Embed Size (px)
Citation preview
Molecular Cell, Volume 46
Supplemental Information
Integrative Genomics Identifies the Corepressor
SMRT as a Gatekeeper of Adipogenesis
through the Transcription Factors C/EBPand KAISO
Sunil K. Raghav, Sebastian M. Waszak, Irina Krier, Carine Gubelmann, Alina Isakova, Tarjei S. Mikkelsen, and Bart
Deplancke

Figure S1. SMRT KD Enhances Adipogenesis in 3T3-L1 Cells
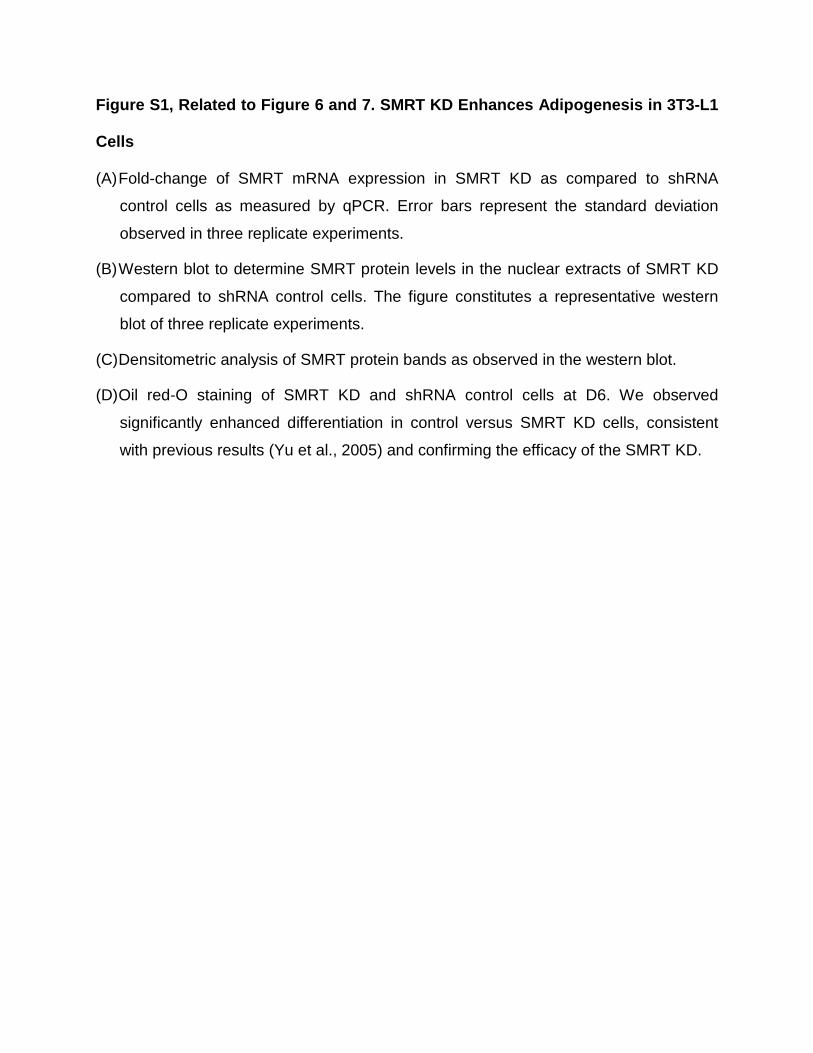
Figure S1, Related to Figure 6 and 7. SMRT KD Enhances Adipogenesis in 3T3-L1
Cells
(A) Fold-change of SMRT mRNA expression in SMRT KD as compared to shRNA
control cells as measured by qPCR. Error bars represent the standard deviation
observed in three replicate experiments.
(B) Western blot to determine SMRT protein levels in the nuclear extracts of SMRT KD
compared to shRNA control cells. The figure constitutes a representative western
blot of three replicate experiments.
(C) Densitometric analysis of SMRT protein bands as observed in the western blot.
(D) Oil red-O staining of SMRT KD and shRNA control cells at D6. We observed
significantly enhanced differentiation in control versus SMRT KD cells, consistent
with previous results (Yu et al., 2005) and confirming the efficacy of the SMRT KD.

Figure S2. ChIP-qPCR Validation of Randomly Selected SMRT Peaks Derived from
ChIP-Seq Data

Figure S2, Related to Figure 1. ChIP-qPCR Validation of Randomly Selected SMRT
Peaks Derived from ChIP-Seq Data
(A) ChIP-qPCR for 15 randomly selected SMRT peak regions using SMRT KD and
shRNA control 3T3-L1 pre-adipocytes. The results shown are representative of two
ChIP-qPCR replicate experiments. Isotype match rabbit antibody and two genomic
regions not bound by SMRT were used to determine the non-specific ChIP
enrichment (see Supplemental Experimental Procedures for more experimental
detail and the list of primers used for qPCR).
(B) ChIP-qPCR for 25 randomly selected SMRT peak regions to validate the decrease in
SMRT binding after differentiation induction at D1. Isotype match rabbit antibody is
used to estimate the non-specific enrichment by beads used for ChIP and the
average enrichment (or lack thereof) of two genomic regions not bound by SMRT in
ChIP-Seq is used to subtract the non-specific ChIP enrichment by the SMRT
antibody (see Supplemental Experimental Procedures for more experimental detail
and the list of primers used for qPCR).
Figure S3. Position of De Novo Identified Motifs with Respect to SMRT Peak
Maxima and Further Validation of KAISO DNA Binding at SMRT Promoter-
Proximal Sites in 3T3-L1 Cells

Figure S3, Related to Figures 2 and 3. Position of De Novo Identified Motifs with
Respect to SMRT Peak Maxima and Further Validation of KAISO DNA Binding at
SMRT Promoter-Proximal Sites in 3T3-L1 Cells
(A) Positional distribution of de novo motifs with respect to SMRT peak maxima (see
Figure 2A for more details on motif statistics).
(B) SMRT tag density at regions bound by C/EBPβ at D0 and occupied by pro-
adipogenic TFs at 4h.
(C) Graph showing linear regression lines fitted to MITOMI data points corresponding to
each tested KAISO target probe sequence (Table S4D; see Supplemental
Experimental Procedures for more details). The data shown are representative of
three MITOMI replicate experiments (i.e. independent microfluidic chips).
(D) Fold decrease in Kaiso mRNA expression as determined by qPCR in KAISO KD as
compared to shRNA control cells. Error bars represent the standard deviation from
three replicate experiments.
(E) Western blot for NCoR1 and KAISO protein in NCoR1 antibody immunoprecipitated
cell lysate samples from pre-adipocytes (D0) and differentiated (D6) 3T3-L1 cells.
The presented western blot constitutes representative data from three replicate
experiments.
(F) SDS-PAGE followed by western blot for KAISO protein in SMRT antibody immuno-
precipitated cell lysate samples from shRNA control (empty vector treated), KAISO
KD, NCoR1 KD, and SMRT KD pre-adipocyte 3T3-L1 cells. Densitometric analyses
for detected KAISO bands are shown below the western blot panel. The presented
western blot constitutes representative data from two replicate experiments.
(G) SMRT ChIP in SMRT KD, KAISO KD, and shRNA control cells at promoter-
proximal SMRT binding sites containing a KAISO motif.
(H) KAISO ChIP-qPCR (using a KAISO-specific antibody from Abcam, cat no.: ab12723)
for 15 selected SMRT-bound promoter-proximal regions with a KAISO motif in
comparison to 15 SMRT-bound promoter-proximal or -distal regions lacking such a

motif. Error bars represent the standard deviation observed in two replicate
experiments.

Figure S4. Control Experiments to Examine the Significance of Open Chromatin
and Histone Mark Enrichment within SMRT-Bound Regions

Figure S4, Related to Figure 4. Control Experiments to Examine the Significance
of Open Chromatin and Histone Mark Enrichment within SMRT-Bound Regions
(A-E) Enrichment of randomized SMRT peaks within DNase I hypersensitive sites (A),
and H3K27ac (B), H3K27me3 (C), H3K4me1 (D), and H3K4me3 (E) marked
regions (see Supplemental Experimental Procedures for more details).

Figure S5. SMRT-Bound Regions Show Increased Chromatin Accessibility 24h
after 3T3-L1 Differentiation Induction and hence after SMRT Release

Figure S5, Related to Figure 4. SMRT-Bound Regions Show Increased Chromatin
Accessibility 24h after 3T3-L1 Differentiation Induction and hence after SMRT
Release
(A) Contour plot showing the dynamic changes in SMRT binding (as RPKM) and DNaseI
hypersensitive changes (i.e., chromatin accessibility) at all SMRT-bound regions in
pre-adipocytes (D0) and during differentiation (at 2h, D1, and D6). DHS data was
used from (Siersbaek et al., 2011). The degree of chromatin accessibility is
measured in terms of peak height observed at DNase I hypersensitive sites.
Horizontal and vertical line levels were arbitrarily chosen.
(B) Contour plot showing the dynamics of chromatin accessibility at SMRT D0 promoter-
proximal peak regions enriched for the KAISO motif.

Figure S6. Transcriptional Dynamics of All SMRT-Bound Genes

Figure S6, Related to Figure 5. Transcriptional Dynamics of All SMRT-Bound
Genes
(A-B) RNA pol II occupancy at promoters (-30 to +300 bp relative to TSS) of all
proximally or distally bound SMRT target genes over the course of terminal
adipogenesis.
(D-E) Gene body RNA pol II occupancy of all proximally or distally bound SMRT target
genes over the course of terminal adipogenesis.
(C-F) Randomly selected control genes show low promoter and gene body RNA pol II
densities.

Figure S7. KAISO KD Cells Exhibit Accelerated Cell Cycle Progression during the
Early Mitotic Clonal Expansion Phase of Terminal Adipogenesis

Figure S7, Related to Figure 6. KAISO KD Cells Exhibit Accelerated Cell Cycle
Progression during the Early Mitotic Clonal Expansion Phase of Terminal
Adipogenesis
(A-B) Propidium iodide (PI) staining-based FACS analysis of KAISO KD (A) and shRNA
control (B) cells during the first 24h after induction of differentiation. The presented
figure constitutes representative data from three replicate experiments.(C) Histograms
indicating the percentage of KAISO KD and shRNA control cells at each cell cycle
phase (G0/G1, S, and G2/M) during the first 24h after differentiation induction
(**P<0.01, *P<0.05; two-sided t-test). Error bars show the standard error of the mean
from three replicate experiments.

Figure S8. Simplified, Schematic Model of the Molecular Mechanisms Underlying
the Involvement of SMRT in Terminal Adipogenesis

Figure S8. Simplified, Schematic Model of the Molecular Mechanisms Underlying
the Involvement of SMRT in Terminal Adipogenesis
M indicates methylated DNA.

Supplemental Experimental Procedures
3T3-L1 Cell Culture and Differentiation
Mouse embryonic fibroblast-adipose like cells (cell line 3T3-L1) obtained from ATCC
were maintained in Dulbecco‟s modified Eagle‟s medium (DMEM, Invitrogen) containing
10% fetal calf serum (FCS; Amimed), 1X antibiotic solution (Invitrogen) and the cultures
were incubated at 37°C and 5% CO2. Cells were sub-cultured in 1:5 into new petri-
plates when they were 75-80% confluent. 3T3-L1 pre-adipocytes at 2 days post-
confluence were differentiated into adipocytes using differentiation inducing cocktail of
1µM Dexamethasone (Dex), 0.5mM isobutyl-methyl-xanthine (IBMX) and 167nM insulin
in DMEM with 10% FCS. After two days of induction with differentiation medium, cells
were washed with cell culture grade 1X phosphate buffered saline (PBS) and complete
medium containing 167nM insulin was added. Two days thereafter, fresh DMEM
medium containing FCS was added to the cells and at day six, cells were stained with
oil red-O to estimate the extent of differentiation into mature fat cells.
Chromatin Immunoprecipitation of SMRT, NCoR1, and RNA Polymerase II
Cells were collected from pre-adipocytes (D0) and at five distinct time points after
induction of differentiation (2h, D1, D4, and D6). The cells were washed two times with
1X PBS and cross-linked using 1% formaldehyde for 10 min at room temperature
followed by quenching the reaction using 125mM glycine for 5 min. After quenching, the
petri-plates were placed on ice, cells were scraped using a cell scraper and collected in
falcon tubes. The cells were then washed three times using cold 1X PBS and cell
pellets were stored at -80°C until further use. The cells were lysed in nuclei extraction

buffer (50mM HEPES-NaOH pH 7.5, 140mM NaCl, 1mM EDTA pH 8.0, 10% glycerol,
0.5% NP-40, 0.25% TritonX-100) supplemented with a protease inhibitor tablet (Roche)
and phosphatase inhibitors (5mM NaF, 1mM β-glycerol phosphate and 1mM sodium
orthovanadate) for 10 min at 4°C while shaking to isolate the nuclei. The isolated nuclei
were then washed using protein extraction buffer (200mM NaCl, 1mM EDTA pH 8.0,
0.5mM EGTA pH 8.0, 10mM Tris-HCl pH 8.0) supplemented with a protease inhibitor
tablet (Roche) and phosphatase inhibitors (5mM NaF, 1mM β-glycerol phosphate and
1mM sodium orthovanadate) at room temperature for 10 min. Washed nuclei were
resuspended in chromatin extraction buffer (1mM EDTA pH 8.0, 0.5mM EGTA pH 8.0,
10mM Tris-HCl pH 8.0 and 1% TritonX-100) supplemented with protease and
phosphatase inhibitor tablets (Roche) and incubated for 20 min on ice. The chromatin
was fragmented using a Bioruptor (Diagenode) sonicator for 80 min using high
amplitude and 30s ON & 30s OFF cycles to obtain 200-500 bp-sized fragments. A
cooling unit was used to circulate the cold water during sonication to avoid de-
crosslinking because of overheating. The fragmented chromatin was centrifuged at
17,000xg for 10 min and then clear supernatant was collected in chilled 15ml falcon
tubes. The DNA concentration of the chromatin was estimated using a NanoDrop and
the sonicated chromatin was diluted with ChIP dilution buffer (1mM EDTA pH 8.0,
10mM Tris-HCl pH 8.0 and 1% TritonX-100 containing protease and phosphatase
inhibitors) to get 100 µg/ml of chromatin for each IP. BSA and ssDNA (Salmon Sperm
DNA) -preblocked protein-A sepharose (80 µl/IP) beads were added to the samples and
incubated for 2h to remove non-specific- binding chromatin. To the supernatant, 5 µl/IP
rabbit polyclonal anti-SMRT antibody (Abcam, cat no.: ab-24551), anti-NCoR1 (Abcam,
cat no.: ab-24552), or RNA Pol-II antibody (Santa Cruz, cat no.: sc9001) was added to
immuno-precipitate the chromatin complex at 4°C overnight. After the overnight
incubation, 50µl blocked beads were added to each sample and incubated for 90 min at
4°C to pull down the respective antibody-chromatin complexes. The beads were then
washed four times with low salt wash buffer (20mM Tris-Cl pH 8.0, 150mM NaCl, 2mM
EDTA pH 8.0, 0.1% SDS, 1% TritonX-100) followed by two washes with high salt wash
buffer (20mM Tris-Cl pH 8.0, 500mM NaCl, 2mM EDTA pH 8.0, 0.1% SDS, 1% TritonX-
100), lithium chloride wash buffer (10mM Tris-Cl pH 8.0, 0.25 M LiCl, 1mM EDTA pH
8.0, 1% NP-40, 1% sodium deoxycholate) and tris-EDTA (TE) buffer (10mM Tris-Cl pH
8.0, 1mM EDTA pH 8.0). After removing the wash buffer completely, protein-bound
chromatin complexes were eluted from beads for 30 min using elution buffer (100mM
sodium bicarbonate and 1% SDS in milliQ water). The eluted chromatin was then
reverse-crosslinked by incubating the eluted supernatant at 65°C overnight on a heat
block after adding 8µl of 5M NaCl. The next day, DNA was purified from the reverse-
crosslinked chromatin by proteinase and RNase digestion followed by purification using
Qiagen DNA purification columns. The purified DNA was eluted in 50µl of Qiagen
elution buffer.
ChIP-Seq
Multiplex libraries were prepared using barcoded adapters (see Table SE1 below) for
each sample following an Illumina recommended protocol with slight modifications. In
brief, ChIP-DNA fragments were end-repaired using an End-IT DNA end repair kit
(Epicentre Technologies, Madison, WI, USA) followed by the addition of an „A‟ base and
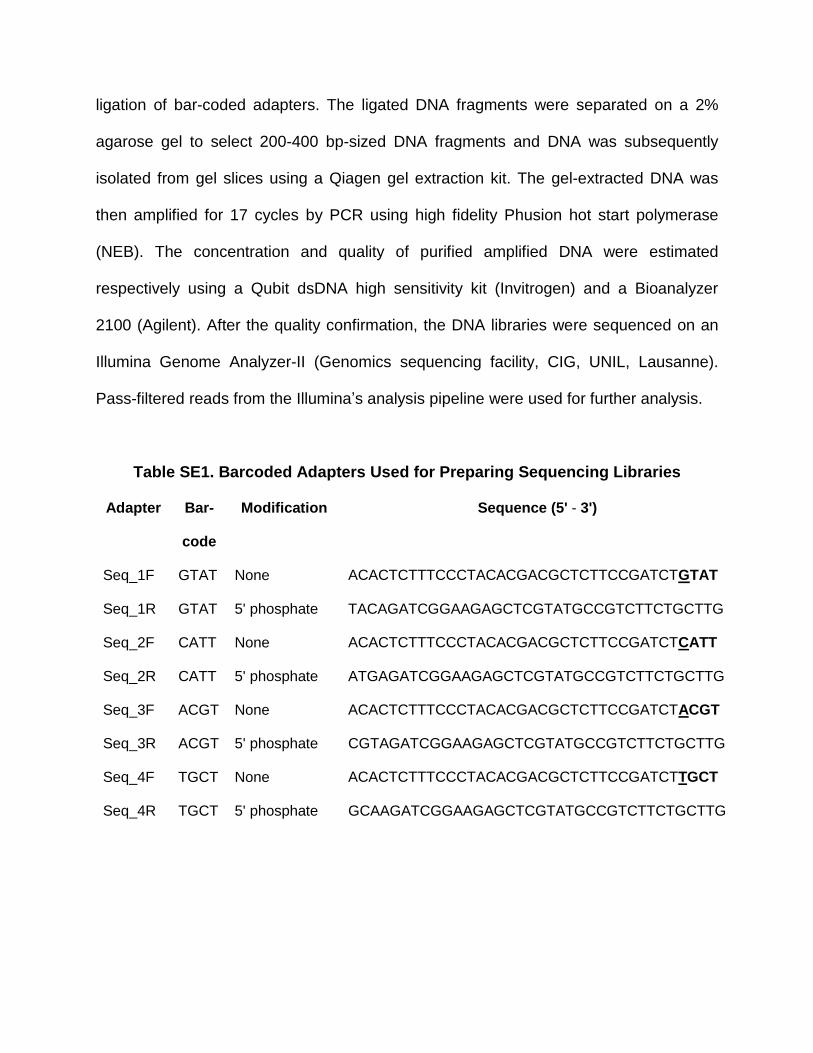
ligation of bar-coded adapters. The ligated DNA fragments were separated on a 2%
agarose gel to select 200-400 bp-sized DNA fragments and DNA was subsequently
isolated from gel slices using a Qiagen gel extraction kit. The gel-extracted DNA was
then amplified for 17 cycles by PCR using high fidelity Phusion hot start polymerase
(NEB). The concentration and quality of purified amplified DNA were estimated
respectively using a Qubit dsDNA high sensitivity kit (Invitrogen) and a Bioanalyzer
2100 (Agilent). After the quality confirmation, the DNA libraries were sequenced on an
Illumina Genome Analyzer-II (Genomics sequencing facility, CIG, UNIL, Lausanne).
Pass-filtered reads from the Illumina‟s analysis pipeline were used for further analysis.
Table SE1. Barcoded Adapters Used for Preparing Sequencing Libraries
Adapter Bar-
code
Modification Sequence (5' - 3')
Seq_1F GTAT None ACACTCTTTCCCTACACGACGCTCTTCCGATCTGTAT
Seq_1R GTAT 5' phosphate TACAGATCGGAAGAGCTCGTATGCCGTCTTCTGCTTG
Seq_2F CATT None ACACTCTTTCCCTACACGACGCTCTTCCGATCTCATT
Seq_2R CATT 5' phosphate ATGAGATCGGAAGAGCTCGTATGCCGTCTTCTGCTTG
Seq_3F ACGT None ACACTCTTTCCCTACACGACGCTCTTCCGATCTACGT
Seq_3R ACGT 5' phosphate CGTAGATCGGAAGAGCTCGTATGCCGTCTTCTGCTTG
Seq_4F TGCT None ACACTCTTTCCCTACACGACGCTCTTCCGATCTTGCT
Seq_4R TGCT 5' phosphate GCAAGATCGGAAGAGCTCGTATGCCGTCTTCTGCTTG

SMRT ChIP-Seq Data Handling and Processing
Raw tags were barcode-sorted and trimmed using the fastx-toolkit
(http://hannonlab.cshl.edu/fastx_toolkit/) and aligned to the mm9 genome assembly
using BWA with default settings. Reads with low mapping quality were removed
(minimum mapping quality –q 10) as well as PCR duplicates using rmdup from the
samtools suite. SMRT libraries from each time point were three times randomly down-
sampled to four million unique tags after mapping. Each set of down-sampled libraries
was merged to create a single library consisting of ~20M tags, which was later used for
identifying peaks (see below).
SMRT Peak Calling
Peaks were called using the QuEST 2.4 algorithm with a bandwidth of 40 bp and a
region size of 400 bp. An input library with ~20M tags was used as a negative control. A
score threshold of 15 was chosen together with the stringent peak calling parameter set,
i.e., rescue-fold as well as enrichment-fold of three. Peak calling was repeated for the
three down-sampled merged libraries, and peak regions were combined, while peak
maxima were all retained, but when closer than 100 bp to each other, only the highest-
scoring peak was retained. Values of the QuEST kernel bandwidth were selected,
because default parameters did not yield satisfying results in terms of defining binding
regions for SMRT based on manual inspection of the resulting peaks. Specifically,
SMRT peaks tended to be wider (480-880 bp) than the default allowed kernel bandwidth
for transcription factors; therefore we chose a larger value. In addition, we based the
selection of the score threshold on the enrichment profiles of SMRT-positive compared
to SMRT-negative control regions as assessed by ChIP-qPCR as well as manual
inspection and saturation analyses. This allowed us to exclude regions with low signal
to noise ratios, while including regions that proved reproducibly positive based on ChIP-
qPCR even if their overall enrichment was only low to moderate.
NCoR1 DNA Binding Enrichment at SMRT-Bound Regions
Sequencing reads were aligned similar to how SMRT reads were processed as
described above. SeqMINER software version 1.2.1 was used to cluster SMRT peaks
according to both the NCoR1 ChIP-Seq signal at the two time points D0 and D4 at
these locations as well as input with libraries down-sampled to 4M each.
Temporal Classification of SMRT Peaks
The seqMINER software version 1.2.1 was used with default settings to determine the
temporal DNA occupancy behavior of SMRT at peaks predicted from the single merged
libraries. Using the peak maxima as a base, the down-sampled library of each time
point was used to cluster peaks according to their raw tag enrichment profile across
differentiation. In 10 clusters, we observed either SMRT sites with predominant binding
at D0, or sites with similar binding profiles throughout differentiation (i.e., D0, 2h, D1,
D4, and D6).
Annotation of SMRT Peaks to Putative Target Genes
SMRT peaks were assigned to the nearest transcription start site (TSS) using the
RefSeq gene annotation (UCSC, refGene table, accessed 02/08/11). Peaks were

considered promoter-proximal when less than +/-1kb away from the TSS and promoter-
distal otherwise.
De Novo Motif Identification within SMRT Peaks
We performed de novo motif analysis on sequences around proximal and distal SMRT
peak maxima (+/-100bp) separately for D0-specific and all-time point sites, using the
software package MEME. We restricted the identification of motifs to 15 with a minimum
and maximum length of 5 and 25 bp, respectively. Obtained motifs were filtered
according to E-value (<1E-4) and motif occurrence among input sites (>5%). Passed de
novo motif PWMs were compared against known PWMs deposited in TRANSFAC,
JASPAR, and UNIPROBE using the TOMTOM motif comparison software
(http://meme.sdsc.edu/meme/cgi-bin/tomtom.cgi).
Binding Site Overlap between SMRT and Adipogenic TFs
We obtained genome-wide DNA binding locations of relevant adipogenic TFs from
previously published ChIP-Seq datasets (see below) and determined the co-occurrence
with SMRT sites by intersecting whole peak regions (min. >1 bp overlap criteria). We
obtained raw ChIP-Seq datasets for RXR and PPARfrom the NCBI Gene Expression
Omnibus (GEO) website (accession: GSE13511) and re-analyzed both datasets.
Libraries were aligned against the mm9 genome using the BWA short-read aligner,
quality filtered (minimum mapping quality –q 10), PCR-duplicates were removed with
samtools, and peaks at distinct time points of adipogenesis (D0, D1, D2, D3, D4, and
D6) were called with QuEST 2.4 using parameters for TF binding sites, i.e. a ChIP score

threshold of 50, a bandwidth of 30 and a region size of 300 (default settings for TF
identification). These parameters yielded results, which closely mirrored the results
communicated in the respective paper. Published genome-wide C/EBP (D0, 2h, 4h,
and D2), C/EBP (D0 and 4h), RXR (4h), STAT5a (4h), and glucocorticoid receptor
(GR, 4h) binding sites in 3T3-L1 cells were obtained from the NCBI GEO database
(accession: GSE27826).
Human KAISO ChIP-Seq Data Analysis
Publicly available genome-wide ZBTB33/KAISO ChIP-Seq binding sites from a
lymphoblastoid cell line (GM12878) were downloaded from the ENCODE website
(http://hgdownload.cse.ucsc.edu/goldenPath/hg18/encodeDCC/wgEncodeHudsonalpha
ChipSeq/; Myers lab, Hudson Alpha Institute). Peaks from two technical replicates were
joined and only overlapping peaks were retained for further analysis, thus resulting in
1,253 peak regions. de novo motif analysis was performed with MEME (min. motif width
= 5; max. motif width = 25) using sequences extracted from whole peak regions of all
1,253 peaks and highest enriched (top 25% or 313) peaks, respectively. Synteny
between SMRT peaks enriched with the palindromic CGCG motif and human KAISO
binding sites enriched with the palindromic motif (as identified by de novo motif finding
using all 1,253 binding sites) was assessed with the UCSC liftOver tool
(http://genome.ucsc.edu/cgi-bin/hgLiftOver) requiring that at least 10% of bases (within
a KAISO peak region) must map to the mm9 genome assembly.

MITOMI Analysis
KAISO target sequence synthesis and labeling
To validate and estimate the relative affinity of KAISO to a series of DNA motifs derived
from human KAISO ChIP-Seq data as well as SMRT peaks, sequences containing the
respective motifs (10 bp) flanked by 10 bp up- and down-stream were designed. The 10
bp flanking sites were specifically chosen not to contain any “CG” sites as to not
confound the methylation assay (see Table S4D for all DNA sequences). Specifically,
the 10 bp upstream flank was chosen from the mouse Mre11a gene promoter, which
contains the full palindromic “TCTCGCGAGA” motif and which is also bound by SMRT.
The 10 bp upstream flank was also used as the downstream flank. We also flanked
each fragment by a “CCC” clamp at the 5‟ end to prevent degradation and by a
complementary sequence at the 3‟ end to allow primer hybridization. Target sequences
of interest were purchased as single stranded DNA from Life Technologies and double
stranded DNA was generated according to a previously described procedure (Maerkl
and Quake, 2007) except that the labeled, generic primer used here (5‟-Cy5-
GTGGTACCTCCAAGGG-3‟ ordered from Integrated DNA Technologies (IDT)) was
designed such as it does not contain any CG di-nucleotieds. The double stranded,
labeled DNA sequences were purified using a Qiagen nucleotide purification kit and
then methylated (when appropriate) using a CpG methylase kit (New England Biolabs,
Cat no: M-0226L) according to a protocol recommended by the vendor. Each reaction
was subsequently purified using a Qiagen nucleotide purification kit and eluted in a final
volume of 30 µL. 20 µL of 1.5% BSA in dH2O was added to each reaction and the entire
volume was then transferred to a 384-well plate to generate an 8-fold dilution series for

each DNA sequence. All target DNA sequences in BSA aqueous solution were
deposited onto epoxy-coated glass substrates (CELL Associates) using Qarray
(Genetix) or SpotBotIII (ArrayIt) microarrayers with a 946MP4 pin configuration
(European Biotek Network SPRL).
Preparation and synthesis of KAISO protein
The open-reading frame of KAISO (RIKEN clone E130014G12) was cloned into
pDONR221 Entry vector using Gateway® technology and sequence-verified.
Subsequently, it was sub-cloned into the pMARE vector to enable in vitro expression as
described previously (Hens et al., 2011). For each experiment, KAISO was expressed in
vitro using the TnT® SP6 High-Yield Wheat Germ Protein Expression kit (Promega).
MITOMI analysis of KAISO-DNA interactions
All MITOMI experiments were performed on 768-unit devices as described previously
(Maerkl and Quake, 2007). The molds for MITOMI devices and devices itself were
fabricated at the Center of MicroNanoTechnology (CMI) Core Facility at the EPFL.
Surface chemistry was performed as described in (Hens et al., 2011). Data extraction
was performed according to (Maerkl and Quake, 2009). The detected surface-bound
DNA values (RFU) were normalized against surface-immobilized protein amounts and
plotted separately for each target sequence. To assess the differences in DNA binding
of KAISO to different DNA probes, linear regression lines were fitted to the data points
corresponding to each target sequence separately (see Figure S3C for a representative
MITOMI chip). Only data points with free DNA below 10,000 RFUs were considered in

order to remain in the linear part of the saturation curve. The slopes of the regression
curves within one MITOMI chip were scaled relative to the slope of the sequence for
which KAISO showed strongest affinity (i.e., methylated palindrome). The averages and
standard deviations of the relative affinity values from three MITOMI replicates are
shown in Figure 3G of the main manuscript.
RNA Polymerase II Transcription Dynamics
Genome-wide maps of RNA pol II occupancy during 3T3-L1 adipogenesis (D0, D1, D2,
D3, D4, and D6) were obtained from the NCBI GEO database (accession: GSE13511).
Raw reads were aligned with bwa against the mm9 genome assembly, mapping quality
filtered (MAQ >10), and PCR duplicates were removed with samtools. Tags were
counted within RefSeq transcript bodies (+300 bp relative to the TSS until the transcript
end) and near the promoter (-30 to +300 bp relative to TSS). Gene body and promoter
counts were later transformed into a reads per kilo base per million mapped reads
(RPKM) measure to compare the occupancy at different days of differentiation.
Testing for Differential RNA Pol II Occupancy between SMRT KD and shRNA
Control Cells
Genome-wide RNA pol II occupancy maps were generated in SMRT KD and shRNA
control cells using RNA pol II ChIP-Seq following the method as described above for
ChIP-Seq. Raw reads (~32M) were barcode-trimmed, mapped with BWA against the
mm9 genome assembly, low quality reads were filtered out (MAQ <10), and PCR
duplicates were removed with Samtools resulting in ~12.4M (SMRT KD) and ~12.6M

(shRNA control) unique reads, respectively. Tags were counted within RefSeq-based
gene body coordinates (i.e., +300 bp relative to TSS and until end of gene) to quantify
gene transcription levels. Total gene body tag counts were down-scaled in the shRNA
control condition by multiplying and rounding total gene counts by a global scaling
factor, which is the ratio of the total number of mapped tags between both conditions.
Gene body transcription levels were normalized by applying quantile normalization
(normalize. quantiles function in the affy package, R, www.r-project.org) on log2-
transformed gene body densities (i.e., tags/kb), and back-transformed as well as
rounded to obtain again gene body tag count values. Transcripts that featured in both
conditions a gene body RPKM value less than a library size adjusted input experiment
(representing background) or a gene body RPKM value less than one (representing low
transcription) were filtered out. We tested for differential transcription between the
SMRT KD and shRNA control condition with an exact two-sided binomial test (p=0.5),
using the normalized gene body tag count values, for each transcript separately. P-
values were adjusted for multiple hypotheses testing using Benjamini & Hochberg FDR
correction (function p. adjust in R). Transcripts were considered as differentially
transcribed between the two conditions if the transcription level was >1.5-fold higher or
lower in one or the other condition with an FDR cutoff < 1%.
Analysis of Open Chromatin and Histone Modification Data
DNase I hypersensitivity (DHS) and histone modifications (i.e., H3K4me1, H3K4me2,
H3K4me3, H3K27ac, and H3K27me3) in pre-adipocytes, during the early and late
stages of terminal fat cell differentiation were obtained from the NCBI GEO database

(accessions: GSE27826 and GSE21365). SMRT-bound sites were classified to be
enriched in DHS or histone modifications if they overlapped by at least 1 bp with the
latter sites. Randomization tests were performed to evaluate for background
enrichments of SMRT within functional sites by shifting conservatively SMRT peaks
randomly 10 kb upstream or downstream, this way preserving local DNA/chromatin
properties, and testing for overlap with DHS or histone modified sites.
Functional Annotation of SMRT Targeted Genes
We used the DAVID Bioinformatics Resource 6.7 (http://david.abcc.ncifcrf.gov/) to
obtain a functional annotation (i.e., Panther biological process) of SMRT-bound genes
using an FDR cutoff of 10%. We performed this analysis separately for genes linked to
SMRT peaks with distinct spatial-temporal properties (Table S2).
Permutation Test for Enrichment in SMRT Targets among Differentially
Transcribed Genes Between SMRT KD and shRNA Control Cells
To evaluate the significance of our results regarding the over-representation of
differentially transcribed genes among SMRT-bound genes, we randomly permutated
SMRT peaks within each chromosome 100 times, re-annotated each peak to the
nearest gene TSS, and computed the overlap between the permutation-based- and
observed gene list.

Lentivirus-Mediated Knockdown of SMRT, NCoR1, and KAISO
The lentiviral mammalian vector pLKO.1 containing SMRT, NCoR1 and Kaiso-specific
shRNAs (three shRNAs per target were used) along with control shRNA (empty pLKO.1
plasmid or GFP shRNA) were obtained from Sigma. Viral particles containing shRNA
expression plasmid were generated in 293T cells using a CalPhos mammalian
transfection kit (Clontech) according to (Barde et al., 2001). 293T cells were transfected
with transfer plasmids containing SMRT or Kaiso-specific shRNAs or control shRNAs
along with packaging plasmids (Pcmvr8.74 and PMd2.G) and the next day, the culture
medium was refreshed and after 24h, viral particles along with medium were collected
in 50 ml falcon tubes. Viral particle-containing medium was filtered with 0.45µm
centricon syringe filters and preserved at -80°C in small aliquots. 3T3-L1 cells at a
density of 5 X 10³ cells were transduced with viral particles containing a pool of three
shRNA expression plasmids in 10cm petri-plates. After 72h of viral incubation, the
medium was changed to a puromycin selection medium (2 µg/ml puromycin in complete
DMEM medium) to select the stably transduced cells. After every two days, puromycin
selection media was changed and the stably transduced cells were selected for one to
two weeks before performing actual experiments. The control shRNA- transduced cells
were treated similarly.
RNA Isolation and Quantitative PCR
Total RNA was isolated using a Qiagen RNAeasy plus mini kit according to the
recommended protocol. RNA concentration was estimated using a nanodrop and 2.5µg
of total RNA was used for single strand cDNA synthesis (single strand cDNA synthesis

kit, Invitrogen). cDNA was diluted 1:100 using nuclease free water and 1.5µl was used
for each qPCR reaction. The qPCR was performed using custom oligos designed with
in-house developed GetPrime software (Gubelmann et al., 2011). Power SYBR Green
Master Mix (Applied Biosystems) used for the qPCR reaction and PCR amplification
was monitored with Applied Biosystems 7900HT Fast Real-Time PCR System. A
Hamilton Liquid Handling Robotic System was used to assemble the 384-well plates.
Primers were optimized for linear and single product amplification. Primers used for
qPCR are listed at the end of this document.
SMRT ChIP-qPCR
We randomly selected 15 peaks/sites from the ChIP-Seq results for verification of
SMRT binding and reduced enrichment in SMRT KD cells. qPCR was performed as
described above in the qPCR section. Similarly, to validate that KAISO is recruiting
SMRT at promoter-proximal regions, we performed ChIP-qPCR for 12 selected genes
targeting SMRT DNA binding sites containing a KAISO motif in KAISO KD, SMRT KD,
and shRNA control cells. ChIP was performed as described above for SMRT ChIP-Seq.
Percent enrichment vs Input was calculated using the standard equation:
100*2^(Corrected Input Ct - Ct of IP sample). Input was adjusted / corrected to 100% as
1% of IP sample was used as Input DNA. Primers used for qPCR are listed at the end
of this document. Average enrichment of two genomic regions without SMRT peaks
based on ChIP-Seq data were used as negative controls to estimate or subtract the
non-specific enrichment by the antibody, and an isotype match rabbit antibody was
used to control the non-specific enrichment by the beads used for ChIP.

KAISO ChIP
KAISO ChIPs were performed according to the method described by (Reddy et al.,
2009) with few modifications. In brief, the cells were fixed and quenched with glycine as
described above in the ChIP section. The cell layers were then washed three times with
cold 1x PBS. After washing the cells with PBS, they were lysed and scraped in Farnham
lysis buffer (5mM PIPES at pH 8.0, 85mM KCl, 0.5% NP-40) with added protease
inhibitor. The cells were then centrifuged at 200xg for 5min at 4°C and the crude nuclear
extract stored at -80°C. During ChIP, an aliquot of 30 X 106 nuclei was suspended in
1.5ml of RIPA buffer (1% NP-40, 0.5% sodium deoxycholate, 0.1% SDS in PBS at pH
7.4) and the chromatin was fragmented using a Bioruptor sonicator for 30 min using
high amplitude and 30s ON & 30s OFF cycles to obtain 200-500 bp-sized fragments
and the samples were centrifuged at 17000xg for 15 min to remove debris. The
chromatin was then diluted using RIPA buffer and added to dynal magnetic beads
(Sheep-anti mouse IgG conjugated Dynabeads, Invitrogen, Cat no: 110-31) pre-treated
with 5µg specific anti-mouse antibody for KAISO (Santa Cruz, Cat no: sc-23871 or
Abcam, Cat no: ab12723) for immune-precipitation of specific complexes. The samples
were incubated overnight at 4°C on a rotator, then magnetic beads were washed 5
times with lithium chloride wash buffer (100 mM Tris at pH 7.5, 500 mM LiCl, 1%NP-
40,1% sodium deoxycholate) and finally once with 1X TE buffer (10 mM Tris-HCl at pH
7.5, 0.1 mM Na2EDTA). The chromatin complex was eluted using elution buffer (1%
SDS, 0.1 M NaHCO3) for 1 h at 65°C using an Eppendorf thermo-mixer. The chromatin
was then de-crosslinked overnight at 65°C and ChIP DNA purified using a Qiagen PCR

purification kit and eluted in 50 µl of elution buffer. To validate the KAISO enrichment at
SMRT bound regions, 15 SMRT regions positive for KAISO motif were selected along
with 15 SMRT bound promoter and candidate enhancer regions lacking a discernible
KAISO motif. Two intergenic genomic regions were selected as negative controls. For
each qPCR reaction, 1.5 µl of 1/10 diluted ChIP DNA was used.
H3K9me2 ChIP-qPCR
Chromatin preparation from 3T3-L1 cells followed by ChIP was performed as described
above for KAISO ChIP except that Sheep-anti rabbit IgG conjugated dynabeads
(Invitrogen, Cat no: 112.03D) coated with anti-rabbit H3K9me2 antibody (Abcam, Cat
no: ab-1220) were used for IP. For estimating the enrichment of this histone mark, the
same genomic regions validated for KAISO binding were evaluated using qPCR.
Immunoprecipitation (IP)
The cells were grown and differentiated as described above. At the D0 and D6 time
points, the cells were washed twice with PBS containing protease and phosphatase
inhibitors, trypsinized, and collected by centrifugation at 1000xg for 10 min. The cells
were lysed by passing them through a 26-guage needle 25 times in Triton X-100 IP
buffer (20mM Tris-Cl, pH. 7.4, 150mM NaCl, 10% glycerol, 1% Triton X-100, 1mM
EDTA, 1mM DTT) supplemented with protease and phosphatase inhibitors (Roche).
Lysates were cleared by centrifuging at maximum speed in a tabletop refrigerated
centrifuge for 10 min. Antibodies (10 μg/IP) against SMRT (Abcam, ab-24551), NCoR1
(Abcam, ab-24552), and isotype matched rabbit antibody (Millipore) were added to the

cell lysate and incubated for 3h at 4°C while rotating. Protein-A sepharose beads (50µl)
that were washed and pre-blocked with BSA were then added to the samples and
further incubated for 2h to pull down the protein-antibody complex. The beads were
then washed 5 times with Triton X-100 IP buffer and once with 1X TE buffer. After the
last wash, beads containing immune-precipitated protein complexes were boiled in 60μl
of 2X SDS sample loading buffer. Proteins present in the eluted supernatant were
resolved on a 7.5% SDS-PAGE gel, and then transferred to a nitrocellulose membrane.
Immunoblotting was performed with anti-KAISO antibody (Abcam, ab-12723). To
confirm the SMRT and NCoR1 pull-down by the respective antibodies, the same blots
were also developed for SMRT and NCoR1. To further validate the presence of KAISO
in a SMRT-containing complex, SMRT IP in KAISO KD, NCoR1 KD, SMRT KD and
Empty vector (shRNA control) 3T3-L1 preadipocyte cells followed by western blotting for
KAISO was performed as described above. Densitometric analysis of the bands
detected in western blot was performed using AlphaDigidoc-1201 software. The stable
knockdown 3T3-L1 cells for these genes were made as detailed in the lentivirus-
mediated gene knockdown section.
Cell Cycle Analysis using FACS
The standard method of Propidium Iodide (PI) based FACS analysis was used to
observe the changes in cell cycle progression. 3T3-L1 cells (SMRT KD, KAISO KD, and
shRNA control cells) were cultured in six-well plates as described above. At specific
time points (-72h, 0h, 16h, 18.5h, 20h, 22h and 24h), the cells were trypsinized, washed
two times with 1X PBS and cooled on ice for 30 min. The cells were then fixed by drop-

wise addition of 70% ethanol, while gently vortexing the cells to avoid clumping. Before
PI staining, fixed cells were washed three times with 1X PBS and 200µl of staining
buffer (50µg/ml PI, 0.01% triton X-100, 10µg/ml RNase-A in PBS) was subsequently
added to each sample. The samples were then incubated for 45 min at 37 ºC for
staining and RNA degradation as RNA might interfere with the PI staining of DNA.
10,000 live-gated cells from each sample were then analyzed to determine their cell
cycle phase using an Accuri-6 flow cytometer (settings: FSC-SSC gate for live cell
singlet selection and FL2A histogram for PI-stained cell signal intensity). FlowJo
analysis software was then used to calculate the proportion of G0/G1, S, and G2/M cells
in each sample. Significant differences in the number of cells at a specific cell cycle
phase between the different samples were determined using a student‟s two-sided t-
test.
Effect of the PPARγ Ligand Rosiglitazone on the Differentiation Capacity of SMRT
KD 3T3-L1 Cells
An equal number of SMRT KD and shRNA control cells (50,000/well) were sub-cultured
into six-well plates and grown to confluence. Two days post-confluence, the cells were
differentiated using MDI medium (normal differentiation induction medium), 100nM &
250nM PPARγ ligand-containing medium, 167nM insulin and 1µM dexamethasone-
containing medium. After two days, 167nM insulin-containing DMEM medium with 10%
FCS was added to each well which was changed to DMEM medium containing 10%
FCS on the fourth day of differentiation. At D6, the wells were washed two times with 1X

PBS and the cells were fixed using 10% formalin in PBS. The accumulated fat droplets
inside cells were then stained using oil red-O to estimate the extent of differentiation.

List of Primers Used for ChIP-qPCR and Gene Expression Analyses
Gene Primer Sequence
control1_ChIP_F CACACAGCTGACCTCCAGAA
control1_ChIP_R AGTGGCAAGGTCTCTGCTTC
control2_ChIP_F GGGTGCTAGCCTTCCTGACT
control2_ChIP_R TCCAAGGTTCTCCCGACATA
Ampk1_ChIP_F CGGTGCTGGTGGCTAGAG
Ampk1_ChIP_R TCCTCCTAAAATGGCTACAAGG
Cdk12_ChIP_F GTGCCGTTTCGGTTTAATCT
Cdk12_ChIP_R CTAGCCTCCGCCTCACAC
Atf2_ChIP_F CATCCCTACAACCTCCAAGC
Atf2_ChIP_R GGCAGGACCATGAATTAGTGA
Atf4_ChIP_F CGCAGACCCCTGATCCTA
Atf4_ChIP_R GGCGAGTCACCTAAACCTCA
Atf6_ChIP_F CAGATCCACTCACCCCAGTC
Atf6_ChIP_R CCATGGAGTCGCCTTTTAGT
Atf7_ChIP_F ACTCGTGGGGCTGAGTTG
Atf7_ChIP_R ACTCAAGCCACGCTCACA
Camk1d_ChIP_F AAAGCACCACGTGTACAAACA
Camk1d_ChIP_R CTCTTTGCTGGGCTACCTTG
Chmp4b_ChIP_F CCTTTGACCTCTGCGAGACT

Chmp4b_ChIP_R AAGCCGGGAGTCTGAGTTTT
Crebzf_ChIP_F GGGGGTGGAAACTAGGTTTTAT
Crebzf_ChIP_R CTTTGCGGTGATGTCATAGG
Hdac4_ChIP_F CAGGGCAGTTAGGCACTCTC
Hdac4_ChIP_R TTGCCCTCAAAGCCTCAG
Hnrnpa2b1_ChIP_F ACTAACGCGTCTCCGCTTAC
Hnrnpa2b1_ChIP_R AGGAGAGTGTAGGCCCTTCC
Med1_ChIP_F GATCGCGAGATTAATCGTGTT
Med1_ChIP_R GAGACTTTGGTGCGGTTCC
Meis1_ChIP_F CCGACCAGAATGCTAGAACC
Meis1_ChIP_R TTGTGTAAGACGCGACCTGT
Ndufa11_ChIP_F CCAGTGTCATCGCAAGACC
Ndufa11_ChIP_R CTGACCTTTGCTTCCAGACC
Por_ChIP_F TTCCGAGGAGAGGATGAGG
Por_ChIP_R AAATCTCTGCTGTTGGTACGG
Rxra_ChIP_F AGTGAAACTTCCCGGAGGA
Rrxa_ChIP_R GAGAGGTGCCAGAGAACAGG
Suv39h1_ChIP_F CCTGCGCAGTAGCAAAGC
Suv39h1_ChIP_R GGCTAGCAATATGACTGACAAGG
Tle3_ChIP_F GCCGCCACATTATTTTGTTAC
Tle3_ChIP_R AGCACGAGGTCTGAACTGC
Ncoa4_ChIP_F TGTCTGGGTCGGTCTAAGGT
Ncoa4_ChIP_R GCCACTCTCGTCCTTACCG

Map3k14_ChIP_F GGGCTTTGAGGCAAGACTAA
Map3k14_ChIP_R CAAGGACAAGTGGCTCACC
Arf3_ChIP_F GGGCTATGGCAGCTAGCAC
Arf3_ChIP_R CGGAGGTTCAGGACGTGT
Nkrf_ChIP_F AACCGGTCTCCAACTTCAAA
Nkrf_ChIP_R GCAGAGTGCGTCAATGAAGA
Ccnt1_ChIP_F CGACACCCCGTAGACGAA
Ccnt1_ChIP_R AGATAGTCCCGCCCACCT
Tipin_ChIP_F GCCGCTGTCTAGGTGAGGT
Tipin_ChIP_R GGGCTCCACTTCCAAAATCT
Pfkfb2_ChIP_F GAGCTTGGTGGCATTGTTG
Pfkfb2_ChIP_R AAGGGAAGGCTTTTAATTCACC
Hnrnpk_ChIP_F CAGAGGATAATGGCGTCTGC
Hnrnpk_ChIP_R CCCCTCACCACAGAGTGC
Ets1_ChIP_F TGTTGCTATGAAGGGGAGTGT
Ets1_ChIP_R CCCAGCTCAAAGACAACAAGA
Sirt1_ChIP_F AAGAGTGAGCCACACTTACGG
SIRT1_ChIP_R ACCTCTAGGTGGCGTCCAA
Aspn_gene_F TCGATTTGTTTCCAACATGTCC
Aspn_gene_R CCGATGTCAGACCTAGATCAG
Tle1_gene_F CTCAGGAACATCAACAACAGG
Tle1_gene_R CGATGATGGCATTCAACTCTG
Tnfaip6_gene_F CAACCCACATGCAAAGGAG

Tnfaip6_gene_R TACTCATTTGGGAAGCCCG
Trpv6_gene_F CTTGTGCCAAATAACCAGGG
Trpv6_gene_R CATCAGGTGTTGGAACATCAC
Wnt5a_gene_F ACGCTTCGCTTGAATTCCT
Wnt5a_gene_R CCCGGGCTTAATATTCCAA
Cebpα_gene_F AAACAACGCAACGTGGAGA
Cebpα_gene_R GCGGTCATTGTCACTGGTC
Six1_gene_F AAGGAAAGGGAGAACACCG
Six1_gene_R TTCTGGTCTGGACTTTGGG
Akt1_gene_F AGCTCTTCTTCCACCTGTC
Akt1_gene_R GAGGTTCTCCAGCTTCAGG
Kaiso_gene_F TGCTTGGGGTAGGACTCTGA
Kaiso_gene_R TGAATGTCTGTAGCAGAAATCAGTT
Smrt_gene_F CATGAAGGTCTACAAGGACC
Smrt_gene_R TGCATAAACTTCTCACGGA
Tgfβ3_gene_F AATTACTGCTTCCGCAACC
Tgfβ3_gene_R TTTCCAGCCTAGATCCTGC
Plin4_gene_F GAGGCCTTCCAGATGACAG
Plin4gene__R CACCATGGTGTTCAAGCTC
Srf_gene_F TGAAGAAGGCCTATGAGCTG
Srf_gene_R TATACACATGGCCTGTCTCAC
Twist1_gene_F AGCTACGCCTTCTCCGTCT
Twist1_gene_R TCCTTCTCTGGAAACAATGACA
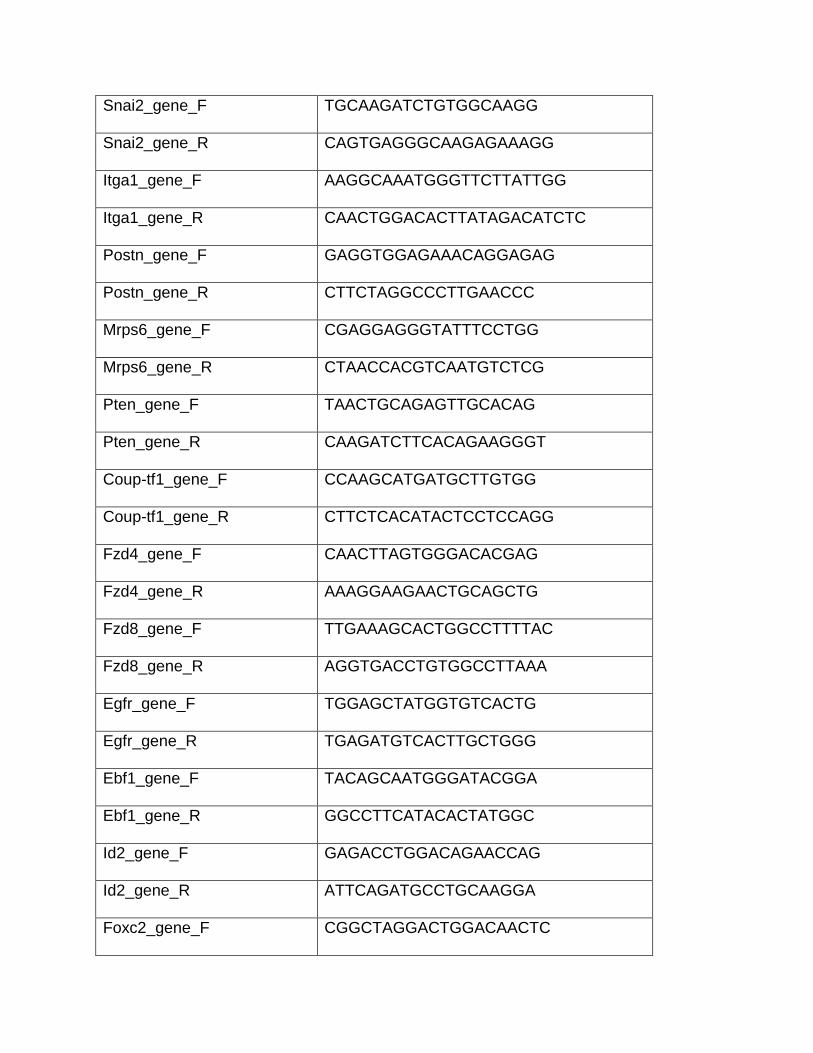
Snai2_gene_F TGCAAGATCTGTGGCAAGG
Snai2_gene_R CAGTGAGGGCAAGAGAAAGG
Itga1_gene_F AAGGCAAATGGGTTCTTATTGG
Itga1_gene_R CAACTGGACACTTATAGACATCTC
Postn_gene_F GAGGTGGAGAAACAGGAGAG
Postn_gene_R CTTCTAGGCCCTTGAACCC
Mrps6_gene_F CGAGGAGGGTATTTCCTGG
Mrps6_gene_R CTAACCACGTCAATGTCTCG
Pten_gene_F TAACTGCAGAGTTGCACAG
Pten_gene_R CAAGATCTTCACAGAAGGGT
Coup-tf1_gene_F CCAAGCATGATGCTTGTGG
Coup-tf1_gene_R CTTCTCACATACTCCTCCAGG
Fzd4_gene_F CAACTTAGTGGGACACGAG
Fzd4_gene_R AAAGGAAGAACTGCAGCTG
Fzd8_gene_F TTGAAAGCACTGGCCTTTTAC
Fzd8_gene_R AGGTGACCTGTGGCCTTAAA
Egfr_gene_F TGGAGCTATGGTGTCACTG
Egfr_gene_R TGAGATGTCACTTGCTGGG
Ebf1_gene_F TACAGCAATGGGATACGGA
Ebf1_gene_R GGCCTTCATACACTATGGC
Id2_gene_F GAGACCTGGACAGAACCAG
Id2_gene_R ATTCAGATGCCTGCAAGGA
Foxc2_gene_F CGGCTAGGACTGGACAACTC

Foxc2_gene_R CTGACAGCTCGCATTGCTC
Ccdc99_ChIP_F CACTAACTCCACCTCAGCACAG
Ccdc99_ChIP_R CCGGCGCTTACTTAGCAG
Ddx20_ChIP_F GTGGACTCGGAGGTTGTCA
Ddx20_ChIP_R CCCCGCCTCAAGTCTAAATA
Mdh2_ChIP_F CAAGCTTCTTGCGCTTCTCT
Mdh2_ChIP_R GACTCCAACGACCTCCACTC
Psmd5_ChIP_F GAGATCTTACGGAGCGAAGC
Psmd5_ChIP_R GACCGCGTTGAGAAAGGAT
Mgmt_ChIP_F AATGGCAGTAAATTCTTCAATAAGC
Mgmt_ChIP_R GGCTCATTTTCTGTGCTGTTG
Med6_ChIP_F CAGTAAAGGCGATGACTACCG
Med6_ChIP_R TTTTGACCTCCCCGCTAAC
Med23_ChIP_F TCCAAACAGGTCGCAGTTC
Med23_ChIP_R GACAGCGCTGCTTGATCC
Nfatc3_ChIP_F CTCTGGCGCTTCTTGCTC
Nfatc3_ChIP_R ACCGACCTATCGCGTGAGT
Nr4a1_ChIP_F GGAGGGGAGGAGATCCTGT
Nr4a1_ChIP_R GGAGGGGGTGTTGTAAATCC
Runx2_ChIP_F GCGAAGGAATGTGTAAACAGG
Runx2_ChIP_R AGAGGCATTTTGCGTTGTG
Prkg1_ChIP_F AGCCTAGTGAAATGTGAACAGATG
Prkg1_ChIP_R AAGGAACTCTTGGCTTATTCCAT

Prkca_ChIP_F GTCCCGTGTTGTGATGAATG
Prkca_ChIP_R TTCCAACATGAACAGCAAGC
Rarβ_ChIP_F CCTCTGGGCAGCTGATACTT
Rarβ_ChIP_R GTGCAGGAAATGCCTTTTG
Med27_ChIP_F CATTTCTTTGTCATTCACTATTAAGCA
Med27_ChIP_R TGATCTCCATCTAGGGAAGTCAT
Pld1_ChIP_R GCATAGCCTCAGCTTCCTGT
Pld1_ChIP_R AATCTGTACAGTTGCCTTTCTAATCA

Supplemental References
Barde, I., Salmon, P., and Trono, D. (2001). Production and Titration of Lentiviral Vectors. In Current Protocols in Neuroscience (John Wiley & Sons, Inc.).
Gubelmann, C., Gattiker, A., Massouras, A., Hens, K., David, F., Decouttere, F., Rougemont, J., and Deplancke, B. (2011). GETPrime: a gene- or transcript-specific primer database for quantitative real-time PCR. Database, bar040.
Hens, K., Feuz, J.-D., Isakova, A., Iagovitina, A., Massouras, A., Bryois, J., Callaerts, P., Celniker, S.E., and Deplancke, B. (2011). Automated protein-DNA interaction screening of Drosophila regulatory elements. Nat Meth 8, 1065-1070.
Maerkl, S.J., and Quake, S.R. (2007). A systems approach to measuring the binding energy landscapes of transcription factors. Science 315, 233-237.
Maerkl, S.J., and Quake, S.R. (2009). Experimental determination of the evolvability of a transcription factor. Proceedings of the National Academy of Sciences 106, 18650-18655.
Reddy, T.E., Pauli, F., Sprouse, R.O., Neff, N.F., Newberry, K.M., Garabedian, M.J., and Myers, R.M. (2009). Genomic determination of the glucocorticoid response reveals unexpected mechanisms of gene regulation. Genome Research 19, 2163-2171.
Siersbaek, R., Nielsen, R., John, S., Sung, M.-H., Baek, S., Loft, A., Hager, G.L., and Mandrup, S. (2011). Extensive chromatin remodelling and establishment of transcription factor /`hotspots/' during early adipogenesis. Embo J 30, 1459-1472.
Yu, C., Markan, K., Temple, K.A., Deplewski, D., Brady, M.J., and Cohen, R.N. (2005). The Nuclear Receptor Corepressors NCoR and SMRT Decrease Peroxisome Proliferator-activated Receptor γ Transcriptional Activity and Repress 3T3-L1 Adipogenesis. Journal of Biological Chemistry 280, 13600-13605.