Embed Size (px)
Citation preview
Biophysical Journal, Volume 110
Supplemental Information
Cholesterol Increases the Openness of SNARE-Mediated Flickering Fu-
sion Pores
Benjamin S. Stratton, JasonM.Warner, ZhenyongWu, Joerg Nikolaus, GeorgeWei, EmmaWagnon, David Baddeley, Erdem Karatekin, and Ben O'Shaughnessy
Biophysical Journal
Supporting Material
Cholesterol Increases the Openness of SNARE-Mediated Flickering Fusion Pores
Benjamin S. Stratton,1 Jason M. Warner ,1 Zhenyong Wu,2,3 Joerg Nikolaus,2,3 George Wei,1 Emma Wagnon,1 David Baddeley,3,4 Erdem Karatekin,2,3,5,6,* and Ben O'Shaughnessy1,*
1Department of Chemical Engineering, Columbia University, New York, New York; 2Department of Cellular and Molecular Physiology, Yale University, School of Medicine, New Haven, Connecticut; 3Nanobiology Institute, Yale University, West Haven, Connecticut; 4Department of Cell Biology and 5Department of Molecular Biophysics and Biochemistry, Yale University, New Haven, Connecticut; and 6Laboratoire de Neurophotonique, Université Paris Descartes, Centre National de la Recherche Scientifique (CNRS) UMR8250, Paris, France
*Correspondence: [email protected]; [email protected]

2
Decomposition of the docking-to-fusion delay time distribution into a fast and
a slow component
For each fusion event, following docking of a vesicle onto the SBL fusion occurred after a delay
time 𝜏delay (Fig. 2B, C). We measured 𝜏delay from the TIRF signal and for each lipid
composition we constructed the distribution of delay times, represented as the survivor function
𝑆�𝜏delay�, the probability fusion has not occurred after a time 𝜏delay (Fig. S2E). From these
distributions we found that there are two populations of fusion events: a fast-fusing population
and a slowly fusing population with significantly longer delay times, similarly to ref. (1).
Following ref. (1) we interpreted the fast fusers as being SNARE-dependent, and the slow fusers
as originating in non-specific events and involving fusion pores whose dynamics were not
controlled by SNAREpins. This enabled us to measure the effects of SNARE proteins on
flickering fusion pore dynamics, and to study by comparison the dynamics of fusion pores that
are apparently controlled only by the lipid membranes independently of SNAREs, consistent
with ref. (1).
The survivor distributions were well fit by mixed exponentials of the form 𝑆�𝜏delay� =
𝑎 exp(−𝜏delay/𝜏delay) + (1 − 𝑎) exp�−𝜏delay/𝜏ns� where a is the amplitude of the fast fusing
component and is interpreted as the fraction of vesicles which fuse in a SNARE-mediated
manner, 𝜏delay is the mean docking-to-fusion delay time for SNARE-mediated fusion, and 𝜏ns is
the mean delay time for non-specific fusion. Fits were obtained using a maximum likelihood
estimate using Matlab’s Statistics Toolbox. 𝜏ns was in the range ~2 − 3 s for all compositions,
~10 times greater than typical mean delay times for specific SNARE-mediated events.
Method to identify events as fast or slow. We determined a maximum cutoff time for the
specific SNARE-mediated events, and defined all events with 𝜏delay less (greater) than this time
to be specific (non-specific) events. The cutoff time was determined as follows. As the parameter
𝑎 represents the fraction of fusion events which are SNARE-mediated, we varied the cutoff time
until the fraction of fusion events below this cutoff time matched 𝑎 from the double exponential
fit. For self-consistency, we checked that the cutoff time was larger than the mean value of the
delay time for the fast fusers and smaller than the mean value of the delay time for the slow
3
fusers. The cutoff times we find, ~70-600 ms (Fig. S2E), are ~2-6-fold greater than 𝜏delay and
~4-fold smaller than 𝜏ns.
The statistics of fusion events between v-SUVs and protein-free SBLs are similar to those
for the slow component of fusion events between v-SUVs and t-SBLs. We also examined
fusion events between protein-free SBLs (pf-SBLs) and v-SNARE containing SUVs (v-SUVs).
To test that the slow component of the fusion events between t-SNARE containing SBLs (t-
SBLs) and v-SUVs represented events for which the fusion pore dynamics were SNARE-
independent, we compared 𝜏ns to 𝜏pf, the mean value of the delay time for pf-SBL/v-SUV fusion
events. For membranes with 45% (10%) cholesterol in the SUV (SBL) we found 𝜏pf ~ 1.9 s,
statistically indistinguishable from 𝜏ns for the same composition, Fig. 5A (p>0.05). Similarly, for
the same composition the openness 𝑃0 ~ 0.05 ± 0.02 of pf-SBL/v-SUVs fusion pores was
statistically indistinguishable from the pore openness for the slow component of the t-SBL/v-
SUV fusion events (P>0.05, see non-specific events in Fig. 4C).
These observations are consistent with the hypothesis that the fusion pore dynamics of the slow
component of t-SBL/v-SUV events are determined by the physical properties of the lipid
bilayers.
Properties of single fluorescent lipids in the SBL
In the main text (SNARE-mediated fusion pores flicker or are permanently open, in Results) we
fit the predicted total intensity time course, eq. 3, to the measured integrated intensity time
course 𝐼tot(𝑡) for each fusion event to determine the pore openness and vesicle size (Fig. 4). In
order to perform this fit, we required three single lipid properties: the single fluorescent lipid
intensity 𝐼lip in the SBL, the fluorescent lipid bleaching time in the SBL 𝜏bleach, and the single
lipid diffusivity 𝐷lip (Fig. S2). Almost all fluorescent spots released into the SBL upon fusion
remained bright for a period and then suddenly darkened (bleached) in a single frame, consistent
with these spots being single fluorescent lipids. In this way, for each lipid we made a ‘digital’
measurement of the bleaching time. We confined our single lipid analysis to those which

4
bleached in one step in this manner. Fluorescent lipids were tracked using SpeckleTrackerJ (2),
and further analysis was performed using Matlab.
Measurement of single fluorescent lipid intensity, 𝑰𝐥𝐢𝐩. We measured the intensity of a single
lipid by measuring the average change of intensity upon bleaching. We take the average of the
total intensity of a lipid in an area 3𝑥3 pixels (0.80 𝑥 0.80 𝜇𝑚2) centered on the lipid, time-
averaged over the final 15 frames for which the lipid fluoresced. We measured the background
intensity in the same location where the lipid bleached, over the 15 frames following bleaching.
The latter was subtracted from the former to determine the intensity of the individual lipid. We
then averaged each of these individual lipid intensities over ~40 lipids to determine the mean
single lipid intensity 𝐼lip for a given movie, ~1 min in duration (i.e. Fig. S2A). All analysis of
events from that movie used the measured single lipid intensity from that movie.
Measurement of single lipid diffusion coefficient,𝑫𝐥𝐢𝐩 . We calculated the mean square
displacement (MSD) for lipid trajectories lasting ≳ 1.5 seconds and determined the best fit linear
relation of MSD vs. t over time windows ranging from one to 10 frames (𝑡frame ≈ 17 ms or 31
ms) to sample a full range of the trajectory. A sample of 7 of these MSD curves is shown in Fig.
S2B. We then calculated the diffusion constant from MSD = 𝑀𝑆𝐷(0) + 4 𝐷lip 𝑡 for each
analyzed trajectory. We report a mean ± SEM 𝐷lip averaged from ~20 analyzed lipid trajectories
for each lipid composition, Table S3. The MSD was calculated in Matlab.
Measurement of lipid bleaching time in the SBL, 𝝉𝐛𝐥𝐞𝐚𝐜𝐡. We measured the lipid bleaching
time 𝜏bleach by determining the total duration of single lipid trajectories and then calculating the
survivor function 𝑓fluor(𝑡) describing many such trajectories. We fit a decaying exponential to
the survivor function 𝑓fluor(𝑡) = 𝑒−𝑡/𝜏bleach (Fig. S2C). Approximately 50 bleaching episodes
were used to calculate the survivor function in each movie. The uncertainty reported is the 95%
confidence interval from the fitting routine.
The bleaching rate in the vesicle is much slower than that in the SBL. Our measurements of
single lipid bleaching were for lipids in the SBL. To determine bleaching rates for lipids in
vesicles (expected to be lower since the fluorescence emission is lower) we measured the
bleaching time of entire vesicles 𝜏bleachves for ∼ 30 vesicles that did not fuse per movie. We
measured 𝜏bleachves from the best fit exponential 𝐼tot(𝑡) = 𝐼o exp(−𝑡/𝜏bleachves ) (Fig. S2D). 𝐼tot is

5
the spatially integrated intensity over a box of size 15x15 pixels centered on the unfused vesicle,
with the background subtracted off. Repeating this for each movie, we found that the bleaching
time in vesicles is ~5-8-fold greater than the bleaching time in the SBL. Thus, when we used our
model to calculate the fluorescence intensity versus time, 𝐼𝑡𝑜𝑡(𝑡) , we neglected fluorescent
bleaching of lipids in the vesicle (eqs. 3, 4).
Analysis of individual fusion events.
For each fusion event, we measured the total intensity versus time t, 𝐼tot(𝑡) (Fig. 2B and C). To
do this, we measured the integrated intensity by drawing a square region of interest of size
30𝑥30 pixels. We use a box of this size to ensure that all of the lipids remain in the box for the
duration of the measurement, 1.6 s. We analyzed fusion events with longer release times by
manually drawing larger boxes based on the specific fusion event. Fusing vesicles were well
spaced enough that we did not have to account for significant background lipid diffusion into the
region of interest.
In TIRFM the evolving fluorescence intensity following a SUV-SBL fusion event provides a
high time resolution readout of lipid transfer. As described in the main text, when lipids
diffuse from a vesicle into the SBL through the walls of a fusion pore a rapid increase in
fluorescence intensity is observed due to the spatial decay of the intensity of the incident
evanescent wave, and the change in mean lipid orientation when a lipid transfers to the planar
SBL from the spherical SUV which alters the coupling to the polarized evanescent wave. The
increase in fluorescence is instantaneous upon transfer of a labeled lipid into the SBL and thus
provides a very sensitive measure of the fraction of dye transferred between the fusing
membranes as a function of time, with temporal resolution limited only by acquisition frame
rates (~100 Hz, which is in turn limited by the exposure time needed to detect single
fluorophores). In conjunction with a mathematical model of release through a flickering pore,
this enabled us to accurately measure SUV-to-SBL lipid release times 𝜏release . A fitting
procedure using the mathematical model was needed because the lipid release kinetics are
convoluted with bleaching kinetics (Fig. 2C).

6
By comparison the spread of the dye from the fusion site to a distance larger than the optical
resolution (~250 nm) would take 60 ms or longer (taking Dlip=1 𝜇𝑚2𝑠−1), too slow to measure
typical release times. In a previous work where we employed the present SUV-SBL fusion assay,
but used far-field fluorescence microscopy rather than TIRFM, the signal of fusion was taken to
be this spread of lipids from the fusion site, quantified by the time course of the width of a two-
dimensional Gaussian profile fit to the image sequence representing a fusing vesicle (1).
A different kind of resolution limit determines the minimum flickering frequency our method
can access. When a flickering pore opens (Fig. S1A), if it remains open for longer than the time
for all labelled lipids to diffuse out of the vesicle through the open pore, the signal will be lost
before completion of a single flicker cycle. This diffusion time is approximately τves, the lipid
diffusion time for a distance of order the vesicle size (multiplied by a logarithmic factor of order
unity involving the pore diameter). Thus when we observe a pore openness <1, indicating that
the release time exceeds τves, the most we can say is that the flickering frequency is higher than
this lower limit. Given τves~ 10ms for a typical vesicle size, it follows that the pores we measure
flicker at frequencies ≳ 100 Hz. A similar limitation holds for amperometry, once the contents
have been released, the pore may continue to flicker without being observed.
Dependence of fusion statistics on vesicle size
Fusion pore statistics do not depend on vesicle size. Over the vesicle size range (10 𝑛𝑚 ≲
𝑅ves ≲ 80 𝑛𝑚) and lipid compositions studied, our data did not reveal correlations between
vesicle size and either docking-to-fusion delay times, pore openness 𝑃o or the fraction of pores
that were permanently open (Fig. S4A-C).
Fusion probability does not depend on vesicle size. A fraction of vesicles dock but do not fuse
within the time the labelled lipids in the vesicle have completely bleached. Thus we sought to
determine whether these vesicles followed a different size distribution to vesicles that fused, as
this would suggest size-dependence in the fusion mechanism.
For these events where fusion does not occur we could not use our usual procedure to measure
vesicle size, which is based on fitting our model to a fluorescence intensity versus time curve
7
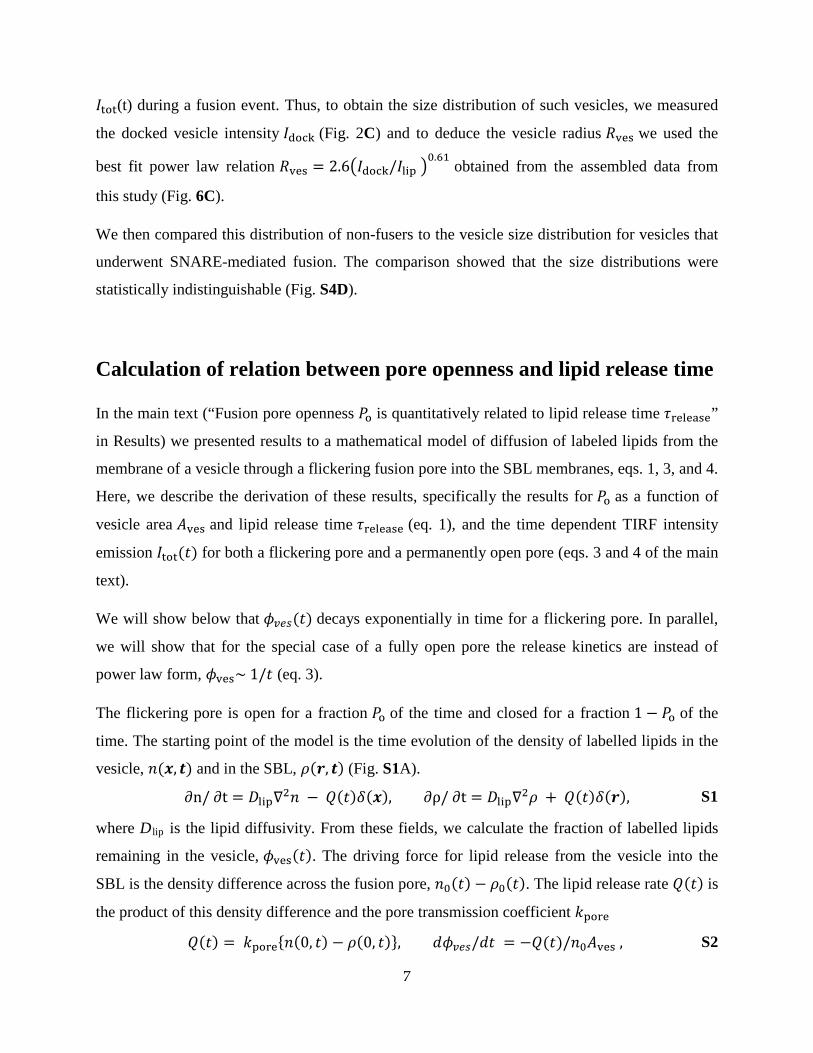
𝐼tot(t) during a fusion event. Thus, to obtain the size distribution of such vesicles, we measured
the docked vesicle intensity 𝐼dock (Fig. 2C) and to deduce the vesicle radius 𝑅ves we used the
best fit power law relation 𝑅ves = 2.6�𝐼dock/𝐼lip �0.61
obtained from the assembled data from
this study (Fig. 6C).
We then compared this distribution of non-fusers to the vesicle size distribution for vesicles that
underwent SNARE-mediated fusion. The comparison showed that the size distributions were
statistically indistinguishable (Fig. S4D).
Calculation of relation between pore openness and lipid release time
In the main text (“Fusion pore openness 𝑃o is quantitatively related to lipid release time 𝜏release”
in Results) we presented results to a mathematical model of diffusion of labeled lipids from the
membrane of a vesicle through a flickering fusion pore into the SBL membranes, eqs. 1, 3, and 4.
Here, we describe the derivation of these results, specifically the results for 𝑃o as a function of
vesicle area 𝐴ves and lipid release time 𝜏release (eq. 1), and the time dependent TIRF intensity
emission 𝐼tot(𝑡) for both a flickering pore and a permanently open pore (eqs. 3 and 4 of the main
text).
We will show below that 𝜙𝑣𝑒𝑠(𝑡) decays exponentially in time for a flickering pore. In parallel,
we will show that for the special case of a fully open pore the release kinetics are instead of
power law form, 𝜙ves~ 1/𝑡 (eq. 3).
The flickering pore is open for a fraction 𝑃o of the time and closed for a fraction 1 − 𝑃o of the
time. The starting point of the model is the time evolution of the density of labelled lipids in the
vesicle, 𝑛(𝒙, 𝒕) and in the SBL, 𝜌(𝒓, 𝒕) (Fig. S1A).
∂n/ ∂t = 𝐷lip∇2𝑛 − 𝑄(𝑡)𝛿(𝒙), ∂ρ/ ∂t = 𝐷lip∇2𝜌 + 𝑄(𝑡)𝛿(𝒓), S1
where D lip is the lipid diffusivity. From these fields, we calculate the fraction of labelled lipids
remaining in the vesicle, 𝜙ves(𝑡). The driving force for lipid release from the vesicle into the
SBL is the density difference across the fusion pore, 𝑛0(𝑡) − 𝜌0(𝑡). The lipid release rate 𝑄(𝑡) is
the product of this density difference and the pore transmission coefficient 𝑘pore
𝑄(𝑡) = 𝑘pore{𝑛(0, 𝑡) − 𝜌(0, 𝑡)}, 𝑑𝜙𝑣𝑒𝑠/𝑑𝑡 = −𝑄(𝑡)/𝑛0𝐴ves , S2
8
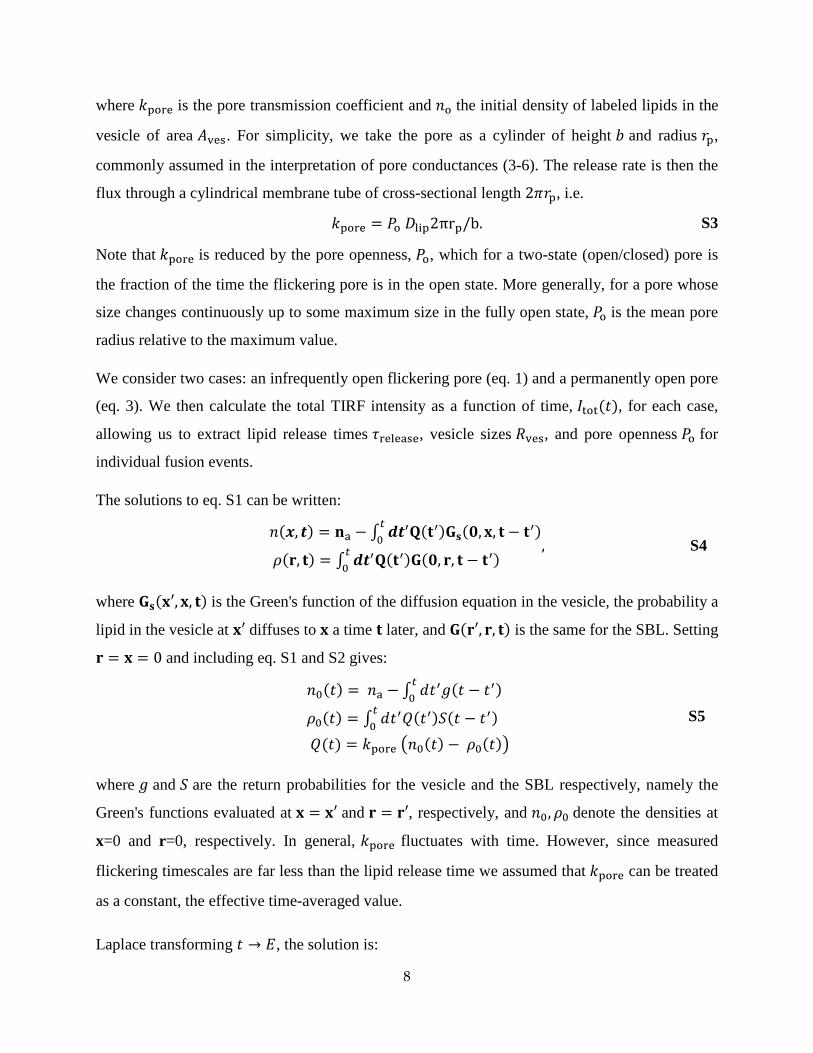
where 𝑘pore is the pore transmission coefficient and 𝑛o the initial density of labeled lipids in the
vesicle of area 𝐴ves. For simplicity, we take the pore as a cylinder of height 𝑏 and radius 𝑟p,
commonly assumed in the interpretation of pore conductances (3-6). The release rate is then the
flux through a cylindrical membrane tube of cross-sectional length 2𝜋𝑟p, i.e.
𝑘pore = 𝑃o 𝐷lip2πrp/b. S3
Note that 𝑘pore is reduced by the pore openness, 𝑃o, which for a two-state (open/closed) pore is
the fraction of the time the flickering pore is in the open state. More generally, for a pore whose
size changes continuously up to some maximum size in the fully open state, 𝑃o is the mean pore
radius relative to the maximum value.
We consider two cases: an infrequently open flickering pore (eq. 1) and a permanently open pore
(eq. 3). We then calculate the total TIRF intensity as a function of time, 𝐼tot(𝑡), for each case,
allowing us to extract lipid release times 𝜏release, vesicle sizes 𝑅ves, and pore openness 𝑃o for
individual fusion events.
The solutions to eq. S1 can be written:
𝑛(𝒙, 𝒕) = 𝐧a − ∫ 𝒅𝒕′𝐐(𝐭′)𝐆𝐬(𝟎,𝐱, 𝐭 − 𝐭′)𝑡
0
𝜌(𝐫, 𝐭) = ∫ 𝒅𝒕′𝐐(𝐭′)𝐆(𝟎, 𝐫, 𝐭 − 𝐭′)𝑡0
, S4
where 𝐆𝐬(𝐱′,𝐱, 𝐭) is the Green's function of the diffusion equation in the vesicle, the probability a
lipid in the vesicle at 𝐱′ diffuses to 𝐱 a time 𝐭 later, and 𝐆(𝐫′, 𝐫, 𝐭) is the same for the SBL. Setting
𝐫 = 𝐱 = 0 and including eq. S1 and S2 gives:
𝑛0(𝑡) = 𝑛a − ∫ 𝑑𝑡′𝑔(𝑡 − 𝑡′) 𝑡
0
𝜌0(𝑡) = ∫ 𝑑𝑡′𝑄(𝑡′)𝑆(𝑡 − 𝑡′)𝑡0
𝑄(𝑡) = 𝑘pore �𝑛0(𝑡) − 𝜌0(𝑡)�
S5
where 𝑔 and 𝑆 are the return probabilities for the vesicle and the SBL respectively, namely the
Green's functions evaluated at 𝐱 = 𝐱′ and 𝐫 = 𝐫′, respectively, and 𝑛0,𝜌0 denote the densities at
x=0 and r=0, respectively. In general, 𝑘pore fluctuates with time. However, since measured
flickering timescales are far less than the lipid release time we assumed that 𝑘pore can be treated
as a constant, the effective time-averaged value.
Laplace transforming 𝑡 → 𝐸, the solution is:

9
𝑄 = 𝑘pore𝑛a𝐸�1+𝑘pore�𝑔(𝐸)+𝑆(𝐸)��
,
𝜌0 = 𝑘pore𝑛a𝑆𝐸�1+𝑘pore�𝑔(𝐸)+𝑆(𝐸)��
,
𝑛0/𝑛a = 𝑘pore𝑆𝐸�1+𝑘pore�𝑔(𝐸)+𝑆(𝐸)��
,
S6
where 𝑄(𝐸),𝜌o(𝐸),𝑛0(𝐸),𝑔(𝐸),𝑆(𝐸) are all functions of 𝐸 . Note that 𝐺 is a simple 2D
Gaussian describing free lipid diffusion in the SBL. Thus, 𝑆(𝑡) = 1/4𝜋𝐷lip 𝑡 , and a crude
approximation of its Laplace transform is 𝑆(𝐸) ≈ �1/𝐷lip� ln(1/𝐸𝑡b) where 𝑡b = 𝑏2/𝐷lip and 𝑏
is a pore cut-off scale.
Lipid release through a flickering fusion pore. If 𝑘pore ≪ 𝐷lip, then 𝑆(𝐸) ≪ 1/𝑘pore for any
𝐸 > 𝑡b−1𝑒1/𝜖, where 𝜖 = 𝑘pore/𝐷lip. Thus for small enough 𝜖, for all relevant 𝐸 we can delete
the 𝑘pore 𝑆 terms in eq. S3. In addition, we can replace 𝑔(𝐸) ≈ 1/𝐸𝐴ves with its form for small
𝐸 (𝐸 < 1/𝜏ves) reflecting the fact that on time scales greater than 𝜏ves a point source uniformly
covers the vesicle. We justify this below. Thus, eq. S5 gives:
𝑛0 = 𝑛a𝐸+𝑘pore/𝐴ves
𝜌0 = 𝑘pore𝑛a𝑆𝐸+𝑘pore/𝐴ves
𝑄 = 𝑘pore𝑛0
S7
The solution is 𝑛0(𝑡) = 𝑛𝑎 exp(−𝑡/𝜏release) where 𝜏release = 𝐴ves/𝑘pore . Using the
expression for 𝑘pore in eq. S3, we arrive at the expression for pore openness 𝑃o in terms of
𝜏release and 𝐴ves of eq. 1 of the main text. Using the expression for 𝑄 in eq. S7 in eq. S2 gives
𝜙ves = exp(−𝑡/𝜏release) S8
In this limit, 𝑛(𝑥, 𝑡) ≈ 𝑛0(𝑡) is uniform because the release time greatly exceeds the vesicle
diffusion time (since 𝜏release/𝜏ves = 1/𝜖 ≫ 1). Further, the fraction released by time 𝜏ves is thus
very small. Since 𝑔(𝑡) assumes its long time form (1/𝐴ves) for times 𝑡 > 𝜏ves, this justifies our
replacing 𝑔(𝐸) with its long time form to obtain eq. S8: these are the only time scales relevant to
the decay of 𝜙ves.
TIRF intensity time course through a flickering fusion pore. In this subsection we derive the
expression of eq. 2 in the main text for the time-dependent total fluorescence intensity of labelled
10
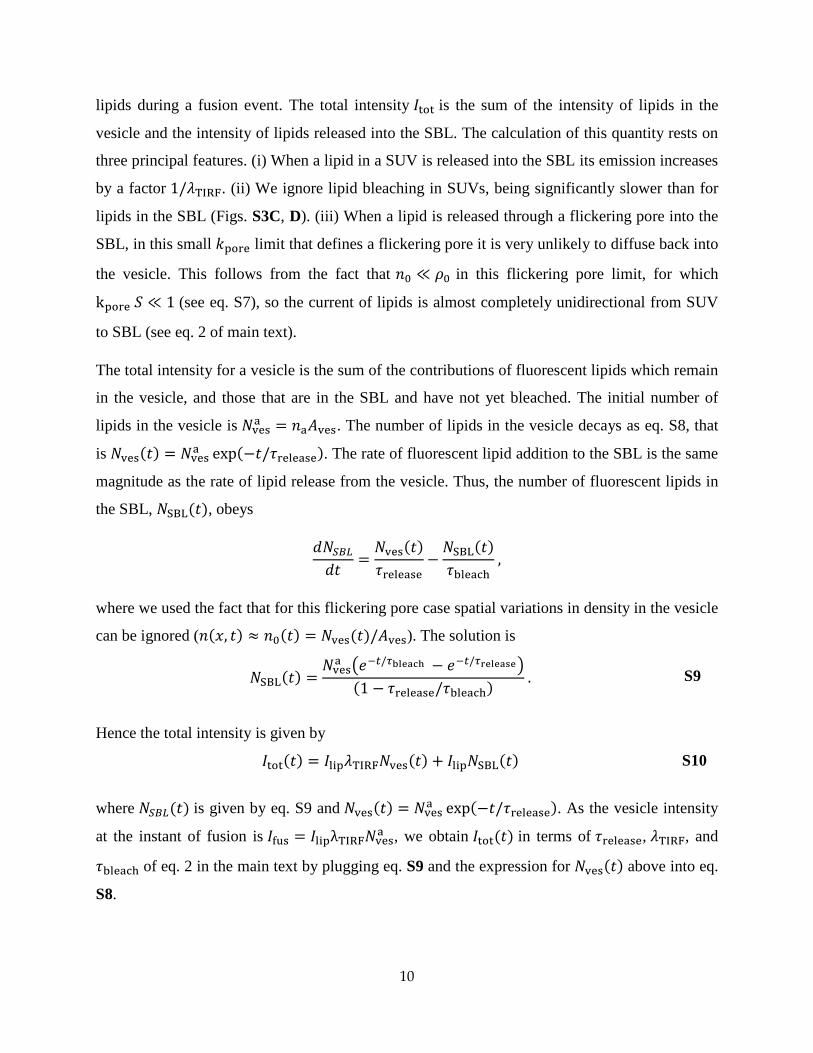
lipids during a fusion event. The total intensity 𝐼tot is the sum of the intensity of lipids in the
vesicle and the intensity of lipids released into the SBL. The calculation of this quantity rests on
three principal features. (i) When a lipid in a SUV is released into the SBL its emission increases
by a factor 1/𝜆TIRF. (ii) We ignore lipid bleaching in SUVs, being significantly slower than for
lipids in the SBL (Figs. S3C, D). (iii) When a lipid is released through a flickering pore into the
SBL, in this small 𝑘pore limit that defines a flickering pore it is very unlikely to diffuse back into
the vesicle. This follows from the fact that 𝑛0 ≪ 𝜌0 in this flickering pore limit, for which
kpore 𝑆 ≪ 1 (see eq. S7), so the current of lipids is almost completely unidirectional from SUV
to SBL (see eq. 2 of main text).
The total intensity for a vesicle is the sum of the contributions of fluorescent lipids which remain
in the vesicle, and those that are in the SBL and have not yet bleached. The initial number of
lipids in the vesicle is 𝑁vesa = 𝑛a𝐴ves. The number of lipids in the vesicle decays as eq. S8, that
is 𝑁ves(𝑡) = 𝑁vesa exp(−𝑡/𝜏release). The rate of fluorescent lipid addition to the SBL is the same
magnitude as the rate of lipid release from the vesicle. Thus, the number of fluorescent lipids in
the SBL, 𝑁SBL(𝑡), obeys
𝑑𝑁𝑆𝐵𝐿𝑑𝑡
=𝑁ves(𝑡)𝜏release
−𝑁SBL(𝑡)𝜏bleach
,
where we used the fact that for this flickering pore case spatial variations in density in the vesicle
can be ignored (𝑛(𝑥, 𝑡) ≈ 𝑛0(𝑡) = 𝑁ves(𝑡)/𝐴ves). The solution is
𝑁SBL(𝑡) =
𝑁vesa �𝑒−𝑡/𝜏bleach − 𝑒−𝑡/𝜏release�(1 − 𝜏release/𝜏bleach) . S9
Hence the total intensity is given by
𝐼tot(𝑡) = 𝐼lip𝜆TIRF𝑁ves(𝑡) + 𝐼lip𝑁SBL(𝑡) S10
where 𝑁𝑆𝐵𝐿(𝑡) is given by eq. S9 and 𝑁ves(𝑡) = 𝑁vesa exp(−𝑡/𝜏release). As the vesicle intensity
at the instant of fusion is 𝐼fus = 𝐼lipλTIRF𝑁vesa , we obtain 𝐼tot(𝑡) in terms of 𝜏release, 𝜆TIRF, and
𝜏bleach of eq. 2 in the main text by plugging eq. S9 and the expression for 𝑁ves(𝑡) above into eq.
S8.

11
The case of a permanently open pore. For a fully open pore, 𝑃o = 1, eq. S3 tells us that
𝑘pore = 𝐷lip2𝜋𝑟p/𝑏. Thus 𝑘pore is of order 𝐷lip (𝜖 ≈ 1), and 𝑘pore 𝑆(𝐸) ≫ 1 for all 𝐸 ≫ 𝑡b−1, ie
for all relevant 𝐸. Thus from eq. S6
𝜌𝑜 ≈ 𝑛0 ≈ 𝑛a𝐴ves𝑆(𝐸) S11
Consider the behavior for 𝐸 ≪ 1/𝜏ves. On these time scales 𝐸𝑆 < 1/𝐴ves and we have
𝜌o(𝐸) ≈ 𝑛0(𝐸) ≈ 𝑛a𝐴ves𝑆(𝐸), (𝐸 < 1/𝜏ves) S12
Thus 𝑛0(𝑡) decays as 𝑆(𝑡) = 1/(4 𝜋𝐷lip𝑡) , and 𝜙ves(𝑡) ≈ 𝑛0(𝑡)/𝑛a = 𝐴ves𝑆(𝑡) . Hence we
obtain eq. 4 of the main text 𝜙ves(𝑡) = 𝜏ves/𝑡 . The form of the net TIRF signal 𝐼tot(𝑡) is
modified from eq. 3 of the main text. Unlike flickering pores, reverse diffusion is significant
through an open pore: typical lipids transit the fusion pore many times and lipids which have
bleached will reenter the vesicle, just as fluorescing lipids will. Thus, all lipids have equal
probability of bleaching and the predicted TIRF fluorescence intensity 𝐼tot(𝑡) for permanently
open pores is thus eq. 4 of the main text.
Calculation of the number of SNARE complexes at the fusion pore
using the t-SNARE recruitment model of ref. (1)
In the main text (“At high cholesterol levels fusion is so accelerated that there is insufficient time
to recruit t-SNAREs to the fusion site,” Fig. 5A) we report the number of t-SNAREs recruited
during the docking-to-fusion delay time by vesicle v-SNAREs using the SNARE recruitment
model that we previously developed in ref. (1). This procedure provides an estimate of the
number of SNAREpins involved in fusion for each membrane composition, reported in Fig. 5A
of the main text.
t-SNARE recruitment model. In ref. (1), we developed a t-SNARE recruitment model to
determine the number of t-SNAREs, 𝑁⋆, recruited to the vesicle a time 𝜏 after the vesicle is
docked by formation of the first SNARE complex. The key model assumptions were: (1) t-
SNAREs are homogeneously and randomly distributed throughout the SBL with density ΓS and
diffuse independently with diffusivity 𝐷S; (2) when a t-SNARE diffuses into the “reaction sink”
12
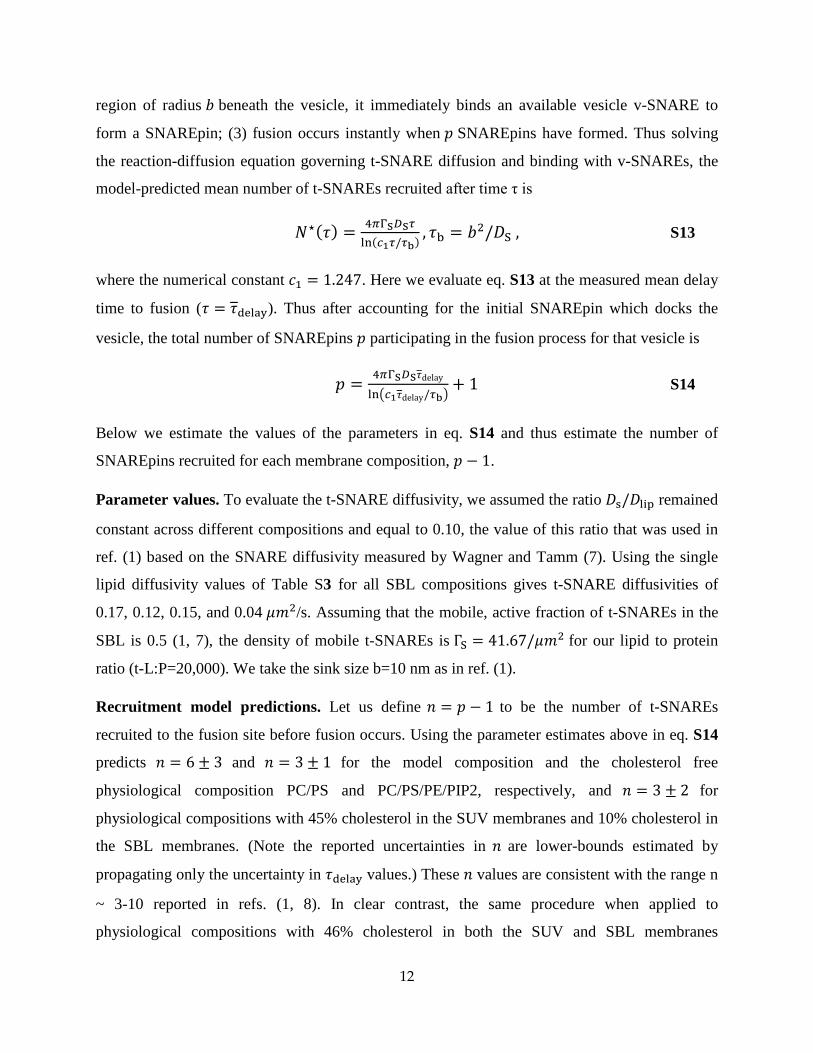
region of radius 𝑏 beneath the vesicle, it immediately binds an available vesicle v-SNARE to
form a SNAREpin; (3) fusion occurs instantly when 𝑝 SNAREpins have formed. Thus solving
the reaction-diffusion equation governing t-SNARE diffusion and binding with v-SNAREs, the
model-predicted mean number of t-SNAREs recruited after time τ is
𝑁⋆(𝜏) = 4𝜋ΓS𝐷S𝜏ln(𝑐1𝜏/𝜏b)
, 𝜏b = 𝑏2/𝐷S , S13
where the numerical constant 𝑐1 = 1.247. Here we evaluate eq. S13 at the measured mean delay
time to fusion (𝜏 = 𝜏delay). Thus after accounting for the initial SNAREpin which docks the
vesicle, the total number of SNAREpins 𝑝 participating in the fusion process for that vesicle is
𝑝 = 4𝜋ΓS𝐷S𝜏delay
ln�𝑐1𝜏delay/𝜏b�+ 1 S14
Below we estimate the values of the parameters in eq. S14 and thus estimate the number of
SNAREpins recruited for each membrane composition, 𝑝 − 1.
Parameter values. To evaluate the t-SNARE diffusivity, we assumed the ratio 𝐷s/𝐷lip remained
constant across different compositions and equal to 0.10, the value of this ratio that was used in
ref. (1) based on the SNARE diffusivity measured by Wagner and Tamm (7). Using the single
lipid diffusivity values of Table S3 for all SBL compositions gives t-SNARE diffusivities of
0.17, 0.12, 0.15, and 0.04 𝜇𝑚2/s. Assuming that the mobile, active fraction of t-SNAREs in the
SBL is 0.5 (1, 7), the density of mobile t-SNAREs is ΓS = 41.67/𝜇𝑚2 for our lipid to protein
ratio (t-L:P=20,000). We take the sink size b=10 nm as in ref. (1).
Recruitment model predictions. Let us define 𝑛 = 𝑝 − 1 to be the number of t-SNAREs
recruited to the fusion site before fusion occurs. Using the parameter estimates above in eq. S14
predicts 𝑛 = 6 ± 3 and 𝑛 = 3 ± 1 for the model composition and the cholesterol free
physiological composition PC/PS and PC/PS/PE/PIP2, respectively, and 𝑛 = 3 ± 2 for
physiological compositions with 45% cholesterol in the SUV membranes and 10% cholesterol in
the SBL membranes. (Note the reported uncertainties in 𝑛 are lower-bounds estimated by
propagating only the uncertainty in 𝜏delay values.) These 𝑛 values are consistent with the range n
~ 3-10 reported in refs. (1, 8). In clear contrast, the same procedure when applied to
physiological compositions with 46% cholesterol in both the SUV and SBL membranes

13
predicted that only 𝑛 = 0.15 ± 0.02 SNAREpins are recruited during the delay to fusion,
suggesting that there is insignificant time for even a single additional t-SNARE to be recruited to
the fusion site after docking.
As discussed in the main text, this could indicate that t-SNAREs are preclustered at docking sites
with high densities.
Dependence of the TIRF fluorescence reduction factor 𝝀𝐓𝐈𝐑𝐅 on
vesicle radius 𝑹𝐯𝐞𝐬: coupled contributions from incident evanescent
intensity decay and polarization effects
In Fig. 6D of the main text we plotted values of 𝝀𝐓𝐈𝐑𝐅 versus 𝑹𝐯𝐞𝐬 obtained from our analyses of
many fusion events. Here, we discuss the theoretical relationship between these two quantities
based on the known characteristics of TIRF microscopy. From this relation we determined the
tangent of the relation at zero vesicle radius and we fit the tangent to the data of Fig. 6D.
Consider a vesicle of radius 𝑅ves docked at the SBL as in Fig. 6A. The total TIRF fluorescence
emission intensity of the vesicle is a sum over all lipid orientations 𝜃 in the spherical vesicle
membrane
𝐼dock = 𝜖𝐼inco 𝜌lip𝜇Q ∫ 𝑑𝜃2𝜋𝑅ves2 sin 𝜃 𝛼P(𝜃)𝑒−𝑅ves[1+cos𝜃]/𝛿TIRF𝜋0 . S15
Here 𝐼inco is the incident TIRF intensity at the SBL (𝑧 = 0), 𝜖 is the single fluorescent lipid
emissivity, 𝛿TIRF is the TIRF decay length and 𝜇Q ≤ 1 is the fluorescence quenching factor due
to a higher labeled lipid density in the vesicle. The mean polarization factor per lipid, 𝛼P(𝜃), is
the factor by which the lipid intensity is reduced (or enhanced) due to its orientation, for a
segment of the vesicle bilayer with outward normal oriented at angle 𝜃 relative to the SBL
normal. We define this factor relative to the situation when the lipid resides in the SBL (𝜃 = 0):
hence 𝛼P(0) ≡ 1. It arises because the evanescent TIRF wave is polarized, and preferentially
excites fluorescent labels whose excitation dipoles align with its polarization (9). 𝛼P is the mean
value per lipid, and is a weighted average over all labeled lipids in the inner and outer
monolayers of the local vesicle segment. In general it is expected to depend on bilayer curvature,

14
labeled and unlabeled lipid density and the partitioning of labeled lipids between the two
monolayers.
Following fusion of the vesicle, the labeled lipids will be released into the SBL and after
sufficient time will have diffused to be dilute enough for full dequenching to have occurred. The
polarization factor for the lipids is then unity. Thus, the total intensity of the released lipids in the
SBL is given by:
𝐼dock = 𝜖𝐼inco 𝜌lip4𝜋𝑅ves2 S16
The fluorescence reduction factor is the ratio of the total intensities before and after fusion:
𝜆TIRF(𝑅ves) = 𝐼dock𝐼SBL
= 𝜇Q2 ∫ 𝑑𝜃 sin 𝜃 𝛼P(𝜃)𝑒−𝑅ves[1+cos𝜃]/𝛿TIRF𝜋
0 S17
We are interested in the form of 𝜆TIRF as a function of 𝑅ves. It is clear from the integral in eq.
S17 that this dependence is complex, as the effects of exponential TIRF intensity fall off and
polarization are intimately coupled. Both effects are important. The only practical way to
establish this crucial function, 𝜆TIRF(𝑅ves), is to directly measure it as described in the main text
(Fig. 6D).
Determining the pure polarization effect. Now taking the derivative of 𝜆TIRF(𝑅ves) with
respect to 𝑅ves and setting 𝑅ves = 0 , one obtains a sum of two terms, −𝜆TIRF(0)/𝛿TIRF +
�𝜇Q/2� ∫ 𝑑𝜃 sin𝜃 cos 𝜃 𝛼P(𝜃)𝜋0 . The second term vanishes, however, from the up-down
symmetry of the polarization factor, 𝛼P(𝜃) = 𝛼P(𝜋 − 𝜃). Thus
�𝜕𝜆TIRF𝜕𝑅ves
�𝑅ves=0
= −𝜆TIRF(0)𝛿TIRF
,𝜆TIRF(0) = �𝜇Q2�� 𝑑𝜃 sin𝜃 𝛼P(𝜃)
𝜋
0 . S18
This shows that, at zero vesicle radius, 𝜆TIRF and its slope are determined by a simple moment of
the polarization factor 𝛼P(𝜃). To obtain 𝜆TIRF(0), in principle one could measure 𝜆TIRF versus
vesicle radius (as described in this paper) and extrapolate to zero radius. In the main text we
outlined an alternative procedure to obtain 𝜆TIRFo ≡ 𝜆TIRF(0) which is based on the slope at the
origin, and is preferable because our data is noisiest for small vesicles, whose small lipid release
times are covered by fewest time frames in our intensity profiles. For small 𝑅ves (we used data
points with 𝑅ves < 35 nm) we fit our 𝜆TIRF versus 𝑅ves data to a linear relation with the correct
slope, as given by eq. S18 (dashed red line, Fig. 6D). Constraining this tangent to have intercept

15
𝑅ves = 𝛿TIRF = 68 nm, the experimentally measured evanescent field penetration depth (see
Materials and Methods), and extrapolating to zero vesicle size we could read off 𝜆TIRFo = 0.81 ±
0.03. For our experimental system, 𝜆TIRFo is essentially a pure polarization effect because self-
quenching is expected to be negligible at the dilute lipid labeling densities we used (0.6-0.8 mole
%, see Table S1).
Quantitative model of the effect of cholesterol on the fusion pore
bending energy
A number of theoretical studies have analyzed the energetics of the membrane fusion pore (10,
11). Here we estimated the reduction by cholesterol of the bending energy of the highly bent
fusion pore using a simple extension of a mathematical model developed in ref. (12). This is a
strong effect because cholesterol has negative spontaneous curvature, and the fusion pore has a
net negative curvature. The model quantifies the elastic properties of the lipid leaflets that
constitute the pore. Our aim is to predict the influence of cholesterol on the free energy of pore
formation, Δ𝐹pore, which is closely related to pore openness 𝑃0 (see main text).
Consider two planar bilayers, whose neutral surfaces are separated by distance 2h (Fig. S5A).
We assume each bilayer is symmetric and we will consider each of the physiologically motivated
compositions that we treated in our experimental study (PC/PS/PE/PIP2, PC/PS/PE/PIP2/Ch,
PC/PS/PE/PIP2/Ch+, Tables S1, S2.). What is the free energy to create a fusion pore, Δ𝐹pore?
How is this free energy change affected by the addition of cholesterol? We assume the pore is
torroidal in shape (10) with radius 𝑟p. Hence each monolayer of the pore is also torroidal with
dimensions adjusted by the monolayer thickness 𝛿 (Fig. S5A). Kozlov et al (12) calculated the
elastic bending energy of such torroidal monolayers as
𝐹monolayer = 𝜋𝜅
⎩⎨
⎧ 2�ℎ + 𝑟p�2
ℎ�𝑟p�𝑟p + 2ℎ�atan�
𝑟p + 2ℎ𝑟p
+ 𝐶o�2𝜋�𝑟p + ℎ� − 8ℎ� − 4
⎭⎬
⎫
S19
where 𝜅 is the monolayer bending modulus and 𝐶o is the monolayer spontaneous curvature. We
applied this equation to the situation of two monolayers that constitute a fusion pore as follows.
(1) Pore geometry required that the parameter h for membrane separation be increased
16
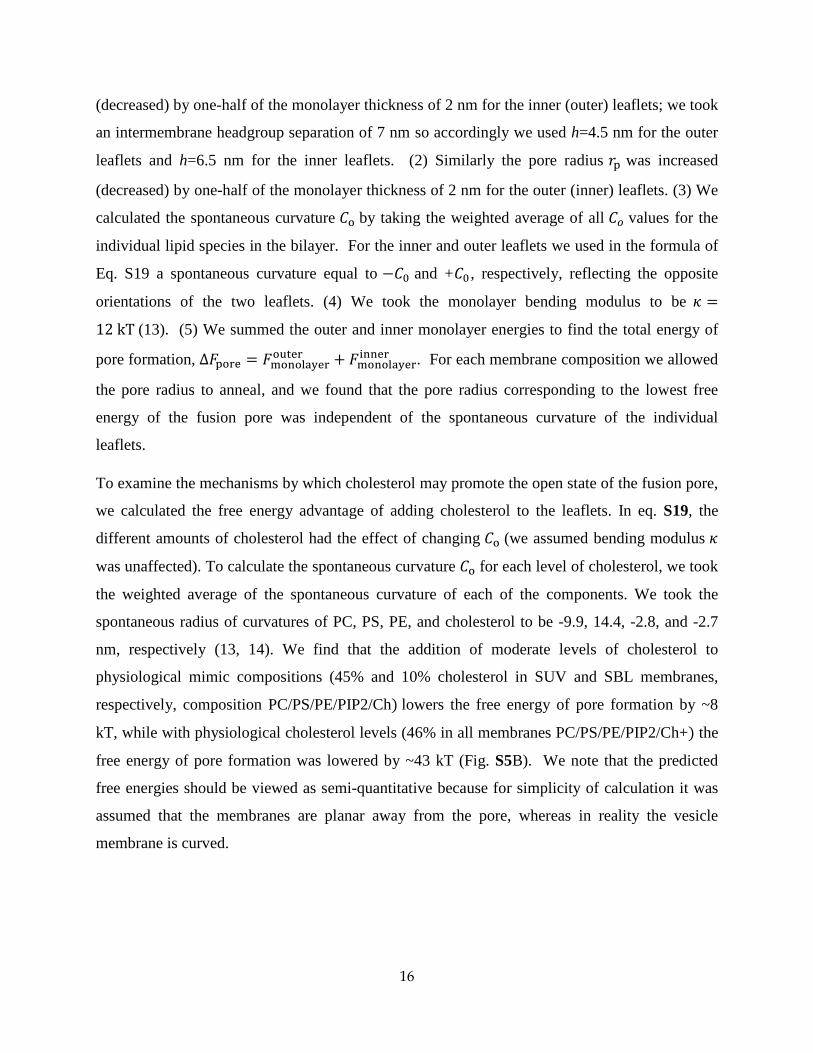
(decreased) by one-half of the monolayer thickness of 2 nm for the inner (outer) leaflets; we took
an intermembrane headgroup separation of 7 nm so accordingly we used h=4.5 nm for the outer
leaflets and h=6.5 nm for the inner leaflets. (2) Similarly the pore radius 𝑟p was increased
(decreased) by one-half of the monolayer thickness of 2 nm for the outer (inner) leaflets. (3) We
calculated the spontaneous curvature 𝐶o by taking the weighted average of all 𝐶𝑜 values for the
individual lipid species in the bilayer. For the inner and outer leaflets we used in the formula of
Eq. S19 a spontaneous curvature equal to −𝐶0 and +𝐶0 , respectively, reflecting the opposite
orientations of the two leaflets. (4) We took the monolayer bending modulus to be 𝜅 =
12 kT (13). (5) We summed the outer and inner monolayer energies to find the total energy of
pore formation, Δ𝐹pore = 𝐹monolayerouter + 𝐹monolayerinner . For each membrane composition we allowed
the pore radius to anneal, and we found that the pore radius corresponding to the lowest free
energy of the fusion pore was independent of the spontaneous curvature of the individual
leaflets.
To examine the mechanisms by which cholesterol may promote the open state of the fusion pore,
we calculated the free energy advantage of adding cholesterol to the leaflets. In eq. S19, the
different amounts of cholesterol had the effect of changing 𝐶o (we assumed bending modulus 𝜅
was unaffected). To calculate the spontaneous curvature 𝐶o for each level of cholesterol, we took
the weighted average of the spontaneous curvature of each of the components. We took the
spontaneous radius of curvatures of PC, PS, PE, and cholesterol to be -9.9, 14.4, -2.8, and -2.7
nm, respectively (13, 14). We find that the addition of moderate levels of cholesterol to
physiological mimic compositions (45% and 10% cholesterol in SUV and SBL membranes,
respectively, composition PC/PS/PE/PIP2/Ch) lowers the free energy of pore formation by ~8
kT, while with physiological cholesterol levels (46% in all membranes PC/PS/PE/PIP2/Ch+) the
free energy of pore formation was lowered by ~43 kT (Fig. S5B). We note that the predicted
free energies should be viewed as semi-quantitative because for simplicity of calculation it was
assumed that the membranes are planar away from the pore, whereas in reality the vesicle
membrane is curved.
17
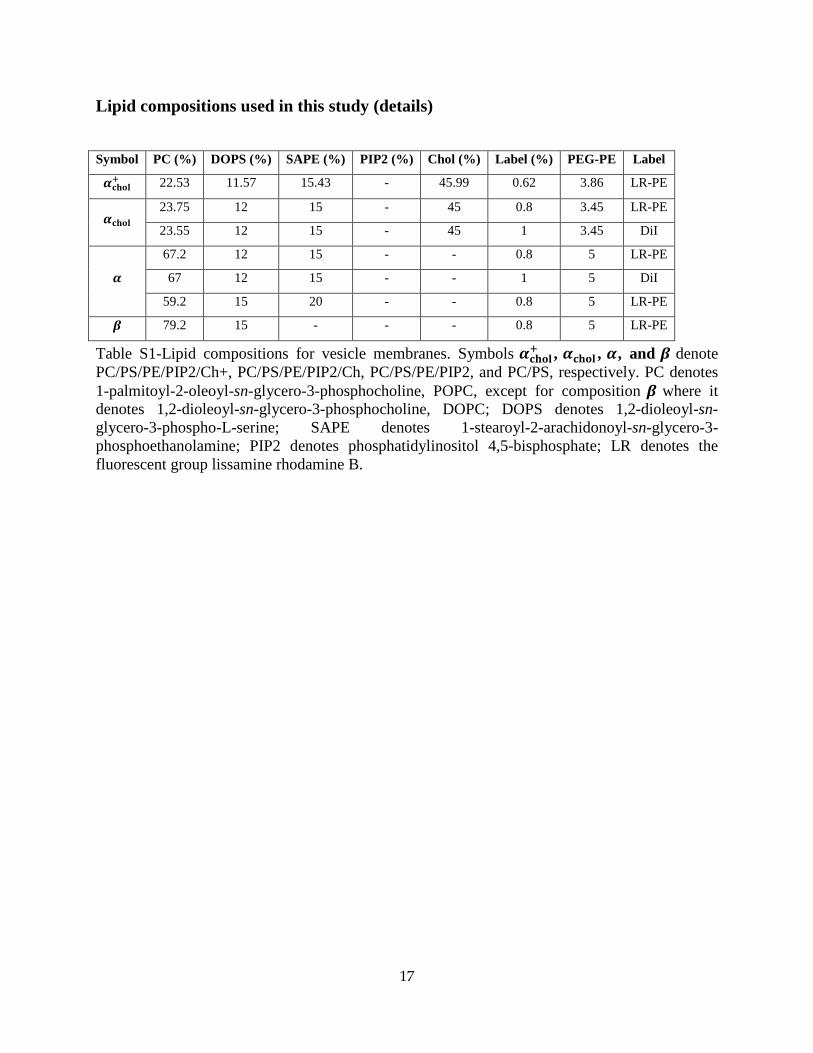
Lipid compositions used in this study (details)
Symbol PC (%) DOPS (%) SAPE (%) PIP2 (%) Chol (%) Label (%) PEG-PE Label
𝜶𝐜𝐡𝐨𝐥+ 22.53 11.57 15.43 - 45.99 0.62 3.86 LR-PE
𝜶𝐜𝐡𝐨𝐥 23.75 12 15 - 45 0.8 3.45 LR-PE
23.55 12 15 - 45 1 3.45 DiI
𝜶
67.2 12 15 - - 0.8 5 LR-PE
67 12 15 - - 1 5 DiI
59.2 15 20 - - 0.8 5 LR-PE
𝜷 79.2 15 - - - 0.8 5 LR-PE
Table S1-Lipid compositions for vesicle membranes. Symbols 𝜶𝐜𝐡𝐨𝐥+ , 𝜶𝐜𝐡𝐨𝐥 , 𝜶, and 𝜷 denote PC/PS/PE/PIP2/Ch+, PC/PS/PE/PIP2/Ch, PC/PS/PE/PIP2, and PC/PS, respectively. PC denotes 1-palmitoyl-2-oleoyl-sn-glycero-3-phosphocholine, POPC, except for composition 𝜷 where it denotes 1,2-dioleoyl-sn-glycero-3-phosphocholine, DOPC; DOPS denotes 1,2-dioleoyl-sn-glycero-3-phospho-L-serine; SAPE denotes 1-stearoyl-2-arachidonoyl-sn-glycero-3-phosphoethanolamine; PIP2 denotes phosphatidylinositol 4,5-bisphosphate; LR denotes the fluorescent group lissamine rhodamine B.
18
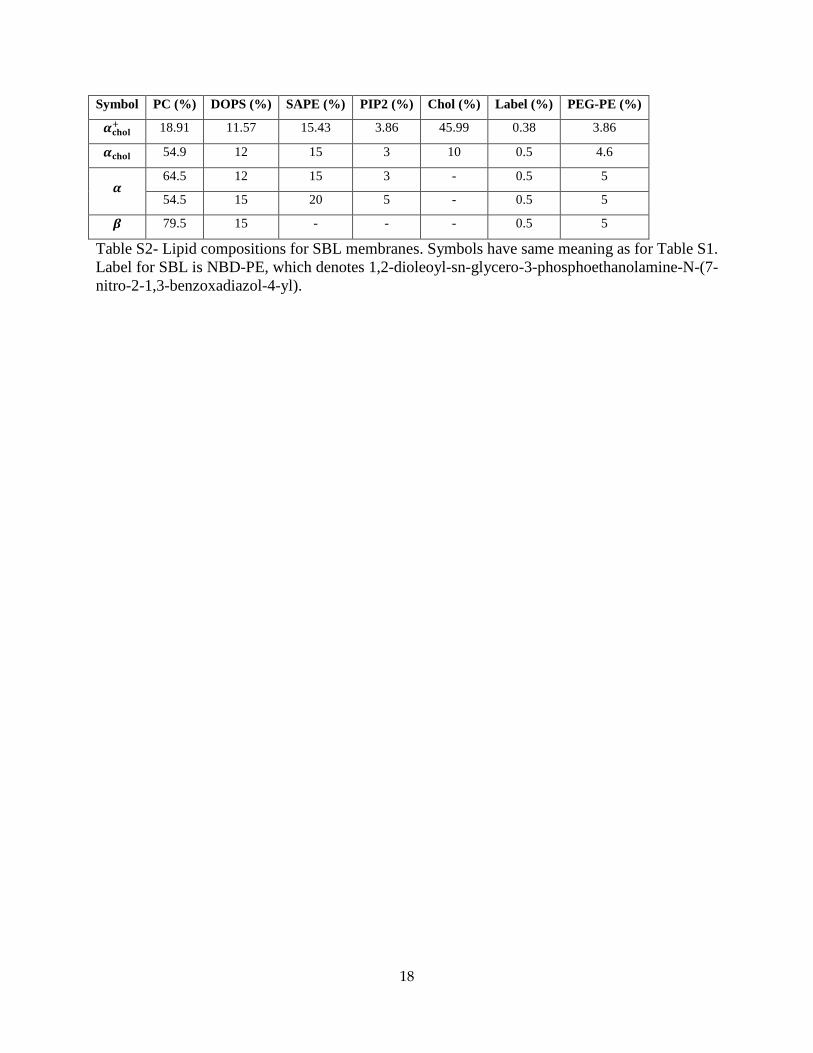
Symbol PC (%) DOPS (%) SAPE (%) PIP2 (%) Chol (%) Label (%) PEG-PE (%)
𝜶𝐜𝐡𝐨𝐥+ 18.91 11.57 15.43 3.86 45.99 0.38 3.86
𝜶𝐜𝐡𝐨𝐥 54.9 12 15 3 10 0.5 4.6
𝜶 64.5 12 15 3 - 0.5 5
54.5 15 20 5 - 0.5 5
𝜷 79.5 15 - - - 0.5 5
Table S2- Lipid compositions for SBL membranes. Symbols have same meaning as for Table S1. Label for SBL is NBD-PE, which denotes 1,2-dioleoyl-sn-glycero-3-phosphoethanolamine-N-(7-nitro-2-1,3-benzoxadiazol-4-yl).
19
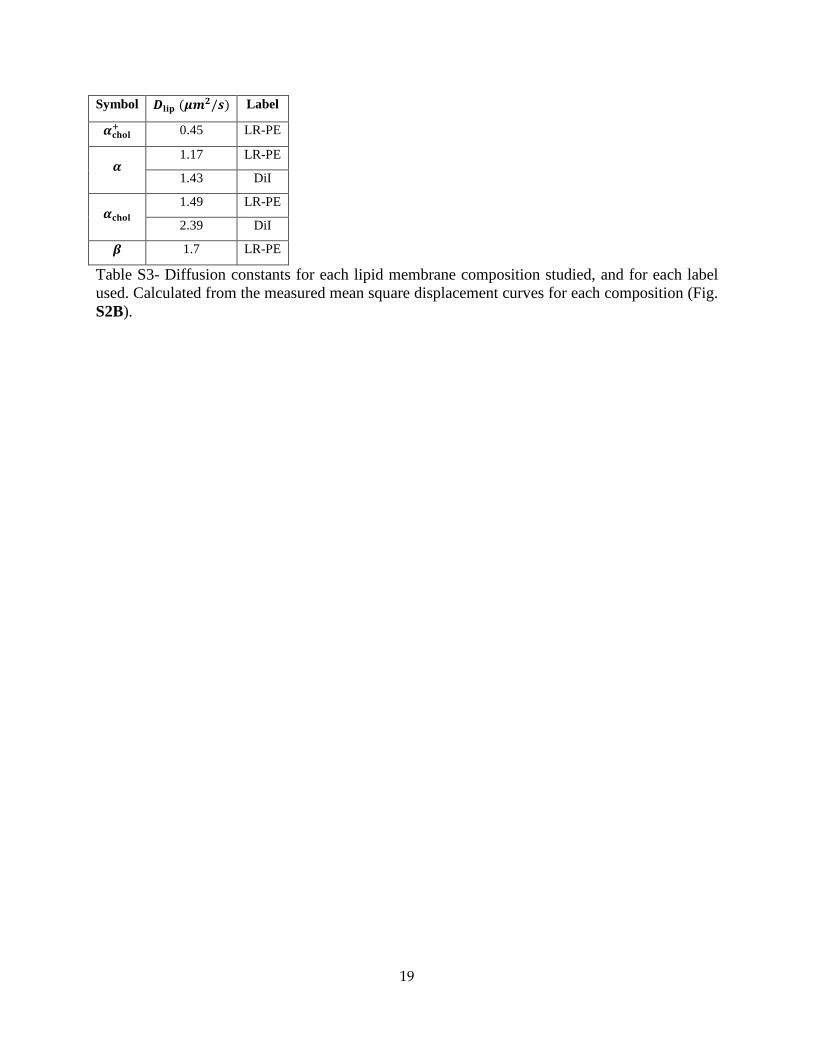
Symbol 𝑫𝐥𝐢𝐩 (𝝁𝒎𝟐/𝒔) Label
𝜶𝐜𝐡𝐨𝐥+ 0.45 LR-PE
𝜶 1.17 LR-PE
1.43 DiI
𝜶𝐜𝐡𝐨𝐥 1.49 LR-PE
2.39 DiI
𝜷 1.7 LR-PE
Table S3- Diffusion constants for each lipid membrane composition studied, and for each label used. Calculated from the measured mean square displacement curves for each composition (Fig. S2B).

20
Supporting References Cited
1. Karatekin, E., J. Di Giovanni, C. Iborra, J. Coleman, B. O'Shaughnessy, M. Seagar, and J. E. Rothman. 2010. A fast, single-vesicle fusion assay mimics physiological SNARE requirements. Proceedings of the National Academy of Sciences 107:3517-3521.
2. Smith, M. B., E. Karatekin, A. Gohlke, H. Mizuno, N. Watanabe, and D. Vavylonis. 2011. Interactive, Computer-Assisted Tracking of Speckle Trajectories in Fluorescence Microscopy: Application to Actin Polymerization and Membrane Fusion. Biophysical journal 101:1794-1804.
3. Klyachko, V. A., and M. B. Jackson. 2002. Capacitance steps and fusion pores of small and large-dense-core vesicles in nerve terminals. Nature 418:89-92.
4. Breckenridge, L., and W. Almers. 1987. Final steps in exocytosis observed in a cell with giant secretory granules. Proceedings of the National Academy of Sciences 84:1945.
5. Monck, J. R., and J. M. Fernandez. 1992. The exocytotic fusion pore. The Journal of Cell Biology 119:1395.
6. He, L., X. S. Wu, R. Mohan, and L. G. Wu. 2006. Two modes of fusion pore opening revealed by cell-attached recordings at a synapse. Nature 444:102-105.
7. Wagner, M. L., and L. K. Tamm. 2001. Reconstituted syntaxin1a/SNAP25 interacts with negatively charged lipids as measured by lateral diffusion in planar supported bilayers. Biophysical journal 81:266-275.
8. Shi, L., Q. T. Shen, A. Kiel, J. Wang, H. W. Wang, T. J. Melia, J. E. Rothman, and F. Pincet. 2012. SNARE proteins: one to fuse and three to keep the nascent fusion pore open. Science Signalling 335:1355.
9. Axelrod, D. 1989. Total internal reflection fluorescence microscopy. Method Cell Biol. 30:245-270.
10. Chizmadzhev, Y. A., F. Cohen, A. Shcherbakov, and J. Zimmerberg. 1995. Membrane mechanics can account for fusion pore dilation in stages. Biophysical journal 69:2489-2500.
11. Jackson, M. B. 2009. Minimum membrane bending energies of fusion pores. J. Membr. Biol. 231:101-115.
12. Kozlov, M. M., S. L. Leikin, L. V. Chernomordik, V. S. Markin, and Y. A. Chizmadzhev. 1989. Stalk mechanism of vesicle fusion - intermixing of aqueous contents. Eur. Biophys. J. Biophys. Lett. 17:121-129.
13. Chen, Z., and R. Rand. 1997. The influence of cholesterol on phospholipid membrane curvature and bending elasticity. Biophysical journal 73:267-276.
14. Fuller, N., C. R. Benatti, and R. Peter Rand. 2003. Curvature and bending constants for phosphatidylserine-containing membranes. Biophys. J. 85:1667-1674.

21
Supplementary Figures
Figure S1- (A) Model of lipid release from a vesicle through a flickering fusion pore. Schematic of model. The pore is centered at 𝑥 = 0 in the vesicle and 𝑟 = 0 in the SBL. The density of labelled lipids in the vesicle is 𝑛(𝑥, 𝑡) and in the SBL is 𝜌(𝑟, 𝑡). Here, we model the pore as a cylinder of length 𝑏 = 15 nm and radius 𝑟p = 3 nm. The pore radius is measured from the center of the pore to the centerline of the bilayer. During open periods of the pore, lipids can diffuse through the membranes of the neck of the pore into the SBL membranes; the net flux is proportional to the density difference across the pore multiplied by the fraction of the time the pore is open, Po (eqs. S1 and S2). (B) Measured overall distribution of Po values, for all compositions. Mean openness for flickering pores is 0.14±0.01 and the fraction of pores that are permanently open is 15%. Bin size 0.05. (C) Measured distribution of lipid release times across all compositions. Bin size is 0.02 s.

22
Figure S2- Single lipid properties needed for fusion event analysis, and measured docking-to-fusion delay time distributions. (A-C) Single lipid resolution enables accurate measurement of diffusivity, bleaching time and single lipid emission. Plots shown for PC/PS membrane composition. (A) Distribution of measured single lipid intensities, 𝐼lip, in a typical movie. (B) Mean square displacement versus time for seven lipid trajectories. (C) Digital measurement of bleaching time 𝜏bleach. Labeled lipids in the SBL suddenly ceased fluorescing, indicating that these fluorescing spots were individual lipids. The survivor fraction is shown for a sample movie, fit to an exponential exp−𝑡/𝜏bleach (red curve). (D) Bleaching of lipids in vesicles is much slower than for lipids in the SBL. Emission intensity versus time for two representative unfused vesicles. Each is shown with a best fit curve to a decaying exponential 𝐼(𝑡) = 𝑒−𝑡/𝜏bleach
ves where
𝜏bleachves is the bleaching time in the vesicle. Both events are for PC/PS/PE/PIP2/Ch+ membrane composition. The bleaching time of the Docked Vesicle 1 (data: red points, best fit exponential:
23
green curve) is 19.9 s. The bleaching time for Docked Vesicle 2 (data: blue points, best fit exponential: gold curve) is 16.0 s. Both values are much greater than 3𝑠 ≲ 𝜏bleach ≲ 5𝑠, the bleaching time in the SBL. (E) Docking-to-fusion delay time distributions: measured survivor functions for all compositions. Mean delay times 𝜏delay for each composition are shown, along with 95% confidence interval. Colored ticks on the x-axis indicate the cutoff times used to separate the SNARE-mediated and non-specific fusion events. The cutoff times were obtained by fitting double exponentials to the survivor functions. (F) Docking-to-fusion delay time distributions for fusions between protein-free SBLs and v-SNARE containing SUVs, for lipid composition PC/PS/PE/PIP2/Ch that contains 45% (10%) cholesterol in the SUV (SBL) (see Tables S1, S2). Measured survivor function (blue curve) and best fit exponential (red curve) with delay time 𝜏pf = 1.9 s are plotted. There is no statistically significant difference between this distribution and the long tail of the slow component of the delay time distribution for PC/PS/PE/PIP2/Ch fusion events between v-SUVs and t-SBLs (p>0.05), part (E).

24
Figure S3- Vesicle-to-SBL lipid release kinetics through permanently open pores have power law dependence on time. Our model predicts that the number of lipids remaining in the vesicle decays as 𝜙ves(t)~𝜏ves/𝑡 for a fully open fusion pore where 𝜏ves is the diffusion time on the scale of the vesicle and depends on vesicle size (see main text). The pooled 𝜙ves(𝑡) data that we measured for all fully open fusion pores (𝑃o = 1, left panel) collapsed onto a single power law relation when plotted against time scaled with 𝜏ves. The best fit power law (blue line) was 𝑡−𝛼 with 𝛼 = −0.99 ± 0.22, very close to the model prediction. The same procedure applied to flickering pores with relatively small openness (𝑃o ≤ 0.15, right panel) produced a best fit power law exponent 𝛼 = −0.68 ± 0.09.
25
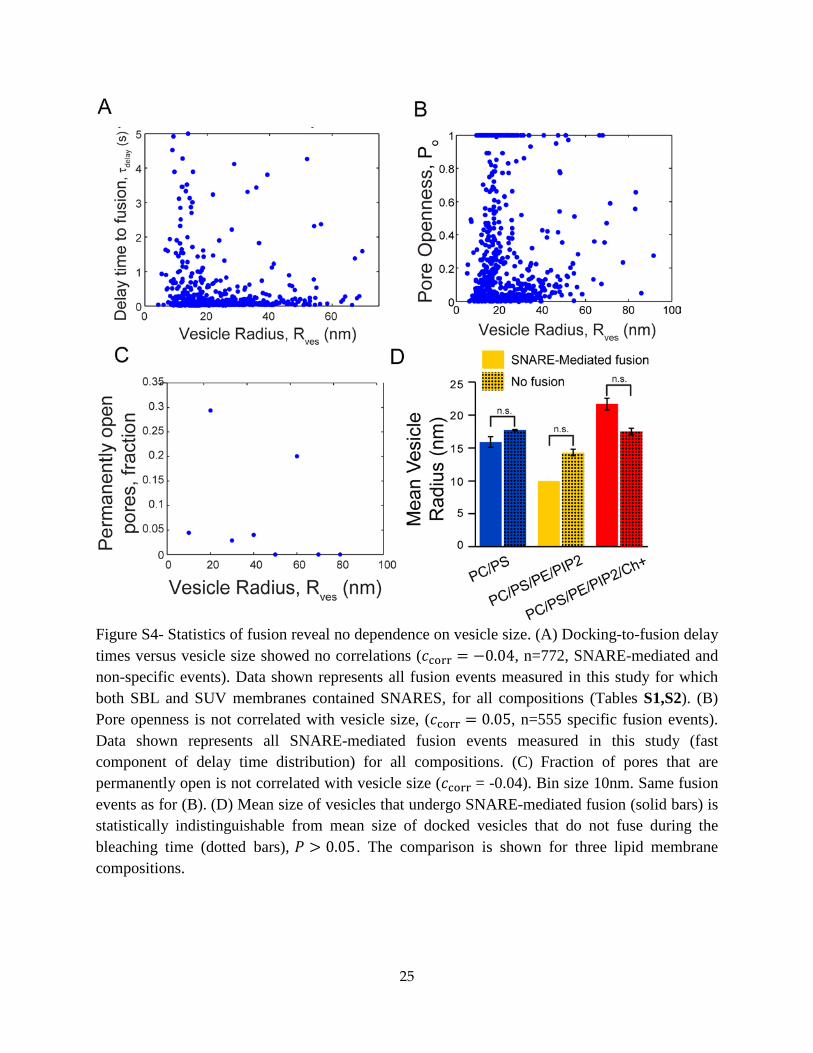
Figure S4- Statistics of fusion reveal no dependence on vesicle size. (A) Docking-to-fusion delay times versus vesicle size showed no correlations (𝑐corr = −0.04, n=772, SNARE-mediated and non-specific events). Data shown represents all fusion events measured in this study for which both SBL and SUV membranes contained SNARES, for all compositions (Tables S1,S2). (B) Pore openness is not correlated with vesicle size, (𝑐corr = 0.05, n=555 specific fusion events). Data shown represents all SNARE-mediated fusion events measured in this study (fast component of delay time distribution) for all compositions. (C) Fraction of pores that are permanently open is not correlated with vesicle size (𝑐corr = -0.04). Bin size 10nm. Same fusion events as for (B). (D) Mean size of vesicles that undergo SNARE-mediated fusion (solid bars) is statistically indistinguishable from mean size of docked vesicles that do not fuse during the bleaching time (dotted bars), 𝑃 > 0.05. The comparison is shown for three lipid membrane compositions.

26
Figure S5- Cholesterol lowers the bending energy of fusion pores: calculation of pore bending energy using an elastic model of the fusion pore. (A) Schematic of a fusion pore, side view. The membranes have asymptotic separation 2h and the pore radius is 𝑟p. Each leaflet has thickness 𝛿. (B) Free energies were calculated for the biologically motivated family of lipid compositions (Tables S1, S2) using eq. S20. The change in free energy of pore formation relative to zero cholesterol (PC/PS/PE/PIP2) is plotted versus cholesterol content. Values for the two cholesterol-rich compositions studied (PC/PS/PE/PIP2/Ch, PC/PS/PE/PIP2/Ch+) are indicated. High cholesterol levels produce enormous free energy decreases, indicating a powerful stabilizing effect on the open state of the pore.
27
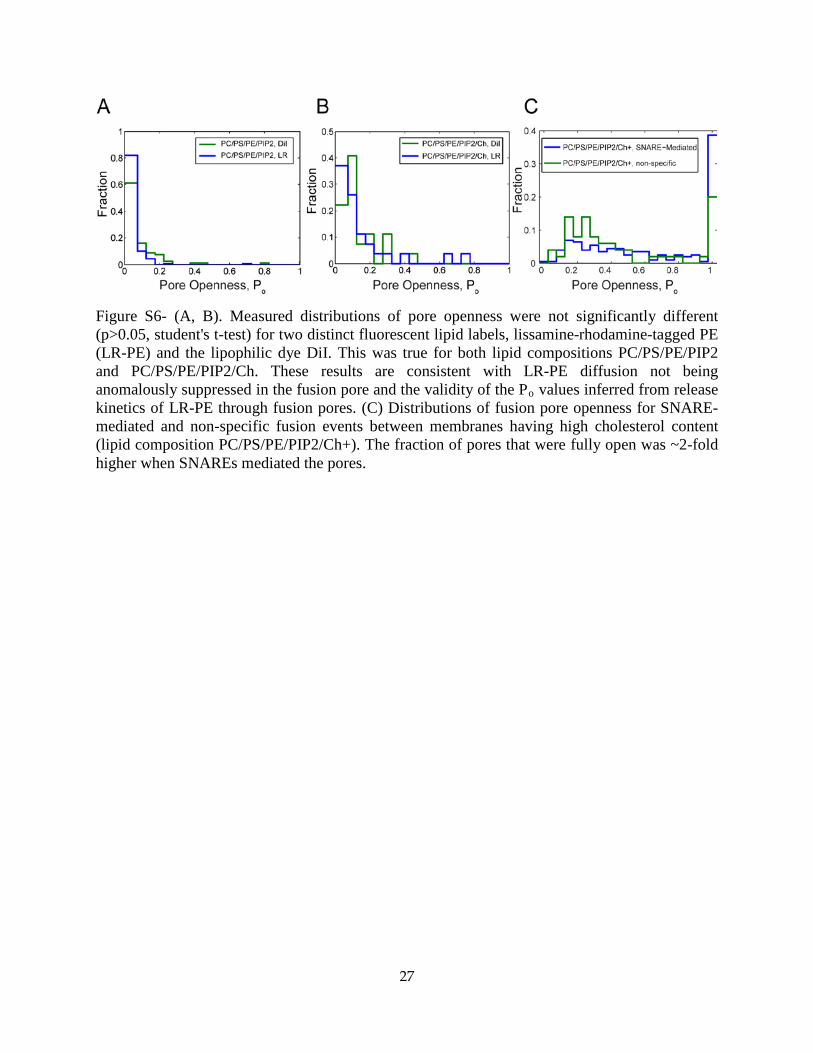
Figure S6- (A, B). Measured distributions of pore openness were not significantly different (p>0.05, student's t-test) for two distinct fluorescent lipid labels, lissamine-rhodamine-tagged PE (LR-PE) and the lipophilic dye DiI. This was true for both lipid compositions PC/PS/PE/PIP2 and PC/PS/PE/PIP2/Ch. These results are consistent with LR-PE diffusion not being anomalously suppressed in the fusion pore and the validity of the Po values inferred from release kinetics of LR-PE through fusion pores. (C) Distributions of fusion pore openness for SNARE-mediated and non-specific fusion events between membranes having high cholesterol content (lipid composition PC/PS/PE/PIP2/Ch+). The fraction of pores that were fully open was ~2-fold higher when SNAREs mediated the pores.

28

29
Figure S7- Additional examples of simultaneous contents and lipid release during v-SUV/t-SBL fusion, measured with TIRFM (cf. Fig 3). (A) vSUVs with 45 mole % cholesterol, (B) cholesterol-free vSUVs contained 1 mole % DiD lipid dye and encapsulated 10 mM soluble contents marker SRB. DiD and SRB were simultaneously excited using 638 nm and 561 nm laser lines, respectively. The emission was split to observe DiD (top trace, blue) and SRB (red trace) fluorescence signals simultaneously projected onto an EMCCD detector. Total intensities from a region 20 pixels by 20 pixels (5.3 µm x 5.3 µm) are plotted (18.3 ms resolution) for both the lipid (upper trace, blue) and contents (lower trace, red) signals for representative events. Snapshots from the lipid (blue) and contents (red) signals are shown in inverted false colors. When docking was clearly visible in the lipid channel, the contents channel was still dim, because SRB was encapsulated at self-quenching concentrations (#1). In the same frame in which the lipid signals begin to increase, announcing lipid mixing, the contents signals also increase (dashed vertical line), due to dilution and dequenching of encapsulated SRB as molecules escape through the pore. Once lipid transfer is complete (shortly after the maximum in the blue trace), the intensity in the lipid channel decreases due to photobleaching (#3), as in Fig. 2. The SRB signal was abruptly lost seconds after the initial dequenching (#4) in ~20% of events. .