Embed Size (px)
Citation preview

Supplemental Figure 1
A
B C
D E F
Femoral artery and vein catheterization
Continuous 4-day IV infusion of saline or glucose
Islet isolation for proteomics analysis
Day 0 Day 3 Day 7
Saline Glucose0
50
100
150
200
Blo
od g
luco
se (m
g/dl
) p=0.01
Pre INF Post INF0
10
20
30
Body
wei
ght (
g)
SalineGlucose
Supplemental Figure 1. (A) Schematic of experimental timeline for glucose infusion for proteomics analysis. Mice were catheterized in the femoral artery and vein on Day 0, allowed to recover for three days, and then received continuous intravenous infusion of saline (control) or 50% glucose through the femoral vein. After 4 days infusion mice were anesthetized and islets immediately isolated for proteomics screen. (B) Average blood glucose measured on blood obtained from the arterial catheter (unhandled mouse) over the 4-day infusion was modestly increased in mice receiving IV glucose. (C) Saline and glucose infused mice were of similar body weight before and after infusion. (D-F) Quantification of immunoblot performed on islets after 4-day infusion, corresponds to images shown in Figure 1F; n=4. Data are repre-sented as mean +/- SEM. *p<0.05 by Student’s T test.
0.0
0.5
1.0
1.5
p-eI
F2a
: act
in
0.0
0.5
1.0
1.5
PC
NA
: ac
tin
0.0
0.5
1.0
1.5
2.0
sXbp
: ac
tin
* *p=0.055
Sal Glu Sal Glu Sal Glu

Supplemental Figure 2
**
5 7.5 150.0
0.5
1.0
BiP/
actin
****
5 7.5 150.0
0.5
1.0
1.5
PC
NA
/act
in
0.0
0.5
1.0
1.5
GR
P94
/act
in
5 7.5 15
**
Actin
GRP94
PDI
5 mM7.5 mM15 mM
**
**
ERO1Lb ERp57 ERp59
p=0.10p=0.07
**** **
**
p97/VCP CHGaSCG3PSMA
p=ns p=ns
0.0
0.5
1.0
1.5
2.0
ddC
t (ge
ne:a
ctin
)
ACLY5 Annexin-V ATPa5 HSP60
7.5 15sXbp
7.5 15uXbp
7.5 15s:uXbp
0.0
0.5
1.0
1.5
2.0
2.5
ddC
t (ge
ne:H
K)
p=0.06*
*
B
G H I J K
A
D E FC
0.0
0.5
1.0
1.5
PD
I / a
ctin
5 7.5 15
p=0.09
7.5 15 7.5 15 7.5 15
**nsns
Supplemental Figure 2. Ex vivo islet glucose exposure models in vivo induction of proliferation, UPR, and targets induced in the proteomics screen (goes with Figure 2). (A) Mouse islet cells cultured in 5, 7.5 or 15 mM glucose for 24 hours were assessed for mRNA expression of the indicated genes corresponding to proteins altered in abun-dance on the proteomics screen (n=3; p values reflect comparison between 5mM and 15mM glucose. (B-C) quanti-fication of immunoblots in Figure 2D (n=3). (C-E) Immunoblots on mouse islet cells cultured in 5, 7.5 or 15mM glucose for other UPR-associated proteins (n=3). (F-I) quantfication of immunoblots in Figure 2G and 2K (n=3). (J) Results of a qPCR assay for spliced and total Xbp. This is a different assay than the gel-based agarose assay shown in Figure 2F. Data are represented as mean +/- SEM. *p<0.05, **p<0.01, ***p<0.001, ****p<0.0001 by Student’s T test
***
5 7.5 150.0
0.5
1.0
1.5
CH
OP
/act
in
0.0
0.5
1.0
1.5
full
leng
th A
TF6
/act
in
0.0
0.5
1.0
1.5
nucl
ear A
TF6
/act
in
0.0
0.5
1.0
1.5
p-eI
F2a/
actin

A B
Supplemental Figure 3
1st probe(Novus)
no strip2nd probe
(Novus)
cre
actin
Ad la
cZ
Ad c
re
ATF6full
nuclear
ATF6full
nuclear
Supplemental Figure 3. Validation of ATF6 antibody. Most commercially available ATF6 antibodies did not detect bands of the correct size in mouse islets in our hands. One antibody, lot#AB121107A-02 from Novus (but not lot#AB060711A-05 from Novus), did detect bands of the correct size for full and nuclear ATF6 in dispersed mouse islet cultures. To test whether these bands were indeed ATF6, we tested (A) islets from ATF6-alpha flox/flox mice (generous gift from G. Hotamisligil) transduced with adeno-lacZ (control) or adeno-cre (for deletion). On first probe the bands are visible but faint, with extensive background; on second probing with the same antibody (with additional washing but without stripping) the bands of correct size are visible in the control and reduced in the Ad-cre treated islets. We also tested the antibody on islet cells treated with the ATF6 inhibitor (B); in this case, although PERK and IRE1 inhibitors did not reduce the nuclear/active ATF6 band, the ATF6 inhibitor did.
actin
Veh
Veh
PERK
inh
Atf
6 in
h
IRE1
inh
ATF6full
nuclear
7.5
50
75100
15 15 15 15
PCNA
CHOP
BiP
p-eIF2α
ATF6
Actin
5
Veh Tg Tm
7.5 15 15 15 15 15 15 15
full
nuclear
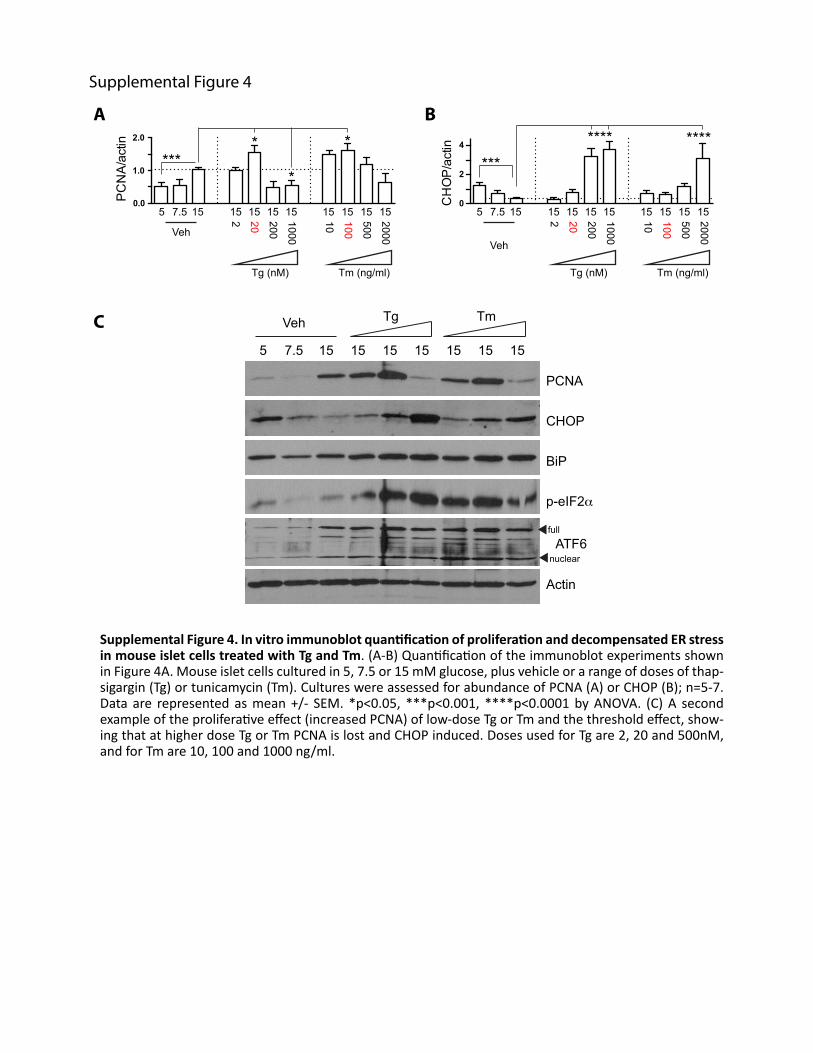
Supplemental Figure 4
Veh
5 7.5 15 15 15 15 15
Tm (ng/ml)
15 15 15 15
Tg (nM)
Veh
5 7.5 15 15 15 15 1515 15 15 15
*****
*0.0
1.0
2.0
PC
NA
/act
in
******* ****
0
2
4
CH
OP
/act
in
10 100
500
2000
2 20 200
1000
Tm (ng/ml)Tg (nM)
10 100
500
2000
2 20 200
1000
Supplemental Figure 4. In vitro immunoblot quantification of proliferation and decompensated ER stress in mouse islet cells treated with Tg and Tm. (A-B) Quantification of the immunoblot experiments shown in Figure 4A. Mouse islet cells cultured in 5, 7.5 or 15 mM glucose, plus vehicle or a range of doses of thap-sigargin (Tg) or tunicamycin (Tm). Cultures were assessed for abundance of PCNA (A) or CHOP (B); n=5-7. Data are represented as mean +/- SEM. *p<0.05, ***p<0.001, ****p<0.0001 by ANOVA. (C) A second example of the proliferative effect (increased PCNA) of low-dose Tg or Tm and the threshold effect, show-ing that at higher dose Tg or Tm PCNA is lost and CHOP induced. Doses used for Tg are 2, 20 and 500nM, and for Tm are 10, 100 and 1000 ng/ml.
A B
C

Supplemental Figure 5
5 mM
Veh Tg
15 mM
Veh Tg
*
*
0
2
4
6
8
% B
rdU
(+) b
eta
cells
5 mM
Veh Tm
15 mM
Veh Tm*
**
5
10
15
% B
rdU
(+) b
eta
cells
Supplemental Figure 5. Low dose thapsigargin (Tg) and tunicamycin (Tm) increase mouse beta cell proliferation (goes with Figure 4). Primary dispersed mouse islet cells were cultured in 5 or 15 mM glucose with vehicle or low-dose Tg (20 nM) or Tm (50 ng/ml) for 72 hours. BrdU was added for the final 24 hours of culture. Cultures were immunostained for insulin, BrdU and dapi, imaged, blinded and counted. (A) The images from Figure 4C are repeated here adjacent to panels showing insulin/dapi alone, to facilitate evaluation of the nuclear nature of the BrdU stain. (B-C) Quantification of BrdU counts from the first experiment exposing islet cell cultures to low dose thapsigargin (B) or tunicamycin (C). B-C was performed by a different individual in the lab from the experiment shown in Figure 4D-E (n=3-5). (D) Individual data points of all experiments, including the plots in Figure 4D-E, panels B-C above, and a third unpublished experiment, showing that proliferation increased when low dose Tg or Tm were added to 15mM glucose, independent of maximal proliferation in any given prep or of experimentalist. Data are represented as mean +/- SEM. *p<0.05, **p<0.01 by Student’s T test. Images were acquired at 200X.
A B
C
D
Veh5m
M5m
MTg
5mM
Tm
15mM
Veh15m
MTg
15mM
Tm
I15m
MVeh
15mM
Tg15m
MTm
Veh5m
M5m
MTg
5mM
Tm
Insulin DNA BrdU Insulin DNA Insulin DNA BrdU Insulin DNA
vehicle
Tg (20nM)Tg (5nM)
Tm (50ng/ml)Tm (10ng/ml)
Tm (100ng/ml)
glucose0
10
20
30
% B
rdU
(+) b
eta
cells
+ -
- -- +
- -- -
- -
15 15
A
0
10
20
30
% B
rdU
(+) b
eta
cells
+ -
- -- -
- +- -
- -
15 15
A
0
10
20
30
% B
rdU
(+) b
eta
cells
+ -
- +- -
- -- -
- -
15 15
B
0
10
20
30
% B
rdU
(+) b
eta
cells
+ -
- -- -
- -- -
- +
15 15
B
0
10
20
30
% B
rdU
(+) b
eta
cells
+ -
- +- -
- -- -
- -
15 15
B
0
10
20
30
% B
rdU
(+) b
eta
cells
+ -
- -- -
- -- +
- -
15 15
BIndividual
***** ** *p=0.05p=ns

Supplemental Figure 6
Supplemental Figure 6. Cell confluence increases in wells treated with low dose Tg and Tm. Wells containing dispersed mouse islet cells were imaged sequentially, at the same time each day, with brightfield microscopy. Time “0 hours” refers to one day after dispersion and plating, when the dispersed islet cultures were treated with the additives indicated. Tg-20 refers to 20 nM thapsigargin; Tm-10 refers to 10 ng/ml tunicamycin. The images in each row represent the same well imaged over time. Note the apparent increase in cell number at 24 and 48 hours, which is not captured by the BrdU exposure between 48-72 hours, or the pHH3 measurement, which reflects M-phase at the time of fixation. Between 0 and 24 hours, cells grown in 15mM glucose undergo spreading, which accounts for some of the increase in apparent confluence at 24 hours. Images acquired at 40X. These images are representative of n=3 independent biological replicates.
0 hours
5 m
M, V
ehic
le15
mM
, Veh
icle
15 m
M, T
g-20
15 m
M, T
m-1
0
24 hours 48 hours 72 hoursA
B
C
D

Supplemental Figure 8
Supplemental Figure 7
5mM - veh 15mM - veh 15mM - Tg20 15mM - Tg1000
Supplemental Figure 7. Scatter plots showing procedure for identifying single alpha, beta and islet cells for the cell number counts per unit time experiments (Figure 4H-4I-4J). Dispersed mouse islet cells were cultured on plastic as described above. After lifting from the plate using trypsin, cells were immunostained for insulin and glucagon to identify beta and alpha cells, then counted by flow cytometry. Gating was performed to (A) capture healthy appearing islet cells, that (B) were not doublets, and (C) stained for either glucagon or insulin. Flow plots are representative of n=5-7 replicates.
Supplemental Figure 8. Scatter plots for Annexin V / PI experiments. Dispersed mouse islet cells cultured with the indicated reagents were lifted using trypsin, stained for annexin V and PI, and analyzed by flow cytometry. The fraction of AnnexinV(+)/PI(+) cells was clearly increased by high dose thapsigargin (Tg; 1000 nM), as expected, but was not increased by low (proliferative) dose thapsigargin (20 nM). These are the raw data from one of n=4 experiments summarized in Figure 4L.
A B C

Supplemental Figure 9
Supplemental Figure 10 p=ns
0
50
100
150
200
Blo
od g
luco
se (m
g/dl
)
CD HFD
Supplemental Figure 10. Blood glucose in high fat diet (HFD) fed mice injected with TUDCA. Blood glucose levels at the end of the 7-day HFD exposure were not significantly different whether mice were injected with saline or with TUDCA. Neither group was significantly different from mice fed control diet (CD). n=5-8. Data are represented as mean ± SEM.
Supplemental Figure 9. Co-immunostaining for BrdU (proliferation) and gamma-H2AX (DNA damage) suggests that UPR-induced BrdU incorporation is not due to DNA damage. Dispersed mouse islet cells cultured in 7.5mM or 15mM glucose, plus additives including low dose 20nM thapsigargin (Tg20), high dose 500nM thapsigargin (Tg500), low dose 100ng/ml tunicamycin (Tm100), or mitomycin C to directly induce DNA damage, were cultured for 72 hours, with BrdU included during the final 24 hours of culture. Although rare cells positive for gamma-H2AX were evident under all conditions, cells with BrdU incorporation in low/high glucose or with low dose Tg or Tm do not show gamma H2AX staining. Directly inducing DNA damage by treatment with mitomycin C, conversely, induces widespread gamma H2AX staining, without many BrdU positive cells, suggesting that BrdU does not routinely label beta cells with DNA damage. Arrows: gamma-H2AX labeled cells. Arrowheads: cells labeled with both gamma-H2AX and BrdU.
gam
ma-
H2A
X D
NA
Brd
U
7.5 mM, Vehicle 15 mM, Vehicle 15 mM, Tg 20
15 mM, Tg 50015 mM, Tm 100 15 mM, Mitomycin C
A B C
D E F

Supplemental Figure 11
Supplemental Figure 11. IRE1, PERK and ATF6 inhibitors block activation of their expected targets. Mouse islets were dispersed and cultured on plastic for 48 (A, C) or 72 (B) hours, then harvested for RNA (A, C) or protein (B) analysis. For all panels, high dose thapsigargin (Tg) 500nM was added to activate ER stress. (A) IRE1 inhibitor prevented splicing of Xbp (n=3). (B) PERK inhibitor reduced phosphorylation of eIF2a. (C) ATF6 inhibitor reduced expression of known ATF6 transcriptional targets. As expected, the ATF6 inhibitor did not alter abundance of sXbp or ATF6. Data are represented as mean +/- SEM. *p<0.05, **p<0.01 by Student’s t-test.
p-eIF2α
actin
veh
ATF6
inhi
b
PE
RK
inhi
b
veh
veh
veh
IRE
1 in
hib
IRE
1 in
hib
IRE
1 in
hib
Xbp
Actin
unsplicedspliced
A B
C
0.5
1.0
1.5
2.0
2.5
gene
:HK
HerpUD Hyou1 Pdia4 Grp94 BiP Erdj4 SelL1 sXbp uXbp Atf6
Tg-500 + + + + + + + + + + + + + + + + + + + +ATF6-inhibitor - + - + - + - + - + - + - + - + - + - +
** ** ** * *ns ns ns
p=0.08
p=0.08

Supplemental Figure 12
Supplemental Figure 12. Viability of mouse islet cells after electroporation. Mouse islets were dispersed using trypsin, and then either held as control (”No Shock”), electroporated with control plasmid or electro-porated with ATF6 plasmid, then immediately treated with TOPRO dye to identify dead cells. The most significant loss of viability occurred after trypsinization, with moderate additional loss of viability after electroporation. n=3, quantified by flow cytometry. Data are represented as mean +/- SEM. *p<0.05, ***p<0.001 by Student’s T test.
No
Sho
ck
Con
trol p
lasm
id
ATF
6 pl
asm
id
0
20
40
60
80
100
% L
ive
cells
(TO
PR
O-n
egat
ive)
*** *

Supplemental Figure 13
Supplemental Figure 13. Raw, non-normalized data for human islet experiments. Variability in human beta cell proliferation among donors necessitated normalizing the data to observe effects of thapsigargin (Tg) and tunicamycin (Tm) on proliferation (Figure 9). The raw, non-normalized data are shown here for all preps treated with Tg (20, 200 or 500 nM), Tm (10, 100 or 1000 ng/ml), and chaperones TUDCA and PBA. Note that in nearly all preps, low dose Tg and/or Tm increased proliferation over 15mM glucose baseline, and, when tested, TUDCA and PBA reduced proliferation below 15mM glucose baseline. Later preps (G-L) were not treated with high dose Tg or Tm, or chaperones (H-L). Note the variable Y-axis range, and the lack of proliferative effect of low dose Tg or Tm in the single prep from a donor with T2D (B).
0.0
0.2
0.4
0.6
0.8
% B
rdU
(+) b
eta
cells
AAEY008
7 15
Veh
Tg Tm
15 15 15 15 15 15
20 200
500 10 100
1000
15 15
TUD
CA
PB
A
0.0
0.5
1.0
1.5
% B
rdU
(+) b
eta
cells
AAFS251-T2D
7 15
Veh
Tg Tm
15 15 15 15 15 15
20 200
500 10 100
1000
15 15
TUD
CA
PB
A
AAF2179
0.0
0.5
1.0
1.5
2.0
2.5
% B
rdU
(+) b
eta
cells
7 15
Veh
Tg Tm
15 15 15 15 15 15
20 200
500 10 100
1000
15 15
TUD
CA
PB
A
AAIB402Ate
st0
1
2
3
4
5
% B
rdU
(+) b
eta
cells
ABFV308
test0.0
0.2
0.4
0.6%
Brd
U(+
) bet
a ce
lls
ABGH054
test0
2
4
6
8
% B
rdU
(+) b
eta
cells
7 15
Veh
Tg Tm
15 15 15 15 15 15
20 200
500 10 100
1000
15 15
TUD
CA
PB
A
7 15
Veh
Tg Tm
15 15 15 15 15 15
20 200
500 10 100
1000
15 15
TUD
CA
PB
A
7 15
Veh
Tg Tm
15 15 15 15 15 15
20 200
500 10 100
1000
15 15
TUD
CA
PB
A
ABHV437
test0.0
0.2
0.4
0.6
% B
rdU
(+) b
eta
cells
ABJU206te
st0.0
0.5
1.0
1.5
% B
rdU
(+) b
eta
cells
ABJ3487
test0.0
0.5
1.0
1.5
% B
rdU
(+) b
eta
cells
7 15
Veh
Tg Tm
15 15 15 15 15 15
20 200
500 10 100
1000
15 15
TUD
CA
PB
A
7 15
Veh
Tg Tm
15 15 15 15 15 15
20 200
500 10 100
1000
15 15
TUD
CA
PB
A
7 15
Veh
Tg Tm
15 15 15 15 15 15
20 200
500 10 100
1000
15 15
TUD
CA
PB
A
ABKT045
0.0
0.5
1.0
1.5
2.0
2.5
% B
rdU
(+) b
eta
cells
ABKS484
test0
1
2
3
4
5
% B
rdU
(+) b
eta
cells
ABKS009
test0.0
0.5
1.0
1.5
% B
rdU
(+) b
eta
cells
7 15
Veh
Tg Tm
15 15 15 15 15 15
20 200
500 10 100
1000
15 15
TUD
CA
PB
A
7 15
Veh
Tg Tm
15 15 15 15 15 15
20 200
500 10 100
1000
15 15
TUD
CA
PB
A
7 15
Veh
Tg Tm
15 15 15 15 15 15
20 200
500 10 100
1000
15 15
TUD
CA
PB
A
A B C
D E F
G H I
J K L

Supplemental Figure 14
Actin
BiP
(glucose) 5
Veh
Veh
Tg20
Tm10
0
TUD
CA
PB
A
15 15 15 15 15
Actin
BiP
(glucose) 5
Veh
Veh
Veh
Tg20
Tm10
0
TUD
CA
7 15 15 15 15
Supplemental Figure 14. Low dose Thapsigargin (Tg) and tunicamycin (Tm) increase ER stress in human islets, and TUDCA and PBA reduce ER stress in human islets. (A-B) Dispersed human islet cells from two different donors were cultured with thapsigargin (Tg; 20nM), tunicamycin (Tm; 100 ng/ml), TUDCA (100 ng/ml) or PBA (250 nM) for 96 hours before lysing cells for western blot. Tg and Tm increased BiP abun-dance, and TUDCA and PBA reduced BiP abundance, relative to 15mM glucose vehicle control.
A B
Supplemental Figure 15
gam
ma-
H2A
X D
NA
Brd
U
A B C
D E F
7.5 mM, Vehicle 15 mM, Vehicle
15 mM, Tg 20 15 mM, Tm 100015 mM, Tm 10
15 mM, Mitomycin C
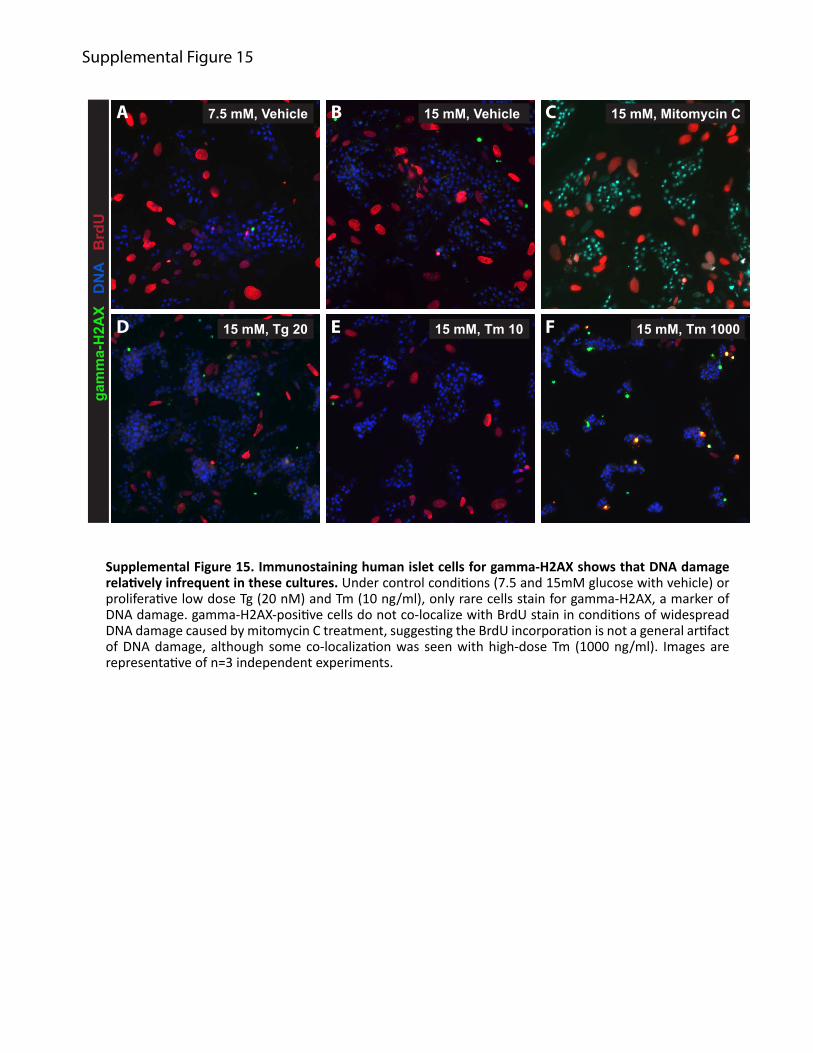
Supplemental Figure 15. Immunostaining human islet cells for gamma-H2AX shows that DNA damage relatively infrequent in these cultures. Under control conditions (7.5 and 15mM glucose with vehicle) or proliferative low dose Tg (20 nM) and Tm (10 ng/ml), only rare cells stain for gamma-H2AX, a marker of DNA damage. gamma-H2AX-positive cells do not co-localize with BrdU stain in conditions of widespread DNA damage caused by mitomycin C treatment, suggesting the BrdU incorporation is not a general artifact of DNA damage, although some co-localization was seen with high-dose Tm (1000 ng/ml). Images are representative of n=3 independent experiments.

Function category
Accession number Protein name Symbol
Number of
peptides
Protein score
Protein score
confidence interval (%)
Direction of
change
Translation gi|33859482 Eukaryotic translation elongation factor 2
EEF2 29 368 100 shift
Protein folding
gi|109730421 ERO1-‐like beta ERO1LB 18 234 100 down
gi|112293264 Protein disulfide isomerase associated 3 PDIA3 31 652 100 down
gi|31981679 Heat shock 60kDa protein 1 (chaperonin)
HSPD1 23 241 100 down
gi|6678413 Triosephosphate isomerase 1 TPI1 9 100 99.999 up
gi|549060 T-‐complex protein 1 subunit eta (TCP-‐1-‐eta) (CCT-‐eta) CCT7 20 324 100 down
gi|129729 Protein disulfide-‐isomerase precursor (PDI) PDI 17 207 100 up
gi|2506545 78 kDa glucose-‐regulated protein precursor (GRP78, BIP)
HSPA5 23 215 100 up
Protein degradation
gi|1698572 Proteasome activator PA28 beta subunit
PSME2 9 109 100 up
gi|6755198 Proteasome (prosome, macropain) subunit, alpha type 6
PSMA6 13 179 100 up
Secretory pathway
gi|1171774 N-‐ethylmaleimide sensitive fusion protein, isoform CRA_a
NSF 34 304 100 up
gi|19353445 Secretogranin III SCG3 12 71 99.13 up
gi|6680932 Chromogranin A CHGA 8 94 99.995 up
Metabolism
gi|29293809 ATP citrate lyase ACLY 32 237 100 up
gi|6680748 ATP synthase, H+ transporting, mitochondrial F1 complex, alpha subunit, isoform 1
ATP5A1 14 113 100 up
Nuclear transport gi|12846283 Ras-‐related nuclear protein RAN 11 119 100 up
Misc gi|6753060 Annexin A5 ANXA5 21 443 100 up Supplemental Table 1. Proteomics screen results. 8 mice underwent catheterization and four-day intravenous infusion with saline (n=4) or glucose (n=4). Immediately after infusion pancreatic islets were isolated, hand-picked, and frozen. Protein lysates within each infusion group were combined, labeled with Cy3 (saline) or Cy5 (glucose), mixed, and separated by 2D electrophoresis. Protein spots with different visual intensity between the fluorophores, implying regulation by in vivo hyperglycemia, were excised from the gel, trypsinized, and identified by mass spectrometry. Of 24 spots picked, 21 were positively identified with a high degree of confidence, 5 of which were duplicates (charge shift) of the same proteins, leaving 17 unique proteins, listed above.

Supplemental Table 2: Human islet characteristics
Unos IDPost
Culture Viability
Post Culture Purity
% beta cells Gender Age BMI Diabetes Ethnicity Cause of Death
AAEY008 80 90 89 F 55 39.9 No White StrokeAAFS251 95 95 64 M 49 23.9 Yes Asian StrokeAAF2179 93 83 41 M 65 37.4 No White StrokeAAIB402A 95 90 69 M 30 37 No Black AnoxiaABFV308 97 85 93 F 45 27.4 No White StrokeABGH054 95 85 73 M 25 33.8 No Hispanic Head TraumaABHV437 95 90 79 F 61 31 No Black StrokeABJU206 98 80 69 F 52 31.4 No White StrokeABJ3487 95 85 79 M 28 32.8 No White StrokeABKS009 94 90 60 M 15 23 No White Head traumaABKS484 98 70 79 M 63 38.6 No White AnoxiaABKT045 95 70 86 M 35 32 No Hispanic StrokeACCK183 93 80 84 F 39 22.8 No White Stroke
Donor characteristicsIslet characteristics
Supplemental Table 2: Characteristics of human islet preparations. All preps were received from the IIDP. Post culture viability and purity, gender, age, BMI, diabetes history, ethnicity, and cause of death are per IIDP report. The % beta cells refers to the percent of cells adherent in coverslip cultures that stained for insulin divided by the number of dapi-stained nuclei.

Supplemental Table 3: Experimental use of each human islet preparation
Unos ID
7.5 vs.15 mM gluc (Figure
9B)
Thapsigargin (Tg)
(Figure 9C)
Tunicamycin (Tm)
(Figure 9D)TUDCA, PBA (Figure 9E)
Atf6 inhibitor (Figure 9F)
Ad-Atf6 (Figure 9G)
gH2AX (Suppl.
Figure 13)AAEY008 x x xAAFS251 x x x xAAF2179 x x x xAAIB402A x x x x xABFV308 x x x xABGH054 x x x xABHV437 x x x xABJU206 x x x x x xABJ3487 x x x x x xABKS009 x x x xABKS484 x x x x xABKT045 x x x x xACCK183 x
Supplemental Table 3: Description of which human islet preparations were used for which experiment.
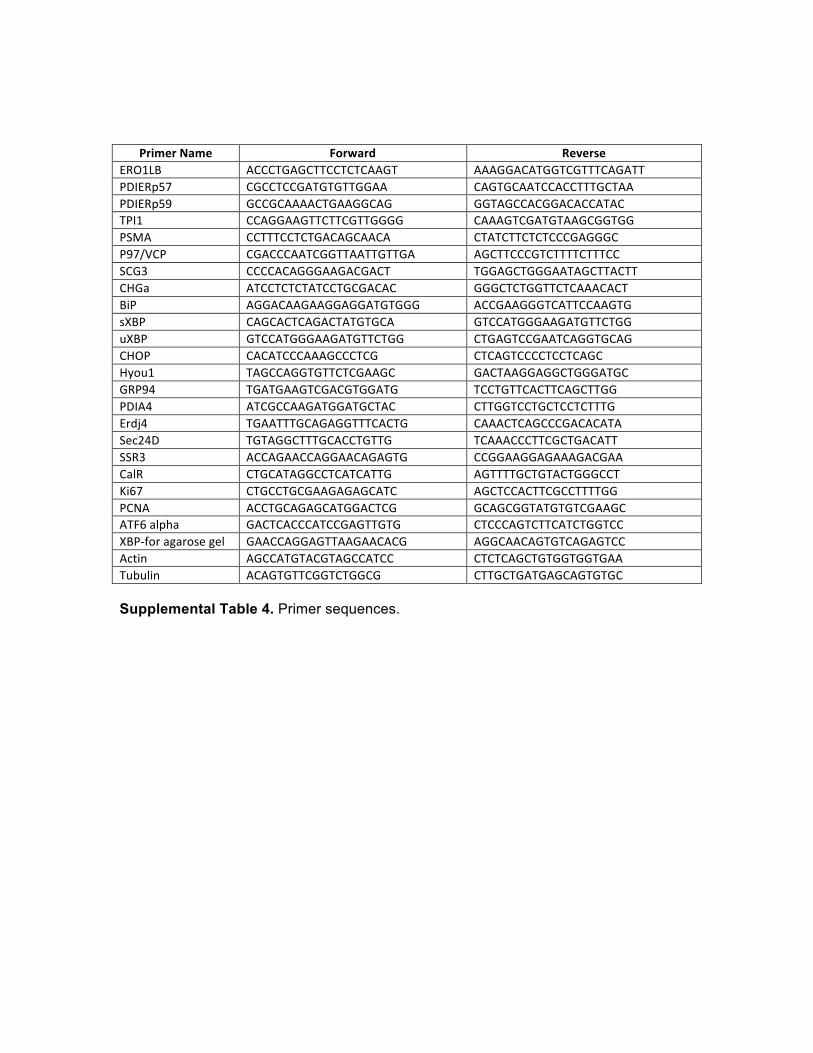
Primer Name Forward Reverse ERO1LB ACCCTGAGCTTCCTCTCAAGT AAAGGACATGGTCGTTTCAGATT PDIERp57 CGCCTCCGATGTGTTGGAA CAGTGCAATCCACCTTTGCTAA PDIERp59 GCCGCAAAACTGAAGGCAG GGTAGCCACGGACACCATAC TPI1 CCAGGAAGTTCTTCGTTGGGG CAAAGTCGATGTAAGCGGTGG PSMA CCTTTCCTCTGACAGCAACA CTATCTTCTCTCCCGAGGGC P97/VCP CGACCCAATCGGTTAATTGTTGA AGCTTCCCGTCTTTTCTTTCC SCG3 CCCCACAGGGAAGACGACT TGGAGCTGGGAATAGCTTACTT CHGa ATCCTCTCTATCCTGCGACAC GGGCTCTGGTTCTCAAACACT BiP AGGACAAGAAGGAGGATGTGGG ACCGAAGGGTCATTCCAAGTG sXBP CAGCACTCAGACTATGTGCA GTCCATGGGAAGATGTTCTGG uXBP GTCCATGGGAAGATGTTCTGG CTGAGTCCGAATCAGGTGCAG CHOP CACATCCCAAAGCCCTCG CTCAGTCCCCTCCTCAGC Hyou1 TAGCCAGGTGTTCTCGAAGC GACTAAGGAGGCTGGGATGC GRP94 TGATGAAGTCGACGTGGATG TCCTGTTCACTTCAGCTTGG PDIA4 ATCGCCAAGATGGATGCTAC CTTGGTCCTGCTCCTCTTTG Erdj4 TGAATTTGCAGAGGTTTCACTG CAAACTCAGCCCGACACATA Sec24D TGTAGGCTTTGCACCTGTTG TCAAACCCTTCGCTGACATT SSR3 ACCAGAACCAGGAACAGAGTG CCGGAAGGAGAAAGACGAA CalR CTGCATAGGCCTCATCATTG AGTTTTGCTGTACTGGGCCT Ki67 CTGCCTGCGAAGAGAGCATC AGCTCCACTTCGCCTTTTGG PCNA ACCTGCAGAGCATGGACTCG GCAGCGGTATGTGTCGAAGC ATF6 alpha GACTCACCCATCCGAGTTGTG CTCCCAGTCTTCATCTGGTCC XBP-‐for agarose gel GAACCAGGAGTTAAGAACACG AGGCAACAGTGTCAGAGTCC Actin AGCCATGTACGTAGCCATCC CTCTCAGCTGTGGTGGTGAA Tubulin ACAGTGTTCGGTCTGGCG CTTGCTGATGAGCAGTGTGC Supplemental Table 4. Primer sequences.