Embed Size (px)
Citation preview
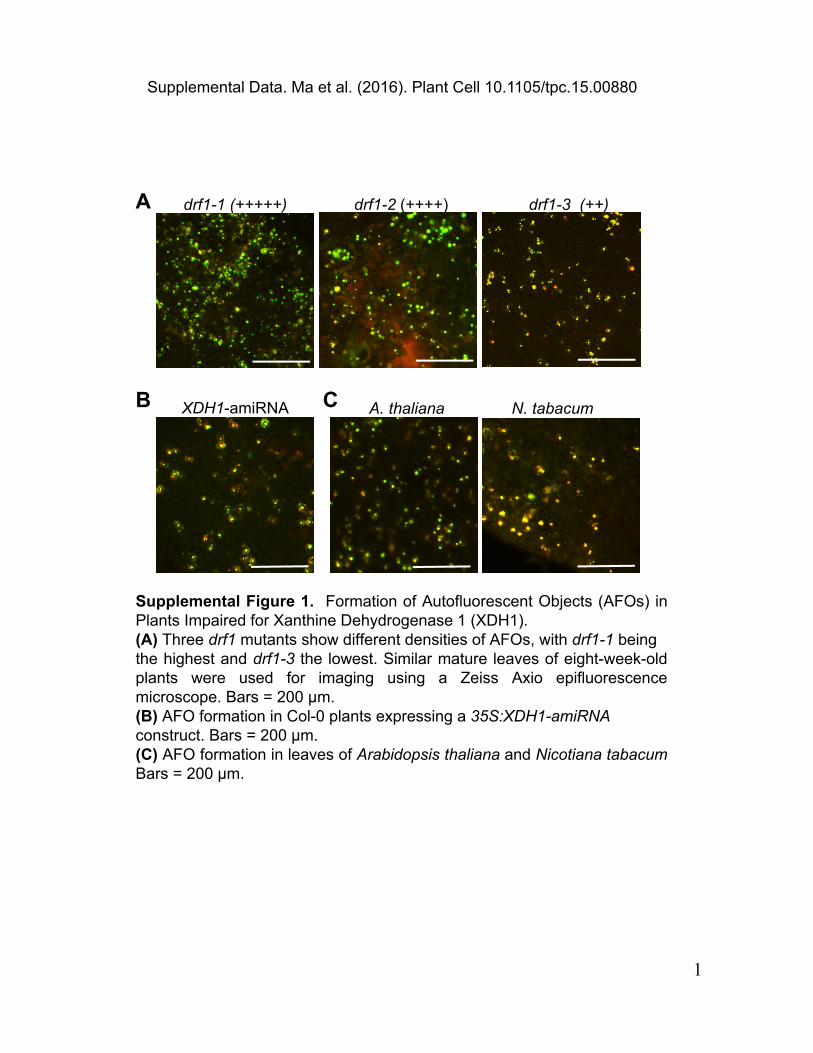
drf1-1 (+++++) drf1-2 (++++) drf1-3 (++)
A. thaliana N. tabacumXDH1-amiRNA
Supplemental Figure 1. Formation of Autofluorescent Objects (AFOs) in Plants Impaired for Xanthine Dehydrogenase 1 (XDH1).(A) Three drf1 mutants show different densities of AFOs, with drf1-1 being the highest and drf1-3 the lowest. Similar mature leaves of eight-week-old plants were used for imaging using a Zeiss Axio epifluorescence microscope. Bars = 200 μm.(B) AFO formation in Col-0 plants expressing a 35S:XDH1-amiRNA construct. Bars = 200 μm.(C) AFO formation in leaves of Arabidopsis thaliana and Nicotiana tabacum Bars = 200 μm.
A
B C
Supplemental Data. Ma et al. (2016). Plant Cell 10.1105/tpc.15.00880
1
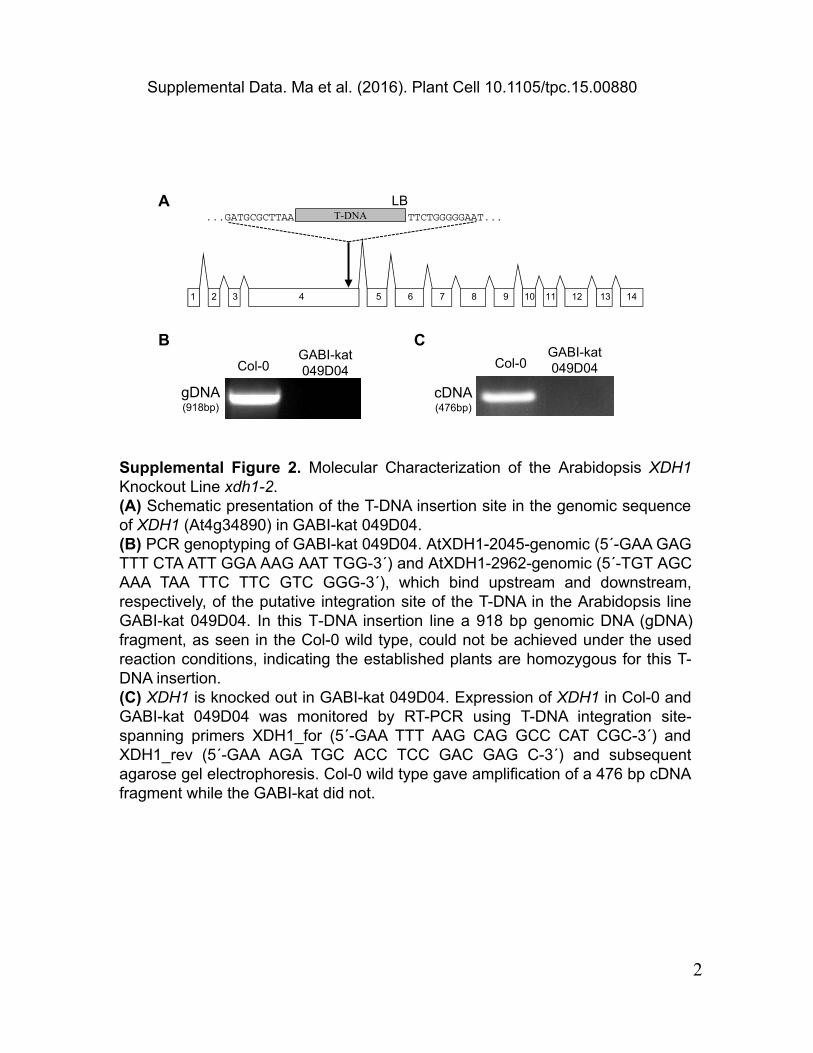
Supplemental Figure 2. Molecular Characterization of the Arabidopsis XDH1 Knockout Line xdh1-2.(A) Schematic presentation of the T-DNA insertion site in the genomic sequence of XDH1 (At4g34890) in GABI-kat 049D04.(B) PCR genoptyping of GABI-kat 049D04. AtXDH1-2045-genomic (5´-GAA GAG TTT CTA ATT GGA AAG AAT TGG-3´) and AtXDH1-2962-genomic (5´-TGT AGC AAA TAA TTC TTC GTC GGG-3´), which bind upstream and downstream, respectively, of the putative integration site of the T-DNA in the Arabidopsis line GABI-kat 049D04. In this T-DNA insertion line a 918 bp genomic DNA (gDNA) fragment, as seen in the Col-0 wild type, could not be achieved under the used reaction conditions, indicating the established plants are homozygous for this T-DNA insertion.(C) XDH1 is knocked out in GABI-kat 049D04. Expression of XDH1 in Col-0 and GABI-kat 049D04 was monitored by RT-PCR using T-DNA integration site-spanning primers XDH1_for (5´-GAA TTT AAG CAG GCC CAT CGC-3´) and XDH1_rev (5´-GAA AGA TGC ACC TCC GAC GAG C-3´) and subsequent agarose gel electrophoresis. Col-0 wild type gave amplification of a 476 bp cDNA fragment while the GABI-kat did not.
A
B C
Col-0GABI-kat 049D04
Col-0GABI-kat 049D04
1 2 3 4 5 6 7 8 9 10 11 12 13 14
...GATGCGCTTAA..... ....TTCTGGGGGAAT...T-DNALB
gDNA(918bp)
cDNA(476bp)
Supplemental Data. Ma et al. (2016). Plant Cell 10.1105/tpc.15.00880
2
Time [mm:ss]
0.0
0.1
0.2
0.3
0.4
0.5
0.6
0.7
0.8
00:00 00:30 01:00 01:30 02:00 02:30
Act
ivit
y[c
han
ge in
abs
orba
nce
at 2
95 n
m] WT
G48DR941QT1061IWT+Allopurinol
03:00
0.000
0.005
0.010
0.015
0.020
0.025
0.030
0.035
0.040
0:00:00 0:00:30 0:01:00 0:01:30 0:02:00 0:02:30 0:03:00
Ac
tivi
ty[c
ha
nge
in a
bso
rba
nce
at
29
5 n
m]
Time [mm:ss]
WTG48DR941QT1061IWT+Allopurinol
A
B
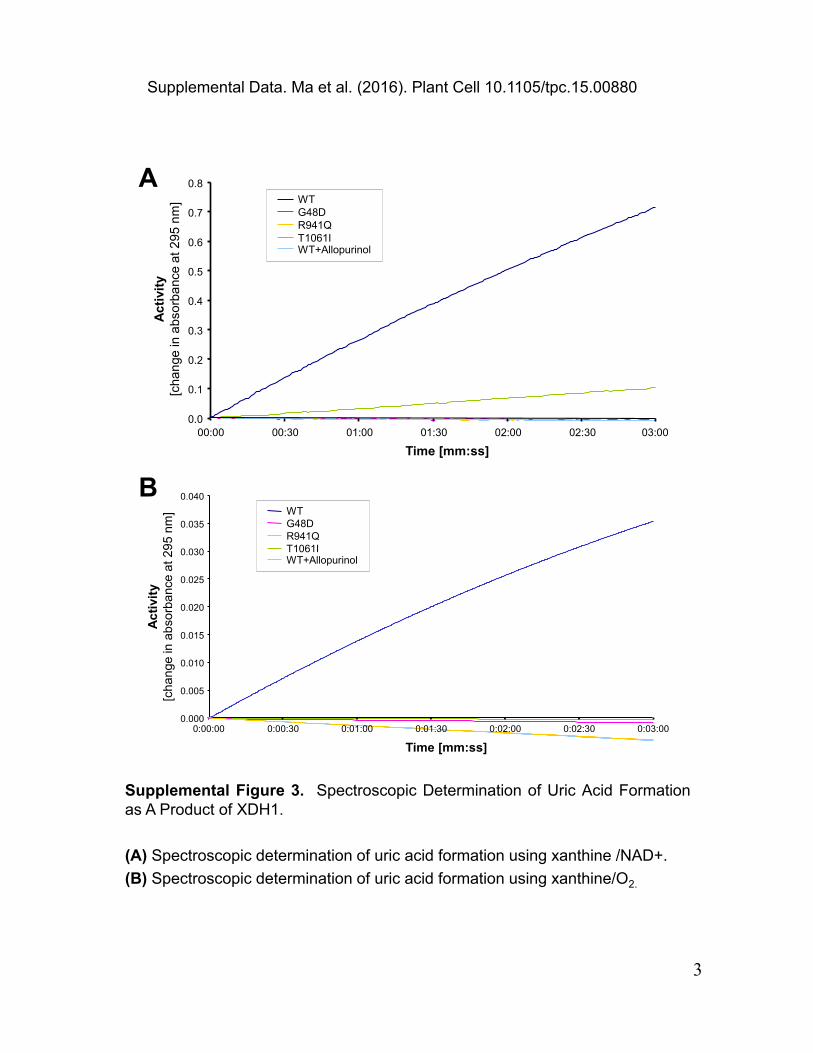
Supplemental Figure 3. Spectroscopic Determination of Uric Acid Formationas A Product of XDH1.
(A) Spectroscopic determination of uric acid formation using xanthine /NAD+.
(B) Spectroscopic determination of uric acid formation using xanthine/O2.
Supplemental Data. Ma et al. (2016). Plant Cell 10.1105/tpc.15.00880
3
pH 6.0 pH8.0
pH6.8 pH8.0
B
A
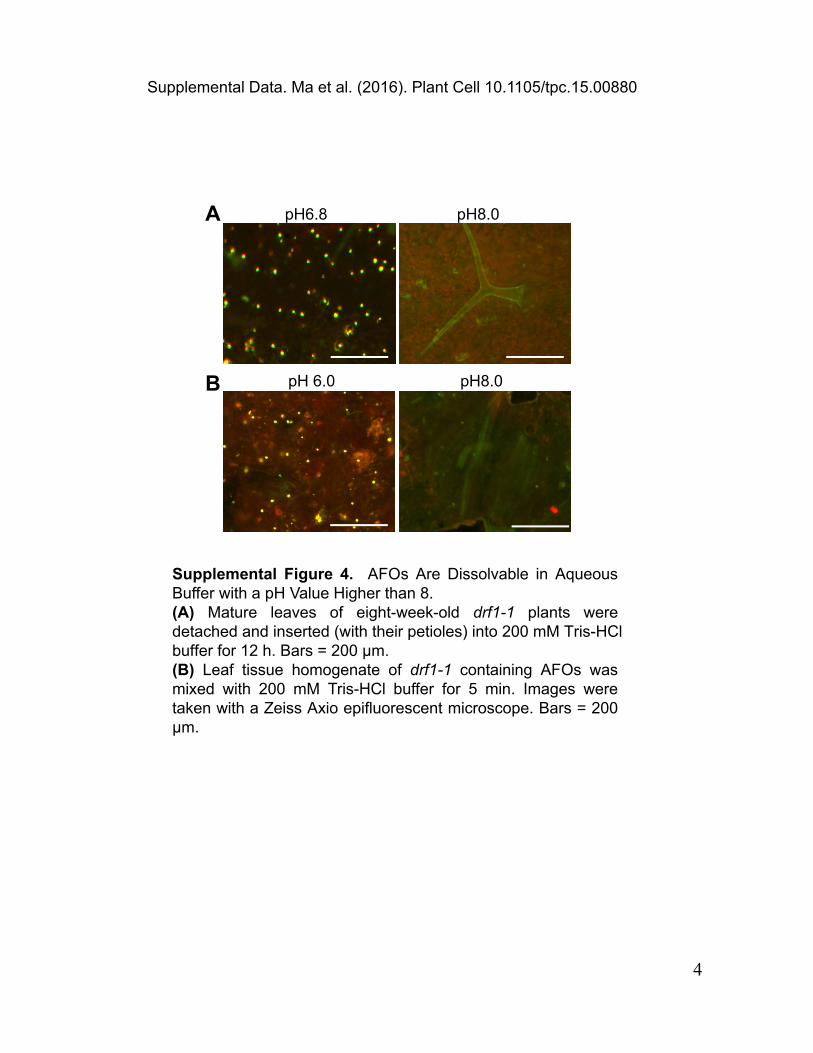
Supplemental Figure 4. AFOs Are Dissolvable in Aqueous Buffer with a pH Value Higher than 8.(A) Mature leaves of eight-week-old drf1-1 plants were detached and inserted (with their petioles) into 200 mM Tris-HCl buffer for 12 h. Bars = 200 μm.(B) Leaf tissue homogenate of drf1-1 containing AFOs was mixed with 200 mM Tris-HCl buffer for 5 min. Images were taken with a Zeiss Axio epifluorescent microscope. Bars = 200 μm.
Supplemental Data. Ma et al. (2016). Plant Cell 10.1105/tpc.15.00880
4
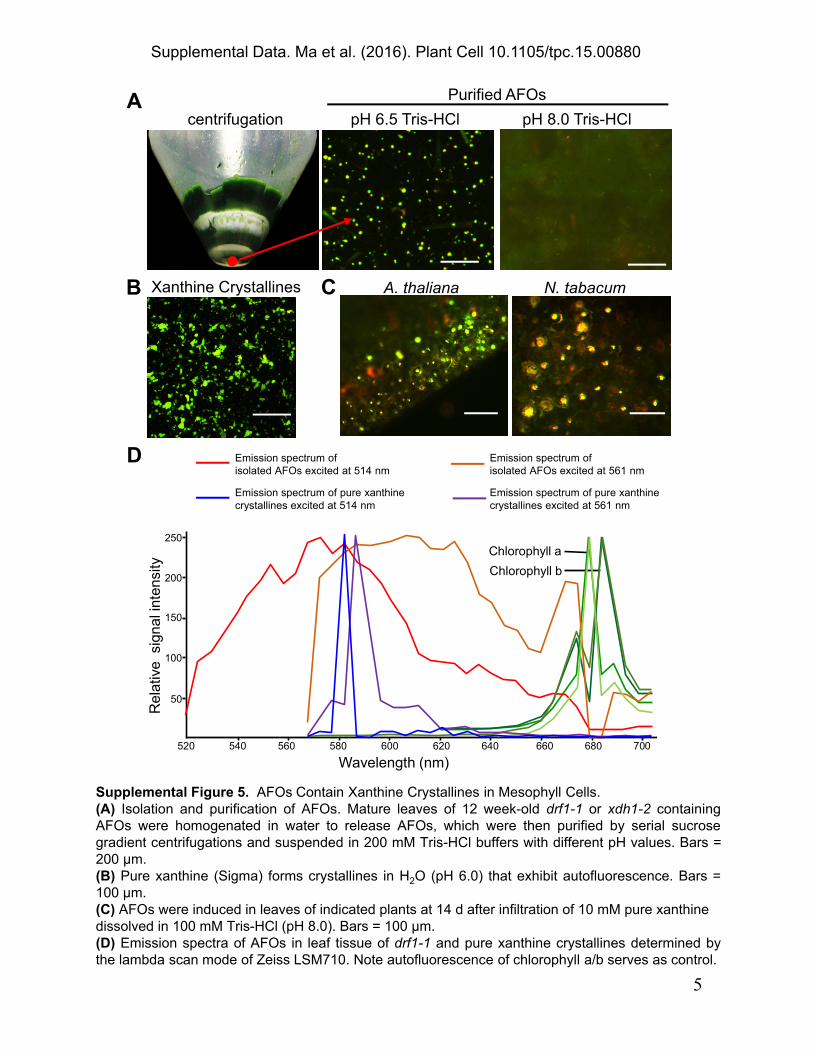
Supplemental Figure 5. AFOs Contain Xanthine Crystallines in Mesophyll Cells.(A) Isolation and purification of AFOs. Mature leaves of 12 week-old drf1-1 or xdh1-2 containing AFOs were homogenated in water to release AFOs, which were then purified by serial sucrose gradient centrifugations and suspended in 200 mM Tris-HCl buffers with different pH values. Bars = 200 μm.(B) Pure xanthine (Sigma) forms crystallines in H2O (pH 6.0) that exhibit autofluorescence. Bars = 100 μm.(C) AFOs were induced in leaves of indicated plants at 14 d after infiltration of 10 mM pure xanthine dissolved in 100 mM Tris-HCl (pH 8.0). Bars = 100 μm.(D) Emission spectra of AFOs in leaf tissue of drf1-1 and pure xanthine crystallines determined by the lambda scan mode of Zeiss LSM710. Note autofluorescence of chlorophyll a/b serves as control.
A
B
centrifugation pH 6.5 Tris-HCl pH 8.0 Tris-HCl
Xanthine Crystallines at pH6.0
A. thaliana N. tabacum
D
Emission spectrum of pure xanthine crystallines excited at 514 nm
100umEmission spectrum ofisolated AFOs excited at 514 nm
Emission spectrum of isolated AFOs excited at 561 nm
Emission spectrum of pure xanthine crystallines excited at 561 nm
C
Purified AFOs
520 540 560 580 600 620 640 660 680 700
50
250
200
150
100
Chlorophyll b
Chlorophyll a
Rel
ativ
e s
igna
l int
ensi
ty
Wavelength (nm)
Supplemental Data. Ma et al. (2016). Plant Cell 10.1105/tpc.15.00880
5
B
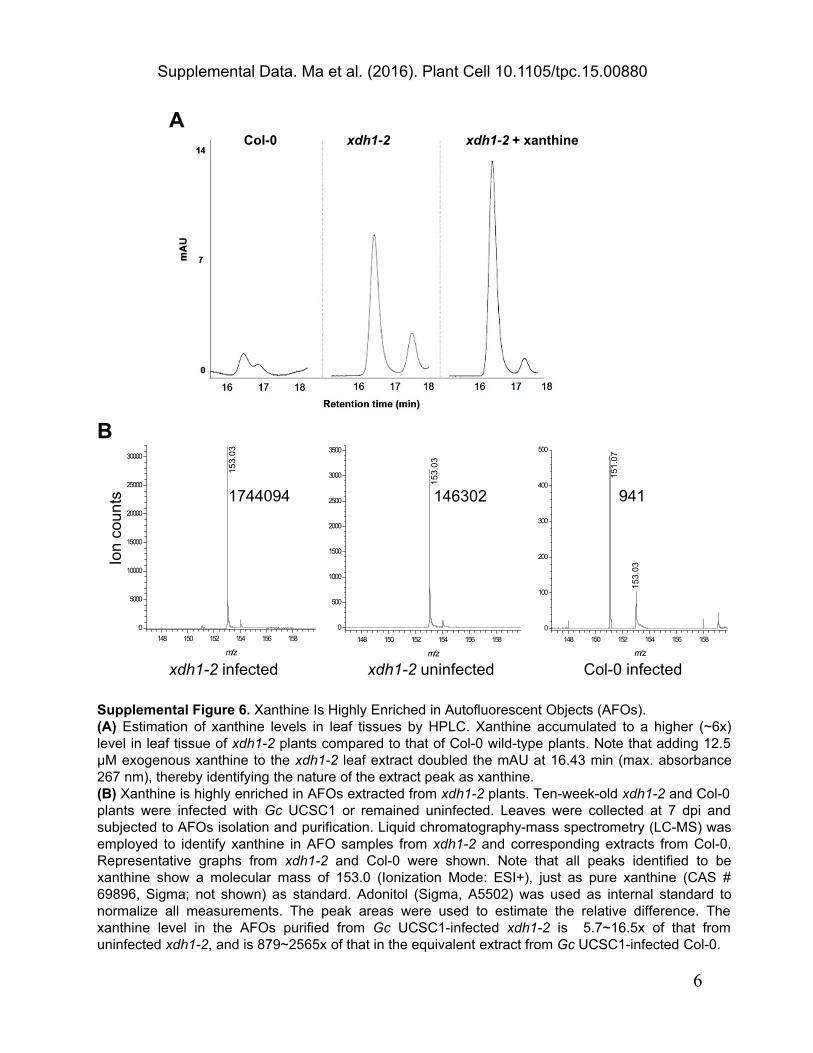
Supplemental Figure 6. Xanthine Is Highly Enriched in Autofluorescent Objects (AFOs).(A) Estimation of xanthine levels in leaf tissues by HPLC. Xanthine accumulated to a higher (~6x) level in leaf tissue of xdh1-2 plants compared to that of Col-0 wild-type plants. Note that adding 12.5 µM exogenous xanthine to the xdh1-2 leaf extract doubled the mAU at 16.43 min (max. absorbance 267 nm), thereby identifying the nature of the extract peak as xanthine.(B) Xanthine is highly enriched in AFOs extracted from xdh1-2 plants. Ten-week-old xdh1-2 and Col-0 plants were infected with Gc UCSC1 or remained uninfected. Leaves were collected at 7 dpi and subjected to AFOs isolation and purification. Liquid chromatography-mass spectrometry (LC-MS) was employed to identify xanthine in AFO samples from xdh1-2 and corresponding extracts from Col-0. Representative graphs from xdh1-2 and Col-0 were shown. Note that all peaks identified to be xanthine show a molecular mass of 153.0 (Ionization Mode: ESI+), just as pure xanthine (CAS # 69896, Sigma; not shown) as standard. Adonitol (Sigma, A5502) was used as internal standard to normalize all measurements. The peak areas were used to estimate the relative difference. The xanthine level in the AFOs purified from Gc UCSC1-infected xdh1-2 is 5.7~16.5x of that from uninfected xdh1-2, and is 879~2565x of that in the equivalent extract from Gc UCSC1-infected Col-0.
148 150 152 154 156 158
0
5000
10000
15000
20000
25000
30000
15
3.0
3
m/z
148 150 152 154 156 158
0
500
1000
1500
2000
2500
3000
3500
153.
03
m/z
1463021744094
148 150 152 154 156 158
0
100
200
300
400
500
15
1.0
7
15
3.0
3
m/z
941
ACol-0 xdh1-2 xdh1-2 + xanthine
xdh1-2 infected xdh1-2 uninfected Col-0 infected
Ion
coun
ts
Supplemental Data. Ma et al. (2016). Plant Cell 10.1105/tpc.15.00880
6
C
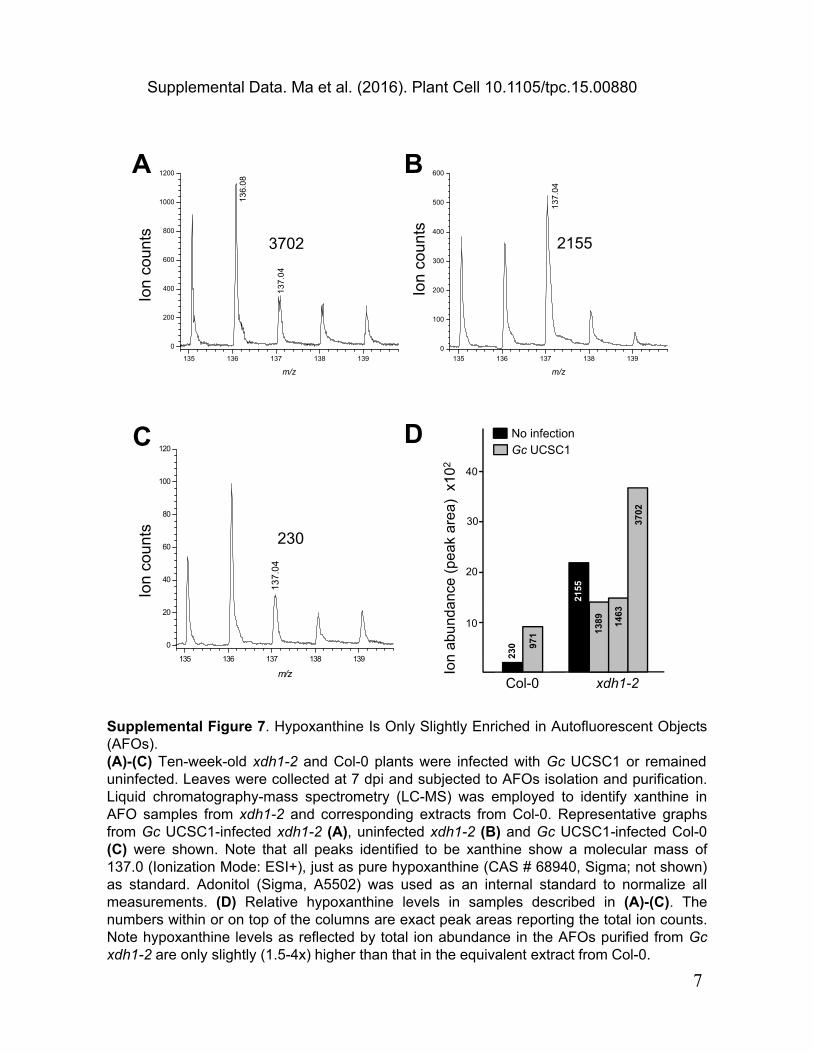
Supplemental Figure 7. Hypoxanthine Is Only Slightly Enriched in Autofluorescent Objects (AFOs).(A)-(C) Ten-week-old xdh1-2 and Col-0 plants were infected with Gc UCSC1 or remained uninfected. Leaves were collected at 7 dpi and subjected to AFOs isolation and purification. Liquid chromatography-mass spectrometry (LC-MS) was employed to identify xanthine in AFO samples from xdh1-2 and corresponding extracts from Col-0. Representative graphs from Gc UCSC1-infected xdh1-2 (A), uninfected xdh1-2 (B) and Gc UCSC1-infected Col-0 (C) were shown. Note that all peaks identified to be xanthine show a molecular mass of 137.0 (Ionization Mode: ESI+), just as pure hypoxanthine (CAS # 68940, Sigma; not shown) as standard. Adonitol (Sigma, A5502) was used as an internal standard to normalize all measurements. (D) Relative hypoxanthine levels in samples described in (A)-(C). The numbers within or on top of the columns are exact peak areas reporting the total ion counts. Note hypoxanthine levels as reflected by total ion abundance in the AFOs purified from Gc xdh1-2 are only slightly (1.5-4x) higher than that in the equivalent extract from Col-0.
Ion
abun
danc
e (p
eak
area
) x
102
No infectionGc UCSC1
Col-0 xdh1-2
10
40
30
20
1389
3702
1463
**
2155
971
230
135 136 137 138 139
0
20
40
60
80
100
120
13
7.0
4
m/z
230
135 136 137 138 139
0
100
200
300
400
500
600
137
.04
m/z
135 136 137 138 139
0
200
400
600
800
1000
1200
136.
08
137
.04
m/z
21553702
A
D
BIo
n co
unts
Ion
coun
ts
Ion
coun
ts
Supplemental Data. Ma et al. (2016). Plant Cell 10.1105/tpc.15.00880
7
0 μm
13.2 μm9.9 μm
6.6 μm3.3 μm
16.8 μm
H
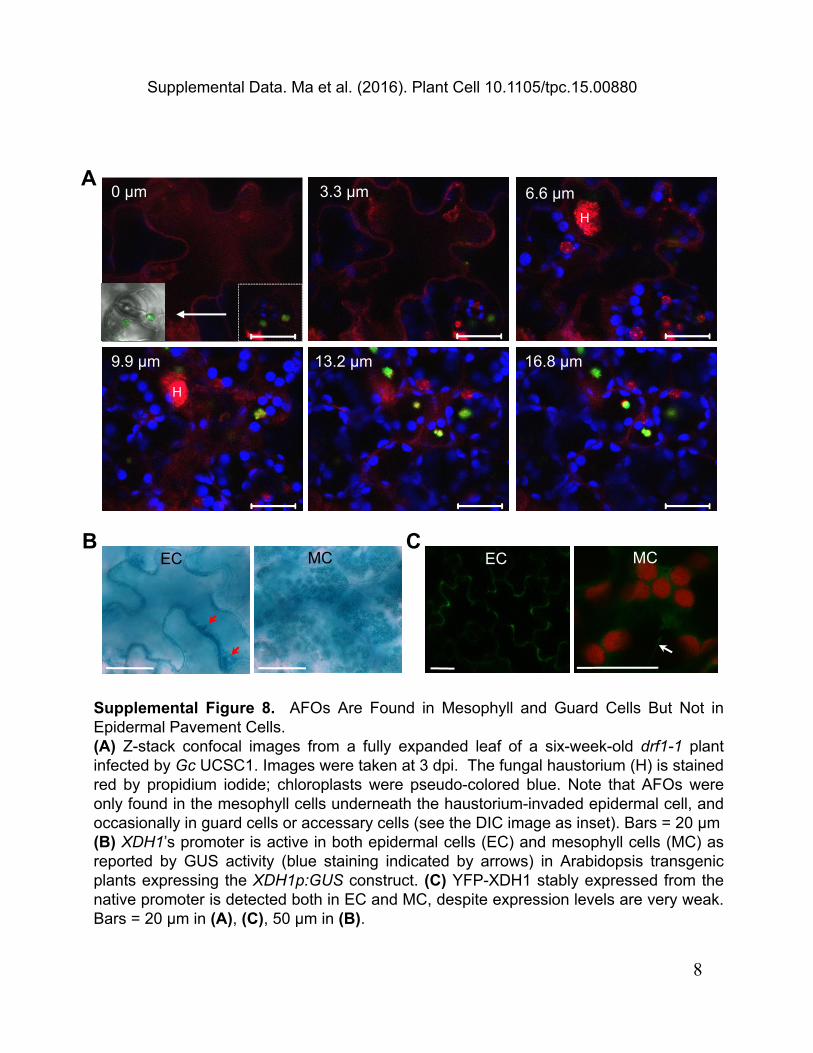
Supplemental Figure 8. AFOs Are Found in Mesophyll and Guard Cells But Not inEpidermal Pavement Cells.(A) Z-stack confocal images from a fully expanded leaf of a six-week-old drf1-1 plantinfected by Gc UCSC1. Images were taken at 3 dpi. The fungal haustorium (H) is stainedred by propidium iodide; chloroplasts were pseudo-colored blue. Note that AFOs wereonly found in the mesophyll cells underneath the haustorium-invaded epidermal cell, andoccasionally in guard cells or accessary cells (see the DIC image as inset). Bars = 20 μm(B) XDH1’s promoter is active in both epidermal cells (EC) and mesophyll cells (MC) asreported by GUS activity (blue staining indicated by arrows) in Arabidopsis transgenicplants expressing the XDH1p:GUS construct. (C) YFP-XDH1 stably expressed from thenative promoter is detected both in EC and MC, despite expression levels are very weak.Bars = 20 μm in (A), (C), 50 μm in (B).
A
B C
H
EC ECMC MC
Supplemental Data. Ma et al. (2016). Plant Cell 10.1105/tpc.15.00880
8
A 6 week 8 week 12 week
B 8 week 10 week 14 week
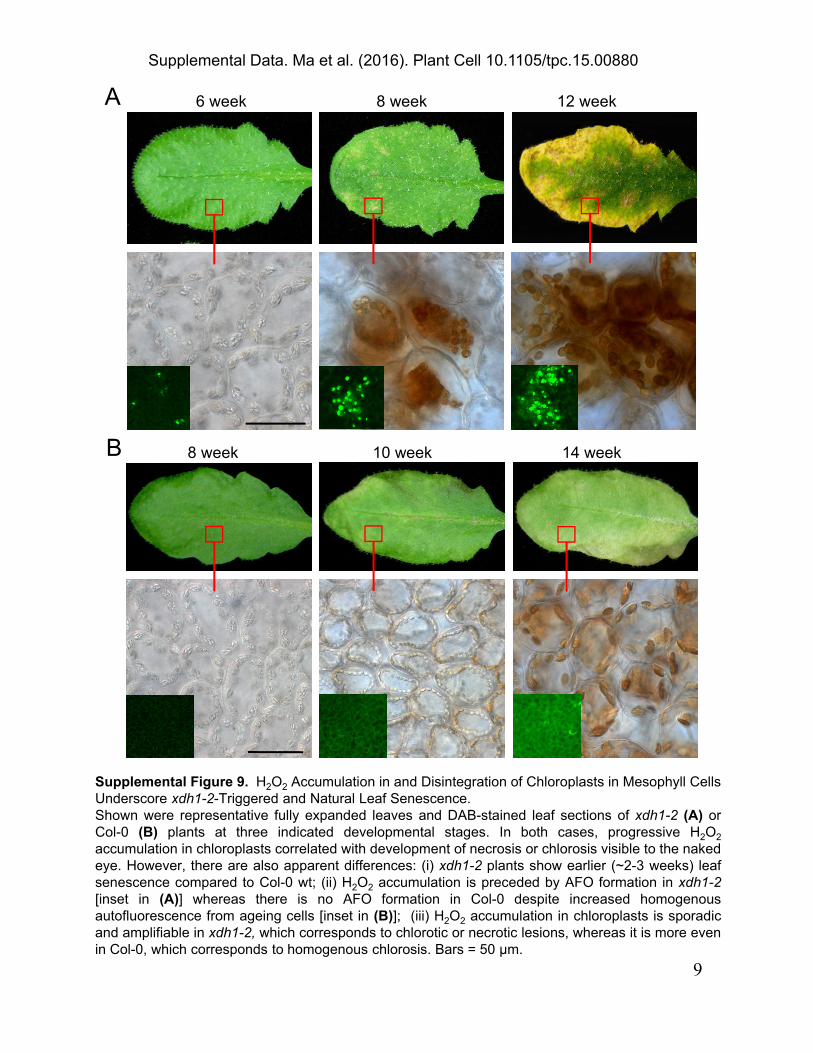
Supplemental Figure 9. H2O2 Accumulation in and Disintegration of Chloroplasts in Mesophyll CellsUnderscore xdh1-2-Triggered and Natural Leaf Senescence.Shown were representative fully expanded leaves and DAB-stained leaf sections of xdh1-2 (A) orCol-0 (B) plants at three indicated developmental stages. In both cases, progressive H2O2
accumulation in chloroplasts correlated with development of necrosis or chlorosis visible to the nakedeye. However, there are also apparent differences: (i) xdh1-2 plants show earlier (~2-3 weeks) leafsenescence compared to Col-0 wt; (ii) H2O2 accumulation is preceded by AFO formation in xdh1-2[inset in (A)] whereas there is no AFO formation in Col-0 despite increased homogenousautofluorescence from ageing cells [inset in (B)]; (iii) H2O2 accumulation in chloroplasts is sporadicand amplifiable in xdh1-2, which corresponds to chlorotic or necrotic lesions, whereas it is more evenin Col-0, which corresponds to homogenous chlorosis. Bars = 50 μm.
Supplemental Data. Ma et al. (2016). Plant Cell 10.1105/tpc.15.00880
9
3 dpi
7 dpi
12 dpi
488 nm 488 nm + DIC
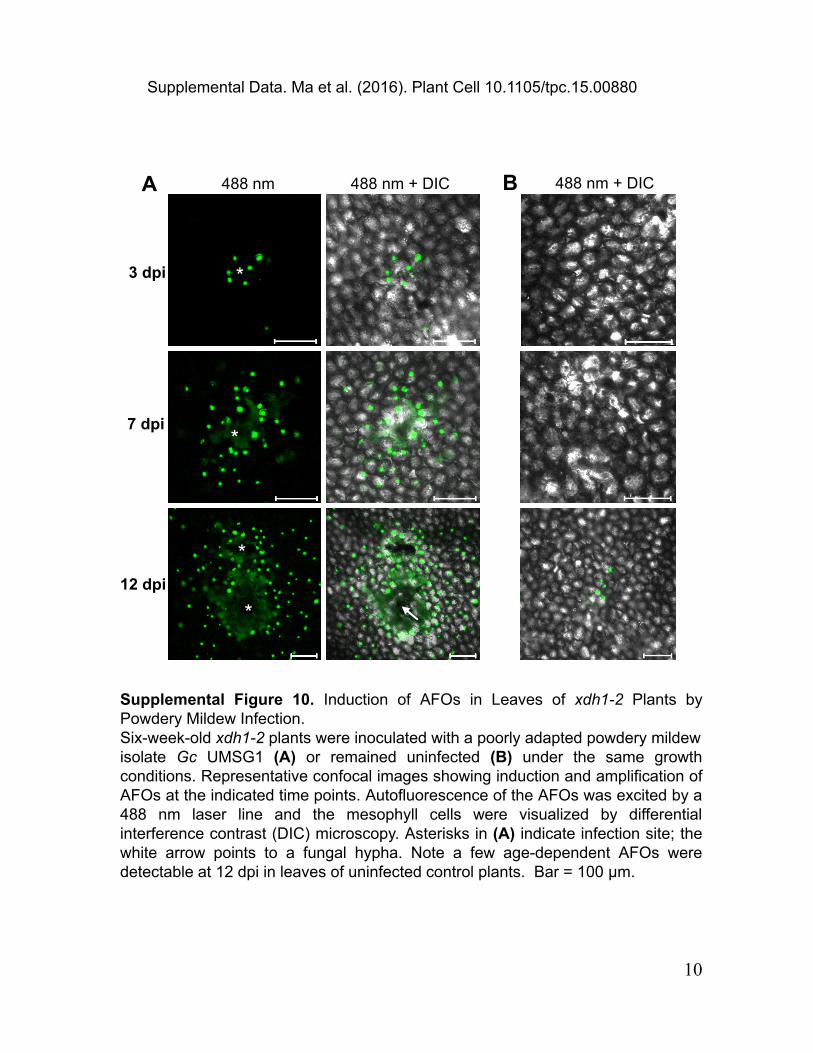
Supplemental Figure 10. Induction of AFOs in Leaves of xdh1-2 Plants by Powdery Mildew Infection.Six-week-old xdh1-2 plants were inoculated with a poorly adapted powdery mildew isolate Gc UMSG1 (A) or remained uninfected (B) under the same growth conditions. Representative confocal images showing induction and amplification of AFOs at the indicated time points. Autofluorescence of the AFOs was excited by a 488 nm laser line and the mesophyll cells were visualized by differential interference contrast (DIC) microscopy. Asterisks in (A) indicate infection site; the white arrow points to a fungal hypha. Note a few age-dependent AFOs were detectable at 12 dpi in leaves of uninfected control plants. Bar = 100 μm.
*
*
*
*
488 nm + DICA B
Supplemental Data. Ma et al. (2016). Plant Cell 10.1105/tpc.15.00880
10
Col-gl S6 (RPW8.1+RPW8.2)A
B
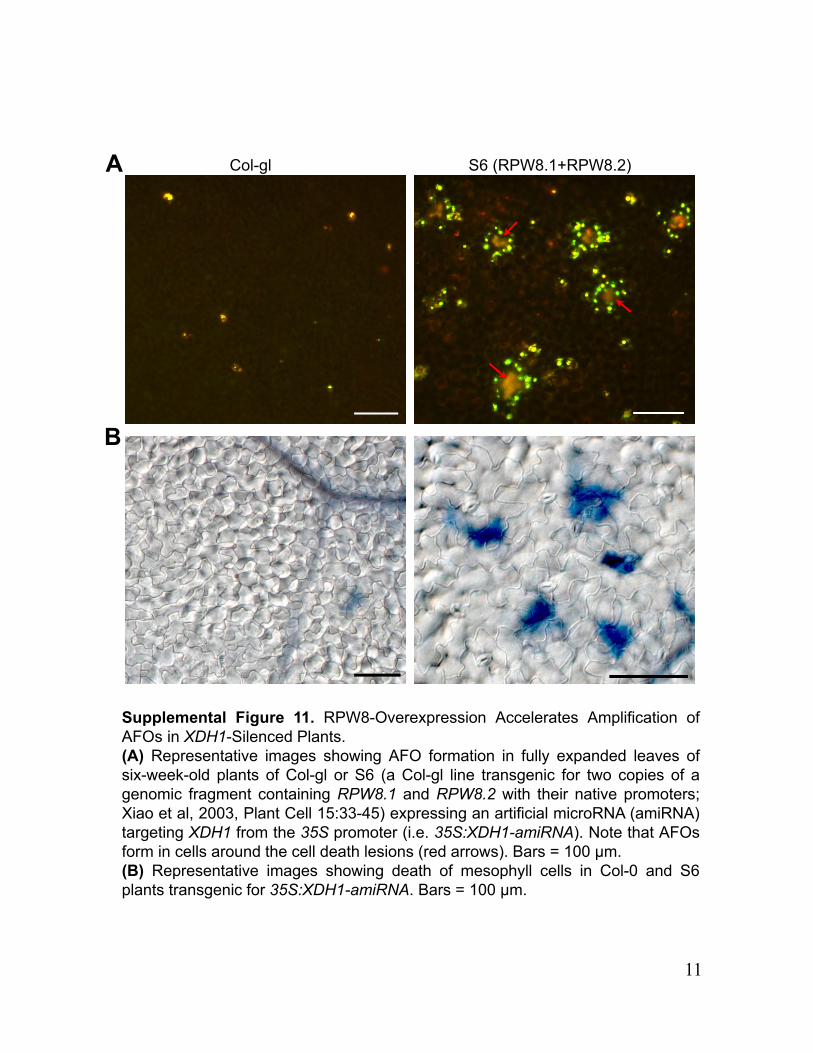
Supplemental Figure 11. RPW8-Overexpression Accelerates Amplification ofAFOs in XDH1-Silenced Plants.(A) Representative images showing AFO formation in fully expanded leaves ofsix-week-old plants of Col-gl or S6 (a Col-gl line transgenic for two copies of agenomic fragment containing RPW8.1 and RPW8.2 with their native promoters;Xiao et al, 2003, Plant Cell 15:33-45) expressing an artificial microRNA (amiRNA)targeting XDH1 from the 35S promoter (i.e. 35S:XDH1-amiRNA). Note that AFOsform in cells around the cell death lesions (red arrows). Bars = 100 μm.(B) Representative images showing death of mesophyll cells in Col-0 and S6plants transgenic for 35S:XDH1-amiRNA. Bars = 100 μm.
11
1
3
4
5R
elat
ive
mR
NA
leve
ls
2
00 1 2 3 5 7 dpi
Col-0
0.2
0.6
0.8
1.0
Rel
ativ
e m
RN
A le
vels
0.4
00 1 2 3 5 7 dpi
xdh1-3 Col-0A B
TTAGTGTTTGAGCTTTAAACTTTAATAGAGGGGAGAAAGATGGATCAATCCATTTTGTCAAAGTCATATATGTAAGTTACTTCCAGTCTCCAAATACATGATGTAACATGATACATGTTTCTTCAAAGCAGCAACTTTGTTGACTAAATGCGCGCGCCATCGAGATAAAATATCAGATTTTTTTTTTCTGAACAACCTCTAACTTCAAGTGAGCAAAGAATGTGAAGCAGTTATGCTGAGCAATGCAAGACGCTTATCATCATCATATATCAAAACCAAAAATAAAACAAACAATATCATCAAAATTTCTTTTAAAGTAAATCTTAAGACAAGACAATAACACACTAGTCATAACTAATCAGACTACAATTTATAAACGAAACATAATCAGCAAAATTCAGTTAAACAAATATATAAGTGGCATTGTAAAAACATCATATAGGCTTCAATTGTTTTACTTTGTTCAAACTTAAATTTCGTTCTTTCTATTTTGGGTTCTTTACAAAAAAAAAAAAAAAAAAAAAAAAATTGACTGCACAAGTGATGATGATGAAGATGCGTATTCATTCGGTGGATGCTATCGGAAAGGAACACGAATTTTATTATTAAAAAAGGAAAATGTTATTCCTTTTTTGCTTCTCTTGACTTGGCGTAATCAACTTCGCCATCTTCGTTTTTGTTTCGATCCCAATCGAGTTTTCTCTCAATTTGAGAAATGGGTTCACTGAAAAAGGACGGCGAGATCGGAGATGAGTTTACGGAGGCGTTACTGTACGTTAACGGCGTTCGTAGAGTCTTGCCTGATGGATTGGCTCATATGACACT
E
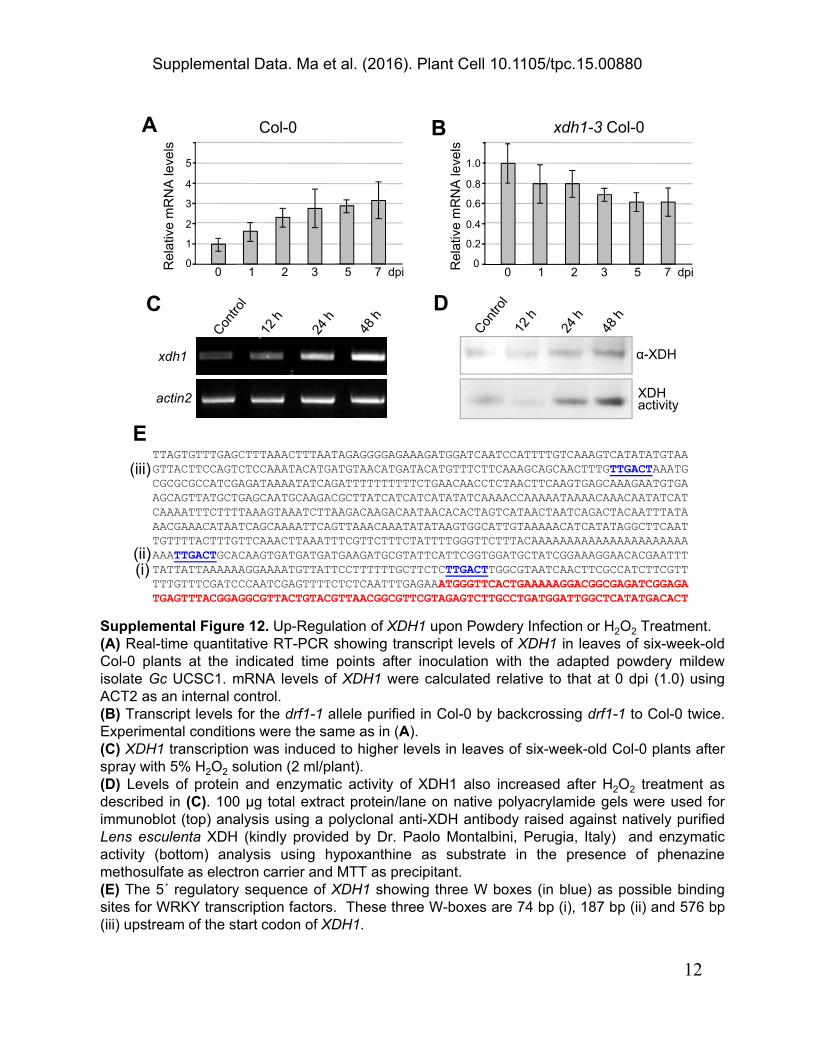
Supplemental Figure 12. Up-Regulation of XDH1 upon Powdery Infection or H2O2 Treatment.(A) Real-time quantitative RT-PCR showing transcript levels of XDH1 in leaves of six-week-oldCol-0 plants at the indicated time points after inoculation with the adapted powdery mildewisolate Gc UCSC1. mRNA levels of XDH1 were calculated relative to that at 0 dpi (1.0) usingACT2 as an internal control.(B) Transcript levels for the drf1-1 allele purified in Col-0 by backcrossing drf1-1 to Col-0 twice.Experimental conditions were the same as in (A).(C) XDH1 transcription was induced to higher levels in leaves of six-week-old Col-0 plants afterspray with 5% H2O2 solution (2 ml/plant).(D) Levels of protein and enzymatic activity of XDH1 also increased after H2O2 treatment asdescribed in (C). 100 µg total extract protein/lane on native polyacrylamide gels were used forimmunoblot (top) analysis using a polyclonal anti-XDH antibody raised against natively purifiedLens esculenta XDH (kindly provided by Dr. Paolo Montalbini, Perugia, Italy) and enzymaticactivity (bottom) analysis using hypoxanthine as substrate in the presence of phenazinemethosulfate as electron carrier and MTT as precipitant.(E) The 5´ regulatory sequence of XDH1 showing three W boxes (in blue) as possible bindingsites for WRKY transcription factors. These three W-boxes are 74 bp (i), 187 bp (ii) and 576 bp(iii) upstream of the start codon of XDH1.
(i)
(iii)
(ii)
xdh1
actin2
α-XDH
XDH activity
C D
Supplemental Data. Ma et al. (2016). Plant Cell 10.1105/tpc.15.00880
12

S5
S5 xdh1-2
Col-0
xdh1-2
A
B
young old
Supplemental Figure 13. Accelerated Leaf Senescence of xdh1-2 Plants uponActivation of RPW8-Mediated or Basal Defenses.(A) Nine representative leaves from seven-week-old plants of the indicatedgenotypes infected with Gc UCSC1 at 10 dpi. S5 is a Col-gl line transgenic for asinge copy genomic fragment containing RPW8.1 and RPW8.2 with their nativepromotors (Xiao et al., 2003, Plant Cell 15:33-45). The xdh1-2 knockout allele wasintroduced into S5 by genetic crossing. Note that leaves of S5/xdh1-2 showedslightly more fungal mycelia and apparently more chlorosis/necrosis.(B) Nine representative leaves from plants of Col-0 or xdh1-2 with the sametreatment as plants in (A). Note that fully expanded leaves of xdh1-2 supportedslightly more fungal mycelia compared to those of Col-0 and that old leaves fromxdh1-2 but not from Col-0 displayed mildew-induced chlorosis.
Supplemental Data. Ma et al. (2016). Plant Cell 10.1105/tpc.15.00880
13
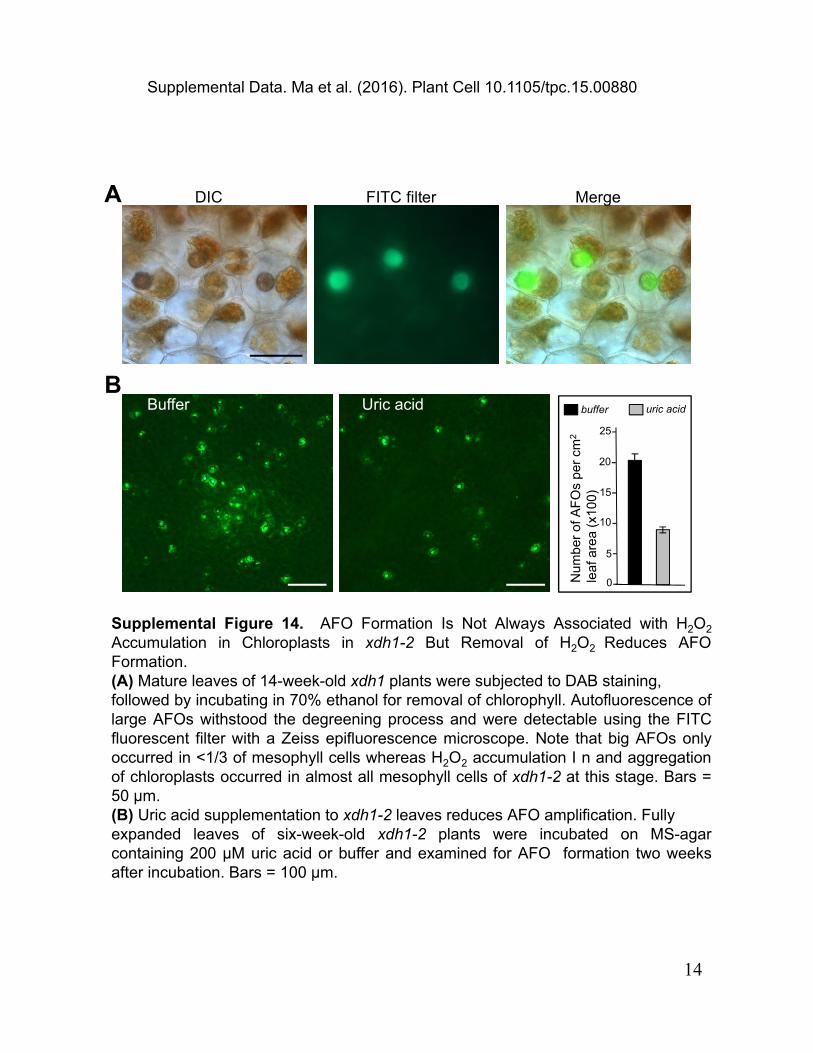
Supplemental Figure 14. AFO Formation Is Not Always Associated with H2O2 Accumulation in Chloroplasts in xdh1-2 But Removal of H2O2 Reduces AFO Formation.(A) Mature leaves of 14-week-old xdh1 plants were subjected to DAB staining, followed by incubating in 70% ethanol for removal of chlorophyll. Autofluorescence of large AFOs withstood the degreening process and were detectable using the FITC fluorescent filter with a Zeiss epifluorescence microscope. Note that big AFOs only occurred in <1/3 of mesophyll cells whereas H2O2 accumulation I n and aggregation of chloroplasts occurred in almost all mesophyll cells of xdh1-2 at this stage. Bars = 50 μm.(B) Uric acid supplementation to xdh1-2 leaves reduces AFO amplification. Fully expanded leaves of six-week-old xdh1-2 plants were incubated on MS-agar containing 200 μM uric acid or buffer and examined for AFO formation two weeks after incubation. Bars = 100 μm.
DIC FITC filter Merge A
B
Num
ber
of A
FO
s pe
r cm
2
leaf
are
a (x
100)
0
20
15
10
5
25
uric acidbufferBuffer Uric acid
Supplemental Data. Ma et al. (2016). Plant Cell 10.1105/tpc.15.00880
14

A
B
Col-0
xdh1-2
HH
Supplemental Figure 15. XDH1-Derived H2O2 Contributes to BasalResistance.(A) Six-week-old plants of Col-0 and xdh1-2 were inoculated with GcUCSC1. Pictures were taken at 7 dpi. Disease quantification data wereshown in Figure 6E. Note there is more fungal mass on the leaves ofxdh1-2 compared to those of Col-0. This experiment was repeated fourtime with similar results. (B) H2O2 accumulation (revealed by DABstaining) occurred in ~5% of the fungal penetration sites (arrows) inCol-0, but rarely (1-2%) in xdh1-2. Bars = 10 μm.
Col-0 xdh1-2
Supplemental Data. Ma et al. (2016). Plant Cell 10.1105/tpc.15.00880
15
Col-0 xdh1-2 rbohD
rbohF xdh1/rbohD DPI + DFO
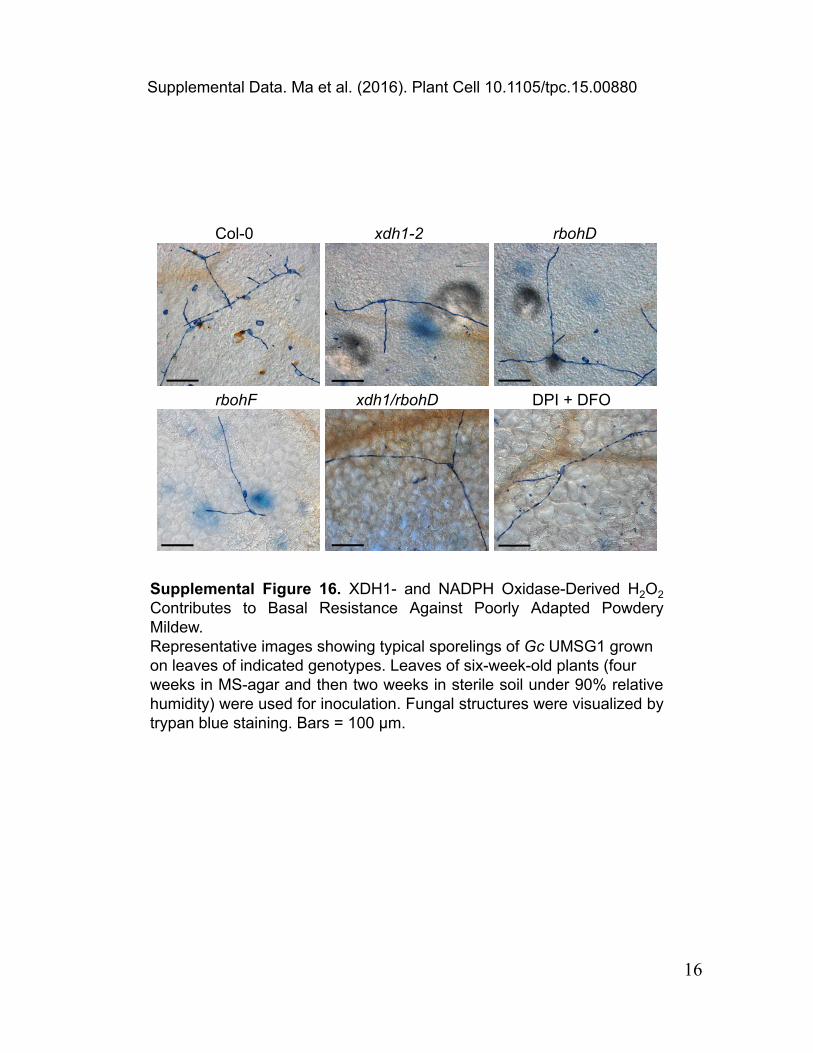
Supplemental Figure 16. XDH1- and NADPH Oxidase-Derived H2O2 Contributes to Basal Resistance Against Poorly Adapted Powdery Mildew.Representative images showing typical sporelings of Gc UMSG1 grown on leaves of indicated genotypes. Leaves of six-week-old plants (four weeks in MS-agar and then two weeks in sterile soil under 90% relative humidity) were used for inoculation. Fungal structures were visualized by trypan blue staining. Bars = 100 μm.
Supplemental Data. Ma et al. (2016). Plant Cell 10.1105/tpc.15.00880
16

Col-0 xdh1-2 rbohD rbohF
xdh1 rbohD xdh1 rbohF rbohD rbohF xdh1 rbohD rbohF
Col-nahG
Supplemental Figure 17. Both XDH1 and RbohD Contribute to Basal Resistance AgainstAdapted Powdery Mildew.(A) Representative mildew-infected leaves of indicated genotypes. Six-week-old plants (fourweeks in MS-agar, two weeks in soil) were inoculated with Gc UCSC1. Pictures were taken at 10dpi. Note that mildew-induced mesophyll cell death in plants containing xdh1-2 was delayed for4-6 days under these growth conditions compared with xdh1-2 grown under normal growthconditions (see Methods). The xdh1 rbohD rbohF triple mutant exhibited extensive mildew-induced necrosis, explaining low-level sporulation of the fungus on it.(B) Quantification of disease susceptibility of the indicated genotypes at 8 dpi. Note that xdh1rbohD supported the highest (close to Col-nahG, a transgenic line deficient in SA signaling),while xdh1 rbohD rbohF supported the least, sporulation of Gc UCSC1. These phenotypic resultsgenerally agree with those concerning hyphal length of Gc UMSG1 (Figure 7D). * indicatessignificant difference when compared to Col-0 wt (p<0.05; n=3, Student t-test). This experimentwas repeated twice with similar results.
A
B
δ
Num
ber
of s
pore
s pe
r m
g tis
sue
(x10
3)
10
12
4
14
16
8
6
2
0
* *
*
*
*
*
Supplemental Data. Ma et al. (2016). Plant Cell 10.1105/tpc.15.00880
17
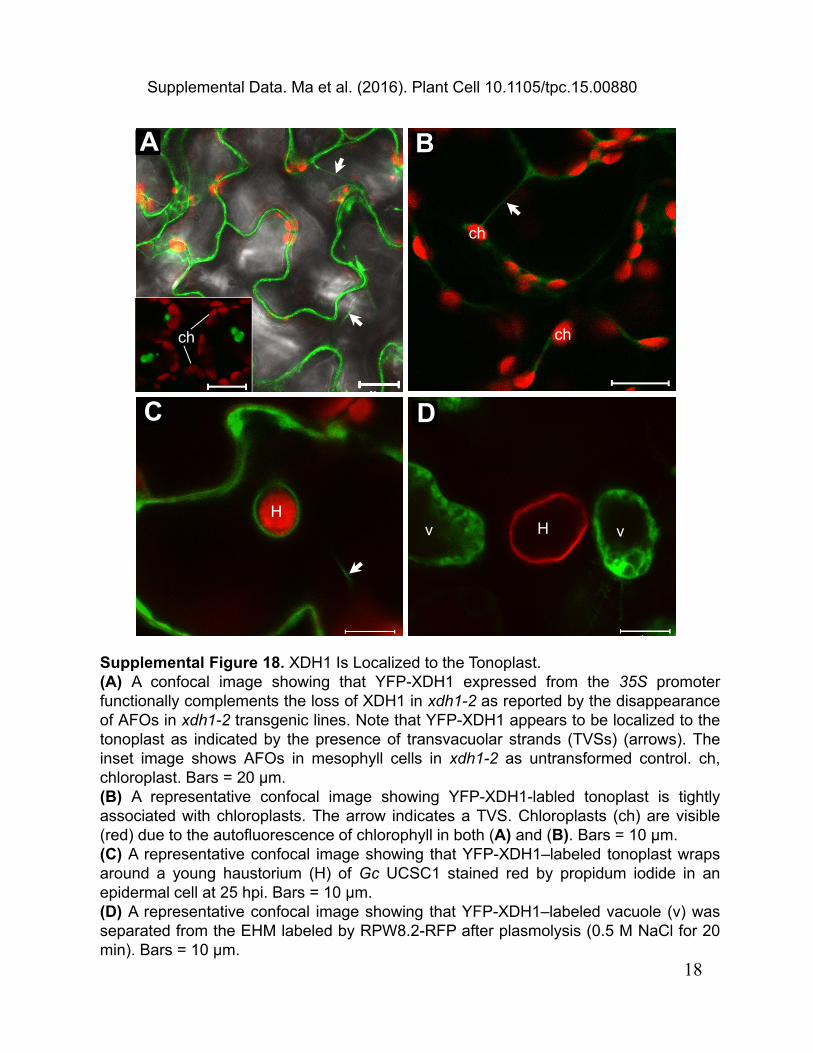
Supplemental Figure 18. XDH1 Is Localized to the Tonoplast.(A) A confocal image showing that YFP-XDH1 expressed from the 35S promoterfunctionally complements the loss of XDH1 in xdh1-2 as reported by the disappearanceof AFOs in xdh1-2 transgenic lines. Note that YFP-XDH1 appears to be localized to thetonoplast as indicated by the presence of transvacuolar strands (TVSs) (arrows). Theinset image shows AFOs in mesophyll cells in xdh1-2 as untransformed control. ch,chloroplast. Bars = 20 µm.(B) A representative confocal image showing YFP-XDH1-labled tonoplast is tightlyassociated with chloroplasts. The arrow indicates a TVS. Chloroplasts (ch) are visible(red) due to the autofluorescence of chlorophyll in both (A) and (B). Bars = 10 µm.(C) A representative confocal image showing that YFP-XDH1–labeled tonoplast wrapsaround a young haustorium (H) of Gc UCSC1 stained red by propidum iodide in anepidermal cell at 25 hpi. Bars = 10 µm.(D) A representative confocal image showing that YFP-XDH1–labeled vacuole (v) wasseparated from the EHM labeled by RPW8.2-RFP after plasmolysis (0.5 M NaCl for 20min). Bars = 10 µm.
DC
A B
H vv
ch
ch
H
ch
Supplemental Data. Ma et al. (2016). Plant Cell 10.1105/tpc.15.00880
18
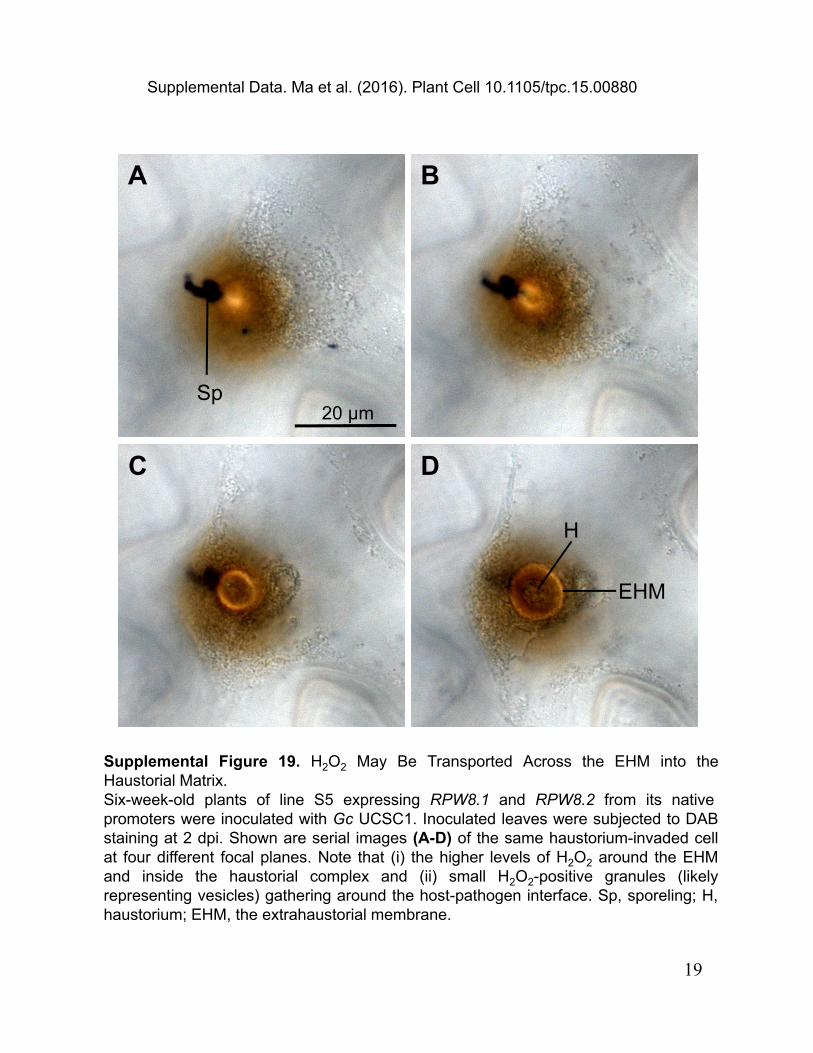
Supplemental Figure 19. H2O2 May Be Transported Across the EHM into the Haustorial Matrix.Six-week-old plants of line S5 expressing RPW8.1 and RPW8.2 from its native promoters were inoculated with Gc UCSC1. Inoculated leaves were subjected to DAB staining at 2 dpi. Shown are serial images (A-D) of the same haustorium-invaded cell at four different focal planes. Note that (i) the higher levels of H2O2 around the EHM and inside the haustorial complex and (ii) small H2O2-positive granules (likely representing vesicles) gathering around the host-pathogen interface. Sp, sporeling; H, haustorium; EHM, the extrahaustorial membrane.
Sp
H
EHM
A B
DC
20 μm
Supplemental Data. Ma et al. (2016). Plant Cell 10.1105/tpc.15.00880
19
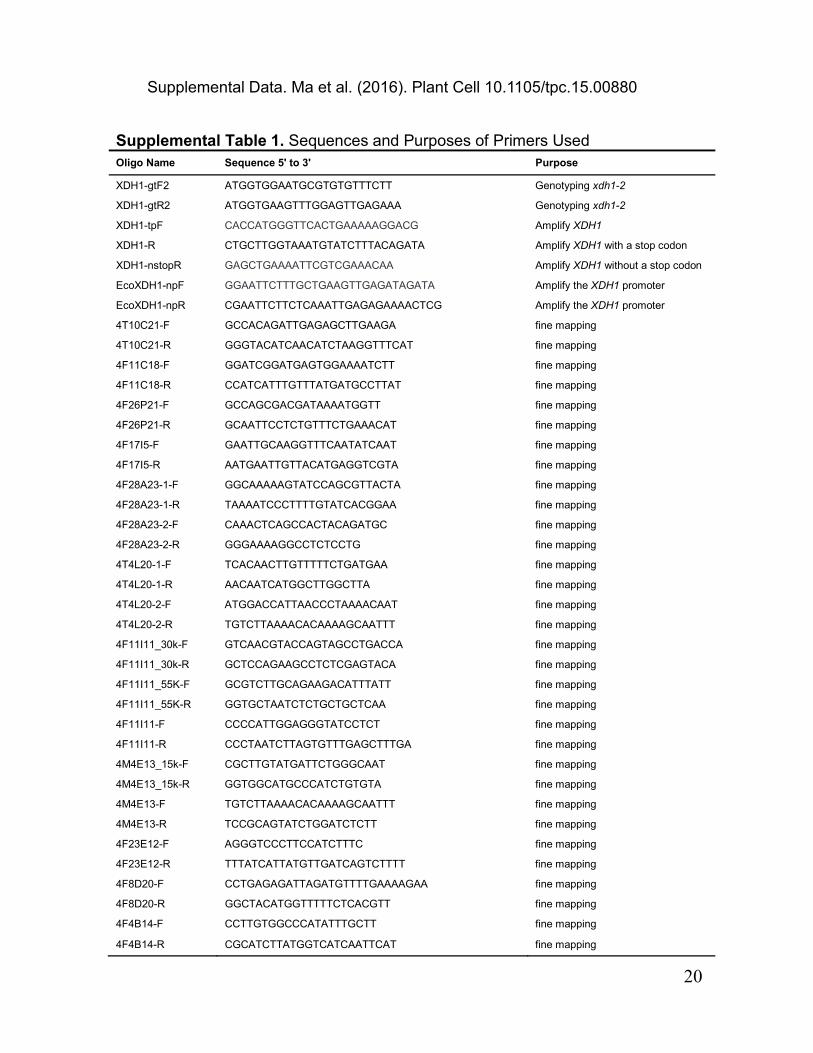
Supplemental Table 1. Sequences and Purposes of Primers Used Oligo Name Sequence 5' to 3' Purpose
XDH1-gtF2 ATGGTGGAATGCGTGTGTTTCTT Genotyping xdh1-2
XDH1-gtR2 ATGGTGAAGTTTGGAGTTGAGAAA Genotyping xdh1-2
XDH1-tpF CACCATGGGTTCACTGAAAAAGGACG Amplify XDH1
XDH1-R CTGCTTGGTAAATGTATCTTTACAGATA Amplify XDH1 with a stop codon
XDH1-nstopR GAGCTGAAAATTCGTCGAAACAA Amplify XDH1 without a stop codon
EcoXDH1-npF GGAATTCTTTGCTGAAGTTGAGATAGATA Amplify the XDH1 promoter
EcoXDH1-npR CGAATTCTTCTCAAATTGAGAGAAAACTCG Amplify the XDH1 promoter
4T10C21-F GCCACAGATTGAGAGCTTGAAGA fine mapping
4T10C21-R GGGTACATCAACATCTAAGGTTTCAT fine mapping
4F11C18-F GGATCGGATGAGTGGAAAATCTT fine mapping
4F11C18-R CCATCATTTGTTTATGATGCCTTAT fine mapping
4F26P21-F GCCAGCGACGATAAAATGGTT fine mapping
4F26P21-R GCAATTCCTCTGTTTCTGAAACAT fine mapping
4F17I5-F GAATTGCAAGGTTTCAATATCAAT fine mapping
4F17I5-R AATGAATTGTTACATGAGGTCGTA fine mapping
4F28A23-1-F GGCAAAAAGTATCCAGCGTTACTA fine mapping
4F28A23-1-R TAAAATCCCTTTTGTATCACGGAA fine mapping
4F28A23-2-F CAAACTCAGCCACTACAGATGC fine mapping
4F28A23-2-R GGGAAAAGGCCTCTCCTG fine mapping
4T4L20-1-F TCACAACTTGTTTTTCTGATGAA fine mapping
4T4L20-1-R AACAATCATGGCTTGGCTTA fine mapping
4T4L20-2-F ATGGACCATTAACCCTAAAACAAT fine mapping
4T4L20-2-R TGTCTTAAAACACAAAAGCAATTT fine mapping
4F11I11_30k-F GTCAACGTACCAGTAGCCTGACCA fine mapping
4F11I11_30k-R GCTCCAGAAGCCTCTCGAGTACA fine mapping
4F11I11_55K-F GCGTCTTGCAGAAGACATTTATT fine mapping
4F11I11_55K-R GGTGCTAATCTCTGCTGCTCAA fine mapping
4F11I11-F CCCCATTGGAGGGTATCCTCT fine mapping
4F11I11-R CCCTAATCTTAGTGTTTGAGCTTTGA fine mapping
4M4E13_15k-F CGCTTGTATGATTCTGGGCAAT fine mapping
4M4E13_15k-R GGTGGCATGCCCATCTGTGTA fine mapping
4M4E13-F TGTCTTAAAACACAAAAGCAATTT fine mapping
4M4E13-R TCCGCAGTATCTGGATCTCTT fine mapping
4F23E12-F AGGGTCCCTTCCATCTTTC fine mapping
4F23E12-R TTTATCATTATGTTGATCAGTCTTTT fine mapping
4F8D20-F CCTGAGAGATTAGATGTTTTGAAAAGAA fine mapping
4F8D20-R GGCTACATGGTTTTTCTCACGTT fine mapping
4F4B14-F CCTTGTGGCCCATATTTGCTT fine mapping
4F4B14-R CGCATCTTATGGTCATCAATTCAT fine mapping
Supplemental Data. Ma et al. (2016). Plant Cell 10.1105/tpc.15.00880
20

Supplemental Data. Ma et al. (2016). Plant Cell 10.1105/tpc.15.00880
Supplemental Table 1. Sequences and Purposes of Primers Used (Continued) Oligo Name Sequence 5' to 3' Purpose
4T9A14-F CCGCAGCTGCACTTTCTTCA fine mapping
4T9A14-R GGAGACGAGCTTTTGGGAGAAA fine mapping
4T22F8-F CGGCAGATCGGATTCCGTTT fine mapping
4T22F8-R GCCTGTTCCTGGATGTCAGCTA fine mapping
XDH amiRNA 1-I GATGAAATCATATGAACTTCGGTTCTCTCTTTTGTATTCC Silencing XDH1/XDH2
XDH amiRNA 1-II GAACCGAAGTTCATATGATTTCATCAAAGAGAATCAATGA Silencing XDH1/XDH2
XDH amiRNA 1-III GAAACGAAGTTCATTTGATTTCATCACAGGTCGTGATATG Silencing XDH1/XDH2
XDH amiRNA 1-IV GATGAAATCAAATGAACTTCGTTTCTACATATATATTCCT Silencing XDH1/XDH2
XDH amiRNA 2-I GATAATCCATTTATGCGCTGCATTCTCTCTTTTGTATTCC Silencing XDH1/XDH2
XDH amiRNA 2-II GAATGCAGCGCATAAATGGATTATCAAAGAGAATCAATGA Silencing XDH1/XDH2
XDH amiRNA 2-III GAATACAGCGCATAATTGGATTTTCACAGGTCGTGATATG Silencing XDH1/XDH2
XDH amiRNA 2-IV GAAAATCCAATTATGCGCTGTATTCTACATATATATTCCT Silencing XDH1/XDH2
XDH amiRNA 3-I GATTGGATATTACATGCAACCCTTCTCTTTTGTATTCC Silencing XDH1/XDH2
XDH amiRNA 3-II GAAGGGTTGCATGTAATATCCAATCAAAGAGAATCAATGA Silencing XDH1/XDH2
XDH amiRNA 3-III GAAGAGTTGCATGTATTATCCATTCACAGGTCGTGATATG Silencing XDH1/XDH2
TmUBC9-F CAGTGGAGTCCTGCTCTCACAA qRT-PCR for UBC9
TmUBC9-R CATCTGGGTTTGGATCCGTTA qRT-PCR for UBC9
UBC9-probe TTCCAAGGTGCTGCTATCGATCTGTTCTTT qRT-PCR for UBC9
TmXDH1-F CACGGTGATGGTGTCTAGTTATGAC qRT-PCR for XDH1
TmXDH1-R CCAAGTCCCTCAATGGATATTACAT qRT-PCR for XDH1
TmXDH1-probe CAAAGACCTCTGTGCATTATGCTGTCAACG qRT-PCR for XDH1
XDH1_G48D_fwd GGATTGACCGATACAAAGCTGGG Cloning the afo1-1 allele
XDH1_G48D_rev CCCAGCTTTGTATCGGTCAATCC Cloning the afo1-1 allele
XDH1_R941Q_for GCACTGCTTTCCA AGGGTTTGGAGG Cloning the afo1-2 allele
XDH1_R941Q_rev CCTCCAAACCCTTGGAAAGCAG TGC Cloning the afo1-2 allele
XDH1_T1061I_for GGTTTTAGTGATTCATGGTGGTG Cloning the afo1-3 allele
XDH1_T1061I_rev CACCACCATGAATCACTAAAACC Cloning the afo1-3 allele
21