Embed Size (px)
Citation preview

The American Journal of Human Genetics, Volume 101
Supplemental Data
A Powerful Approach to Estimating
Annotation-Stratified Genetic Covariance
via GWAS Summary Statistics
Qiongshi Lu, Boyang Li, Derek Ou, Margret Erlendsdottir, Ryan L. Powles, TonyJiang, Yiming Hu, David Chang, Chentian Jin, Wei Dai, Qidu He, ZefengLiu, Shubhabrata Mukherjee, Paul K. Crane, and Hongyu Zhao
Supplementary Figures
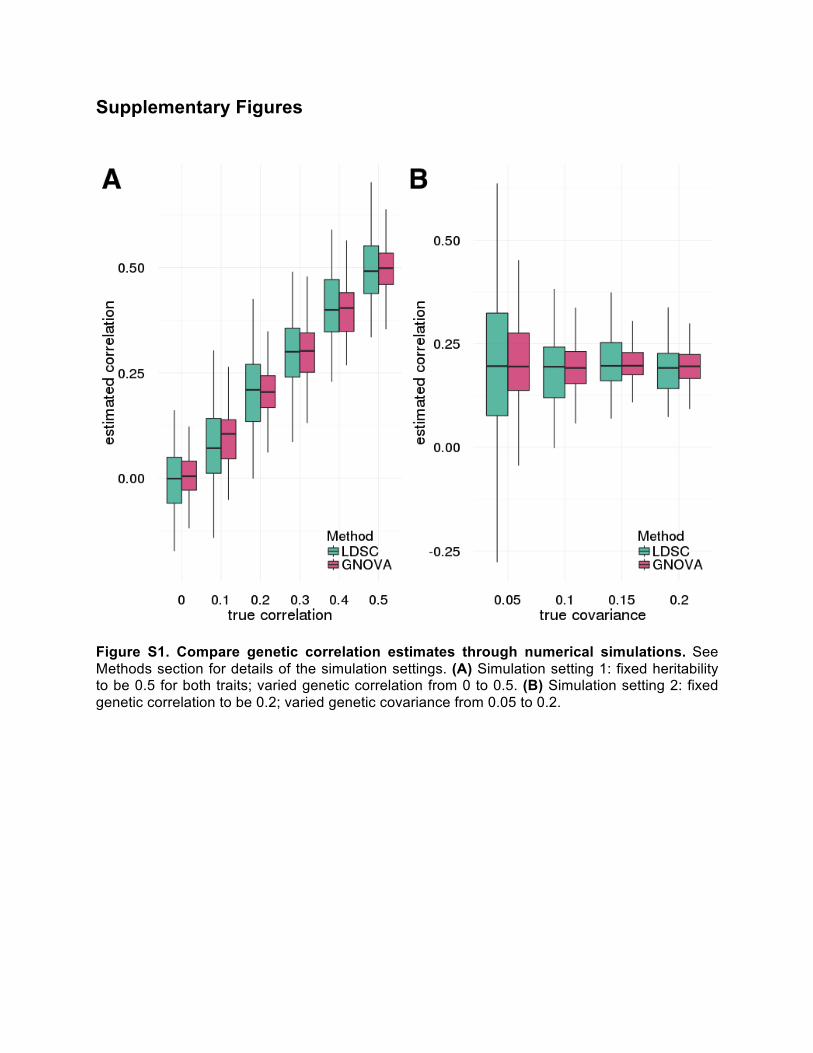
Figure S1. Compare genetic correlation estimates through numerical simulations. See Methods section for details of the simulation settings. (A) Simulation setting 1: fixed heritability to be 0.5 for both traits;; varied genetic correlation from 0 to 0.5. (B) Simulation setting 2: fixed genetic correlation to be 0.2;; varied genetic covariance from 0.05 to 0.2.

Figure S2. Compare GNOVA and LDSC using two traits simulated on the same cohort. Sample overlap correction was applied when estimating genetic covariance. See simulation setting 3 in the Methods section for details on the analysis. Panels (A-C) show the genetic covariance estimates, genetic correlation estimates, and power calculation, respectively.

Figure S3. Genetic correlations of 48 complex traits estimated GNOVA. Asterisks highlight significant genetic correlations after Bonferroni correction (p < 4.4×10⁻⁵). The order of traits is determined by hierarchical clustering. Sample overlap correction was applied to trait pairs with substantial sample sharing (Figure S8). Correlation estimates above 1 or below -1 were truncated.

Figure S4. Genetic correlations of 48 complex traits estimated by LDSC. Asterisks highlight significant genetic correlations after Bonferroni correction (p < 4.4×10⁻⁵). The order of traits is the same as shown in Figure S3. LDSC output p-value=NA for most pairs that involve gout due to its negative heritability estimate. Those blocks are colored in grey.

Figure S5. Scatter plot matrix for MAF-stratified genetic covariance estimates. Q1, Q2, Q3, and Q4 denote the MAF quarters (from lowest to highest).

Figure S6. Stratify genetic covariance by tissue type. Intervals show the standard error of covariance estimates. Single asterisks indicate p-values below 0.05/(4*7) = 0.0018. Double asterisks indicate p-values below 0.05/(7×1225) = 5.8×10⁻⁶.

Figure S7. Compare the estimated genetic covariance in the predicted non-functional genome on each chromosome with size of the non-functional genome.

Figure S8. Pairs of traits with sample overlap correction. Some studies among the 48 GWASs have substantial sample overlap. Therefore, we applied sample overlap correction (See Methods section) when analyzing those traits throughout the paper. Those trait pairs are highlighted in light blue.

Figure S9. Numerical justifications to the theoretical proof – numerical study 1. Analysis details are described in Appendix. (A) Labels “term1” and “term2” denote 𝑡𝑟(𝐴%𝐻'𝐴𝐻() and 𝑡𝑟(𝐴%Θ𝐴%Θ) , respectively;; “sum” denotes the summation of both, i.e. 𝑡𝑟 𝐴%𝐻'𝐴𝐻( +𝑡𝑟(𝐴%Θ𝐴%Θ). (B) Histogram of log'/(|𝑡𝑟 𝐴%𝐻'𝐴𝐻( /𝑡𝑟(𝐴%Θ𝐴%Θ)|).

Figure S10. Numerical justifications to the theoretical proof – numerical study 2. Analysis details are described in Appendix. Boxplots under settings 1 and 2 denote the sample variance 𝑉𝑎𝑟(𝑦'%𝐴𝑦() and 𝑉𝑎𝑟(𝑦'%𝐴′𝑦(), respectively (with 100 repeats). The dotted line marks the sample variance 𝑉𝑎𝑟(𝑦'%𝐴𝑦().

Supplementary Tables Table S1. Details of 48 GWAS.
Trait Acronym Sample Sizea Ref. URL Age at First Birth AFB 241,781 1 http://www.thessgac.org/data Age at Menarche AM 132,989 2 http://www.reprogen.org/data_download.html Age at Natural Menopause ANM 69,360 3 http://www.reprogen.org/data_download.html Age-related Macular Degeneration AMD 33,976 4 http://csg.sph.umich.edu/abecasis/public/amd2015/ Anorexia Nervosa AN 14,477 5 https://www.med.unc.edu/pgc/downloads Anxiety Disorder ANX 17,310 6 https://www.med.unc.edu/pgc/downloads Asthma AST 26,475 7 http://www.cng.fr/gabriel/index.html Autism Spectrum Disorder ASD 10,610 8 https://www.med.unc.edu/pgc/downloads Bipolar Disorder BIP 16,731 9 https://www.med.unc.edu/pgc/downloads Birth Weight BW 143,677 10 http://egg-consortium.org/birth-weight-2016.html Body Mass Index BMI 234,069 11 http://www.broadinstitute.org/collaboration/giant/index.php/GIANT_consortium_data_files Celiac Disease CEL 15,283 12 https://www.immunobase.org/downloads/protected_data/GWAS_Data/ Chronic Kidney Disease CKD 118,147 13 https://www.nhlbi.nih.gov/research/intramural/researchers/ckdgen Chronotype CHT 127,898 14 http://www.t2diabetesgenes.org/data/ Cognitive Performance COG 106,736 15 http://www.thessgac.org/data Coronary Artery Disease CAD 184,305 16 http://www.cardiogramplusc4d.org/downloads/ Crohn's Disease CD 27,726 17 http://www.ibdgenetics.org Depressive Symptoms DEP 161,460 18 http://www.thessgac.org/data Eczema ECZ 40,835 19 http://data.bris.ac.uk/data/dataset/28uchsdpmub118uex26ylacqm Education Years EDU 293,723 20 http://www.thessgac.org/data Epilepsy EPL 34,853 21 http://www.epigad.org/page/show/homepage Fasting Glucose GLU 58,074 22 http://www.magicinvestigators.org/downloads/ Fasting Insulin INS 51,750 22 http://www.magicinvestigators.org/downloads/ Femoral Neck Bone Mineral Density FNBMD 32,961 23 http://www.gefos.org/?q=content/data-release-2012 Gout GOUT 69,374 24 http://metabolomics.helmholtz-muenchen.de/gugc/ HDL Cholesterol HDL 99,900 25 http://csg.sph.umich.edu/abecasis/public/lipids2010/ Height HGT 253,288 26 http://www.broadinstitute.org/collaboration/giant/index.php/GIANT_consortium_data_files Inflammatory Bowel Disease IBD 34,694 17 http://www.ibdgenetics.org LDL Cholesterol LDL 95,454 25 http://csg.sph.umich.edu/abecasis/public/lipids2010/ Lumbar Spine Bone Mineral Density LSBMD 31,800 23 http://www.gefos.org/?q=content/data-release-2012 Major Depressive Disorder MDD 18,759 27 https://www.med.unc.edu/pgc/downloads Multiple Sclerosis MS 27,148 28 https://www.immunobase.org/downloads/protected_data/GWAS_Data/ Neuroticism NEU 170,911 18 http://www.thessgac.org/data Number of Children Ever Born NCEB 318,463 1 http://www.thessgac.org/data Primary Angle Closure Glaucoma PACG 26,454 29 Supplementary data in the original GWAS paper Primary Billary Cirrhosis PBC 13,239 30 https://www.immunobase.org/downloads/protected_data/GWAS_Data/ Resting Heart Rate RHR 134,251 31 http://www.cardiomics.net/download-data Rheumatoid Arthritis RA 58,284 32 http://plaza.umin.ac.jp/~yokada/datasource/software.htm Schizophrenia SCZ 82,315 33 https://www.med.unc.edu/pgc/downloads Serum Urate SU 110,347 24 http://metabolomics.helmholtz-muenchen.de/gugc/ Smoking Behavior SMK 74,053 34 https://www.med.unc.edu/pgc/downloads Subjective Well-being SWB 298,420 18 http://www.thessgac.org/data Systemic Lupus Erythematosus SLE 14,267 35 https://www.immunobase.org/downloads/protected_data/GWAS_Data/ Total Cholesterol TC 100,184 25 http://csg.sph.umich.edu/abecasis/public/lipids2010/ Triglycerides TG 96,598 25 http://csg.sph.umich.edu/abecasis/public/lipids2010/ Type-II Diabetes T2D 69,033 36 http://diagram-consortium.org/downloads.html Ulcerative Colitis UC 28,738 17 http://www.ibdgenetics.org Waist Hip Ratio adjusted for BMI WHR 142,762 37 http://www.broadinstitute.org/collaboration/giant/index.php/GIANT_consortium_data_files Total 4,563,942b
a Due to technical reasons, sample size may be slightly different from what is reported in the reference. b Calculation for total sample size did not take sample overlap between studies into account.

Table S2. Pair-wise genetic correlation of 48 complex traits. Uploaded as a separate file.

Table S3. Compare genetic correlations estimated by GNOVA and LDSC.
GNOVA LDSC
Significance Trait 1 Trait 2 Correlation P Correlation P
GNOVA+;; LDSC-
AFB ASD 0.2571 1.37E-06 0.1617 2.80E-03 AFB EPL -0.2418 4.22E-05 -0.1067 1.65E-01 AFB MDD -0.2779 3.90E-09 -0.2425 1.20E-03 AFB RA -0.2347 5.89E-11 -0.1799 2.00E-04 AFB T2D -0.1902 5.60E-08 -0.1647 3.00E-04 AM CAD -0.1434 4.22E-06 -0.1108 2.00E-04 AM SU -0.1272 2.03E-06 -0.0822 9.50E-03 AN GLU -0.2545 8.77E-06 -0.2959 8.00E-04 AN HDL 0.2354 1.10E-05 0.2575 7.00E-04 AN TG -0.2848 3.23E-08 -0.2292 4.00E-04 AN WHR -0.3156 2.78E-06 -0.2195 5.83E-05 ANM CEL 0.1669 5.65E-07 0.0736 3.54E-01 ANX COG -0.3417 1.55E-07 -0.4370 6.00E-04 ANX MDD 0.6657 1.14E-09 0.7597 6.58E-05 ANX SMK 0.3947 4.25E-05 0.3960 4.30E-03 ASD MS -0.4704 4.13E-11 -0.2531 6.61E-02 ASD SWB -0.2304 4.18E-05 -0.2648 6.00E-04 AST ECZ 0.3537 6.71E-06 0.6475 4.98E-05 BIP DEP 0.3620 1.43E-18 0.2163 9.86E-05 BIP NEU 0.1400 1.55E-05 0.0963 3.97E-02 BIP SWB -0.1773 2.08E-05 -0.2174 9.00E-04 BMI CKD 0.2453 4.76E-06 0.1748 1.80E-03 BMI DEP 0.2136 6.63E-08 0.1220 9.37E-05 BMI NCEB 0.2533 4.20E-11 0.1111 7.70E-05 BW GLU -0.1563 4.17E-05 -0.1246 9.90E-03 BW TC -0.1400 1.29E-05 -0.1269 1.30E-03 CD MS 0.1943 3.03E-06 0.2097 1.79E-01 CEL COG 0.1438 2.71E-06 0.2218 1.90E-03 CHT COG -0.1491 1.03E-08 -0.1439 1.30E-03 CHT SCZ -0.1047 1.26E-05 -0.1180 4.00E-04 COG INS -0.1511 1.36E-05 -0.2396 1.00E-04 COG RA -0.1809 4.47E-11 -0.1921 1.37E-02 COG T2D -0.1913 1.31E-07 -0.1984 2.00E-04 EDU EPL -0.2099 4.39E-07 -0.1883 1.60E-03 EDU LDL -0.1332 2.98E-06 -0.1319 3.00E-04 EDU T2D -0.1738 1.39E-08 -0.1359 1.00E-04 FNBMD GLU 0.3400 1.89E-05 0.1457 6.40E-03 FNBMD T2D 0.2976 1.31E-05 0.1734 8.00E-04 GLU INS 0.2633 2.52E-05 0.2956 1.50E-03 GLU RHR 0.1433 5.34E-06 0.1390 3.90E-03 IBD MS 0.1712 1.29E-05 0.3092 9.07E-02 INS RHR 0.1834 6.18E-06 0.2228 4.76E-05 MDD SMK 0.2738 3.76E-06 0.2000 3.94E-02 MS SLE 0.4343 7.13E-16 0.5394 1.29E-02 NEU WHR 0.1907 6.79E-06 0.1222 3.00E-04 PBC UC 0.2047 9.22E-06 0.2490 1.10E-03 RHR T2D 0.1932 9.89E-07 0.1779 2.00E-04 SCZ SMK 0.1371 2.84E-06 0.1093 4.60E-03 SU T2D 0.2753 1.16E-17 0.2783 2.00E-04 SU TG 0.3822 4.58E-09 0.3301 4.12E-05
GNOVA-;; LDSC+
CAD LDL 0.2140 7.01E-03 0.2242 4.40E-06 LDL TC 0.8596 7.69E-05 0.9905 0.00E+00 T2D WHR 0.2643 1.10E-04 0.2525 1.48E-07
a p-value output in LDSC log file was 0.

Table S4. Genetic correlation between eight pairs of physiologically or epidemiologically related traits.
Trait 1 Trait 2 Covariance SE Correlation P FNBMD LSBMD 0.1553 0.0156 1.7719 2.01E-23 DEP MDD 0.0562 0.0058 0.6270 5.95E-22 SCZ SWB -0.0309 0.0034 -0.3176 2.50E-19 ANX SWB -0.0287 0.0037 -0.6927 5.71E-15 NEU SWB -0.0299 0.0023 -0.6799 3.60E-38 DEP SWB -0.0221 0.0016 -0.7139 3.03E-42 MDD SWB -0.0516 0.0039 -0.7952 3.58E-39

Table S5. Stratify genetic covariance by genome functionality. Uploaded as a separate file. Table S6. Stratify genetic covariance by SNPs’ MAF in 1000 Genomes Project. Uploaded as a separate file. Table S7. Stratify genetic covariance by tissue type. Uploaded as a separate file.

Table S8. Details of LOAD and ALS GWASs.
Trait Sample Size Ref. URL Late-onset Alzheimer's disease 54,162 38 http://web.pasteur-lille.fr/en/recherche/u744/igap/igap_download.php Amyotrophic lateral sclerosis 36,052 39 http://databrowser.projectmine.com

Table S9. Tissue-stratified covariance estimates of LOAD and ALS.
Tissue Covariance SE P Brain 0.0087 0.0081 0.283 Cardiovascular 0.0087 0.0106 0.412 Epithelium 0.0038 0.0126 0.762 Gastrointestinal 0.0001 0.0110 0.996 Immune 0.0254 0.0103 0.014 Muscle 0.0008 0.0097 0.938 Other 0.0006 0.0139 0.964

Table S10. Genetic correlation between LOAD, ALS, and 48 complex traits.
LOAD ALS Trait Covariance SE Correlation P Covariance SE Correlation P AFB -0.0095 0.0021 -0.1595 7.07E-06 -0.0060 0.0022 -0.1003 6.07E-03 AM 0.0014 0.0037 0.0129 7.05E-01 0.0070 0.0033 0.0642 3.42E-02 AMD -0.0051 0.0065 -0.0333 4.33E-01 -0.0033 0.0051 -0.0220 5.19E-01 AN 0.0109* 0.0078 0.0813 1.61E-01 0.0148 0.0078 0.2981* 5.86E-02 ANM -0.0031 0.0041 -0.0332 4.49E-01 0.0030 0.0038 0.0314 4.32E-01 ANX 0.0078* 0.0075 0.0892 2.98E-01 -0.0083 0.0064 -0.0444* 1.96E-01 ASD 0.0019* 0.0089 0.0136 8.29E-01 -0.0152 0.0087 -0.0761* 8.18E-02 AST 0.0250 0.0063 0.1956 7.97E-05 0.0159 0.0070 0.3405* 2.41E-02 BIP 0.0079* 0.0073 0.0505 2.82E-01 -0.0015 0.0073 0.2364* 8.42E-01 BMI -0.0034 0.0030 -0.0494 2.71E-01 0.0043 0.0026 0.0626 9.59E-02 BW -0.0019 0.0029 -0.0203 5.23E-01 0.0051 0.0029 0.0578 7.78E-02 CAD -0.0012* 0.0026 -0.0223 6.40E-01 -0.0028 0.0023 0.2042* 2.30E-01 CD -0.0073* 0.0063 -0.0468 2.49E-01 -0.0014 0.0058 0.2603* 8.06E-01 CEL -0.0110* 0.0099 -0.0455 2.68E-01 0.0284 0.0090 0.5444* 1.52E-03 CHT 0.0046 0.0035 0.0510 1.91E-01 -0.0082 0.0029 -0.0916 5.25E-03 CKD 0.0014 0.0031 0.0346 6.52E-01 0.0017 0.0026 0.0409 5.05E-01 COG -0.0234 0.0034 -0.2547 1.05E-11 -0.0007 0.0031 -0.0079 8.08E-01 DEP 0.0027 0.0029 0.0479 3.56E-01 0.0035 0.0025 0.0644 1.74E-01 ECZ 0.0117 0.0053 0.1365 2.79E-02 0.0082 0.0046 0.0994 7.56E-02 EDU -0.0186 0.0027 -0.1988 3.41E-12 -0.0045 0.0024 -0.0501 6.06E-02 EPL 0.0056* 0.0043 0.0899 1.87E-01 0.0012 0.0042 0.6557* 7.68E-01 FNBMD 0.0093 0.0059 0.1131 1.17E-01 0.0010 0.0051 0.0117 8.50E-01 GLU 0.0106 0.0044 0.1284 1.59E-02 0.0042 0.0041 0.0505 3.07E-01 GOUT 0.0007 0.0031 0.0317 8.20E-01 0.0010 0.0030 0.0429 7.32E-01 HDL 0.0014 0.0037 0.0189 7.06E-01 -0.0025 0.0033 -0.0337 4.38E-01 HGT -0.0174 0.0044 -0.1043 6.67E-05 0.0004 0.0038 0.0025 9.12E-01 IBD -0.0113* 0.0057 -0.0727 4.93E-02 -0.0029 0.0046 0.3208* 5.20E-01 INS 0.0014 0.0044 0.0175 7.56E-01 -0.0041 0.0042 -0.0530 3.27E-01 LDL 0.0085 0.0040 0.1194 3.25E-02 0.0027 0.0032 0.0365 3.94E-01 LSBMD 0.0188 0.0062 0.2331 2.26E-03 -0.0045 0.0050 -0.0542 3.64E-01 MDD 0.0030* 0.0083 0.0244 7.15E-01 -0.0035 0.0069 0.2029* 6.13E-01 MS -0.0100* 0.0078 -0.0686 2.02E-01 0.0283 0.0081 0.3924* 4.55E-04 NCEB 0.0013 0.0019 0.0339 4.89E-01 0.0017 0.0018 0.0412 3.62E-01 NEU 0.0064 0.0035 0.0759 6.95E-02 0.0037 0.0036 0.0456 3.02E-01 PACG 0.0062 0.0059 0.0443 2.96E-01 0.0141 0.0055 0.1185 9.67E-03 PBC -0.0494* 0.0107 -0.2354 4.36E-06 0.0030 0.0170 0.5388* 8.61E-01 RA -0.0066* 0.0050 -0.0652 1.81E-01 -0.0196 0.0087 0.0211* 2.52E-02 RHR 0.0011 0.0030 0.0101 7.27E-01 0.0054 0.0034 0.0538 1.10E-01 SCZ 0.0005* 0.0047 0.0029 9.13E-01 0.0128 0.0048 0.2516* 7.53E-03 SLE -0.0009* 0.0094 -0.0034 9.24E-01 0.0243 0.0142 0.0738* 8.75E-02 SMK -0.0007 0.0036 -0.0095 8.46E-01 0.0054 0.0036 0.0720 1.28E-01 SU -0.0015 0.0036 -0.0154 6.80E-01 -0.0050 0.0033 -0.0509 1.27E-01 SWB -0.0015 0.0021 -0.0347 4.71E-01 0.0016 0.0019 0.0353 3.97E-01 T2D -0.0002* 0.0041 -0.0024 9.62E-01 -0.0028 0.0040 0.2045* 4.82E-01 TC 0.0095 0.0044 0.1258 3.12E-02 0.0004 0.0035 0.0050 9.09E-01 TG 0.0058 0.0037 0.0788 1.17E-01 -0.0027 0.0043 -0.0350 5.27E-01 UC -0.0148* 0.0054 -0.1061 5.68E-03 -0.0064 0.0047 0.3328* 1.75E-01 WHR 0.0017 0.0025 0.0335 5.02E-01 0.0027 0.0030 0.0508 3.74E-01
* Sample overlap correction was applied.

Acknowledgements This study was supported in part by the National Institutes of Health grants R01 GM59507, the VA Cooperative Studies Program of the Department of Veterans Affairs, Office of Research and Development, and the Yale World Scholars Program sponsored by the China Scholarship Council. Dr. Crane’s and Dr. Mukherjee’s efforts were supported by grant R01 AG042437 and U01 AG006781. This study makes use of data generated by the Wellcome Trust Case-Control Consortium. A full list of the investigators who contributed to the generation of the data is available from www.wtccc.org.uk. Funding for the project was provided by the Wellcome Trust under award 076113, 085475, and 090355. We thank the International Genomics of Alzheimer's Project (IGAP) for providing summary results data for these analyses. The investigators within IGAP contributed to the design and implementation of IGAP and/or provided data but did not participate in analysis or writing of this report. IGAP was made possible by the generous participation of the subjects and their families. The i-Select chips were funded by the French National Foundation on Alzheimer's disease and related disorders. EADI was supported by the LABEX (laboratory of excellence program investment for the future) DISTALZ grant, Inserm, Institut Pasteur de Lille, Université de Lille 2, and the Lille University Hospital. GERAD was supported by the Medical Research Council (Grant n° 503480), Alzheimer's Research UK (Grant n° 503176), the Wellcome Trust (Grant n° 082604/2/07/Z), and German Federal Ministry of Education and Research (BMBF): Competence Network Dementia (CND) grant n° 01GI0102, 01GI0711, 01GI0420. CHARGE was partly supported by the NIH/NIA grant R01 AG033193 and the NIA AG081220 and AGES contract N01–AG–12100, the NHLBI grant R01 HL105756, the Icelandic Heart Association, and the Erasmus Medical Center and Erasmus University. ADGC was supported by the NIH/NIA grants: U01 AG032984, U24 AG021886, U01 AG016976, and the Alzheimer's Association grant ADGC–10–196728. We are also grateful for all the consortia and investigators that provided publicly accessible GWAS summary statistics. The authors declare no conflict of interests.

Supplemental References 1. Barban, N., Jansen, R., de Vlaming, R., Vaez, A., Mandemakers, J.J., Tropf, F.C., Shen, X.,
Wilson, J.F., Chasman, D.I., and Nolte, I.M. (2016). Genome-‐‑wide analysis identifies 12 loci influencing human reproductive behavior. Nature genetics.
2. Perry, J.R., Day, F., Elks, C.E., Sulem, P., Thompson, D.J., Ferreira, T., He, C., Chasman, D.I., Esko, T., Thorleifsson, G., et al. (2014). Parent-‐‑of-‐‑origin-‐‑specific allelic associations among 106 genomic loci for age at menarche. Nature 514, 92-‐‑97.
3. Day, F.R., Ruth, K.S., Thompson, D.J., Lunetta, K.L., Pervjakova, N., Chasman, D.I., Stolk, L., Finucane, H.K., Sulem, P., Bulik-‐‑Sullivan, B., et al. (2015). Large-‐‑scale genomic analyses link reproductive aging to hypothalamic signaling, breast cancer susceptibility and BRCA1-‐‑mediated DNA repair. Nature genetics 47, 1294-‐‑1303.
4. Fritsche, L.G., Igl, W., Bailey, J.N.C., Grassmann, F., Sengupta, S., Bragg-‐‑Gresham, J.L., Burdon, K.P., Hebbring, S.J., Wen, C., and Gorski, M. (2016). A large genome-‐‑wide association study of age-‐‑related macular degeneration highlights contributions of rare and common variants. Nature genetics 48, 134-‐‑143.
5. Duncan, L., Yilmaz, Z., Walters, R., Goldstein, J., Antilla, V., Bulik-‐‑Sullivan, B., Ripke, S., Adan, R., Alfredsson, L., and Ando, T. (2016). Genome-‐‑Wide Association Study Reveals First Locus for Anorexia Nervosa and Metabolic Correlations. bioRxiv, 088815.
6. Otowa, T., Hek, K., Lee, M., Byrne, E., Mirza, S., Nivard, M., Bigdeli, T., Aggen, S., Adkins, D., and Wolen, A. (2016). Meta-‐‑analysis of genome-‐‑wide association studies of anxiety disorders. Molecular psychiatry.
7. Moffatt, M.F., Gut, I.G., Demenais, F., Strachan, D.P., Bouzigon, E., Heath, S., von Mutius, E., Farrall, M., Lathrop, M., and Cookson, W.O. (2010). A large-‐‑scale, consortium-‐‑based genomewide association study of asthma. The New England journal of medicine 363, 1211-‐‑1221.
8. Lee, H., Ripke, S., Neale, B., Faraone, S., Purcell, S., Perlis, R., Mowry, B., Thapar, A., Goddard, M., and Witte, J. (2013). Genetic relationship between five psychiatric disorders estimated from genome-‐‑wide SNPs. Nature genetics 45, 984-‐‑994.
9. Sklar, P., Ripke, S., Scott, L., Andreassen, O., Cichon, S., Landén, M., Craddock, N., Edenberg, H., Nurnberger, J., and Rietschel, M. (2011). Large-‐‑scale genome-‐‑wide association analysis of bipolar disorder identifies a new susceptibility locus near ODZ4. Nature genetics 43, 977-‐‑U162.
10. Horikoshi, M., Beaumont, R.N., Day, F.R., Warrington, N.M., Kooijman, M.N., Fernandez-‐‑Tajes, J., Feenstra, B., van Zuydam, N.R., Gaulton, K.J., Grarup, N., et al. (2016). Genome-‐‑wide associations for birth weight and correlations with adult disease. Nature advance online publication.
11. Locke, A.E., Kahali, B., Berndt, S.I., Justice, A.E., Pers, T.H., Day, F.R., Powell, C., Vedantam, S., Buchkovich, M.L., and Yang, J. (2015). Genetic studies of body mass index yield new insights for obesity biology. Nature 518, 197-‐‑206.
12. Dubois, P.C., Trynka, G., Franke, L., Hunt, K.A., Romanos, J., Curtotti, A., Zhernakova, A., Heap, G.A., Adany, R., Aromaa, A., et al. (2010). Multiple common variants for celiac disease influencing immune gene expression. Nature genetics 42, 295-‐‑302.

13. Pattaro, C., Teumer, A., Gorski, M., Chu, A.Y., Li, M., Mijatovic, V., Garnaas, M., Tin, A., Sorice, R., and Li, Y. (2016). Genetic associations at 53 loci highlight cell types and biological pathways relevant for kidney function. Nature communications 7.
14. Jones, S.E., Tyrrell, J., Wood, A.R., Beaumont, R.N., Ruth, K.S., Tuke, M.A., Yaghootkar, H., Hu, Y., Teder-‐‑Laving, M., and Hayward, C. (2016). Genome-‐‑wide association analyses in 128,266 individuals identifies new morningness and sleep duration loci. PLoS genetics 12, e1006125.
15. Rietveld, C.A., Esko, T., Davies, G., Pers, T.H., Turley, P., Benyamin, B., Chabris, C.F., Emilsson, V., Johnson, A.D., and Lee, J.J. (2014). Common genetic variants associated with cognitive performance identified using the proxy-‐‑phenotype method. Proceedings of the National Academy of Sciences 111, 13790-‐‑13794.
16. Nikpay, M., Goel, A., Won, H.-‐‑H., Hall, L.M., Willenborg, C., Kanoni, S., Saleheen, D., Kyriakou, T., Nelson, C.P., and Hopewell, J.C. (2015). A comprehensive 1000 Genomes-‐‑based genome-‐‑wide association meta-‐‑analysis of coronary artery disease. Nature genetics 47, 1121.
17. Liu, J.Z., van Sommeren, S., Huang, H., Ng, S.C., Alberts, R., Takahashi, A., Ripke, S., Lee, J.C., Jostins, L., and Shah, T. (2015). Association analyses identify 38 susceptibility loci for inflammatory bowel disease and highlight shared genetic risk across populations. Nature genetics 47, 979-‐‑986.
18. Okbay, A., Baselmans, B.M., De Neve, J.-‐‑E., Turley, P., Nivard, M.G., Fontana, M.A., Meddens, S.F.W., Linnér, R.K., Rietveld, C.A., and Derringer, J. (2016). Genetic variants associated with subjective well-‐‑being, depressive symptoms, and neuroticism identified through genome-‐‑wide analyses. Nature genetics.
19. Paternoster, L., Standl, M., Waage, J., Baurecht, H., Hotze, M., Strachan, D.P., Curtin, J.A., Bonnelykke, K., Tian, C., Takahashi, A., et al. (2015). Multi-‐‑ancestry genome-‐‑wide association study of 21,000 cases and 95,000 controls identifies new risk loci for atopic dermatitis. Nature genetics 47, 1449-‐‑1456.
20. Okbay, A., Beauchamp, J.P., Fontana, M.A., Lee, J.J., Pers, T.H., Rietveld, C.A., Turley, P., Chen, G.B., Emilsson, V., Meddens, S.F., et al. (2016). Genome-‐‑wide association study identifies 74 loci associated with educational attainment. Nature 533, 539-‐‑542.
21. Consortium, T.I.L.A.E. (2014). Genetic determinants of common epilepsies: a meta-‐‑analysis of genome-‐‑wide association studies. The Lancet Neurology 13, 893.
22. Manning, A.K., Hivert, M.-‐‑F., Scott, R.A., Grimsby, J.L., Bouatia-‐‑Naji, N., Chen, H., Rybin, D., Liu, C.-‐‑T., Bielak, L.F., and Prokopenko, I. (2012). A genome-‐‑wide approach accounting for body mass index identifies genetic variants influencing fasting glycemic traits and insulin resistance. Nature genetics 44, 659-‐‑669.
23. Estrada, K., Styrkarsdottir, U., Evangelou, E., Hsu, Y.-‐‑H., Duncan, E.L., Ntzani, E.E., Oei, L., Albagha, O.M., Amin, N., and Kemp, J.P. (2012). Genome-‐‑wide meta-‐‑analysis identifies 56 bone mineral density loci and reveals 14 loci associated with risk of fracture. Nature genetics 44, 491-‐‑501.
24. Köttgen, A., Albrecht, E., Teumer, A., Vitart, V., Krumsiek, J., Hundertmark, C., Pistis, G., Ruggiero, D., O'Seaghdha, C.M., and Haller, T. (2013). Genome-‐‑wide association analyses identify 18 new loci associated with serum urate concentrations. Nature genetics 45, 145-‐‑154.

25. Teslovich, T.M., Musunuru, K., Smith, A.V., Edmondson, A.C., Stylianou, I.M., Koseki, M., Pirruccello, J.P., Ripatti, S., Chasman, D.I., and Willer, C.J. (2010). Biological, clinical and population relevance of 95 loci for blood lipids. Nature 466, 707-‐‑713.
26. Wood, A.R., Esko, T., Yang, J., Vedantam, S., Pers, T.H., Gustafsson, S., Chu, A.Y., Estrada, K., Luan, J., Kutalik, Z., et al. (2014). Defining the role of common variation in the genomic and biological architecture of adult human height. Nature genetics 46, 1173-‐‑1186.
27. Ripke, S., Wray, N.R., Lewis, C.M., Hamilton, S.P., Weissman, M.M., Breen, G., Byrne, E.M., Blackwood, D.H., Boomsma, D.I., Cichon, S., et al. (2013). A mega-‐‑analysis of genome-‐‑wide association studies for major depressive disorder. Molecular psychiatry 18, 497-‐‑511.
28. Sawcer, S., Hellenthal, G., Pirinen, M., Spencer, C.C., Patsopoulos, N.A., Moutsianas, L., Dilthey, A., Su, Z., Freeman, C., Hunt, S.E., et al. (2011). Genetic risk and a primary role for cell-‐‑mediated immune mechanisms in multiple sclerosis. Nature 476, 214-‐‑219.
29. Khor, C.C., Do, T., Jia, H., Nakano, M., George, R., Abu-‐‑Amero, K., Duvesh, R., Chen, L.J., Li, Z., and Nongpiur, M.E. (2016). Genome-‐‑wide association study identifies five new susceptibility loci for primary angle closure glaucoma. Nature genetics 48, 556-‐‑562.
30. Cordell, H.J., Han, Y., Mells, G.F., Li, Y., Hirschfield, G.M., Greene, C.S., Xie, G., Juran, B.D., Zhu, D., Qian, D.C., et al. (2015). International genome-‐‑wide meta-‐‑analysis identifies new primary biliary cirrhosis risk loci and targetable pathogenic pathways. Nat Commun 6, 8019.
31. Eppinga, R.N., Hagemeijer, Y., Burgess, S., Hinds, D.A., Stefansson, K., Gudbjartsson, D.F., van Veldhuisen, D.J., Munroe, P.B., Verweij, N., and van der Harst, P. (2016). Identification of genomic loci associated with resting heart rate and shared genetic predictors with all-‐‑cause mortality. Nature genetics 48, 1557-‐‑1563.
32. Okada, Y., Wu, D., Trynka, G., Raj, T., Terao, C., Ikari, K., Kochi, Y., Ohmura, K., Suzuki, A., Yoshida, S., et al. (2014). Genetics of rheumatoid arthritis contributes to biology and drug discovery. Nature 506, 376-‐‑381.
33. Ripke, S., Neale, B.M., Corvin, A., Walters, J.T., Farh, K.-‐‑H., Holmans, P.A., Lee, P., Bulik-‐‑Sullivan, B., Collier, D.A., and Huang, H. (2014). Biological insights from 108 schizophrenia-‐‑associated genetic loci. Nature 511, 421.
34. Furberg, H., Kim, Y., Dackor, J., Boerwinkle, E., Franceschini, N., Ardissino, D., Bernardinelli, L., Mannucci, P., Mauri, F., and Merlini, P. (2010). Genome-‐‑wide meta-‐‑analyses identify multiple loci associated with smoking behavior. Nature genetics 42, 441-‐‑447.
35. Bentham, J., Morris, D.L., Graham, D.S.C., Pinder, C.L., Tombleson, P., Behrens, T.W., Martín, J., Fairfax, B.P., Knight, J.C., and Chen, L. (2015). Genetic association analyses implicate aberrant regulation of innate and adaptive immunity genes in the pathogenesis of systemic lupus erythematosus. Nature genetics.
36. Mahajan, A., Go, M.J., Zhang, W., Below, J.E., Gaulton, K.J., Ferreira, T., Horikoshi, M., Johnson, A.D., Ng, M.C., and Prokopenko, I. (2014). Genome-‐‑wide trans-‐‑ancestry meta-‐‑analysis provides insight into the genetic architecture of type 2 diabetes susceptibility. Nature genetics 46, 234-‐‑244.

37. Shungin, D., Winkler, T.W., Croteau-‐‑Chonka, D.C., Ferreira, T., Locke, A.E., Magi, R., Strawbridge, R.J., Pers, T.H., Fischer, K., Justice, A.E., et al. (2015). New genetic loci link adipose and insulin biology to body fat distribution. Nature 518, 187-‐‑196.
38. Lambert, J.-‐‑C., Ibrahim-‐‑Verbaas, C.A., Harold, D., Naj, A.C., Sims, R., Bellenguez, C., Jun, G., DeStefano, A.L., Bis, J.C., and Beecham, G.W. (2013). Meta-‐‑analysis of 74,046 individuals identifies 11 new susceptibility loci for Alzheimer's disease. Nature genetics 45, 1452-‐‑1458.
39. van Rheenen, W., Shatunov, A., Dekker, A.M., McLaughlin, R.L., Diekstra, F.P., Pulit, S.L., van der Spek, R.A., Võsa, U., de Jong, S., and Robinson, M.R. (2016). Genome-‐‑wide association analyses identify new risk variants and the genetic architecture of amyotrophic lateral sclerosis. Nature genetics 48, 1043-‐‑1048.