Embed Size (px)
Citation preview

i
SUPERVISOR DECLARATION
“I hereby declare that I have read this thesis and in my opinion this report is
sufficient in terms of scope and quality for the award of the degree of
Bachelor of Mechanical Engineering (Automotive).”
Signature : ......................................
Supervisor : ......................................
Date : .......................................
ii
SIMULATION OF AIR FLOW AROUND A VEHICLE SIDE MIRROR
NUR ATIQAH BTE SHAHARI
This report is presented in
Partial fulfilment of the requirements for the
Bachelor of Mechanical Engineering (Automotive)
Faculty of Mechanical Engineering
Universiti Teknikal Malaysia Melaka
JUNE 2012

iii
DECLARATION
“I hereby declare that the works in this report is my own except for summaries and
quotations which have been duly acknowledged.”
Signature : .......................................
Author : .......................................
Date : ........................................
iv
To my beloved parents, Mr. Shahari Che Bakar and Mrs.Norasiah Abdul Karim...
My family...
My Supervisor, Mr. Fudhail Bin Abdul Munir...
My friends...
Universiti Teknikal Malaysia Melaka
June 2012

v
ACKNOWLEDGEMENT
First of all, I would to say Alhamdulillah. Praise to Allah with His bless,I am
very thankful for giving chances and ability to complete this project. In addition, I
would like to thank to my fellow friends who always encouraged me with this
project.
Noted with thank to my helpful supervisor, Mr. Fudhail bin Abdul Munir
whose help, stimulating suggestions and encouragement helped me in all the time of
the research and writing of this Final Year Project.. All of the support and
supervision from him is completely useful and it will not be forgotten. The
opportunity he had willingly given to me is a very substantial key for me to serve
better for the industry and educational field particularly.
Lastly, I would like to give my special thanks to my parents whose patient
love enabled me to complete this project, sacrifice their time and money in show of
support towards me. I hope that all results obtained in this research can be used as
references for the betterment of science and technology.
vi
ABSTRACT
In this project, simulation of air flow around vehicle side mirror had been
investigated. The side mirror models that have been chosen for this research were
models from the national car manufacturers. ANSYS FLUENT software was used to
run the simulation. k-ε turbulent model is used to calculate flow around the vehicle
model and make a comparison between all models at vehicle speed 25m/s (90km/h).
The main objective of the research is to study and obtain the flow pattern around
vehicle side mirror. Several factors that influence the flow pattern such as flow
separation, the effect of pressure coefficient (Cp) and types of turbulent has been
studies. Detail velocity variation and pressure distribution plots around the vehicle
envelopes have been presented. Simulation and results of this study showed the
airflow pattern for each selected national car model and the effect in terms of fuel
efficiency had been discussed. Perodua Kenari shows higher pressure distribution
compared to other models. Perodua Myvi show higher streamline velocity compared
to other models.
vii
ABSTRAK
Dalam projek ini, simulasi aliran udara di sekeliling cermin sisi kenderaan
telah dijalankan. Model cermin sisi yang telah dipilih untuk kajian ini adalah model
daripada pengeluar kereta nasional. Perisian ANSYS FLUENT telah digunakan
untuk menjalankan simulasi. k-ε model digunakan untuk mengira aliran di sekitar
model cermin sisi kenderaan dan membuat perbandingan antara semua model
kenderaan pada kelajuan 25m / s (90km / h). Objektif utama kajian ini ialah untuk
mengkaji dan mendapatkan corak aliran di sekeliling cermin sisi kenderaan.
Beberapa faktor yang mempengaruhi corak aliran seperti pemisahan aliran, kesan
pekali tekanan (Cp) dan jenis daripada yang bergelora telah kajian. Perincian
perubahan halaju dan plot taburan tekanan di sekeliling cremin sisi kenderaan telah
dibentangkan. Simulasi dan keputusan kajian ini menunjukkan corak aliran udara
bagi setiap model kereta nasional yang dipilih dan kesan dari segi kecekapan bahan
api telah dibincangkan. Perodua Kenari menunjukkan taburan tekanan yang lebih
tinggi berbanding dengan model-model lain. Perodua Myvi menunjukkan lebih
tinggi memperkemaskan halaju berbanding dengan model-model lain.
viii
CONTENTS
CHAPTER TITLE PAGE
DECLARATION iii
DEDICATION iv
ACKOWLEDGEMENT v
ABSTRACT vi
ABSTRAK vii
CONTENTS viii
LIST O FIGURE xi
LIST OF SYMBOL xiii
CHAPTER 1 INTRODUCTION 1
1.1 Overview 1
1.2 Problem Statement 2
1.3 Objective 2
1.4 Scope 2
1.5 Expected Result 3

ix
CHAPTER 2 LITERATURE REVIEW 4
2.1 Overview 4
2.2 aerodynamic Effects on a Rear Side View Mirror 4
2.3 Simulation of airflow around an Ople Astra 9
2.4 Computational Fluid Dynamics (CFD) 12
2.4.1 Turbulence Model 13
2.4.2 Mesh Generation 15
2.4.3 Boundary Condition 16
2.4.4 Structure of a CFD 17
2.5 Aerodynamics 18
2.5.1 Aerodynamics Theory 19
2.5.1.1 Flow Separation 19
2.5.1.2 Boundary Layer 20
2.5.1.3 Pressure and Friction Drag 22
2.5.1.4 Turbulence and Laminar Flow 22
2.4.1.5 Reynolds Number 24
CHAPTER 3 METHODOLGY 25
3.1 Overview 25
3.2 Model Set Up 27
3.3 Parameters of the Study 28
3.3.1 Model Details 28
3.3.1.1 Description of the Model 29
3.4 Boundary Condition 35
3.5 Geometry Meshing 35
3.6 Assumptions 36
3.7 Presentation Variables 37
CHAPTER 4 RESULT AND DISCUSSION 38
4.1 Overview 38
4.2 Flow Streamline and Pressure
Distribution on Vehicle Models 38
4.3 Pressure and Velocity Variation on
Vehicle Models 43

x
CHAPTER 5 CONCLUSION AND RECOMMENDATION 48
5.1 Conclusion 48
5.2 Recommendation 49
REFERENCES 51
APPENDIX 53

xi
LIST OF FIGURE
NO. OF TITLE PAGE
FIGURE
1 A quarter car with side mirror in the test section 6
2 Schematic layout of the pressure measurement of the rear
view mirror 7
3 Fluctuating Pressure Coefficient 8
4 The simulation process 10
5 The CAD model 11
6 Shaded surface mesh of the CFD model for vehicle outer skin 11
7 Flow visualization; Pressure 12
8 Reynolds Average Navier- Stoke (RANS) turbulence model 14
9 Illustrate the mesh generation 15
10 Turbulent flow around a car computed from Navier-Stokes
equations with slip boundary condition 17
11 Illustrate ANSYS CFX procedure 18
12 Illustrate the laminar separation on car body 20
13 Illustrate the boundary layer thickness of a car 20
14 Illustrate the turbulent and laminar boundary layer flow 21
15 Illustrate turbulence and laminar flow through pipe 23
16 Flow chart of methodology 26
17 Illustrate Perodua Myvi (3-D) model 29
18 Illustrate Perodua Myvi (with various plan view) model 29
19 Illustrate Proton Saga (3-D) model 30

xii
20 Illustrate Proton Saga BLM (with various plan view) model 30
21 Illustrate Perodua Kenari (3-D) model 31
22 Illustrate Perodua Kenari (with various plan view) model 31
23 Standard 3D view (Perodua Kenari) 32
24 Standard 3D view (Perodua Myvi) 33
25 Standard 3D view (Proton Saga BLM) 34
26 Geometry meshing for 3D Perodua Kenari’s side mirror
simulations 36
27 Flow streamline on side mirror model (3D).
(a) Perodua Kenari, (b)Perodua Myvi and (c) Proton Saga BLM 40
28 Pressure distribution on side mirrror model (3D)
(a) Perodua Kenari, (b)Perodua Myvi and (c) Proton Saga BLM 41
29 Pressure variation against distance of wind tunnel 43
30 Drag coefficient versus against number of iterations 46

xiii
LIST OF SYMBOL
ρ Density of air at 300K
V Free stream velocity
µ Dynamics fluid viscosity
Re Reynolds number
L Characteristic length
Cp Pressure coefficient
P Pressure at the car
P∞ Static pressure of the free wind

1
CHAPTER 1
INTRODUCTION
1.1 OVERVIEW
This study has been carried out in order to study the flow around a vehicle
side mirror. A side mirror also known as wing mirror is a mirror found on the
exterior of motor vehicles. It is used to help the driver see rear areas and to the sides
of the vehicle, outside of the driver's peripheral vision in the 'blind spot' [1].
Most modern cars mount their side mirror on the doors, normally at “A”
pillar. The side mirror can be manually adjusted or by using remote for vertical and
horizontal adjustment to produce enough coverage depends on driver height
differences and seated position. As windscreen plays an important role in the overall
design of a vehicle, side mirror also has its own role.
This project deals with Computational Fluid Dynamics (CFD), which is
used to establish the flow pattern around a vehicle side mirror. In this case, CFD
software is used to calculate the pressure distribution, drag and lift coefficient in
order to obtain the flow pattern around a vehicle front windscreen.
2
Two main objectives can be defined from this study. The first is to study the
airflow characteristic around a vehicle side mirror and to obtain the flow pattern
around a vehicle side mirror using Computational Fluid Dynamics (CFD).
Comparison made between three national car models which are Proton Saga BLM,
Perodua Myvi and Perodua Kenari to investigate the effect of the flow pattern. The
result of this study hopefully can be used as a reference and guideline by other
researcher.
1.2 PROBLEM STATEMENT
As the main concern of automotive aerodynamics is reducing drag in order to
reduce the roll resistance, drivers are always curious to see the effect in terms of fuel
efficiency. In this study, the airflow pattern around a side mirror will be investigate
and define. Comparison between three national car models which are Proton Saga
BLM, Perodua Myvi and Perodua Kenari are made to investigate the effect of airflow
pattern. Simulation and results of this study will show the airflow pattern for each
selected national car model and the effect in terms of fuel efficiency will be
discussed.
1.3 OBJECTIVE The objectives of this study are:
1. To study airflow characteristics around a vehicle side mirror.
2. To obtain the flow pattern around a vehicle side mirror using
Computational Fluid Dynamics (CFD).
3
1.4 SCOPE The scopes of this proposed project are:
1. Simulate airflow for different national cars model which is Proton
Saga BLM, Perodua Myvi and Perodua Kenari.
2. To investigate the flow pattern around a vehicle.
3. Simulation will be done using ANSYS 12.1.
1.5 EXPECTED RESULT
At the end of the research, it is expected that the flow pattern around side
mirror can be obtained and the parameter that affects the fuel efficiency at vehicle
will be discussed.

4
CHAPTER 2
LITERATURE REVIEW
2.1 OVERVIEW
This chapter will discuss about interests related to the basic and background
knowledge of side mirror, the aerodynamic theory and the used of Computational
Fluid Dynamics (CFD) in defining the airflow around a vehicle side mirror. Reviews
on previous studies concerning the airflow around a vehicle side mirror are included
as well.
2.2 Aerodynamic Effects on an Automotive Rear Side View Mirror by By Alam,
R. Jaitlee and S. Watkins.
A flat rear mirrored face defined the function of a rear view mirror during vehicle
handling. The resulting bluff body generates unsteady base pressures which generate

5
unsteady forces, leading to movement of the mirror surface and potential image
blurring. This study has been carried out due to the objective is to experimentally
determine the fluctuating base pressure on a standard and modified mirror using a
half of the full-size vehicle, fixed to the side wall of RMIT Industrial Wind Tunnel as
well as in isolation (without the half car)[2].
Driver’s vision can be impairs by pressure fluctuations from the wake of the side
mirror view. Vibration of mirror glass due to the pressure fluctuations cause the
potential of blurring image will consequently affect the safety of the vehicle and its
occupants. Two major contributors to the driver’s vision are the location and
functionality of vehicle side view mirrors. Some previous study has been carried out
in order to define the structural input (engine, road/tyre interaction etc) and also the
aerodynamic input to mirror vibration.
The mirror location in the vicinity of the A-pillar vortex provide complex
problem. The strength and intensity is very high even the size of the A-pillar vortex
is not very large at this location. Thus, the main objective of this project was to
measure the aerodynamic pressure (mean and fluctuating) on the mirror surface in
order to understand the aerodynamic effects on mirror vibration. Moreover, the
mirror was modified by shrouding around the external periphery (24mm, 34mm, and
44mm extensions) to determine the possibility of minimization of aerodynamic
pressure fluctuations and to see if this method would attenuate the fluctuating base
pressures[2].
The mean and fluctuating pressures were measured using a production rear
side view mirror fitted to a Ford AU Falcon in the RMIT Industrial Wind Tunnel.
The car was cut along its plane of symmetry, thus only replicated the case of zero
yaw. The car segment was used as compared to a complete car was to reduce the
blockage effect(~15%). Smoke and documented visualized the airflow around the
mirror. The RMIT Industrial Wind tunnel is a closed return circuit wind tunnel with
the maximum speed of 150 km/h. The tunnel’s working section is rectangular with
dimension of 3 m wide, 2 m height and 9 m long. The car segment and test section is
shown in Figure 1.

6
Figure 1: A quarter car with side mirror in the test section
A Dynamic Pressure Measurement System (DPMS) developed by Turbulent
Flow Instrumentation (TFI) was used in order to measure the mean (time-averaged)
pressures and fluctuating pressures (time-dependent) on the mirror.The DPMS is a
multi-channel pressure measurement system that can accurately measure the
fluctuating pressure up to 1000Hz depending upon tubing diameters and lengths[2].
In this investigation, the glass of the mirror was then replaced with an
Aluminium plate (2.4 mm thickness) and the mirror case was slightly modified in
order to hold the aluminium plate and allow exit of the pressure tubing. There were
51 holes made in the aluminium plate in a rectangular grid pattern. The outer
diameter and inner diameter of the tubing was 2.4 mm 0.9 mm respectively. The
distances between the two adjacent holes were 25 mm horizontally and 13 mm
vertically. The silicon rubber tubing was connected to four pressure sensor modules,
each having 15 channels. All pressure sensor modules were connected to an interface
box that provided power and multiplexed the inputs to the data acquisition system.
Figure 2 shows the schematic layout of the pressure measurement of the rear view
mirror.

7
Figure 2: Schematic layout of the pressure measurement of the rear view mirror
.
Mean, rms (standard deviation), minimum and maximum pressure value of
each pressure port on mirror was provided by the DPMS data acquisition software
Dimensions (diameter and length) of the tubing used was entered , then the data were
linearized to correct for tubing response to obtain dynamic pressure measurements.
The sampling frequency of each channel was1250 Hz. It may be noted that the peak
energy of fluctuating pressure on mirror surface was well below 500 Hz. The mean
and fluctuating pressures were measured at a range of speeds (60 to 120 km/h with an
increment of 20 km/h) at zero yaw angles. The mirror was tested as standard and then
modified by adding 24mm, 34mm and 44mm shrouding on the mirror periphery.
Fluctuating pressure coefficients (C p rms ) of three dimensional (3D) was
plotted for the standard mirror as shown in Figures 3 and 4 for the speeds of 60 km/h
and 120 km/h.
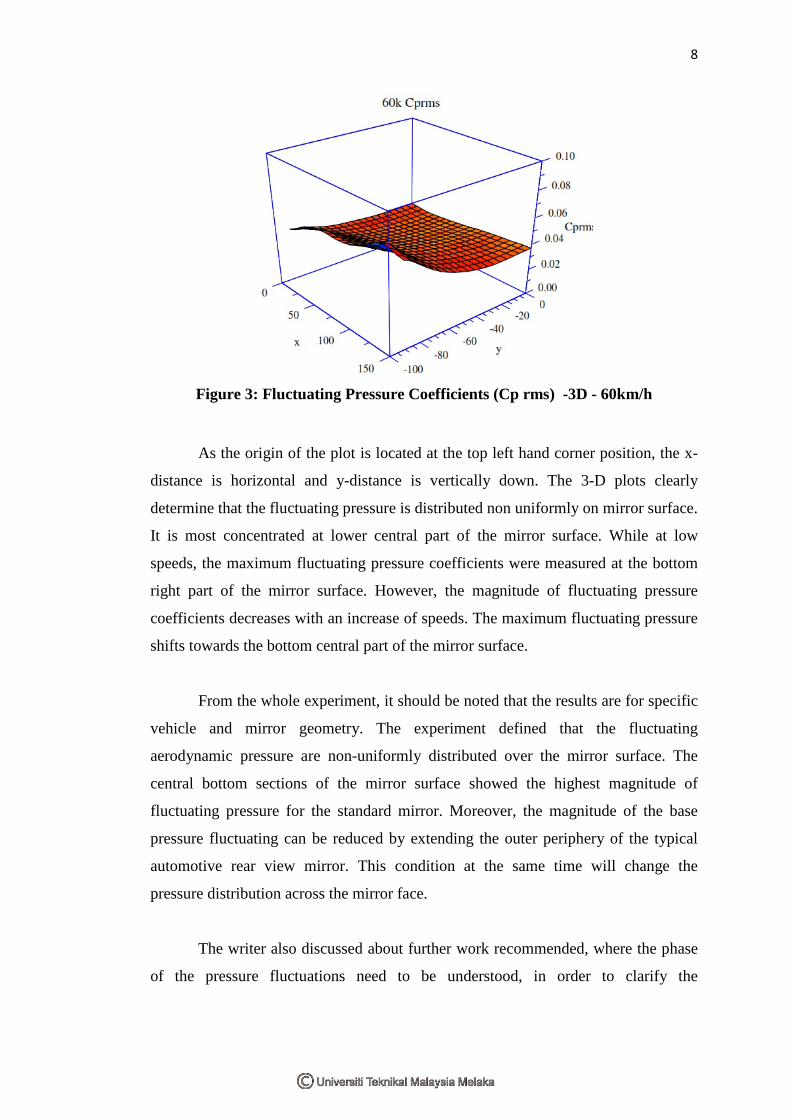
8
Figure 3: Fluctuating Pressure Coefficients (Cp rms) -3D - 60km/h
As the origin of the plot is located at the top left hand corner position, the x-
distance is horizontal and y-distance is vertically down. The 3-D plots clearly
determine that the fluctuating pressure is distributed non uniformly on mirror surface.
It is most concentrated at lower central part of the mirror surface. While at low
speeds, the maximum fluctuating pressure coefficients were measured at the bottom
right part of the mirror surface. However, the magnitude of fluctuating pressure
coefficients decreases with an increase of speeds. The maximum fluctuating pressure
shifts towards the bottom central part of the mirror surface.
From the whole experiment, it should be noted that the results are for specific
vehicle and mirror geometry. The experiment defined that the fluctuating
aerodynamic pressure are non-uniformly distributed over the mirror surface. The
central bottom sections of the mirror surface showed the highest magnitude of
fluctuating pressure for the standard mirror. Moreover, the magnitude of the base
pressure fluctuating can be reduced by extending the outer periphery of the typical
automotive rear view mirror. This condition at the same time will change the
pressure distribution across the mirror face.
The writer also discussed about further work recommended, where the phase
of the pressure fluctuations need to be understood, in order to clarify the
9
aerodynamic inputs to mirror vibration. As the yaw angle is also known to affect
mirror noise and vibration, this should also be considered in future work.
2.3 Simulation of air flow around an Opel Astra vehicle with FLUENT by
Andreas Kleber
In this study, investigation has been done by using OPEL ASTRA as an example
to show an efficient process for the simulation of the flow field around a vehicle.
Individual steps involved in this simulation process include a special emphasis on
mesh generation and adaptions are discussed. Applications of aerodynamic
simulation in various areas are reviewed.
CFD flow simulation used to define characteristics about flow circulation around
car even models or prototypes are not available. Comprehensive information
provided to designers about the entire flow field could drive to the process of
aerodynamic design. Creation of the model geometry, discretization of the physical
domain, and choice of a suitable numerical computing scheme are significant factors
that can determine the level of success of such an effort. The simulation process for
the OPEL ASTRA that is described in this article is based on practical experience,
primarily in the field of mesh generation that has been developed through the use of
software from Fluent Inc. from Lebanon, NH, for various automobile projects [3].

10
Figure 4: The simulation process
The simulation process is divided into following steps: CAD surface
preparation, mesh generation, CFD solution of the fluid flow, mesh adaption, and
visualization of the results. The software packages used for these steps include,
UNIGRAPHICS (CAD), ANSA (CAD/mesh generation), TGRID and GAMBIT
(additional mesh generation), and FLUENT (solver and post processing).
At the beginning of the process, the CAD body shell data for the ASTRA is
downloaded from a common CAE database at OPEL, from which all of the vehicle
parts and components can be accessed. For initial concept studies, the vehicle
exterior data was made by the design department for initial concept studies. In this
study, the air cooling vents and the engine space above the subframe are closed.
ASTRA in this study is constructed as a full model with an asymmetric geometry
(where the asymmetries are mostly confined to the underbody). This is done to
enable detailed predictions of the flow field around and under the vehicle. The wind
tunnel geometry around the model is a rectangular enclosure. It is of such a
dimension that the adverse pressure effects between the vehicle and the wall are
minimized. The three CAD components, namely the outer body of the vehicle, the
underbody with tires, and the wind tunnel together constitute the CFD model (Figure
2) [3].

11
Figure 5: The CAD model[12]
Since the wind tunnel and the underbody have already been meshed, the
description of the task of grid creation is limited to the styling surfaces. The window
frames are covered with regular quadrilateral elements so as to close the stage of the
window later using separately inserted prism blocks.
Figure 6: Shaded surface mesh of the CFD model for vehicle outer skin[12]
For numerical solution of flow equation and grid adaption,a 3D steady state
incompressible solution of the Navier-Stokes equations was performed using
FLUENT 5. Turbulence modeling was done with realizable k- using none
equilibrium wall functions and the free stream velocity was set to be 140km/h.During
this project, a total of 1600 iterations on an eight processor SGI Origin 2000 were
performed.