Embed Size (px)
Citation preview
Faculty 14 – Geo sciences
Institute for Landscape Ecology
Master thesis in the subject Landscape Ecology
Supervised Classification and Change Detection of Agricultural Land Use in the
Forest Steppe Zone of West Siberia Using Multitemporal Satellite Imagery
Submitted by:
Claudia Tillmann
First supervisor:
Prof. Dr. Norbert Hölzel
Westfälische Wilhelms-Universität, Münster
Second supervisor:
Andreas Völker
EFTAS Fernerkundung Technologietransfer GmbH, Münster
Münster, April 2012

Contents
List of figures I
List of tables I
List of acronyms II
Abstract III
Zusammenfassung III
Обобщение IV
1 Introduction 1
2 Methods 2
2.1 Test areas .......................................................................................................................2
2.2 Satellite data ..................................................................................................................3
2.3 Data processing ................................................................................................3
2.3.1 Georeferencing and collecting ground truth data ................................3
2.3.2 Classification of the current state ................................................................4
2.3.3 Classification of the former state ................................................................4
2.3.4 Accuracy assessment ................................................................................................5
3 Results 5
3.1 Land use classification for 2009 .....................................................................................5
3.2 Arable land use in 1987 (TA I) / 1989 (TA II) ................................................................6
3.3 Changes in arable land use ............................................................................................7
3.4 Accuracy assessment ................................................................................................8
4 Discussion 9
4.1 Land use change ................................................................................................9
4.2 Classification ..................................................................................................................11
4.3 Conclusion ......................................................................................................................12
Acknowledgements 13
References 13
Supplement V

List of figures
1 Location of the test areas ..............................................................................................2
2 Land cover classification of the test areas for 2009 ......................................................6
3 Identification of areas of arable use in 1987 / 1989 by calculation of the NDVI
and a supervised classification ......................................................................................7
4 Cropland in the test areas in 1987 / 1989 and 2009 .....................................................8
List of tables
1 Composition of land use in both test areas in 2009 ......................................................5
2 Detection of areas in arable use for 1987 (TA I) and 1989 (TA II) by two
different methods ..........................................................................................................7
3 Changes in the extent of arable land use between 1987 (TA I) / 1989 (TA II)
and 2009.........................................................................................................................7
4 Overall accuracy and kappa statistics of all classifications for the images of
1987 / 1989 and 2009 ................................................................................................8
5 Producers and users accuracy of all classifications for the class Cropland in
1987 / 1989 and 2009 ................................................................................................9
I
List of Acronyms
II
BMBF Bundesministerium für Bildung und Forschung
NIR Near Infra Red
NDVI Normalized Differenced Vegetation Index
TA Test Area
UG Untersuchungsgebiet
Abstract
After the collapse of the Soviet Union in 1991, severe changes in land use, especially the
abandonment of farmland, have taken place in many regions of the Russian Federation.
In order to detect the current land use in the Forest Steppe Zone of Russia a supervised maximum
likelihood classification was applied to Landsat images from 2009. A supervised classification as
well as a calculation of the NDVI with Landsat images acquired in 1987 (Test Area I) / 1989
(Test Area II) were also performed in order to investigate the dynamics of agricultural land use
changes with a focus on areas used as arable land. This study is connected to the BMBF-research
project SASCHA (Sustainable land management and adaptation strategies to climate change for
the Western Siberian corn-belt) and was carried out at two test areas (TA) located in the Tyumen
region. The key idea was to develop an instrument for further investigations within the SASCHA
project and to improve the understanding of ongoing land-cover changes in Russia.
In contrast to scientific publications and reports of national authorities which declared a great
decrease of agriculturally used areas, the decline of cropland in the test areas is not as dramatic as
presumed. While in TA I 7.89 % of the cropland has been lost, in TA II the cropland even expanded
by 9.94%. The position of the study regions within the fertile and still agriculturally high productive
forest steppe as well as their close distance to Tyumen, which is the commercial centre of Western
Siberia reasons these outcomes. Higher economical productivity and better soil qualities in the
district around TA II compared to TA I explains divergent trends in the test areas. The outcome of
this study implies that the alteration of agricultural land use in Russia after the breakdown of the
Soviet Union varies on a small scale and that the assumed drastic changes cannot automatically be
transferred to all regions of the country.
Keywords: change detection, land use change, remote sensing, Russia, satellite images, supervised
classification, Tyumen
Zusammenfassung
Der Zusammenbruch der Sowjetunion im Jahre 1991 führte zu gravierenden
Landnutzungsänderungen, vor allem der Aufgabe von Ackerland in vielen Regionen der Russischen
Föderation. Um die aktuelle Landnutzung in der Waldsteppenzone Russlands zu detektieren wurde
eine überwachte Maximum Likelihood Klassifikation mit Landsatbildern aus 2009 durchgeführt.
Zur Beobachtung von zeitlichen Landnutzungsveränderungen, die Ackerflächen betreffend, wurde
neben einer überwachten Klassifikation zudem eine Berechnung des NDVI mit Landsatbildern aus
den Jahren 1987 (Untersuchungsgebiet I) / 1989 (Untersuchungsgebiet II) durchgeführt.
Diese Studie kooperiert mit dem Forschungsprojekt SASCHA (Nachhaltiges Landmanagement und
Anpassungsstrategien an den Klimawandel für den Westsibirischen Getreidegürtel) und fand in
zwei Untersuchungsgebieten (UG) in der Region Tyumen statt. Die Grundidee war eine Grundlage
für weitere Untersuchungen innerhalb des SASCHA-Projektes zu schaffen sowie das Verständnis
über voranschreitenden Landnutzungswandel in Russland zu verbessern.
Im Widerspruch zu wissenschaftlichen Veröffentlichungen sowie Berichten nationaler Behörden,
ist der Rückgang von Ackerflächen in den Testgebieten nicht so erheblich wie angenommen.
III
Während die Ackerfläche im UG I um nur 7,89 % abnahm hat sie im UG II sogar um 9,94 %
zugenommen. Diese Ergebnisse können durch die Position der Untersuchungsgebiete innerhalb
der fruchtbaren und immer noch agrarisch hoch produktiven Waldsteppe sowie ihrer geringen
Entfernung zu Tyumen, dem wirtschaftlichen Zentrums Westsibiriens, erklärt werden. Höhere
wirtschaftliche Produktivität sowie bessere Bodenqualitäten in dem Gebiet um UG II im Vergleich
zu dem Gebiet um UG I, können divergente Trends zwischen den Untersuchungsgebieten
begründen. Das Ergebnis dieser Studie zeigt, dass der Wandel in der Landnutzung Russlands im
Zusammenhang mit dem Zusammenbruch der Sowjetunion kleinräumig sehr variiert und die
angenommenen drastischen Änderungen nicht auf alle Teile des Landes angewendet werden
können.
Stichwörter: Änderungsdetektion, Fernerkundung, Landnutzungswandel, Russland,
Satellitenbilder, Tyumen, überwachte Klassifikation
IV
Обобщение
После распада Советского Союза в 1991 году в землепользовании происходили серьезные
изменения, в частности, отказ от сельскохозяйственных угодий во многих регионах России.
Для того, чтобы определить текущее использование земли в лесостепной зоне России, была
использована контролируемая классификация максимального правдоподобия (изображения
Landsat, 2009 года). Контролируемая классификация так же, как и расчет нормализованного
относительного индекса растительности (NDVI) по снимкам Landsat, полученным в 1987
( пробный участок I) / 1989 ( пробный участок II) годах, также применялись для того, чтобы
отследить динамику изменений в фокусе сельскохозяйственного использования земель
(земледелие). Это исследование связано с проектом САША (SASCHA) (Устойчивое
землепользование и стратегии адаптации к климатическим изменениям для территории
Западносибирского кукурузного пояса).
Тест был проведен на пробный участках (пу) в Тюменской области. Основная идея данного
проекта заключается в желании проследить за текущими изменениями почвенно
растительного покрова России. Результаты теста оказались не столь драматичны, как
предполагалось.
В то время как на пу I 7,89 % пахотных земель были потеряны, на пу II пахотные угодья даже
расширились до 9,94 %. Более высокие экономическая производительность и качество почв
вокруг пу II в сравнении с пу I объясняется разными тенденциями на территориях
исследования. Отсюда следует главный вывод: некорректно утверждать, что резкие
изменения в системе российского землепользования после распада Советского Союза
происходили одновременно во всех регионах страны.
Ключевые слова: выявление изменения, дистанционное, зондирование, изменение в
землепользовании, контролируемая классификация, Россия, снимки со спутника, Тюмень

1
1 Introduction
Land use plays an important role in environmental changes with regards to sustainability
linked to socio-economic developments as well as it has an impact on natural resources
like soils, vegetation, water resources and biodiversity (LAMBIN et al. 2000, TURNER 1994).
Especially agricultural activities are a significant factor within the global carbon cycle
(BONDEAU et al. 2007, PIELKE et al. 2007, KURGANOVA et al. 2010, TILMANN et al. 2001).
Monitoring land cover changes can help us to understand how these processes affect
climate change and global biochemistry (LAMBIN et al. 2000).
This study is part of the research project ‘SASCHA – Sustainable land management and
adaptation strategies to climate change for the Western Siberian corn-belt’, funded by
the framework programme ‘Research for Sustainable Development’ (FONA) and the
funding measure ‘Sustainable Land Management’ (LAMA) of the Federal Ministry of
Education and Research (BMBF).
SASCHA develops sustainable land use and adaption strategies to climate change by
investigating interactional effects of climate and land use changes on resources and
ecosystem functions in the pre-taiga and forest steppe (SASCHA 2011).
Two of three test areas of the SASCHA project were objects of this study. They are
situated in the forest steppe zone in Western Siberia which is of global significance
considering the ecological relations highlighted above. SHENG et al. (2004) found out that
the peatlands of the Western Siberian plane contain about 70.21 Petagrams of carbon. At
the same time, the province Tyumen, where this study was carried out, is a centre of
Russia’s gas and oil production (SHAHGEDANOVA 2008, WEIN 1999).
Land use in Russia changed because of a great institutional transformations after the
breakdown of the Soviet Union in 1991 (LERMANN et al. 2004). This collapse led to serious
changes in Russia's agricultural system. The development from a state-directed economy
into a capitalistic system had severe consequences for the agricultural land use (KLÜTER
1992, MEINEL 2002, WEGREN 2011). Huge areas of land were abandoned (IOFFE 2005, IOFFE
et al. 2008). Thus, FRUEHAUF (2011) noticed a decline of 61% in agricultural production in
Russia between 1991 and 2000. Other land use studies in Russia, Kasachstan (HÖLZEL et al.
2002, DE BEURS & HENEBRY 2003, DE BEURS et al. 2003, KÜMMERLE et al. 2011, MEINEL 2002,)
or Latvia (MADDOCK 1995) confirm the decreasing trend in the use of agricultural land in
former countries of the Soviet Union after 1991.
Regarding the Tyumen region, there is not much information about current developments
in expansion and trend of agricultural use. To give an instrument for further land
management and environmental strategies, there is a need for information about the
transformations of land use after 1991 as well as the current land use.
The global aim of this work is to imbed the region around Tyumen into movements of
Russian land use and answer the question whether there really is a decline of agricultural
area in the test areas after 1991. Therefore this study focuses on the automatic satellite
image classification of current land use in order to produce a tool for further

2
investigations in this area as well as the detection of changes in arable land use.
Furthermore remote sensing as a tool for monitoring changes in land use will
be discussed.
2 Methods
2.1 Test areas
The two study areas are located in the western part of West Siberia, in the
southern part of the Tyumen Oblast1 (figure 1) which covers an area of about 16000 km².
Figure 1. Location of the test areas
TA I (Test Area I) includes the city Omytinskiy (Омутиский) (56°27’N/67°35’E), TA II (Test
Area II) lies to the south of the city of Ischim (Ишим) (56°06’N/69°30’E). Each of the study
sites covers a 20 x 20 km area (40000 ha). They are situated to the south east of Tyumen
(57°09’N/65°31’E), which is the largest city and the administrative centre of the Tyumen
Oblast with a population of about 600000 inhabitants.
Geographically TA I and II belong to the Western Siberian Lowland. The topography is
characterized by a flat surface. TA I lies 120 m, TA II 110 m above sea level. The bedrock
consists of Palaeozoic rocks, which are overlain by Mesozoic and Cenozoic sedimentary
consisting of Quaternary sands and other aeolian and fluvial deposits. These Quaternary
1 Type of administrative division in countries of the former Soviet Union
3
deposits range from 200 to 250 m thickness covering the West Siberian Lowland
(KORONOVSKY 2002, VOLKO & OLIUNIN 1993).
The soils are mostly chernozems (SMOLENTSEVA et al. 2002, ZAMOTAEV 2002). Further
soiltypes in the test areas are gley soils, black alkali soils and phaozems (COMMITTEE FOR
GEOGRAPHY AND CARTOGRAPHY OF THE MINISTRY FOR ECOLOGY AND RESOURCES OF THE RUSSIAN
FEDERATION 1992). The climate for the Tyumen region is continental with a -17.05°C mean
temperature in January to a +18.07°C mean temperature in July, giving an annual mean
temperature of -1.02°C (RUSSIAN FEDERAL SERVICE FOR HYDROMETEROLOGY AND ENVIRONMENTAL
MONITORING n.d.). Annual precipitation lies around 500 mm (RUSSIAN FEDERAL SERVICE FOR
HYDROMETEROLOGY AND ENVIRONMENTAL MONITORING n.d., SHAHGEDANOVA 2002).
TA I and TA II belong to the dry midlatitudes. Depending on temperature and aridity in
these ecozone several types of steppe can be differentiated. The natural vegetation in
both test areas is forest steppe. The landscape is dominated by grassland of weather
grass (Stipa-Festuca) communities, which are then broken up by islands of trees (SCHULTZ
2002). Land is mainly used for agriculture and extensive farming. Cropland, mostly
planted with spring wheat as crop, meadows and pastures are the most common types of
land use. The region around the test areas is with 2.18 persons/km² sparsely populated
(WEIN 1999).
2.2 Satellite data
All satellite data used were Landsat Thematic Mapper images (TM 4 and 5)
(supplement A) that were downloaded from http://glovis.usgs.gov/. They have a spatial
resolution of 30 m per pixel in 7 bands (1st 0.45-0.52 μm; 2nd: 0.52-0.60 μm; 3rd 0.63-0.69
μm; 4th 0.76-0.90 μm; 5th 1.55-1.73 μm; 6th 10.40-12.50 μm (120 m pixel size); 7th 2.08-
2.35 μ (ALBERTZ 2007)). Selection criteria were no cloud cover at image acquisition date
and the acquisition date itself. All images used were taken in May, because this is the
period of the year where differences between areas of cropland and grassland are
greatest. While cropland is freshly ploughed at this time the grassland already show a
dense vegetation cover. Due to these criteria and limited availability, pictures were taken
from 2009 (TA I: 29.05.09, TA II: 15.05.09) to classify the current state of land use. To
detect differences over time between the state before the breakdown of the Soviet Union
in 1991 and the current state pictures from 1987 (TA I, 17.05.87) and 1989 (TA II, 16.05.89)
were used.
Processing was done using all reflective bands. The satellite imagery was handled with the
software ERDAS Image 2011. Further data processing was handled in ArcMap.
2.3 Data processing
2.3.1 Georeferencing and collecting ground truth data
All subscenes were geo-referenced to a Universal Transverse Mercator projection.
Three (TA I and TA II in 2009, TA I in 1987) of four scenes were provided at level 1T which

4
means pictures offer systematic radiometric and geometric accuracy by incorporating
ground control points with employing a Digital Elevation Model for topographic accuracy
(USGS 2009). For all images this Landsat reference at level 1T was used as base reference.
For the scene of TA II in 1989 the reference was done by generating control points from
the other Landsat scene of TA II in 2009. At some points generating control points was
difficult because the scene did not show acceptable fix points. Furthermore all pictures
reveal aberrations from topographic maps in a range of one to three pixels. However, for
an evaluation of changes in land use on the landscape level these small aberrations are
not significant. The classifications of 2009 were additionally geo-referenced with Russian
topographic maps (scale 1:100000).
In both test areas ground truth data for the supervised classification was collected. At 26
locations in TA I this data was acquired. Because of logistical conditions collecting ground
truth data for TA II was only possible at eleven points. Coordinates with associated
information about land use were taken with a Garmin GPS and administered with Map
Source and applied in ArcMap.
2.3.2 Classification of the current state
The aim of an image classification is to automatically categorize all pixels in an
image into land cover categories (LILLESAND & KIEFER 1994). Therefore, at the locations
where ground truth data (training data) was collected areas of interest (AOI) were
created. These AOI polygons were converted into parametric files presenting the spectral
signatures of the training data (in case of parametric files these are the statistical
parameters of the pixels) (ERDAS 2010).
These files were used to do an automatic supervised classification of land use in 2009. For
this, a statistically-based maximum likelihood classification was applied. Based on the
statistical parameters of the specified classes from the training data, this method
calculates the likelihood, with which every pixel in the image belongs to these classes.
Every pixel is than assigned into the class with the highest likelihood (ALBERTZ 2009,
RICHARDS & JIA 2006). The detected classes can be found in the results (chapter 3.1). Areas
sizes of Cropland, Grassland and Forest have been computed in ArcGIS.
2.3.3 Classification of the former state
For the detection of the areas of agricultural use in 1987 and 1989 only arable land
(Cropland) was classified. Two different methods were applied:
To detect these areas a supervised classification with focus on cropland was done first.
The classification was done as described in chapter 2.3.2 by generating signature files
from areas of interest without ground truth data but manual interpretation of the image
by the processor.
The second approach to detect Cropland was the calculation of the Normalized
Differenced Vegetation Index (NDVI). This index is the difference of the near infra red (NIR)
and the red band divided by their sum (NDVI = NIR-RED/NIR+RED) and points out areas

5
that have high reflectance in the near infra red (HUETE et al. 1997, NETZBAND et al. 2007).
The result is an image with values between zero and one (ALBERTZ 2009) where areas of
sparse to none vegetation correspond to lower values (MYNENI et al. 1995). By manual
checking of these values converting the result into a pseudocolour image the threshold of
the reflectance of cropland was observed. This was done by the known natural range
cover of acres and comparison of the result with the satellite image. Using the ‘Model
Maker’ in ErdasImage this pixel range was extracted to get just the areas used as
Cropland. Finally, the results of both methods were compared using ArcGIS. Areas, where
both methods classified pixels as Cropland, were signed as Cropland in 1987 respectively
1989. Sizes of the arable areas in the different years have been also computed in ArcGIS.
2.3.4 Accuracy assessment
For all classifications an accuracy assessment was done by generating stratified
random points for the classified images, using the accuracy assessment application in
Erdas Image. Per class 50 points were taken (CONGALTON 1991). The reference points were
digitized manual on screen. On this basis an error matrix was produced for each result
presenting the overall accuracy, the users and producers accuracy as well as the kappa
coefficient.
3 Results
Two different thematic maps for each test area have been produced: land use
classifications in 2009 and arable land use in 1987 (TA I) and 1989 (TA II). By combining
this data not ploughed grassland in 1987 (I) / 1989 (II) and 2009 was deduced. The
corresponding maps as well as the satellite images are added in the supplement (B, A).
For bigger maps (figures 2 & 4) see also the supplement (B).
3.1 Land use classification for 2009
For TA I seven and for TA II six land cover classes have been determined. Cropland,
Grassland, Forest, Water and Reeds have been carved out in both classifications (table 1,
figure 2). Further classes are
Roads and Settlement as well as
Unknown for TA I and Fens for
TA II.
Cropland is characterized as
bare ground which enfolds in
2009 29.61% of the whole area
in TA I and 41.25% in TA II. Grassland can include meadows, pastures and fallows and
covered in 2009 41.68% of TA I and 29.78% in TA II. Forest covers all kinds of woodland
vegetation, mostly birches as well as coniferous (predominantly pine). It accounts for
14.22% in the first test area in contrast to 19.09% in the second test area. The remaining
classes (TA I: Reeds, Roads and Settlement, Unknown, Water, TA II: Fens, Reeds, Water)
Table 1. Composition of land use in both test areas in 2009
Class TA I * [ha] % TA II * [ha] %
Cropland 11842.74 29.61 16501.59 41.25
Grassland 16670.34 41.68 11913.12 29.78
Forest 5689.89 14.22 7635.87 19.09
All other classes 5797.03 14.49 3949.42 9.87
* TA= Test area ≙ 40 000 ha

6
cover an area of 14.49% (TA I) and 9.87% (TA II). For TA I Roads and Settlement were also
classified. In the picture of TA II this class could not be outlined. Because of similar pixel
signatures as arable areas, sealed surface appears in the same class as Cropland. Trials
with taking signatures of Cropland and Roads and Settlement from a picture of another
date as well as from a layer stack of two different dates could not solve this problem.
There is one pixel group for TA I, marked in the classification as Unknown, that could not
be identified satisfactorily. At some points pixels of the class Roads and Settlement were
automatically classified incorrectly and put into this unknown class.
TA I TA II
Figure 2. Land cover classification of the test areas for 2009
In contrast to TA I, TA II contains a further class named Fens. Although there were no
ground-truth points for this class it could be identified because of its shape and by
comparison to topographic maps.
3.2 Arable land use in 1987 (TA I) / 1989 (TA II)
The two methods produced slightly differing results (table 2, figure 3). For TA I the
supervised classification brought out 18000.72 ha of Cropland in comparison to
17243.64 ha from the NDVI. That makes a difference of 1.89%. In TA II the NDVI
characterized with 13892.31 ha 2.6% more as Cropland than the supervised classification
with 12853.35 ha.
The NDVI shows in TA I a values margin from -0.06 to 0.13. TA II shows a range from -0.01
to 0.03. Beside the fact that the range of the NDVI which was identified as Cropland,
includes in TA II also some pixels from the class Reeds, interpretation of these values by
comparison with the results of the supervised classification and a consideration of the
7
satellite image as well as consulting the results of the accuracy assessment (see chapter
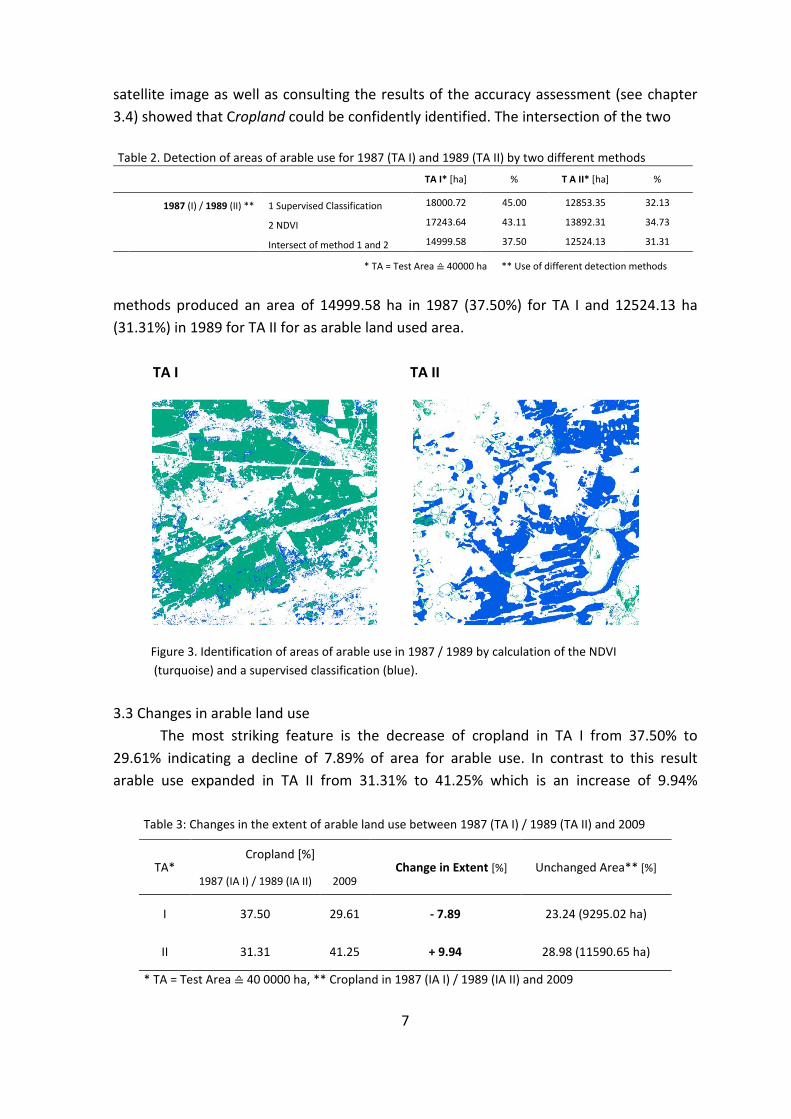
3.4) showed that Cropland could be confidently identified. The intersection of the two
methods produced an area of 14999.58 ha in 1987 (37.50%) for TA I and 12524.13 ha
(31.31%) in 1989 for TA II for as arable land used area.
TA I TA II
Figure 3. Identification of areas of arable use in 1987 / 1989 by calculation of the NDVI
(turquoise) and a supervised classification (blue).
3.3 Changes in arable land use
The most striking feature is the decrease of cropland in TA I from 37.50% to
29.61% indicating a decline of 7.89% of area for arable use. In contrast to this result
arable use expanded in TA II from 31.31% to 41.25% which is an increase of 9.94%
Table 2. Detection of areas of arable use for 1987 (TA I) and 1989 (TA II) by two different methods
TA I* [ha] % T A II* [ha] %
1987 (I) / 1989 (II) ** 1 Supervised Classification 18000.72 45.00 12853.35 32.13
2 NDVI 17243.64 43.11 13892.31 34.73
Intersect of method 1 and 2 14999.58 37.50 12524.13 31.31
* TA = Test Area ≙ 40000 ha ** Use of different detection methods
Table 3: Changes in the extent of arable land use between 1987 (TA I) / 1989 (TA II) and 2009
TA* Cropland [%]
Change in Extent [%] Unchanged Area** [%] 1987 (IA I) / 1989 (IA II) 2009
I 37.50 29.61 - 7.89 23.24 (9295.02 ha)
II 31.31 41.25 + 9.94 28.98 (11590.65 ha)
* TA = Test Area ≙ 40 0000 ha, ** Cropland in 1987 (IA I) / 1989 (IA II) and 2009

8
(table 3). Unchanged Area, which means the area that was used as Cropland in 1987
respectively 1989 and 2009, is with 11590.65 ha in TA II higher than in TA I with
9295.02 ha.
TA I TA II
Figure 4. Cropland in the test areas in 1987 / 1989 and 2009 (background: satellite image, false colour
composite NIR/R/GR (bands 4/3/2)
3.4 Accuracy assessment
The accuracy assessment shows clearly that all of the results fulfill an overall
accuracy higher than 85%. The classifications for the former state of the test areas
reached better results than the supervised classifications for 2009 (table 4).
For both test areas the overall accuracy of the NDVI calculation is three percentage points
below the supervised classification for 1987 (TA I) / 1989 (TA II) (table 4). All of the user’s
and producer’s accuracies for Cropland are within a range from 88.4% to 100.0% (table 5).
Table 4. Overall accuracy and kappa statistics of all classifications for the images of 1987 / 1989 and 2009
Method TA Overall Classification Accuracy [%] Overall Kappa Statistics
20
09
Supervised Classification I 89.4 0.85
II 90.7 0.87
19
87
(I)
/
19
89
(II
)
NDVI I 93.0 0.86
II 96.0 0.91
Supervised Classification I 95.0 0.81
II 98.0 0.95
9
All classifications for TA II reached better results than those for TA I. For more detailed
results of the accuracy assessment (error matrices, users accuracy and producers
accuracy of the other classes) see the supplement (D).
Table 5: Producers and Users accuracy of all classifications for the class Cropland in 1987 / 1989 and 2009
4 Discussion
4.1 Land use change
With its land policies and farm restructuring Russia underwent in the agricultural
sector after the breakdown of the Soviet Union in 1991 many changes, that had
consequences for the whole agrarian system (LERMAN et al. 2004). Previously funded by
subsidies, the agrarian sector then collapsed because of a deficient efficiency in
productivity hence the agricultural sector decreased after 1991 (LERMAN 2001).
This reorganization from a command to a free market economy led to farmland
abandonment. Huge areas between 20 and 30 million hectares of cropland were given up
(IOFFE 2005, IOFFE et al. 2008). IOFFE et al. cite in their work from 2008 the State Committee
for Statistics that Russian agriculture is 40% lower in 2008 than in 1990. FRÜHAUF (2011)
describes a decline in agricultural production between 1991 and 2000 of even 60%.
In the Tyumen Oblast the acreage of crops on farms of all categories decreased by 33.33%
during 18 years from 1607.5 ha in 1991 to 1071.7 ha in 2009. The decrease of the single
Rayons2 within the Oblast is varying from 30.5 % (Sladkowskii Rayon) to 52.38 %
(Sorokinskii Rayon) (THE TERRITORIAL OFFICE OF THE FEDERAL STATE STATISTICS SERVICE OF THE TYUMEN
REGION 1996, THE TERRITORIAL OFFICE OF THE FEDERAL STATE STATISTICS SERVICE OF THE TYUMEN
REGION a 2010). While the quality of soviet data often provides reasons to doubt (FISCHER
1992) Russian statistics after 1991 have been largely reliable (INOFFE 2005). This differing
numbers of decreases in acreage of crops within the Rayons already indicate that Russia’s
agricultural development can differ in different regions of the country.
The value of the decline of cultivated area in the whole Oblast is slightly lower than those
discussed in the literature for the entire country. The cited values are not transferable to
this study. Indeed, a decline in area of arable use is also illustrated in the first test area.
Here, the decrease of cultivated land appears to be quite low with 7.89% in contrast to
the numbers discussed before. In the second test area acreages of crops even increased
Method Reference
Totals
Classified
Totals
Number
Correct
Producers
Accuracy
[%]
Users
Accuracy
[%]
TA I
Supervised Classification for 2009 105 97 95 90.5 97.9
Supervised Classification for 1987 42 45 41 95.0 88.4
Calculation of the NDVI for 1987 40 43 38 95.0 88.4
TA II
Supervised Classification for 2009 110 113 110 100.0 97.4
Supervised Classification for 1989 34 32 32 94.1 100.0
Calculation of the NDVI for 1989 35 35 33 94.3 94.3

10
over a 20 year period by 9.94%. The results of this study indicate, that the decline of
agriculturally used areas might be in some regions not as high as previously assumed.
Obviously, acreage in the test areas that is not used as Cropland anymore, is still used as
Grassland. Indeed Cropland in TA I decreased but considering the proportion of the
classes in both classifications of 2009 areas used for agricultural purposes, either
intensive as Cropland or extensive as Grassland, remain the largest proportion of the area.
Both test areas are situated within the forest steppe belt, where with its fertile soils and
good climatic conditions huge areas of steppe have been ploughed in the 1950s (MEINEL
2002, WEIN 1999). WEIN (1999) entitles the cultivated area of Western Siberia to 17.5
million hectares, which underlines, even after the breakdown of the Soviet Union the
remaining, global importance of Western Siberia as an agricultural area. Moreover the
Tyumen region is one of the most profitable economical regions in the country (WEIN
1999). Both test areas are connected by a good network of transport routes to the
commercial centre of Western Siberia. The close distance to Tyumen as well as their
position within Russia’s agriculturally favored region can be the reason for the consistent
agricultural activities within the test areas.
Nevertheless there are differences in arable use between both test areas. Quite clear is
that fields are abandoned where soil quality is poorer in comparison to other locations. In
the first test area Cropland was given up predominately in areas with gley soils (COMMITTEE
FOR GEOGRAPHY AND CARTOGRAPHY OF THE MINISTRY FOR ECOLOGY AND RESOURCES OF THE RUSSIAN
FEDERATION 1992). Without draining these wet soils are not appropriate farmlands
(SCHEFFER & SCHACHTSCHABEL 2008). Furthermore Cropland was abandoned on black alkali
soils which are more difficult to cultivate than chernozems (SCHEFFER & SCHACHTSCHABEL
2008), on which the increase of areas of arable use in TA II occurred mainly (COMMITTEE
FOR GEOGRAPHY AND CARTOGRAPHY OF THE MINISTRY FOR ECOLOGY AND RESOURCES OF THE RUSSIAN
FEDERATION 1992).
These humus-rich soils belong to the most fertile grounds in the world (SCHEFFER &
SCHACHTSCHABEL 2008). Partly they are degraded (COMMITTEE FOR GEOGRAPHY AND CARTOGRAPHY
OF THE MINISTRY FOR ECOLOGY AND RESOURCES OF THE RUSSIAN FEDERATION 1992), but still with their
high content of humus are fertile locations (SCHEFFER & SCHACHTSCHABEL 2008, ZAMOTAEV
2002). Different soil qualities in the test areas can be one explanation for the divergent
trends in the study regions.
A further reason for the increase of Cropland in TA II can be a local established meat
factory, named ‘Plemzavod-Jubilei’ which ensures a demand for production here. In the
regions Ischim and Berdyuzhskom this company cultivates its own crops as barley, wheat,
peas and rapeseed. The bigger part of the harvest is processed into pig feed, the rest is
sold. For 2011 Plemzavod-Jubilei declares a harvest of 33000 tons on 35373 hectares of
arable land (PLEMZAVOD-JUBILEI 2011). This factory is also supported by governmental
subsidies (DEPARTMENT OF AGRICULTURE TYUMEN 2010) which boosts the economical structure
in the mentioned region. Also parameters like higher population and greater income in
2 Administrative
subdivision of Oblast
11
the agricultural sector in the region around TA II support this trend (THE TERRITORIAL OFFICE
OF THE FEDERAL STATE STATISTICS SERVICE OF THE TYUMEN REGION a 2010, THE TERRITORIAL OFFICE OF
THE FEDERAL STATE STATISTICS SERVICE OF THE TYUMEN REGION b 2010).
4.2 Classification
The results of image classifications are often insufficient (MARBLE & PEUQUET 1983).
Generating training classes can improve such results (ALBERTZ 2009, KRONBERG 1985). Thus,
the use of a supervised classification in this study to detect current and former land cover
has been generally a success. The results of the overall accuracy assessment are satisfying
with at least 89.4% (TA I, 2009). Furthermore Cropland, Grassland, Forest and Water show
also sufficient values in users and producers accuracy. The calculation of the NDVI for
identifying Cropland in 1987 and 1989 showed good results as well with values for overall
accuracy over 90%. Additionally, the low deviation of the two methods for detecting
former arable use indicates that these areas could be determined precisely. The overlap
of the values of the NDVI for Cropland with Reeds in TA II could be caused by the fact that
both classes contain bare ground surfaces which can explain same reflections.
Weaknesses of the classifications for 2009 are Roads and Settlements as well as Reeds for
both classifications. Here, users and producers accuracy do not offer satisfactory results.
In TA I there are some misclassifications between the classes Roads and Settlement and
Cropland. In TA II Cropland and Roads and Settlement could not be differentiated.
Identifying a class through a supervised classification depends on the spectral properties
of the training class (ALBERTZ 2009). Ideally each class has a significant spectral signature.
In reality this is not always the case. Thus, the same surface can appear different in
several locations and show different reflections (KRONBERG 1985). This can lead to the
mentioned misclassifications. Because of the small proportion of Roads and Settlements
of the whole landscape (approximately less than 2 %), the significance of the results of
the determined cropland is not affected.
The month of May turned out to be a good recording point for making out differences
between vegetation covered areas and non covered surfaces as cropland.
The differentiation within classes like Grassland into meadows, fallows and pastures,
Forest into different types of trees and Cropland into several crops was not an aim of this
study and would have been difficult with the number of collected ground truth data. To
get a more detailed separation of the classes for special research questions concerning
individual ecosystems there should be at least one reference surface for each subclass
(ALBERTZ 2009). Moreover a classification of one area from different acquisition dates
within a year could be very helpful to differentiate within classes. For crops with
characteristic seasonal changes, this is a common proceeding (ALBERTZ 2009).
However, the discrimination of riparian vegetation, areas with shrubs, wetlands, wet
grasslands, reeds and fens for the denotation as well as for the correct classification have
a need for further discussion. For summarizing these vegetation types, ‘herbaceous
wetland vegetation’ could be a suggestion. In context of monitoring land use changes a

12
further differentiation would be desirable. For a more specified description of these
classes a further collection of detailed ground truth data at points with these vegetation
types is recommended.
A weakness of the classification of 2009 in the first test area is the non successful
classification of a big cluster of the class Unknown. A big cluster of these signature can be
found in the northern part of the test area. The shape indicates that this is likely to be
used for agricultural purposes. It is possible that further investigations within the
subproject ‘Analysis and Monitoring of land cover and current land use change’ within the
SASCHA project can proof this assumption. Because of the small proportion of this class in
the entire landscape this result does not lead to a big reduction of the conclusions of this
study.
4.3 Conclusion
In this work, it has been proven, that the supervised classification of
multitemporal satellite images is an effective tool to quantify current land use as well as
to detect changes in an altering environment. With high accuracy land use within the test
areas could examined.
All in all the results of this study have shown, that the break-in of the agrarian production
in Russia after the breakdown of the Soviet Union, which is described in the literature, is
not that dramatic as assumed in the test areas. In between 20 years farmland declined in
the first test area, but not as much as the reported numbers in the literature.
Furthermore Cropland increased in the second area which suggests that Russia’s
agricultural development after the breakdown of the Soviet Union does not apply to all
regions in the Russian Federation. Land use differs in between different locations,
depending on conditions on the small scale (like soil quality and economical development)
in a particular region of the country.
For a better understanding of the impacts caused by political and economical
developments on land use further studies are necessary. Around 2000 the economical
situation in Russia has stabilized again (INOFFE et al. 2008). Also statistical data (from 2005
to 2009) show that acreage of crops increased again after that time (THE TERRITORIAL OFFICE
OF THE FEDERAL STATE STATISTICS SERVICE OF THE TYUMEN REGION a 2010).
To examine this development on scale of the test areas further investigations with images
from that time are desired. It would be also interesting to know if the decline of cropland
in TA II was constant between 1989 and 2009 or if an interim break-in of the agrarian
production after 1991 did also take place there.
To put the results of this study into a context of a higher landscape level it would be
useful to detect land use changes for the whole Tyumen Oblast. Further research on
these topics will be done within the module ‘Analysis and monitoring of land cover and
current land use change’ in the context of the framework of the SASCHA project.
13
Acknowledgements
I would like to thank Prof. Dr. Norbert Hölzel and Andreas Völker for their scientific mentoring
during my work progress. I am grateful to Prof. Dr. Andrei Tolstikov and Prof. Dr. Andrei Soromotin from the
Tyumen State University who supported me in organizational issues concerning my stay in Tyumen.
Research in Russia was carried out in co-operation with the Research Institute of Ecology and Natural
Resources Management of the Tyumen State University. Namely I would like to thank Dima Pislegin and
Evgeniy Melnikov for their assistance in technically questions.
Thank you to Alexandra Biscan, Georg Kaspar and Benedikt Peter for answering my questions concerning
image processing. For inspiring discussions about this work I am very grateful to Annemarie Krieger. Thank
you to Eva Maria Hoffmann and Lena Neuenkamp for their useful comments on this thesis and Sigrid
Sherrard for improving my English. Thank you to Julia Artarova and Anastasia Yakovleva for correcting my
Russian abstract.
Last but not least I am really grateful to my parents for their continuous support and belief in me –
Thank you.
References
ALBERTZ J (2009): Einführung in die Fernerkundung. Darmstadt
BONDEAU A, SMITH PC, ZAEHLE S, SCHAPHOFF S, LUCHT W, CRAMER W, GERTEN D, LOTZE-CAMPEN H,
MÜLLER C, REICHSTEIN M & B SMITH (2007): Modelling the role of agriculture for the
20th century global terrestrial carbon balance. Global Change Biology. Vol.13 (3):
697-706
COMMITTEE FOR GEOGRAPHY AND CARTOGRAPHY OF THE MINISTRY FOR ECOLOGY AND RESOURCES OF THE
RUSSIAN FEDERATION (1992): Soil maps of the Tyumen Oblast. Scale 1:300000.
Moscow (in Russian)
CONGALTON RG (1991): A review of assessing the Accuracy of Classifications of Remotely
Sensed Data. Remote Sensing of the Environment. Vol. 37: 35-46
DE BEURS KM, WRIGHT CK & GM HENEBRY (2009): Dual scale trend analysis for evaluating
climatic and anthropogenic effects on the vegetated land surface in Russia and
Kazakhstan. Environmental Research Letters. Vol. 4: 11p.
DE BEURS KM & GM HENEBRY (2003): Land surface phenology, climatic variation, and
institutional change: Analyzing agricultural land cover change in Kazakhstan.
Remote Sensing of Environment. Vol. 89: 497-509
DEPARTMENT OF AGRICULTURE OF THE TYUMEN REGION (2010): Execution for the costs of the
regional budget for agriculture. Tyumen (unpublished)
ERDAS (2010): ERDAS Field Guide. Classification. The Classification Process: 545-547.
Norcross
FISCHER S (1992): Russia and the Soviet Union. Then and now. NBER Conference on
Transition in Eastern Europe. In: EASTERLY AND FISCHER (1994): The Soviet Economic
Decline: Historical and Republican Data. Working Paper No. 4735. National Bureau
of Economic Research. Cambridge
FRÜHAUF, M (2011): Landnutzungs- und Ökosystementwicklung in den südsibirischen
Agrarsteppen. Geographische Rundschau. Vol. 1: 46-53
14
HUETE AR, LIU HQ, BATCHILY K & W VAN LEEUWEN (1997): A Comparison of Vegetation Indices
over a Global Set of TM Images for EOS-MODIS. Remote Sensing of Environment.
Vol. 59 (3): 440-451
HÖLZEL N, HAUB C, INGELFINGER MP, OTTE A & VN PILIPENKO (2002): The return of the steppe –
large-scale restoration of degraded land in southern Russia during the post-Soviet
era. Journal for Nature Conservation. Vol.10: 75-85
IOFFE G (2005): The Downsizing of Russian Agriculture. Europe-Asia Studies. Vol. 57: 179-
208
IOFFE G, NEFEDOVA T & I ZASLAVSLY (2008): From Spatial Continuity to Fragmentation: The
Case of Russian Farming. Annals of the Association of American Geographers. Vol.
94: 913-943
JENSEN JR (2007): Remote Sensing of the Environment: An Earth Resource Perspective.
Upper Saddle River
KLÜTER H (1992): Russland und die Auflösung der Sowjetunion - Ursachen und Folgen aus
wirtschaftsgeographischer Sicht / Russia and the Collapse of the Soviet Union.
Causes and Consequences from an Economic-Geographic Point of View.
Geographische Zeitschrift. Vol. 80 (1): 20-38
KORONOVSKY N (2002): Tectonics and Geology. In: SHAHGEDANOVA M (Ed.): The Physical
Geography of Northern Eurasia. New York
KREMENETSKI KV, VELICHKI, BORISOVA OK, MACDONALD GM, SMITH LC, FREY KE & LA ORLOVA
(2003): Peatlands of the Western Siberian lowlands: current knowledge on
zonation, carbon content and Late Quaternary history. Quaternary Science
Reviews. Vol. 22: 703–723
KRONBERG P (1985): Fernerkundung der Erde. Stuttgart
KUEMMERLE T, OLOFSSON P, CHASKOVSKYY O, BAUMANN M, OSTAPOWICZ O, WOODCOCK CE,
HOUGHTON RA, HOSTERT P, KEETIN WS & VC RADELOFF (2011): Post-Soviet farmland
abandonment, forest recovery, and carbon sequestration in western Ukraine.
Global Change Biology. Vol.17: 1335–1349
KURGANOVA IN, KUDEYAROV VN & VO LOPES DE GERENYU (2010): Updated estimate of carbon
balance on Russian territory. Tellus. Vol. 62 B: 497–505
LAMBIN EF, BAULIES X, BOCKSTAEL N, FISCHER G, KRUG T, LEEMANS R, MORAN EF,. RINDFUSS RR, SATO
Y, SKOLE D, TURNER II BL & C VOGEL (2000): Land-Use and Land-Cover Change (LUCC).
Implementation Strategy. A core project of the International Geosphere-Biosphere
Programme and the International Human Dimensions Programme on Global
Environmental Change Prepared. IGBP Report 48. IHDP Report 10. Stockholm,
Bonn
LEHRMANN Z (2001): Agriculture in transition economies: from common heritage to
divergence. Agricultural Economics. Vol.26: 95-114
LERMAN Z, CSAKA C & G FEDER (2004): Agriculture in Transition. Land Policies and Evolving
Farm Structures in Post-Soviet Countries. Maryland
LILLESAND TM & RW KIEFER (1994): Remote Sensing and Image Interpretation. New York
15
MADDOCK N (1995): Agriculture after socialism. The transformation and development of
Lithuanian agriculture. Food Policy. Vol. 20 (2): 129-137
MARBLE DF & DJ PEUQUET (1983): Geographic information systems and remote sensing. In:
COLWELL RN (1983): Manual of remote sensing. Virginia
MEINEL HT (2002): Die geoökologischen Folgewirkungen der Steppenumbrüche in den 50er
Jahren in Westsibirien. Ein Beitrag für zukünftige Nutzungskonzepte unter
besonderer Berücksichtigung der Winderosion. Dissertation. Halle (Saale)
MYNENI RB, HALL FG, SELLERS PJ & AL MARSHAK (1995): The Interpretation of Spectral
Vegetation Indexes. IEEE Transactions on Geoscience and Remote Sensing. Vol. 33:
481–486
NETZBAND M, STEFANOV WL & C REDMAN (Eds.) (2007): Glossary. Applied Remote Sensing for
Urban Planning, Governance and Sustainability. Berlin, Heidelberg
PIELKE SR RA, ADEGOKE JO, CHASE TN, CH MARSHALL, MATUSI T & D NIYOGI (2007): A new
paradigm for assessing the role of agriculture in the climate system and in climate
change. Agricultural and Forest Meteorology. Vol. 142: 234–254
PLEMZAVOD-JUBILEI (2011): Crops. Online: http://www.ishimpzu.ru/content/3 (accessed on
23.02.12) (in Russian)
RICHARDS JA & X JIA (2006): Remote Sensing Digital Image Analysis. An Introduction. Berlin,
Heidelberg
RUSSIAN FEDERAL SERVICE FOR HYDROMETEROLOGY AND ENVIRONMENTAL MONITORING (no date):
Weather Information for Tjumen. In: World Meteorological Organization. Online:
http://worldweather.wmo.int/107/c01001.htm (accessed on 12.04.2012)
SASCHA PROJECT (2011): Sustainable land management and adaptation strategies to climate
change for the Western Siberian corn-belt. Online: http://www.unimuenster.de/
SASCHA/en/ index.html (accessed on 11.02.2012)
SCHEFFER F & P SCHACHTSCHABEL (2002): Lehrbuch der Bodenkunde. Berlin, Heidelberg
SCHULTZ J (2002): The Ecozones of the World. The Ecological Divisions of the Geosphere.
Stuttgart
SHAHGEDANOVA M (2002): Climate at Present and in the Historical Past. In: SHAHGEDANOVA M
(Ed.): The Physical Geography of Northern Eurasia. New York
SHENG Y, LAURENCE C, SMITH GM, MACDONALD K, KREMENETSKI V, FREY KE, VELICHKO AA, LEE M,
Beilmann DW & P Dubinin (2004): A high-resolution GIS-based inventory of the
west Siberian peat carbon pool. Global Biochemical cycles. Vol. 18. GB 3004: 14p.
SMOLENTSEVA E, LASHCHINSKY N, BABENKO A & P. BARSUKOV (2002): Guide-book of the annual
Soil-Ecological Excursion across Western Siberia. Novosibirsk
THE TERRITORIAL OFFICE OF THE FEDERAL STATE STATISTICS SERVICE OF THE TYUMEN REGION (1996):
Agriculture in the Tyumen region (1991-1996). Statistical Yearbook. Tyumen (in
Russian)
THE TERRITORIAL OFFICE OF THE FEDERAL STATE STATISTICS SERVICE OF THE TYUMEN REGION a (2010):
Agriculture in the Tyumen region (2005-2009). Statistical Yearbook. Tyumen (in
Russian)

16
THE TERRITORIAL OFFICE OF THE FEDERAL STATE STATISTICS SERVICE OF THE TYUMEN REGION b (2010):
Demography (2006-2010). Statistical Yearbook. Tyumen (in Russian)
TILMANN D (2001): Forecasting Agriculturally Driven Global Environmental Change. Science.
Vol. 292: 281-284
TURNER BL (1994): Local Faces, Global Flows: The Role of Land Use and Land Cover in
Environmental Change. Land Degradation and Rehabilitation. Vol. 5. 71-78
USGS (2009): Landsat Product Type Descriptions. Online: http://edcsns17.cr.usgs.gov/
helpdocs/landsat/product_descriptions.html#terrain_l5_l1t (accessed on 01.03.12)
VOLKOV IA, VN OLIUNIN (1993): West Siberia Introduction in VELICHKO, AA (Ed.): Evolution of
Environment and Climate in Northern Eurasia Part 1. Regional paleogeography.
Nauka. Moscow. In: KREMENETSKI KV; VELICHKI, BORISOVA OK, MACDONALD GM, SMITH
LC, FREY KE & LA ORLOVA (2003): Peatlands of the Western Siberian lowlands:
current knowledge on zonation, carbon content and Late Quaternary history.
Quaternary Science Reviews. Vol. 22: 703–723
WEGREN SK (2011): The Development of Agrarian Capitalism in Post-Soviet Russia. Journal
of Agrarian Change. Vol. 11 (2): 138–163
WEIN N (1999): Sibirien. Perthes Regionalprofile. Geographische Strukturen,
Entwicklungen, Probleme. Gotha
ZAMOTAEV I (2002): Soils. In: SHAHGEDANOVA M (Ed.): The Physical Geography of Northern
Eurasia. New York
Supplement
A Test areas
B Maps
C Overview - area sizes (of detected classes)
D Results of the accuracy assessment
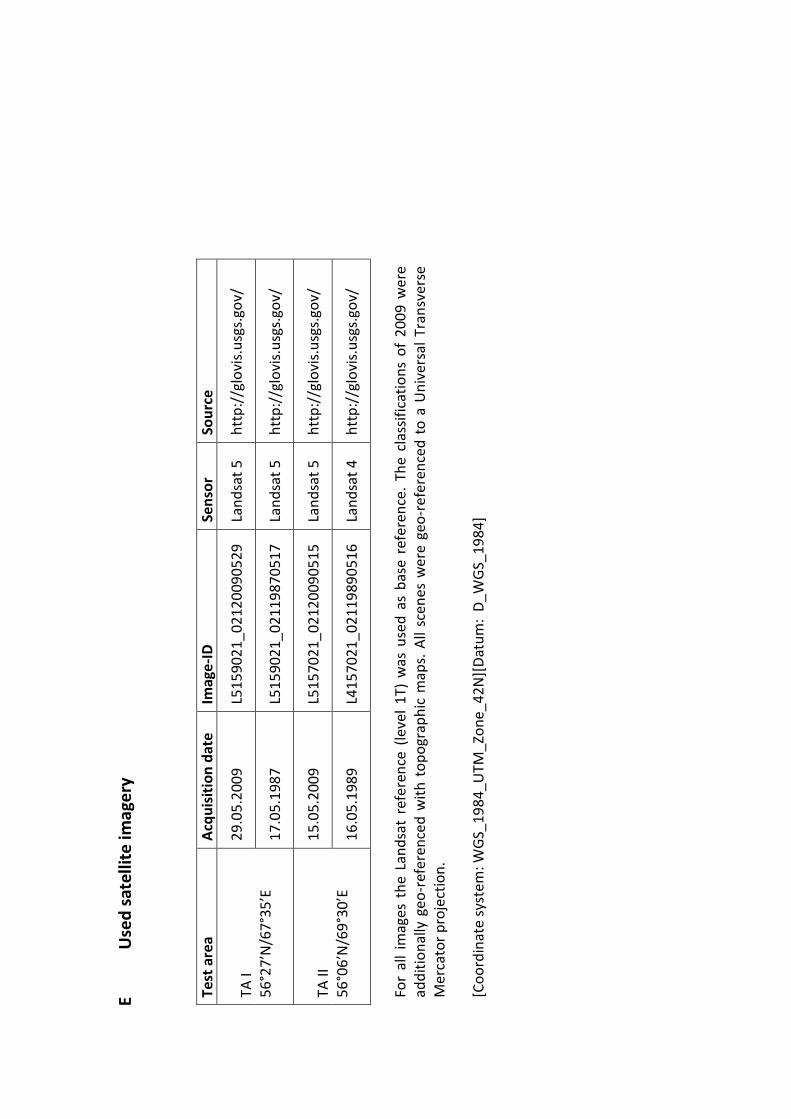
E Used satellite imagery
F CD – Contents
V
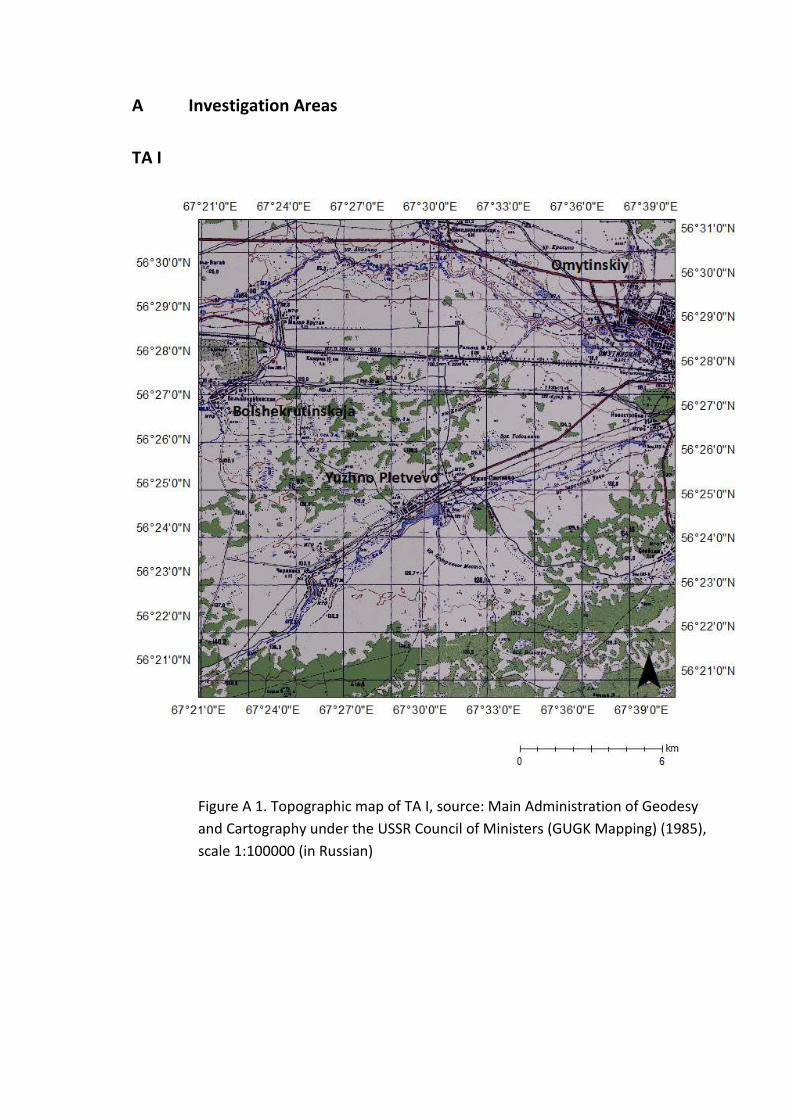
A Investigation Areas
TA I
Figure A 1. Topographic map of TA I, source: Main Administration of Geodesy
and Cartography under the USSR Council of Ministers (GUGK Mapping) (1985),
scale 1:100000 (in Russian)
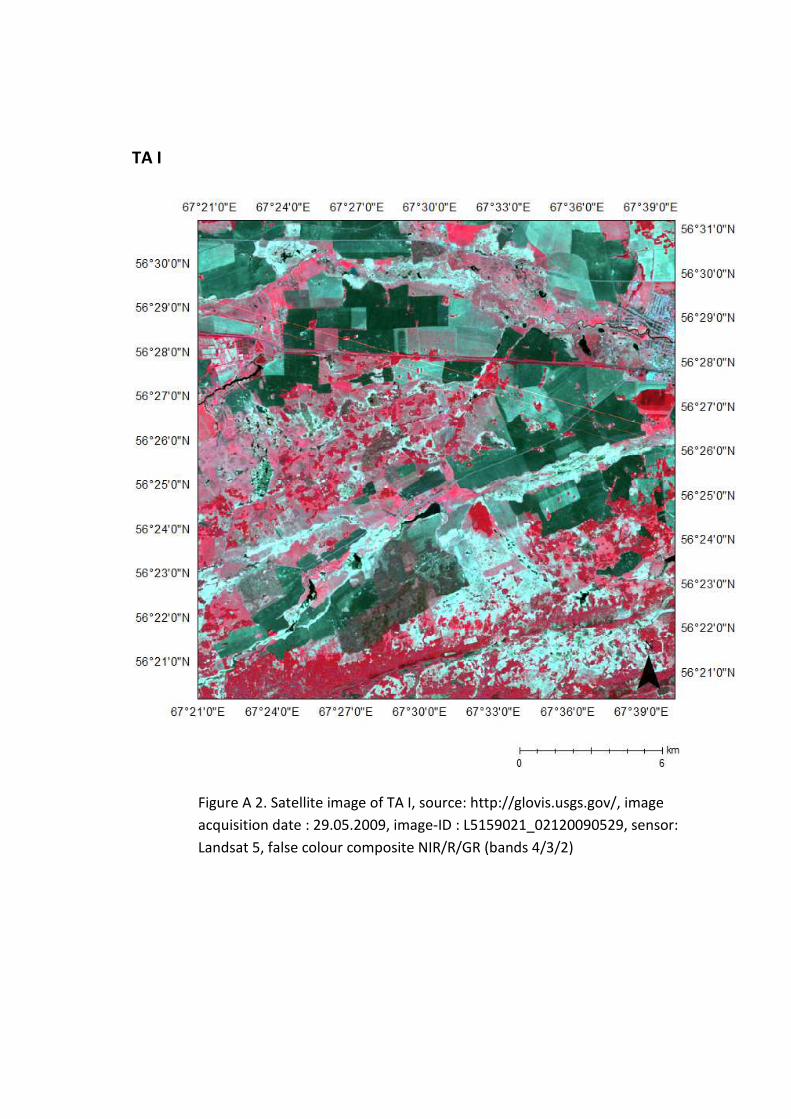
TA I
Figure A 2. Satellite image of TA I, source: http://glovis.usgs.gov/, image
acquisition date : 29.05.2009, image-ID : L5159021_02120090529, sensor:
Landsat 5, false colour composite NIR/R/GR (bands 4/3/2)
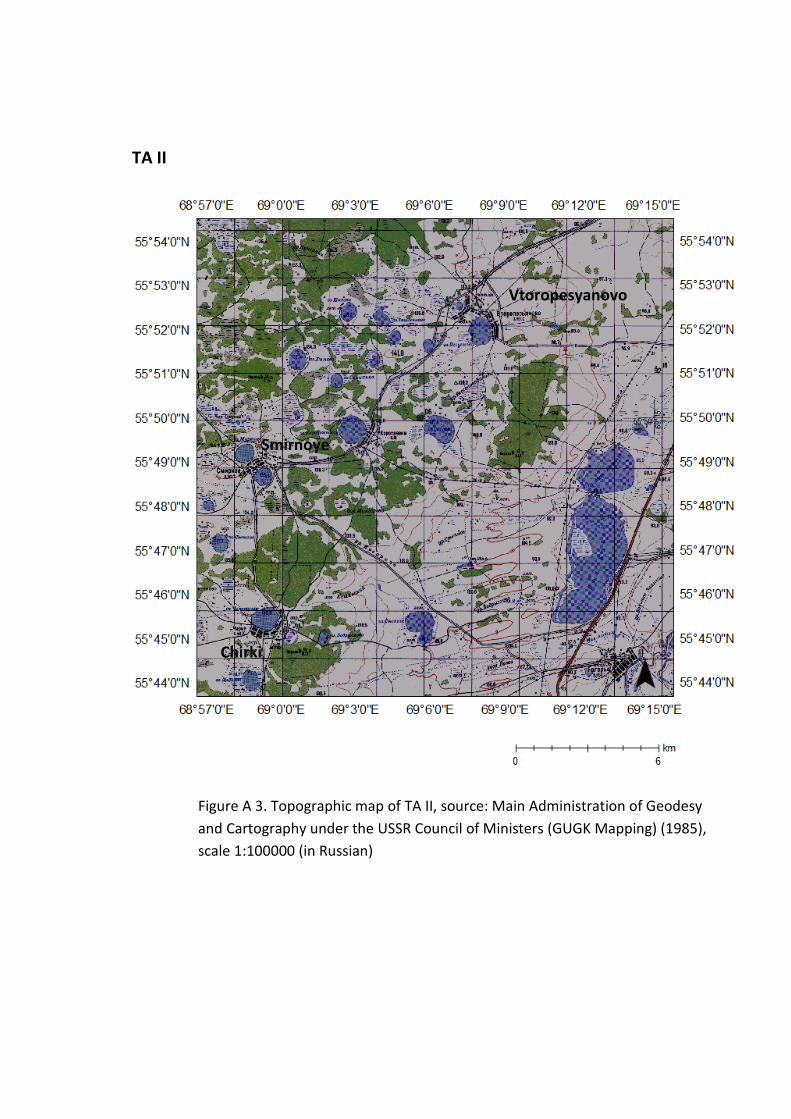
TA II
Figure A 3. Topographic map of TA II, source: Main Administration of Geodesy
and Cartography under the USSR Council of Ministers (GUGK Mapping) (1985),
scale 1:100000 (in Russian)
Chirki
Smirnoye
Vtoropesyanovo
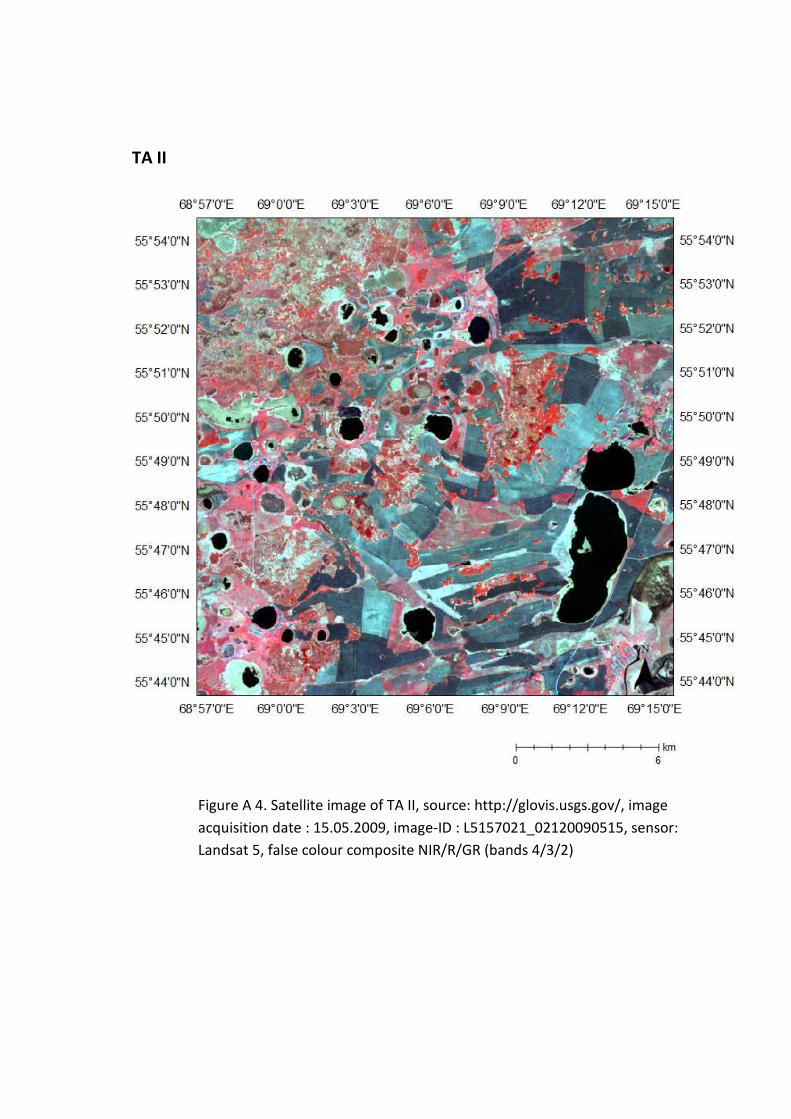
TA II
Figure A 4. Satellite image of TA II, source: http://glovis.usgs.gov/, image
acquisition date : 15.05.2009, image-ID : L5157021_02120090515, sensor:
Landsat 5, false colour composite NIR/R/GR (bands 4/3/2)

B Maps
TA I
Figure B 1. Land use classification for 2009

TA I
Figure B 2. Agricultural land use between 1987 and 2009, background: satellite image,
false colour composite NIR/R/GR (bands 4/3/2)
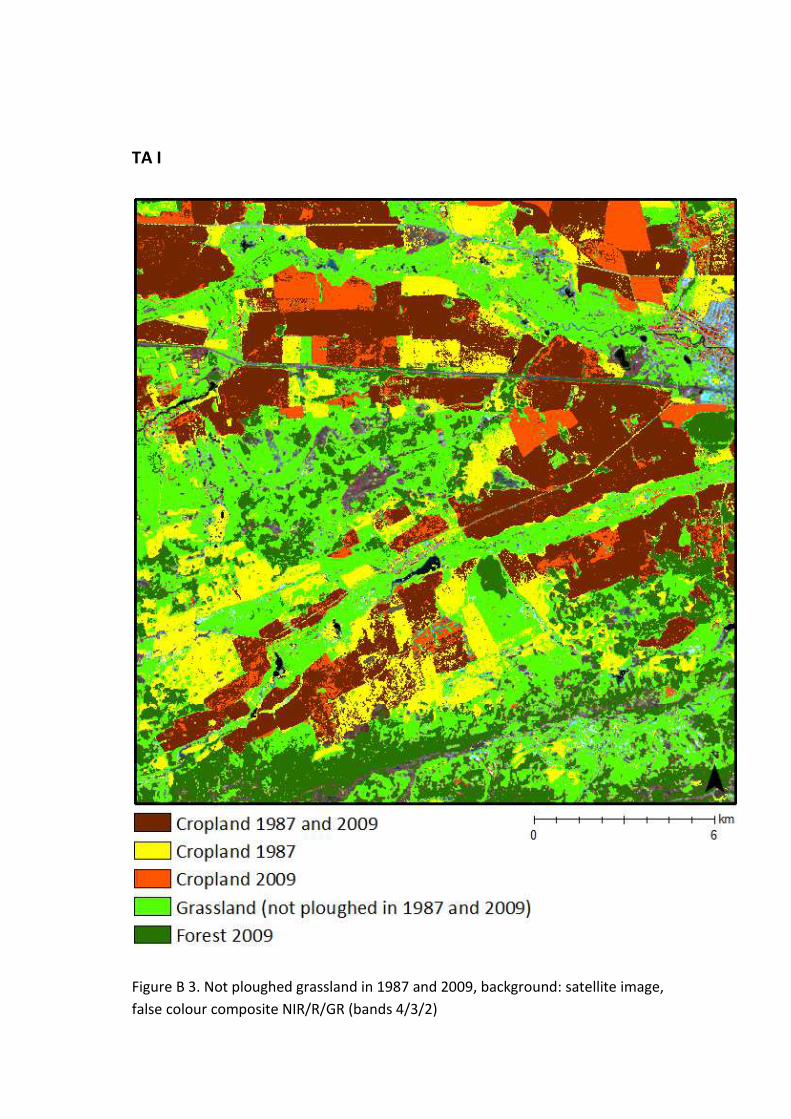
TA I
Figure B 3. Not ploughed grassland in 1987 and 2009, background: satellite image,
false colour composite NIR/R/GR (bands 4/3/2)
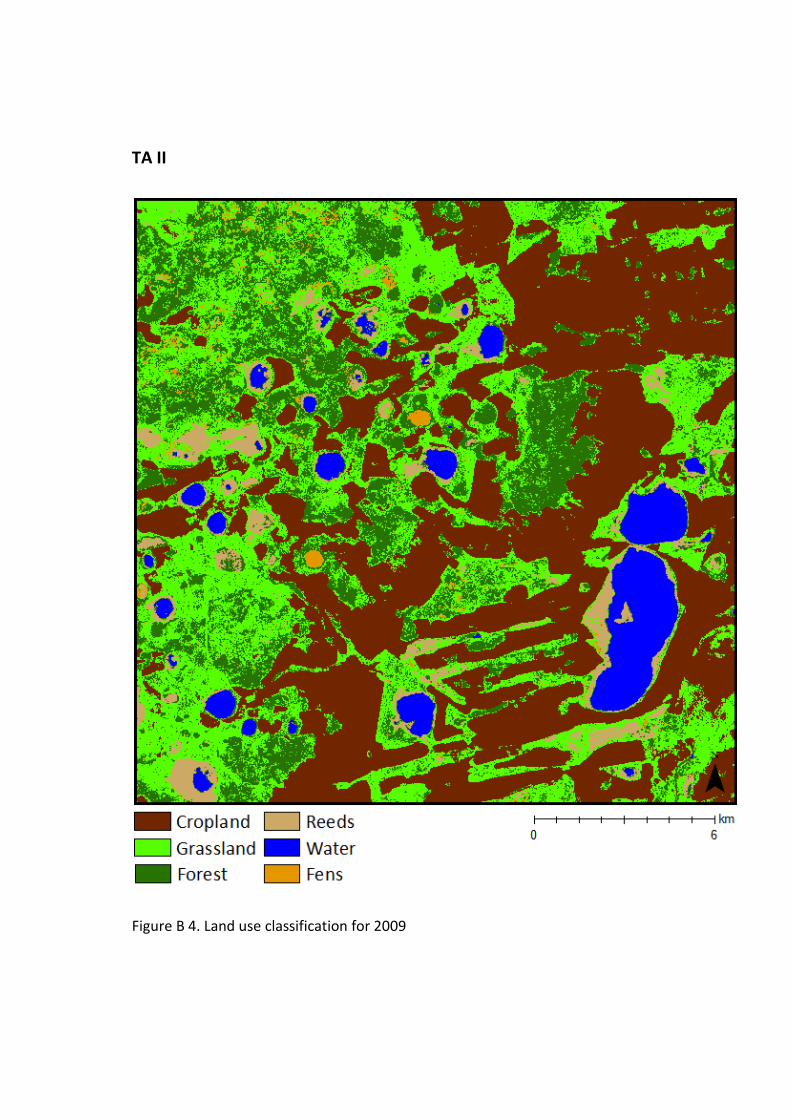
TA II
Figure B 4. Land use classification for 2009
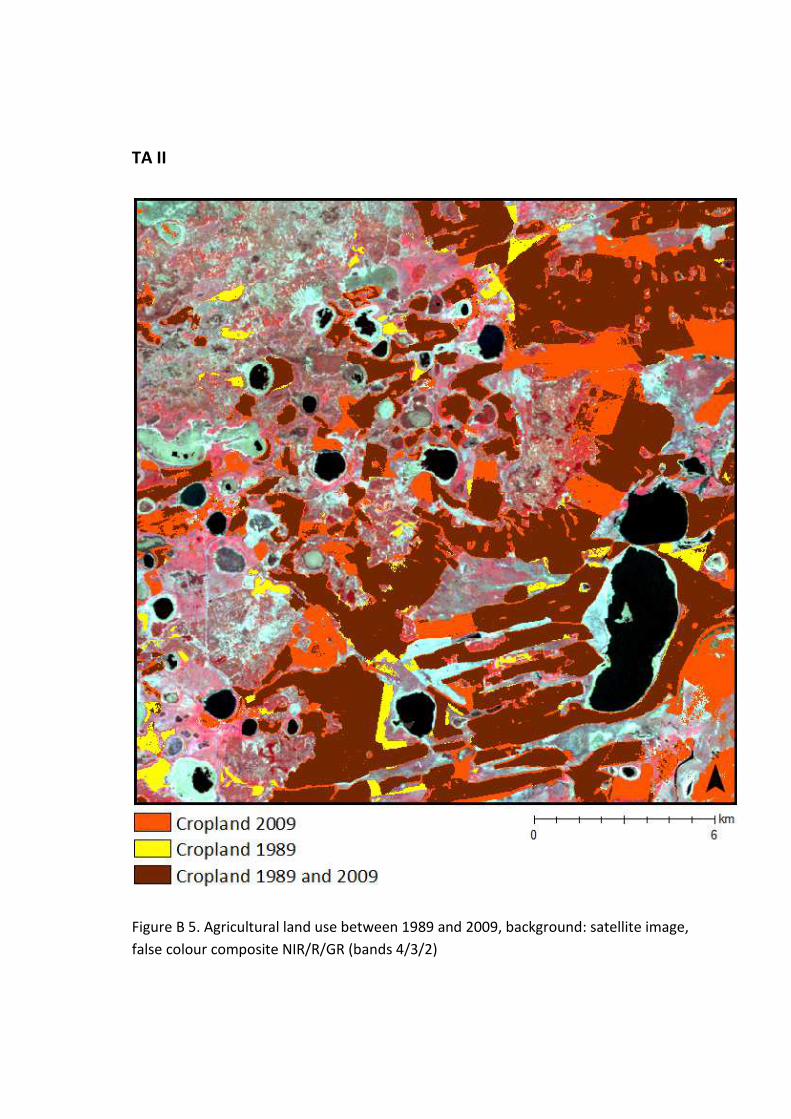
TA II
Figure B 5. Agricultural land use between 1989 and 2009, background: satellite image,
false colour composite NIR/R/GR (bands 4/3/2)
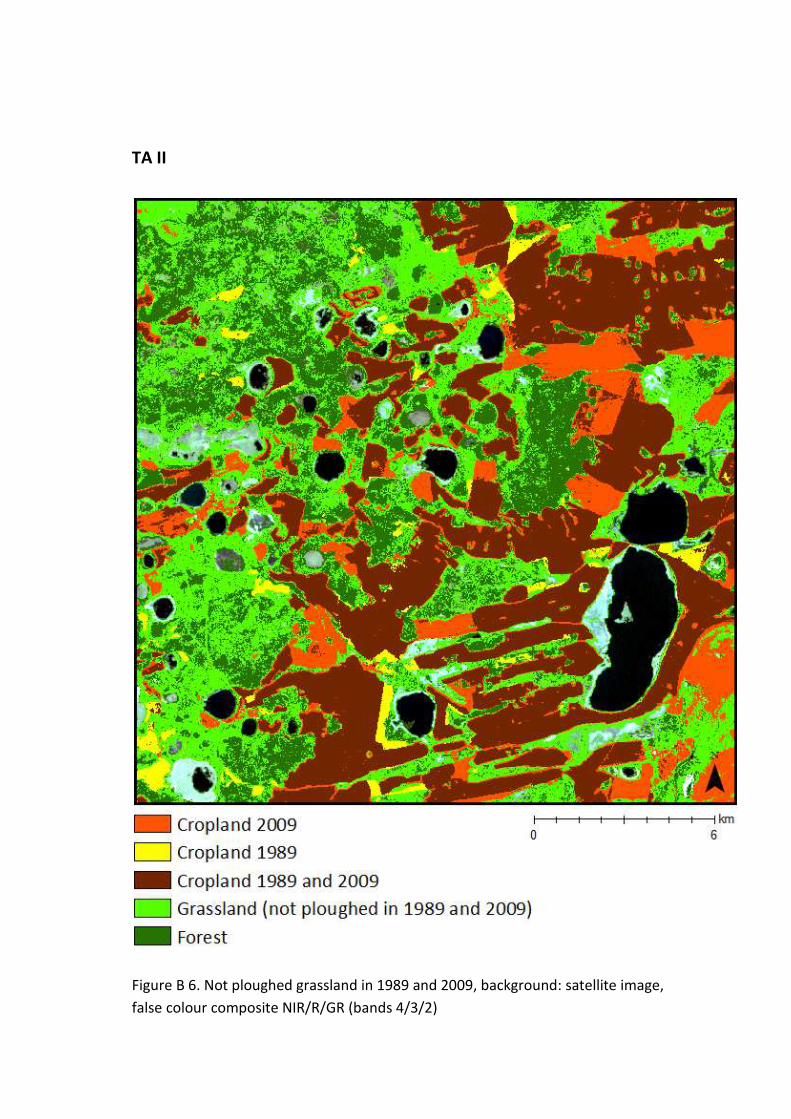
TA II
Figure B 6. Not ploughed grassland in 1989 and 2009, background: satellite image,
false colour composite NIR/R/GR (bands 4/3/2)

C
Ov
erv
iew
- a
rea
siz
es
(of
de
tect
ed
cla
sse
s)
T
ab
le E
1.
Are
a s
ize
s o
f C
rop
lan
d i
n 1
98
7 (
TA
I)
/ 1
98
9 (
TA
II)
an
d C
rop
lan
d,
Un
cha
ng
ed
Are
a,
Gra
ssla
nd
an
d F
ore
st in
20
09
T
A I
[h
a]
%
T A
II
[ha
] %
Cropland
20
09
11
84
2.7
4
29
.61
1
65
01
.59
4
1.2
5
19
87
(T
A I
) /
19
89
(T
A I
I) *
1 S
up
erv
ise
d C
lass
ific
ati
on
1
80
00
.72
4
5.0
0
12
85
3.3
5
32
.13
2 N
DV
I 1
72
43
.64
4
3.1
1
13
89
2.3
1
34
.73
Inte
rse
ct o
f m
eth
od
1 a
nd
2
14
99
9.5
8
37
.50
1
25
24
.13
3
1.3
1
Un
cha
ng
ed
Are
a
(be
twe
en
19
87
/89
an
d 2
00
9)
92
95
.02
2
3.2
4
11
59
0.6
5
28
.98
Others
Gra
ssla
nd
20
09
16
67
0.3
4
41
.68
1
19
13
.12
2
9.7
8
Fo
rest
20
09
56
89
.89
1
4.2
2
76
35
.87
1
9.0
9
*
Use
of
dif
fere
nt
de
tect
ion
me
tho
ds
**
TA
= T
est
are
a ≙
40
00
0 h
a

D Results of the accuracy assessment
TA I Supervised maximum likelihood classification 2009
Table D 1. Results of the accuracy assessment for the supervised classification for 2009
Class Reference
Totals
Classified
Totals
Number
Correct
Producers
Accuracy [%]
Users
Accuracy [%]
Cropland 105 97 95 90.5 97.9
Forest 50 50 48 96.0 96.0
Grassland 151 133 130 86.1 97.7
Reeds 9 11 9 60.0 81.8
Roads and Settlement 15 32 15 100.0 46.9
Unknown 10 17 6 60.0 35.3
Water 10 10 10 100.0 100.0
Totals 350 350 313
Overall classification accuracy = 89.43%
Table D 2. Error matrix of the accuracy assessment for the supervised classification for 2009
Table D 3. Kappa statistics of the accuracy assessment
for the supervised classification for 2009
Class Kappa
Cropland 0.97
Forest 0.95
Grassland 0.96
Reeds 0.81
Roads and Settlement 0.45
Unknown 0.33
Water 1.00
Overall kappa statistics = 0.8543
Class Cropland Forest Grassland Reeds Roads and
Settlement Unknown Water Total
Cropland 95 1 0 0 0 1 0 97
Forest 1 48 1 0 0 0 0 50
Grassland 2 1 130 0 0 0 0 133
Reeds 0 0 2 9 0 0 0 11
Roads and
Settlement 2 0 12 0 15 3 0 32
Unknown 5 0 6 0 0 6 0 17
Water 0 0 0 0 0 0 10 10
Total 105 50 151 9 15 10 10 350
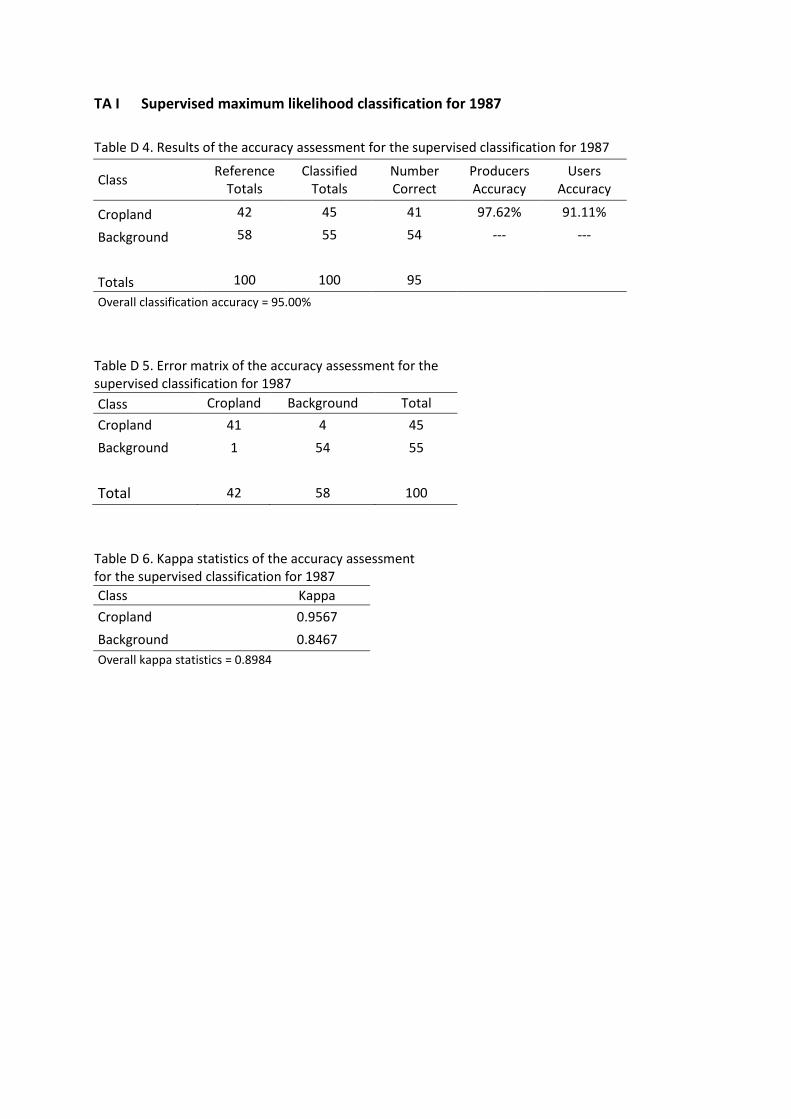
TA I Supervised maximum likelihood classification for 1987
Table D 4. Results of the accuracy assessment for the supervised classification for 1987
Class Reference
Totals
Classified
Totals
Number
Correct
Producers
Accuracy
Users
Accuracy
Cropland 42 45 41 97.62% 91.11%
Background 58 55 54 --- ---
Totals 100 100 95
Overall classification accuracy = 95.00%
Table D 5. Error matrix of the accuracy assessment for the
supervised classification for 1987
Class Cropland Background Total
Cropland 41 4 45
Background 1 54 55
Total 42 58 100
Table D 6. Kappa statistics of the accuracy assessment
for the supervised classification for 1987
Class Kappa
Cropland 0.9567
Background 0.8467
Overall kappa statistics = 0.8984

TA I Calculation of the NDVI for 1987
Table D 7. Results of the accuracy assessment for the calculation of the NDVI for 1987
Class Reference
Totals
Classified
Totals
Number
Correct
Producers
Accuracy
Users
Accuracy
Cropland 40 43 38 95.00% 88.37%
Background 60 57 55 --- ---
Totals 100 100 93
Overall classification accuracy = 93.00%
Table D 8. Error matrix of the accuracy assessment for the
calculation of the NDVI for 1987
Class Cropland Background Total
Cropland 38 5 43
Background 2 55 57
Total 40 60 100
Table D 9. Kappa statistics of the accuracy assessment
for the calculation of the NDVI for 1987
Class Kappa
Cropland 0.9123
Background 0.8062
Overall kappa statistics = 0.8560
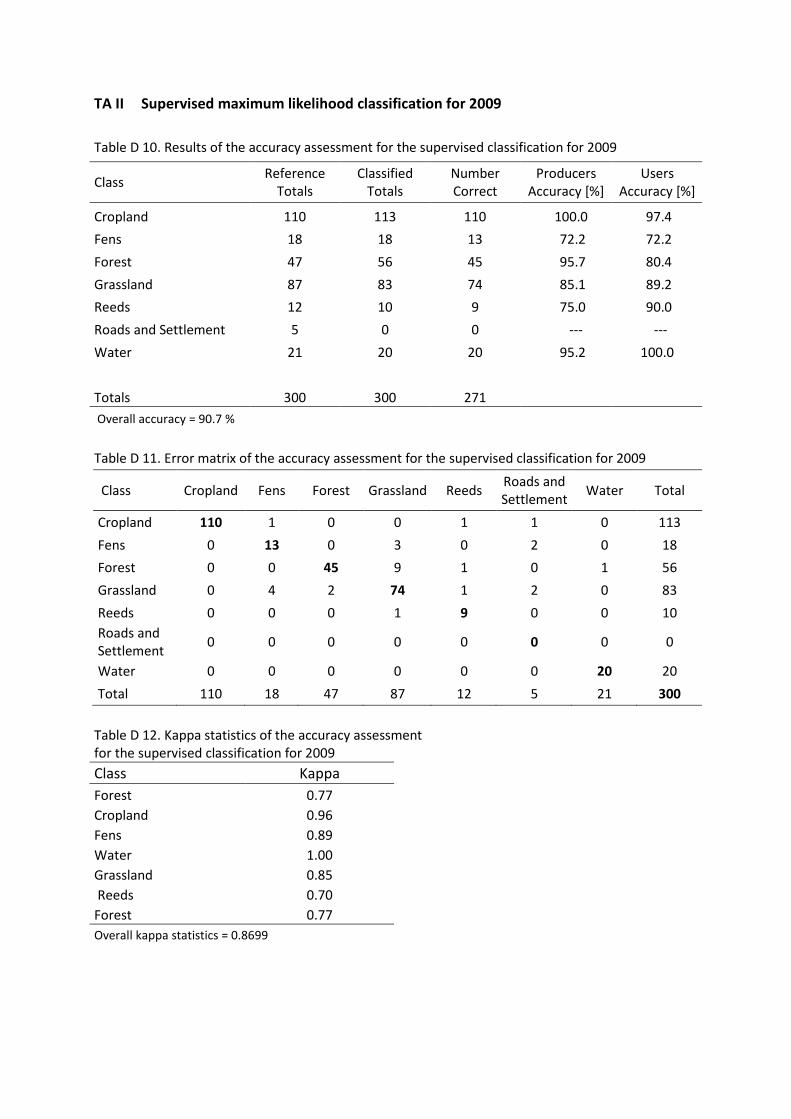
TA II Supervised maximum likelihood classification for 2009
Table D 10. Results of the accuracy assessment for the supervised classification for 2009
Table D 11. Error matrix of the accuracy assessment for the supervised classification for 2009
Class Cropland Fens Forest Grassland Reeds Roads and
Settlement Water Total
Cropland 110 1 0 0 1 1 0 113
Fens 0 13 0 3 0 2 0 18
Forest 0 0 45 9 1 0 1 56
Grassland 0 4 2 74 1 2 0 83
Reeds 0 0 0 1 9 0 0 10
Roads and
Settlement 0 0 0 0 0 0 0 0
Water 0 0 0 0 0 0 20 20
Total 110 18 47 87 12 5 21 300
Table D 12. Kappa statistics of the accuracy assessment
for the supervised classification for 2009
Class Kappa
Forest 0.77
Cropland 0.96
Fens 0.89
Water 1.00
Grassland 0.85
Reeds 0.70
Forest 0.77
Overall kappa statistics = 0.8699
Class Reference
Totals
Classified
Totals
Number
Correct
Producers
Accuracy [%]
Users
Accuracy [%]
Cropland 110 113 110 100.0 97.4
Fens 18 18 13 72.2 72.2
Forest 47 56 45 95.7 80.4
Grassland 87 83 74 85.1 89.2
Reeds 12 10 9 75.0 90.0
Roads and Settlement 5 0 0 --- ---
Water 21 20 20 95.2 100.0
Totals 300 300 271
Overall accuracy = 90.7 %

TA II Supervised maximum likelihood classification for 1989
Table D 13. Results of the accuracy assessment for the supervised classification for 1989
Class Reference
Totals
Classified
Totals
Number
Correct
Producers
Accuracy
Users
Accuracy
Cropland 34 32 32 94.12% 100.00%
Background 66 68 66 --- ---
Totals 100 100 98
Overall classification accuracy = 98.00%
Table D 14. Error matrix of the accuracy assessment for the
supervised classification for 1989
Class Cropland Background Total
Cropland 32 0 32
Background 2 66 68
Total 34 66 100
Table D 15. Kappa statistics of the accuracy assessment
for the supervised classification for 1989
Class Kappa
Cropland 0.9135
Background 1.000
Overall kappa statistics = 0.8984
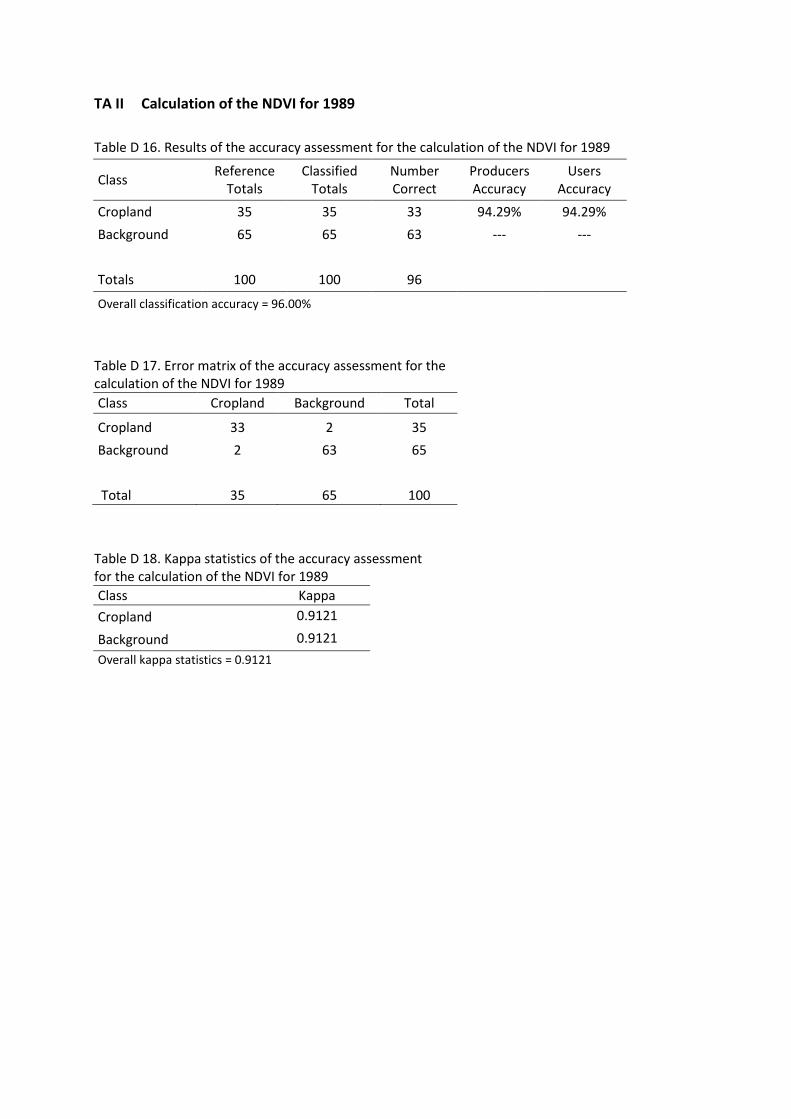
TA II Calculation of the NDVI for 1989
Table D 16. Results of the accuracy assessment for the calculation of the NDVI for 1989
Class Reference
Totals
Classified
Totals
Number
Correct
Producers
Accuracy
Users
Accuracy
Cropland 35 35 33 94.29% 94.29%
Background 65 65 63 --- ---
Totals 100 100 96
Overall classification accuracy = 96.00%
Table D 17. Error matrix of the accuracy assessment for the
calculation of the NDVI for 1989
Class Cropland Background Total
Cropland 33 2 35
Background 2 63 65
Total 35 65 100
Table D 18. Kappa statistics of the accuracy assessment
for the calculation of the NDVI for 1989
Class Kappa
Cropland 0.9121
Background 0.9121
Overall kappa statistics = 0.9121
E
Use
d s
ate
llit
e i
ma
ge
ry
Te
st a
rea
A
cqu
isit
ion
da
te
Ima
ge
-ID
S
en
sor
So
urc
e
TA
I
56
°27
’N/6
7°3
5’E
29
.05
.20
09
L5
15
90
21
_0
21
20
09
05
29
La
nd
sat
5
htt
p:/
/glo
vis
.usg
s.g
ov/
17
.05
.19
87
L5
15
90
21
_0
21
19
87
05
17
La
nd
sat
5
htt
p:/
/glo
vis
.usg
s.g
ov/
TA
II
56
°06
’N/6
9°3
0’E
15
.05
.20
09
L5
15
70
21
_0
21
20
09
05
15
La
nd
sat
5
htt
p:/
/glo
vis
.usg
s.g
ov/
16
.05
.19
89
L4
15
70
21
_0
21
19
89
05
16
La
nd
sat
4
htt
p:/
/glo
vis
.usg
s.g
ov/
Fo
r a
ll i
ma
ge
s th
e L
an
dsa
t re
fere
nce
(le
ve
l 1
T)
wa
s u
sed
as
ba
se r
efe
ren
ce.
Th
e c
lass
ific
ati
on
s o
f 2
00
9 w
ere
ad
dit
ion
ally g
eo
-re
fere
nce
d w
ith
to
po
gra
ph
ic m
ap
s. A
ll s
cen
es
we
re g
eo
-re
fere
nce
d t
o a
Un
ive
rsa
l T
ran
sve
rse
Me
rca
tor
pro
ject
ion
.
[Co
ord
ina
te s
yst
em
: W
GS
_1
98
4_
UT
M_
Zo
ne
_4
2N
][D
atu
m:
D_
WG
S_
19
84
]
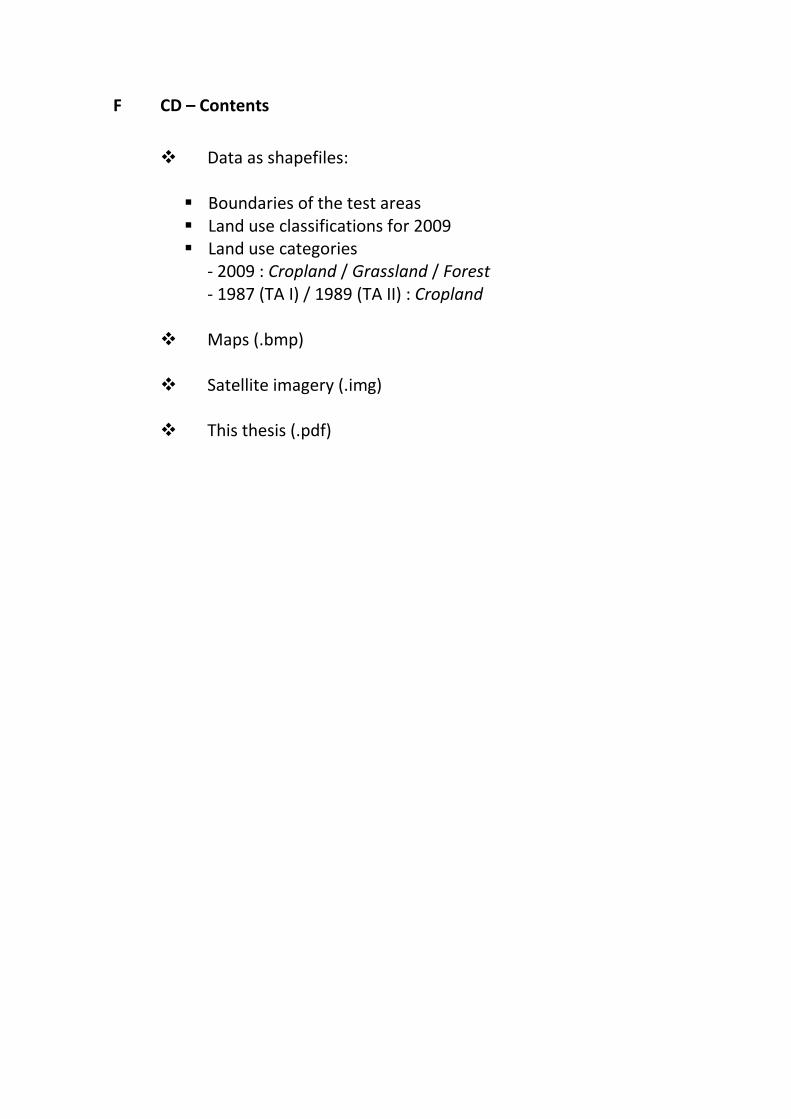
F CD – Contents
� Data as shapefiles:
� Boundaries of the test areas
� Land use classifications for 2009
� Land use categories
- 2009 : Cropland / Grassland / Forest
- 1987 (TA I) / 1989 (TA II) : Cropland
� Maps (.bmp)
� Satellite imagery (.img)
� This thesis (.pdf)

Affidavit
I hereby assert that this master thesis with the title ‘Supervised Classification and Change
Detection of Agricultural Land Use in the Forest Steppe Zone of West Siberia Using
Multitemporal Satellite Imagery’ is written by myself and that I did not use any other than
the declared resources. All parts which are literally and logically taken from external
sources within this work are marked as being external. Each figure or table without
denoted source is created by myself.
Münster, 24th
of April in 2012