Embed Size (px)
Citation preview
Ann. Geophys., 27, 591–600, 2009www.ann-geophys.net/27/591/2009/© Author(s) 2009. This work is distributed underthe Creative Commons Attribution 3.0 License.
AnnalesGeophysicae
Superposed epoch analysis of the ionospheric convection evolutionduring substorms: onset latitude dependence
A. Grocott1, J. A. Wild 2, S. E. Milan1, and T. K. Yeoman1
1Department of Physics and Astronomy, University of Leicester, University Road, Leicester, LE1 7RH, UK2Department of Communication Systems, InfoLab21, Lancaster University, Lancaster, LA1 4WA, UK
Received: 18 August 2008 – Revised: 6 January 2009 – Accepted: 13 January 2009 – Published: 6 February 2009
Abstract. Using data from the Super Dual Auroral RadarNetwork (SuperDARN) we investigate the ionospheric con-vection response to magnetospheric substorms. Substormswere identified using the Far Ultraviolet (FUV) instrumenton board the Imager for Magnetopause-to-Aurora Global Ex-ploration (IMAGE) spacecraft, and were then binned accord-ing to the magnetic latitude of their onset. A superposedepoch analysis of the ionospheric convection patterns foreach onset-latitude bin was then performed using radar datafor the interval 60 min before onset to 90 min after. It isfound that lower onset-latitude substorms are associated withgenerally more enhanced convection than the higher latitudesubstorms, although they suffer from a significant localisedreduction of the flow in the midnight sector during the expan-sion phase. Higher-latitude substorms are associated with asignificant and rapid increase in the nightside convection fol-lowing substorm onset, with all onset-latitude bins showingan enhancement over onset values by∼60 min into the ex-pansion phase. A rudimentary inspection of the concurrentauroral evolution suggests that the duration of the flow reduc-tion following substorm onset is dependent on the strengthand duration of the expansion phase aurora and its associatedconductivity enhancement.
Keywords. Ionosphere (Auroral ionosphere; Plasma con-vection) – Magnetospheric physics (Storms and substorms)
Correspondence to:A. Grocott([email protected])
1 Introduction
Magnetospheric substorms are understood to be one of theprimary mechanisms by which the Earth’s magnetotail ridsitself of stored magnetic flux and energy that are accumu-lated through the action of reconnection with the interplane-tary magnetic field. Whilst the exact time sequence of eventswhich surrounds the onset of magnetospheric substorms isstill under debate, it has recently been suggested that sub-storms are initiated by near-Earth reconnection in the magne-totail (Angelopoulos et al., 2008), which pinches off closedmagnetic flux and then closes open magnetic flux, excitingmagnetospheric convection (e.g.Baker et al., 1996). Withina few minutes a disruption of the cross-tail current is also ob-served in the inner magnetosphere, leading to the creation ofthe substorm current wedge (e.g.Lui, 1996) and an associ-ated ionospheric auroral disturbance (Akasofu, 1964). Therehave been mixed reports, however, regarding the nature of theionospheric convection that accompanies this disturbance.We address this issue in the present paper.
It was suggested byCowley et al.(1998) that reconnec-tion during substorms should excite large-scale twin-vortexflow in the high-latitude ionosphere. In an early study ofSondrestrom radar data,Blanchard et al.(1997) found thatan increase in the tail reconnection rate occurs near midnightshortly after substorm expansion phase onset. Initially, how-ever, this increase was mainly manifest in a poleward mo-tion of the inferred open-closed field line boundary with theflows becoming elevated only after an interval of∼30 min.Somewhat correspondingly,Weimer(1999) presented a sta-tistical survey of low-altitude electric field data from the DE-2 spacecraft, separated according to the IMF direction andinto substorm and non-substorm intervals. The flow patternsfor a given IMF orientation showed a more pronounced “Ha-rang” asymmetry on the nightside during substorm intervals
Published by Copernicus Publications on behalf of the European Geosciences Union.
592 A. Grocott et al.: Ionospheric convection during substorms
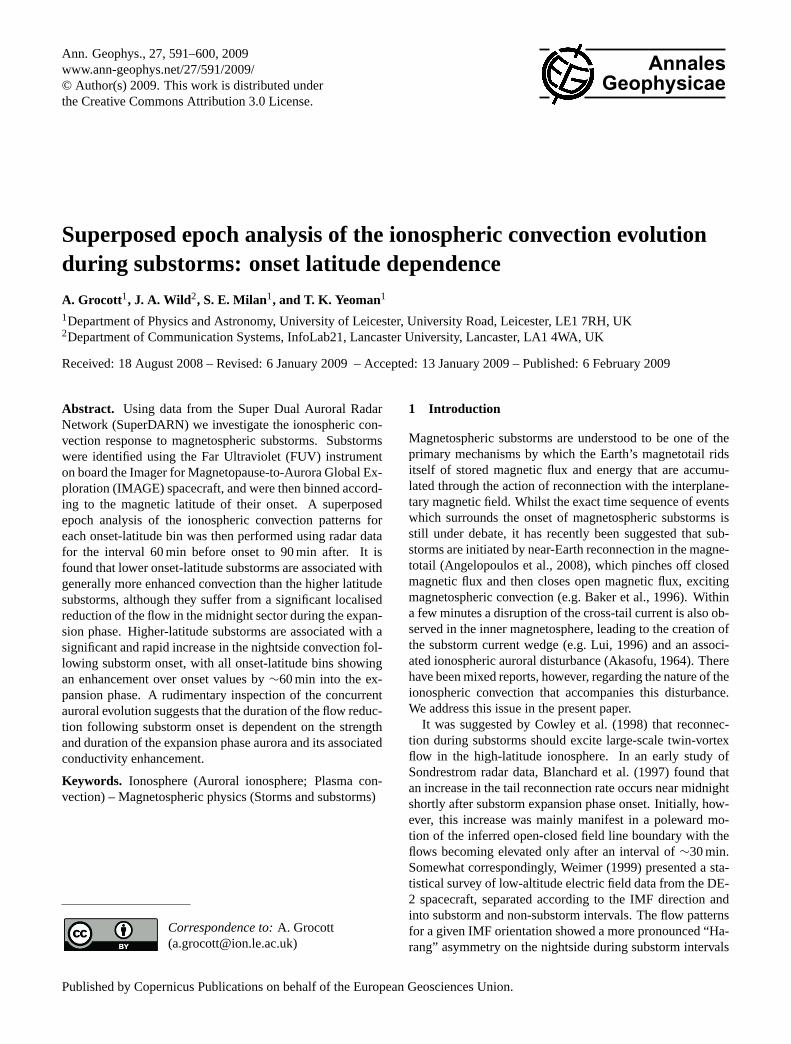
Fig. 1. The locations of Northern Hemisphere isolated substorm on-sets, observed by the FUV instrument on-board the IMAGE satel-lite, presented in magnetic latitude – magnetic local time coordi-nates. The occurrence of substorms within each latitude – localtime bin is colour coded according to the scale at the bottom.
than during non-substorm intervals, but the total transpolarvoltage values showed little overall difference. On the otherhand,Opgenoorth and Pellinen(1998) presented evidencefor flow enhancements in the dusk auroral zone immediatelyfollowing expansion phase onset in the midnight sector, lead-ing to an immediate increase in the global “directly driven”current system. They suggest, however, that diversion of thetwin-vortex flow around the low-flow high-conductivity au-roral bulge formed during the expansion phase (e.g.Morelliet al., 1995; Yeoman et al., 2000) may play a role. Morerecently,Grocott et al.(2002) presented an analysis of Su-per Dual Auroral Radar Network (SuperDARN) flow dataobtained during an isolated substorm, and found evidencefor the excitation of twin-vortex flow cells centred in thenightside ionosphere, which enhance the transpolar voltageby ∼40 kV compared with pre-onset values. Further studiesusing SuperDARN have produced mixed results, however,by providing evidence for both the excitation (e.g.Grocottet al., 2006; Provan et al., 2004) and reduction (e.g.Lyonset al., 2001; Bristow and Jensen, 2007) of the flows follow-ing substorm onset.
Using theFrey et al.(2004) substorm databaseMilan et al.(2009) performed a superposed epoch analysis of the auroralevolution of substorms. They found that the auroral mor-phology was only reproducible in an average sense if sub-storms were grouped according to onset magnetic latitude,due largely to the fact that substorm intensity is intrinsicallylinked to the pre-existing open flux content of the polar cap.In the present paper we therefore use a similar latitude group-ing to produce a set of average substorm convection patternsfor each onset-latitude group. These patterns are obtained for
the interval from 60 min before, to 90 min after, each of the1979 isolated Northern Hemisphere substorms in the Freylist, using the radar data set discussed byWild and Grocott(2008). We find that there is a clear difference in the iono-spheric convection response to substorms of differing onsetlatitudes. Higher-latitude substorms are associated with asignificant and prompt increase in the nightside convectionfollowing onset, whereas lower-latitude substorms appear tobe associated with an initial decrease in the nightside flows,with a delay of up to∼60 min before any enhancement isobserved.
2 Data analysis
Using the FUV instrument (Mende et al., 2000a,b) on the IM-AGE spacecraftFrey et al.(2004) identified 2437 substormsoccurring between May 2000 and December 2002, subse-quently extending this number to 4193 after considering the5-year period up to December 2005.Wild and Grocott(2008)refined this list to 3005 isolated events (by excluding thoseknown to have occurred within±2 h of another substorm),1979 of which were observed in the Northern Hemisphere.The onset locations of these 1979 events (see Fig.1) havea mean magnetic latitude of 66◦ and a mean magnetic localtime (MLT) of 23 h. For the purposes of the present study wehave grouped these events into 10 magnetic latitude bins: be-low 61◦, 61–62◦. . . , 68–69◦, and above 69◦. For each eventwe define a “substorm epoch” as being an interval of timerunning from 60 min before, to 90 min after, the onset timeof the substorm.
Ionospheric flow data for each substorm epoch are pro-vided by the Super Dual Auroral Radar Network (Super-DARN). The SuperDARN network of HF radars providesalmost continuous measurements of ionospheric convectionvelocities in the auroral regions of the Northern and SouthernHemispheres (Greenwald et al., 1995; Chisham et al., 2007)and this facilitates the routine production of large scale mapsof the high-latitude convection using the “Map Potential”technique (Ruohoniemi and Baker, 1998). This techniqueinvolves the mapping of line-of-sight radar velocity measure-ments onto an equal area polar grid and using them to derivea best-fit solution to annth-order expansion of the electro-static potential, expressed in spherical harmonics. An inves-tigation into the sensitivity of the choice ofn on the resultsof the present study revealed that a relatively low sixth orderexpansion was suitable for resolving the larger-scale charac-ter of the convection pattern. A boundary defining the zeropotential at the equatorward edge of the convection patternis also determined from the radar data to help constrain thesolution at lower latitudes.
Two methods of investigating the average substorm con-vection have been adopted for this study. The first methodprovides a means by which we can investigate the best-fit av-erage large-scale convection patterns and involves using the
Ann. Geophys., 27, 591–600, 2009 www.ann-geophys.net/27/591/2009/
A. Grocott et al.: Ionospheric convection during substorms 593
Map Potential “gridded” radar data files generated byWildand Grocott(2008) to derive superposed epoch convectionpatterns for the ten onset-latitude bins. This is achieved bycombining the gridded radar data from all of the substormepochs in each of the ten onset-latitude bins into ten super-posed substorm epochs and then performing the Map Poten-tial fit on each one. The maximum number of substorms inany one onset-latitude bin is 305, however, owing to dataprocessing limitations we restricted the number of substormepochs combined in any one Map Potential fit to 150. Wherean onset-latitude bin contained more than 150 substorms arandom sample of 150 was used. Having performed the anal-ysis on a number of different random samples we can confirmthat little difference is evident in the large-scale nature of thepatterns.
It is also necessary to manually specify the magnetic lat-itude of the zero-potential boundary,30, for these averageconvection maps. In the Map Potential analysis, this bound-ary is set to be the lowest latitude at which a significantnumber of flow vectors above a specified velocity thresholdare observed. For the usual “individual-epoch” analysis thisis usually set to be 3 flow vectors above 100 m s−1, whichis generally sufficient to exclude any noise and interferencewhich might otherwise mislead the algorithm and force it toset the boundary too low. When adding such a large volumeof radar data together however, as is the case for the super-posed epoch analysis, this technique generally fails. We havetherefore specified the boundary to be the mean of the bound-aries identified at each time step for all of the individual sub-storm epochs. Whilst this might not necessarily be the bestchoice in each individual case, it is an objective and con-sistent method across all times and onset-latitude bins andmakes direct comparisons between different convection pat-terns straightforward.
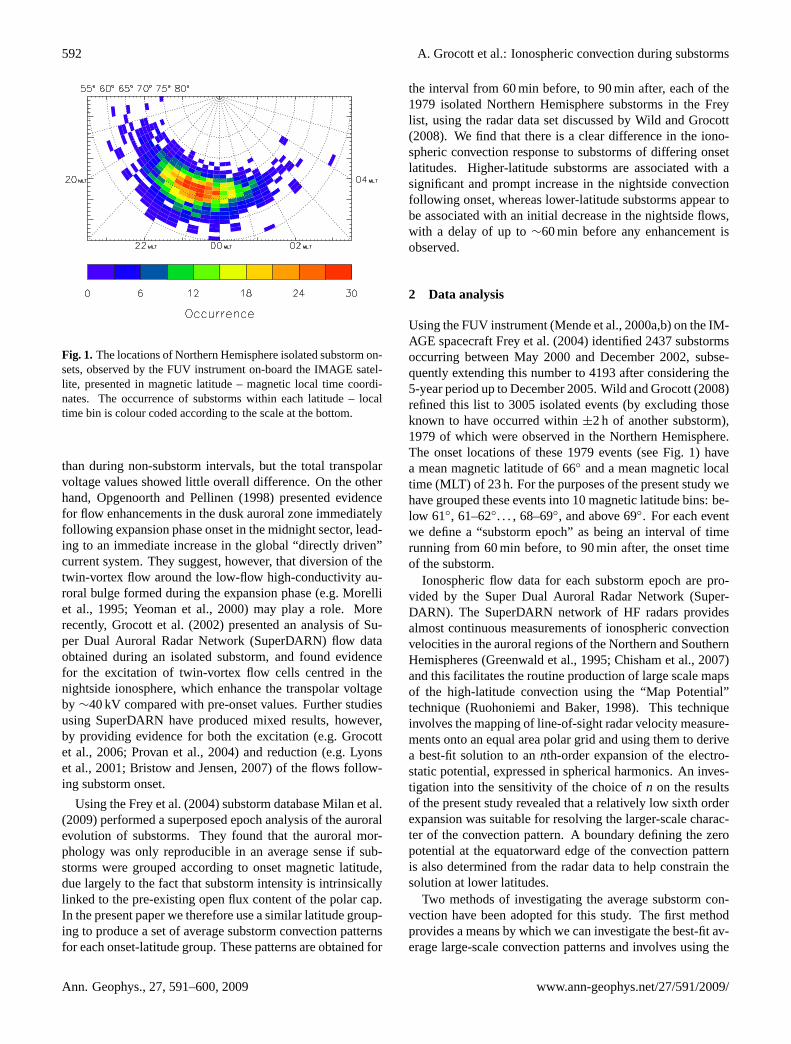
The second method we have used to investigate the aver-age convection involves using a statistical database of iono-spheric convection data to study the average nightside flowsin a more localised manner. This database has been createdto facilitate studies involving large volumes of SuperDARNdata and consists of a reduced set of 40 velocity measure-ments (and associated data coverage information) for every2 min interval between 1999 and 2006. These measurementsare derived for the centre points of a set of boxes, the loca-tions of which are fixed in magnetic local time but are scaledin magnetic latitude according to the overall size of the con-vection pattern, as shown in Fig.2. In other words, the lowestlatitude boxes are located just poleward of the zero-potentialboundary of the convection pattern,30, (the green curve inFig. 2), with a further three sets of boxes at latitudes evenlydistributed between the first set and the pole. By fixing thelatitude of these boxes relative to30, similar statistical pointscorrespond to the same region of the convection pattern ineach case rather than simply the same magnetic latitude/localtime. The boxes themselves delimit the area in which “lo-cal” data coverage is defined. In the present study we have
Fig. 2. The locations of the statistical data points used in the reducedSuperDARN database, plotted on a polar grid in magnetic local time– magnetic latitude coordinates with noon to the top and dusk tothe left. The data points are located at the centre of the red boxeswhich themselves delimit the area in which local data coverage isdefined. The latitudes of the boxes is shown on an arbitrary scale,being dependent on the location of the zero potential boundary,30,(shown in green) in each case. Data from the shaded boxes arediscusses in the text.
imposed a condition that there must be at least 2 radar datapoints in a box for the corresponding velocity value to beused. This does mean that the number of events contributingto the velocity averages is not the same for each time step(overall it results in between 30% and 50% of the substormsbeing included in the averaging for each onset-latitude bin)but it ensures that the velocity averages from each substormcorrespond to regions of the convection patterns where radardata were present to constrain the fitting. In Sect.3.2 wepresent data from the boxes which are shaded in Fig.2.
3 Observations
3.1 Large-scale convection
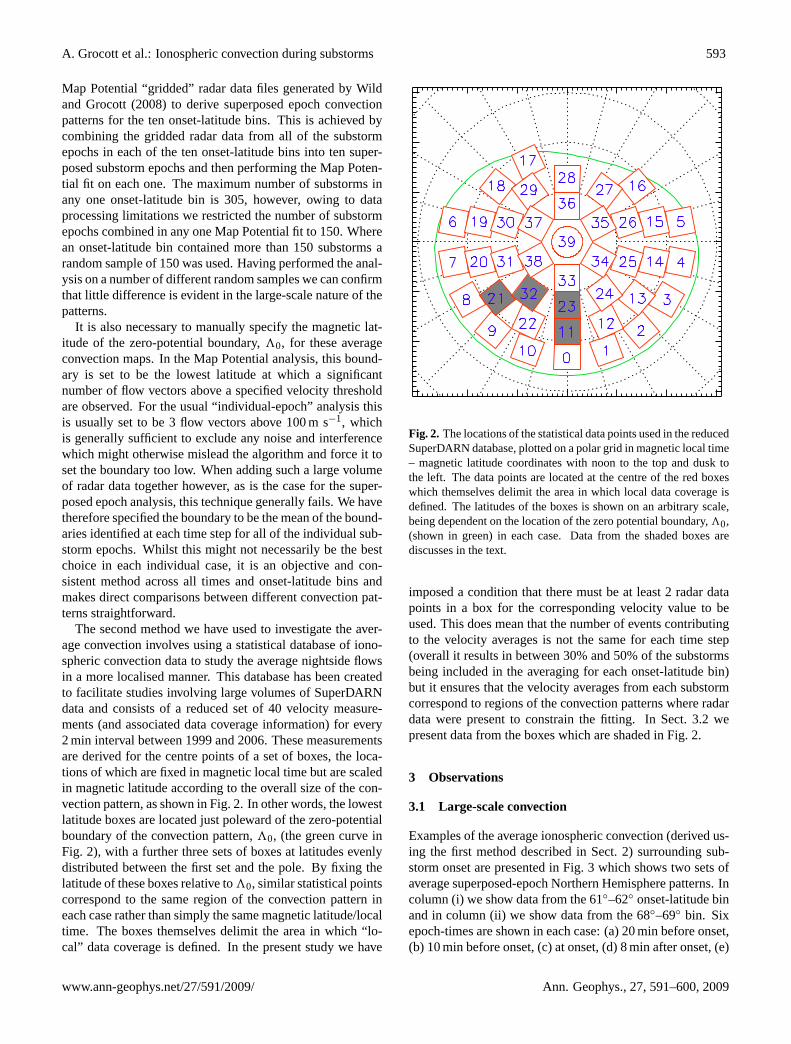
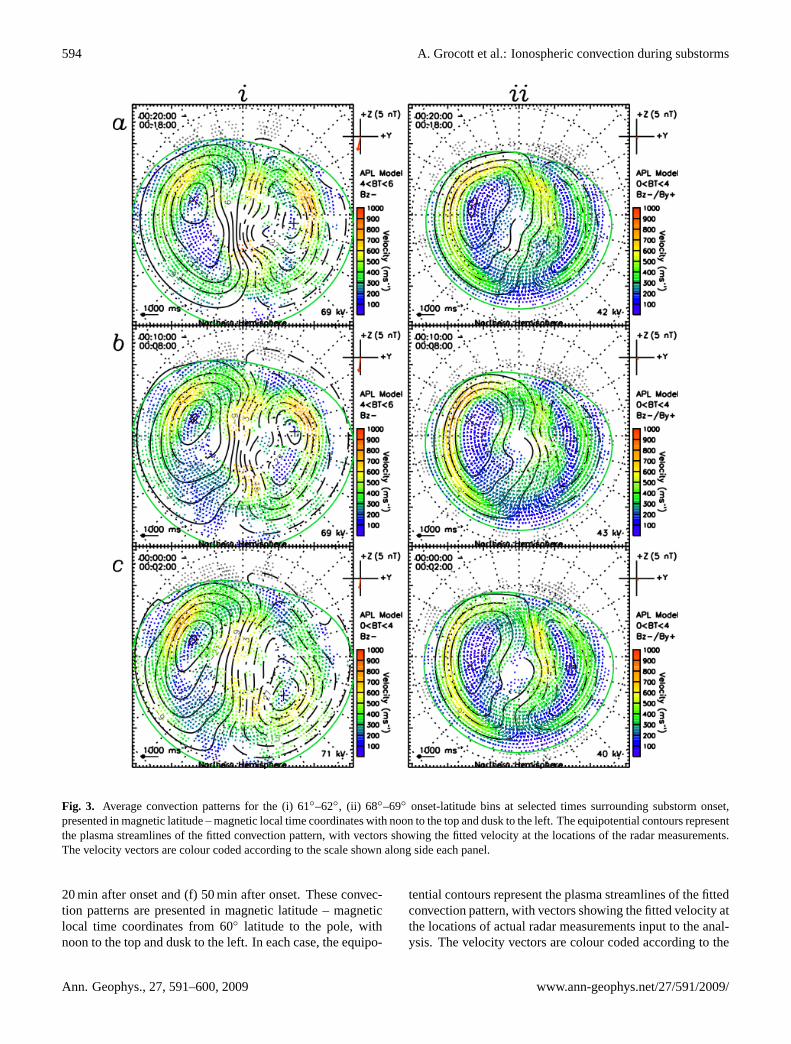
Examples of the average ionospheric convection (derived us-ing the first method described in Sect.2) surrounding sub-storm onset are presented in Fig.3 which shows two sets ofaverage superposed-epoch Northern Hemisphere patterns. Incolumn (i) we show data from the 61◦–62◦ onset-latitude binand in column (ii) we show data from the 68◦–69◦ bin. Sixepoch-times are shown in each case: (a) 20 min before onset,(b) 10 min before onset, (c) at onset, (d) 8 min after onset, (e)
www.ann-geophys.net/27/591/2009/ Ann. Geophys., 27, 591–600, 2009
594 A. Grocott et al.: Ionospheric convection during substorms
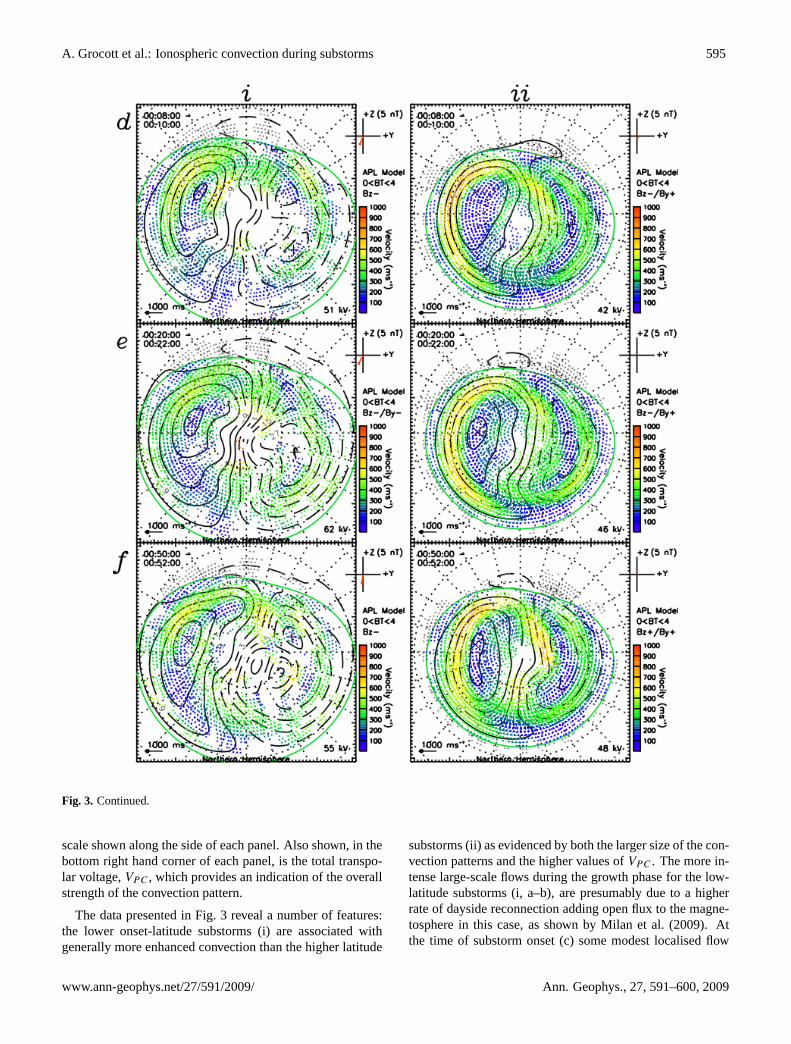
Fig. 3. Average convection patterns for the (i) 61◦–62◦, (ii) 68◦–69◦ onset-latitude bins at selected times surrounding substorm onset,presented in magnetic latitude – magnetic local time coordinates with noon to the top and dusk to the left. The equipotential contours representthe plasma streamlines of the fitted convection pattern, with vectors showing the fitted velocity at the locations of the radar measurements.The velocity vectors are colour coded according to the scale shown along side each panel.
20 min after onset and (f) 50 min after onset. These convec-tion patterns are presented in magnetic latitude – magneticlocal time coordinates from 60◦ latitude to the pole, withnoon to the top and dusk to the left. In each case, the equipo-
tential contours represent the plasma streamlines of the fittedconvection pattern, with vectors showing the fitted velocity atthe locations of actual radar measurements input to the anal-ysis. The velocity vectors are colour coded according to the
Ann. Geophys., 27, 591–600, 2009 www.ann-geophys.net/27/591/2009/
A. Grocott et al.: Ionospheric convection during substorms 595
Fig. 3. Continued.
scale shown along the side of each panel. Also shown, in thebottom right hand corner of each panel, is the total transpo-lar voltage,VPC , which provides an indication of the overallstrength of the convection pattern.
The data presented in Fig.3 reveal a number of features:the lower onset-latitude substorms (i) are associated withgenerally more enhanced convection than the higher latitude
substorms (ii) as evidenced by both the larger size of the con-vection patterns and the higher values ofVPC . The more in-tense large-scale flows during the growth phase for the low-latitude substorms (i, a–b), are presumably due to a higherrate of dayside reconnection adding open flux to the magne-tosphere in this case, as shown byMilan et al. (2009). Atthe time of substorm onset (c) some modest localised flow
www.ann-geophys.net/27/591/2009/ Ann. Geophys., 27, 591–600, 2009
596 A. Grocott et al.: Ionospheric convection during substorms
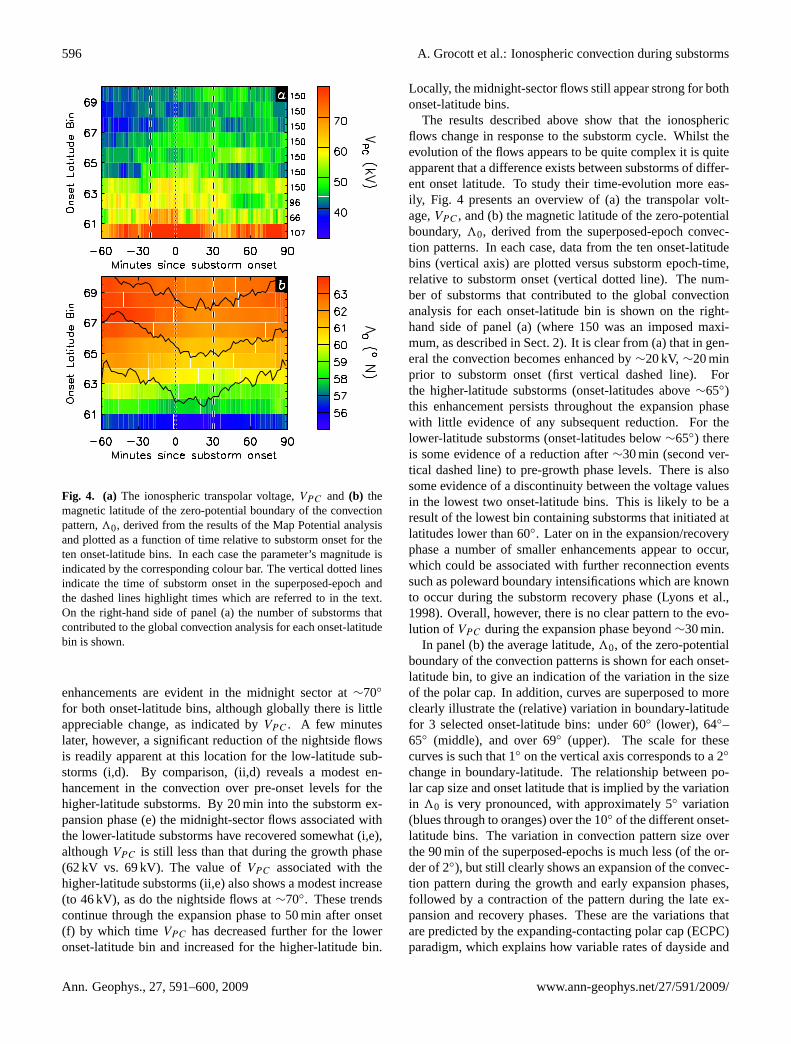
Fig. 4. (a) The ionospheric transpolar voltage,VPC and (b) themagnetic latitude of the zero-potential boundary of the convectionpattern,30, derived from the results of the Map Potential analysisand plotted as a function of time relative to substorm onset for theten onset-latitude bins. In each case the parameter’s magnitude isindicated by the corresponding colour bar. The vertical dotted linesindicate the time of substorm onset in the superposed-epoch andthe dashed lines highlight times which are referred to in the text.On the right-hand side of panel (a) the number of substorms thatcontributed to the global convection analysis for each onset-latitudebin is shown.
enhancements are evident in the midnight sector at∼70◦
for both onset-latitude bins, although globally there is littleappreciable change, as indicated byVPC . A few minuteslater, however, a significant reduction of the nightside flowsis readily apparent at this location for the low-latitude sub-storms (i,d). By comparison, (ii,d) reveals a modest en-hancement in the convection over pre-onset levels for thehigher-latitude substorms. By 20 min into the substorm ex-pansion phase (e) the midnight-sector flows associated withthe lower-latitude substorms have recovered somewhat (i,e),althoughVPC is still less than that during the growth phase(62 kV vs. 69 kV). The value ofVPC associated with thehigher-latitude substorms (ii,e) also shows a modest increase(to 46 kV), as do the nightside flows at∼70◦. These trendscontinue through the expansion phase to 50 min after onset(f) by which timeVPC has decreased further for the loweronset-latitude bin and increased for the higher-latitude bin.
Locally, the midnight-sector flows still appear strong for bothonset-latitude bins.
The results described above show that the ionosphericflows change in response to the substorm cycle. Whilst theevolution of the flows appears to be quite complex it is quiteapparent that a difference exists between substorms of differ-ent onset latitude. To study their time-evolution more eas-ily, Fig. 4 presents an overview of (a) the transpolar volt-age,VPC , and (b) the magnetic latitude of the zero-potentialboundary,30, derived from the superposed-epoch convec-tion patterns. In each case, data from the ten onset-latitudebins (vertical axis) are plotted versus substorm epoch-time,relative to substorm onset (vertical dotted line). The num-ber of substorms that contributed to the global convectionanalysis for each onset-latitude bin is shown on the right-hand side of panel (a) (where 150 was an imposed maxi-mum, as described in Sect.2). It is clear from (a) that in gen-eral the convection becomes enhanced by∼20 kV, ∼20 minprior to substorm onset (first vertical dashed line). Forthe higher-latitude substorms (onset-latitudes above∼65◦)this enhancement persists throughout the expansion phasewith little evidence of any subsequent reduction. For thelower-latitude substorms (onset-latitudes below∼65◦) thereis some evidence of a reduction after∼30 min (second ver-tical dashed line) to pre-growth phase levels. There is alsosome evidence of a discontinuity between the voltage valuesin the lowest two onset-latitude bins. This is likely to be aresult of the lowest bin containing substorms that initiated atlatitudes lower than 60◦. Later on in the expansion/recoveryphase a number of smaller enhancements appear to occur,which could be associated with further reconnection eventssuch as poleward boundary intensifications which are knownto occur during the substorm recovery phase (Lyons et al.,1998). Overall, however, there is no clear pattern to the evo-lution of VPC during the expansion phase beyond∼30 min.
In panel (b) the average latitude,30, of the zero-potentialboundary of the convection patterns is shown for each onset-latitude bin, to give an indication of the variation in the sizeof the polar cap. In addition, curves are superposed to moreclearly illustrate the (relative) variation in boundary-latitudefor 3 selected onset-latitude bins: under 60◦ (lower), 64◦–65◦ (middle), and over 69◦ (upper). The scale for thesecurves is such that 1◦ on the vertical axis corresponds to a 2◦
change in boundary-latitude. The relationship between po-lar cap size and onset latitude that is implied by the variationin 30 is very pronounced, with approximately 5◦ variation(blues through to oranges) over the 10◦ of the different onset-latitude bins. The variation in convection pattern size overthe 90 min of the superposed-epochs is much less (of the or-der of 2◦), but still clearly shows an expansion of the convec-tion pattern during the growth and early expansion phases,followed by a contraction of the pattern during the late ex-pansion and recovery phases. These are the variations thatare predicted by the expanding-contacting polar cap (ECPC)paradigm, which explains how variable rates of dayside and
Ann. Geophys., 27, 591–600, 2009 www.ann-geophys.net/27/591/2009/
A. Grocott et al.: Ionospheric convection during substorms 597
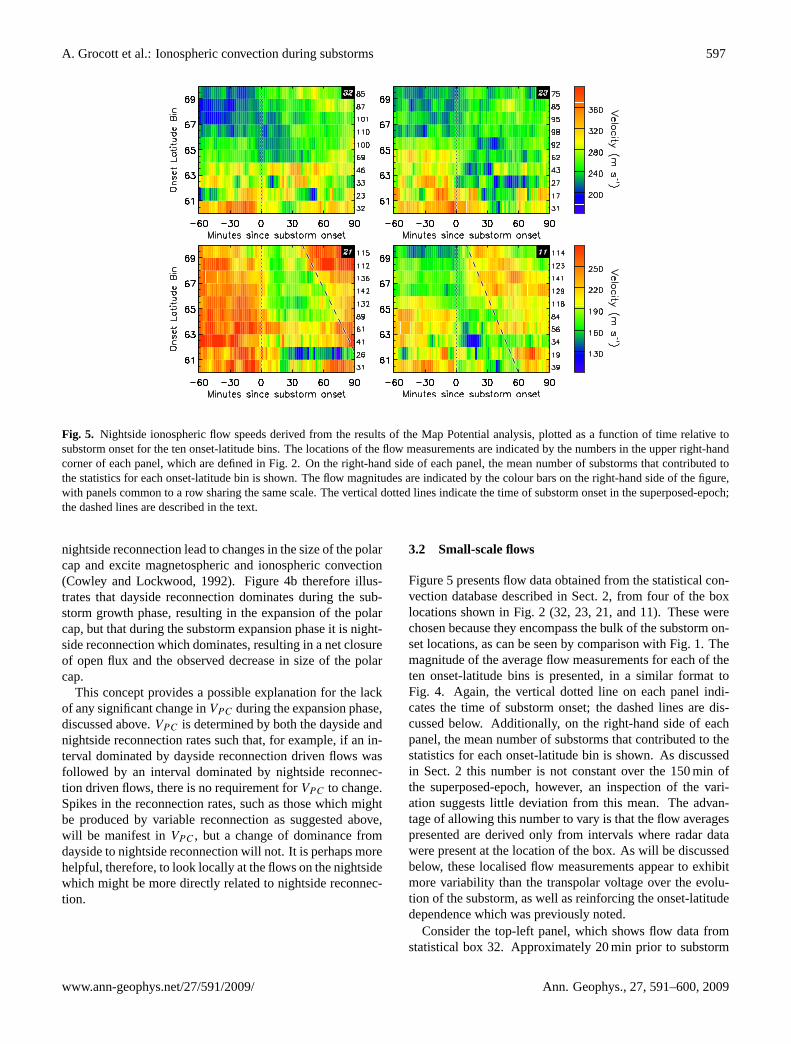
Fig. 5. Nightside ionospheric flow speeds derived from the results of the Map Potential analysis, plotted as a function of time relative tosubstorm onset for the ten onset-latitude bins. The locations of the flow measurements are indicated by the numbers in the upper right-handcorner of each panel, which are defined in Fig.2. On the right-hand side of each panel, the mean number of substorms that contributed tothe statistics for each onset-latitude bin is shown. The flow magnitudes are indicated by the colour bars on the right-hand side of the figure,with panels common to a row sharing the same scale. The vertical dotted lines indicate the time of substorm onset in the superposed-epoch;the dashed lines are described in the text.
nightside reconnection lead to changes in the size of the polarcap and excite magnetospheric and ionospheric convection(Cowley and Lockwood, 1992). Figure4b therefore illus-trates that dayside reconnection dominates during the sub-storm growth phase, resulting in the expansion of the polarcap, but that during the substorm expansion phase it is night-side reconnection which dominates, resulting in a net closureof open flux and the observed decrease in size of the polarcap.
This concept provides a possible explanation for the lackof any significant change inVPC during the expansion phase,discussed above.VPC is determined by both the dayside andnightside reconnection rates such that, for example, if an in-terval dominated by dayside reconnection driven flows wasfollowed by an interval dominated by nightside reconnec-tion driven flows, there is no requirement forVPC to change.Spikes in the reconnection rates, such as those which mightbe produced by variable reconnection as suggested above,will be manifest inVPC , but a change of dominance fromdayside to nightside reconnection will not. It is perhaps morehelpful, therefore, to look locally at the flows on the nightsidewhich might be more directly related to nightside reconnec-tion.
3.2 Small-scale flows
Figure5 presents flow data obtained from the statistical con-vection database described in Sect.2, from four of the boxlocations shown in Fig.2 (32, 23, 21, and 11). These werechosen because they encompass the bulk of the substorm on-set locations, as can be seen by comparison with Fig.1. Themagnitude of the average flow measurements for each of theten onset-latitude bins is presented, in a similar format toFig. 4. Again, the vertical dotted line on each panel indi-cates the time of substorm onset; the dashed lines are dis-cussed below. Additionally, on the right-hand side of eachpanel, the mean number of substorms that contributed to thestatistics for each onset-latitude bin is shown. As discussedin Sect.2 this number is not constant over the 150 min ofthe superposed-epoch, however, an inspection of the vari-ation suggests little deviation from this mean. The advan-tage of allowing this number to vary is that the flow averagespresented are derived only from intervals where radar datawere present at the location of the box. As will be discussedbelow, these localised flow measurements appear to exhibitmore variability than the transpolar voltage over the evolu-tion of the substorm, as well as reinforcing the onset-latitudedependence which was previously noted.
Consider the top-left panel, which shows flow data fromstatistical box 32. Approximately 20 min prior to substorm
www.ann-geophys.net/27/591/2009/ Ann. Geophys., 27, 591–600, 2009

598 A. Grocott et al.: Ionospheric convection during substorms
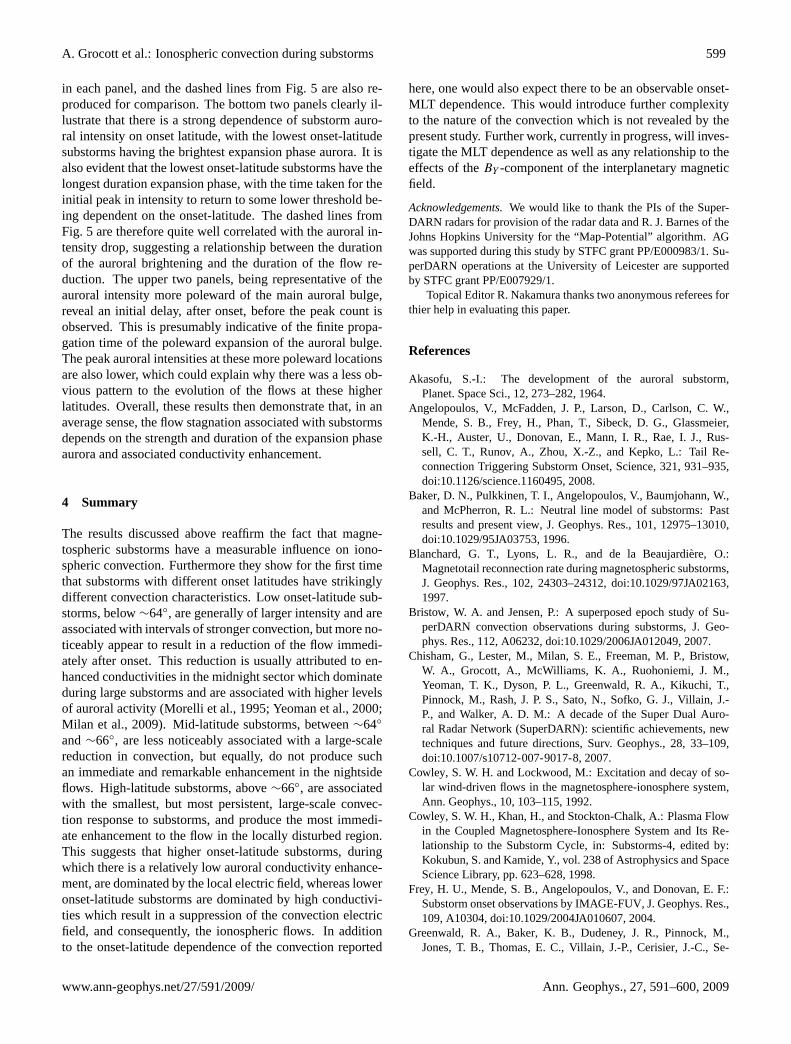
Fig. 6. 10-min averages of WIC auroral electron counts, plotted for the same locations as the flow data in Fig.5 as a function of time relativeto substorm onset, for five onset-latitude bins. The dotted and dashed lines are as in Fig.5 (afterMilan et al., 2009).
onset an enhancement can be seen in the flows, most obviousin the highest four and lowest two onset-latitude bins, whichis similar to the growth phase enhancement ofVPC seen inFig. 4. Around the time of onset, further changes are evidentin the data. For onset-latitudes above 68◦ there is an enhance-ment in the flows from∼200 m s−1 to ∼250 m s−1, whereasbelow 67◦ there is a reduction of about the same magnitude.The duration of this reduction, however, appears to be relatedto the onset-latitude, with a subsequent enhancement occur-ring ∼15 min after onset for the 67◦–68◦ bin, but not for afurther ∼15 min for the 62◦–63◦ bin. This is suggestive ofa relationship between the onset-latitude and the duration ofthe post-onset flow reduction, discussed further below.
A similar but somewhat less clear pattern can be seen inthe data from statistical box 23 (top-right), although any re-lationship in this case is not as obvious. The data from bothof the lower-latitude statistical boxes (21 and 11, bottom pan-els), however, clearly reinforce the idea of a relationship be-tween onset-latitude and the duration of a flow reduction dur-ing the early substorm expansion phase. In both cases this re-lationship appears to be linear, as indicated by the dashed di-agonal lines. Consider first the data from magnetic local mid-night (box 11). For the lowest onset-latitude bins the growthphase flows of up to 300 m s−1 are reduced dramatically atsubstorm onset, dropping to under 100 m s−1 by 10 to 20 mininto the expansion phase. For higher onset-latitudes (above66◦), however, the magnitude of the growth phase flows isless. In this case, rather than decreasing at onset, the flowsexhibit little immediate change but then proceed to increase
from ∼150 m s−1 to ∼250 m s−1 after ∼10 min. Lookingagain at the lower onset-latitude bins, this post-onset flowenhancement can also be seen to occur, but after a delaywhich appears to be approximately inversely proportional tothe latitude of the onset (∼5 min per degree, as indicated bythe dashed slope). For the lowest onset-latitude bin this en-hancement is therefore not evident until∼60 min after on-set. Finally, turning to the data in box 21 (a location∼1.5 hwest of box 11), a similar pattern is evident in the flows.Here the delay is somewhat more prolonged, certainly forhigher onset-latitudes where it is∼30 min longer, althoughfor onset-latitudes below∼64◦ there is some evidence of athreshold to this delay of∼60–70 min where this linear rela-tionship breaks down.
3.3 Substorm auroral evolution
As discussed in Sect.1, it has previously been suggested thatthe ionospheric convection during substorms is related to theassociated auroral development. In this section we thereforebriefly consider the auroral development as a possible expla-nation for the delayed convection response described above.In Fig. 6 we show data based on the work ofMilan et al.(2009) that was derived from a subset of theFrey et al.(2004)list of substorms, similar to the subset used in the presentstudy. Auroral electron counts from the Wideband Imag-ing Camera (WIC) on the IMAGE spacecraft are presentedas a function of substorm epoch-time, for a range of onsetlatitudes, for the same set of locations discussed in Fig.5.The onset time is again marked with the vertical dotted line
Ann. Geophys., 27, 591–600, 2009 www.ann-geophys.net/27/591/2009/
A. Grocott et al.: Ionospheric convection during substorms 599
in each panel, and the dashed lines from Fig.5 are also re-produced for comparison. The bottom two panels clearly il-lustrate that there is a strong dependence of substorm auro-ral intensity on onset latitude, with the lowest onset-latitudesubstorms having the brightest expansion phase aurora. It isalso evident that the lowest onset-latitude substorms have thelongest duration expansion phase, with the time taken for theinitial peak in intensity to return to some lower threshold be-ing dependent on the onset-latitude. The dashed lines fromFig. 5 are therefore quite well correlated with the auroral in-tensity drop, suggesting a relationship between the durationof the auroral brightening and the duration of the flow re-duction. The upper two panels, being representative of theauroral intensity more poleward of the main auroral bulge,reveal an initial delay, after onset, before the peak count isobserved. This is presumably indicative of the finite propa-gation time of the poleward expansion of the auroral bulge.The peak auroral intensities at these more poleward locationsare also lower, which could explain why there was a less ob-vious pattern to the evolution of the flows at these higherlatitudes. Overall, these results then demonstrate that, in anaverage sense, the flow stagnation associated with substormsdepends on the strength and duration of the expansion phaseaurora and associated conductivity enhancement.
4 Summary
The results discussed above reaffirm the fact that magne-tospheric substorms have a measurable influence on iono-spheric convection. Furthermore they show for the first timethat substorms with different onset latitudes have strikinglydifferent convection characteristics. Low onset-latitude sub-storms, below∼64◦, are generally of larger intensity and areassociated with intervals of stronger convection, but more no-ticeably appear to result in a reduction of the flow immedi-ately after onset. This reduction is usually attributed to en-hanced conductivities in the midnight sector which dominateduring large substorms and are associated with higher levelsof auroral activity (Morelli et al., 1995; Yeoman et al., 2000;Milan et al., 2009). Mid-latitude substorms, between∼64◦
and∼66◦, are less noticeably associated with a large-scalereduction in convection, but equally, do not produce suchan immediate and remarkable enhancement in the nightsideflows. High-latitude substorms, above∼66◦, are associatedwith the smallest, but most persistent, large-scale convec-tion response to substorms, and produce the most immedi-ate enhancement to the flow in the locally disturbed region.This suggests that higher onset-latitude substorms, duringwhich there is a relatively low auroral conductivity enhance-ment, are dominated by the local electric field, whereas loweronset-latitude substorms are dominated by high conductivi-ties which result in a suppression of the convection electricfield, and consequently, the ionospheric flows. In additionto the onset-latitude dependence of the convection reported
here, one would also expect there to be an observable onset-MLT dependence. This would introduce further complexityto the nature of the convection which is not revealed by thepresent study. Further work, currently in progress, will inves-tigate the MLT dependence as well as any relationship to theeffects of theBY -component of the interplanetary magneticfield.
Acknowledgements.We would like to thank the PIs of the Super-DARN radars for provision of the radar data and R. J. Barnes of theJohns Hopkins University for the “Map-Potential” algorithm. AGwas supported during this study by STFC grant PP/E000983/1. Su-perDARN operations at the University of Leicester are supportedby STFC grant PP/E007929/1.
Topical Editor R. Nakamura thanks two anonymous referees forthier help in evaluating this paper.
References
Akasofu, S.-I.: The development of the auroral substorm,Planet. Space Sci., 12, 273–282, 1964.
Angelopoulos, V., McFadden, J. P., Larson, D., Carlson, C. W.,Mende, S. B., Frey, H., Phan, T., Sibeck, D. G., Glassmeier,K.-H., Auster, U., Donovan, E., Mann, I. R., Rae, I. J., Rus-sell, C. T., Runov, A., Zhou, X.-Z., and Kepko, L.: Tail Re-connection Triggering Substorm Onset, Science, 321, 931–935,doi:10.1126/science.1160495, 2008.
Baker, D. N., Pulkkinen, T. I., Angelopoulos, V., Baumjohann, W.,and McPherron, R. L.: Neutral line model of substorms: Pastresults and present view, J. Geophys. Res., 101, 12975–13010,doi:10.1029/95JA03753, 1996.
Blanchard, G. T., Lyons, L. R., and de la Beaujardiere, O.:Magnetotail reconnection rate during magnetospheric substorms,J. Geophys. Res., 102, 24303–24312, doi:10.1029/97JA02163,1997.
Bristow, W. A. and Jensen, P.: A superposed epoch study of Su-perDARN convection observations during substorms, J. Geo-phys. Res., 112, A06232, doi:10.1029/2006JA012049, 2007.
Chisham, G., Lester, M., Milan, S. E., Freeman, M. P., Bristow,W. A., Grocott, A., McWilliams, K. A., Ruohoniemi, J. M.,Yeoman, T. K., Dyson, P. L., Greenwald, R. A., Kikuchi, T.,Pinnock, M., Rash, J. P. S., Sato, N., Sofko, G. J., Villain, J.-P., and Walker, A. D. M.: A decade of the Super Dual Auro-ral Radar Network (SuperDARN): scientific achievements, newtechniques and future directions, Surv. Geophys., 28, 33–109,doi:10.1007/s10712-007-9017-8, 2007.
Cowley, S. W. H. and Lockwood, M.: Excitation and decay of so-lar wind-driven flows in the magnetosphere-ionosphere system,Ann. Geophys., 10, 103–115, 1992.
Cowley, S. W. H., Khan, H., and Stockton-Chalk, A.: Plasma Flowin the Coupled Magnetosphere-Ionosphere System and Its Re-lationship to the Substorm Cycle, in: Substorms-4, edited by:Kokubun, S. and Kamide, Y., vol. 238 of Astrophysics and SpaceScience Library, pp. 623–628, 1998.
Frey, H. U., Mende, S. B., Angelopoulos, V., and Donovan, E. F.:Substorm onset observations by IMAGE-FUV, J. Geophys. Res.,109, A10304, doi:10.1029/2004JA010607, 2004.
Greenwald, R. A., Baker, K. B., Dudeney, J. R., Pinnock, M.,Jones, T. B., Thomas, E. C., Villain, J.-P., Cerisier, J.-C., Se-
www.ann-geophys.net/27/591/2009/ Ann. Geophys., 27, 591–600, 2009
600 A. Grocott et al.: Ionospheric convection during substorms
nior, C., Hanuise, C., Hunsucker, R. D., Sofko, G., Koehler, J.,Nielsen, E., Pellinen, R., Walker, A. D. M., Sato, N., and Yam-agishi, H.: Darn/Superdarn: A Global View of the Dynamics ofHigh-Lattitude Convection, Space Sci. Rev., 71, 761–796, doi:10.1007/BF00751350, 1995.
Grocott, A., Cowley, S. W. H., Sigwarth, J. B., Watermann, J. F.,and Yeoman, T. K.: Excitation of twin-vortex flow in the night-side high-latitude ionosphere during an isolated substorm, Ann.Geophys., 20, 1577–1601, 2002,http://www.ann-geophys.net/20/1577/2002/.
Grocott, A., Lester, M., Parkinson, M. L., Yeoman, T. K., Dyson,P. L., Devlin, J. C., and Frey, H. U.: Towards a synthesis of sub-storm electrodynamics: HF radar and auroral observations, Ann.Geophys., 24, 3365–3381, 2006,http://www.ann-geophys.net/24/3365/2006/.
Lui, A. T. Y.: Current disruption in the Earth’s magnetosphere: Ob-servations and models, J. Geophys. Res., 101, 13067–13088, doi:10.1029/96JA00079, 1996.
Lyons, L. R., Blanchard, G. T., Samson, J. C., Rouhoniemi, J. M.,Greenwald, R. A., Reeves, G. D., and Scudder, J. D.: Near EarthPlasma Sheet Penetration and Geomagnetic Disturbances, in:New Perspectives on the Earth’s Magnetotail, edited by Nishida,A., Baker, D. N., and Cowley, S. W. H., p. 241, 1998.
Lyons, L. R., Ruohoniemi, J. M., and Lu, G.: Substorm-associatedchanges in large-scale convection during the November 24, 1996Geospace Environment Modeling event, J. Geophys. Res., 106,397–406, doi:10.1029/1999JA000602, 2001.
Mende, S. B., Heetderks, H., Frey, H. U., Lampton, M., Geller,S. P., Abiad, R., Siegmund, O. H. W., Tremsin, A. S., Spann, J.,Dougani, H., Fuselier, S. A., Magoncelli, A. L., Bumala, M. B.,Murphree, S., and Trondsen, T.: Far ultraviolet imaging from theIMAGE spacecraft. 2. Wideband FUV imaging, Space Sci. Rev.,91, 271–285, 2000a.
Mende, S. B., Heetderks, H., Frey, H. U., Lampton, M., Geller,S. P., Habraken, S., Renotte, E., Jamar, C., Rochus, P., Spann, J.,Fuselier, S. A., Gerard, J.-C., Gladstone, R., Murphree, S., andCogger, L.: Far ultraviolet imaging from the IMAGE spacecraft.1. System design, Space Sci. Rev., 91, 243–270, 2000b.
Milan, S. E., Grocott, A., Forsyth, C., Imber, S. M., Boakes, P. D.,and Hubert, B.: A superposed epoch analysis of auroral evolutionduring substorm growth, onset and recovery: open magnetic fluxcontrol of substorm intensity, Ann. Geophys., in press, 2009.
Morelli, J. P., Bunting, R. J., Cowley, S. W. H., Farrugia, C. J.,Freeman, M. P., Friis-Christensen, E., Jones, G. O. L., Lester,M., Lewis, R. V., Luhr, H., Orr, D., Pinnock, M., Reeves, G.D., Williams, P. J. S., and Yeoman, T. K.: Radar observations ofauroral zone flows during a multiple-onset substorm, Ann. Geo-phys., 13, 1144–1163, 1995,http://www.ann-geophys.net/13/1144/1995/.
Opgenoorth, H. J. and Pellinen, R. J.: The Reaction of the GlobalConvection Electrojets to the Onset and Expansion of the Sub-storm Current Wedge, in: Substorms-4, edited by: Kokubun, S.and Kamide, Y., vol. 238 of Astrophysics and Space Science Li-brary, pp. 663–668, 1998.
Provan, G., Lester, M., Mende, S. B., and Milan, S. E.: Statisticalstudy of high-latitude plasma flow during magnetospheric sub-storms, Ann. Geophys., 22, 3607–3624, 2004,http://www.ann-geophys.net/22/3607/2004/.
Ruohoniemi, J. M. and Baker, K. B.: Large-scale imaging of high-latitude convection with Super Dual Auroral Radar Network HFradar observations, J. Geophys. Res., 103, 20797–20811, doi:10.1029/98JA01288, 1998.
Weimer, D. R.: Substorm influence on the ionospheric electricpotentials and currents, J. Geophys. Res., 104, 185–198, doi:10.1029/1998JA900075, 1999.
Wild, J. A. and Grocott, A.: The influence of magnetospheric sub-storms on SuperDARN radar backscatter, J. Geophys. Res., 113,A04308, doi:10.1029/2007JA012910, 2008.
Yeoman, T. K., Davies, J. A., Wade, N. M., Provan, G., and Milan,S. E.: Combined CUTLASS, EISCAT and ESR observations ofionospheric plasma flows at the onset of an isolated substorm,Ann. Geophys., 18, 1073–1087, 2000,http://www.ann-geophys.net/18/1073/2000/.
Ann. Geophys., 27, 591–600, 2009 www.ann-geophys.net/27/591/2009/