Embed Size (px)
Citation preview

Supergene gold transformation:
Secondary and nano-particulate gold
from northern Finland
Thesis submitted in accordance with the requirements of the University of Adelaide for an Honours Degree in Geology
.
Paige Sawley
November 2014

Paige Sawley
Supergene gold transformation
i
SUPERGENE GOLD TRANSFORMATION: SECONDARY AND NANO-PARTICULATE GOLD FROM NORTHERN FINLAND
SUPERGENE GOLD TRANSFORMATION
ABSTRACT
The transformation of gold (Au) in many supergene environments is driven by
(bio)geochemical processes. This study assesses the link between surface morphologies
of Au grains and supergene transformation processes in arctic settings. Gold grains were
collected from nine sites across two localities in northern Finland, i.e., Ivalojoki and
Lemmenjoki. Sites were chosen based on contrasting elevations and settings, from
glacial till to alluvial. Gold grains were studied using field emission scanning electron
microscopy (FEG-SEM), focused ion beam-scanning electron microscopy (FIB-SEM)
coupled with Energy Dispersive X-ray Spectroscopy (EDXS), and electron microprobe
analyses (EPMA). Gold grains from all sites displayed supergene transformation
features, i.e., morphotypes indicative of Au and Ag dissolution, as well as Au
aggregation. The latter included a variety of secondary Au morphotypes, such as nano-
particles and µ-crystals, sheet-like Au and branched Au networks. Dissolution features
on grains from high organic matter environments suggest fulvic and humic acids are
important contributors in the transformation of Au. Secondary Au occurs as part of the
polymorphic layer. In addition to the secondary Au, the polymorphic layer consists of
active microbial biofilms, organic matter and biominerals suggestive of remnant
biofilms, as well as aluminosilicates, iron-sulfides and oxides. Bacterial cells and
putative fungal hyphae were closely associated with Au nano-particles, suggesting that
Au biomineralisation is an important factor in the transformation of Au. In conclusion,
surface morphologies of Au grains from Finland are the result of supergene
(bio)geochemical transformations occurring in the arctic environment.
KEYWORDS
Gold, supergene, Finland, arctic, nano-particles, biofilm
1
TABLE OF CONTENTS
Supergene gold transformation: Secondary and nano-particulate gold from northern
Finland .................................................................................................................................... i
Supergene gold transformation ............................................................................................. i
Abstract ................................................................................................................................... i
Keywords ................................................................................................................................ i
1. List of Figures ................................................................................................................ 2
2. List of Tables ................................................................................................................. 3
3. Introduction .................................................................................................................... 4
4. Geological Setting ......................................................................................................... 6
5. Methods .......................................................................................................................... 8
6. Observations and Results ............................................................................................ 10
5.1 Gold grains from Ivalojoki, Finland ............................................................................ 10
5.1.1 Ivalojoki 1................................................................................................................... 10
5.1.2 Aila’s claim ................................................................................................................ 13
5.1.3 Risto’s Claim .............................................................................................................. 15
5.2 Gold grains for Lemmenjoki, Finland ......................................................................... 17
5.1.1 Jäkäläpää claim .......................................................................................................... 17
5.2.2 (Miessi) Turkka’s Claim ........................................................................................... 20
5.2.3 (Miessi) Pekka’s Claim ............................................................................................. 22
5.2.4 (Miessi) Raimo’s Claim ............................................................................................ 24
5.2.5 Kaarreoja Claim ......................................................................................................... 25
5.2.6 (Miessi) Ami’s Claim ................................................................................................ 27
7. Discussion .................................................................................................................... 29
8. Conclusions .................................................................................................................. 34
9. Acknowledgments ....................................................................................................... 35
10. References ................................................................................................................ 35
Appendix A: Methods ......................................................................................................... 39
Appendix B: Supplementary Figures ................................................................................. 45

2
1. LIST OF FIGURES
Figure 1: Finland sample site locations; insert Lemmenjoki, (1) (Miessi) Turkka’s
Claim, (2) Jäkäläpää Claim, (3) (Miessi) Pekka’s Claim, (4) (Miessi) Raimo’s Claim,
(5) Kaarreoja Claim, (6) (Miessi) Ami’s Claim. Insert Ivalojoki. (1) Ivalojoki 1, (2)
Aila’s Claim, (3) Risto’s Claim. Modified after Google Earth. ......................................... 7 Figure 2: Backscatter electron (BSE, a, b) and scanning electron (SE, c, d) micrographs
and EDXS maps (e–h) of Au grains from Ivalojoki 1, Ivalojoki, Finland. (a) Micrograph
showing a typical irregular Au grain with rounded and partially folded edges; (b)
conglomerate of Au µ-crystals surrounded by Au nano-particles in the polymorphic
layer; (c) micrograph showing the polymorphic layer described in (b); (d) a sheet-like,
secondary Au plate; (e–h) EDXS maps of Au, Ag, Fe and Si concentrations (wt. %). .. 11
Figure 3: Electron microprobe maps of Au, Ag and Fe concentrations in a polished
section of two Au grains from Ivalojoki 1, Ivalojoki, Finland. (a) Maximum
concentrations of Au 100 wt.%; (b) maximum concentration of Ag 13.37 wt.%; (c)
maximum concentrations of Fe 35.50 wt.%. ..................................................................... 12 Figure 4: Electron micrographs of Au grains from Ivalojoki 1, Ivalojoki, Finland,
showing (a) typical features of the polymorphic layer, with bacterial cell (arrow); (b)
conglomerate of Au µ-crystals, surrounded by Au nano-particles and bacterial cell
(arrow) dispersed through the polymorphic layer; (c) a bacterial, rod-shaped cell
attached by pili; (d) a bacterial rod-shaped cell surrounded by Au nano-particles
(arrows). ............................................................................................................................... 13
Figure 5: BSE (a, c–e) and SE (b) micrographs of Au grains from Aila’s Claim,
Ivalojoki, Finland, showing (a) a typical Au grain with rounded and partially folded
edges; (b) the physically damaged grain surfaces; (c) dissolution pits on the grain
surface and budding Au forming bridging structures; (d) Au µ-crystals and nano-
particles dispersed through the polymorphic layer; (e) triangular-shaped, flat Au crystal.
.............................................................................................................................................. 14
Figure 6: SE (a) and BSE (b–d) micrographs of Au grains from Risto’s Claim,
Ivalojoki, Finland, showing (a) a typical flattened grain with rounded edges; (b) the
physically damaged grain surfaces; (c) Au dissolving into the polymorphic layer, (d) the
highly transformed grain surfaces with few Au nano-particles and budding structures. 16
Figure 7: SE (a, d) and BSE (b, c) micrographs of Au grains from Jäkäläpää Claim,
Lemmenjoki, Finland, showing (a) a branching Au grain with sub-rounded edges; (b)
budding Au and extensive Au nano-particles dispersed through the polymorphic layer;
(c) Au µ-crystals and Au nano-particles accumulating in a Ti rich part of the matrix; (d)
a pyrite particle (red arrow) and a biomineral (orange arrow). ........................................ 17
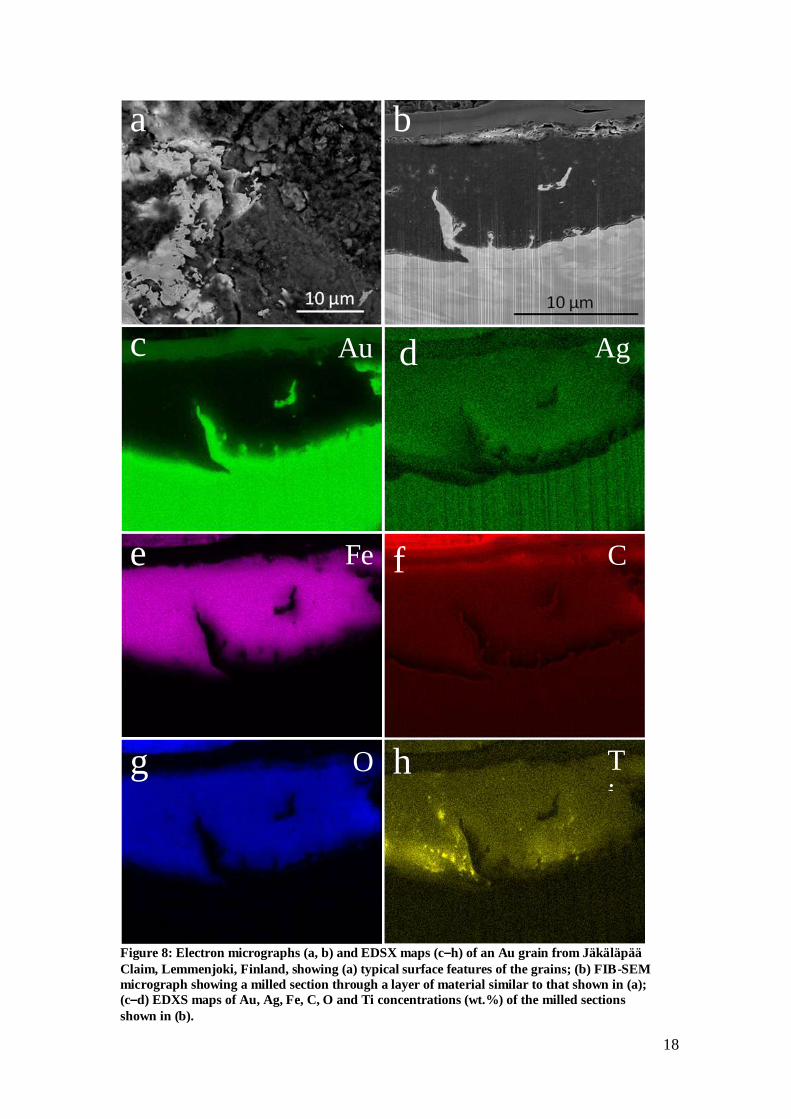
Figure 8: Electron micrographs (a, b) and EDSX maps (c–h) of an Au grain from
Jäkäläpää Claim, Lemmenjoki, Finland, showing (a) typical surface features of the
grains; (b) FIB-SEM micrograph showing a milled section through a layer of material
similar to that shown in (a); (c–d) EDXS maps of Au, Ag, Fe, C, O and Ti
concentrations (wt.%) of the milled sections shown in (b). ............................................. 18
Figure 9: Electron microprobe maps of Au, Ag and Fe concentrations in a polished
section of two Au grains from Jäkäläpää Claim, Lemmenjoki, Finland. (a) Maximum

3
concentrations of Au 100 wt.%; (b) maximum concentration of Ag 46.07 wt.%; (c)
maximum concentrations of Fe 32.07 wt.%. ..................................................................... 20 Figure 10: BSE (a, b, d) and SE (c) micrographs and an electron microprobe map of Au
grains from (Miessi) Turkka’s Claim, Lemmenjoki, Finland showing (a) a wire Au
grain with rounded edges; (b) the typical textured grain surface; (c) a network of
biological nano-wires (arrows) running through the polymorphic layer; (d) triangular
and spherical shaped Au nano-particles; (e) minimum concentrations of Au 60 wt.%,
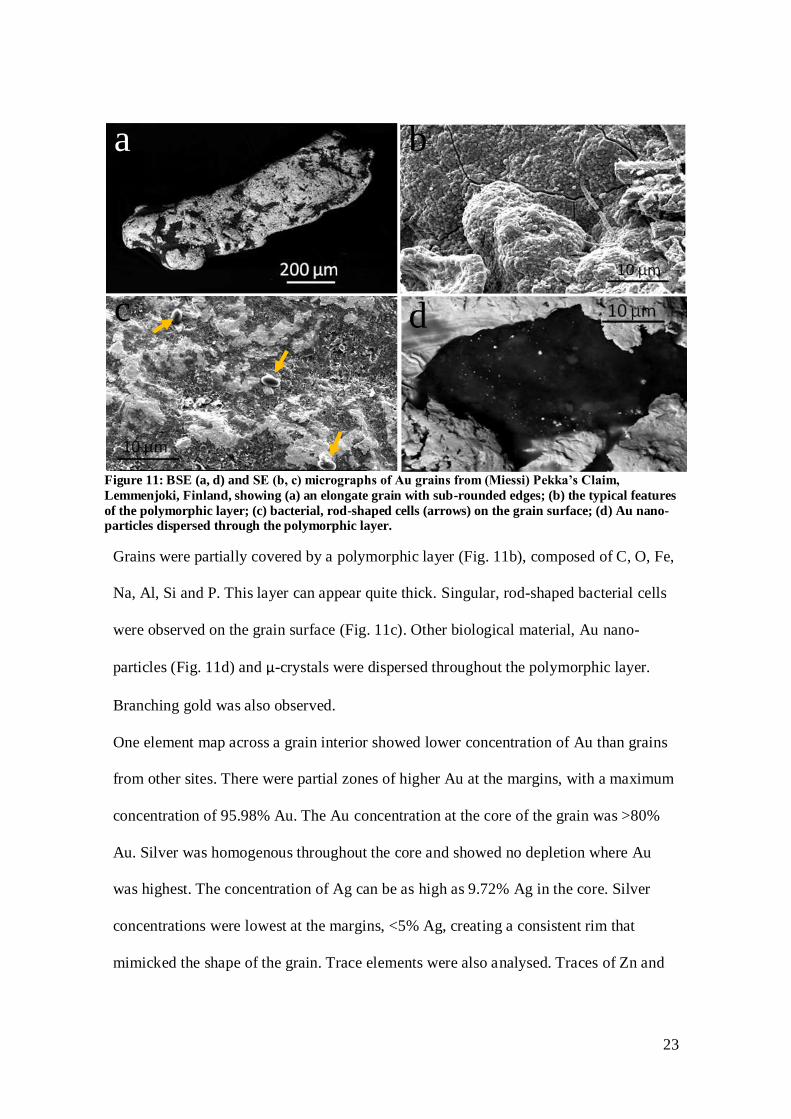
maximum concentrations of Au 100 wt.%. ....................................................................... 21 Figure 11: BSE (a, d) and SE (b, c) micrographs of Au grains from (Miessi) Pekka’s
Claim, Lemmenjoki, Finland, showing (a) an elongate grain with sub-rounded edges;
(b) the typical features of the polymorphic layer; (c) bacterial, rod-shaped cells (arrows)
on the grain surface; (d) Au nano-particles dispersed through the polymorphic layer. .. 23
Figure 12: SE (a–c) and BSE (d, e) micrographs of Au grains from (Miessi) Raimo’s
Claim, Lemmenjoki, Finland, showing (a) a flattened, branched grain; (b) biological
material on the physically damaged surfaces; (c) a cluster of rod-shaped bacterial cells
on the surface of the polymorphic layer; (d) the bacterial cells shown in (c) surrounded
by Au nano-particles; (e) budding Au forming bridging structures................................. 25
Figure 13: BSE micrographs (a, b) and electron microprobe maps (c–h) of Au grains
from Kaarreoja Claim, Lemmenjoki, Finland showing (a) a wire Au grain with rounded
edges; (b) Au nano-particles dispersed through the polymorphic layer; electron
microprobe maps of Au (c, e, g; maximum concentration 100 wt.%) and Ag (d, f, h;
maximum concentration 23.88 wt.%). Note the lack of Ag at enriched Au rims. .......... 26
Figure 14: BSE (a–c) micrographs and electron microprobe maps (d, e) of Au grains
from (Miessi) Ami’s Claim, Lemmenjoki, Finland showing (a) an irregular Au grain
with sub-rounded edges; (b) typical surface features of the grains; (c) increased
magnification of Au nano-particles, area highlighted in (b); (d, e) electron microprobe
maps of Au (d; maximum concentrations 100 wt.%) and Ag (e; maximum
concentrations 11.66 wt.%). ............................................................................................... 28
2. LIST OF TABLES
Table 1: Summary of the environmental properties at the sampling sites......................... 8

4
3. INTRODUCTION
Gold (Au) is rare (~1 ppb) in the Earth’s crust (Hough et al. 2009). One of the most
important sources of Au is alluvial placer deposits (Youngson & Craw 1993). Alluvial
Au is most commonly found micrometer to millimetres in size (Hough et al. 2009).
Under surface conditions and in aqueous solutions, Au can occurs in three forms;
colloidal [Au (0)], aurous [Au (I)] or auric [Au (III)] (Southam et al. 2009).
Primary Au is Au that has originated from high temperature systems (Fairbrother et al.
2012). It is most commonly an Au/Ag alloy, containing between 5–20% Ag (Hough et
al. 2009). Physical erosion of host material results in primary Au being deposited in
supergene placers (Fairbrother et al. 2012). Secondary Au occurs on the surface of
primary Au and usually has a high purity (>99 wt. % Au). Many Au grains recovered in
placer environments display a core of Au-Ag and have a partial or complete rim of high
purity Au (e.g.Groen et al. 1990, McCready et al. 2003, Fairbrother et al. 2012, Reith et
al. 2012). Secondary Au can have a range of morphologies including wire Au, Au nano-
particles and µ-crystals, bacteriomorphic Au and sheet-like Au (Falconer et al. 2006,
Reith et al. 2006, Hough et al. 2011). Nano-particulate Au also have a variety of
morphologies including triangle, spherical, hexagonal and octahedral (Fairbrother et al.
2013).
There has been debate on whether the development of Au grains in supergene
environments is driven by detrital (Minter et al. 1993, Hough et al. 2007) or chemical
accretionary (Youngson & Craw 1993) processes. A recent model by Fairbrother et al.
(2012) has integrated both to create a model of supergene processes for the
transformation of Au grains. In this model, the physically eroded primary Au, now in
the supergene environment, experiences Ag de-alloying and Au dissolution. De-alloying

5
is the selective leaching of less noble elements (e.g. Ag) and results in nano-porous Au
structures (Schofield et al. 2008). Gold becomes soluble in surface waters by forming
complexes with thiosulphate, chloride, halides, organic ligands and cyanide (Reith et al.
2007). Abiogenic and biogenic processes then re-precipitate the complexed Au,
forming secondary Au.
Evaporation is an abiogenic process that is thought to promote Au precipitation. This is
because Au nano-plates have been shown to be intergrown with evaporite minerals,
(Hough et al. 2008). However, biogenically mediated precipitation has also well
documented, with bacteria shown to accumulate and precipitate Au (e.g.,Karthikeyan &
Beveridge 2002, Reith & McPhail 2006, Fairbrother et al. 2013). Gold (III) complexes
however, can be highly toxic to microbes (Nam et al. 2014). For example,
cyanobacteria have shown to precipitate Au nano-particles and form Au platelets
(Lengke et al. 2006). The Au enters the cell in its Au (III) form and then is reduced to
Au (0). However, before being reduced, the toxic Au (III) is thought to degraded the
cells, resulting in further Au precipitation (Lengke et al. 2006). Some bacteria have
developed mechanisms against the Au (III) toxic effects (e.g.Reith & McPhail 2006,
Checa et al. 2007, Reith et al. 2013), and in same case have used Au to its advantage.
This includes using Au-complexing ligands to gain metabolic energy and using Au as a
metal centre in enzymes (Southam et al. 2009).
Most Au grains are partially covered by a polymorphic layer. This layer is composed of
microbial biofilms, Au nano-particles and bacteriomorphic Au, clay-, iron- and silicate
minerals (Reith et al. 2010). The relationship between Au nano-particles and biofilms
suggests that biofilms may influence the rate of Au mobilisation and re-precipitation.

6
Few time constraints on secondary processes are yet to be established. Gold grains from
Precambrian environments in arid Australia and Palaeozoic to Oligocene temperate
environments in New Zealand have shown to display extensive secondary features
(Falconer et al. 2006, Fairbrother et al. 2012, Reith et al. 2012). Grains from these
environments have also shown that Au transformation is biologically mediated (Reith et
al. 2010, Fairbrother et al. 2012, Reith et al. 2012). Whether or not these processes
occur in younger, arctic environments is unknown. Hence, the aim of this study is to
assess the link between surface morphologies of gold grains and supergene
transformation processes in arctic settings. Areas of specific interest are: (i) if microbial
biofilms and polymorphic layers exist on the grains; (ii) if there are Au nano-particles
within these layers; and (iii) the morphologies and chemical composition of the grains.
To achieve this, gold grains from two localities in northern Finland were studied using
advanced micro-analytical techniques, including field emission scanning electron
microscopy (FEG-SEM), focused ion beam-scanning electron microscopy (FIB-SEM)
coupled with Energy Dispersive X-ray Spectroscopy (EDXS), and electron microprobe
analyses (EPMA).
4. GEOLOGICAL SETTING
The sites studied are located in the Ivalojoki and Lemmenjoki districts, approximately
20 km east and 80 km southwest of Inari, respectively, in northern Lapland, Finland.
The maximum temperature in the summer is 18°C and the minimum temperature is
-18°C in the winter. The annual rainfall is approximately 500–550 mm (Finnish
Meteorological Institute 2014). Approximately 10% of northern Finland is covered by
water bodies and 30% is covered by peat lands (Stigzelius 1977). Gold washing has

7
been occurring along the Inari river since the 19th
century (Puustinen 1991, Kojonen et
al. 2005). The size of Au grains can be a very fine dust to nuggets weighing hundreds of
grams (Puustinen 1991).
Geologically, Ivalojoki and Lemmenjoki are located in the southern part of a granulite
belt (Saarnisto et al. 1991, Kojonen et al. 2005). The complex was metamorphosed
during the Svecokarelian Orogeny (~1.9 Ga), under granulite conditions (Saarnisto et al.
1991, Tuisku et al. 2006). Northern Finland was glaciated during the Pleistocene
(Stigzelius 1977). Deglaciation began in northern Finland approximate 11,600 years ago
(Lunkka et al. 2004). During deglaciation, river valleys acted as meltwater channels.
Most of the Au fields are interpreted as glaciofluvial placers, varying in size and
Figure 1: Finland sample site locations; insert Lemmenjoki, (1) (Miessi) Turkka’s Claim,
(2) Jäkäläpää Claim, (3) (Miessi) Pekka’s Claim, (4) (Miessi) Raimo’s Claim, (5) Kaarreoja
Claim, (6) (Miessi) Ami’s Claim. Insert Ivalojoki. (1) Ivalojoki 1, (2) Aila’s Claim, (3)
Risto’s Claim. Modified after Google Earth.

8
composed of poorly sorted sediments (Saarnisto et al. 1991, Kinnunen 1996). Gold has
also been discovered in river terraces, bottom sands and tills (Saarnisto et al. 1991).
Gold samples were taken from nine main sites, all of which are currently mining claims.
Three sites were within the Ivalojoki district and six were within the Lemmenjoki
district (Fig. 1). Sites were chosen based on contrasting elevations and settings (Table
1).
Table 1: Summary of the environmental properties at the sampling sites.
Sample Name
District GPS coordinates Approximate elevation relative to sea level (m)
Setting Depth of sample (m)
Ivalojoki 1 Ivalojoki 35W, N68 27’27.6” E26 56’49.4” 260 Till 2
Aila’s Claim
Ivalojoki 35W, N68 27’31.6” E26 56’34.8” 270 Till 2-3
Risto’s Claim
Ivalojoki 35W, N68 25’12.0” E26 54’50.0” 230 Alluvial N/A
Jäkäläpää Claim
Lemmenjoki 35W, N68 41’54.0” E25 43’42.1” 450 Till 1
(Miessi) Turkka’s Claim
Lemmenjoki 35W, N68 42’31.1” E25 42’01.2” 440 Till with alluvial reworking
N/A
(Miessi) Pekka’s Claim
Lemmenjoki 35W, N68 41’40.0” E25 41’08.7” 403 Till with alluvial reworking
1
(Miessi) Raimo’s Claim
Lemmenjoki 35W, N68 39’54.9” E25 36’18.3” 438 Till with alluvial reworking
n.r.
Kaarreoja Claim
Lemmenjoki 35W, N68 39’06.0” E25 37’45.4” 358 Till 3
(Miessi) Ami’s Claim
Lemmenjoki 35W, N68 38’59.0” E25 37’46.7” 361 n. r. N/A
5. METHODS
Gold grains from the Ivalojoki and Lemmenjoki districts were collected in August 2013.
Grains were collected from each site according to a field sterile procedure aimed at
preventing contamination and preserving delicate structures (Reith et al. 2010). Gold

9
grains were washed and stored in 1–2 ml of sterile physiological solution (0.9 wt. %
NaCl) and were kept cool whist transported to the laboratory.
Gold grains from each site were either air dried or dehydrated. Dehydration was
completed using increments of ethanol (70%, 90% and 100%) and then 100%
Hexamethyldisilazane (HDMS), before drying. Ten uncoated, air dried samples and 28
dehydrated, C-coated samples were analysed using field emission scanning electron
microscopes (Quanta 450, Phillips XL-30, Adelaide Microscopy, University of
Adelaide). Images of surface features were collected in secondary electron and
backscatter imaging mode at 5kV and 20kV, respectively. Selected samples were
further analysed using a focus ion beam secondary electron microscope (FIB-SEM;
Helios NanoLab DualBeam). Images of the surface features were collected at 2 to 20kV
and 86pA, with sectioning and cleaning at 20kV and 9.7pA. Sectioning was completed
to observe the processes occurring within the polymorphic layers. The instrument was
equipped with an Energy Dispersive X-ray Spectroscopy (EDXS); this was used to
collect element maps across grain surfaces and milled sections.
Other Au grains were set in epoxy resin, polished with 1 µm diamond paste and coated
with a 15 nm thick carbon film. One to four grains from each site were quantitatively
mapped using a Cameca SXFive Electron Microprobe running the PeakSite software for
instrument control, and Probe for EPMA™ for data acquisition and processing
(Adelaide Microscopy, University of Adelaide). The SXFive was equipped with five
WLD X-Ray detectors. The MAN background correction and elemental pixel
quantification were performed in CalcImage, and false colourisation and formatting was
completed in Surfer™. Analysis was conducted at 20kV and 150nA. The grains were
analysed for (detection limit range in parenthesis in wt.%): Au(0.99–2.9), Ag(0.45–

10
0.49), Cu(0.25–0.61), As(0.43–0.60), Zn(0.33–0.85), Ti(0.09–0.15), Fe(0.18–0.39),
S(0.16–0.17). All elements were calibrated on a mixture of minerals and pure metal
standards from Astimex and P&H. Cu, Fe and S were calibrated on chalcopyrite; As on
gallium arsenide; Zn on sphalerite; Ag on Telluride; Ti on Rutile; and Au on a pure
metal standard.
6. OBSERVATIONS AND RESULTS
5.1 Gold grains from Ivalojoki, Finland
5.1.1 IVALOJOKI 1
Grains from Ivalojoki 1 ranged in size from approximately 1.5 to 1.8 mm in diameter.
Grains were irregular and had rounded edges that can be partially folded (Fig. 2a). Other
than folded edge, there was little physical damage to the grains.
Nano-particulate Au and conglomerates of Au µ-crystals were common throughout a
polymorphic layer (Fig. 2b). Sheet-like Au, resembling the shape of triangles, were also
observed (Fig. 2c). An EDXS element map across a section of the grain surface and
polymorphic layer showed Au dispersed through the layer (Fig. 2e). Silver did not
appear with Au in the polymorphic layer (Fig. 2f). The polymorphic layer consisted of
Fe, Si, (Fig. 2g, h), C, O, Na, Mg, Al, and P and occurred mostly in the topographic
lows.
Three Au grains were quantitatively mapped using the Cameca SXFive Electron
Microprobe. The element maps across grain interiors showed an Au enriched rim that
can be as thick as 40 µm (Fig. 3a). Areas of greatest thickness occurred partially around

11
a b
c d
Si
A
g Au e f
Fe h g
Figure 2: Backscatter electron (BSE, a, b) and scanning electron (SE, c, d) micrographs and
EDXS maps (e–h) of Au grains from Ivalojoki 1, Ivalojoki, Finland. (a) Micrograph
showing a typical irregular Au grain with rounded and partially folded edges; (b) conglomerate of Au µ-crystals surrounded by Au nano-particles in the polymorphic layer;
(c) micrograph showing the polymorphic layer described in (b); (d) a sheet-like, secondary
Au plate; (e–h) EDXS maps of Au, Ag, Fe and Si concentrations (wt. %).

12
inclusions. Other grains showed partial or no enrichment of Au at the margins. Gold
concentrations on the rim of the grains can be as high as 100% Au, with core
concentrations varied, but always >85% Au. Sliver concentrations also varied, with
minimum concentrations at the Au enriched rims. The Ag concentration within the grain
core can be as high as 13.38% Ag (Fig. 3b), or in one grain, below detection limit of
0.47% Ag. Trace elements were also analysed. Grain margins showed maximum Fe
concentrations, as high as 35.50% Fe (Fig. 3c). Elements below detection limit included
Ti, Zn, As and Cu. There were inclusions ranging from 40 to 200 µm.
Figure 3: Electron microprobe maps of Au, Ag and Fe concentrations in a polished section of two Au grains from Ivalojoki 1, Ivalojoki, Finland. (a) Maximum concentrations of Au 100 wt.%; (b)
maximum concentration of Ag 13.37 wt.%; (c) maximum concentrations of Fe 35.50 wt.%.
Max
a b
c Min
Au
Fe
Ag
Max

13
Bacterial cells were observed in the polymorphic layer (Fig. 4a, b) and can be
surrounded by what appeared to be fungal hyphae Singular rod-shaped bacterial cells
were observed in relatively protected areas on the grains, attached by pili (Fig. 4c, d).
Cells were up to 3µm in length and can be surrounded by nano-particles (Fig. 4d).
5.1.2 AILA’S CLAIM
Grains from Aila’s Claim ranged in size from approximately 0.8 to 1.1 mm in diameter.
Grains were commonly irregular but can be branching. Grain edges had been
Figure 4: Electron micrographs of Au grains from Ivalojoki 1, Ivalojoki, Finland, showing (a) typical
features of the polymorphic layer, with bacterial cell (arrow); (b) conglomerate of Au µ-crystals,
surrounded by Au nano-particles and bacterial cell (arrow) dispersed through the polymorphic layer;
(c) a bacterial, rod-shaped cell attached by pili; (d) a bacterial rod-shaped cell surrounded by Au
nano-particles (arrows).
a b
c d

14
rounded and folded (Fig. 5a). Grains appeared to be battered and striations were
common on the surface (Fig. 5b). Pitted surfaces were observed on the grain (Fig. 5c).
Figure 5: BSE (a, c–e) and SE (b) micrographs of Au grains from Aila’s Claim, Ivalojoki, Finland,
showing (a) a typical Au grain with rounded and partially folded edges; (b) the physically damaged
grain surfaces; (c) dissolution pits on the grain surface and budding Au forming bridging structures;
(d) Au µ-crystals and nano-particles dispersed through the polymorphic layer; (e) triangular-shaped,
flat Au crystal.
e
d c
b a

15
Similar to Ivalojoki 1, grains were partially covered by a polymorphic layer,
predominantly in the topographic lows and cavities. Budding Au can appear to be
creating bridging structures over the polymorphic layer (Fig. 5c). The polymorphic
layer contained Au µ-crystals (Fig. 5d), Au nano-particles, sheet-like Au (Fig. 5e) and
biological material.
Rod-shaped cells can be in a cluster or singular. They were usually protected in larger
cavities and could appear along with relics of diatoms. Cell size ranged between 2.5 to
3.5 µm and can be surrounded by nano-particles.
Three element maps across grain interiors showed partially developed Au enriched rims
on some grains and others that were completely homogenous. The Au concentrations at
the rim of the grain can be as high as 100% Au, with varied core concentrations, always
>86% Au. The Ag concentrations within the grain core can be as high as 10.09% Ag or
below the detection limit of 0.47% Ag. Trace elements were also analysed, showing
higher concentrations of S, Zn and Cu inconsistently along the grain margins.
Concentrations of S along the margins, and with minor amounts in the core, had a
maximum value 1.69% S. Other maximum values were 1.02% Zn and 0.78% Cu.
Elements below detection limit include As. Inclusions were found internally and on the
edges of grains. They can range in size from 80 to 120 µm. Inclusions on the edges can
have Fe concentrations as high as 21.18% Fe. Internal inclusion showed to contain Ti
with a maximum concentration of 35.23% Ti.
5.1.3 RISTO’S CLAIM
Grains from Risto’s Claim were between 0.20 to 0.25 mm in diameter. Grains can be
equant or irregular (Fig. 6a). They were flattened, with sub-rounded to rounded edges.

16
The gold surface was mostly smooth but can have randomly orientated carved, striated
channels. Pits were seen in areas that were more physically damaged (Fig. 6b).
A polymorphic layer can cover a large proportion of the grain or just partially cover
areas, again remaining in the topographic lows. Gold can appear to be dissolving into
the polymorphic layer (Fig. 6c) and branching Au was observed. This site had fewer
nano-particulate and µ-crystals dispersed in the layer than grains from other Ivalojoki
sites (Fig. 6d).
Extensive biological material was observed over grain surfaces, composed of C, N and
O. This material was found in both the polymorphic layer and in direct contact with the
Au grain surface.
Figure 6: SE (a) and BSE (b–d) micrographs of Au grains from Risto’s Claim, Ivalojoki, Finland,
showing (a) a typical flattened grain with rounded edges; (b) the physically damaged grain surfaces;
(c) Au dissolving into the polymorphic layer, (d) the highly transformed grain surfaces with few Au
nano-particles and budding structures.
a b
c d

17
5.2 Gold grains for Lemmenjoki, Finland
5.1.1 JÄKÄLÄPÄÄ CLAIM
Grains from Jäkäläpää Claim ranged in size from approximately 0.70 to 1.56 mm in
diameter. A variety of morphologies were observed including flattened, elongate,
equant, irregular and branching Au (Fig. 7a). The grains had sub-rounded to rounded
edges, with one almost spherical grain. There were partially folded edges and surfaces
can be smooth or uneven. Some grains appeared battered.
Figure 7: SE (a, d) and BSE (b, c) micrographs of Au grains from Jäkäläpää Claim, Lemmenjoki,
Finland, showing (a) a branching Au grain with sub-rounded edges; (b) budding Au and extensive
Au nano-particles dispersed through the polymorphic layer; (c) Au µ-crystals and Au nano-
particles accumulating in a Ti rich part of the matrix; (d) a pyrite particle (red arrow) and a
biomineral (orange arrow).
d c
a b
18
Figure 8: Electron micrographs (a, b) and EDSX maps (c–h) of an Au grain from Jäkäläpää
Claim, Lemmenjoki, Finland, showing (a) typical surface features of the grains; (b) FIB-SEM
micrograph showing a milled section through a layer of material similar to that shown in (a);
(c–d) EDXS maps of Au, Ag, Fe, C, O and Ti concentrations (wt.%) of the milled sections
shown in (b).
a b
c d Au
u Ag
u
e
O
C Fe f
h g T
i

19
The grains can be almost completely or partially covered by a polymorphic layer.
Within the layer there was wire-like organic material, Au nano-particles (Fig. 7b) and µ-
crystals, which were generally concentrated in regions of high Ti (Fig. 7c). This site had
the most extensive Au nano-particles. Single euhedral pyrite particles, approximately
1.5 µm wide, were observed (Fig. 7d). The pyrite were undamaged, showing well
defined edges and corners and relatively smooth faces. Biological material, including
what appeared to be fungal hyphae, were seen in the polymorphic layer and in direct
contact with the grain surface. Biominerals were also observed (Fig. 7d).
An EDXS element map across a milled section of a grain showed Au dispersed through
the polymorphic layer (Fig. 8). The Au appeared to be enriched at the grain surface and
polymorphic layer interface (Fig. 8c). Silver concentrations also appeared to be depleted
in this zone (Fig. 8d). This layer was composed of Fe, O, C, Ti (Fig. 8c–h), Si, Al, Na,
Mg and P and can sometimes appear quite thick.
Six Au grains were quantitatively mapped using the Cameca SXFive Electron
Microprobe. The element maps across grain interiors showed a variety of Au and Ag
concentrations. Grains can show early development of Au enriched rims, whilst others
had homogenous Au concentrations across the entire grain (Fig. 9a). Maximum Ag
concentrations ranged from 2.52 to 46.07 % Ag. The maximum Ag concentrations
occurred in Ag enriched bands through the core (Fig. 9b). These bands had sharp
boundaries. Trace elements were also analysed. Minor amounts of S can be throughout
grain interiors, as high as 1.40 % S. Along the grain margins Zn, Ti and Fe was
observed (Fig. 9c). Elements below detection limit include As. Grains can contain
numerous inclusions that ranged in size from 50 to 230 µm.

20
5.2.2 (MIESSI) TURKKA’S CLAIM
Grains from (Miessi) Turkka’s Claim ranged in size from approximately 0.60 to 1.42
mm in diameter. Grains were elongate, equant or wire grains (Fig. 10a). They had sub-
rounded to rounded edges. Linear and curved, randomly orientated scratches were
common. Grains can appear to be battered (Fig. 10b).
Min Max
a
b
c
Figure 9: Electron microprobe maps of Au, Ag and Fe concentrations in a polished section of
two Au grains from Jäkäläpää Claim, Lemmenjoki, Finland. (a) Maximum concentrations of
Au 100 wt.%; (b) maximum concentration of Ag 46.07 wt.%; (c) maximum concentrations of
Fe 32.07 wt.%.

21
Grains were almost completely covered or partially covered with a polymorphic layer
(Fig. 10b). This layer was composed of Al, Si, Fe, O, C, Na, Mg, P, K and Ti. Grains
Figure 10: BSE (a, b, d) and SE (c) micrographs and an electron microprobe map of Au grains from
(Miessi) Turkka’s Claim, Lemmenjoki, Finland showing (a) a wire Au grain with rounded edges; (b)
the typical textured grain surface; (c) a network of biological nano-wires (arrows) running through
the polymorphic layer; (d) triangular and spherical shaped Au nano-particles; (e) minimum
concentrations of Au 60 wt.%, maximum concentrations of Au 100 wt.%.
a b
c d
e Au

22
that were almost completely covered by this layer had extensive biological material.
Biological nano-wires (Fig. 10c) and singular rod-shaped cells were also observed. The
cells can be throughout the polymorphic layer or in direct contact with the grain surface.
They ranged in size from 2.5 to 3.5 µm. Putative fungal hyphae were observed in
protected, low topography areas.
Nano-particles were dispersed throughout the polymorphic layer, shaped triangular and
spherical (Fig. 10d). There was branching Au but it was not as extensive as observed on
samples from other sites.
Three element maps across grain interiors showed variation amongst grains. Grains can
have irregular enriched Au rims, having concentrations as high as 100% Au and
thicknesses ranging from non-existent to 50 µm (Fig. 10e). Grain can have
homogeneous concentrations of Au across the entire grain, averaging >98% Au. The Ag
content was homogenous in all grains, with concentrations as high as 15.87% Ag. The
enriched Au rims can have little to no Ag. Trace elements were also analysed. Elements
that were below detection limit include Zn and Cu. Small amounts of As was observed
and Ti and Fe can be found on edges. Concentration of S can be as high as 22.07% S.
There were inclusions on the edges of the grains.
5.2.3 (MIESSI) PEKKA’S CLAIM
Grains from (Miessi) Pekka’s Claim ranged in size from approximately 0.08 to 0.35 mm
in diameter. Grains were flattened and can be elongate to equant (Fig. 11a). They had
sub-rounded to rounded edges, with some folded edges. There were striations randomly
orientated and pits that were filled with matrix. Striations can be linear or curved.
23
Grains were partially covered by a polymorphic layer (Fig. 11b), composed of C, O, Fe,
Na, Al, Si and P. This layer can appear quite thick. Singular, rod-shaped bacterial cells
were observed on the grain surface (Fig. 11c). Other biological material, Au nano-
particles (Fig. 11d) and µ-crystals were dispersed throughout the polymorphic layer.
Branching gold was also observed.
One element map across a grain interior showed lower concentration of Au than grains
from other sites. There were partial zones of higher Au at the margins, with a maximum
concentration of 95.98% Au. The Au concentration at the core of the grain was >80%
Au. Silver was homogenous throughout the core and showed no depletion where Au
was highest. The concentration of Ag can be as high as 9.72% Ag in the core. Silver
concentrations were lowest at the margins, <5% Ag, creating a consistent rim that
mimicked the shape of the grain. Trace elements were also analysed. Traces of Zn and
a b
c d
Figure 11: BSE (a, d) and SE (b, c) micrographs of Au grains from (Miessi) Pekka’s Claim,
Lemmenjoki, Finland, showing (a) an elongate grain with sub-rounded edges; (b) the typical features
of the polymorphic layer; (c) bacterial, rod-shaped cells (arrows) on the grain surface; (d) Au nano-particles dispersed through the polymorphic layer.

24
Cu were along grain margins, reaching maximum concentrations of 0.84% Zn and
0.61% Cu. Thicker zones of Fe also occurred along parts of margins, reaching a
maximum thickness of 40 µm and concentration of 39.01% Fe. Elements below
detection limit include As and Ti. Inclusions were seen on some grains.
5.2.4 (MIESSI) RAIMO’S CLAIM
Grains from (Miessi) Raimo’s Claim ranged in size from approximately 0.60 to 2.00
mm in diameter. Grains can be irregular or branching. They were flattened and have
sub-rounded to rounded edges (Fig. 12a). Randomly orientated scratches can be curved
or linear (Fig. 12b). Grains can appear battered.
Polymorphic layer material was mostly observed in cavities. Rod shaped bacterial cells
were approximately 3 µm in length and can be in clusters or singular (Fig. 12c). Cells
can be surrounded by nano-particles (Fig. 12d) and can be in direct contact with the
grain surface or in the matrix. Gold nano-particles were dispersed through the
polymorphic layer and branching Au can form bridges (Fig. 12e).
Two element maps across grain interiors showed some grains with poorly developed Au
enriched rims. The rims can have concentrations as high as 100% Au and have a
thickness up to 20 µm. The Au concentration at grain cores can be as low as 86% Au.
The grain core can have Ag concentrations a high as 12.41% Ag. Similarly to Jäkäläpää
Claim, grains can have bands of high Ag concentrations (maximum 28.93% Ag), that
run through the core. The bands had sharp boundaries and had lower Au concentrations.
Trace elements were also analysed. Minor amounts of Zn and S were observed on the
margins, with much more Fe. Elements that were below detection limits include As and
Cu. There can be small inclusions containing Cu, Fe, S.

25
5.2.5 KAARREOJA CLAIM
Grains from Kaarreoja Claim ranged in size from approximately 0.45 to 1.20 mm in
diameter. Grains can be wire Au and have rounded edges (Fig. 13a). There were curved
striations on the grain surface.
a b
c d
e
Figure 12: SE (a–c) and BSE (d, e) micrographs of Au grains from (Miessi) Raimo’s Claim,
Lemmenjoki, Finland, showing (a) a flattened, branched grain; (b) biological material on the physically
damaged surfaces; (c) a cluster of rod-shaped bacterial cells on the surface of the polymorphic layer;
(d) the bacterial cells shown in (c) surrounded by Au nano-particles; (e) budding Au forming bridging
structures.

26
Figure 13: BSE micrographs (a, b) and electron microprobe maps (c–h) of Au grains
from Kaarreoja Claim, Lemmenjoki, Finland showing (a) a wire Au grain with
rounded edges; (b) Au nano-particles dispersed through the polymorphic layer;
electron microprobe maps of Au (c, e, g; maximum concentration 100 wt.%) and Ag
(d, f, h; maximum concentration 23.88 wt.%). Note the lack of Ag at enriched Au
rims.
a b
c d Ag Au
Au
e f
h Ag
Min Max

27
A polymorphic layer partially covers grains, again mostly in topographic lows and
cavities. The polymorphic layer can contain nano-particles, mostly spherical in shape
(Fig. 13b), nano-wires and less common budding Au.
Three element maps across grain interiors showed some grains with poorly developed
Au enrich rims and others with irregular patterns (Fig. 13c, e, g). Gold concentrations
on the rim of the grains can be as high as 100% Au, with varied core concentrations,
always >75% Au. In central areas of the grains, Ag-rich bands up to 40 µm wide were
observed, with Ag concentrations up to 18.00% Ag (Fig. 12f, h). The bands boundary
can be sharp or diffuse. Core Ag concentrations can be as high as 23.88% Ag (Fig.
13d). Trace elements were also analysed. Minor amounts of S were observed
throughout the grains, with concentrations reaching 1.37% S. Grain margins had
elevated concentrations of Fe. Elements below detection limit include As, Zn and Cu.
Inclusions contained Ti and Fe. Inclusions ranged in size from approximately 10 to 100
µm.
5.2.6 (MIESSI) AMI’S CLAIM
Grains from (Miessi) Ami’s Claim ranged in size from approximately 0.80 to 1.55 mm
in diameter. Grains had rounded edges but can be irregular (Fig. 14a). There was minor
physical damage on surfaces, including few scratches and some battering and folded
edges.

28
Most of the grains surfaces were exposed, with a polymorphic layer only in the few
cavities and topographic lows (Fig. 14b). The layer contained spherical nano-particulate
Au (Fig. 14c) and biological material. Budding Au was common and can be bridging
Figure 14: BSE (a–c) micrographs and electron microprobe maps (d, e) of Au grains from (Miessi)
Ami’s Claim, Lemmenjoki, Finland showing (a) an irregular Au grain with sub-rounded edges; (b)
typical surface features of the grains; (c) increased magnification of Au nano-particles, area
highlighted in (b); (d, e) electron microprobe maps of Au (d; maximum concentrations 100 wt.%)
and Ag (e; maximum concentrations 11.66 wt.%).
500 µm
500 µm
Ag
Au
e
c d
b a
Min Max

29
over the matrix. Biological material was also observed on exposed grain surfaces, along
with some singular rod-shaped cells.
Four element maps across grain interiors showed homogenous Au concentrations
throughout cores, but varying purity amongst grains (Fig. 14d, e). Most of the grains
had core Au concentrations >85% Au, but can reach an average >99% Au. Grains can
show minor amounts of enriched Au at the margins (Fig. 14d). The Ag content was
homogenous across grain interiors but can appear to increase in concentration towards
the margins. The Ag content can be as high as 22.12% Ag or as low as <0.5% Ag. The
highest Ag concentrations occurred as slightly curved, thin, sharply defined bands that
were 10 µm wide, similar to that observed on grains from Jäkäläpää Claim. The bands
can run through the entire grain, from margin to margin. Trace elements were also
analysed. Concentrations of S can occur at the margins, with maximum values of 2.98%
S. Concentrations of Fe also occurred on the margins. Elements below detection limit
include As, Zn, and Cu. Internal and exposed inclusions, containing Ti, were observed
in grains.
7. DISCUSSION
All Finland grains studied showed signs of physical damage indicative of glacial and
alluvial transportation, including rounded and folded edges, striations and cavities. With
increased transport, grains become rounded and then flattened and develop smooth,
clean to pitted surfaces (Groen et al. 1990, Knight et al. 1999). Grains studied from sites
furthest north from either Ivalojoki or Lemmenjoki were irregular and show partially
folded edges. Grains from Ivalojoki become more rounded and eventually flattened as
sites changed from glacial till to alluvial. Grains from Lemmenjoki transgressed from

30
irregular to elongated and wire Au morphologies from glacial till to alluvial sites.
Randomly orientated striations, observed on most Finland grains, are evidence of
physical transport via glacier (Kinnunen 1996).
Pits on grain surfaces can be the result of physical damage (Kinnunen 1996), removal of
crystals (Larizzatti et al. 2008) or dissolution (Lawrance & Griffin 1994). Many of the
pits found on the Finland grains appeared within areas of extensive scratching and are
therefore likely to have been obtained through physical damage. However, some of the
pits observed on grains from Aila’s Claim, in particular, are the result of dissolution
(Fig. 5c). Dissolution pits generally produce irregular, mottled surfaces, like the
surfaces observed on these grains (Lawrance & Griffin 1994, Falconer & Craw 2009).
These surfaces appeared in close proximity to re-precipitation features.
The mobility of metals in the supergene environment may be enhanced by colloids
(Weber et al. 2009). This is because colloids have a high dislocation content (Hough et
al. 2008). Gold nano-particles were observed on all grains studied. There have been
contrasting views on the formation of nano-particles. It has been linked to inorganic
processes, particularly evaporation (Hough et al. 2011). However, nano-particulate Au
has been observed on grains collected from wet environments, where evaporation is an
unlikely influence. Reith et al. (2012) suggested that in these conditions, active biogenic
processes may facilitate the formation of nano-particles. The presence of Au nano-
particles in polymorphic layers (consisting of microbial biofilm and residual biofilm
material) observed on grains from Australia (Reith et al. 2010, Fairbrother et al. 2012)
and New Zealand (Reith et al. 2012) provides further indication of the importance of
biogenic active processes. Similar polymorphic layers observed on Finland grains, and

31
the arctic climate, suggests that abiogenic processes are the most likely to contribute to
the formation of Au nano-particles.
Gold interactions with humic substances have been described as a possible method of
colloidal Au formation. Humic acids are capable of reducing Au to its colloidal form,
particularly in the hydrosphere (Baker 1978). Of the humic acids, fulvic acids are the
most water soluble (dos Santos Jr et al. 2005). Fulvic acids are also capable of
dissolving Au. They do so by providing potential ligands for Au complexing. (Bowell et
al. 1993). It is suggested that the acid in solution in the alluvial profile at Risto’s Claim
is responsible from the dissolution features (Fig. 6c) and minimal Au nano-particles
(Fig. 6d) observed on the grains.
Micro-organisms are able to facilitate the solubilization of Au if it can promote Au
oxidation and excretes the specific ligands that form complexes with Au (Reith et al.
2007). Bacterial cells and/or putative fungal hyphae were observed on most grains
studied. An in vitro study completed by Reith and McPhail (2006), showed that after 45
days of incubation, microbiota were able to solubilized up to 8o wt. % of native Au.
Bacterial cells have also shown to accumulate Au on external cell surfaces and
internally (Reith et al. 2006). The bacterial cells observed on Finland grains generally
appeared in close proximity to Au nano-particles, suggesting a possible influence on
particle mobility. The putative fungal hyphae were seen on Au grains from Ivalojoki 1
and Jäkäläpää Claim and were similar to that observed on grains from New Zealand
(Reith et al. 2012). Studies have shown that fungi are also able to accumulate Au
(Nakajima 2003, Borovička et al. 2010).
Gold has a high natural affinity towards itself, promoting the formation of aggregation
features (Lawrance 2001). Aggregation features are the result of repeated nucleation of
32
Au nano-particles, forming chain structures and Au conglomerates, as observed most
commonly on grains from Ivalojoki 1 (Fig 2b; 4b). Continuous re-precipitation of Au
via aggregation can result sheets of secondary Au, where the individual particles are still
distinguishable (Falconer & Craw 2009). These features are observed on grains from
Aila’s Claim and (Miessi) Raimo’s Claim (Fig. 5e; 12e).
High purity Au-rich rims are indicative of supergene transformation processes. They
can form by re-precipitation of Au (discussed above) and/or de-alloying of Ag. Partially
developed Au-rich rims were observed on most Finland grains studied. The Au and Ag
concentrations appear to be inversely proportional, with little to no Ag where there was
Au enrichment.
A number of features favour Au re-precipitation as a method of Au enriched rims.
Supergene Au is generally coarser than grains found from the potential primary
material, suggesting growth of grains in the current environment (Reith et al. 2007).
There are small inclusions that appear within the enriched Au rim (Fig. 10; 13) and
were likely to be incorporated during Au re-precipitation (Groen et al. 1990). Supergene
Au also displays a number of morphotypes (e.g. porous Au, wire and branched Au
networks) that are not characteristic of primary Au. The delicate nature of these surface
structures could not survive transport (Youngson & Craw 1993).
However, there is evidence to suggest Ag de-alloying is responsible for Au-rich rims.
Grains with irregular core/rim boundaries that create deep embayment into the core,
such as a grain from Kaarreoja Claim, Lemmenjoki (Fig. 13c), may be the result of Ag
leaching (Youngson & Craw 1993). This feature is explained by a method of Ag
leaching is described by Desborough (1970). When Ag becomes oxidised, its size is
reduced, resulting in its removal from its site in the alloy. Repetition of this process

33
creates new Au/Ag alloy interfaces, resulting in porous rims. Some authors suggest that
the diffusion of Ag is far too slow to create the sharp boundaries between the enriched
Au rim and the core of the grain (Groen et al. 1990). However, others argue that the
sharp boundary indicates Ag leaching in low temperature conditions (Desborough
1970).
Gold grains from Jäkäläpää Claim, Kaarreoja Claim and (Miessi) Ami’s Claim
displayed Ag-rich bands through the core. Fairbrother et al. (2012) suggest this may be
the result of selective leaching of Ag along preferential flow paths or the fusion of
multiple smaller grains. Preferential leaching of Ag is preferred because the Ag-rich
bands occur mostly in grains with otherwise homogenous cores. (Hough et al. 2009).
However, some grains have bands that mimic grain boundaries, particularly those from
Kaarreoja Claim, Lemmenjoki (Fig. 13h).
Single euhedral pyrite particles were seen on the surface of gold grains from Jäkäläpää
Claim. Due to the little physical damage, it is believed that they formed in the surface
environment. Pyrite can form through microbial sulfate reduction (Falconer et al. 2006).
Sulfate reduction can also lead to the formation of Au-thiosulfate complexes (Fitz &
Cypionka 1990), which in turn, facilitates the mobilisation of Au. An in vitro study
completed by (Lengke & Southam 2007), has shown that sulfate-reducing bacteria, in
the presence if Au-thiosulfate complexes, were able to precipitate Au from the solution.
Sulfate reducing bacteria can be highly active in organic-rich sediments (Winfrey &
Ward 1983), and thus, may be an important contributor to the formation of pyrite
particles and the complexing of Au in the Finland environments studied.
The core Au and Ag concentrations varied between sites and also between grains from
the same site. For example, grains from (Miessi) Ami’s Claim can be almost completely

34
pure Au or can contain more than 10% Ag. Grains that have higher Au overall
concentrations generally have experienced greater supergene transformation, where as
grains with high Ag content and low rims suggests they have recently been eroded from
the primary source (Reith et al. 2012). The variance in grains of close proximity may
suggest the presence of different Au populations from different primary sources that
have now been grouped together as a result of glacial and alluvial transport. The
differences between sites may also suggest different primary sources or could reflect
differing post-deposition weathering conditions.
Gold grains from Precambrian environments in Australia and Palaeozoic to Oligocene
environments in New Zealand have shown to display extensive secondary features
(Falconer et al. 2006, Fairbrother et al. 2012, Reith et al. 2012). It has been thought that
supergene Au is not common on grains found in locations that were glaciated during the
Pleistocene (Wilson 1984). However, northern Finland was glaciated at this time and
has been show in this study to not only host supergene Au, but also have grains with
secondary features. With increased time, continuous dissolution and precipitation
increases the width of the Au-rich rim (Reith et al. 2012). Therefore, estimations about
the extent of supergene transformation experienced by grains can be made. As expected,
grains from the older environments in Australia and New Zealand showed much more
developed Au enriched rims than observed on Finland grains. However, as discussed,
most Finland grains showed signs of early stages of high purity Au rims, suggesting
secondary transformation processes begin not long after deposition.
8. CONCLUSIONS
Deglaciation of Northern Finland began 11,600 years ago, suggesting that supergene Au
transformation processes begin not long after deposition. Gold grains studied from

35
northern Finland’s arctic conditions display a range of re-precipitation and dissolution
features. The variety of chemical compositions and Au morphotypes on grains from the
same site suggests different primary sources. Extensive nano-particulate Au, dispersed
through polymorphic layers, and branching Au networks highlight the environmental
mobilisation of Au and the subsequent aggregation and re-precipitation onto pre-
existing Au particles. Dissolution features and a lack of nano-particles on grains from
high organic matter environments suggest that fulvic and humic acids are important
contributors in the transformation of Au. Bacterial cells and putative fungal hyphae
were closely associated with Au nano-particles. These results shows that the model of
processes responsible for supergene Au transformation introduced by Fairbrother et al.
(2012) is also valid in arctic environments. Further research could include trace element
analysis to determine possible primary sources or characterisation of the biofilm
communities involved in gold cycling in the arctic zone.
9. ACKNOWLEDGMENTS
This study acknowledges the following individuals and institutions for their
contributions: The University of Adelaide, CSIRO Land and Water, F. Reith, A. Pring,
R. King, K. Howard, J. Zhao and R. Kittle. Equipment and instrument support provided
by the South Australian Museum and Adelaide Microscopy. Funding provided by ARC-
LP100200102 to F.Reith. Special thanks to Kai ‘Mullis’ Rantanen, Vasant Mäkinen,
Heikki Kalliomannila, Aila Hekkilä and family, Risto and Maija Risto and Maija
Vehviläinen, Pekka Turkka, Raimo Kanamäki, Antti Kohtamäki, Sirka and Kari
Merentuoto, Ami Telilä, Pekka Itkonen and Pekka Salonen, the Gold Prospectors
Association of Finnish Lapland as well as all other friends for their warm welcome,
access to sites and the fantastic samples. Thanks also to Manfred and Brigitte Roos, and
Tina Khine for help with sampling and sample preparation.
10. REFERENCES
BAKER W. E. 1978. The role of humic acid in the transport of gold. Geochimica et Cosmochimica Acta 42, 645-649.
BOROVIČKA J., DUNN C. E., GRYNDLER M., MIHALJEVIČ M., JELÍNEK E., ROHOVEC J., ROHOŠKOVÁ
M. & ŘANDA Z. 2010. Bioaccumulation of gold in macrofungi and
36
ectomycorrhizae from the vicinity of the Mokrsko gold deposit, Czech Republic. Soil Biology and Biochemistry 42, 83-91.
BOWELL R., GIZE A. & FOSTER R. 1993. The role of fulvic acid in the supergene migration of gold in tropical rain forest soils. Geochimica et Cosmochimica Acta 57, 4179-4190.
CHECA S. K., ESPARIZ M., PÉREZ AUDERO M. E., BOTTA P. E., SPINELLI S. V. & SONCINI F. C. 2007. Bacterial sensing of and resistance to gold salts. Molecular Microbiology 63, 1307-1318.
DESBOROUGH G. A. 1970. Silver depletion indicated by microanalysis of gold from placer occurrences, western United States. Economic Geology 65, 304-311.
DOS SANTOS JR D. S., ALVAREZ-PUEBLA R. A., OLIVEIRA JR O. N. & AROCA R. F. 2005. Controlling the size and shape of gold nanoparticles in fulvic acid colloidal solutions and their optical characterization using SERS. Journal of Materials Chemistry 15, 3045-3049.
FAIRBROTHER L., BRUGGER J., SHAPTER J., LAIRD J. S., SOUTHAM G. & REITH F. 2012. Supergene gold transformation: Biogenic secondary and nano-particulate gold from arid Australia. Chemical Geology 320–321, 17-31.
FAIRBROTHER L., ETSCHMANN B., BRUGGER J., SHAPTER J., SOUTHAM G. & REITH F. 2013. Biomineralization of gold in biofilms of Cupriavidus metallidurans. Environmental science & technology 47, 2628-2635.
FALCONER D., CRAW D., YOUNGSON J. & FAURE K. 2006. Gold and sulphide minerals in Tertiary quartz pebble conglomerate gold placers, Southland, New Zealand. Ore Geology Reviews 28, 525-545.
FALCONER D. & CRAW D. 2009. Supergene gold mobility: a textural and geochemical study from gold placers in southern New Zealand. Supergene environments, processes and products. Econ Geol Spec Publ 14, 77-93.
FINNISH METEOROLOGICAL INSTITUTE 2014. Normal Perids 1981-2010 <http://en.ilmatieteenlaitos.fi/normal-period-1981-2010>.
FITZ R. M. & CYPIONKA H. 1990. Formation of thiosulfate and trithionate during sulfite reduction by washed cells of Desulfovibrio desulfuricans. Archives of Microbiology 154, 400-406.
GROEN J. C., CRAIG J. R. & DONALD RIMSTIDT J. 1990. Gold rich rim formation on electrum grains in placers. Canadian Mineralogist 28, 207-228.
HOUGH R. M., BUTT C. R. M., REDDY S. M. & VERRALL M. 2007. Gold nuggets: supergene or hypogene? Australian Journal of Earth Sciences 54, 959-964.
HOUGH R. M., NOBLE R. R. P., HITCHEN G. J., HART R., REDDY S. M., SAUNDERS M., CLODE P., VAUGHAN D., LOWE J., GRAY D. J., ANAND R. R., BUTT C. R. M. & VERRALL M. 2008. Naturally occurring gold nanoparticles and nanoplates. Geology 36, 571-574.
HOUGH R. M., BUTT C. R. M. & FISCHER-BÜHNER J. 2009. The Crystallography, Metallography and Composition of Gold. Elements 5, 297-302.
HOUGH R. M., NOBLE R. R. P. & REICH M. 2011. Natural gold nanoparticles. Ore Geology Reviews 42, 55-61.
KARTHIKEYAN S. & BEVERIDGE T. 2002. Pseudomonas aeruginosa biofilms react with and precipitate toxic soluble gold. Environmental microbiology 4, 667-675.
KINNUNEN K. 1996. Classification scheme for surface textures of gold nuggets from Finnish Lapland. BULLETIN-GEOLOGICAL SOCIETY OF FINLAND 68, 18-33.

37
KNIGHT J. B., MORISON S. R. & MORTENSEN J. K. 1999. The relationship between placer gold particle shape, rimming, and distance of fluvial transport as exemplified by gold from the Klondike District, Yukon Territory, Canada. Economic Geology 94, 635-648.
KOJONEN K. K., TARKIAN M., KNAUF V. V. & TÖRNROOS R. 2005. New results of the placer PGE-minerals from Ivalojoki and Lemmenjoki rivers, Finnish Lapland. Extended Abstracts, Geological Survey of Finland,, 145-149.
LARIZZATTI J. H., OLIVEIRA S. M. B. & BUTT C. R. M. 2008. Morphology and composition of gold in a lateritic profile, Fazenda Pison “Garimpo”, Amazon, Brazil. Journal of South American Earth Sciences 25, 359-376.
LAWRANCE L. M. & GRIFFIN B. J. 1994. Crystal features of supergene gold at Hannan South, Western Australia. Mineralium Deposita 29, 391-398.
LAWRANCE L. M. 2001. Multi-element dispersion within salt-lake environments: case study of the buried Hannan South gold deposit, Western Australia. Geochemistry: Exploration, Environment, Analysis 1, 323-339.
LENGKE M. F., FLEET M. E. & SOUTHAM G. 2006. Bioaccumulation of Gold by Filamentous Cyanobacteria Between 25 and 200°C. Geomicrobiology Journal 23, 591-597.
LENGKE M. F. & SOUTHAM G. 2007. The Deposition of Elemental Gold from Gold(I)-Thiosulfate Complexes Mediated by Sulfate-Reducing Bacterial Conditions. Economic Geology 102, 109-126.
LUNKKA J. P., JOHANSSON P., SAARNISTO M. & SALLASMAA O. 2004. Glaciation of Finland. Developments in Quaternary Sciences 2, 93-100.
MCCREADY A. J., PARNELL J. & CASTRO L. 2003. Crystalline Placer Gold from the Rio Neuquén, Argentina: Implications for the Gold Budget in Placer Gold Formation. Economic Geology 98, 623-633.
MINTER W. E. L., GOEDHART M., KNIGHT J. & FRIMMEL H. E. 1993. Morphology of Witwatersrand gold grains from the Basal Reef; evidence for their detrital origin. Economic Geology 88, 237-248.
NAKAJIMA A. 2003. Accumulation of gold by microorganisms. World Journal of Microbiology and Biotechnology 19, 369-374.
NAM S.-H., LEE W.-M., SHIN Y.-J., YOON S.-J., KIM S. W., KWAK J. I. & AN Y.-J. 2014. Derivation of guideline values for gold (III) ion toxicity limits to protect aquatic ecosystems. Water Research 48, 126-136.
PUUSTINEN K. 1991. Gold deposits of Finland. Journal of Geochemical Exploration 39, 255-272.
REITH F. & MCPHAIL D. C. 2006. Effect of resident microbiota on the solubilization of gold in soil from the Tomakin Park Gold Mine, New South Wales, Australia. Geochimica et Cosmochimica Acta 70, 1421-1438.
REITH F., ROGERS S. L., MCPHAIL D. C. & WEBB D. 2006. Biomineralization of Gold: Biofilms on Bacterioform Gold. Science 313, 233-236.
REITH F., LENGKE M. F., FALCONER D., CRAW D. & SOUTHAM G. 2007. The geomicrobiology of gold. The ISME Journal 1, 567-584.
REITH F., FAIRBROTHER L., NOLZE G., WILHELMI O., CLODE P. L., GREGG A., PARSONS J. E., WAKELIN S. A., PRING A., HOUGH R., SOUTHAM G. & BRUGGER J. 2010. Nanoparticle factories: Biofilms hold the key to gold dispersion and nugget formation. Geology 38, 843-846.

38
REITH F., STEWART L. & WAKELIN S. A. 2012. Supergene gold transformation: Secondary and nano-particulate gold from southern New Zealand. Chemical Geology 320–321, 32-45.
REITH F., BRUGGER J., ZAMMIT C., NIES D. & SOUTHAM G. 2013. Geobiological Cycling of Gold: From Fundamental Process Understanding to Exploration Solutions. Minerals 3, 367-394.
SAARNISTO M., TAMMINEN E. & VAASJOKI M. 1991. Gold in bedrock and glacial deposits in the Ivalojoki area, Finnish Lapland. Journal of Geochemical Exploration 39, 303-322.
SCHOFIELD E. J., INGHAM B., TURNBULL A., TONEY M. F. & RYAN M. P. 2008. Strain development in nanoporous metallic foils formed by dealloying. Applied Physics Letters 92, 043118.
SOUTHAM G., LENGKE M. F., FAIRBROTHER L. & REITH F. 2009. The Biogeochemistry of Gold. Elements 5, 303-307.
STIGZELIUS H. 1977. Recognition of mineralized areas by a regional geochemical survey of the till-blanket in Northern Finland. Journal of Geochemical Exploration 8, 473-481.
TUISKU P., MIKKOLA P. & HUHMA H. 2006. Evolution of migmatitic granulite complexes: implications from Lapland Granulite Belt, Part I: metamorphic geology. BULLETIN-GEOLOGICAL SOCIETY OF FINLAND 78, 71.
WEBER F.-A., VOEGELIN A., KAEGI R. & KRETZSCHMAR R. 2009. Contaminant mobilization by metallic copper and metal sulphide colloids in flooded soil. Nature Geoscience 2, 267-271.
WILSON A. F. 1984. Origin of quartz-free gold nuggets and supergene gold found in laterites and soils — a review and some new observations. Australian Journal of Earth Sciences 31, 303-316.
WINFREY M. R. & WARD D. M. 1983. Substrates for sulfate reduction and methane production in intertidal sediments. Applied and Environmental Microbiology 45, 193-199.
YOUNGSON J. H. & CRAW D. 1993. Gold nugget growth during tectonically induced sedimentary recycling, Otago, New Zealand. Sedimentary Geology 84, 71-88.
39
APPENDIX A: METHODS
Sampling procedure for field sterile sampling of gold grains and regolith to be used
for molecular microbial analysis
Modified after Reith et al. 2010
Aim of field sterile sampling:
Samples have to be taken field sterile to prevent contamination during sampling and
transport. Samples have to be stored on dry ice/ice and frozen to prevent DNA/RNA-
degeneration.
Equipment required for field sterile sampling (gold grains and regolith materials):
Powder free nitrile gloves (do not use latex cloves!)
Dry ice (ideally) or ice/ice packs if dry ice is not available
Esky or car fridge
>70% Ethanol
Distilled water
Camping gas burner and gas
Metal garden shovels
Role of paper towels
For gold grain sampling:
Gold grains of interest: 0.2 to 2 mm in diameter, preferably secondary gold grains,
obtain 25 grains from each sampling site.
Best practise:
If through previous experience it can be assumed that a given regolith material, e.g. a
concentrate from a sluice, contains a number of gold grains per kg then: pack up the
material like any other regolith material (see below), put on ice/dry ice and send to
directly to our lab.
If you have to go panning or take samples from a sluice or other form of enrichment
device
Additional equipment:
Gold panning equipment (metal or plastic pan)
centrifuge tubes (2 or 10 ml sterile)
1 ml syringes (sterile one-way)
Eye wash solution (0.9% NaCl) (important to store gold grains in!!!!!)
Fine pincers
Ideally sterile, distilled water for panning
1. Use gold pan to pan out gold (wear gloves!) use distilled, sterile water if
available other water including dam/bore water if necessary.
2. When gold is visible in the pan use pincers to transfer to centrifuge tube, use one
centrifuge tube for each grains

40
3. Open a new eye wash solution squirt 1-2 ml into centrifuge tube, close tube
shake well for 10 sec, open, suck up solution using syringe and discard solution,
add new solution so that gold grain is slightly covered.
4. Gold grain is now ready to be put on ice / frozen and send to our lab.
Regolith material sampling for small quantities (50-100g) of sample:
Additional equipment:
Sterile 50 ml centrifuge (Falcon) tube
Procedure:
1. Obtain samples by opening sterile Falcon tubes immediately before sampling,
use Falcon tube to scoop up field fresh regolith sample and close immediately
after sampling. Do not touch soil with your hands or other equipment.
2. Collect 2 Falcon tubes full of sample for each site.
3. Put samples on dry ice (if possible, if not use ice) immediately after sampling
and transport on dry ice/ice to the lab (see general rules).
4. Send on dry ice/ice to laboratories in Adelaide.
Sample preparation for SEM (dehydration)
Materials:
EM fixative (4% Paraformaldehyde / 1.25% Glutaraldehyde in PBS, + 4%
sucrose, pH 7.2)
washing buffer (PBS+4% sucrose)
Ethanol (70%, 90% and 100%)
Hexamethyldisilazane (HMDS)
Stubs
Carbon coating
Procedure:
1. Fix sample for (at least) 30 mins in EM fixative
2. Remove EM fixative and place in a waste bin
3. Wash sample in washing buffer – 1 change, 5mins
4. Dehydrate with
70% ethanol – 1 change, 10mins each
90% ethanol – 1 change, 10 mins each
100% ethanol – 3 changes, 10 mins each
HMDS 1:1 with ethanol – 10 mins
100% HMDS – 10mins
5. Remove HMDS and allow to dry
6. Place on stubs
7. Coat the with a 15 nm layer of carbon
Notes: Grains from the same locality were prepared in a single stub. One to six grains
were used from each site.

41
Quanta 450 (FEG Environmental SEM + EDAX TEAM EDS with SDD Detector)
The Quanta 450 was operated in ‘high vacuum’ mode. The working distance was set at
10 mm. Uncoated, air dried samples and dehydrated, C-coated samples were analysed.
Images were collected in secondary electron (5kV, spot 3) and backscatter (20kV, spot
4) imaging mode, with a resolution of 2048 x 1768.
With sites of interest on the grains, several images were taken to characterise the area.
Images were also taken at various magnifications (at least 3 different), over the same
area, to give a sense of location.
The equipment was equipped with an EDS detector allowing for light element detection.
In order to obtain good elemental spectra, the running time was at least 100 seconds.
Philips XL30 FEGSEM x EDAX EDS, Oxford Cyro Stage & HKL EBSD
Set up and basic operations of the Philips XL30 were completed following the Adelaide
Microscopy’s Phillips XL30 Scanning Electron Microscope Operating Instructions. The
working distance was set at 10 mm. Uncoated, air dried samples and dehydrated, C-
coated samples were analysed. Images were collected in secondary electron (5kV, spot
3) and backscatter (20kV, spot 4) imaging mode. Images were captured using ‘slow
scan 3’.
Several images were taken of the site of interest on the grains to characterise the area.
Images were also taken at various magnifications (at least 3 different), over the same
area, to give a sense of location.
The equipment was equipped with an EDS detector allowing for light element detection.
In order to obtain good elemental spectra, the running time was at least 100 seconds.
FEI DualBeam™ Focused Ion Beam (FIB) Scanning Electron Microscope/SEM
Selected samples were analysed using a focus ion beam secondary electron microscope
(FIB-SEM; Helios NanoLab DualBeam). Images were collected at 2 to 20kV and 86pA,
with sectioning and cleaning at 20kV and 9.7pA.
FEI DualBeam™ has a Gallium ion beam. Before sectioning by the FIB, the area of
interest was locally platinum coated to preserve “soft” surface features. Parameters
were:
Pt dep – cold
Pattern – rectangle
Value – pt dep
Application - Si
The instrument was equipped with an Energy Dispersive X-ray Spectroscopy (EDXS);
this was used to collect element maps across milled sections. The elements mapped

42
were: Ag La, Al Ka, Au La, Au Ma, C Ka, Fe Ka, Fe La, Ga Ka, K Ka, Mg Ka, Na Ka,
Ni La, N Ka, O Ka, Pt La, Si Ka, Ti Ka.
Mounting and Polishing – preparation for CAMECA SXFive Electron Microprobe
w Probe for EPMA Software and Resonetics_LA_ICP_MS
Materials:
Two-sided tape
Cover slip
2.5 cm plastic blocks
Epoxy resin
Vacuum pump
Razer
P1200 sandpaper
3µm and 1µm polishing pad
3 grade Kemet Diamond
Compound
1 grade Kemet Diamond
Compound
Ultrasonic cleaner
Carbon coating
Notes:
Grains from the same locality were prepared in a single mount.
Mounting Procedure:
1. Place two-sided tape on a cover slip, securing a plastic block in the middle
2. Place (number 2-?)gold grains inside, preferably in the middle
3. Completely fill the grey ring with epoxy resin
4. Place in a vacuum pump to remove air bubbles
5. Run several times for a few minutes each
6. Leave to set for a few days
7. Place razer in between tape and peel off
8. Mark grey ring with razor
Polishing Procedure:
1. Start with P1200 sandpaper + water
2. 20 figure 8s, rotate 90°
3. Repeat until at centre of grain
4. Place in an ultrasonic cleaner – 5 mins
5. Use 3µm polishing pad + 3 grade Kemet Diamond Compound + water
6. 20 figure 8s, rotate 90°, repeat 10 mins
7. Place in an ultrasonic cleaner – 5 mins
8. Use 1µm polishing pad + 1 grade Kemet Diamond Compound + water
9. 20 figure 8s, rotate 90°, repeat 10 mins
10. Place in an ultrasonic cleaner – 5 mins
11. Coat the polished sample with a 15 nm layer of carbon

43
CAMECA SXFive Electron Microprobe w Probe for EPMA Software
Calibration:
Table 1 Element/line Diffracting
Crystal Peak count time (sec)
Background type/fit
Background points (Lo/Hi)
Background count time (Lo/Hi) (sec)
Standard
Au La LLIF 10 Multipoint 3/2 15/10 Astimex Gold
Cu Ka LLIF 10 Linear 1/1 5/5 P&H Chalcopyrite
Fe Ka LLIF 10 Linear 1/1 5/5 P&H Chalcopyrite
As La TAP 10 Multipoint 1/4 5/20 P&H Gallium Arsenide
Zn Ka LLIF 10 Multipoint 0/4 0/20 P&H Sphalerite
Ag La LPET 10 Multipoint 1/3 5/15 P&H Silver Telluride
Ti Ka LPET 10 Linear 1/1 5/5 Astimex Rutile
S Ka LPET 10 Multipoint 2/2 10/10 P&H Chalcopyrite
Table 2
Element/line Diffracting crystal Overlapping line/order Overlap standard Au La LLIF - -
Cu Ka LLIF - -
Fe Ka LLIF - - As La TAP Fe V, Au VIII P&H Chalcopyrite, Astimex
Gold Zn Ka LLIF Au I Astimex Gold
Ag La LPET Cu III, Hg IV, Au IV P&H Chalcopyrite, P&H Cinnabar, Astimex Gold
Ti Ka LPET Au III Astimex Gold
S Ka LPET Au V, Hg VI Astimex Gold, P&H Cinnabar
Mapping:
One to three samples were used from each site. Samples were quantitatively mapped
using a Cameca SXFive Electron Microprobe running the PeakSite software for
instrument control, and Probe for EPMA™ for data acquisition and processing. The
SXFive is equipped with 5 WDS X-Ray detectors. Samples were quantitatively mapped
using the same peak position, interference corrections, background positions, and
calibrated standard intensities as that of spot analysis (Table 1 & 2). The beam
condition used for mapping was 20kV and 150nA. Crystals are set to the peak position

44
of the elements of interest, and the focussed beam was rastered over a set area divided
into a specified pixel size:
Dimensions and pixel size
Grains below 50 000 µm2 = 1 x 1 pixel size
If only 2 grains in sample = 2 x 2 pixel size
Grains <~ 53 000 µm2 = 3 x 3 pixel size
Grains >~ 53 000 µm2 = 4 x 4 pixel size
Samples were mapped for five elements in single pass maps, and at least one grain from
each sample were mapped for eight elements requiring two mapping passes (Table 3).
The grains were analysed for (detection limit range in parenthesis in wt.%): Au(0.99-
4.83), Ag(0.45-0.49), Cu(0.25-0.61), As(0.43-0.60), Zn(0.33-0.85), Ti(0.09-0.15),
Fe(0.18-0.39), S(0.16-0.17). The range in detection limit was due to a variation of
counts per second (CPS) across grains.
The time taken for one map is governed by the pixel dwell time (measured in
milliseconds), multiplied by the amount of pixels in the given area. For this study the
mapped areas ranged in size from 1 by 1 pixels to 4 by 4 pixels, with a dwell time of 50
ms, giving mapping times of approximately 1 to 2 hours. Historically, quantitative
mapping is carried out by rastering the beam over the set area with the diffracting
crystals on the elemental peak positions, then remapping the same area after offsetting
the crystals to a “background” position. This method doubles your acquisition time.
The Probe for EPMA software allows fully quantitative pixel by pixel calculation by
using the Mean Atomic Number (MAN) background correction (Donovan and Tingle,
1996). This negates the need for remapping the same area to acquire the background
intensity.
Quantification and formatting
The MAN background correction and elemental pixel quantification are performed in
CalcImage, a module of Probe for EPMA, and false colourisation and formatting done
in Surfer™.
Quantitative parameters
Calculate ‘totals’ image
Output detection limits
Net intensities
References
Adelaide Microscopy’s Phillips XL30 Scanning Electron Microscope Operating Instructions, Adelaide
Microscopy, The University of Adelaide
Adelaide Microscopy’s LA_ICP_MS User Instructions, Adelaide Microscopy, The University of
Adelaide
DONOVAN, J.J., TINGLE, T.N., 1996. An Improved Mean Atomic Number Background Correction for Quantitative Microanalysis. Microscopy and Microanalysis, 1, pp. 1-7.
REITH F., FAIRBROTHER L., NOLZE G., WILHELMI O., CLODE P. L., GREGG A., PARSONS J.
E., WAKELIN S. A., PRING A., HOUGH R., SOUTHAM G. & BRUGGER J. 2010. Nanoparticle
factories: Biofilms hold the key to gold dispersion and nugget formation. Geology 38, 843-846.

45
APPENDIX B: SUPPLEMENTARY FIGURES
a
b
c
Figure 1: Site photos from Ivalojoki, Finland (a) Ivalojoki 1; (b) Aila’s Claim; (c) Risto’s Claim.

46
a b
c d
e
Figure 1: Site photos from Lemmenjoki, Finland (a) Jäkäläpää Claim; (b) (Miessi) Turkka’s Claim;
(c) (Miessi) Pekka’s Claim; (d) (Miessi) Raimo’s Claim; (e) Kaarreoja Claim.