Embed Size (px)
Citation preview

Superfund Proposed Plan
Lower Eight Miles of the Lower Passaic River Part of the Diamond
Alkali Superfund Site
Supplemental Figures

Remedial Investigation Report for the Focused Feasibility Study of the Lower Eight Miles of the Lower Passaic River
2014

2014Lower Eight Miles of the Lower Passaic River
Figure 4-22,3,7,8-TCDD Concentration (0-6 inches) vs. River Mile
Legend
Note: 2,3,7,8-TCDD concentrations generated during the 2008 CPG coring program were biased low and have been correctedby applying a factor of 1.89. The factor was provided by CSC and Interface, Inc., 2010.
2008 CPG2009 CPG
2008 EPA2005&2007 NewarkBay
2005&2007 Kill VanKull
2008 CPG TributaryBelow HoT
2005&2007 ShootersIsland & Arthur Kill
2005&2007 Port Elizabeth & Newark
2010 CPG
1995 TSI
2012 CPG
0.01
0.1
1
10
100
1,000
10,000
100,000
-10-8-6-4-202468101214161820
2,3,
7,8-
TCD
D C
once
ntra
tion
(ng/
kg)
River Mile
Newark BayLower Passaic RiverUpper Passic River

Lower Eight Miles of the Lower Passaic River 2014
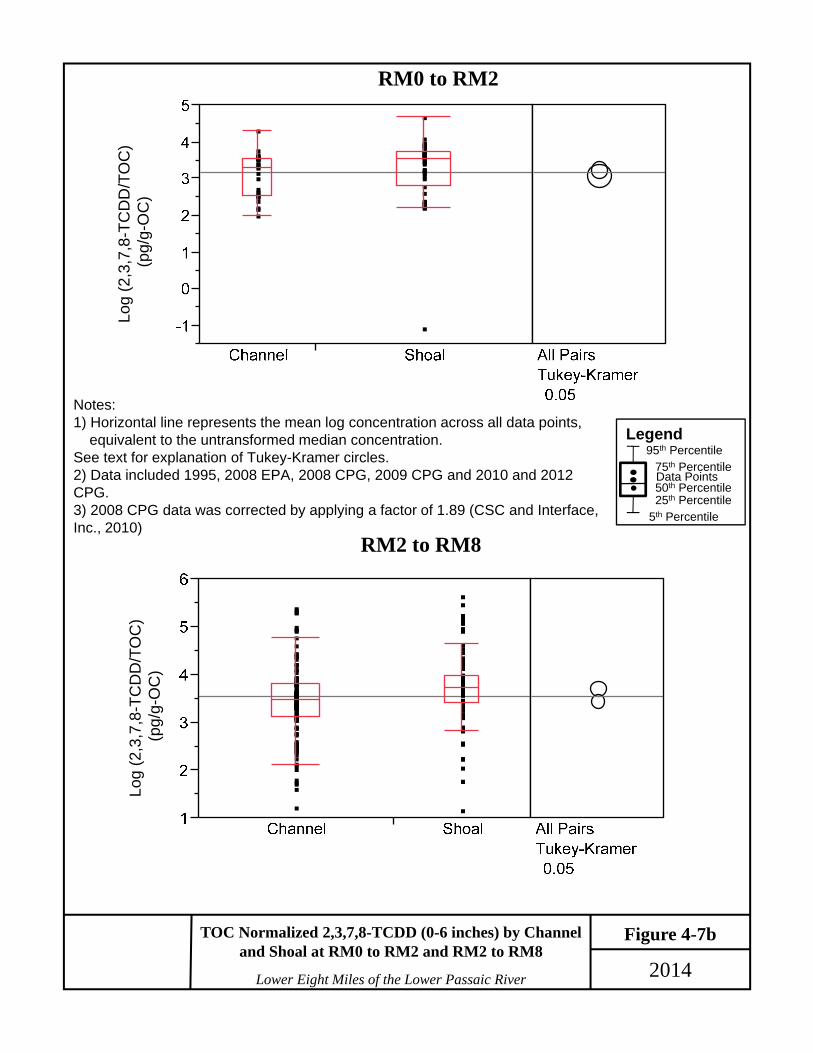
Figure 4-7a2,3,7,8-TCDD (0-6 inches) by Channel and Shoalat RM0 to RM2 and RM2 to RM8
RM0 to RM2
Log
(2,3
,7,8
-TC
DD
C
once
ntra
tion)
(pg/
g)Lo
g (2
,3,7
,8-T
CD
D
Con
cent
ratio
n) (p
g/g)
RM2 to RM8
Notes: 1) Horizontal line represents the mean log concentration across all data points,
equivalent to the untransformed median concentration.See text for explanation of Tukey-Kramer circles.2) Data included 1995, 2008 EPA, 2008 CPG, 2009 CPG and 2010 and 2012CPG.3) 2008 CPG data was corrected by applying a factor of 1.89 (CSC and Interface,Inc., 2010)
95th Percentile
5th Percentile
50th Percentile25th Percentile
75th PercentileData Points
Legend
Lower Eight Miles of the Lower Passaic River 2014
Figure 4-7bTOC Normalized 2,3,7,8-TCDD (0-6 inches) by Channel and Shoal at RM0 to RM2 and RM2 to RM8
RM0 to RM2
Log
(2,3
,7,8
-TC
DD
/TO
C)
(pg/
g-O
C)
RM2 to RM8
Notes: 1) Horizontal line represents the mean log concentration across all data points,
equivalent to the untransformed median concentration.See text for explanation of Tukey-Kramer circles.2) Data included 1995, 2008 EPA, 2008 CPG, 2009 CPG and 2010 and 2012 CPG.3) 2008 CPG data was corrected by applying a factor of 1.89 (CSC and Interface, Inc., 2010)
95th Percentile
5th Percentile
50th Percentile25th Percentile
75th PercentileData Points
Legend
Log
(2,3
,7,8
-TC
DD
/TO
C)
(pg/
g-O
C)

Lower Eight Miles of the Lower Passaic River 2014
0
1
2
3
4
5
-1
0
1
2
3
Notes: 1) Horizontal line represents the mean log concentration across all data points,equivalent to the untransformed median concentration.See text for explanation of Tukey-Kramer circles.2) 2008 CPG data was corrected by applying a factor of 1.89 (CSC and Interface, Inc., 2010)
Figure 4-82,3,7,8-TCDD (0-6 inches) by Sampling Programat RM0 to RM2 and RM2 to RM8
RM0 to RM2
Sampling Program
RM2 TO RM8
Log
(2,3
,7,8
-TC
DD
C
once
ntra
tion)
(pg/
g)
Sampling Program
Log
(2,3
,7,8
-TC
DD
C
once
ntra
tion)
(pg/
g)
95th Percentile
5th Percentile
50th Percentile25th Percentile
75th PercentileData Points
Legend
1995
RI
Pro
gram
CP
G 2
008
EPA
2008
CP
G 2
009
CP
G 2
010
CP
G 2
012
1995
RI
Pro
gram
CP
G 2
008
CP
G 2
009
CP
G 2
010
CP
G 2
012

2014Lower Eight Miles of the Lower Passaic River
Figure 4-11Total PCBs Concentration (0-6 inches) vs. River Mile
Legend
1
10
100
1,000
10,000
100,000
-10-8-6-4-202468101214161820
Tota
l PC
Bs
Con
cent
ratio
ns (µ
g/kg
)
River Mile
Newark BayLower Passaic RiverUpper Passic River
2008 CPG2009 CPG
2008 EPA2005&2007 NewarkBay
2005&2007 Kill VanKull
2008 CPG TributaryBelow HoT
2005&2007 ShootersIsland & Arthur Kill
2005&2007 Port Elizabeth & Newark
2010 CPG
1995 TSI
2012 CPG

Lower Eight Miles of the Lower Passaic River 2014
Figure 4-14aTotal PCBs (0-6 inches) by Channel and Shoalat RM0 to RM2 and RM2 to RM8
RM0 to RM2
RM2 to RM8
Notes: 1) Horizontal line represents the mean log concentration across all data points,equivalent to the untransformed median concentration.See text for explanation of Tukey-Kramer circles.2) Data included 1995, 2008 EPA, 2008 CPG, 2009 CPG, 2010 CPG and 2012 CPG.3) A factor 1.25 was applied to the1995 TPCB concentrations based on matched pairsof congener and Aroclor analysis (see Data Evaluation No. 4 for further discussion).
(ug/
kg)
95th Percentile
5th Percentile
50th Percentile25th Percentile
75th PercentileData Points
Legend
Log
(Tot
al P
CB
Con
gene
rs(u
g/kg
))
Log
(Tot
al P
CB
Con
gene
rs –
Adj
uste
d to
Hig
h R
es.
(ug/
kg))
Log
(Tot
al P
CB
Con
gene
rs(u
g/kg
))

Lower Eight Miles of the Lower Passaic River 2014
Log
Tota
l PC
B C
onge
ners
- 19
95ad
just
ed to
hig
h re
s. (u
g/kg
-OC
)Lo
g To
tal P
CB
Con
gene
rs -
1995
adju
sted
to h
igh
res.
(ug/
kg-O
C)
Figure 4-14bTOC Normalized Total PCBs (0-6 inches) by Channel and Shoal at RM0 to RM2 and RM2 to RM8
RM0 to RM2
RM2 to RM8
Notes: 1) Horizontal line represents the mean log concentration across all data points, equivalent to the untransformed median concentration.See text for explanation of Tukey-Kramer circles.2) Data included 1995, 2008 EPA, 2008 CPG, 2009 CPG, 2010 CPG and 2012 CPG.3) A factor 1.25 was applied to the1995 TPCB concentrations based on matched pairsof congener and Aroclor analysis (see Data Evaluation No. 4 for further discussion).
(ug/
kg)
95th Percentile
5th Percentile
50th Percentile25th Percentile
75th PercentileData Points
Legend
Log
(Tot
al P
CB
Con
gene
rs/T
OC
(ug/
kg-O
C))
Log
(Tot
al P
CB
Con
gene
rs /T
OC
(ug/
kg-C
O))

Lower Eight Miles of the Lower Passaic River 2014
0.5
1
1.5
2
2.5
3
3.5
4
4.5
1
1.5
2
2.5
3
3.5
4
Figure 4-15Total PCBs (0-6 inches) by Sampling Programat RM0 to RM2 and RM2 to RM8
Notes: 1) Horizontal line represents the mean log concentration across all data points, equivalent to the untransformed median concentration. See text for explanation of Tukey-Kramer circles.2) A factor 1.25 was applied to the1995 TPCB concentrations based on matched pairsof congener and Aroclor analysis (see Data Evaluation No. 4 for further discussion).
RM0 to RM2
RM2 to RM8
95th Percentile
5th Percentile
50th Percentile25th Percentile
75th PercentileData Points
Legend
Sampling Program
Log
(Tot
al P
CB
Con
gene
rs
(ug/
kg))
Log
(Tot
al P
CB
Con
gene
rs
(ug/
kg))
Sampling Program
1995
RI
Pro
gram
CP
G 2
008
EPA
2008
CP
G 2
009
CP
G 2
010
CP
G 2
012
CP
G 2
008
CP
G 2
009
CP
G 2
010
CP
G 2
012
1995
RI
Pro
gram

2014Lower Eight Miles of the Lower Passaic River
Figure 4-17a4,4’-DDE Concentration (0-6 inches) vs. River Mile
Legend
0.1
1
10
100
1,000
-10-8-6-4-202468101214161820
4,4'
-DD
E (u
g/kg
)
River Mile
Newark BayLower Passaic RiverUpper Passic River
2008 CPG2009 CPG
2008 EPA2005&2007 NewarkBay
2005&2007 Kill VanKull
2008 CPG TributaryBelow HoT
2005&2007 ShootersIsland & Arthur Kill
2005&2007 Port Elizabeth & Newark
2010 CPG
1995 TSI
2012 CPG

Lower Eight Miles of the Lower Passaic River 2014
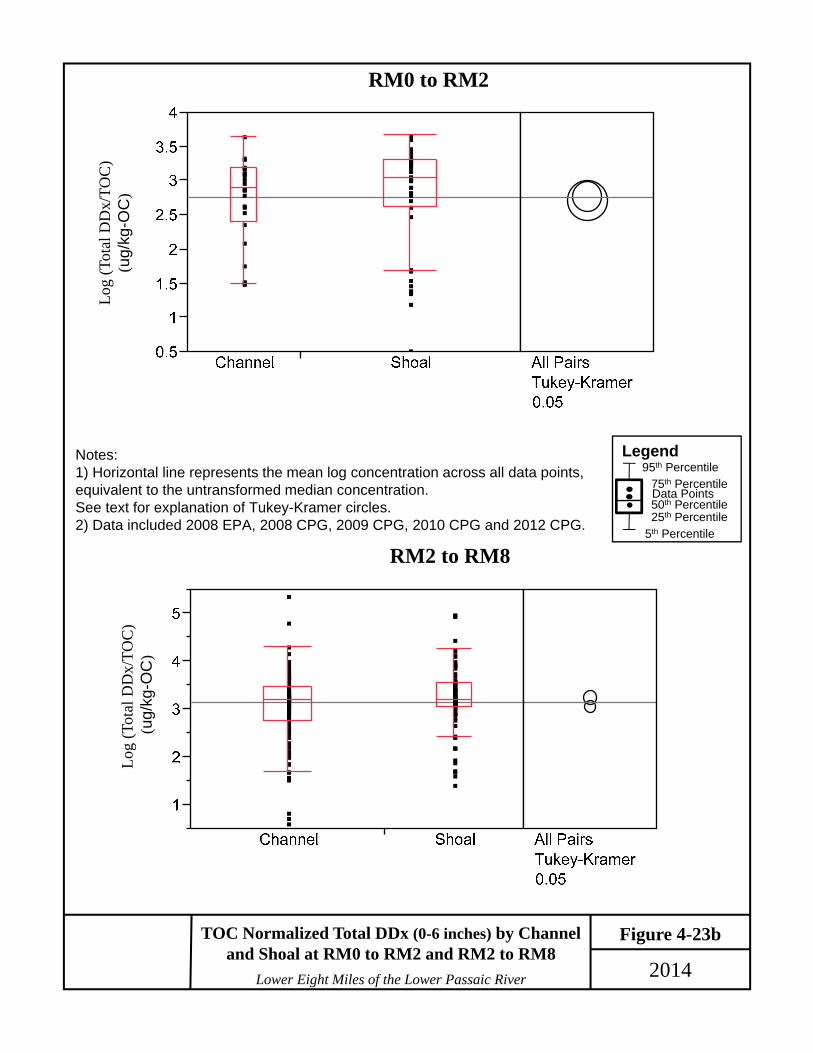
Figure 4-23aTotal DDx (0-6 inches) by Channel and Shoalat RM0 to RM2 and RM2 to RM8
Notes: 1) Horizontal line represents the mean log concentration across all data points,equivalent to the untransformed median concentration. See text for explanation of Tukey-Kramer circles.2) Data included 2008 EPA, 2008 CPG, 2009 CPG, 2010 CPG and 2012 CPG.
95th Percentile
5th Percentile
50th Percentile25th Percentile
75th PercentileData Points
Legend
RM0 to RM2
RM2 to RM8
(ug/
kg)
Log
(Tot
al D
Dx
Con
cent
ratio
n)
(ug/
kg)
Log
(Tot
al D
Dx
Con
cent
ratio
n)
(ug/
kg)
Lower Eight Miles of the Lower Passaic River 2014
Log
Tota
l DD
T -
1995
Adj
uste
d to
HR
MS
(ug/
kg-O
C)
Log
Tota
l DD
T -
1995
Adj
uste
d to
HR
MS
(ug/
kg-O
C)
Figure 4-23bTOC Normalized Total DDx (0-6 inches) by Channel and Shoal at RM0 to RM2 and RM2 to RM8
Notes: 1) Horizontal line represents the mean log concentration across all data points, equivalent to the untransformed median concentration.See text for explanation of Tukey-Kramer circles.2) Data included 2008 EPA, 2008 CPG, 2009 CPG, 2010 CPG and 2012 CPG.
95th Percentile
5th Percentile
50th Percentile25th Percentile
75th PercentileData Points
Legend
RM0 to RM2
RM2 to RM8
(ug/
kg)
Log
(Tot
al D
Dx/
TOC
) (u
g/kg
-OC
)Lo
g (T
otal
DD
x/TO
C)
(ug/
kg-O
C)

Lower Eight Miles of the Lower Passaic River 2014
-1
-0.5
0
0.5
1
1.5
2
2.5
3
-1
-0.5
0
0.5
1
1.5
2
Figure 4-264,4’-DDE (0-6 inches) by Sampling Programat RM0 to RM2 and RM2 to RM8
Note: Horizontal line represents the mean log concentration across all data points,equivalent to the untransformed median concentration.See text for explanation of Tukey-Kramer circles.
(ug/
kg)
RM0 to RM2
95th Percentile
5th Percentile
50th Percentile25th Percentile
75th PercentileData Points
Legend
Log
(4,4
’-D
DE
Con
cent
ratio
n)
(ug/
kg)
RM2 to RM8
Sampling Program
Sampling Program
Log
(4,4
’-D
DE
Con
cent
ratio
n)
(ug/
kg)
1995
RI
Pro
gram
CP
G 2
008
EPA
2008
CP
G 2
009
CP
G 2
010
CP
G 2
012
1995
RI
Pro
gram
CP
G 2
008
CP
G 2
009
CP
G 2
010
CP
G 2
012

2014Lower Eight Miles of the Lower Passaic River
Figure 4-32aTotal PAHs Concentrations (0-6 inches) vs. River Mile
Legend
2008 CPG2009 CPG
2008 EPA2005&2007 NewarkBay
2005&2007 Kill VanKull
2008 CPG TributaryBelow HoT
2005&2007 ShootersIsland & Arthur Kill
2005&2007 Port Elizabeth & Newark
2010 CPG
1995 TSI
2012 CPG
100
1,000
10,000
100,000
1,000,000
10,000,000
-10-8-6-4-202468101214161820
Tota
l PA
Hs
(ug/
kg)
River Mile
Newark BayLower Passaic RiverUpper Passic River
2008 CPG at RM11.23,6.2 ug/kg

Lower Eight Miles of the Lower Passaic River 2014
Notes: 1) Horizontal line represents the mean log concentration across all data points,equivalent to the untransformed median concentration. See text for explanation of Tukey-Kramer circles.2) Data included 1995, 2008 EPA, 2008 CPG, 2009 CPG, 2010 CPG and 2012 CPG.
Figure 4-38aTotal PAHs (0-6 inches) by Channel and Shoalat RM0 to RM2 and RM2 to RM8
95th Percentile
5th Percentile
50th Percentile25th Percentile
75th PercentileData Points
Legend
RM0 to RM2
RM2 to RM8
(ug/
kg)
(ug/
kg)
Log
(Tot
al P
AH
Con
cent
ratio
n) (u
g/kg
)Lo
g (T
otal
PAH
Con
cent
ratio
n) (u
g/kg
)

Lower Eight Miles of the Lower Passaic River 2014
Log
Tota
l PA
H(u
g/kg
-OC
)Lo
g To
tal P
AH
(ug/
kg-O
C)
Figure 4-38bTOC Normalized Total PAHs (0-6 inches) by Channel and Shoal at RM0 to RM2 and RM2 to RM8
95th Percentile
5th Percentile
50th Percentile25th Percentile
75th PercentileData Points
Legend
RM0 to RM2
RM2 to RM8
(ug/
kg)
Notes: 1) Horizontal line represents the mean log concentration across all data points,equivalent to the untransformed median concentration. See text for explanation of Tukey-Kramer circles.2) Data included 1995, 2008 EPA, 2008 CPG, 2009 CPG, 2010 CPG and 2012 CPG.
Log
(Tot
al P
AH/T
OC
C
once
ntra
tion)
(ug/
kg-O
C)
Log
(Tot
al P
AH/T
OC
C
once
ntra
tion)
(ug/
kg-O
C)

Lower Eight Miles of the Lower Passaic River 2014
2
2.5
3
3.5
4
4.5
5
5.5
6
6.5
3.5
4
4.5
5
5.5
Figure 4-41Total PAHs (0-6 inches) by Sampling Programat RM0 to RM2 and RM2 to RM8
Note: Horizontal line represents the mean log concentration across all data points,equivalent to the untransformed median concentration.See text for explanation of Tukey-Kramer circles.
RM0 to RM2
RM2 to RM8
95th Percentile
5th Percentile
50th Percentile25th Percentile
75th PercentileData Points
Legend
Log
(Tot
al P
AH
Con
cent
ratio
n)
(ug/
kg)
Sampling Program
Sampling Program
Log
(Tot
al P
AH
Con
cent
ratio
n)
(ug/
kg)
1995
RI
Pro
gram
CP
G 2
008
EPA
2008
CP
G 2
009
CP
G 2
010
CP
G 2
012
1995
RI
Pro
gram
CP
G 2
008
CP
G 2
009
CP
G 2
010
CP
G 2
012

2014Lower Eight Miles of the Lower Passaic River
Figure 4-47aMercury Concentration (0-6 inches) vs. River Mile
Legend
2008 CPG2009 CPG
2008 EPA2005&2007 NewarkBay
2005&2007 Kill VanKull
2008 CPG TributaryBelow HoT
2005&2007 ShootersIsland & Arthur Kill
2005&2007 Port Elizabeth & Newark
2010 CPG
1995 TSI
2012 CPG
0.01
0.1
1
10
100
-10-8-6-4-202468101214161820
Mer
cury
Con
cent
ratio
n (m
g/kg
)
River Mile
Newark BayLower Passaic RiverUpper Passic River

Lower Eight Miles of the Lower Passaic River 2014
Figure 4-57aMercury (0-6 inches) by Channel and Shoalat RM0 to RM2 and RM2 to RM8
Log
(Mer
cury
Con
cent
ratio
n)
(mg/
kg)
RM0 to RM2Lo
g (M
ercu
ryC
once
ntra
tion)
(m
g/kg
)
RM2 to RM8
95th Percentile
5th Percentile
50th Percentile25th Percentile
75th PercentileData Points
LegendNotes: 1) Horizontal line represents the mean log concentration across all data points,equivalent to the untransformed median concentration.See text for explanation of Tukey-Kramer circles.2) Data included 1995, 2008 EPA, 2008 CPG, 2009 CPG, 2010 CPG and 2012 CPG.

Lower Eight Miles of the Lower Passaic River 2014
Mer
cury
(mg/
kg ir
on)
Mer
cury
(mg/
kg ir
on)
Figure 4-57bIron Normalized Mercury (0-6 inches) by Channel and Shoal at RM0 to RM2 and RM2 to RM8
Log
(Mer
cury
/Iron
)(m
g/kg
-Fe)
RM0 to RM2Lo
g (M
ercu
ry/Ir
on)
(mg/
kg-F
e)
RM2 to RM8
95th Percentile
5th Percentile
50th Percentile25th Percentile
75th PercentileData Points
LegendNotes: 1) Horizontal line represents the mean log concentration across all data points,equivalent to the untransformed median concentration.See text for explanation of Tukey-Kramer circles.2) Data included 1995, 2008 EPA, 2008 CPG, 2009 CPG, 2010 CPG and 2012 CPG.

Lower Eight Miles of the Lower Passaic River 2014
Figure 4-62Mercury (0-6 inches) by Sampling Programat RM0 to RM2 and RM2 to RM8
95th Percentile
5th Percentile
50th Percentile25th Percentile
75th PercentileData Points
Legend
Log
(Mer
cury
Con
cent
ratio
n)
(mg/
kg)
Sampling Program
Log
(Mer
cury
Con
cent
ratio
n)(m
g/kg
)
Sampling Program
RM0 to RM2
RM2 to RM8
1995
RI
Pro
gram
CP
G 2
008
EPA
2008
CP
G 2
009
CP
G 2
010
CP
G 2
012
1995
RI
Pro
gram
CP
G 2
008
CP
G 2
009
CP
G 2
010
CP
G 2
012
Note: Horizontal line represents the mean log concentration across all data points,equivalent to the untransformed median concentration.See text for explanation of Tukey-Kramer circles..

Lower Eight Miles of the Lower Passaic River2014
Figure 4-75aSediment Contamination vs Year for 2005 High Resolution Cores
1950
1955
1960
1965
1970
1975
1980
1985
1990
1995
2000
20050.001 0.01 0.1 1 10
App
roxi
mat
e Ye
ar o
f Dep
ositi
on2,3,7,8 - TCDD (ug/kg)
RM 1.4
RM 2.2
RM 7.8
RM 11
RM 12.6
Non-contiguous core segment
1950
1955
1960
1965
1970
1975
1980
1985
1990
1995
2000
20050.0 0.2 0.4 0.6 0.8 1.0
App
roxi
mat
e Ye
ar o
f Dep
ositi
on
2,3,7,8-TCDD to Total TCDD Ratio
1950
1955
1960
1965
1970
1975
1980
1985
1990
1995
2000
2005100 1,000 10,000 100,000
App
roxi
mat
e Ye
ar o
f Dep
ositi
on
Total PCBs (ug/kg)

Lower Eight Miles of the Lower Passaic River2014
Figure 4-75b
RM 1.4
RM 2.2
RM 7.8
RM 11
RM 12.6
Non-contiguous core segment
1950
1955
1960
1965
1970
1975
1980
1985
1990
1995
2000
2005 0.1 1 10 100 1,000 10,000
BZ52 Concentration (ug/kg)D
epth
(Rep
rese
nted
by
Yea
r)
1950
1955
1960
1965
1970
1975
1980
1985
1990
1995
2000
2005 0.1 1 10 100 1,000 10,000
BZ61+70+74+76 Concentration (ug/kg)
Dep
th (R
epre
sent
ed b
y Y
ear)
1950
1955
1960
1965
1970
1975
1980
1985
1990
1995
2000
2005 0.1 1 10 100 1,000
BZ110+115 Concentration (ug/kg)
Dep
th (R
epre
sent
ed b
y Y
ear)
Sediment Contamination vs Year for 2005 High Resolution Cores

Lower Eight Miles of the Lower Passaic River2014
Figure 4-75c
RM 1.4
RM 2.2
RM 7.8
RM 11
RM 12.6
Non-contiguous core segment
1950
1955
1960
1965
1970
1975
1980
1985
1990
1995
2000
2005 0.01 0.1 1 10 100 1,000
BZ180+193 Concentration (ug/kg)D
epth
(Rep
rese
nted
by
Yea
r)
1950
1955
1960
1965
1970
1975
1980
1985
1990
1995
2000
2005100 1,000 10,000 100,000
App
roxi
mat
e Ye
ar o
f Dep
ositi
on
Total PAH Concentration (ug/kg)
1950
1955
1960
1965
1970
1975
1980
1985
1990
1995
2000
2005100 1,000 10,000 100,000 1,000,000
HMW PAH Concentration (ug/kg)
App
roxi
mat
e Y
ear o
f Dep
ositi
on
Sediment Contamination vs Year for 2005 High Resolution Cores

Lower Eight Miles of the Lower Passaic River2014
Figure 4-75d
RM 1.4
RM 2.2
RM 7.8
RM 11
RM 12.6
Non-contiguous core segment
1950
1955
1960
1965
1970
1975
1980
1985
1990
1995
2000
200510 100 1,000 10,000 100,000
LMW PAH Concentration (ug/kg)A
ppro
xim
ate
Yea
r of D
epos
ition
1950
1955
1960
1965
1970
1975
1980
1985
1990
1995
2000
20051 10 100 1,000 10,000
Dep
th (R
epre
sent
ed b
y Ye
ar)
Phenanthrene (ug/kg)
1950
1955
1960
1965
1970
1975
1980
1985
1990
1995
2000
20051 10 100 1,000 10,000
Dep
th (R
epre
sent
ed b
y Ye
ar)
Benzo[a]pyrene Concentration (ug/kg)
Sediment Contamination vs Year for 2005 High Resolution Cores

Lower Eight Miles of the Lower Passaic River2014
Figure 4-75e
RM 1.4
RM 2.2
RM 7.8
RM 11
RM 12.6
Non-contiguous core segment
1950
1955
1960
1965
1970
1975
1980
1985
1990
1995
2000
200510 100 1,000 10,000 100,000
Dep
th (R
epre
sent
ed b
y Ye
ar)
Fluoranthene (ug/kg)
1950
1955
1960
1965
1970
1975
1980
1985
1990
1995
2000
20051 10 100 1000
App
roxi
mat
e Ye
ar o
f Dep
ositi
on
4-4' - DDE (ug/kg)
1950
1955
1960
1965
1970
1975
1980
1985
1990
1995
2000
20050.1 1 10 100 1000
App
roxi
mat
e Ye
ar o
f Dep
ositi
on
Dieldrin (ug/kg)
Sediment Contamination vs Year for 2005 High Resolution Cores

Lower Eight Miles of the Lower Passaic River2014
Figure 4-75f
RM 1.4
RM 2.2
RM 7.8
RM 11
RM 12.6
Non-contiguous core segment
1950
1955
1960
1965
1970
1975
1980
1985
1990
1995
2000
20050.1 1 10 100 1000
Dep
th (R
epre
sent
ed b
y Ye
ar)
Gamma-(Trans)-Chlordane (ug/kg)
1950
1955
1960
1965
1970
1975
1980
1985
1990
1995
2000
20050 5 10 15 20 25 30 35 40 45
Dep
th (R
epre
sent
ed b
y Ye
ar)
Cadmium Concentration (mg/kg)
1950
1955
1960
1965
1970
1975
1980
1985
1990
1995
2000
20050 400 800 1200 1600
Dep
th (R
epre
sent
ed b
y Ye
ar)
Chromium Concentration (mg/kg)
Sediment Contamination vs Year for 2005 High Resolution Cores

Lower Eight Miles of the Lower Passaic River2014
Figure 4-75g
RM 1.4
RM 2.2
RM 7.8
RM 11
RM 12.6
Non-contiguous core segment
1950
1955
1960
1965
1970
1975
1980
1985
1990
1995
2000
20050 200 400 600 800 1000
Dep
th (R
epre
sent
ed b
y Ye
ar)
Copper Concentration (mg/kg)
1950
1955
1960
1965
1970
1975
1980
1985
1990
1995
2000
20050 400 800 1200
Dep
th (R
epre
sent
ed b
y Ye
ar)
Lead Concentration (mg/kg)
1950
1955
1960
1965
1970
1975
1980
1985
1990
1995
2000
20050 5 10 15 20
App
roxi
mat
e Ye
ar o
f Dep
ositi
on
Mercury Concentration (mg/kg)
Sediment Contamination vs Year for 2005 High Resolution Cores

Focused Feasibility Study Reportfor the Lower Eight Miles of the
Lower Passaic River
2014

0
7
6
5
3
1
2
4
HUDSON COUNTY
ESSEX COUNTY
BERGEN COUNTY
³
2014Lower Eight Miles of the Lower Passaic RiverSediment Texture Type – RM0 to RM8
0 0.5 10.25Miles
Path:
S:\Pr
ojects
\pass
aic\M
apDo
cume
nts\Fi
nal_F
FS_F
igures
_201
4\Figu
re 1-6
Sed
imen
tTextu
re - b
ase m
ap.m
xd
Legend
Project CenterlineShoreline as Defined by the New Jersey Department of Environmental Protection County Boundaries
City BoundariesSediment Type
Rock and Coarse Gravel
Gravel and Sand
Sand
Silt and Sand
Silt
Figure 1-6a

Second River
Third River
8
9
12
1011
13ESSEX COUNTY
BERGEN COUNTY
PASSAIC COUNTY
HUDSON COUNTY
³
2014Lower Eight Miles of the Lower Passaic RiverSediment Texture Type – RM8 to RM13
0 0.5 10.25Miles
Path:
S:\Pr
ojects
\pass
aic\M
apDo
cume
nts\Fi
nal_F
FS_F
igures
_201
4\Figu
re 1-6
Sed
imen
tTextu
re - b
ase m
ap.m
xd
Legend
Project CenterlineShoreline as Defined by the New Jersey Department of Environmental Protection County Boundaries
City BoundariesSediment Type
Rock and Coarse Gravel
Gravel and Sand
Sand
Silt and Sand
Silt
Figure 1-6b

Saddle River16
13
1417
15
BERGEN COUNTY
PASSAIC COUNTY
³
2014
Sediment Texture Type – RM13 to RM17 Lower Eight Miles of the Lower Passaic River
0 0.3 0.60.15Miles
Path:
S:\Pr
ojects
\pass
aic\M
apDo
cume
nts\Fi
nal_F
FS_F
igures
_201
4\Figu
re 1-6
Sed
imen
tTextu
re - b
ase m
ap.m
xd
Legend
Project CenterlineShoreline as Defined by the New Jersey Department of Environmental Protection County Boundaries
City BoundariesSediment Type
Rock and Coarse Gravel
Gravel and Sand
Sand
Silt and Sand
Silt
Figure 1-6c

Copyright:© 2013 ESRI, i-cubed,GeoEye
CAD Cell:Area = 38 acresDimensions = 1500 x 1100 feet
Entrance Channel:Depth = 25 feet MLWWidth = 150 feet
Copyright:© 2013 ESRI, i-cubed,GeoEye
CAD Cell:Area = 17 acresDimensions = 1000 x 750 feet
Entrance Channel:Depth = 25 feet MLWWidth = 150 feet
Copyright:© 2013 ESRI, i-cubed,GeoEye
Figure 4-1
Lower Eight Miles of the Lower Passaic River
³
Proposed Confined Aquatic Disposal Cells in Newark Bay
LegendCAD Cell Entrance Channel
CAD Cell
Federally Authorized Navigation Channel
Channel Top of Slope (Approximate)
2014s:\pa
ssaic
\map
docu
ments
\Fina
l_FFS
_Figu
res_2
013\F
igure4
-2 Pr
opos
ed C
onfin
ed Aq
uatic
Disp
osal
Cells
in Ne
wark
Bay.m
xd
0 0.5 10.25Miles
Alternative 2 Alternative 3³
CAD Cell:Area = 55 acresDimensions = 1500 x 1600 feet
Entrance Channel:Depth = 25 feet MLWWidth = 150 feet
³ Alternative 4

Legend
Lower Eight Miles of the Lower Passaic River 2014
Figure 4-3a Average Concentrations of 2,3,7,8-TCDD in Surface Sediment in the FFS Study Area versus PRGs (Linear Scale)
Risk = 10-6
Risk = 10-4
HQ = 1 (Proposed Remediation Goal)
Risk = 10-6
Risk = 10-4
HQ = 1
56 Fish Meals per year:
34 Crab Meals per year:
Human Health PRGs
0
0.2
0.4
0.6
0.8
1
0
0.2
0.4
0.6
0.8
1
1995 2005 2015 2025 2035 2045 2055
2,3,
7,8-
TCDD
Con
cent
ratio
n (µ
g/kg
) Fish Consumption
0
0.2
0.4
0.6
0.8
1
0
0.2
0.4
0.6
0.8
1
1995 2005 2015 2025 2035 2045 2055
2,3,
7,8-
TCDD
Con
cent
ratio
n (µ
g/kg
)
Crab Consumption
Time (Years)

Legend
Lower Eight Miles of the Lower Passaic River 2014
Figure 4-3b Average Concentrations of 2,3,7,8-TCDD in Surface Sediment in the FFS Study Area versus PRGs (Log Scale)
Risk = 10-6
Risk = 10-4
HQ = 1 (Proposed Remediation Goal)
Risk = 10-6
Risk = 10-4
HQ = 1
56 Fish Meals per year:
34 Crab Meals per year:
Human Health PRGs
0.00001
0.0001
0.001
0.01
0.1
1
10
0.00001
0.0001
0.001
0.01
0.1
1
10
1995 2005 2015 2025 2035 2045 2055
2,3,
7,8-
TCDD
Con
cent
ratio
n (µ
g/kg
) Fish Consumption
0.00001
0.0001
0.001
0.01
0.1
1
10
0.00001
0.0001
0.001
0.01
0.1
1
10
1995 2005 2015 2025 2035 2045 2055
2,3,
7,8-
TCDD
Con
cent
ratio
n (µ
g/kg
)
Crab Consumption
Time (Years)

Legend
Lower Eight Miles of the Lower Passaic River 2014
0.001
0.01
0.1
1
10
0.001
0.01
0.1
1
10
1995 2000 2005 2010 2015 2020 2025 2030 2035 2040 2045 2050 2055 2060
0.001
0.01
0.1
1
10
0.001
0.01
0.1
1
10
1995 2000 2005 2010 2015 2020 2025 2030 2035 2040 2045 2050 2055 2060
0.001
0.01
0.1
1
10
0.001
0.01
0.1
1
10
1995 2000 2005 2010 2015 2020 2025 2030 2035 2040 2045 2050 2055 2060
Average Concentration of 2,3,7,8-TCDD in Surface Sediment in the FFS Study Area: Best Estimate and Uncertainty Bounds
Figure 4-3c
Time (Years)
2,3,
7,8-
TCD
D C
once
ntra
tion
(µg/
kg) Alternative 1 and Alternative 2
Alternative 1 and Alternative 3
Alternative 1 and Alternative 4
Alternative 1 Uncertainty Bounds
Alternative 2 Uncertainty Bounds
Alternative 1 Best Estimate
Alternative 2 Best Estimate
Alternative 3 Best Estimate
Alternative 4 Best Estimate
Alternative 3 Uncertainty Bounds Alternative 4 Uncertainty Bounds
Proposed Remediation Goal
Legend
Lower Eight Miles of the Lower Passaic River 2014
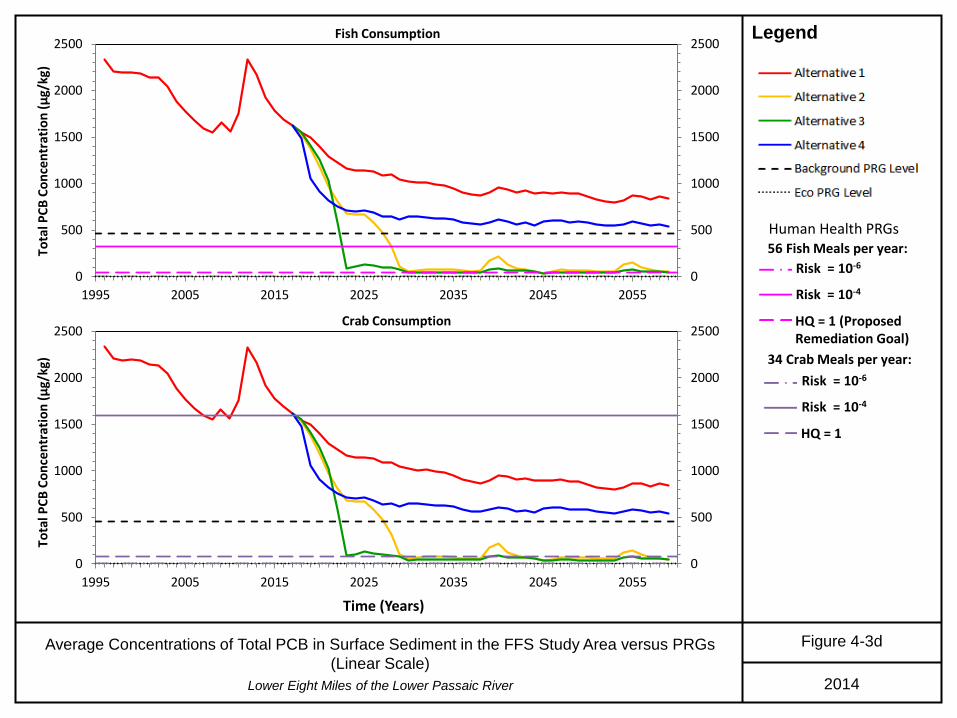
Figure 4-3d Average Concentrations of Total PCB in Surface Sediment in the FFS Study Area versus PRGs (Linear Scale)
Risk = 10-6
Risk = 10-4
HQ = 1 (Proposed Remediation Goal)
Risk = 10-6
Risk = 10-4
HQ = 1
56 Fish Meals per year:
34 Crab Meals per year:
Human Health PRGs
0
500
1000
1500
2000
2500
0
500
1000
1500
2000
2500
1995 2005 2015 2025 2035 2045 2055
Tota
l PCB
Con
cent
ratio
n (µ
g/kg
) Fish Consumption
0
500
1000
1500
2000
2500
0
500
1000
1500
2000
2500
1995 2005 2015 2025 2035 2045 2055
Tota
l PCB
Con
cent
ratio
n (µ
g/kg
)
Crab Consumption
Time (Years)

Legend
Lower Eight Miles of the Lower Passaic River 2014
Figure 4-3e Average Concentrations of Total PCB in Surface Sediment in the FFS Study Area versus PRGs (Log Scale)
Risk = 10-6
Risk = 10-4
HQ = 1 (Proposed Remediation Goal)
Risk = 10-6
Risk = 10-4
HQ = 1
56 Fish Meals per year:
34 Crab Meals per year:
Human Health PRGs
1
10
100
1000
10000
1
10
100
1000
10000
1995 2005 2015 2025 2035 2045 2055
Tota
l PCB
Con
cent
ratio
n (µ
g/kg
) Fish Consumption
1
10
100
1000
10000
1
10
100
1000
10000
1995 2005 2015 2025 2035 2045 2055
Tota
l PCB
Con
cent
ratio
n (µ
g/kg
)
Crab Consumption
Time (Years)

Legend
Lower Eight Miles of the Lower Passaic River 2014
10
100
1000
10000
10
100
1000
10000
1995 2000 2005 2010 2015 2020 2025 2030 2035 2040 2045 2050 2055 2060
10
100
1000
10000
10
100
1000
10000
1995 2000 2005 2010 2015 2020 2025 2030 2035 2040 2045 2050 2055 2060
10
100
1000
10000
10
100
1000
10000
1995 2000 2005 2010 2015 2020 2025 2030 2035 2040 2045 2050 2055 2060
Average Concentration of Total PCB in Surface Sediment in the FFS Study Area: Best Estimate and Uncertainty Bounds
Figure 4-3f
Tota
l PC
B C
once
ntra
tion
(µg/
kg)
Alternative 1 and Alternative 2
Alternative 1 and Alternative 3
Alternative 1 and Alternative 4
Alternative 1 Uncertainty Bounds
Alternative 2 Uncertainty Bounds
Alternative 1 Best Estimate
Alternative 2 Best Estimate
Alternative 3 Best Estimate
Alternative 4 Best Estimate
Alternative 3 Uncertainty Bounds Alternative 4 Uncertainty Bounds
Proposed Remediation Goal
Time (Years)

Legend
Lower Eight Miles of the Lower Passaic River 2014
Figure 4-3g Average Concentrations of Total DDx in Surface Sediment in the FFS Study Area versus PRGs (Linear and Log Scale)
Note: Human Health PRGs were not calculated for Total DDX because it does not contribute significantly to human health risk.
(Proposed Remediation Goal)
0
50
100
150
200
250
0
50
100
150
200
250
1995 2005 2015 2025 2035 2045 2055
Tota
l DDx
Con
cent
ratio
n (µ
g/kg
)
0.1
1
10
100
1000
0.1
1
10
100
1000
1995 2005 2015 2025 2035 2045 2055
Tota
l DDx
Con
cent
ratio
n (µ
g/kg
)
Time (Years)

Legend
Lower Eight Miles of the Lower Passaic River 2014
0.1
1
10
100
1000
0.1
1
10
100
1000
1995 2000 2005 2010 2015 2020 2025 2030 2035 2040 2045 2050 2055 2060
0.1
1
10
100
1000
0.1
1
10
100
1000
1995 2000 2005 2010 2015 2020 2025 2030 2035 2040 2045 2050 2055 2060
0.1
1
10
100
1000
0.1
1
10
100
1000
1995 2000 2005 2010 2015 2020 2025 2030 2035 2040 2045 2050 2055 2060
Average Concentration of Total DDx in Surface Sediment in the FFS Study Area: Best Estimate and Uncertainty Bounds
Figure 4-3h
Time (Years)
Tota
l DD
x C
once
ntra
tion
(µg/
kg)
Alternative 1 and Alternative 2
Alternative 1 and Alternative 3
Alternative 1 and Alternative 4
Alternative 1 Uncertainty Bounds
Alternative 2 Uncertainty Bounds
Alternative 1 Best Estimate
Alternative 2 Best Estimate
Alternative 3 Best Estimate
Alternative 4 Best Estimate
Alternative 3 Uncertainty Bounds Alternative 4 Uncertainty Bounds
Proposed Remediation Goal

Legend
Lower Eight Miles of the Lower Passaic River 2014
Figure 4-3i Average Concentrations of Mercury in Surface Sediments in the FFS Study Area versus PRGs (Linear Scale)
HQ = 1
HQ = 1
56 Fish Meals per year:
34 Crab Meals per year:
Human Health PRGs
Note: 34 Crab Meals per year PRG at the HQ = 1 threshold is not shown in the figure because the concentration is 45000 µg/kg.
(Proposed Remediation Goal)
0
500
1000
1500
2000
2500
3000
3500
4000
0
500
1000
1500
2000
2500
3000
3500
4000
1995 2005 2015 2025 2035 2045 2055
Mer
cury
Con
cent
ratio
n (µ
g/kg
) Fish Consumption
0
500
1000
1500
2000
2500
3000
3500
4000
0
500
1000
1500
2000
2500
3000
3500
4000
1995 2005 2015 2025 2035 2045 2055
Mer
cury
Con
cent
ratio
n (µ
g/kg
)
Crab Consumption
Time (Years)

Legend
Lower Eight Miles of the Lower Passaic River 2014
10
100
1000
10000
100000
10
100
1000
10000
100000
1995 2005 2015 2025 2035 2045 2055
Mer
cury
Con
cent
ratio
n (µ
g/kg
) Fish Consumption
Figure 4-3j Average Concentrations of Mercury in Surface Sediments in the FFS Study Area versus PRGs (Log Scale)
HQ = 1
HQ = 1
56 Fish Meals per year:
34 Crab Meals per year:
Human Health PRGs
(Proposed Remediation Goal)
Time (Years)
10
100
1000
10000
100000
10
100
1000
10000
100000
1995 2005 2015 2025 2035 2045 2055
Mer
cury
Con
cent
ratio
n (µ
g/kg
)
Crab Consumption

Legend
Lower Eight Miles of the Lower Passaic River 2014
10
100
1000
10000
10
100
1000
10000
1995 2000 2005 2010 2015 2020 2025 2030 2035 2040 2045 2050 2055 2060
10
100
1000
10000
10
100
1000
10000
1995 2000 2005 2010 2015 2020 2025 2030 2035 2040 2045 2050 2055 2060
10
100
1000
10000
10
100
1000
10000
1995 2000 2005 2010 2015 2020 2025 2030 2035 2040 2045 2050 2055 2060
Average Concentration of Mercury in Surface Sediment in the FFS Study Area: Best Estimate and Uncertainty Bounds
Figure 4-3k
Time (Years)
Mer
cury
Con
cent
ratio
n (µ
g/kg
) Alternative 1 and Alternative 2
Alternative 1 and Alternative 3
Alternative 1 and Alternative 4
Alternative 1 Uncertainty Bounds
Alternative 2 Uncertainty Bounds
Alternative 1 Best Estimate
Alternative 2 Best Estimate
Alternative 3 Best Estimate
Alternative 4 Best Estimate
Alternative 3 Uncertainty Bounds Alternative 4 Uncertainty Bounds
Proposed Remediation Goal

Final Feasibility Study Appendix A - Data Evaluation Reports
2014

Lower Eight Miles of the Lower Passaic River 2014
Figure 2-1a Blue Crab 2,3,7,8-TCDD Concentration vs. River Mile
Legend Tissue Sampling Year
1995
1999
2000
2009
Hepatopancreas
Muscle
Muscle/Hepatopancreas
Carcass
Tissue Type
Notes 1. Fit Lines are weighted curves for illustration purpose only.
These curves are based on all available data for given tissue types.
2. Muscle/Hepatopancreas tissue type includes muscle/hepatopancreas, all edible tissue and whole body – soft tissue.
3. Muscle tissue includes muscle, edible muscle and muscle tissue.
1
10
100
1000
0 1 2 3 4 5 6 7 8
2,3,
7,8-
TCD
D C
once
ntra
tion
(pg/
g)
Carcass
Muscle
Muscle/Hepatopancreas
Hepatopancreas
100
1000
10000
100000
0 1 2 3 4 5 6 7 8
Lipi
d N
orm
aliz
ed 2
,3,7
,8-T
CD
D C
once
ntra
tion
(pg/
g)
River Mile
CarcassHepatopancreas
Muscle/Hepatopancreas
Muscle

Lower Eight Miles of the Lower Passaic River 2014
Figure 2-1b Blue Crab Total PCB Concentration vs. River Mile
Legend Tissue Sampling Year
1995
1999
2000
2009
Hepatopancreas
Muscle
Muscle/Hepatopancreas
Carcass
Tissue Type
Notes 1. Fit Lines are weighted curves for illustration purpose only.
These curves are based on all available data for given tissue types.
2. Muscle/Hepatopancreas tissue type includes muscle/hepatopancreas, all edible tissue and whole body – soft tissue.
3. Muscle tissue includes muscle, edible muscle and muscle tissue.
10
100
1000
10000
100000
0 1 2 3 4 5 6 7 8
Tota
l PC
B C
once
ntra
tion
(ug/
kg)
Hepatopancreas
Muscle/Hepatopancreas
CarcassMuscle
100
1000
10000
100000
1000000
0 1 2 3 4 5 6 7 8
Lipi
d N
orm
aliz
ed T
otal
PC
B C
once
ntra
tion
(ug/
kg)
River Mile
Hepatopancreas
Muscle
Carcass
Muscle/Hepatopancreas

Lower Eight Miles of the Lower Passaic River 2014
Figure 2-1c Blue Crab Dieldrin Concentration vs. River Mile
Legend Tissue Sampling Year
1995
1999
2000
2009
Hepatopancreas
Muscle
Muscle/Hepatopancreas
Carcass
Tissue Type
Notes 1. Fit Lines are weighted curves for illustration purpose only.
These curves are based on all available data for given tissue types.
2. Muscle/Hepatopancreas tissue type includes muscle/hepatopancreas, all edible tissue and whole body – soft tissue.
3. Muscle tissue includes muscle, edible muscle and muscle tissue.
0.1
1
10
100
0 1 2 3 4 5 6 7 8
Die
ldri
n C
once
ntra
tion
(ug/
kg)
Hepatopancreas
Muscle Carcass
Muscle/Hepatopancreas
10
100
1000
10000
0 1 2 3 4 5 6 7 8
Lipi
d N
orm
aliz
ed D
ield
rin
Con
cent
ratio
n (u
g/kg
)
River Mile
CarcassHepatopancreas
Muscle/Hepatopancreas
Muscle
Lower Eight Miles of the Lower Passaic River 2014
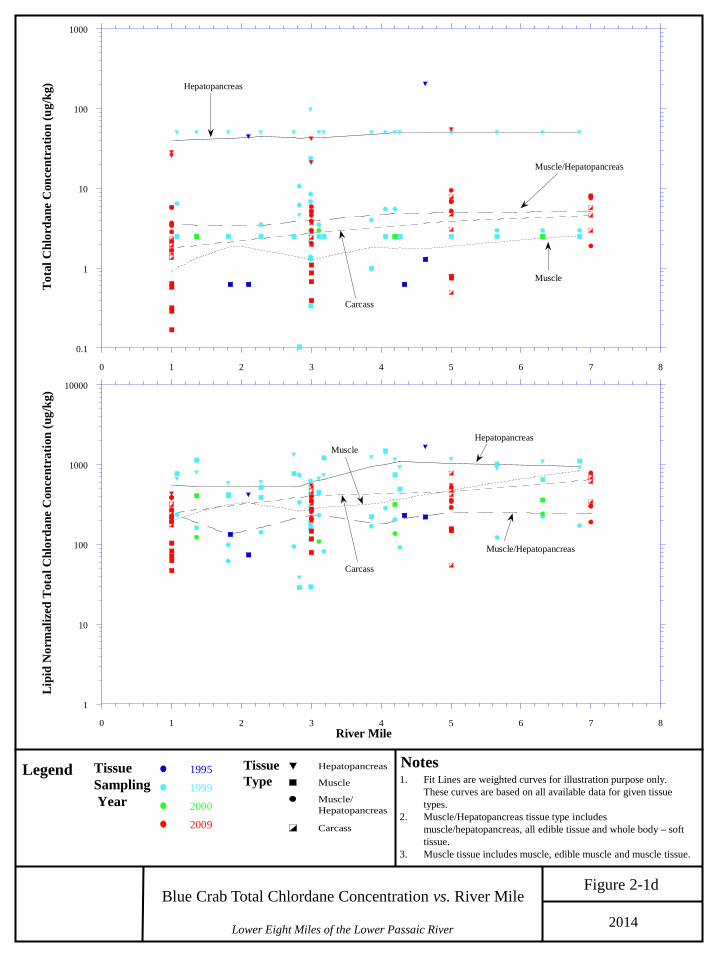
Figure 2-1d Blue Crab Total Chlordane Concentration vs. River Mile
Legend Tissue Sampling Year
1995
1999
2000
2009
Hepatopancreas
Muscle
Muscle/Hepatopancreas
Carcass
Tissue Type
Notes 1. Fit Lines are weighted curves for illustration purpose only.
These curves are based on all available data for given tissue types.
2. Muscle/Hepatopancreas tissue type includes muscle/hepatopancreas, all edible tissue and whole body – soft tissue.
3. Muscle tissue includes muscle, edible muscle and muscle tissue.
0.1
1
10
100
1000
0 1 2 3 4 5 6 7 8
Tota
l Chl
orda
ne C
once
ntra
tion
(ug/
kg) Hepatopancreas
Muscle/Hepatopancreas
Carcass
Muscle
1
10
100
1000
10000
0 1 2 3 4 5 6 7 8
Lipi
d N
orm
aliz
ed T
otal
Chl
orda
ne C
once
ntra
tion
(ug/
kg)
River Mile
Hepatopancreas
Muscle/Hepatopancreas
Carcass
Muscle

Lower Eight Miles of the Lower Passaic River 2014
Figure 2-1e Blue Crab Total DDx Concentration vs. River Mile
Legend Tissue Sampling Year
1995
1999
2000
2009
Hepatopancreas
Muscle
Muscle/Hepatopancreas
Carcass
Tissue Type
Notes 1. Fit Lines are weighted curves for illustration purpose only.
These curves are based on all available data for given tissue types.
2. Muscle/Hepatopancreas tissue type includes muscle/hepatopancreas, all edible tissue and whole body – soft tissue.
3. Muscle tissue includes muscle, edible muscle and muscle tissue.
1
10
100
1000
10000
0 1 2 3 4 5 6 7 8
Tota
l DD
x C
once
ntra
tion
(ug/
kg)
Hepatopancreas
Muscle
Carcass
Muscle/Hepatopancreas
10
100
1000
10000
100000
0 1 2 3 4 5 6 7 8
Lipi
d N
orm
aliz
ed T
otal
DD
x C
once
ntra
tion
(ug/
kg)
River Mile
HepatopancreasCarcass
Muscle/HepatopancreasMuscle

Lower Eight Miles of the Lower Passaic River 2014
Figure 2-1f Blue Crab LMW PAH Concentration vs. River Mile
Legend Tissue Sampling Year
1995
1999
2000
2009
Hepatopancreas
Muscle
Muscle/Hepatopancreas
Carcass
Tissue Type
Notes 1. Fit Lines are weighted curves for illustration purpose only.
These curves are based on all available data for given tissue types.
2. Muscle/Hepatopancreas tissue type includes muscle/hepatopancreas, all edible tissue and whole body – soft tissue.
3. Muscle tissue includes muscle, edible muscle and muscle tissue.
1
10
100
1000
0 1 2 3 4 5 6 7 8
Low
Mol
ecul
ar W
eigh
t PA
H C
once
ntra
tion
(ug/
kg)
Hepatopancreas
Muscle/Hepatopancreas
MuscleCarcass
100
1000
10000
100000
0 1 2 3 4 5 6 7 8
Lipi
d N
orm
aliz
ed L
ow M
olec
ular
Wei
ght P
AH
Con
cent
ratio
n (u
g/kg
)
River Mile
Hepatopancreas
Muscle/Hepatopancreas
Muscle
Carcass

Lower Eight Miles of the Lower Passaic River 2014
Figure 2-1g Blue Crab HMW PAH Concentration vs. River Mile
Legend Tissue Sampling Year
1995
1999
2000
2009
Hepatopancreas
Muscle
Muscle/Hepatopancreas
Carcass
Tissue Type
Notes 1. Fit Lines are weighted curves for illustration purpose only.
These curves are based on all available data for given tissue types.
2. Muscle/Hepatopancreas tissue type includes muscle/hepatopancreas, all edible tissue and whole body – soft tissue.
3. Muscle tissue includes muscle, edible muscle and muscle tissue.
1
10
100
1000
0 1 2 3 4 5 6 7 8
Hig
h M
olec
ular
Wei
ght P
AH
Con
cent
ratio
n (u
g/kg
)Hepatopancreas
Muscle/HepatopancreasMuscle
Carcass
100
1000
10000
100000
0 1 2 3 4 5 6 7 8
Lipi
d N
orm
aliz
ed H
igh
Mol
ecul
ar W
eigh
t PA
H C
once
ntra
tion
(ug/
kg)
River Mile
Hepatopancreas
Muscle/Hepatopancreas
Muscle
Carcass

Lower Eight Miles of the Lower Passaic River 2014
Figure 2-1h Blue Crab Total PAH Concentration vs. River Mile
Legend Tissue Sampling Year
1995
1999
2000
2009
Hepatopancreas
Muscle
Muscle/Hepatopancreas
Carcass
Tissue Type
Notes 1. Fit Lines are weighted curves for illustration purpose only.
These curves are based on all available data for given tissue types.
2. Muscle/Hepatopancreas tissue type includes muscle/hepatopancreas, all edible tissue and whole body – soft tissue.
3. Muscle tissue includes muscle, edible muscle and muscle tissue.
1
10
100
1000
10000
0 1 2 3 4 5 6 7 8
Tota
l PA
H C
once
ntra
tion
(ug/
kg)
Hepatopancreas
Muscle/Hepatopancreas
Muscle
Carcass
100
1000
10000
100000
1000000
0 1 2 3 4 5 6 7 8
Lipi
d N
orm
aliz
ed T
otal
PA
H C
once
ntra
tion
(ug/
kg)
River Mile
Hepatopancreas
Muscle/Hepatopancreas
Muscle
Carcass

Lower Eight Miles of the Lower Passaic River 2014
Figure 2-1i Blue Crab Copper Concentration vs. River Mile
Legend
Tissue Type
Tissue Sampling Year
1995
1999
2000
2009
Hepatopancreas
Muscle
Muscle/Hepatopancreas
Carcass
1
10
100
0 1 2 3 4 5 6 7 8
Carcass
Hepatopancreas
MuscleMuscle/Hepatopancreas
Cop
per C
once
ntra
tion
(mg/
kg)
River MileNotes:1) Mucle/Hepatopancreas tissue type includes muscle/hepatopancreas, all edible tissue and whole body - soft tissue.2) Muscle tissue type includes edible muscle, muscle and muscle tissue.

Lower Eight Miles of the Lower Passaic River 2014
Figure 2-1j Blue Crab Lead Concentration vs. River Mile
Legend
Tissue Type
Tissue Sampling Year
1995
1999
2000
2009
Hepatopancreas
Muscle
Muscle/Hepatopancreas
Carcass
0.01
0.1
1
10
0 1 2 3 4 5 6 7 8
CarcassHepatopancreas
Muscle
Muscle/Hepatopancreas
Lead
Con
cent
ratio
n (m
g/kg
)
River MileNotes:1) Mucle/Hepatopancreas tissue type includes muscle/hepatopancreas, all edible tissue and whole body - soft tissue.2) Muscle tissue type includes edible muscle, muscle and muscle tissue.

Lower Eight Miles of the Lower Passaic River 2014
Figure 2-1k Blue Crab Mercury Concentration vs. River Mile
Legend
Tissue Type
Tissue Sampling Year
1995
1999
2000
2009
Hepatopancreas
Muscle
Muscle/Hepatopancreas
Carcass
10
100
1000
0 1 2 3 4 5 6 7 8
CarcassHepatopancreas
Muscle
Muscle/Hepatopancreas
Mer
cury
Con
cent
ratio
n (u
g/kg
)
River MileNotes:1) Mucle/Hepatopancreas tissue type includes muscle/hepatopancreas, all edible tissue and whole body - soft tissue.2) Muscle tissue type includes edible muscle, muscle and muscle tissue.
Lower Eight Miles of the Lower Passaic River 2014
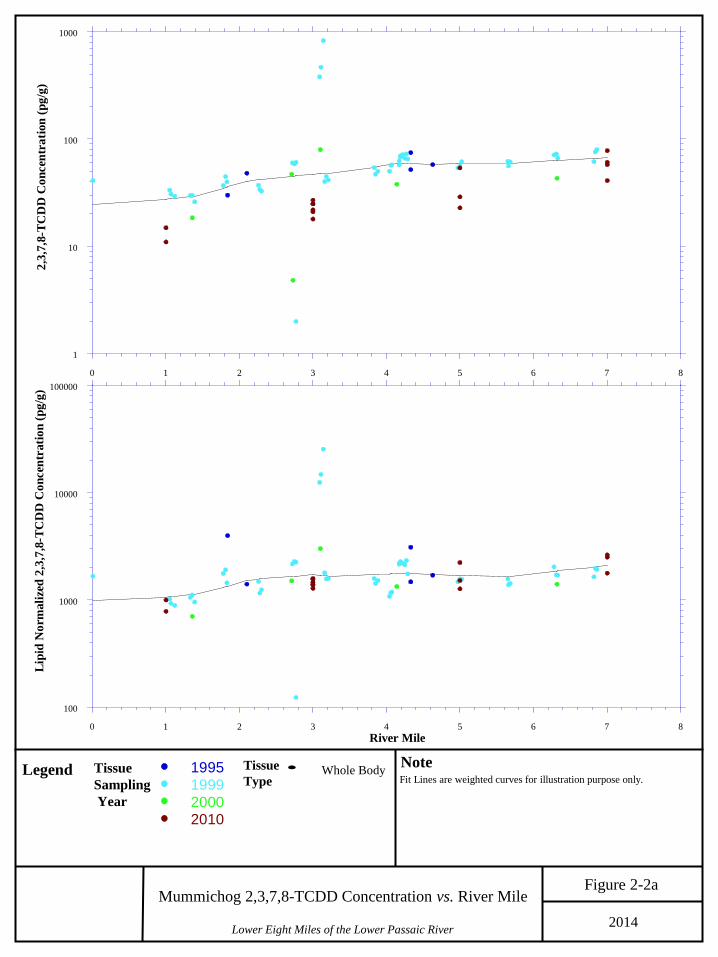
Figure 2-2a Mummichog 2,3,7,8-TCDD Concentration vs. River Mile
Legend Tissue Sampling Year
Tissue Type
Note Fit Lines are weighted curves for illustration purpose only.
1995199920002010
Whole Body
1
10
100
1000
0 1 2 3 4 5 6 7 8
2,3,
7,8-
TCD
D C
once
ntra
tion
(pg/
g)
100
1000
10000
100000
0 1 2 3 4 5 6 7 8
Lipi
d N
orm
aliz
ed 2
,3,7
,8-T
CD
D C
once
ntra
tion
(pg/
g)
River Mile

Lower Eight Miles of the Lower Passaic River 2014
Figure 2-2b Mummichog Total PCB Concentration vs. River Mile
Legend Tissue Sampling Year
Tissue Type
Note Fit Lines are weighted curves for illustration purpose only.
1995199920002010
Whole Body
100
1000
10000
0 1 2 3 4 5 6 7 8
Tota
l PC
B C
once
ntra
tion
(ug/
kg)
1000
10000
100000
0 1 2 3 4 5 6 7 8
Lipi
d N
orm
aliz
ed T
otal
PC
B C
once
ntra
tion
(ug/
kg)
River Mile

Lower Eight Miles of the Lower Passaic River 2014
Figure 2-2c Mummichog Dieldrin Concentration vs. River Mile
Legend Tissue Sampling Year
Tissue Type
Notes 1. Fit Lines are weighted curves for illustration purpose only. 2. 1999 and 2000 data was excluded from the fit line because the large
number of nondetects presented in the data.
1995199920002010
Whole Body
1
10
100
0 1 2 3 4 5 6 7 8
Die
ldri
n C
once
ntra
tion
(ug/
kg)
10
100
1000
0 1 2 3 4 5 6 7 8
Lipi
d N
orm
aliz
ed D
ield
rin
Con
cent
ratio
n (u
g/kg
)
River Mile

Lower Eight Miles of the Lower Passaic River 2014
Figure 2-2d Mummichog Total Chlordane Concentration vs. River Mile
Legend Tissue Sampling Year
Tissue Type
Notes 1. Fit Lines are weighted curves for illustration purpose only. 2. 1999 and 2000 data was excluded from the fit line because the large
number of nondetects presented in the data.
1995199920002010
Whole Body
1
10
100
1000
0 1 2 3 4 5 6 7 8
Tota
l Chl
orda
ne C
once
ntra
tion
(ug/
kg)
10
100
1000
10000
0 1 2 3 4 5 6 7 8
Lipi
d N
orm
aliz
ed T
otal
Chl
orda
ne C
once
ntra
tion
(ug/
kg)
River Mile

Lower Eight Miles of the Lower Passaic River 2014
Figure 2-2e Mummichog Total DDx Concentration vs. River Mile
Legend Tissue Sampling Year
Tissue Type
Note Fit Lines are weighted curves for illustration purpose only.
1995199920002010
Whole Body
1
10
100
1000
0 1 2 3 4 5 6 7 8
Tota
l DD
x C
once
ntra
tion
(ug/
kg)
100
1000
10000
100000
0 1 2 3 4 5 6 7 8
Lipi
d N
orm
aliz
ed T
otal
DD
x C
once
ntra
tion
(ug/
kg)
River Mile

Lower Eight Miles of the Lower Passaic River 2014
Figure 2-2f Mummichog LMW PAH Concentration vs. River Mile
Legend Tissue Sampling Year
Tissue Type
Note Fit Lines are weighted curves for illustration purpose only.
1995199920002010
Whole Body
1
10
100
1000
0 1 2 3 4 5 6 7 8
Low
Mol
ecul
ar W
eigh
t PA
H C
once
ntra
tion
(ug/
kg)
100
1000
10000
100000
0 1 2 3 4 5 6 7 8
Lipi
d N
orm
aliz
ed L
ow M
olec
ular
Wei
ght P
AH
Con
cent
ratio
n (u
g/kg
)
River Mile

Lower Eight Miles of the Lower Passaic River 2014
Figure 2-2g Mummichog HMW PAH Concentration vs. River Mile
Legend Tissue Sampling Year
Tissue Type
Note Fit Lines are weighted curves for illustration purpose only.
1995199920002010
Whole Body
1
10
100
1000
0 1 2 3 4 5 6 7 8
Hig
h M
olec
ular
Wei
ght P
AH
Con
cent
ratio
n (u
g/kg
)
100
1000
10000
100000
0 1 2 3 4 5 6 7 8
Lipi
d N
orm
aliz
ed H
igh
Mol
ecul
ar W
eigh
t PA
H C
once
ntra
tion
(ug/
kg)
River Mile

Lower Eight Miles of the Lower Passaic River 2014
Figure 2-2h Mummichog Total PAH Concentration vs. River Mile
Legend Tissue Sampling Year
Tissue Type
Note Fit Lines are weighted curves for illustration purpose only.
1995199920002010
Whole Body
1
10
100
1000
0 1 2 3 4 5 6 7 8
Tota
l PA
H C
once
ntra
tion
(ug/
kg)
100
1000
10000
100000
0 1 2 3 4 5 6 7 8
Li
pid
Nor
mal
ized
Tot
al P
AH
Con
cent
ratio
n (u
g/kg
)
River Mile

Lower Eight Miles of the Lower Passaic River 2014
Figure 2-2i Mummichog Copper Concentration vs. River Mile
Legend
Tissue Type
Tissue Sampling Year
Whole Body
1995199920002010
1
10
0 1 2 3 4 5 6 7 8
Cop
per C
once
ntra
tion
(mg/
kg)
River Mile

Lower Eight Miles of the Lower Passaic River 2014
Figure 2-2j Mummichog Lead Concentration vs. River Mile
Legend
Tissue Type
Tissue Sampling Year
Whole Body
1995199920002010
0.1
1
10
0 1 2 3 4 5 6 7 8
Lead
Con
cent
ratio
n (m
g/kg
)
River Mile
Note: 1999 non detects were excluded from the fit line.

Lower Eight Miles of the Lower Passaic River 2014
Figure 2-2k Mummichog Mercury Concentration vs. River Mile
Legend
Tissue Type
Tissue Sampling Year
Whole Body
1995199920002010
10
100
1000
0 1 2 3 4 5 6 7 8
Mer
cury
Con
cent
ratio
n (u
g/kg
)
River Mile

Lower Eight Miles of the Lower Passaic River 2014
Figure 2-3a White Perch 2,3,7,8-TCDD Concentration vs. River Mile
Legend Tissue Sampling Year
Tissue Type
Note
Whole Body -Head&Viscera
Whole Body
Fillet Skinless
Carcass
Fillet with Skin
1999
2000
2009
2010
Fit Lines are weighted curves for illustration purpose only. These curves are based on all available data for given tissue types.
10
100
1000
0 1 2 3 4 5 6 7 8
2,3,
7,8-
TCD
D C
once
ntra
tion
(pg/
g)
Whole Body
Fillet with skin
Fillet Skinless
100
1000
10000
0 1 2 3 4 5 6 7 8
Lipi
d N
orm
aliz
ed 2
,3,7
,8-T
CD
D C
once
ntra
tion
(pg/
g)
River Mile
Whole Body
Fillet with Skin
Fillet Skinless

Lower Eight Miles of the Lower Passaic River 2014
Figure 2-3b White Perch Total PCB Concentration vs. River Mile
Legend Tissue Sampling Year
Tissue Type
Note
Whole Body -Head&Viscera
Whole Body
Fillet Skinless
Carcass
Fillet with Skin
1999
2000
2009
2010
Fit Lines are weighted curves for illustration purpose only. These curves are based on all available data for given tissue types.
100
1000
10000
100000
0 1 2 3 4 5 6 7 8
Fillet Skinless
Fillet with Skin
Tota
l PC
B C
once
ntra
tion
(ug/
kg)
Whole Body
1000
10000
100000
1000000
0 1 2 3 4 5 6 7 8
Lipi
d N
orm
aliz
ed T
otal
PC
B C
once
ntra
tion
(ug/
kg)
River Mile
Whole Body
Fillet with SkinFillet Skinless

Lower Eight Miles of the Lower Passaic River 2014
Figure 2-3c White Perch Dieldrin Concentration vs. River Mile
Legend Tissue Sampling Year
Tissue Type
Note
Whole Body -Head&Viscera
Whole Body
Fillet Skinless
Carcass
Fillet with Skin
1999
2000
2009
2010
Fit Lines are weighted curves for illustration purpose only. These curves are based on all available data for given tissue types.
0.1
1
10
100
1000
0 1 2 3 4 5 6 7 8
Die
ldri
n C
once
ntra
tion
(ug/
kg)
Whole Body
Fillet with skin
Fillet Skinless
1
10
100
1000
10000
0 1 2 3 4 5 6 7 8
Lipi
d N
orm
aliz
ed D
ield
rin
Con
cent
ratio
n (u
g/kg
)
River Mile
Whole Body
Fillet with Skin
Fillet Skinless

Lower Eight Miles of the Lower Passaic River 2014
Figure 2-3d White Perch Total Chlordane Concentration vs. River Mile
Legend Tissue Sampling Year
Tissue Type
Note
Whole Body -Head&Viscera
Whole Body
Fillet Skinless
Carcass
Fillet with Skin
1999
2000
2009
2010
Fit Lines are weighted curves for illustration purpose only. These curves are based on all available data for given tissue types.
1
10
100
1000
0 1 2 3 4 5 6 7 8
Tota
l Chl
orda
ne C
once
ntra
tion
(ug/
kg)
Whole Body
Fillet Skinless
Fillet with skin
10
100
1000
10000
0 1 2 3 4 5 6 7 8
Li
pid
Nor
mal
ized
Tot
al C
hlor
dane
Con
cent
ratio
n (u
g/kg
)
River Mile
Whole Body
Fillet Skinless
Fillet with Skin

Lower Eight Miles of the Lower Passaic River 2014
Figure 2-3e White Perch Total DDx Concentration vs. River Mile
Legend Tissue Sampling Year
Tissue Type
Note
Whole Body -Head&Viscera
Whole Body
Fillet Skinless
Carcass
Fillet with Skin
1999
2000
2009
2010
Fit Lines are weighted curves for illustration purpose only. These curves are based on all available data for given tissue types.
10
100
1000
0 1 2 3 4 5 6 7 8
Tota
l DD
x C
once
ntra
tion
(ug/
kg) Whole Body
Fillet Skinless
Fillet with skin
1000
10000
100000
0 1 2 3 4 5 6 7 8
Lipi
d N
orm
aliz
ed T
otal
DD
x C
once
ntra
tion
(ug/
kg)
River Mile
Whole Body
Fillet with Skin
Fillet Skinless

Lower Eight Miles of the Lower Passaic River 2014
Figure 2-3f White Perch LMW PAH Concentration vs. River Mile
Legend Tissue Sampling Year
Tissue Type
Note
Whole Body -Head&Viscera
Whole Body
Fillet Skinless
Carcass
Fillet with Skin
1999
2000
2009
2010
Fit Lines are weighted curves for illustration purpose only. These curves are based on all available data for given tissue types.
1
10
100
1000
0 1 2 3 4 5 6 7 8
Low
Mol
ecul
ar W
eigh
t PA
H C
once
ntra
tion
(ug/
kg)
Fillet with Skin
Whole Body
Fillet Skinless
100
1000
10000
100000
0 1 2 3 4 5 6 7 8
Lipi
d N
orm
aliz
ed L
ow M
olec
ular
Wei
ght P
AH
C
once
ntra
tion
(ug/
kg)
River Mile
Fillet with Skin
Whole Body
Fillet Skinless

Lower Eight Miles of the Lower Passaic River 2014
Figure 2-3g White Perch HMW PAH Concentration vs. River Mile
Legend Tissue Sampling Year
Tissue Type
Note
Whole Body -Head&Viscera
Whole Body
Fillet Skinless
Carcass
Fillet with Skin
1999
2000
2009
2010
Fit Lines are weighted curves for illustration purpose only. These curves are based on all available data for given tissue types.
10
100
1000
0 1 2 3 4 5 6 7 8
Hig
h M
olec
ular
Wei
ght P
AH
Con
cent
ratio
n (u
g/kg
)
Whole Body
Fillet with Skin
Fillet Skinless
100
1000
10000
0 1 2 3 4 5 6 7 8
Lipi
d N
orm
aliz
ed H
igh
Mol
ecul
ar W
eigh
t PA
H
Con
cent
ratio
n (u
g/kg
)
River Mile
Whole Body
Fillet with SkinFillet Skinless

Lower Eight Miles of the Lower Passaic River 2014
Figure 2-3h White Perch Total PAH Concentration vs. River Mile
Legend Tissue Sampling Year
Tissue Type
Note
Whole Body -Head&Viscera
Whole Body
Fillet Skinless
Carcass
Fillet with Skin
1999
2000
2009
2010
Fit Lines are weighted curves for illustration purpose only. These curves are based on all available data for given tissue types.
10
100
1000
0 1 2 3 4 5 6 7 8
Fillet Skinless
Tota
l PA
H C
once
ntra
tion
(ug/
kg)
Fillet with Skin
Whole Body
100
1000
10000
100000
0 1 2 3 4 5 6 7 8
Lipi
d N
orm
aliz
ed T
otal
PA
H C
once
ntra
tion
(ug/
kg)
River Mile
Whole Body
Fillet Skinless
Fillet with Skin

Lower Eight Miles of the Lower Passaic River 2014
Figure 2-3i White Perch Copper Concentration vs. River Mile
Legend
Tissue Type
Tissue Sampling Year
1999
2000
2009
2010
Whole Body -Head&Viscera
Whole Body
Fillet Skinless
Carcass
Fillet with Skin
0.1
1
10
100
0 1 2 3 4 5 6 7 8
Cop
per C
once
ntra
tion
(mg/
kg)
River Mile
Fillet with Skin
Fillet Skinless
Whole Body

Lower Eight Miles of the Lower Passaic River 2014
Figure 2-3j White Perch Lead Concentration vs. River Mile
Legend
Tissue Type
Tissue Sampling Year
1999
2000
2009
2010
Whole Body -Head&Viscera
Whole Body
Fillet Skinless
Carcass
Fillet with Skin
0.001
0.01
0.1
1
0 1 2 3 4 5 6 7 8
Lead
Con
cent
ratio
n (m
g/kg
)
River Mile
Whole Body
Fillet Skinless
Fillet with Skin

Lower Eight Miles of the Lower Passaic River 2014
Figure 2-3k White Perch Mercury Concentration vs. River Mile
Legend
Tissue Type
Tissue Sampling Year
1999
2000
2009
2010
Whole Body -Head&Viscera
Whole Body
Fillet Skinless
Carcass
Fillet with Skin
10
100
1000
0 1 2 3 4 5 6 7 8
Mer
cury
Con
cent
ratio
n (u
g/kg
)
River Mile
Fillet with Skin
Fillet Skinless
Whole Body

Lower Eight Miles of the Lower Passaic River 2014
Figure 2-4a American Eel 2,3,7,8-TCDD Concentration vs. River Mile
Legend Tissue Sampling Year
Tissue Type
Note
Whole Body -Head&Viscera
Whole Body
Fillet Skinless
Carcass
Fillet with Skin
Fit Lines are weighted curves for illustration purpose only. These curves are based on all available data for given tissue types.
1999200020012009
1
10
100
0 1 2 3 4 5 6 7 8
2,3,
7,8-
TCD
D C
once
ntra
tion
(pg/
g)
Whole Body
Fillet Skinless
10
100
1000
0 1 2 3 4 5 6 7 8
Lipi
d N
orm
aliz
ed 2
,3,7
,8-T
CD
D C
once
ntra
tion
(pg/
g)
River Mile
Fillet Skinless
Whole Body
Lower Eight Miles of the Lower Passaic River 2014
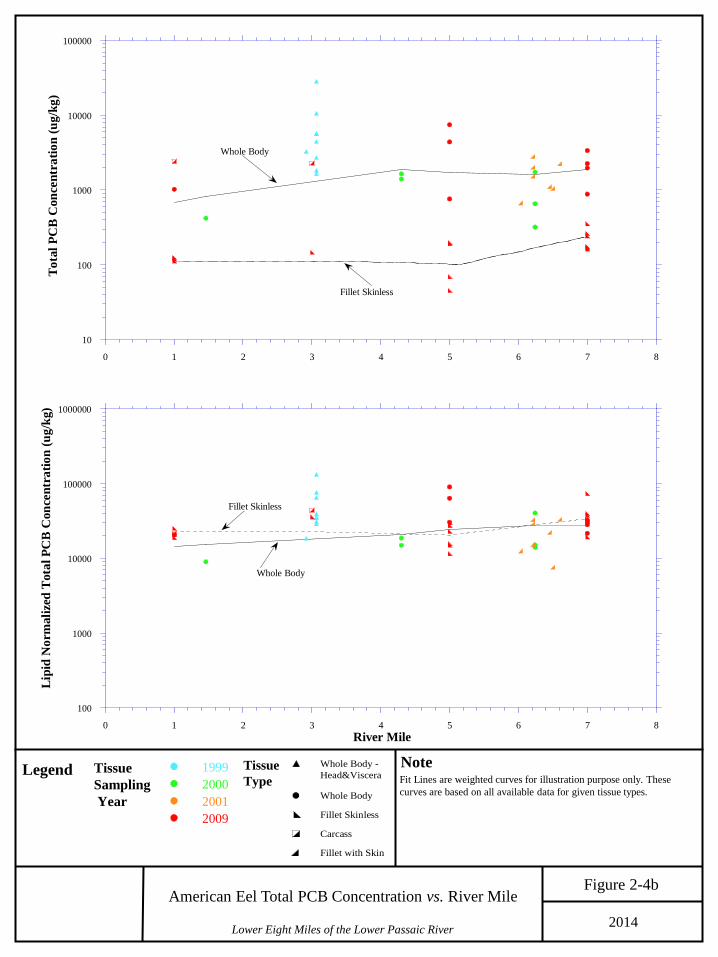
Figure 2-4b American Eel Total PCB Concentration vs. River Mile
Legend Tissue Sampling Year
Tissue Type
Note
Whole Body -Head&Viscera
Whole Body
Fillet Skinless
Carcass
Fillet with Skin
Fit Lines are weighted curves for illustration purpose only. These curves are based on all available data for given tissue types.
1999200020012009
10
100
1000
10000
100000
0 1 2 3 4 5 6 7 8
Tota
l PC
B C
once
ntra
tion
(ug/
kg)
Whole Body
Fillet Skinless
100
1000
10000
100000
1000000
0 1 2 3 4 5 6 7 8
Lipi
d N
orm
aliz
ed T
otal
PC
B C
once
ntra
tion
(ug/
kg)
River Mile
Fillet Skinless
Whole Body

Lower Eight Miles of the Lower Passaic River 2014
Figure 2-4c American Eel Dieldrin Concentration vs. River Mile
Legend Tissue Sampling Year
Tissue Type
Note
Whole Body -Head&Viscera
Whole Body
Fillet Skinless
Carcass
Fillet with Skin
1. Fit Lines are weighted curves for illustration purpose only. These curves are based on all available data for given tissue types.
2. Year 2000 whole body data was excluded from the fit line because all data was nondetects.
1999200020012009
1
10
100
1000
0 1 2 3 4 5 6 7 8
Die
ldri
n C
once
ntra
tion
(ug/
kg)
Whole Body
Fillet Skinless
10
100
1000
10000
0 1 2 3 4 5 6 7 8
Lipi
d N
orm
aliz
ed D
ield
rin
Con
cent
ratio
n (u
g/kg
)
River Mile
Whole Body
Fillet Skinless

Lower Eight Miles of the Lower Passaic River 2014
Figure 2-4d American Eel Total Chlordane Concentration vs. River
Mile
Legend Tissue Sampling Year
Tissue Type
Note
Whole Body -Head&Viscera
Whole Body
Fillet Skinless
Carcass
Fillet with Skin
1. Fit Lines are weighted curves for illustration purpose only. These curves are based on all available data for given tissue types.
2. Year 2000 whole body data was excluded from the fit line because all data was nondetects.
1999200020012009
1
10
100
1000
0 1 2 3 4 5 6 7 8
Tota
l Chl
orda
ne C
once
ntra
tion
(ug/
kg)
Whole Body
Fillet Skinless
10
100
1000
10000
0 1 2 3 4 5 6 7 8
Lipi
d N
orm
aliz
ed T
otal
Chl
orda
ne C
once
ntra
tion
(ug/
kg)
River Mile
Whole Body
Fillet Skinless

Lower Eight Miles of the Lower Passaic River 2014
Figure 2-4e American Eel Total DDx Concentration vs. River Mile
Legend Tissue Sampling Year
Tissue Type
Note
Whole Body -Head&Viscera
Whole Body
Fillet Skinless
Carcass
Fillet with Skin
1. Fit Lines are weighted curves for illustration purpose only. These curves are based on all available data for given tissue types.
2. Year 2000 whole body data was excluded from the fit line because all data was nondetects.
1999200020012009
10
100
1000
10000
0 1 2 3 4 5 6 7 8
Tota
l DD
x C
once
ntra
tion
(ug/
kg)
Whole Body
Fillet Skinless
100
1000
10000
100000
0 1 2 3 4 5 6 7 8
Lipi
d N
orm
aliz
ed T
otal
DD
x C
once
ntra
tion
(ug/
kg)
River Mile
Whole Body
Fillet Skinless

Lower Eight Miles of the Lower Passaic River 2014
Figure 2-4f American Eel LMW PAH Concentration vs. River Mile
Legend Tissue Sampling Year
Tissue Type
Note
Whole Body -Head&Viscera
Whole Body
Fillet Skinless
Carcass
Fillet with Skin
1. Fit Lines are weighted curves for illustration purpose only. These curves are based on all available data for given tissue types.
2. Year 2000 whole body data was excluded from the fit line because all data was nondetects.
1999200020012009
1
10
100
1000
0 1 2 3 4 5 6 7 8
Low
Mol
ecul
ar W
eigh
t PA
H C
once
ntra
tion
(ug/
kg)
Fillet Skinless
Whole Body
10
100
1000
10000
0 1 2 3 4 5 6 7 8
Li
pid
Nor
mal
ized
Low
Mol
ecul
ar W
eigh
t PA
H
Con
cent
ratio
n (u
g/kg
)
River Mile
Fillet Skinless
Whole Body

Lower Eight Miles of the Lower Passaic River 2014
Figure 2-4g American Eel HMW PAH Concentration vs. River Mile
Legend Tissue Sampling Year
Tissue Type
Note
Whole Body -Head&Viscera
Whole Body
Fillet Skinless
Carcass
Fillet with Skin
1. Fit Lines are weighted curves for illustration purpose only. These curves are based on all available data for given tissue types.
2. Year 2000 whole body data was excluded from the fit line because all data was nondetects.
1999200020012009
1
10
100
0 1 2 3 4 5 6 7 8
Hig
h M
olec
ular
Wei
ght P
AH
Con
cent
ratio
n (u
g/kg
)
Fillet Skinless
Whole Body
10
100
1000
0 1 2 3 4 5 6 7 8
Lipi
d N
orm
aliz
ed H
igh
Mol
ecul
ar W
eigh
t PA
H
Con
cent
ratio
n (u
g/kg
)
River Mile
Fillet Skinless
Whole Body

Lower Eight Miles of the Lower Passaic River 2014
Figure 2-4h American Eel Total PAH Concentration vs. River Mile
Legend Tissue Sampling Year
Tissue Type
Note
Whole Body -Head&Viscera
Whole Body
Fillet Skinless
Carcass
Fillet with Skin
1. Fit Lines are weighted curves for illustration purpose only. These curves are based on all available data for given tissue types.
2. Year 2000 whole body data was excluded from the fit line because all data was nondetects.
1999200020012009
10
100
1000
0 1 2 3 4 5 6 7 8
Tota
l PA
H C
once
ntra
tion
(ug/
kg)
Fillet Skinless
Whole Body
100
1000
10000
0 1 2 3 4 5 6 7 8
Lipi
d N
orm
aliz
ed T
otal
PA
H C
once
ntra
tion
(ug/
kg)
River Mile
Fillet Skinless
Whole Body

Lower Eight Miles of the Lower Passaic River 2014
Figure 2-4i American Eel Copper Concentration vs. River Mile
Legend
Tissue Type
Tissue Sampling Year
Whole Body -Head&Viscera
Whole Body
Fillet Skinless
Carcass
Fillet with Skin
1999200020012009
0.1
1
10
100
0 1 2 3 4 5 6 7 8
Copp
er C
once
ntra
tion
(mg/
kg)
River Mile
Whole Body Year 2009
Fillet Skinless
Whole Body Year 2000

Lower Eight Miles of the Lower Passaic River 2014
Figure 2-4j American Eel Lead Concentration vs. River Mile
Legend
Tissue Type
Tissue Sampling Year
Whole Body -Head&Viscera
Whole Body
Fillet Skinless
Carcass
Fillet with Skin
1999200020012009
0.01
0.1
1
10
0 1 2 3 4 5 6 7 8
Lead
Con
cent
ratio
n (m
g/kg
)
River Mile
Whole Body
Fillet Skinless

Lower Eight Miles of the Lower Passaic River 2014
Figure 2-4k American Eel Mercury Concentration vs. River Mile
Legend
Tissue Type
Tissue Sampling Year
Whole Body -Head&Viscera
Whole Body
Fillet Skinless
Carcass
Fillet with Skin
1999200020012009
10
100
1000
0 1 2 3 4 5 6 7 8
Mer
cury
Con
cent
ratio
n (u
g/kg
)
River Mile
Fillet Skinless
Whole Body

Lower Eight Miles of the Lower Passaic River 2014
0
2,0
4,0
6,0
8,0
10
Lipi
d N
orm
aliz
ed
2,3,
7,8-
TCD
D (p
g/g)
01/01/1999 01/01/2007
Datetime_Placed
Figure 2-12 Lipid Normalized 2,3,7,8-TCDD Tissue Concentration vs. Time
Sample Date
Blue Crab Hepatopancreas Blue Crab Muscle
Sample Date Sample Date
Blue Crab Muscle+Hepatopancreas
Mummichog Whole Body
Sample Date
0
2,0
4,0
6,0
8,0
10
Lipi
d N
orm
aliz
ed
2,3,
7,8-
TCD
D (p
g/g)
01/01/1994 01/01/20040
2,0
4,0
6,0
8,0
10
Lipi
d N
orm
aliz
ed
2,3,
7,8-
TCD
D (p
g/g)
01/01/1994 01/01/2004
0
1,0
2,0
3,0
4,0
5,0
Lipi
d N
orm
aliz
ed
2,3,
7,8-
TCD
D (p
g/g)
01/01/1999 01/01/2007
Datetime_PlacedSample Date
White Perch Whole Body