Embed Size (px)
Citation preview

Supercritical fluid extraction and analysis
of indigenous medicinal plants for uterotonic activity
by
VIKASH SEWRAM .
Submitted in partial fulfillment of the requirements
for the degree of
DOCTOR OF PHILOSOPHY
in the
Department of Chemistry and Applied Chemistry,
University of Natal, Durban, South Africa
1997

Preface
The experimental work described in this thesis was carried out in the Department of
Chemistry & Applied Chemistry and the Department of Physiology, University of Natal,
Durban, under the supervision of Professor M.W. Raynor (Applied Chemistry), Professor
D.A. Mulholland (Chemistry) and Doctor D.M. Raidoo (Physiology).
These studies represent original work by the author and have not been submitted in any form
to another university. Where use was made of the work of others, it has been duly
acknowledged in the text.
SIGNED:---iT---=-:::~ __ _
Vikash Sewram
We hereby certify that the above statement is correct.
SIGNED: ~ ----~----------
ProfessorM.W. Raynor
SIGNED: __ d(--+",,:)_~--,-. __ _
Doctor D .M. Raidoo
Department of Chemistry and Applied Chemistry
University of Natal
Durban
SIGNED: {)J.YlfVGv..li~· Professor D.A. Mulholland

Acknowledgements
I would like to express my sincere thanks and appreciation to the following for their
contribution to this thesis:
• Professor M.W. Raynor, Professor D.A. Mulholland, and Doctor D.M. Raidoo, for
their expert guidance and constant encouragement throughout the course of this
project.
• Doctor B.S. Martincigh for allowing the use of the preparative HPLC instrument.
• Mr S. Peterson and Mrs S. Naidoo for their assistance in the Applied Chemisty
department.
• Mr D. Jagjivan for obtaining NMR spectra of all the isolated compounds.
• Mr B. Parel for his assistance in the organic research laboratory whenever required.
• Mr R. Naicker and Mr K Perumal of the Department of Physiology who assisted with
the biological assays and in the construction of the organ baths for on-line bioassays.
• Mr M. Wagner of the Analytical unit, Department of Physiology, for allowing the use
of the GC-MS and HPLC instruments.
• Doctor P. Boshoff of the Cape Technikon for his assistance in obtaining mass spectra
and high resolution mass measurements of the isolated compounds.
• Mrs J. Govender and Mr R. Suchipersad for the administrative aspects related to this
work.
• All my colleagues in the Department of Physiology and Department of Chemistry and
Applied Chemistry especially Mr N. Naidoo and Miss K. Kowlaser who made my
working environment a pleasant and cheerful one.
• The FRD and University of Natal for providing financial assistance for these studies.
• My parents Mr and Mrs S. Girdhari for their love and support throughout my years of
study.
iii

Abstract
Ingestion of extracts prepared from various medicinal plants to induce or augment labour
is common amongst Black South African women during the late stages of pregnancy.
This applies particularly to the rural areas where modem health care facilities are often
lacking. Many of these plants have not been investigated scientifically and one needs to
substantiate claims of quality, safety and efficacy. Furthennore, it is believed that the
consumption of these plant extracts can result in foetal meconium staining at delivery.
An investigation into the uterotonic properties of three plants viz. Ekebergia capensis
Sparrm. Clivia miniata (Lindl.) Regel. and Grewia occidentalis L. were carried out using
guinea pig uterine smooth muscle in vitro. Supercritical fluid extraction was perfonned
with water modified supercritical carbon dioxide to extract the uterotonic components.
An attempt was also made to couple supercritical fluid extraction directly on-line to the
bioassay so that on line screening of crude plant extracts could be perfonned within short
periods of time. The effects of supercritical CO2 decompression on temperature and pH of
the muscle bathing solution were considered since · these factors affect muscle
contractility. The direct effects of excess CO2 on intracellular mechanisms were
eliminated by constructing a CO2 reduction interface together with passage of carbogen
which aided in the rapid displacement of excess CO2, As samples of these extracts were
found to induce muscle contraction, supercritical fluid fractionation (SFF) was perfonned
by sequentially increasing the fluid density. Extracted fractions were obtained by
sequentially increasing the pressure at constant temperature and modifier concentration in
an attempt to identify the active fractions. Extractions were perfonned at 200 atm, 300
atm and 400 atm respectively. Subsequent testing of these fractions enabled the detection
of active and inactive fractions as well as a fraction that had a spasmolytic effect on
uterine muscle. The 400 atm extracts of E. capensis and C. miniata displayed maximum
activity while only the 300 atm extract of G. occidentalis induced uterine muscle
contraction. Subsequent analysis of the sequentially extracted fractions, by high
iv

perfonnance liquid chromatography and micellar electrokinetic capillary chromatography
revealed that certain compounds present in the fractions that stimulated muscle
contraction, were sensitive to the extraction pressure hence making it possible to
detennine the compounds that were likely to be active. Column chromatography
followed by various spectroscopic techniques were perfonned in an attempt to isolate and
elucidate the structures of the compounds that were present in the plant extracts. The
extract of Ekebergia capensis yielded five known compounds (P-sitosterol, oleanonic
acid, 3-epioleanolic acid, 2,3,22,23-tetrahydroxy-2,6,1 0, 15,19 ,23-hexamethyl-6, 1 0, 14, 18-
tetracosatetrene and 7 -hydroxy-6-methoxy coumarin. The extract of Clivia miniata
yieded linoleic acid and 5-hydroxymethyl-2-furancarboxaldehyde while the extract of
Grewia occidentalis yielded 3-( 4-hydroxy-3-methoxyphenyl)-2-propenal, a novel
compound 2,2' ,6,6'-tetramethoxy-4' -al-4-( ro-oxo-E-propenyl)-biphenyl and oleanonic
acid. The pure compounds were further evaluated pharmacologically to identify the
active components and assess the physiological mode of action by the use of various
receptor blockers. Oleanonic acid, 3-epioleanolic acid, linoleic acid and 5-
hydroxymethyl-2-furancarboxaldehyde and 3-(4-hydroxy-3-methoxyphenyl)-2-propenal
were found to induce an agonistic muscle response. All these compounds were observed
to mediate their effects through the cholinergic receptors. The results obtained in this
study supports the claim of these plants possessing uterotonic properties.
v

Publications and Conference Presentations
Selected results from this thesis have been published in scientific journals and presented at
various conferences.
l. D.A. Mulholland, S. Iourine, V. Sewram, M.W. Raynor, D. Raidoo, Novel
compounds from South African Ekebergia species, Planta Med., 62 (1996), 125 .
2. V. Sewram, M. W. Raynor, D.A. Mulholland, D.M. Raidoo, Coupling SFE to
uterotonic bioassay: The on-line approach to analyzing medicinal plants, 1. Pharm
Biomed. Anal., in press.
3. V. Sewram, M.W. Raynor, D.A. Mulholland, D.M. Raidoo, On-line SFE
bioassay of uterotonically active fractions from Indigenous Medicinal Plants.
(Oral presentation), 2nd International Symposium on Natural Drugs, Maratea,
Italy, 28 September - 1 October 1997.
4. V. Sewram, D.M. Raidoo, M.W. Raynor, D.A. Mulholland, Interfacing SFE with
uterotonic bioassay: A novel approach to drug discovery. (Oral Presentation),
25th Annual Congress of the Physiological Society of Southern Africa and 2nd
International Congress of the African Association of Physiological Sciences,
International Convention Centre, Durban, 21 - 24 September 1997.
5. V. Sewram, M.W. Raynor, D.A. Mulholland, D.M. Raidoo, Coupling SFE to
uterotonic bioassay: The on-line approach to analyzing medicinal plants. (Oral
presentation), 6th Frank Warren National Organic Chemistry Conference,
Mtunzini, KwaZulu-Natal, 29 June - 1 July 1997.
vi

6. V. Sewram, M.W. Raynor, D.M. Raidoo, D.A. Mulholland, On-line SFE
bioassay with "MECC of uterotonic ally active fractions from Medicinal Plants."
(Poster presentation), 19th International Symposium on Capillary Chromatography
and Electrophoresis, Wintergreen, Virginia, USA, 18 - 22 May 1997.
7. V.Sewram, M.W. Raynor, D.A. Mulholland, D. Raidoo, Off-line Supercritical
fluid Extraction (SFE) - Micellar Electrokinetic Capillary Chromatography
("MECC) of Utero-tonic Compounds from an Indigenous Medicinal Plant,
Ekebergia capensis Sparrm. (poster presentation), 18th International
Symposium on Capillary Chromatography, Riva del Garda, Italy, May 1996.
8. V.Sewram, M.W. Raynor, D.A. Mulholland, D. Raidoo, Off-line Supercritical
fluid Extraction (SFE) - Bioassay - Micellar Electrokinetic Capillary
Chromatography (MECC) of Utero-tonic Compounds from Ekebergia capensis
Sparrm.(poster presentation), Chromatography and Mass Spectrometry
conference, Vaal Spa, Christiana, 25 - 29 August 1996 (PRIZE FOR BEST
POSTER ON METHOD DEVELOPMENT IN SEPARATION SCIENCE)
8. V.Sewram, M.W. Raynor, D.A. Mulholland, D. Raidoo, Supercritical fluid
extraction and analysis of an Indigenous medicinal plant, Ekebergia capensis
Sparrm. for Utero-tonic activity. (Poster presentation), International Symposium
on Supercritical Fluid Chromatography and Extraction, Indianapolis Indiana, USA,
March 1996.
9. V. Sewram, M.W. Raynor, D.A. Mulholland, D. Raidoo, Supercritical fluid
Extraction and Analysis of utero-tonic compounds from Ekebergia Capensis
Sparrm. (poster presentation), Conference proceedings, 33rd Annual Convention
of the South Mrican Chemical Institute, University of Cape Town, Cape Town,
January 1996.
vii

10. V. Sewram, M.W. Raynor, D.A. Mulholland, D.M. Raidoo, Supercritical fluid
extraction and analysis of indigenous medicinal plants for tocolytic activity. (Oral
presentation), Research Colloquium, Department of Physiology, Faculty of
Medicine, December 1995.
11. V. Sewram, M.W. Raynor, D.A. Mulholland, D.M. Raidoo, Supercritical Fluid
Extraction and analysis of indigenous medicinal plants for tocolytic activity. (Oral
presentation) Conference proceedings, 2nd Annual Symposium of the Centre for
Indigenous Plant Use Research (CIPUR), University of Natal, November 1995.
Awards received
Recipient of the 1995 Analytica Award from the Analytical Division of the South African
Chemical Institute for past and present research involving Analytical techniques.
Award for best poster on Method Development in Separation Science exhibited at the
Chromatography and Mass Spectrometry conference in VaaI Spa, Christiana, August
1996.
Recipient of the 1997 SasoI Postgraduate Medal
viii

Table of contents
Preface
Acknowledgements
Abstract
Publications and conference presentations
List of Figures
List of Tables
List of Schemes
List of Abbreviations and Units
1 Introduction and Aims
References
2 Theory of Supercritical Fluid Extraction (SFE)
2.1 Definition of a supercritical fluid
2.2 Physical properties of supercritical fluids
2.3 Advantages of SFE
2.4 Selection of a supercritical fluid
2.5 Unique properties of SF-CO2
2.6 Generalized method and instrumentation requirements for SFE
2.7 Selection of SFE conditions
2.8 U se of modifiers in SFE
2.8.1 Methods of adding modifiers
2.9 Modes of SFE
2.10 Kinetics of SFE
2.11 Physical matrix effects
ix
Page
11
111
IV
VI
XVll
XXVI
XXVll
XXVll
1
4
5
5
6
7
8
12
13
16
17
18
23
24
26

3
4
2.12 Impact of matrix on extraction kinetics
2.13 Class-selective SFE
References
Application of SFE to natural products: A literature review
3.1 Introduction
3.2 Alkaloids
3.3 Steroids
3.4 Flavour and Fragrance Compounds
3.5 Carotenoids
3.6 Lipid materials
3.7 Miscellaneous applications
References
Separation techniques
4.1 Introduction
4.2 Theory of Chromatography
4.2.1 Column Efficiency
4.2.2 Selectivity
4.2.3 Resolution
4.2.4 The van Deemter equation in Chromatography
4.3 Theory of electrophoretic separation
4.3 .1 Background electrolyte
4.3 .2 Instrumentation
4.3 .3 Electrophoresis
4.3.4 Electroosmosis and the electrical double layer
4.3.5 Efficiency
4.3 .6 Flow Profile
4.3.7 Modes of capillary electrophoresis.
4.3.7.1 Micellar Electrokinetic Capillary Chromatography
26
30
31
34
34
36
42
44
48
50
51
53
58
58
58
61
62
62
63
65
66
67
68
69
71
71
73
73

5
4.3.7.2 Principles of separation in MECC
4.3.7.3 Theory ofMECC
References
Experimental
5.1 Introduction
5.2 Plant material
5.3 Preparation of crude aqueous extracts
5.4 Off-line supercritical fluid extraction of plant components.
5.4.1 Pump
5.4.2 Plumbing
5.4.3 Extraction vessels
5.4.4 Extraction parameters
5.5 Uterotonic bioassay
5.6 On-line SFE-Bioassay.
5.7 Muscle bath construction.
5.7.1 Muscle bath A
5.7.2 Muscle bath B
5.8 Tapered restrictor fabrication.
5.9 pH measurements of Tyro des solution.
5.10 Isolation and structural elucidation of plant components
5.10.1 Column Chromatography
5.10.2 Thin layer chromatography
5.11 Spectroscopic techniques l ' 13 5. 11 . 1 Hand C NMR spectroscopy
5.11 .2 Infrared Spectroscopy
5.11.3 High Resolution Mass Spectrometry
5.11.4 Acetylation of compound 4
5.12 Chromatographic and electrophoretic analysis of the plant extracts
5.12.1 HPLC analysis.
xi
73
75
76
78
78
78
78
79
79
81
81
82
83
85
89
89
90
91
92
92
92
92
93
93
93
93
94
94
94

6
5. 12.2 Capillary electrophoresis
5.12.2.1
5.12.2.2
Buffer preparation
Sample preparation and injection
5.12.3 Supercritical fluid chromatography
95
97
97
99
5.13 Column packing 101
5. 14 Preparation of porous ceramic frits 103
5.15 GC-MS Analysis of Clivia miniata L. 103
5.16 Esterification of fatty acid mixture 104
5.17 Identification of active components and assessment of mode of action 104
5.18 Extractives from Ekebergia capensis 105
5.18.1 Physical data of compound 1
5.18.2 Physical data of compound 2
5.18.3 Physical data of compound 3
5.18.4 Physical data of compound 4
5.18.5 Physical data of compound 5
5.19 Extractives from Clivia miniata
5.19.1 Physical data of compound 6
5.19.2 Physical data of compound 7
5.20 Extractives from Grewia occidentalis
5.20.1 Physical data of compound 8
5.20.2 Physical data of compound 9
5.20.3 Physical data of compound 10
References
SFE optimization by application of dynamic extraction model for the
extraction of plant components
6.1 Introduction
6.2 The Extraction Model
6.3 Selection of extraction temperature
6.4 Selection of extraction pressure
xii
105
105
106
107
108
108
108
108
109
109
110
110
III
112
112
113
114
115

6.5 Selection of dynamic extraction time 116
6.6 Supercritical fluid extraction of Ekebergia capensis 116
6.7 Supercritical fluid extraction of Grewia occidentalis 119
6.8 Supercritical fluid extraction of Clivia miniata 121
6.9 Conclusion 123
References 124
7 The role of hioassays in medicinal plant analysis and a preliminary 126
investigation of the plant extracts for uterotonic activity
7.1 Introduction 126
7.2 Selection ofbioassays 127
7.3 The uterotonic bioassay 127
7.4 Theory of smooth muscle contraction 129
7.5 The effect of acetylcholine (ACh) on smooth muscle 132
7.6 Analysis of extracts of Ekebergia capensis Sparrm. 134
7.6.1 Aqueous extract 134
7.6.2 SFE extracts 136
7.6.3 Supercritical fluid fractionation of Ekebergia extracts 138
7.7 Analysis of extracts of Clivia miniata (Lindl.) Regel 142
7.7.1 Aqueous extract 142
7.7.2 SFE extract 143
7.8 Analysis of Grewia occidentalis L. 144
7.8.1 Aqueous extract 144
7.8.2 SFE extract 145
7.9 Conclusion 145
References 146
xiii

8
9
10
Coupling SFE to uterotonic bioassay: An on-line approach to 148
analysing Medicinal Plants
8.1 Introduction 148
8.2 Results and Discussion 150
8.2.1 Temperature effects 150
8.2.2 pH effects 152
8.2.3 Evaluation of Extracts 157
8.2.3.1 Analysis of Ekebergia capensis 157
8.2.3.2 Analysis of Grewia occidentalis 160
8.2.3 .3 Analysis of Clivia miniata 162
8.3 Conclusions 164
References 164
Extractives from Ekebergia capensis Sparrm. 166
9.1 The Genus Ekebergia 166
9.2 Structure elucidation of compounds isolated 173
9.2.1 Compound 1 173
9.2.2 Compound 2 175
9.2.3 Compound 3 177
9.2.4 Compound 4 179
9.2.5 Compound 5 182
References 186
Extractives from Clivia miniata (Lindl.) Regel. 188
10.1 The genus Clivia 188
10.2 Structural elucidation of compounds isolated from Clivia miniata 191
10.2.1
10.2.2
References
Compound 6
Compound 7
xiv
191
195
197

11.
12
Extractives from Grewia occidentalis 198
11.1 The genus Grewia 198
11 .2 Structural elucidation of compounds isolated from Grewia occidentalis 200
11.2.1 Compound 8 200
11.2.2 Compound 9 203
11 .2.3 Compound 10 206
References 206
In vitro screens and functional assays of isolated compounds 207
12.1 Introduction 207
12.2 Receptors and biological response 207
12.3 The role of chemical bonding 209
12.4 Analysis of compounds from Ekebergia capensis 211
12.4.1 Compound 2 211
12.4.2 Compound 3 212
12.5 Analysis of compounds from Clivia miniata 214
12.5.1 Compound 6 214
12.5.2 Compound 7 216
12.6 Analysis of compounds form Grewia occidentalis 217
12.6.1 Compound 8 217
12.7 Assessment of mode of action through receptor binding assays 218
12.7.1 Compound 3 from Ekebergia capensis 218
12.7.2 Compound 7 from Clivia miniata 220
12.7.3 Compound 8 from Grewia occidentalis 221
12.8 Conclusion 222
References 222

13 Chromatographic and electrophoretic analysis of the plant extracts
13 .1 Introduction
13 .2 Reverse-phase HPLC
13 .2.1 Analysis of extracts from Ekebergia capensis
13.2.2 Analysis of extracts from Clivia miniata
13 .2.3 Analysis of extracts from Grewia occidentalis
13 .3 Capillary electrophoresis
13 .3.1 Analysis of extracts from Ekebergia capensis
13.3.1. 1 Buffer selection
13.3.1.2 Optimization of surfactant concentration
13.3 .1.3 pH optimization
13.3 .1.4 Variation of applied voltage
13.3.1.5 Separation of components under optimised conditions
13.3.2 Analysis of extracts from Clivia miniata
13.3.3 Analysis of extracts from Grewia occidentalis
13.4 Packed capillary column SFC
13.4.1 SFC with COi
13.4.2 SFC with hydrofluorocarbon
13.5 Conclusion
References
14 Overview and concluding remarks
APPENDIX 1
APPENDIX 2
xvi
223
223
223
223
228
231
235
236
236
236
240
243
243
248
251
255
255
258
258
259
261
263
265

Figure 2.1
Figure 2.2
Figure 2.3
Figure 2.4
Figure 2.5
Figure 2.6
Figure 2.7
Figure 2.8
Figure 2.9
List of Figures
Pressure/temperature phase diagram of a substance.
Effect of temperature and pressure on the Hildebrand solubility parameter
for supercritical CO2. (14)
Effect of pressure changes on density of supercritical CO2 at different
temperatures.
Schematic diagram of an SFE setup for off-line recovery of analytes.
Typical extraction cells used in analytical SFE.
Schematic diagram of modifier delivery system for SF£.
Schematic diagram of device used to modify supercritical CO2 (22) .
Arrows indicate direction of flow. Components: A = four port valve;
B = "Parker" or "Swagelok" brand "tee" tubing fitting (1116 x 1/16 x 1/4
inch stainless steel); C = 114 inch normal pipe thread x 114 inch tubing stub
fitting welded into D; D = modifier chamber; E = 1116 inch o.d. stainless
steel tubing; F = heating coil; G = extraction cell; H = heater; I = restrictor;
J = collection vial.
Page
5
9
12
14
15
19
21
Relationship between the critical temperature, pressure and mole fraction of 22
CO2-methanol mixtures according to Saito and Nitta. (23)
Generalised extraction curve of percent solute extracted as a function of
volume of extraction fluid or time of extraction.
24
Figure 2.10 Mass transport steps for the SFE of an analyte from a porous matrix 27
partcle.
Figure 2.11 Plot of In (mlmo) against extraction time for .the supercritical fluid 29
extraction of camphor from rosemary.
Figure 3.1 Capillary GC/FID pattern of Senecio inaequidens pyrrolizidine alkaloid 38
fraction extracted by off-line SFE. (16)
1, senecivernine; 2, senecio nine; 3, seneciphylline; 4, integerrimine;
5, retrorsine; 6, usaramine; 7, desacetyl doronine; 8, doronine.
:\:vii

Figure 3.2
Figure 3.3
Figure 3.4
Figure 3.5
Figure 4.1
Figure 4.2
Figure 4.3
Figure 4.4
Figure 4.5
Figure 4.6
Figure 4.7
Capillary GCIFID pattern of Senecio cordatus pyrrolizidine alkaloid
fraction extracted by off-line SFE. (16)
1, seneciverine; 2, senecio nine; 3, seneciphylline; 4, spartiodine;
5, integerrimine; 6, jacobine; 7, jacozine.
Influence of water on the extraction curves of thebaine at constant mass
flow-rate (12). SFE was performed at 20 N1Pa and 40.5 °C using
CO2:methanol: water mixtures of the following w:w:w compositions:O
50:32:18; ~ 50:36:14; .50:40:10; + 50:44:6; .50:46:4; 050:49:1;
o 50:49.5:0.5; f1 50:50:0
The dependence of extraction yield on CO2 consumption at 50 0e. (18)
Comparison of chromatograms generated by
CA) SFE-GC-FID analysis of rosemary and by
(C) Standard on-column injection of a methylene chloride extract.
Chromatogram (B) shows the result of a second SFE-GC-FID analysis
of the same sample. (35)
A chromatogram with its characteristic features.
van Deemter plot
Change in H versus linear mobile phase velocity u.
Hrrun = A + (2BC)If2; Uopt = (B/C)If2
Basic Scheme of a CE instrument
C = separation capillary;
E = electrolyte reservoirs with platinum electrodes
S = sample vial
D = detector
R = signal recorder
Double layer structure at a silica wall.
Velocity profiles of liquid flowing in a capillary under the action of (a)
electroosmosis and (b) hydrostatic pressure.
Schematic representation of the separation principle ofMECC.
Schematic representation of the zone separation in NIECe.
xviii
38
39
40
45
60
64
67
70
72
74
75

Figure 5.1
Figure 5.2
Figure 5.3
Figure 5.4
Figure 5.5
Figure 5.6
Figure 5.7
Figure 5.8
Figure 5.9
Photograph of the home assembled SFE system.
Schematic diagram of a syringe pump
A diagram of a commercially available stainless steel extraction vessel with
fingertight end caps. (1)
Schematic diagram of the uterotonic bioassay setup used to monitor muscle
activity.
Schematic diagram of the on-line SFE-bioassay setup.
Plumbing schematic of the multi port valve used for switching between static
and dynamic modes of extraction.
Polypropylene muscle bath designed for horizontal flow of CO2 with direct
introduction into the muscle bath.
Polypropylene muscle bath designed for vertical flow of CO2 with direct
introduction into a CO2 reduction interface.
Schematic steps showing the preparation of a tapered capillary restrictor.
(1) a mico-Bunsen burner is used for localized heating of the capillary.
(2) tension is applied and the capillary pulled to a hair like taper.
(3) polyimide resin is applied to the taper which is subsequently positioned
with a capillary sleeve.
(4) the resin cures and glues the taper to part of the inner wall of the sleeve.
79
80
82
84
86
87
89
90
91
Figure 5.10 Interior of the Capillary Cartridge. (3) 96
Figure 5. 11 Assembly for sample injection in the micro lit er scale. 98
Figure 5.12 Schematic diagram of injection valve for SFC. 99
Figure 5.13 Schematic diagram of butt-connection of column to restrictor 100
Figure 5.14 Schematic diagram of the supercritical fluid CO2 packing system. (4) 102
Figure 6.1 Generalized solubility isotherm as a function of pressure at constant 115
temperature. (9)
Figure 6.2
Figure 6.3
Extraction curve of mass extracted from Ekeberia capensis Sparrm. as a
function of extraction time (min).
Plot of In (mlmoJ against extraction time (min) for the supercritical fluid
extraction of Ekebegia capensis Sparrm.
xix
118
118

Figure 6.4
Figure 6.5
Figure 6.6
Figure 6.7
Figure 7.1
Figure 7.2
Figure 7.3
Figure 7.4
Figure 7.5
Figure 7.6
Figure 7.7
Figure 7.8
Figure 7.9
Extraction curve of mass extracted from Grewia occidentalis L. as a
function of extraction time (min).
Plot of In (m/m,) against extraction time (min) for the supercritical fluid
extraction of Grewia occidentalis L.
Extraction curve of mass extracted from Clivia miniata L. as a function of
extraction time (min).
Plot of In (m/mq) against extraction time (min) for the supercritical fluid
extraction of Clivia miniata L.
The pharrnacokinetic influences on a biologically active agent.
Diagram of the mechanism of activation of smooth muscle contraction
by Ca2+.
Biosynthesis of Acetylcholine.
Electrical recording of Guinea Pig uterine smooth muscle contraction
induced by 1 Ilg O-Acetylcholine hydrochloride (ACh).
Electrical recording of non pregnant guinea pig uterine smooth muscle
contraction induced by (a) 588 Ilg of the aqueous extract of milled wood of
Ekebergia capensis and (b) 700 Ilg of the aqueous extract after
administration of mepyramine. w = muscle wash
Electrical recording of contractions induced by the SFE extract of
Ekebergia capensis.on a non-pregnant uterus.
Electrical recording of contractions induced by the SFE extract of
Ekerbergia capeilsis.on a pregnant uterus.
Electrical recording of non pregnant guinea pig uterine smooth muscle
contraction induced by the sequentially fractionated extract of Ekebergia
capensis at 400 atm
Electrical recording of non pregnant guinea pig uterine smooth muscle
contraction induced by the sequentiaIIy fractionated extract of Eke b ergia
capensis at 350 atm.
xx
120
120
122
123
128
131
132
133
135
137
138
139
140

Figure 7.10
Figure 7.11
Figure 7.12
Figure 7.13
Figure 7.14
Figure 8.1
Figure 8.2
Figure 8.3
Figure 8A
Electrical recording of non pregnant guinea pig uterine smooth muscle
contraction induced by the sequentialIy fractionated extract of Ekebergia
capensis at 300 atm.
Electrical recording of pregnant guinea pig uterine smooth muscle
contraction induced by the aqueous extract of Clivia miniata (Lindl.)
RegeJ.
Electrical recording of pregnant guinea pig uterine smooth muscle
contraction induced by the SFE extract of Clivia miniata (Lindl.) Regel.
Electrical recording of pregnant guinea pig uterine smooth muscle
contraction induced by the aqueous extract of Grewia occidentalis L.
Electrical recording of pregnant guinea pig uterine smooth muscle
contraction induced by the SFE extract of Grewia occidentalis L.
The effect of CO2 decompression on temperature of Tyrodes solution.
CO2 was decompressed from an internal pressure of 400 atm through a 25
!J.m i.d. tapered restrictor (.) and a linear restrictor (.)
The effect of CO2 decompression on pH of modified (0.2 mM Na2HP04,
0.2mM NaH2P04) and original Tyrodes solution (OA mM NaH2P04).
CO2 was decompressed from an internal pressure of 400 atm through a 25
!J.m i.d. tapered restrictor; CO2 flow was measured at 150 atm after
decompression and found to be 18 mlImin.
The direct effect of CO2 on muscle contractility. Muscle activity was
inhibited following a blank extraction with CO2 at 400 atm and 80°C.
The effect of SFE extract of E. capensis on Guinea Pig uterine smooth
muscle.
a) total 400 atm extract, b) sequentiaIIy fractionated extract obtained
at 200 atm, c)300 atm and d) 400 atm demonstrating that the 400 atm
extract was most potent.
fr point at which contents of the extract collection chamber was transferred
to the muscle bath; W = muscle wash with Tyrodes solution.
x.xi
141
142
143
144
145
151
153
154
159

Figure 8.5
Figure 8.6
The effect of SFE extract of G. occidentalis on Guinea Pig uterine smooth
muscle.
a) total 400 atm extract, b) sequentiaUy fractionated extract obtained at
200 atm, c) 300 atm and d) 400 atm demonstrating that the 300 atm extract
was most potent.
o point at which contents of the extract collection chamber was transferred
to the muscle bath; W = muscle wash with Tyrodes solution.
The effect of SFE extract of C. miniata on Guinea Pig uterine smooth
muscle.
a) total 400 atm extract, b) sequential extract at 200 atm, c) 300 atm d) 400
atm demonstrating that the 400 atm extract was most potent.
o point at which contents of the extract collection chamber was transferred
to the muscle bath; W = muscle wash with Tyrodes solution.
161
163
Figure 10.1 GC-MS total ion chromatogram of esterified fatty acid mixture showing 192
linoleic acid methyl ester as the major component.
Figure 10.2 El mass spectrum for linoleic acid methyl ester with the matching spectrum 193
from the Wiley library confirming the identity of linoleic acid.
Figure 12.1 Illustration of the different conformations of drug molecules and their ability 208
to bind to the receptor surface (7).
Figure 12.2 Illustration of various drug-receptor bonds.
Figure 12.3 Electrical recording of contractions induced by compound 2 of
Ekebergia capensis on a non-pregnant uterus.
Figure 12.4 Electrical recording of contractions induced by compound 3 of
Ekebergia capensis on a non-pregnant uterus.
Figure 12.5 Electrical recording of pregnant guinea pig uterine smooth muscle
contraction induced by compound 6 of Clivia miniata (Lindl.)
Regel.
xxii
210
211
212
215

Figure 12.6
Figure 12.7
Figure 12.8
Figure 12.9
Figure 12.10
Figure 13 .1
Figure 13 .2
Figure 13 .3
Electrical recording of pregnant guinea pig uterine smooth muscle
contraction induced by compound 7 of Clivia miniata (Lindl.)
Regel.
Electrical recording of pregnant guinea pig uterine smooth muscle
contraction induced by compound 8 of Grewia occidentalis L.
Receptor binding assays of compound 3 from E. capensis.
Receptor binding assays of compound 7 from C. miniata.
Receptor binding assays of compound 8 from G. occidentalis.
Reverse-phase HPLC chromatogram of total SFE extract of E. capensis
wood obtained at 400 atm and 80°C.
Conditions: Bondclone-l0 C 18 reverse phase column; gradient elution
(methanol/water); column temperature 40°C; UV detection at 280 run.
Reverse-phase HPLC chromatogram of sequentially extracted SFE fractions
of E. capensis wood.
Conditions: Bondclone-10 C 18 reverse phase column; gradient elution
(methanOl/water); column temperature 40°C; UV detection at 280 run.
Reverse-phase HPLC chromatogram of first batch of SFE extract of E.
capensis wood showing the variation of chemical composition with seasonal
changes.
Conditions: Bondclone-10 C 18 reverse phase column; gradient elution
(methanOl/water); column temperature 40°C; UV detection at 280 nm.
216
217
219
220
221
225
226
227
Figure 13.4 Reverse-phase HPLC chromatogram of total SFE extract of C. miniata 228
root obtained at 400 atm and 80°C.
Conditions: Bondclone-10 C 18 reverse phase column; gradient elution
(methanol/water); column temperature 40°C; UV detection at 280 nm.
Figure 13 .5 Reverse-phase HPLC chromatogram ofsequentially extracted SFE fractions 229
of C. miniata root.
Conditions: Bondclone-10 C 18 reverse phase column; gradient elution
(methanol/water); column temperature 40°C; UV detection at 280 run.
x.xiii

Figure 13.6 Reverse-phase HPLC chromatogram of total 400 atm SFE extracts ofC. 230
minata root showing the variation of chemical composition with seasonal
changes. (A) second batch of plant material obtained during spring
(B) first batch of plant material obtained during autumn
Conditions: Bondc1one-10 C 18 reverse phase column; gradient elution
(methanoVwater); column temperature 40°C; UV detection at 280 nm.
Figure 13 .7 Reverse-phase HPLC chromatogram of total SFE extract ofG. occidentalis 232
wood obtained at 400 atm and 80°C.
Conditions: Bondc1one-10 C 18 reverse phase column; gradient elution
(methanoVwater); column temperature 40°C; UV detection at 254 nm.
Figure 13 .8 Reverse-phase HPLC chromatogram ofsequentially extracted SFE fractions 233
of G. occidentalis root.
Conditions: Bondc1one-l0 C 18 reverse phase column; gradient elution
(methanoVwater); column temperature 40°C; UV detection at 254 nm.
Figure 13 .9 Reverse-phase HPLC chromatogram of total 400 atm SFE extracts ofG. 234
occidentalis wood showing the variation of chemical composition with
seasonal changes.
(A) second batch of plant material obtained during spring
(B) first batch of plant material obtained during autumn
Conditions: Bondc1one-10 C 18 reverse phase column; gradient elution
(methanol/water); column temperature 40°C; UV detection at 254 nm.
Figure 13.10 Electropherogram of total 400 atm extract of E. capensis wood obtained 237
with 20 mM Na2B4.07.10H20 and (A) 30 mM SDS and (B) 60 mM SDS,
pressure injection for 1 sec, UV detection at 280 nm.
Figure 13 .11 Variation of migration time as a function of sodium cholate concentration. 238
(.A. oleanonic acid, . scopoletin, . 3-epioleanolic acid)
Figure 13.12 Structure of Bile salts 239
xxiv

Figure 13.13 Variation of migration time of the Ekebergia components as a function of 241
buffer pH. Run buffer: 20 mM Na2B4.07.10H20 with 120 mM sodium
cholate. (A. oleanonic acid,. scopoletin,. 3-epioleanolic acid)
Figure 13 .14 Electropherogram of total 400 atm extract of E. capensis wood obtained 242
at pH 9.70.
Figure 13 .15 Variation of migration time of Ekebergia components as a function of 245
applied voltage.
Figure 13 .16 Electropherogram of total 400 atm extract of E. capensis wood obtained 246
under optimised pH conditions
Conditions: 20 mM Na2B4.07.10H20 with 120 mM sodium cholate at pH
9.70, pressure injection for 1 sec, UV detection at 280 nm.
Figure 13.17 Electropherograms of sequentially extracted fractions of E. capensis wood 247
obtained under optimised pH conditions
Conditions: 20 mM Na2B4.07.10H20 with 120 mM sodium cholate at pH
9.70, pressure injection for 1 sec, UV detection at 280 nm.
Figure 13 .18 Electropherograms of sequentiallyextracted fractions of C. miniata root. 249
Conditions: 30 mM Na2HP04, 30 mM NaH2P04, 120 mM sodium
cholate, pH 6.95, applied voltage of20 kV, presure injcetion for 1 sec, UV
detection at 280 nm.
Figure 13 .19 Electropherograms of (A) SFE and (B) aqueous extracts of C. miniata root 250
showing the presence of 5-hydroxymethyl-2- furancarboxaldehyde in both
extracts.
Conditions: 30 mM Na2HP04, 30 mM NaH2P04, 120 mM sodium
cholate, pH 6.95, applied voltage of20 kV, presure injcetion for 1 sec, UV
detection at 280 nm.
Figure 13.20 Variation of migration time as a function of pH for the components of G. 251
occidentalis obtained at 400 atm. (_ oleanonic acid, • coniferaldehyde,
A. 2,2',6,6'-tetramethoxy-4'-al-4-(co-oxo-E-propenyl)-biphenyl)
xxv

Figure 13 .21 Electropherogram of total 400 atm extract of G. occidentalis wood 252
obtained under optimised conditions
Conditions: 20 mM Na2B4.07.10H20 with 100 mM sodium cholate at pH
9.80, pressure injection for 1 sec, UV detection at 254 nm.
Figure 13 .22 Electropherograms of sequentially extracted fractions of G. occidentalis 254
wood.
Conditions: 30 mM Na2HP04, 30 mM NaH2P04, 120 mM sodium
cholate, pH 6.95, applied voltage of20 kV, presure injcetion for 1 sec, UV
detection at 280 nm.
Figure 13.23 Packed capillary SFC of 5 mglml naphthalene standard
Conditions: 300 atm, 50°C, 30 cm x 100 ~m i.d. column
packed with ODS2, UV detection at 254 nm
Figure 13 .24 Possible interaction of chlorosilanes and carbonyl compounds
with residual silanols. (42)
Figure 13 .25 Formation of "bifurcated" hydrogen bond.
List of Tables Table 1.1 Selected examples of important bioactive substances from natural sources.
Table 2.1 Comparison of physical properties of gases, liquids and supercritical fluids.
Table 2.2 Critical conditions of common SFE solvents.
Table 2.3 Examples of commonly-used modifiers in SFE applications.
Table 4.1 Commonly used buffers in CE
Table 5.1 Gradient elution programme employed to separate the plant components.
Table 6.1 Data used to obtain mo for Ekebergia capensis Sparrm.
Table 6.2 Data used to obtain kinetic plot for the extraction of Ekebergia capensis
Sparrm.
Table 6.3 Data used to obtain mo for Grewia occidentalis L.
Table 6.4 Data used to obtain kinetic plot for the extraction of Grewia occidentalis L.
Table 6.5 Data used to obtain mo for Clivia miniata L.
Table 6.6 Data used to obtain kinetic plot for the extraction of Clivia miniata L.
xxvi
256
257
257
" .)
6
11
18
66
95
117
117
119
119
121
122

List of Schemes Scheme 9.1 Oxidation of side chain.
Scheme 9.2 Furan ring formation .
Scheme 9.3 Biosynthesis of scopoletin.
ACh
ADP
a.
atm
ATP
ATPase
bs
CE
CGE
ClEF
CITP
CMC
COSY
CZE
8
d
dd
List of Abbreviations and Units
acetylcholine
adenosine diphosphate
alpha
atmospheres
adenosine triphosphate
adenosine triphosphatase
beta
broad singlet
capillary electrophoresis
capillary gel electrophoresis
capillary isoelectric focusing
capillary isotachophoresis
critical micelle concentration
carbon dioxide
correlated spectroscopy
capillary zone electrophoresis
chemical shift
doublet
double doublet
xxvii
166
167
185

DEPT
DMSO
EOF
FID
FTIR
FTNMR
GC
GC-MS
HEPES
HETCOR
HPLC
Hz
i.d.
KBr
LCIMS
m
:MECC
:MES
MLC
MLCK
MPa
MS
mlz
NOE
o.d.
ODS
distortionless enhancement by polarization transfer
dimethyl sulphoxide
electroosmotic flow
flame ionization detector
fourier transform infrared
fourier transform nuclear magnetic resonance
gas chromatography
gas chromatography-mass spectrometry
N-2-hydroxyethylpiperazine-N'-2-ethanesulphonic acid
heteronucJear chemical shift correlation
high performance liquid chromatography
Hertz
internal diameter
potassium bromide
liquid chromatography/mass spectrometry
multiplet
micellar electrokinetic capillary chromatography
2-(N-morpholino )ethane sulphonic acid
myosin light chain
myosin light chain kinase
megapascal
mass spectrometry
mass to charge ratio
nuclear overhauser effect
outer diameter
Octadecylsilyl
xxviii

Pc
%
PAHs
PCBs
PEEK
PIPES
PIFE
S
SC-C02
SDS
SF
SFC
SFE
SFF
ILC
Tricine
Iris
DV
VIZ.
°C
cm
cm-!
kV
mm
mg
critical pressure
percent
polyaromatic hydrocarbons
polychlorinated biphenyls
polyetheretherketone
piperazine-N,N'-bis(2-ethane )sulphonic acid
po lytetrafl uo roethyl ene
singlet
supercritical carbon dioxide
sodium dodecyl sulphate
supercriticaI fluid
supercritical fluid chromatography
supercritical fluid extraction
supercriticaI fluid fractionation
critical temperature
thin layer chromatography
N -[ tris(hydroxymethyl)-methyl]gIycine
tris(hydroxymethyl-aminomethane)
ultraviolet
namely
degree celcius
centimeter
wavenumber
kilovolt
minute
milligram
xxix

ml millilitre
mllmin millilitre per minute
ng nanogram
~g nucrogram
~l microlitre
~lm micrometer
xx:"

CHAPTER 1
Introduction and Aims
Despite the dramatic advances made in orthodox medicine over the past 100 years, there
has been an increasing interest in complimentary systems (1). About 80 % of the world's
population relies on traditional medicines, and governments of Third-World countries,
unable to sustain a complete coverage of modern drugs, have encouraged the rational
development of traditional treatments. Furthennore, the services and advice of indigenous
practitioners are valued because they are offered in tenns that patients can understarid and
in the context of cultural values and practices that are shared by both patients and healers
alike.
The plant kingdom constitutes an abundant source of new chemical products which may
be important due to their biological properties and in particular because of their potential
use in medicine (2). Many plants produce secondary metabolites which have extensive
drug effects. Table 1.1 outlines a few examples of important constituents produced by
plants. This outline also shows some of the important constituents besides drugs, such as
the essential oils which are used for foods etc.
Traditional medicine used during pregnancy currently still plays an integral part in the lives
of most black South African women. This applies particularly to the rural areas where
modern health care facilities are often lacking. Fertility is a dominant theme as it ensures
the preservation and propagation of the tribe. Children are regarded as an insurance
against loneliness and poverty in old age and, as a result, a sterile woman is treated with
contempt and pity (4, 5). Pregnancy is an event of great importance and many traditions
and taboos are upheld to ensure a successful confinement and the birth of a healthy child.
Traditional medicine recognises the value of antenatal medication and, as a result, the
ingestion of plant extracts during pregnancy is common and as many as fifty seven

different plants are used (6). Different concoctions known as 'isishilambezo' are
consumed by women as antenatal remedies or, more specifically, to induce or augment
labour. Many of these plants have not been investigated scientifically and one needs to
substantiate claims of quality, safety and efficacy. Hence, investigation of components
contained in these medicinal preparations is important as the utilization of the whole plant
or other crude preparations for therapeutic purposes can have several drawbacks. These
include:
1. Variation in the concentration of the active constituents with topography, season,
as well as with climatic and ecological conditions.
2. Co-occurrence of undesirable compounds causing antagonistic, synergistic, or
other undesirable, and possibly unpredictable, modulations of the bioactivity.
3. Losses of bioactivity due to variability in collection, storage, and preparation of
the raw material.
Furthermore, it is believed that the consumption of these concoctions can result in foetal
meconium staining at delivery. Meconium is a heterogenous substance found in foetal
intestine and contains a number of pigments. Passage of meconium into the amniotic fluid
followed by aspiration into the foetus can result in foetal distress. A study undertaken by
Mitri et al. (7) has revealed a high incidence of foetal meconium passage in babies whose
mothers had a history of consuming isishilambezo mixtures. Hence identification and
isolation of these biologically active compounds is necessary since pure compounds can be
administered in reproducible, accurate doses, with obvious benefits from an experimental
or therapeutic point of view. Secondly, it permits the structural determination ofbioactive
compounds that may enable the production of synthetic material, incorporation of
structural modifications, and a rationalization of mechanisms of action. This, in turn, will
enable investigations of structure/activity relationships, facilitating the developments of
new compounds with similar or more desirable bioactivities. Hence this study is aimed at
making an important contribution to the welfare of black South Africans.
2

Tablel.1 Selected examples of important bioactive substances
from natural sources (3).
Biochemical class Botanical source Biological activity
1. Glycoside
* Anthraquinones Rhamnus purshiana Cathartic
Barbaloin Aloe barbadensis Cathartic
2. Steroids
Diosgenin Dioscorea spp. **Oralcontraceptives, corticosteroids
Digitoxin Digitalis spp. Cardenolides
3. Alkaloids
Atropine Atropa belladonna Parasympatholytics
Colchicine Colchicum autumnale Antigout
Vincristine Catharanthus roseus Anticancer
Morphine Papaver somniferum Analgesic
Quinine Cinchona spp. Antimalarial
Reserpine Rauwolfia serpentina Hypotensive
Artemisinine Artemisia annua Antimalarial
4. Limonoid
Azadirachtin Azadirachta indica Antifeedant pesticide
* ActIve as the glycosIde
** After chemical modification
This project is a multidisciplinary approach to the analysis of medicinal plants consumed
during pregnancy in an attempt to validate the physiological properties these plants are
said to manifest as well as document any toxic effects. The preparation of plant extracts
for scientific analysis is currently usually still performed by classical liquid solvent
extractions in a Soxhlet apparatus. Unfortunately, liquid solvent extractions often require
several hours or even days to perform, result in dilute extracts (which must be
concentrated for trace analysis), and may not result in quantitative recovery of target
3

analytes. Furthermore, concerns regarding the hazardous nature of many commonly used
solvents together with the cost and environmental dangers of waste solvent disposal has
given support to the development of alternative sample extraction methods. The
limitations of conventional methods have fueled interest in the development of
supercritical fluid extraction (SFE) as an alternative to extractions using liquid solvents.
The aims and objectives of this work were to investigate the possibility of using
supercritical carbon dioxide to extract the uterotonic components from three selected
plants and to isolate and elucidate the structures of the biologically active compounds by
various chromatographic and spectroscopic techniques. An attempt was also made to
couple SFE directly on-line to a bioassay using guinea pig uterine smooth muscle in vitro
so that on line screening of crude plant extracts could be performed within short periods
of time. Further, a pharmacological evaluation of the isolated compounds was
undertaken. The thesis ends with an overview of this investigation and the main
conclusions which have been drawn from this study.
References
1. W.e. Evans, Trease & Evan 's Pharmacognosy, 13th Ed., AIden Press,
Oxford, UK (1989), p.617.
2. G.B . Marini-Bettolo, M. Nicoletti, M. Patarnia, e. Galeffi and 1. Messana,
J. Chromatogr., 213 (1981) 113.
3. A. Der Marderosian and L.E. Liberti, Natural products medicine, G. F.
Stickley Co., Philadelphia, USA (1988), p.17.
4. M. Brindley, S. A. Journal of Ethnology, 8 (1985), 98 .
5. M.V. Gumedi, SAMJ, 53 (1978), 823.
6. D.1.H. Veale, K.I. Furman and D.W. Oliver, J. Ethnopharm., 36 (1992) 185.
7. F. Mitri, G.1. Hofmeyer and e.1. Van Gelderen, SAMJ, 71 (1987), 431. .
4

CHAPTER 2
Theory of Supercritical Fluid Extraction (SFE)
The solubility of solids in supercritical fluids was first discovered by Hannay and Hogarth
in 1879 (1). Since then, the application of supercritical fluid extraction as an alternative to
distillation and conventional solvent extraction has been considered by a number of
industries including the food, polymer, petroleum and pharmaceutical industries (2-5) .
This technique offers the analyst an alternative for preparing samples prior to analysis that
is rapid and environmentally less hazardous. This chapter describes the basic principles
involved in applying the technique to sample preparation.
2.1 Definition ofa supercriticaI fluid
In order to define a supercritical fluid (SF), one needs to consider the phase diagram
illustrated in Figure 2.1.
Pc
Pressure Solid
liquid
Gas Gitical point
Tc Temperature
Figure 2.1 Pressure/temperature phase diagram of a substance.
5

If a liquid and a gas are in equilibrium and one moves along the gas-liquid coexistence
curve towards the critical point, by increasing both the temperature and presure, the liquid
becomes less dense because of thermal expansion and the gas becomes more dense as the
pressure increases. At the critical point, the densities of the two phases become identical
and the distinction between the gas and liquid disappears. The substance becomes a
supercritical fluid and is characterized by a critical temperature and pressure (T~ and Pc).
The region of interest for SFE is the area above the critical point where densities,
solubilities, viscosities and diffusivities are intermediate between those of typical gases and
liquids.
2.2 Physical properties of supercritical fluids
Supercritical fluids offer a convenient means to achieve solvating properties which have
gas and liquid-like characteristics without actually changing chemical structure. By
selective control of pressure and temperature one can access a significant range of
physicochemical properties (density, diffusivity, dielectric constant, etc.) without ever
passing through a phase boundary, e.g. changing from gas to liquid form. A supercritical
fluid can therefore be considered a continuously adjustible solvent. Table 2.1 illustrates
how supercritical fluids compare to gases and liquids in terms of the important
physicochemical properties of each.
Table 2.1 Comparison of physical properties of gases, liquids and supercritical
fluids (6).
Density (g/cm3)
Diffusion rates (cm2/s)
Viscosity (g/cm.s)
a at 25 DC and 1 atm
b at Te and Pc to 4xPe
Gasa
0.6 - 2 x 10⁻³
0.1 - 0.4
1 - 3 X 10⁻⁴
6
Liquid3 SFb
0.6 - 1.6 0.2 - 0.9
0.2 - 2 x 10⁻⁵ 0.1 - 4 x 10⁻³
0.2 - 3 x 10⁻² 1 - 9 X 10⁻⁴

These favourable physical properties of SFs are advantageous for extraction applications.
2.3 Advantages of SFE
SFE has several potential advantages over classical liquid extraction methods.
Speed: Mass transfer is faster in a supercritical fluid than in liquid solvents because
supercritical fluids have lower viscosities and higher solute diffusivities. The low
viscosities provide favourable flow properties. This permits supercritical fluids to
penetrate matrices with low permeability more readily than conventional solvents. The
higher solute diffusivity is a significant property as rates of extraction are ultimately
limited by the speed with which analyte molecules are transported by diffusion from the
sample matrix into the bulk fluid. Hence SFE can usually be completed within a short
period of time, compared to several hours for liquid solvent extractions.
Variable solvent strength: The solvent strength of a supercritical fluid is a function of its
density (7), which, in turn, is a function of temperature and pressure. The relationship
between pressure, temperature and density may be described by an equation of state, a
number of which have been developed by various workers (8, 9, 10). The general trend is
for higher pressures (at a given temperature) to increase density and solvating power,
while increasing temperature at a constant pressure will result in a reduction in density
and hence solvent strength. These parameters (density, pressure, temperature) are,
therefore, of prime importance in controlling the extraction process. This allows SFE
parameters to be optimized for a target analyte, and provides a method to achieve class
selective extractions from a single sample by simply extracting the sample at two
different pressures with the same supercritical fluid.
Reduction of liquid solvent usage: The large volumes of liquid solvents used for
conventional extractions have caused recent concern because of their potential toxic
nature and rapidly increasing disposal costs. Since most commonly-used supercritical
7

fluids such as CO2
are gases at ambient conditions and SFE effluents are typically
collected in small volumes of liquid solvents (or no liquid solvent for on-line SFE
methods), the need for liquid solvents is dramatically reduced. In a similar manner, the
need to concentrate extracts prior to analysis of trace analytes is also greatly reduced.
Simplified on-line coupling with chromatographic techniques: The gaseous nature (at
ambient conditions) of most supercritical fluids also facilitates the direct coupling of SFE
with GC and SFC.
Analyte crystallization: Solid compounds may be crystallized from supercritical fluids
and the size of the crystals manipulated by changing process pressures and temperatures.
The ability to make small crystals is of interest to the pharmacuetical industry, where
product morphology can be critical to drug uptake rates, and where mechanical
fragmentation procedures may be unacceptable, owing to thermal instability or
contamination risks (11).
2.4 Selection of a supercritical fluid
The critical pressure and temperature are two important parameters that need
consideration when selecting a supercritical fluid. The analyst should strive to select a
fluid that exhibits the best compromise in solubilizing the solutes of interest as well as
mass transfer characteristics required to rapidly effect the extraction of the analytes.
Qualitatively, the solvent strength of an eluent may be described by the solubility
parameter introduced by Hildebrand and Scott (12). They stated that the solubility
parameters of the solvent and the solute should be similar to achieve dissolution of the
solute. This condition can be approximated if the solubility parameter of the analyte is
known and if certain correlations are used, such as one proposed by Giddings et al. (13):
P (2.1)
P(liq)
8

where 8so1 is the Hildebrand solubility parameter, Pc is the critical pressure of the fluid, pis
the density of the supercritical fluid, and P(liq) is the density of the fluid in its liquid state.
Optimization of pressure and temperature will assure a high flux rate of the analyte into
the extracting medium, thereby saving consumption of fluid, while assuring rapid sample
processing. Figure 2.2 shows the dependence of the Hildebrand solubility parameter on
temperature and pressure for supercritical C02.
S 5.0
4.0
to 3.0
· • • • • • 2.0 • • • • · • · • • • • • • • 1.0 •
0.7
• • • • :-Tc · · · · ·
P~ure(atm)
730
145
100
80
· 0.5 :-~_-::-__ --:-:~ __ ---.JL-__ ---1 ___ ~ __ -.J 20 180 220
Temperature eC)
Figure 2.2 Effect of temperature and pressure on the Hildebrand solubility parameter
for supercritical C02. (14)
9

The critical pressure, to a first approximation, determines the magnitude of the fluid's
solvent power in the condensed state and can therefore be used as a crude guide to match
the fluid with the anticipated polarity of the compounds to be extracted. For example,
ethane has a lower critical pressure than carbon dioxide as shown in Table 2.2. Based on
this criterion, ethane would not dissolve a moderately polar solute to the same extent as
carbon dioxide. Likewise, fluids which exhibits higher critical pressures than carbon
dioxide, are known to solubilise polar compounds at higher concentrations in the fluid
phase than supercritical CO2•
The critical temperature of the fluid is also important when one considers the effect of
extraction temperature on the thermal stability of target analytes. Fluids which are
characterized by high critical temperatures require elevated extraction temperatures in
order to effect extraction in the supercritical state.
10

Table 2.2 Critical conditions ofSFE solvents. (15)
Compound Critical Critical Critical Acentric Dipole
temperature pressure density factor moment
(OC) (atm) (glcm3) (0)) (D)
Ethylene 9.9 50.5 0.23 - -
Chlorotrifluoromethane 28.8 38.2 0.58 0.198 0.5
Carbon dioxide 31.0 72.9 0.47 0.239 0.0
Ethane 32.2 48.2 0.20 0.099 0.0
Tetrafluoroethylene 33.3 38.9 0.58 - -Nitrous oxide 36.5 71.7 0.46 0.165 0.2
Methyl fluoride 44.6 58.0 0.31 - -Sulfur hexafluoride 45.6 37.1 0.75 0.286 0.0
Chlorodifluoromethane 96.4 48.5 0.52 0.221 1.4
Propane 96.7 42.0 0.22 0.153 0.0
Carbon disulfide 104.8 65.0 0.45 0.109 0.0
Dichlorodifluoromethane 111.7 39.4 0.56 - -Dimethyl ether 126.9 52.6 0.26 - -
Ammonia 132.3 111.3 0.24 0.250 1.5
Sulfur dioxide 157.5 77.7 0.53 - -
Nitrogen dioxide 157.8 100.0 0.56 - -Methyl ethyl ether 164.7 43.4 0.27 - -Diethyl ether 193.6 36.3 0.27 . - -n-Pentane 196.6 33.3 0.23 0.251 0.0
Isopropanol 235 .3 47.0 0.27 0.665 1.7
Acetone 235.9 47.0 0.28 0.304 2.9
Methanol 240.3 78.9 0.27 0.556 1.7
Ethanol 243.4 63.0 0.28 0.644 1.7
Chloroform 263.4 54.0 0.58 0.218 1.1
n-Heptane 267.0 27.0 0.24 0.349 0.0
Water 374.0 218.0 0.32 0.344 1.8
11

2.5 Unique properties of SF-C02
Supercritical carbon dioxide has been the fluid of choice in many SFE studies. This fluid
has the added advantage over other supercritical solvents because it is non-toxic, non
flammable, environmentally acceptable, inexpensive, and leaves no solvent residue. In
addition, the critical temperature is low (31°C), thus extractions can be performed at
moderate temperatures hence preventing the degradation of thermally labile compounds.
Modest compression of CO2 produces a substantial change in its fluid density due to the
high non-ideality exhibited by this fluid as seen from the pressure-density isotherm (Figure
2.3). Even though supercritical CO2 preferentially extracts non-polar compounds, it can
exhibit an induced dipole moment, which enhances the extraction of moderately polar
solutes into the fluid phase (16).
7~Q
~QO
l7
0.25
GAS·LIOUIO . EOUILIBRIUM
REGION
\ .:0
\
·60
\ \ \ ·90 I
1.25
Figure 2.3 Effect of pressure changes on density of supercriticaI CO2 at different
temperatures. (17)
12

2.6 Generalized method and instrumentation requirements for SFE
The essential equipment needed to perform SFE is shown in Figure 2.4. A high pressure
pump is used to provide pressurized fluid (at a constant pressure) to the sample which is
contained in the extraction vessel or sample cell. The extraction vessel is housed in an
oven to maintain the temperature above the critical temperature of the extraction fluid .
The extraction fluid is pumped through the extraction vessel, the analytes are partitioned
into the supercritical fluid, and the analytes are collected after depressurization of the
supercritical fluid. The depressurization step and the flow control is achieved by using a
back pressure regulator or a length of fused silica tubing (typically 10 to 50 J.lm i.d.).
Extracted analytes are most often collected in a small volume of liquid solvent (off-line
SFE) or the analytes transferred directly to a chromatographic system (on-line SFE) like
SFC or GC. Alternate methods such as cryogenic trapping (18, 19) or collection onto a
sorbent cartridge have also been used (20).
The pump is usually a syringe or reciprocating type and requIres an external cooling
source to assure liquefaction of the fluid. If necessary, the modifier component can be
added by methods discussed in section 2.8.1.
13

oven
control valves
~ linear restrictor
.-----{~/
~ collection vessel
with suitable solvent
I....------if- extraction vessel
Figure 2.4 Schematic diagram of an SFE setup for off-line recovery of analytes.
Extraction cells have been fabricated out of a variety of materials appropriately suited to
pressures to be used, but most cells consist of a tubular metal cavity with associated
compression fittings. In the past, many investigators have utilised tube fittings or HPLC
columns as extraction cells (21), but recently, commercially available extraction cells with
finger-tight fittings have become available. Figure 2.5 shows typical vessels currently
employed in SFE.
14

0.5 ml Vessel Extraction Cartridge
f~1 :Q(OCD ~/ II~~\ ·
Internal Washer Seal External
Snap Ring Snap Ring
1 ml to 12 ml Vessels Frit and Seal Unit
I
(l~O~m® I I
Extender Extraction Retaining Cartridge Sleeve
50 ml Vessel Frit SS Plate
~~~~=====fj=~ I
Distributor
Figure 2.5 Typical extraction cells used in analytical SFE.
15

2.7 Selection of SFE conditions
As stated earlier, the density, pressure and temperature are of prime importance in
controlling the extraction process and, although some relationships between them and
solubility have been developed (22), it is generally not possible to predict ideal extraction
conditions on a purely physicochemical basis. However, it is often possible to predict the
overall feasibility of an extraction or initial extraction condition. In SFE, the solvent
strength of a given fluid is primarily dependent upon its density. However it is much
easier to measure directly and control the pressure (and temperature) than to measure
directly and control the fluid density. It is possible, however, at a specific temperature, to
relate fluid pressure to density, thus allowing measurement and control of the density by
measuring and controlling the pressure. For low density gases, this is easily done with the
ideal gas law, PVIRT = 1. (The molar volume, V, is the reciprocal of the molar density.
Knowledge of the gas' s molar mass, M, makes conversion from molar density to mass
density trivial: mass density, p, is MIV). At high densities, which are frequently
encountered in SFE, the ideal gas law is no longer valid. The work by Pitzer (23, 24),
however, allows the ideal gas law to be extended by adding another term, called the
compressibility factor, which is a function of the pressure, temperature, and molecular
identity of the fluid. With this extension, the gas law becomes PVIRT = z, where z is the
compressibility factor. Pitzer was able to reduce the molecular identity terms of z to a
single number, called the acentric factor, 0). This factor attempts to account for both the
molecular size and shape. The value of the acentric factor (refer to Table 2.2) was taken
to be the ratio of the vapour pressure of the substance at 70% of its critical temperature to
that at its critical temperature. Thus, at a given temperature, pressure, and known acentric
factor, z can be determined (25). This allows V to be determined from the gas law (V =
zRTIP) and thus the mass density to be determined if the molar mass of the fluid is known.
The same principle described for pressure to density conversion of a single fluid can be
used for binary fluids as well. When two fluids are mixed, critical parameters can be
calculated based on the physical-chemical properties and the mole fraction of each fuid in
the mixture (26).
16

2.8 Use of modifiers in SFE
Difficulties are experienced when fairly polar analytes need to be quantitatively extracted,
as these analytes display a reduced solubility in the supercritical CO2 phase. In these cases
a fluid with a higher solvent strength should be chosen, but the use of more polar fluids is
severely limited by practical considerations. Supercritical ammonia would be very
attractive from a solvent strength point of view, but it is difficult to pump as ammonia is
chemically reactive (dissolves pump seals) and is likely to be too dangerous for routine
use. Supercritical methanol is also an excellent solvent but is less attractive because of its
high critical temperature and because it is a liquid at ambient conditions, which
complicates sample concentrations after extractions. Despite its excellent characteristics
as an SFE fluid, the routine use of CHCIF2 is also not likely because of negative
environmental effects. Hence CO2 still remains the fluid of choice in many applications.
In the case of polar analytes, it becomes desirable to add a polar co-solvent to the
supercritical fluid to enhance the solubility of an analyte in the extracting medium. Such
co-solvents (also called modifiers or entrainers) are usually organic solvents that are added
to the source of compressed fluid . Table 2.3 lists examples of commonly-used modifiers
in SFE applications.
17

Table 2.3 Examples of commonly-used modifiers in SFE applications. (26)
Modifier Tc eC) Pc (atm) Molar mass Dielectric
g/mol constant at 20°C
Methanol 239.4 79.9 32.04 32.70
Ethanol 243.0 63.0 46.07 24.30
Propan-l-ol 263.5 51.0 60.10 20.33
Propan-2-01 235.1 47.0 60.10 19.30
Hexan-l-ol 336.8 40.0 102.18 13.30
2-Methoxyethanol 302.0 52.2 76.10 16.93
T etrahydrofuran 267.0 5l.2 72.11 7.58
1,4-dioxane 314.0 51.4 88.11 2.25
Acetonitrile 275.0 47.7 4l.05 37.50
Dichloromethane 237.0 60.0 84.93 8.93
Chloroform 263.2 54.2 119.38 4.81
Carbon disulphide 279.0 78 .0 76.13 2.64
Water 374.1 217.6 18.01 80.1
2.8.1. Methods of adding modifiers
There are a number of ways in which modifiers can be added to primary supercritical fluids
(27-30). Premixed cylinders can be purchased from commercial sources. These cylinders
have a discrete concentration level of a specific modifier in CO2 for example. The cylinder
is directly connected to the supply pump, which then delivers prernixed modified fluid to
the SFE vessel. One disadvantage of this technique is that, to obtain different percentages
of modifier, different cylinders with a range of concentrations of modifier are necessary.
Also, it has been experimentally observed that, as material is drawn from the cylinder, a
shift in the vapour-liquid equilibrium results, leading to a change in the concentration of
18

the modifier in the liquid phase (31). As the liquid phase is drawn, CO2, being the more
volatile component, vapourises disproportionately occupying the liberated volume. As a
result, the concentration of the modifier in the liquid phase increases. Such behaviour has
been found to give rise to reproducibility problems in extraction efficiency (32).
Modifiers can also be added to CO2 by using two separate supply pumps. One pump is
used primarily for CO2 delivery and the second pump is used for modifier delivery.
Downstream of both these pumps is a mixing tee where the modifier is equilibrated with
either liquid or supercritical CO2 in a thermostatted zone. A schematic diagram is shown
in Figure 2.6. The mixed fluid is then delivered to the extraction vessel.
,------ - ---- - ------------1 - I
I I
I I
I I
: Extraction I
I
I
cell I
I
: Therm ostatted I
I I
I I
I I zo ne
I I
I I
I I
I I
I -r- I
I I
I I
I I
I I
I I
I I
I I
I I
I I
I
Mixing tee I
I I
I I 1 ________________ _ __ _ ___ ~ I
Modifier
Figure 2.6 Schematic diagram of modifier delivery system for SFE.
19

Unlike the first method of introducing modifiers, in this case the compressibility of the
fluids must be taken into account otherwise pumping of the modifier into the CO2 pump
can occur.
The next and perhaps the most effective way (if matrix-analyte interactions are strong) of
delivering a modifier for SFE is by directly adding the modifier to the sample matrix prior
to extraction. In this respect, the highest concentration of modifier is delivered to the
matrix. Moreover, one can screen a number of modifiers and modifier concentrations in a
relatively rapid fashion without purging the entire system between experimental runs.
Ashraf-Khorassani and Taylor compared the extraction efficiency of PCBs from river
sediment using two different methods for incorporation of modifier into the SFE system
(33). They found that off-line addition of modifier to the SFE vessel prior to extraction
was more effective in promoting extraction efficiency of PCBs than using in-line modifier
addition. Also, direct spiking of the matrix required less modifier than the in-line approach
for achieving the same level of recovery.
Hawthome et al. developed a simple saturation chamber to provide modified supercritical
CO2 and used this device (Figure 2.7) for the extraction of linear alkylbenzenesulfonates
from soil, sediment and municipal wastewater treatment sludge (34). Reproducible and
quantitative recoveries (>90%) were achieved.
20

Pump
Figure 2 .7 Schematic diagram of device used to modify supercritical CO2 (34).
Arrows indicate direction of flow. Components: A = four port valve;
B = 'Parker" or 'Swagelok" brand 'tee" tubing fitting (1/16 x 1116 x 1/4 inch
stainless steel); C = 114 inch normal pipe thread x 114 inch tubing stub fitting
welded into D; D = modifier chamber; E = 1116 inch o.d. stainless steel
tubing; F = heating coil; G = extraction cell; H = heater; I = restrictor;
J = collection vial.
21

With any method of adding modifiers to the primary fluid, it must be remembere~ that
the addition of modifiers changes the critical point of the mixture from one recorded for
the pure fluid. The critical temperature of the mixed solution is higher than that of the
pure fluid, and therefore the extraction temperature should be raised to ensure that a
single phase supercritical fluid is present during SFE to avoid possible solute partitioning
between the two phases that might coexist. Hence it is important to recognise the
magnitude of this change so as to adjust the experimental parameters accordingly. The
solubility of the co-solvent in the supercritical fluid is also determined by the extraction
pressure, therefore the quantity of the cosolvent that can be added to the fluid phase must
be regulated. For example, Figure 2.8 shows the relationship between the critical
temperature, pressure and mole fraction of a CO2-methanol mixture. Clearly, if a
methanol mole fraction of 0.2 in CO2 was required for extraction, it would be necessary
to operate above 150 bar (15 MPa) and 80°C in order to maintain a homogenous
supercritical fluid (23). Water is also scarcely soluble in liquid carbon dioxide (around
0.1 % mlm at 20°C); its solubility increases in fluid CO2 with increasing temperature
(around 0.3% mlm at 50°C)
250
TeT(C) 200 PeT (bar)
~ .... .. , 150 ' .. .' . ca . ' . ...... ... .'. a..~ ..
".
f3' 100 . -... ... ~ 60
Or---~--~----~---T----~--~ ____ ~ __ ~ __ ~~ __ ~ 0.0 0.1 0.2 0.3 0.4 0.6 0.8 0.7 0.8 0.8 1.0
Methanol Mole Fraction
Figure 2.8 Relationship between the critical temperature, pressure and mole fraction of
CO2-methanol mixtures according to Saito and Nitta. (35)
22

Furthermore, depending upon the modifier identity, the nature of the analytes of interest,
as well as the type of sample matrix, there is a need to apply an equilibration period when
using modifiers in SFE. If the modifier has not reached a level of equilibration with the
supercritical fluid (i.e. existing as a one phase system) as well as the sample matrix, there
could be situations where the enhancement of the extraction efficiencies using modifiers
are not seen. In these cases, what happens is that the modifier is displaced out of the
extraction vessel into the collection vial without achieving an interactive extraction. In
most situations, when a modifier is required to enhance SFE efficiencies, a static
equilibration period is recommended.
2.9 Modes of SFE
Two common modes are used for SFE; dynamic and static. For dynamic SFE, the sample
is constantly swept with fresh supercritical fluid at a flow rate determined by the extraction
pressure and the dimensions of the outlet restrictor. Dynamic SFE continually provides
new fluid to the sample, and is more effective when the supercritical fluid is likely to
become saturated with the target analytes.
For static SFE, the extraction vessel is pressurised with the fluid and the sample is
extracted with no outflow of the supercritical fluid. After the extraction is thought · to be
completed, a valve is opened at the outlet of the cell to allow the analytes to be swept
from the cell into the collection vial. Typically, a static extraction is followed by several
minutes of dynamic extraction to recover the analytes. Static extraction has the
advantages that less fluid is used and that liquid polarity modifiers can be used by simply
adding them to the cell prior to pressurisation. However, in a static mode, extraction
times may be longer because the movement of components must rely on diffusion as
opposed to the mass action of the carrier in dynamic systems.
23

t "0 Q)
o IQ ... x
LU . ~
2.10 Kinetics of SFE
It is important to understand the kinetics of SFE. Extraction by a supercritical fluid is
never complete in finite time. It is relatively rapid initially, but then there follows a long
tail in the curve of percent extracted versus time as illustrated in Figure 2.9. In a typical
situation, 50% is extracted in ten minutes, but it may be a hundred minutes before
approximately 99% is extracted. It is not correct, therefore, to assume that extraction is
essentially complete if it has been carried out for two consecutive equal periods of time
and the second period produces only a fraction of the compound extracted in the first
period.
Maximum % Extracted
EqulibriumControlled
Phase
Transition Phase
DiHusion-Controled Phase
Volume of Fluid Time of Extraction
Figure 2.9 Generalised extraction curve of percent solute extracted as a function of
volume of extraction fluid or time of extraction.
24

As shown in the above figure, the initial portion of the extraction curve is linear, indicating
that quasi-equilibrium conditions are governing the partition of the solute into the mobile
dense fluid phase. After a finite time, the yield curve starts to become convex with respect
to the time axis as the extraction experiences a transition from equilibrium to diffusion
controlled kinetics. In the final stage of the extraction, the kinetics are dominated by
diffusive mechanisms which may be quite complex, depending on the morphology of the
substrate being extracted. For the case of the solid substrate, factors such as the degree of
swelling of the substrate can have a profound effect on the yield curve.
Three interrelated factors influence recovery as shown in the SFE triangle below.
Solubility
Diffusion Matrix
For extraction to be successful, the analytes must firstly be sufficiently soluble in
supercritical fluid. This factor is especially important at the beginning of extraction, . when
extraction is occuring at a higher rate.
Secondly, the solute must be transported sufficiently by 'diffusion' from the interior of the
matrix in which it is contained. The 'diffusion' process may be normal diffusion of the
25

solute, or it may involve diffusion of the fluid into the matrix and perhaps subsequent
replacement of solute by solvent molecules on surface sites.
The third factor is that of the matrix. Even though a particular compound may be soluble
in a supercritical fluid, not all of it may be necessarily extracted from the matrix due to
adsorption effects.
2.11 Physical matrix effects
The physical morphology of the substrate undergoing SFE can have a pronounced
influence on the efficiency of the extraction and the rate at which it is conducted. In
general, the smaller the particle size of the substrate, the more rapid and complete the
extraction will be. This effect is largely due to the shorter internal diffusional path lengths
over which the extracted solutes must travel to reach the bulk fluid phase. Synder et al.
have carried out studies and shown that the geometric size of the matrix particles can
influence the speed and completeness with which SFE can be conducted (36). As in solid
liquid extraction, an increase in the matrix's porosity will generally promote a more
efficient and rapid SFE.
2.12 Impact of matrix on extraction kinetics
The rate of removal of a solute from a matrix using SFE is a function of its solubility in the
fluid media and the rate of mass transport of the solute out of the sample matrix. Rate
liiniting kinetics can adversely impact on the rapid extraction of an analyte despite
favourable solubility charactersitics in the supercritical fluid medium. As shown in Figure
2.10, there are four major mass transport mechanisms to consider:
1. analyte diffusion through the internal volume of the sample,
2. surface desorption of the analyte,
3. diffusion of the analyte through a surface boundary layer, and
4. transport in the bulk supercritical fluid phase.
26

SF flow
•
3 4 ... -~ .
Figure 2.10 Mass transport steps for the SFE of an analyte from a porous matrix partcle.
If the rate detennining step is intraparticle diffusion, then the rate of extraction will be a
function of the particle size of the sample matrix. It should be recognised however, that
some sample matrices when exposed to supercritical fluids swell, thereby facilitating the
mass transport of the analyte from within a sample matrix (37). An excellent example of
this principle is the observation that polymeric films are plasticized by supercritical gases
(38). This undoubtably contributes to the success in applying SFE for the analysis of
additives in plastics (39).
Surface desorption of an analyte by a supercritical fluid (step 2) is an important step in
SFE for many sample types. For certain analyte-matrix combinations, the solvating
power of the supercritical fluid alone will not suffice to assure a complete or rapid
extraction. The use of a modifier will frequently accelerate the desorption of an analyte
from the surface of the sample matrix. Wheeler and McNally have shown that the
extraction efficiencies of herbicides from soil can be increased by direct addition of
micro litre quantities of ethanol or methanol to the sample before commencement of
extraction (40).
27
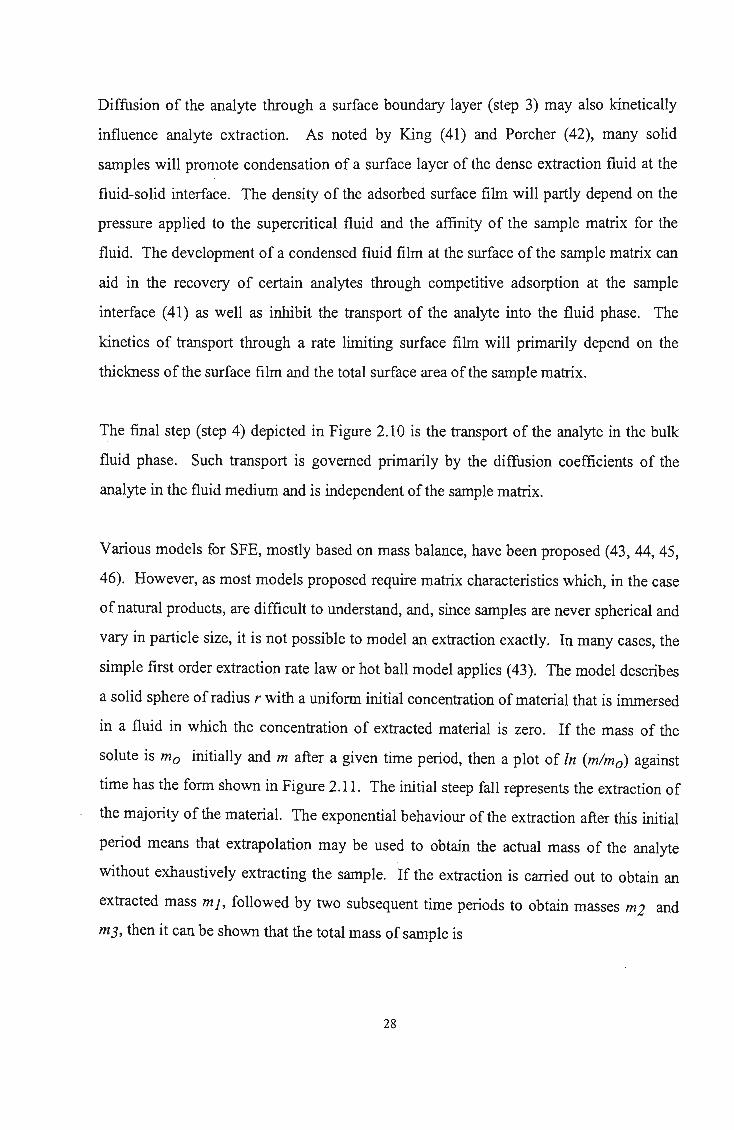
Diffusion of the analyte through a surface boundary layer (step 3) may also kinetic ally
influence analyte extraction. As noted by King (41) and Porcher (42), many solid
samples will promote condensation of a surface layer of the dense extraction fluid at the
fluid-solid interface. The density of the adsorbed surface film will partly depend on the
pressure applied to the supercritical fluid and the affinity of the sample matrix for the
fluid. The development of a condensed fluid film at the surface of the sample matrix can
aid in the recovery of certain analytes through competitive adsorption at the sample
interface (41) as well as inhibit the transport of the analyte into the fluid phase. The
kinetics of transport through a rate limiting surface film will primarily depend on the
thickness of the surface film and the total surface area of the sample matrix.
The final step (step 4) depicted in Figure 2.10 is the transport of the analyte in the bulk
fluid phase. Such transport is governed primarily by the diffusion coefficients of the
analyte in the fluid medium and is independent of the sample matrix.
Various models for SFE, mostly based on mass balance, have been proposed (43, 44, 45,
46). However, as most models proposed require matrix characteristics which, in the case
of natural products, are difficult to understand, and, since samples are never spherical and
vary in particle size, it is not possible to model an extraction exactly. In many cases, the
simple first order extraction rate law or hot ball model applies (43). The model describes
a solid sphere of radius r with a uniform initial concentration of material that is immersed
in a fluid in which the concentration of extracted material is zero. If the mass of the
solute is mo initially and m after a given time period, then a plot of In (mlmo) against
time has the form shown in Figure 2.11. The initial steep fall represents the extraction of
the majority of the material. The exponential behaviour of the extraction after this initial
period means that extrapolation may be used to obtain the actual mass of the analyte
without exhaustively extracting the sample. If the extraction is carried out to obtain an
extracted mass m 1, followed by two subsequent time periods to obtain masses m 2 and
m3, then it can be shown that the total mass of sample is
28

-o E -E -..s
, m2-
mo = m I + ------------- (2.2)
m2 - mj
o~--------------------------------------------------------_,
-7.Sl...----------::-..L-.---------___ -'-_________ ---1
o 17.9 20 40
Time I minutes
Figure 2.11 Plot ofln (mlmo) against extraction time for the supercritical fluid extraction
of camphor from rosemary.(47)
29
60

2.13 Class-selective SFE
The coextraction of unwanted solutes along with target analytes frequently occurs in
analytical SFE, whether conducted in the off-line or on-line mode. As discussed earlier,
one of the potential advantages of SFE over liquid solvent extraction is that the solvent
strength of a SF can be changed by simply changing its density. Thus, the potential to
achieve class-selective extractions exists by extracting the same sample at different
pressures with the same fluid. Although obtaining a pure analyte from complex matrices
using SFE is unlikely, sequential extractions of different compound classes have been
demonstrated. For example, alkanes can be extracted from urban air particulates with CO2
at 75 atm (45°C) whereas the polyaromatic hydrocarbons (PARs) remain unextracted
until the pressure is raised to 300 atm. By sequentially extracting the air particulates at
these two pressures, 85-90% selectivities can be achieved (48). Class selective SFE has
also been applied to the extraction of target analytes from a bulk matrix (e.g., fat) which is
itself soluble in supercritical CO2 under most conditions. Even though fat components are
highly soluble above pressures of ca. 120 atm, selective extracts of non-polar analytes
have been achieved by extracting the samples at lower pressures. King has used this
approach and achieved quantitative recovery of pesticides from fat samples, yet the
extracts were sufficiently fat-free to allow direct GC analysis (49). Selective extraction of
lactones from milk fat triglycerides has also been reported (50). A single extraction
concentrated the lactones by 20 to 50 times, while a two step extraction yielded a
concentration factor of ca. 500 times. Class selective extractions have also been achieved
by depositing the analytes onto a sorbent column, then eluting them with SFs in SFC
mode. Such approaches have been used to achieve rapid fractionation of alkanes, alkenes,
and aromatics from gasoline (51, 52) and fractionation of saturates, aromatics and
asphaItenes from crude oil (53). These favourable extraction properties of supercritical
fluids makes this technique appropriate for a wide variety of applications and there is no
doubt that SFE will continue to find use in the analyicallaboratory.
30

References
1. KA. Larson and M.L. King, Biotechnol. Prog., 2 (1986),73.
2. G.R. List, lP. Friedrich and 1 Pominski, J Am. Oil Chem. Soc., 61 (1984), 1847.
3. lR. Bradley, J Dairy Sci ., 72 (1989), 2834.
4. S.A. Liebman, E .l Levy, S. Lurcott, S. O'Neil, 1. Guthrie, T. Ryan and S.
Yochlovich, J Chromatogr. Sci., 27 (1989), 118.
5. D.F. Williams, Chem. Eng. Sci., 36 (1981),1769.
6. S.R Wallenborg, PhD thesis, Uppsala University (1997), p.3.
7. G.M. Schneider, Angew Chem. Int. Ed., 17 (1978), 716.
8. D.Y. Peng and D.B. Robinson, Infi: Eng. Chem. Fundam., 15 (1976), 59.
9. K.D. Bartle, A.A. Clifford and G.F. Shilstone, J Supercritical Fluids, 5 (1992),
220.
10. R. Dohrn, J Supercritical Fluids, 5 (1992), 81.
11. T.W. Randolph, Tibtech, 8 (1990), 78.
12. lH. Hildebrand and R.L. Scott, The Solubility of Nonelectrolytes, New York,
USA (1950), p.53.
13. lC. Giddings, M.N. Myers, L. Mclaren and R.A. Keller, SCience, 162 (1968),
67.
14. RA. Allada, Ind Eng. Chem. Process Des. Dev., 23 (1984), 344.
15. R.e. Reid, 1.M. Prausnitz and B.E. Poling, The Properties of Gases and Liquids,
4th Ed., McGraw-Hill, New York, USA (1987), p.122.
16. C.T. Lira, In: Supercritical Fluid Extraction and Chromatography, B.A.
Charpentier and M.R. Sevenants (Eds.), American Chemical Society, Washington
DC, USA (1988), p.1.
17. D. Leyendecker, In: SupercrWccil Fluid Chromatography, R.M. Smith (Ed.),The
Royal Society of Chemistry, London, UK (1988), p.53 .
18. J.M. Levy, R.M. Ravey, RK Houck and M. Ashraf-Khorassani, Fresenius J
Anal. Chem., 344 (1992),517.
19. Q.L. Xie, KE. Markides and M.L.Lee, J Chromatogr. Sci., 27 (1989), 365.
31

20. Rl Maxwell, AR Lightfield and AAM. Stolker,1. High Resol. Chromatogr.,
18 (1995), 231
21. T.P. Zhuze, G.N. Jushkevic and lE. Gekker, Maslo-Zhir. Promst., 24 (1958),34.
22. lW. King and lP. Friedrich, 1. Chromatogr., 517 (1990), 449.
23 . KS . Pitzer, 1. Am. Chem. Soc., 77 (1955), 3427.
24. KS. Pitzer, D.Z. Lippmann, RF. Curl Jr., e.M. Huggins and D. E. Petersen, 1.
Am. Chem. Soc., 77 (1955), 3433.
2S. 1.e. Fjeldsted, W.P. Jackson, P.A Peaden and M.L. Lee, 1. Chrom. Sci., 21
(1983), 222.
26. M.L. Lee and K.E. Markides (Eds.), Analytical Supercritical Fluid
Chromatography and Extraction, Chromatography Conferences, Inc., Prov~,
Utah, USA (1990), p.100.
27. T.A Berger, I F. Dye, M. Ashraf-Khorassani and L.T. Taylor,1. Chromatogr.
Sci., 27 (1989), 10S.
28 . D.R. Gere, R. Board and D. McManigilJ, Anal. Chem., 54 (1984), 736.
29. 1. M. Levy, A.e. Roselli, D.S. Boyer and K Cross, 1. High Resol. Chromatogr.,
13 (1990), 416.
30. lM. Levy, E. Storozynsky and M. Ashraf-Khorassani, Supercritical Fluid
Technology, ACS Symposium Series, 488 (1992), 338.
31. F.K. Schweighardt and P.M. Mathias, 1. Chromatogr. Sci., 31 (1993), 207.
32. 1. Via, L.T. Taylor and F.K Schweighardt, Anal. Chem., 61 (1994) 1459.
33. M. Ashraf-Khorassani and L.T. Taylor, 1nl. Lab., March 1986, 16.
34. S.B. Hawthome, DJ. Miller, D.D. Walker, D. E. Whittington and B.L. Moore,
1. Chromatogr., 541 (1991), 185.
3S. M. Saito and T. Nitta, In: Fractionalion by Packed Column SFC and SFE, M.
Saito, Y. Yamauchi and T. Okuyama (Eds.), VCH Publishers, New York, USA
(1994), p.27.
36. lM. Synder, lP. Friedrich and D.D. Christianson,1. Am. Oil. Chem. Soc., 61
(1984), 547S.
32

37. J. W. King, Personal Communication, 7th International Symposium on SFC and
SFE, Indianapolis, USA (1996).
38 . J.S. Chiou, TW. Barlow and D.R. Paul, 1. Appl. Polym. Sci ., 30 (1985), 3911.
39. J. Nicholas, KD. Bartle and AA Clifford, In: Proceedings - 11th International
Symposium on Capillary Chromatography, P. Sandra and G. Redant (Eds.),
Huthig, Heidelberg (1990), p.665 .
40. J.R Wheeler and M.E. McNally,1. Chromatogr. Sci., 27 (1989), 534.
41 . J. W. King, In: Supercritical Fluids: Chemical and Engineering Principles and
Applications, T.G. Squires and M.E. Paulaitis (Eds.), American Chemical Society,
Washington D.C., USA (1987), p.150.
42. J. Porcher and J.R. Strubinger,1. Chromatogr., 479 (1989), 251.
43. KD. Bartle, AA Clifford, S.B. Hawthorne, J.1. Langenfeld, DJ. Miller and R.
Robinson,1. Supercrit. Fluids, 3 (1990), 143.
44. J. Pawliszyn, 1. Chromatogr. Sci., 31 (1993), 31.
45. H. Sovova, Proc. 3rd Int. Symp. Supercrit. Fluids, Strasbourg, France, 2 (1994)
p.131.
46. E. Reverchon & L. Sesti Osseo, Proc. 3rd Int. Symp. Supercrit. Fluids,
Strasbourg, France, 2 (1994), p.189.
47. D.F. G. Walker, KD. Bartle, D. G.P.A Breen, AA Clifford and S. Costiou,
Analyst, 119 (1994), 2789.
48. S.B. Hawthorne and DJ. Miller, 1. Chromatogr. Sci., 24 (1986), 258.
49. J.W. King, 1. Chromatogr. Sci., 27 (1989), 355.
50. AB. de Haan, I. de Graauw, J.E. Schaap and H.T. Badings, 1. Supercritical
Fluids, 3 (1990), 15 .
51. J.M. Levy, RA Cavalier, T.N. Bosch, AM. Rynaski and W.E. Huhack,
1. Chromatogr. Sci., 27 (1989), 34l.
52. J.M. Levy and I .P. Guzowski, Fresenius Z. Anal. Chem., 330 (1989), 207.
53. H. Skaar, H.R Noli, E. Lundanes and T. Greibrokk,1. Microcol. Sep., 2 (1990),
222.
33

CHAPTER 3
Application of SFE to natural products:
A literature review
3.1 Introduction
Supercritical fluids were used as a mobile phase in a chromatographic separation as early
as 1962 by Klesper et al. (1). Despite the report of this application, the advantages of
supercritical fluids in the extraction and chromatography of natural products have only
been properly realised recently (2). SFE is being increasingly used as a sample preparation
method for the analysis of solutes in solid and liquid matrices. Traditionally SFE was used
for many years for preparative scale isolation of compounds from plant matrices.
Currently, commercialized industrial scale processes such as the decaffeination of coffee
and the extraction of hops, spices and tobacco exist.
The extraction of caffeine from green coffee beans is achieved by soaking the beans in
water and then extracting them in the pressure range of 160 to 220 bar and at
temperatures between 70 to 90°C. Under these conditions, the extraction is extremely
selective and the caffeine content can be reduced from 0.7-3% to 0.02%. (3). The caffeine
is food grade and is incorporated into beverages such as cola.
Extraction of hops is an important development in the brewing industry. The valuable
constituents of the hop resins give the characteristic bitter taste of the beer. Both are
unsaturated acids containing about 25 carbon atoms together with hydroxy and keto
groups. With supercritical CO2, almost 99% extraction of the humulones is achieved ,
well above the required minimum of95% (4).
34

Spice extraction has also become a commercial operation. Many spices are extracted,
usually with dichloromethane and, of these, extractions with supercritical CO2 have been
reported for black pepper, nutmeg and chillies. Piperine [3.1], makes up 98% of the hot
principle of pepper.
o > o
[3.1 ]
Extraction of ground black pepper, followed by transfer of the supercritical phase to a
vessel held at below supercritical temperature and pressure, produced a yellow pasty
extract containing nearly 98% of the piperine. Similarly, extraction of ground chillies gave
a red oil containing 97% of the main alkaloid, capsaicine [3.2] (5).
[3.2]
Tobacco differs as a starting material in that it is the extraction residue, the treated
tobacco, that is wanted, whereas the extracted nicotine is of secondary interest. Since
tobacco treated with organic solvents often acquires a rubbery texture, special processes
have to be considered to avoid this, as it is disadvantageous to further processing.
35

Extraction with SC-C02 is one possible means, though it causes some expansion of the
tobacco.
Many other applications involving process scale SFE have been documented (6,7) . These
include refining of triglycerides and fatty acids, the production of essential oil extracts
from natural products, and the production of low fat and low cholesterol foods. Apart
from these processes, current trends are towards the application of SFE as an analytical
extraction method (8) and numerous analytical scale SFE procedures have been
published. These procedures are concerned more with the extraction of analytes of
interest from a bulk matrix as a sample preparation technique prior to their
characterisation by other analytical methods such as chromatographic, spectrometric,
spectroscopic and gravimetric techiques. It is therefore potentially very useful for the
extraction of natural products prior to structural characterisation.
This chapter reviews the use of SFs for the analytical scale extraction of natural products.
Different classes of compounds have been discussed and each highlights the applications
where SFE was shown to be advantageous.
3.2. Alkaloids
Alkaloids are structurally the most diverse class of secondary metabolites encounted, most
commonly, in the plant kingdom, but representatives have been isolated from fungi and
mammals (9). Their manifold pharmacological activities have always excited man's
interest. The most common alkaloid which has been extracted by SFE is caffeine.
Sugiyama et al. (10) demonstrated the extraction and analysis of caffeine from roasted
coffee beans by direct coupling of SFE-SFC. The extraction conditions such as pressure,
temperature, water content and extraction times were initially investigated by off-line
SFE-SFC. SFE was performed with CO2 at 20 rvIPa; 20% added water and 48°C for 60
minutes. A JASCO Fine Pak Sn.. C18 HPLC coLumn was used with a methanol-water
(55:45) mobile phase at a flow rate of 1.2 ml per minute. UV detection was performed at
272 nm.
36

Ndiomu and Simpson (11) compared SFE with liquid extraction for the isolation of
caffeine from kolanuts. Low SFE recoveries of 53.7% were obtained while liquid
extraction with tetrahydrofuran and methanol yielded 97,0% and 99,4% respectively. The
SFE recoveries were attributed to two factors . Firstly, the extraction was carried out at a
comparatively low density although the system was operated at its maximum pressure, and
secondly thekolanuts were dried before extraction. The presence of water in the sample
is known to enhance the solubility power of the SF and this has been demonstrated by
Janicot et al. (12) for the extraction of alkaloids thebaine, codeine and morphine from
poppy straw. Elizabeth et al. (13) also isolated caffeine from coffee powder and
performed structural confirmation by FTIR and FTN1vIR.
The extraction of monocrotaline, a hepatotoxic pyrrolizidine alkaloid, from the seeds of
Crotalaria spectabilis was successfully performed by Schaeffer et al. (14). Supercritical
CO2 with 5-10 mol percent ethanol was employed at a pressure of 10.34 1vfPa and 22.15
1vfPa and 35-55 0c. However, the presence of highly soluble lipid material in the seeds
resulted in low monocrotaline percentage (approximately 24% mlm) in the extracts. A
cation-exchange resin trap was incorporated to selectively trap the alkaloids after SFE, in
preference to the co-extracted lipid material (15). The reported yield of monocrotaline
increased to 95% mlm.
The pyrrolizidine alkaloid fraction of two Senecio species (Senecio inaeqllidens and S.
cordatlls) was extracted by off-line SFE and analysed by capillary GC (16). SFE was
carried out with a home-assembled apparatus, using methanoVC02 as the extracting
medium, at 55°C and 15 1vfPa. This technique was found to produce cleaner extracts and
higher recoveries. Figures 3.1 and 3.2 show the capillary GC/FID pattern of the extracts
from S. inaequidens and S. cordates respectively. SFE required a smaller amount of
sample, gave a quicker extraction, a simplified fraction clean-up and a higher recovery.
37

1 2 5
....
..;
.... 0-... ... ~ ...
'" ... .. .,.. .... 3 ...:. ... .. "-
~ . - 4 .... .J , - ' t · 30 mi"_ ~IO 10 20 'f10 1~0 2~-o 210 'be
Figure 3.1 . Capillary GC/FID pattern of Senecio inaequidens pyrrolizidine alkaloid fraction extracted by off-line SFE. (16) 1, senecivernine; 2, senecio nine; 3, seneciphylline; 4, integerrimine; 5, retrorsine; 6, usaramine; 7, desacetyl doronine; 8, doronine.
2 7
6 ~ 1 ~ ... ... ~
... ;:; - ,.;
V\ ... .... .,. CD ,... '" ...; ....
:: ..; ... ... " .. ... .... ". "" "'- " .
.~ ::: ~~
Figure 3.2. Capillary GCIFID pattern of Senecio cordatus pyrrolizidine alkaloid fraction extracted by off-line SFE. (16) 1, seneciverine; 2, senecionine; 3, seneciphylline; 4, spartiodine; 5, integerrimine; 6, jacobine; 7, jacozine.
38

The extraction of alkaloids thebaine, codeine and morphine from poppy straw was also
investigated. (1 2). Extraction with pure SC-C02 at 20 MPa and 40.5 QC was unsuccessful,
hence the influence of various polarity modifiers were considered. It was found that 50 %
methanol in CO2 was necessary in order to achieve quantitative extraction yields for
morphine. A mixture of 25% methanol, 0.22% methylamine and 0.34% water produced
the same effect as 50 % methanol in CO2 . The methylamine:water mixture, however, had
a major drawback in that morphine in the presence of the amine degraded in the presence
of light. Hence, CO2:methanol:water mixtures were investigated and it was observed that
by increasing the water content in the extraction fluid, the extraction rate for thebaine was
dramatically enhanced (Figure 3.3).
Water content . Ina-eases
100 . - 1==== •
10
-~ 0 -Cl)
~ 60 a: c 0 U cu .... -x W
20
o ~----~----~----~----~-----r-----r--o 30 60· to 120 150 110
Time I minutes
Figure 3.3. Influence of water on the extraction curves of thebaine at constant mass flowrate (12). SFE was performed at 20 MPa and 40.5 QC using CO2:methanol: water mixtures of the following w:w:w compositions:
050:32:18; A 50:36:14; .50:40:10; • 50:44:6; .50:46:4; o 50:49: 1; 0 50:49.5 :0.5; 650:50:0
39

Sharma et al. investigated the use of SC-C02 for the extraction of moist snuff (17) . Pure
and methanol modified SC-C02 was used at 54.4 NIPa and 60 QC over a 20 min period.
Methanol modified CO2 extracted compounds such as benzyl alcohol, benzothiazole and
cotinine which were not present in the extracts obtained using pure CO2.
The extraction of vindoline, an indole alkaloid from Catheranthus rose us was investigated
by Kyu-Min et al. (18). Vindoline is the biosynthetic precursor of the dimeric alkaloids,
vinblastine and vincristine. These two dimeric alkaloids have been used in chemotherapy
for the treatment of Hodgkin's disease and acute leukemia (19,20) . The extraction was
carried out using pure CO2 at various temperature and pressure conditions and the
resulting extracts analysed by LCIMS. Figure 3.4. illustrates the dependence of extraction
yield on CO2 consumption at various pressures and constant . temperature (50 QC).
Extraction of the leaves at 300 bar and 70 QC was found to produce the highest yield of
vindoline.
1.2.,-----------....... -------,
lO
,....... -a 0.8 E ~
~ 0.6 g 13 ....
0.4 u 0 '-.... Jj
01
0 0 100 ZOO 300 1,00
COz ConSlJmp tion [g]
.IQ bar
200 bar
150 bar
1]0 bar 500 600
Figure 3.4. The dependence of extraction yield on CO2 consumption at 50 QC. (18)
~o

Bugatti et al. used SC-C02 in the extraction of isoquinoline alkaloids, O-methylcariachine,
protopine, a-allocryptopine, escolzine, californidine, sanguinorine and chelerythine from
the aerial parts of Eschscholtzia californica (Papaveraceae) (21). Extractions were
performed at 40 QC using pressures from 8 to 30 MPa and analysis performed by reversed
phase HPLC with UV photodiode array detection.
A study was also undertaken to investigate SFE as an alternative method for the selective
recovery of drugs of abuse, specifically cocaine, from hair (22). While urine anaysis can
detect only relatively recent drug exposure, hair analysis has potential for providing long
term information about drug usage. ' A variety of CO2-modifier mixtures were
investigated as extractants. Modifier was added directly to the sample by injection into
the CO2 stream upon initiation of a static extraction step. Quantitative analysis of the
SFE extracts was performed using capillary GC with nitrogen-phosphorous detection
(GC - NPD). The most efficient recoveries of cocaine were obtained using CO2 modified
with 100 ~l water/triethylamine (TEA) (85:15 v/v) or with 100 ~l methanol/ water / TEA
(76:10:14 v/v) and extracting the hair sample at 40 MPa and 110 QC for 10 min static ally,
followed by a 15 minute dynamic extraction period.
Supercritical fluid extraction has also been investigated to isolate some of the major
oxindole alkaloids of Uncaria tormentosa (23). U. tormentosa is a woody vine and is
used for the treatment of gastritis, ulcers, cancer, arthritis, etc (24). Pure and methanol
modified SC-C02 were used to generate the extracts that were subsequently analysed by
both GCIMS and HPLCIMS. The extractions were first performed with pure CO2 at 250
atm at 60 QC for 30 minutes in dynamic mode to yield fraction 1. The extraction was then
performed with 10% methanol modified CO2 for 60 minutes to yield fraction 2. Fraction
1 was found to contain two isomers of mitraphylline while fraction 2 contained 5 isomers
of mitraphylline and two isomers of rhynchophylline. The average SFE yield (3
determinations) was 82,6% (with a coefficient of variation of 17.8%) for mitraphylline
and 99.5% (coefficient of variation of 6.2%) for rhynchophylline.
41

3.3 Steroids
The steroids are a subclass of the triterpenoids and are known for their outstanding
chemical, biological and medical importance. Analytical SFE has been investigated on
moderately polar compounds such as cholesterol, stigmasterol, testosterone, cortisone and
the anabolic steroid trebolone. Solublility data for cholesterol, stigmasterol and egosterol
in SC-C02 was obtained by Wong and Johnstone (25). The solubility of cholesterol in
pure CO2 was found to be approximately three times greater than that of stigmasterol, and
fifty times that of ergosterol although these sterols have similar structures. Furthermore,
the addition of methanol or ethanol to CO2 increased the solubility of the sterols by up to
two orders of magnitude. In studies using ascending pressure profile extraction, milk fat
was stripped of 90% of its cholesterol using pure SC-C02 (26) . The efficiency of
separation was measured on each fraction collected at each pressure interval and
cholesterol assayed using an AOAC procedure and GC. The extraction of cholesterol
from egg yolk and blood serum was also carried out by Ong et al. (27;28). Pure SC-C02
at 45 QC and 17.7 MPa was used and the extraction carried out for about 60 min. The
result obtained were comparable to classical methods for cholesterol analysis.
Polar SFs such as Freon-22 have also been used for the extraction of estrone,
testosterone, estriol, cortisone, methyl testosterone and hydro-cortisone from spiked glass
wool (29). Li et al. compared the results obtained using Freon-22 with those using pure
CO2. Extractions were performed with CO2 at 50 QC for 30 min and with Freon-22 at 100
QC for 15 min using pressures up to 18 MPa. The extraction efficiency with Freon-22 was
significantly better than that with CO2. However, Freons are not recommended as
extraction fluids owing to their adverse environmental effects.
SFE was also investigated as a fast laboratory method to determine the levels of fungal
infection in foodstuffs (30). The extraction of ergosterol (a fungal metabolite) from flour,
mouldy bread and mushroom caps was performed using CO2 at 40 QC and a density of
. 0.90 glm!. Analyte trapping was performed using an octadecylsilyl (ODS) material. The
analyte, after being washed off with methanol, was subsequently analysed by packed

column SFC on a Spherisorb amino column (3 ~m) using CO2 with 10% methanol, and
employing UV detection at 282 nm. The observed levels of ergosterol ranged from 0.08
~g/g in cake flour to 14,3 mg/g in freeze-dried mushroom caps.
Ouabain is a steroid-derived polar compound with eight hydroxyl groups. It belongs to a
group of drugs known as digitalis cardioglycosides, which are derived from plants and
used in the treatment of heart failure. These drugs are used at very low concentrations,
that is in the 1-20 ng/ml range. On-line SFE-SFC with fraction collection was performed
on this compound and important information pertaining to solute elution density,
efficiency of extraction, solute trapping, and chromatography was obtained (31) . The cell
was packed with an adsorbent containing the sample of interest and extraction carried out
with CO2 at 400 atm, 80 °C for 30 min. Solute trapping was performed in a deactivated
capillary solute concentrater within a cryogenic trap. The capillary solute concentrator
was directly connected to the SFC column (3m X 50 urn i.d. SB-Methyl 100) and
chromatography performed by density programming.
The SFE extract of the bark ofCedrela toona (Meliaceae) was also analysed by Modey et
al. (32). SFE was performed with CO2 at 40 °C and 39:MPa for 50 min (25 min static
extraction followed by 25 min dynamic extraction). GC-MS analysis of the extract
revealed the presence of stigmasterol and the 22,23-dihydro- derivative of stigmasterol.
Synthetic anabolic steroids such as trenbolone [3.3] speed muscle development in animals
but are known to be hazardous to man.
OH
[3.3]
43

Administration of anabolic steroids to food-producing animals has been prohibited in the
UK since 1986, but on-going monitoring is clearly necessary. SFE was evaluated for the
quantitative extraction of trenbolone from beef (33). Experiments on beef spiked with
trenbolone suggested that SFE is best carried out on freeze-dried samples. The presence
of methanol modifer was necessary to increase solubility and reduce matrix interaction.
Extraction was near-complete (98 % recovery) within 60 min at 75 QC and 400 atm using
0.1 methanol mole fraction in CO2. Under these conditions, extraction of fats and other
endogenous materials is minimised. However, the authors stated that these results could
not be used to illustrate the extraction behaviour from naturally contaminated samples, as
in naturally contaminated samples, the trenbolone may, for example, be exposed to
different active sites and a greater fraction of it encapsulated within cells. Despite these
and other possible differences, this study does provide a useful prediction for the
extraction conditions that might be required.
3.4 Flavour and Fragrance Compounds
The extraction of flavour and fragrance compounds from plants has been successfully
achieved using supercritical CO2. The sesquitepenoid bitter principals, calamus, acorone
and isoacorone present in Acarus calamus are thermally unstable and partially decompose
using steam distillation. SFE was carried out at 9 MPa and 40 QC to successfully extract
these components (34). The yield of the bitter principle improved and the decomposition
problems were eliminated.
On line extraction and analysis of flavour and fragrance compounds was performed by
Hawthome et al. (35). Extracted components were transferred directly from the
extraction cell onto the GC column via an on-column injector. A variety of samples
including herbs, spices, orange peel and spruce needles were analysed to demonstrate the
potential of this technique. As shown in Figure 3.5, the on-line SFE-GC results were
comparable to the off-line analysis of a variety of SFE extracts which were injected
manually into the Gc. Cryogenic trapping at -30 QC was employed during the extraction
44

of thyme and compounds such as borneol, thymol and carvacrol were identified by mass
spectrometry.
Q) Cl)
C o 0. Cl)
ID 0:
o
SFE-GC A
1,8-cineoJe
I camphor
camphene
I borneol
a-Pin". ~ / bornyl acetate
./ '" . humulene
Second Extraction B
L--------------~ u. On-Column Injection
c
10 20
Retention Time (min)
Figure 3.5. Comparison of chromatograms generated by (A) SFE-GC-FID analysis of rosemary and by (C) Standard on-column injection of a methylene chloride extract. Chromatogram (B) shows the result of a second SFE-GC-FID analysis of the same sample. (35)
45

The extraction of a number of herbs used in herbal remedies have also been carried out
using SFE. In 1991, Ma and coworkers (36) extracted and analysed three kinds of herbs
used in traditional Chinese medicine viz. frankincense, myrrh and Evodia rutaecarpa. SFE
with CO2 was performed at 20 MPa and 50°C followed by GC-MS analysis. Large
amounts of sesquiterpenes were found to be present in the extract of myrrh while the
Evodia extract was found to contain monoterpenes, sesquiterpenes, diterpenes and
aliphatic hydrocarbons. The study revealed the potential of SFE as an analytical tool for
the study of medicinal plants.
The medicinal herb, feverfew, Tanacetum parthenium, was also analysed for the presence
of the sesquiterpene lactone, porthenolide by GC (37, 38). Extraction was first performed
using SC-C02 at 25 MPa and 45°C and the analyte trapped in a cryogenically cooled flask
at 17°C using liquid nitrogen. The addition of methanol or acetonitrile as a modifier
increased yields of porthenolide.
Work was performed on tumeric, the ground rhizome of the plant Curcuma /onga, a
species of the Zingiberaceae family which is native to Southern Asia (39). It is valued for
its yellow-colouring components and its use as a spice, as well as being an ingredient in
traditional medicines and cosmetics. SFE employing pure CO2 at 25 MPa and 60°C was
used initially to remove low polarity components. However, CO2 modified with 20%
methanol was required to extract the more polar curcuminoids and under optimized
condititions, gave more than 90% recovery of curcumin.
The plant Zingiber zen/mbe! also belongs to the Zingiberaceae family. The rhizome of
this species is an important ingredient for the famous Indonesian traditional medicine,
Jamu. Supercritical CO2 at 60°C and 20 MPa was used to extract the non-polar
components of the dried rhizome of this plant (40) and analysis carried out by GC. SFE of
Z. zerumbet was performed initially using pure CO2 at 60°C, and the sample was
extracted sequentially at 10 MPa and then at 20 MPa. The combined SFE extracts gave a
1,92% yield compared to the dichloromethane extract which gave a 1.98% yield of the
46

dried plant material. The extracts were examined by capillary GC and the peaks were
identified by GC-electron ionization MS and coinjection with authentic samples.
Comparison of the SFE extracts with the dichloromethane extract by capillary GC
showed that similar components were extracted and the composition of the SFE extracts
were comparable to that of the dichloromethane extract.
Barton et al. (41) extracted volatile compounds from Mentha piperita. The flavour and
fragrance of the CO2 mint extracts were closer in quality to actual mint leaves compared
with mint oils extracted by conventional steam distillation. The extraction conditions
were CO2, 6-18 MPa, 24 - 43 QC and 4-9 hours.
Simandi et al. (42) also reported on SFE of the leaves of M. piperita and found the extract
to contain more of the fragrance characteristic compound menthofuran than the distilled
oil. In addition, these workers extracted the flavours of Lavandula intermedia using a
step-wise pressure programme. Unlike the SFE extract, the distilled oil contained high
levels of linalool resulting from the hydrolysis of linanyl acetate once again illustrating
the disadvantages of steam distillation. The results indicate that the most natural and
true-tasting extracts are obtained by techniques which utilize low temperature and avoid
degradative heat processes and reactive solvents. Moyler (6) has reviewed the published
literature pertaining to the extraction of forty two natural botanical extracts.
SFE has also been utilized for the selective extraction of the essential oils myrcene,
caryophyllene, humulene and the u- and B- bitter acids of hops, Humulus lupulus (43).
At a density of 0.2 glml and a temperature of 50 QC, 98% myrcene, 91 % humulene and
95% B-caryophyllene were extracted. The bitter acids only became soluble in CO2 at
0.25 glml and were completely extracted at about 0.9 glm!. The essential oils were
analysed by capillary GC and the bitter acids by micro-LC and MECC.
A procedure to extract free aroma terpenic components in musts and wines was also
presented by Carro et al. (44). Due to the high number of variables that potentially affect
47

SFE, experimental designs were used to simultaneously optimize the operational
parameters and to establish their possible interactions. Plackett Burman Factorial designs
were applied on a synthetic hydroalcoholic model solution of five terpenic compounds,
linalool, a-terpineol, citronellol, nerol, and geraniol. The following experimental variables
were optimized: SC-C02 density and flow, static and dynamic extraction times, extraction
cell and trap temperatures. Best results were obtained at 0.9 glml at 54°C after a static
extraction time of 5 minutes followed by dynamic extraction of 40 minutes. The trap
temperature was maintained at 10°C and a CO2 flow of 2ml1min.
The extraction of aroma compounds in fruits has also been investigated. Kerrola et af.
(45) used on-line SFE-GC in the analysis of carvone and limonene in caraway fruits of
various origins. Extractions were performed at 9.7:MPa and 50°C. Fractionation of
lemon peel oil by SFE-preparative SFC was also investigated (46,47). The SFE results
indicated that CO2 extracts were similar in composition to cold-pressed oil, but contained
less limonene, 10 times the concentration of alcohols, and three to five times the
concentration of linalyl acetate.
3.5 Carotenoids
The high degree of unsaturation in carotenoids has rendered them heat and light sensitive
making carotenoids the most experimentally demanding group of terpenes. The polyene
chain is responsible for the intense colour of the carotenoids, which are pigments that
occur in many plant and animal sources (47) . Many SFE studies have focused on
carotenoid compounds, firstly because of their possible role in reducing the incidence of
certain cancers in humans, secondly because of the provitamin A activity of ~-carotene
and thirdly because of the anti-oxidant activity of ~-carotene .
Favati et al. (48) investigated SC-C02 for the extraction of carotene and lutein from
alfalfa leaf protein concentrate (LPC). Over 90% of the carotene contained in LPC was
removed at extraction pressures in excess of 30 :MPa. However, the removal of lutein
from the LPC required higher extraction pressures (70 MPa) to attain 70% recovery.
48

Extractions were performed on 45-50 gram samples of LPC and chromatographic analysis
was performed using HPLC. SFE provided the possibility of obtaining a selective
extraction of natural colourants free of solvent residuals for food dyes.
The SFE of carotenoids from algae has also been investigated (49, 50). Extractions from
a mediterranean brown alga were conducted by applying a controlled stagewise pressure
increase and different fractions in terms of colour and composition were obtained
depending on the density of the extracting fluid . The pressure was stepped from 8 to 10,
to 15, 20 and 25 MPa at temperatures of 35, 45 and 55°C. Subsequent analysis of the
extracts by TLC and HPLC showed the presence of ~-carotene amongst many other
unidentified components.
The extraction of carotenoids from foodstuffs, specifically tomato paste, canned pumpkin,
spinach, red palm oil, butter and cheese was also carried out with SC-C02 and various
modifiers (51). Static and dynamic extractions were investigated using CO2 modified with
1% methanol, ethanol or isopropanol at pressures of 13,6-68 MPa and temperatures of 40,
55 and 70°C. HPLC was used to confirm the presence of specific carotenoids including
lycopene. A poor yield (24%) was reported for tomato paste however the yield increased
to 78% when modified CO2 was employed.
The extraction of a-carotene from sweet potatoes has also been reported (52) .
Supercritical CO2 was employed at 41.4 MPa and 41°C. The extract was found to
contain about 94% a-carotene, but the yield varied depending on the moisture content of
the sample, the method of sample dehydration and the particle size. Marsilli and Callahan
(53) compared SFE using CO2 with classical solvent extraction using ethanol:pentane for
the extraction of carotenes from a number of vegetable samples. The SFE method proved
favourable in terms of both extraction yield and speed.
49

3.6 Lipid materials
Pure and modified CO2 has been successfully applied to the extraction of many lipid
materials such as vegetable oils, fatty acids, fatty acid esters, phospholipids and
tocopherols. Many reports have outlined the use of SC-C02 for large-scale (54-56) and
analytical-scale (57, 58) extraction of oilseeds. Dry milled corn-germ was also extracted
using supercritical CO2 at 34-54 MPa and 50°C (59). The oil was found to be lower in
free fatty acids and refining loss and was lighter in colour compared with commercial
expeller-milled oil.
Friedrich et al. (60) also extracted oil from soyabeans using pure SC-C02 at 50°C and
pressure of 68 MPa. The oil was found to be lighter in colour and to contain less iron and
about one-tenth the phosphorous content as was obtained by hexane extractions on the
same sample.
Tocopherols in wheat germ have also been studied extensively (61, 62). SFE was used in
tandem with SFE for on-line separation of the tocopherols. SFE was performed with pure
SC-C02 at 25 MPa and 40°C. 0,03% tocopherol and 10% oil by weight was extracted.
SFC was performed with ethanol modified CO2 and the eluent monitored with a
multiwavelength UV detector.
Prostaglandins were also selectively analysed without derivatization using SFE and open
tubular column SFC (63). These C20 polyunsaturated fatty acids containing a substituted
cyclopentane ring, posses a strongly diversified physiological activity and are potent at sub
- ppm levels. Aqueous prostaglandin samples were extracted from adsorbents onto which
the samples had been loaded, using CO2 at a density of 0,800 glml and at 35-50 0c. The
extract was then trapped in a solute trap cooled with liquid CO2 prior to SFC analysis.
Eleven prostaglandin standards were seperated in thirty five minutes using this method.
50

Supercritical CO2 has shown advantages for the extraction of oils from grape seeds (64) .
A 3 hour extraction with CO2 at 35 MPa and 40 DC gave similar yields to a 20 hour
Soxhlet extraction with hexane. The SFE extract had a lower percentage of free fatty
acids and unsaponifiables than the solvent extract and did not require degumming or alkali
refining. Further, extraction with CO2 at low temperature enabled the seed proteins to be
recovered. These are normally denatured on extraction with hot organic solvents.
The extraction of polar phospholipids from soyabeans has also been investigated (65) . A
two step extraction sequence was performed. Initial extraction aided in the removal of the
soyabean oil while the second extraction with ethanol modified CO2 was undertaken to
isolate the phospholipid enriched fractions. Analysis were performed by HPLC. It was
observed that at methanol mole fraction of 0.52, the recovery of phospholipids was very
low, however recoveries increased considerably to around 10 glkg of soyabean using
0.102 and 0.162 mole fractions of ethanol respectively.
The quantitative extraction of pecan oil was undertaken by Maness et al. (66) employing
CO2 as the extraction solvent, and chilled · hexane as the trapping solvent. The fatty acid
composition for the total lipid fraction of oils extracted as well as the total oil content
obtained with SFE was the same as for oils extracted with organic solvents. Extraction
was carried out at 69l\1Pa and 75 DC with a 250 mlImin restrictor for specified durations.
The extraction of fatty and waxy material from rice bran was also investigated with SC
CO2 at pressures up to 28 MPa and temperatures between 40 and 70°C (67). Although
the yields obtained with SF were only 16-60% of those obtained by Soxhlet extraction
with hexane, the extract was lighter in colour and richer in wa, content and long chain
fatty acids C20-C34.
3.7 Miscellaneous applications
SFE has been employed for the extraction of taxanes. SFE of taxicin from the dried
needles of the English yew tree, TaxlIs baccata was carried out at 400 atm and 50 DC with
5l

pure CO2 (68) . Extraction times varied between 15 and 105 minutes and restrictor
temperatures were between 100 and 175 QC. Subsequent analysis by SFC and proton
NMR confirmed the identity and purity of taxicin. SFC was performed on 10 m x 50 Ilm
i.d. SB-Biphenyl-30 (30% biphenyl-substituted polydimethylsiloxane) or carbowax
. column. Pure CO2 was used as the mobile phase, the oven temperature was 120 QC and
sample introduction was via a 50 n1 timed-split injection valve. The extraction efficiency
of SFE was comparable with that obtained using liquid solvents.
Furanocoumarins are representatives of the compounds commonly present in higher plants
from the Umbelliferae and Rutaceae families. Linear furanocoumarins have been found to
exhibit a pronounced photosensitizing activity and have thus been used in clinical
treatment of skin lesions (psoriasis and vitiligo) (69, 70). The fruit of Archange/ica off.
Hoffin. constitute one of the richest sources of furanocoumarins. SFE has been
successfully employed in the extraction of these compounds. Fractionating SFE was
perfonned by varying both the temperature and pressure of CO2. Under optimal
conditions, the overall SFE recoveries of the compounds extracted were close to those ·
obtained by soxhlet extraction (71).
The isolation of sulfonamides from chicken eggs has also been carried out using SFE (72).
Sulfonamides are routinely used in veterinary medicine in raising cattle and poultry
because of their broad range of activity against gram-positive and gram-negative bacteria.
Whole egg was mixed with hydro matrix and the sample extracted at 40 QC with SC-C02 at
680 bar. The sulfonamides were trapped in-line on an alumina sorbent bed and eluted with
phosphate buffer and methanol for subsequent analysis by HPLC.
From this literature review, it has become quite evident that SFE has a wide application
area and is capable of extracting a wide range of diverse compounds from a variety of
sample matrices. Although SFE does not provide the solution to every problem, the use
of SFE in other areas of natural products still await investigation.
52

References
1. E. Klesper, AH. Corwin and D.A Turner, J Org. Chem., 27 (1962), 700.
2. C.D. Bevan and P.S. Marshall, Nat. Prod. Rep., 11 (1994), 451.
3. H. Engelhardt and A Gross, Trends in Analytical Chemistry, 10 (1991), 64.
4. P. Hubet and O.G. Vitzthum, Angew. Chem. Int. Ed., 17 (1978), 710.
5. D.F. Williams, Chemical Engineering Science, 36 (1981), 1769.
6. D.A Moyer, In: Extraction of Natural of products using Near-critical Solvents,
M.B. King and T.R. Bott, (Eds.). Blackie, Glasgow, UK (1993), p.149.
7. S.S.H. Rizvi, Supercritical Fluid Processing of Food and Biomaterials,
Blackie, Glasgow, UK (1994), p.12.
8. S.R. Sargenti and F.M. Lancas, J High Resol. Chromatogr., 20 (1997), 511.
9. l Mann, R.S . Davidson, lB. Hobbs, D.V. Banthorpe and lB. Harborne, Natural
Products, their Chemistry and Biological Significance, Longman Group, London,
UK (1994), p.389.
10. K. Sugiyama, M. Saitto, T. Hando and M. Senda, J Chromatogr., 332 (1985),
107.
11. D.P. Ndiomu and C.F. Simpson, Anal. Chim. Acta., 213, (1988), 237.
12. lL. Janicot, M. Cauder and R. Rosset, J Chromatogr., 505 (1990), 247.
13. P. Elizabeth, M. Yoshioka, Y. Yamauchi and M. Saito, Anal. Sci., 7 (1991),
427.
14. S.T. SchaefIer, L.H. Zalkow and AS. Teja, AIChE Journal, 34 (1988),
1740.
15. S.T. SchaefIer, L.H. Zalkow and AS. Teja, Ind. Eng. Chem. Res., 28 (1989),
1017.
16. C. Bicchi, P. Rubiolo, C. Frattini; P. Sandra and F.David, J Nat. Prod., 54
(1991), 941.
17. AK. Sharma, B. Prokopczyk and D. Hoffmann, J Agric. Food Chem., 39 (1991),
508.
53

18. S. Kyu-Min, Y, Ji-Ho, L. Huen, H. Won-Hi and Y. Seung-Man. Biochemical
Engineering 2001, Proceedings of the Asian-Pacific Biochemical Engineering
Conference (1992), p.566.
19. G.B. Boder, M.Gorman, I.S . lohnson and P.l Simpson, Lloydia, 27 (1964)
328.
20. Y. Miura, K Hirata, N. Kurando, K Miyamoto and K Uchida, Planta Med., 54
(1988), 18.
21. C. Bugatti, M.L. Colombo and A. Mossa, PlantaMed., 59 (1993), A626.
22. IF. Morrison and W.A. MacCrehon, Proc. 5th Int. Symp. Supercrit. fluid
Chromatogr. Exlr. , Baltimore, MA., USA (1994), p.F16.
23. V. Lopez-Avila, l Benedicto and D. Robaugh, 1. High. Resol. Chromatogr.,
20 (1997), 23 1.
24. H. Stuppner, S. Sturm and G. Konwalinka, Chromatographia, 34 (1992), 597.
25. lM. Wong and KP. Johnstone, Biotechnol. Prog., 2 (1986), 29.
26. RL. Bradley Jr., J. Dairy Se., 72 (1989), 2834.
27. c.P. Ong, H.L. Lee and S.F.Y. Li, J. Chromatogr., 515 (1990); 509.
28. c.P. Ong, H.L. Lee and S.Y.F. Li, 1. Microeol. Sep., 2 (1990) 69.
29. S.F.Y. Li, C.P. Ong, M.L. Lee and H.K Lee, 1. Chromatogr., 515 (1990),515.
30. lC. Young and D.E. Games,l Agrie. Food Chem., 41 (1993), 577.
3l. Q.L. Xie, KE. Markides and M.L. Lee, 1. Chromatogr. Sei., 27 (1989),365.
32. ,W.K Modey, D.A. Mulholland, H. Mahomed and M.W. Raynor, 1. Mierocol.
Sep ., 8 (1996), 67.
33 . N. Din; K. D. Bartle and A.A. Clifford, 1 High Resol. Chromatogr., 19 (1996),
465.
34. E. Stahl and K Keller, PlantaMed., 47 (1983), 75.
35. S. B. Hawthome, M. S. Krieger and D. l Miller, Anal. Chem.,60 (1988),472.
36. X, Ma, X. Yu, Z. Zheng and l Mao, Chromatographia, 32 (1991), 40.
37. R M. Smith and M. D. Burford, 1. Chromatogr., 627 (1992), 255.
38. R M. Smith and M. D. Burford, 1.Chromatogr., 600 (1992),175.
54

39. M. M. Sanagi, U. K. Abmad and R. M. Smith, 1. Chromatogr. Sci ., 31 (1993),
20.
40 . U. K. Abroad, H. M . Sirat, M. M. Sanagi and R. M. Smith, J. Microcol. Sep.,
6 (1994), 27.
41. P. Barton, R.E. Hughes, Jnr. and M . M. Hussein, 1. Supercrit. Fluids, 5 (1992),
157 . .
42. B. Simandi, A. Kery, E. Lemberkovics, M. Oszagyan and E. Hethelyi, Planta
Med., 59 (1993), A626.
43. M . Verschuere, P. Sandra and F. David,1. Chromatogr. SCi., 30 (1992), 388.
44. N . Carro, C. M . Garcia and R. Cela, 1. Microcolumn Sep., 8 (1996), 453.
45. K. Kerrola, P. Alhorunaki and H. Kallio, Proc. 5th Int. Symp. Supercrit. Fluid
Chromatogr. Extr., Baltimore, MA, USA (1994), p.E2.
46. Y. Yamauchi and M Saito, In: Fractionation by Packed column SFC and SFE,
M. Saito, Y. Yamauchi & T. Okuyama (Eds.), VCH publishers, New York, USA
(1994), p.69.
47. R. Ramage in Chemistry of Tepenes and Terpenoids, A A. Newman (Ed.),
Acedemic Press Inc., London (1972), p.288.
48. F. Favati, 1.W. King, 1. P. Friedrich and K. Eskins, 1. Food Sci., 53 (1988),
1532.
49. T. Lorenzo, S.J. Schwartz and P. K. Kilpatrick, In: Proc. Int. Symp. Supercrit.
Fluids, M. A. Mchugh (Ed.), (1991), p.297.
50. P. Subra and P. Boissinot, 1. Chromatogr., 543 (1991), 413 .
51. L. H. Tonucci and G. R. Beecher, Proc. 4th Int. Symp. Supercrit. Fluid
Chromatogr. Extr., Cincinnati; OH, USA (1992), p.1l9.
52. G. A. Spanos, H. Chem and S. 1. Schwartz,1. Food Sci., 58 (1993), 817.
53. R. Marsilli and D. Callahan, 1. Chromatogr. Sci., 31 (1993), 422.
54. D.D. Christianson, 1. P. Friedrich, E .B. Bagley and G. E . Inglett, In: Maize:
Recent Progress in Chemistry and Technology, G.E. Inglett (Ed.), Academic
Press, New York, USA (1982), p.231.
55

55 . G. R. List, 1 P. Friedrich and 1 Pominski, 1. Am. Oil. Chem. Soc., 61 (1984),
1847.
56. C. A Passey and N. D. Patil, in Proceedings of the 2nd International Conference
on Separations Science and Technology, M. H. I. Baird & S. Vijayan (Ed.),
Canadian Society for Chemical Engineering, Ottawa, Canada (1989), p.57.
57. S. L. Taylor, 1. W. King and G. R. List, 1. Am. Oil. Chem. Soc., 70 (1993), 437.
58. 1. W. King and 1. H. Johnson, in Proc. 5th Int. Symp. Supercrit. Fluid
Chromatogr. Extr., Cahnes Publishing, Des Plaines (1994), p.13 .
59. D. D. Christianson, 1 P. Friedrich, G. R. List, K Warner, E. B. Bagley,
AC. Stringfellow and G.E. Inglett,1. Food Sci., 49 (1984), 229.
60. lP. Friedrich, G.R. List and A1. Heakin, 1. Am. Oil Chem. Soc., 59 (1982),
288.
61. M. Saito, T. Rondo and Y. Yamauchi, In: Supercritical Fluid Chromatography,
RM. Smith (Ed.), Royal Society of Chemistry, London, UK (l988), p.203.
62. M. Saito, Y. Yamauchi, K. Inomata and W. Kottkamp, 1. Chromatogr. Sci., 27
(1989), 79.
63. 1.1. Koski, B.A Jansson, K.E. Markides and M.L. Lee,1. Pharm. Biomed Anal.,
9 (1991), 281.
64. A. Molero Gomez, W.Huber, C, Pereyra Lopez and E. Martinez la Ossa, Proc.
3rd Int Symp. Supercril. Fluids., Strasourg, France (l994), p.413.
65 . L.Montanori, lW. King, G.R. List and KA. Rennick, Proc 3rd 1nl. Symp.
Supercrit. Fluids., Strasbourg, France (1994), p.497.
66 . N.O. Maness, D. Chrz, T. Pierce and G.H. Brusewitz, 1. Am. Oil Chem. Soc.,
72 (1995), 665.
67. A Garcia, A de Lucas, 1 Rincon, A. Alvorez, 1. Gracia and M.A. Garcia,
1. Am. Oil Chem. Soc., 73 (1996), 1127.
68. D.M. Reaton, KD. Bartle, CM. Rayner and A.A. Clifford, J. High Resolut.
Chromatogr., 16 (1993), 666.
69. J. Willis and D.E.R. Harris, Arch. Dermal., 107 (1973), 358.
70. V. Wolf, T.B. Fitzportick and J.A Parrish, Arch Dermat.,112 (1976), 943.
56

7l. 1. Gawdzik, S. Kawka, M. Mardarowicz, Z. Suprynowicz and T. Wolski,
1. High Resot. Chromatogr., 18 (1995) 781.
72. lW. Pensabene, W. Fiddler and O.W. Parks, 1. Chromatogr. Sci., 35 (1997)
· 270.
57

CHAPTER 4
Separation techniques
4.1 Introduction
Plant extract analysis for phytoremediation and the development of phytochemicals for
medicinal applications requires the characterisation of a wide variety of compounds.
Analysing the extracts of plants involves matrices thaf are unavoidably complex and often
requires manipulation of a mixture of components with varying solubilities and volatilities
present in different proportions. Many different chromatographic techniques have been
applied to the separation and identification of individual components from these matrices
(1-3) depending on the requirements to be fulfilled in order to achieve an effective
separation. More recently, capillary electrophoretic techniques have also found use in the
analysis of plant extracts (4-6). This chapter outlines the basic conditions and theory of the
chromatographic and capillary electrophoretic processes used in the characterisation of
plant extracts. The general equations applicable to gas chromatography (GC),
supercritical fluid chromatography (SFC), liquid chromatography (LC) and capillary
electrophoresis (CE) are discussed.
4.2 Theory of Chromatography
Chromatography is defined as a separation method whereby individual chemical
compounds which were originally present in a mixture are resolved from each other by the
selective process of distribution between two heterogeneous (immiscible) phases. The
distribution of chemical species to be separated occurs in a dynamic process between the
mobile and the stationary phase (7). The stationary phase is a dispersed medium, which
usually has a relatively large surface area, through which the mobile phase is allowed to
flow. The chemical nature of the stationary phase exercises the primary control over the
separation process (8). The greater the affinity of a particular solute for the stationary
medium, the longer it will be retained in the system. The mobile phase can be either gas,
58

liquid or supercritical fluid hence the name gas, liquid or supercritical fluid
chromatography. Each technique has its own niche. For example, GC is most useful for
small volatile molecules that are thermally stable whereas SFC is often applied to thermally
labile compounds and those which are too involatile to be analysed by Gc. HPLC is
usually used to separate polar and high molecular weight compounds and is the technique
which is most appropriate for the majority of sample types which are not amenable to GC
or SFC.
All chromatographic separations are based upon differences in the extent to which solutes
are partitioned between the mobile and the stationary phase. The equilibrium involved can
be described quantitatively by means of a partition coefficient Ki, for each solute (t) in the
sample which for chromatography is defined as
C .s Ki = (4 .1)
C ,rn
Here, Ci,,r and C ,rn are the concentrations of a solute in the stationary phase and mobile
phases respectively.
The distribution of each solute between the stationary and mobile phase is described by the
capacity factor (k)
Xi.s K, k' = (4.2)
f3
where x represents the masses of components i (in each phase), Vs and Vm are the volumes
of the stationary and mobile phases, respectively, and f3 is the phase ratio of the column,
that is,
Vrn
59

Figure 4.1 shows a typical chromatogram and its characteristic features.
Signal
'0
I I I. , I
t I. .. I
Compound 1
fR1
"'2 I I I l'
Time
Sanple injection
Figure 4.1 A chromatogram with its characteristic features.
Here w is the peak width at the baseline and to is the dead time or retention time of an
unretained solute (i.e. the time required by the mobile phase to pass through the columns).
Hence the average linear flow velocity, ii can be calculated as
L if= (4.3)
where L is the column length. The retention time tr is the period between sample injection
and recording of the peak maximum while t'r is the net retention time. Two compounds
can be separated if they have different retention times. Figure 4.1 shows that
tr = to + t'r . (4.4)
60

The retention time of a solute is a function of mobile phase flow velocity and column
length. If the mobile phase is flowing slowly or if the column is long, then to is large and
hence so is I,. Therefore I, is not suitable for characterising a compound and instead, the
capacity factor, also known as the k' value is prefered:
k' = = (4.5)
The capacity factor is independent of the column length and mobile phase flow-rate
(provided that u does not exceed 5 cm S·I)
4.2.1 Column Efficiency
Efficiency is used to describe the potential separation capabilities of the chromatographic
system. The results are expressed in terms of theoretical plates (n), which can be thought
of as a certain number of separation stages. The more stages in a given separation, the
higher the column efficiency (n). There are several ways to calculate n from the
chromatogram. The most simple approach utilizes the retention time (t,) and the baseline
width (w).
(4.6)
As the column length (L) increases, n increases. In order to compare the efficiencies of
columns of different lengths, the height equivalent to a theoretical plate, HETP, is used
instead of n:
L HETP = (4.7)
n
61

4.2.2 Selectivity
The ease of separating two different components on a column is given by the selectivity,
a. It is calculated from the ratio of k' values and is always expressed as a number greater
than 1. .
a = (4.8.)
where k'j, and k'2 are the capacity factors of each component and k'2 is the capacity factor
of the later eluting component. Conceptually, a represents the spacing between peak
maxima. With a large a (wide spacing),components separate and as a approaches unity,
the peaks fuse.
In GC, selectivity is a result of the vapour pressure of the solute and intermolecular force
interactions with the stationary phase. In LC and SFC, the selectivity can also be affected
by interactions between solutes and the mobile phase. The interactions can either be by
dispersion, dipole-dipole or dipole-induced dipole. Dispersion interactions account for
separations based on differences in solute boiling points and sizes. Dipole-dipole
interactions account for separations of polar compounds on a polar stationary phase and
dipole-induced dipole interactions occur when dipolar solute molecules act as an electron
donor or electron acceptor.
4.2.3 Resolution
The basic equation defining the resolution (R), between any two compounds is:
211t R = ---- (4.9)
(Wb/ + Wb2)
In terms of the column efficiency, n, the selectivity, a , and the capacity factor, k', R is
given by:
R= (4 .10) 4
62

4.2.4 The van Deemter equation in Chromatography
A number of valuable concepts are embraced by the van Deemter equation (7), which
permits evaluation of the relative importance of a series of parameters on column
efficiency and relates H to the average mobile phase linear velocity u.
For packed columns
2Dm d p 2 ( 1 + 6k' + llk,] ) i1
H=2Adp +-- + ii 24Dm (1 + k,)2
(4.11)
where dp is the column packing particle diameter and A. is the eddy diffusion coefficient.
Dm is the diffusion coefficient of the solute in the mobile phase.
Simplifying the equation becomes
B H=A+ + Ca (4 .12)
11
The A term includes packing and multi-flowpath factors, B is the longitudinal diffusion
term and C is the resistance to mass transfer term. The A term can be influenced by
particle size, geometry and tightness of packing of the stationary phase in a packed column
while the B term arises from the tendency of molecules to migrate from the concentrated
central part of a band towards more dilute regions on either side and is directly
proportional to the rate of diffusion of the solute in the mobile phase and inversely
proportional to the linear velocity of the moblile phase. The above equation can also be
represented graphically in Fig':lre 4.2 which shows the effect of H with changes in mobile
phase linear velocity. Equation 4.12 represents a hyperbola that has a minimum at linear
velocity (uopt)
B 112
Uopt = (4.13) C
63

and a minimum H value (Hmin) at A + 2 (BC) 112. The constants may be graphically
calculated from an experimental plot of H versus mobile phase linear velocity as shown in
Figure 4.2. From this figure it can be seen that the A term (2Adp) is independent of mobile
phase linear velocity. The second term is a measure of the effect of molecular diffusion on
zone spreading and becomes significant at very low flow rates. The third term accounts
for resistance to mass transfer and this term becomes significant at higher mobile phase
linear velocities.
H
2Adp {
\ \ \ \ \ \ \ ",--\ --",
\ " \ ""
---~---- "" \ I __ , \ I ", ,-
8/ - \ ,-,--U \ ,--', Ca
--"'\ I -' , ~~-----~~~---------------------------."
A ' .......... I ... ----- _____________ ,.. ___ _
~------------~------------------------------------U, cmlsec
Figure 4.2 van Deemter plot
Change in H versus linear mobile phase velocity u. Hmin = A + (2BC)112; uopt = (B/C)1I2
64

Open tubular columns contain no packing and the A term becomes zero, reducing the van
Deemter equation to a form known as the Golay equation (8):
Wm d 2e (1 + 6k'+ Ilk,]) ii 2k'd 2
f U
H = + + (414)
U 96Dm ( 1 +k,)2 3( l+k'i2Ds
where df is the stationary phase film thickness, de is the column internal diameter and Ds is
the diffusion coefficient of the solute in the stationary phase. Simplifying, the equation
becomes:
B H= (4.15)
U
The C term results because of laminar flow through the open tube which gives rise to the
characteristic parabolic velocity profile over the tube cross section. Solutes in the centre
of the flow move faster than solutes near the wall. Failure of the solute to rapidly diffuse
in a radial direction tends to keep the solute distributed on streamlines of differing
velocity, thus broadening the peak. The Cs term is usually negligible if thin films are used
but can become appreciable if thick films are used. By differentiation of equation 4.15, it
can be seen that the optimum mobile phase velocity (i.e. the velocity that produces a
minimum value for H and maximum value for n) is:
B 112 4.2Dm
UOP1 = =--- (4.16.)
4.3 Theory of electrophoretic separation
Another technique receiving attention for the analysis of natural products is capillary
electrophoresis. It is a separation technique that has rapidly developed over the past few
years and has been widely applied to the analysis of macromolecules, amino acids, chiral
drugs, vitamins, inorganic acids, proteins and peptides (9).
65

Electrophoresis is defined as the different,ial movement of charged species by attraction or
repulsion in an electric field hence CE permits the rapid and efficient separations of
charged components present in small volumes. Separations are based on the differences in
electrophoretic mobilities of ions in elecrophoretic media inside small capillaries.
4.3.1 Background electrolyte
The electrophoresis buffer is of key importance in CE because its composition
fundamentally determines the migration behaviour of the analytes. A suitable electrolyte
must ensure the correct electrophoretic behaviour of all individual solutes, the overall
stability of the sytsem and satisfactory .separation of the analytes. A wide variety of :, "
electrolyte systems have been used in CEto effect the required separations. The majority
of these are aqueous buffers. Table 4.1 lists some commonly used buffers in CE.
Table 4.1 Commonly used buffers in CE (4).
* See list of abreviations
Buffer Useful pH range
Borate 8.24 - 10.24
Phosphate 1.12 - 3.12
Acetate 3.75 - 5.75
Phosphate 6.21-8.21
'le Zwitterionic buffers
MES 5.15-7.15
PIPES 5.80 - 7.80
HEPES 6.55 - 8.55
Tricine 7.15 - 9.15
Tris 7.30 - 9.30
66

The choice of the · electrolyte system in a CE separation involves consideration of many
fact9rs , such as the solubility and stability of the analytes in the electrolyte, the degree of
ionization of the analytes, the influence of the anions and cations present in the electrolyte
on the electromigration of the solutes, the effect of pH, the effects of organic modifiers
and other additives, and the dissipation of heat generated in the electrolyte during the
passage of the current
4.3.2 Instrumentation
The equipment consists of five units: the anode and the cathode reservoirs with the
corresponding electrodes, the separation capillary, the injection system and the detector.
The basic instrumental setup to accomplish capillary eietrophoresis is depicted in Figure
4.3 .
" C /
/ I
I I ,
~s E
HVPS
Figure 4.3 Basic Scheme of a CE instrument C = separation capillary;
E
E = electrolyte reservoirs with platinum electrodes S = sample vial D = detector R = signal recorder
67
~

A capillary tube filled with the buffer solution is placed between two buffer resevoirs. The
electric field is applied by means of a high voltage power supply which can generate
voItages up to 30 kV. Injection of the sample is performed by replacing one buffer
reservoir with the sample vial and a defined sample volume is introduced into the capillary
by either hydrodynamic flow or electromigration. An on-column ultraviolet absorbance
detector is located at the end of the capillary which is opposite to the injection side. If an
uncoated . open-tube fused silica capillary is used as the separation chamber, two
electrokinetic actions occur under the influence of the electric field . First electrophoresis
of the ions takes place, secondly, electroosmosis, which takes place due to the immovable
charge of the capillary walls being effective from the basic to the weak acid pH range.
Separation, however, is based solely on electrophoresis while electroosmosis causes a
liquid transport analogous to a mechanical pump. Because the electroosmosis flow in
aqueous solution is mostly directed toward the cathode, the sample is injected at the
anode. The sample components migrate with different migration velocities, depending on
their charge densities, towards the corresponding electrodes. They are all carried through
the detection system by the electroosmotic flow (EOF), which is higher than the migration
velocities of the ions.
4.3.3 Electrophoresis
Electrophoresis is the movement of charged particles in response to the applied field .
Upon the application of a constant electric field E (£ = VIL where V is the voltage applied
across the capillary of length L), ionic species undergo an electrostatic force, Fe, which is
proportional to the electric field strength and the charge (q) of the particular ion. This
electric force can be given by:
Fe=qE (4.17)
This force causes the acceleration of ions toward the oppositely charge electrode. As the
velocity of the ions increases, the counteracting frictional force (Ff ) caused by the
surrounding solution slows down the species. The frictional force (assuming a spherical
ion) can be expressed in terms of Stokes law as:
(4.18)
68

where 17 is the solution viscosity; r, the ion radius and v is the ion velocity.
After reaching a steady state, the ions move with a constant velocity (v) which is
proportional to the applied electric field and is given by
v = PeE (4.19)
where Pe is the electrophoretic mobility and is a characteristic property of a given
medium at a given temperature.
During electrophoresis:
(4.20)
hence: qE = 6mp1l (4.21)
Solving for velocity:
qE v=-- (4.22)
and substituting equation 4.22 into equation 4.19 yields an equation that describes the
electrophoretic mobility in terms of physical parameters:
q
Pe = (4.23)
6mp-
Hence small, highly charged species have high mobilities whereas large, minimally
charged species have low mobilities.
4.3.4 Electroosmosis and the electrical double layer
. Electroosmosis of ions is an important phenomenon in CE and originates from the
negative charges on the innerwall of the capillary tube. In uncoated fused silica
capillaries, an electric double layer is formed from the ionization of silanol groups present
on the surface of the capillary. The double layer (Figure 4.4) is generally explained using
the Gouy-Chapman model (11-14). According to this treatment, the double layer consists
of a fixed layer of negative charges and a positive part formed by a net excess of positive
69

ions in the background electrolyte. The cations are arranged in two layers, a fixed layer
(Stem layer) and a diffuse layer, and at a position just outside of the compact-diffuse
layer interface a plane of shear is established.
Surface or shear
Silica Stern / wall layer ~
Diffuse I layer
8 I I
8 cbG? 8 8 I I C\
I
I ,8 80 I \!J I
- ci2~ 80 10. I
~:8 ~ e:~ p
Bulk solution
Disunce from capillary wall
Figure 4.4 Double layer structure at a silica wall.
)
The potential at this boundary is known as the zeta potential, s. The potential in the
diffuse layer falls exponentially to zero. The negative charge on the capillary surface is
balanced by the positively charged layer of hydrated cations. Upon application of the
electric field, this layer begins to move toward the cathode and, owing to viscous drag,
transports the bulk liquid inside the capillary. The zeta potential (S), is given by the
Helmholtz equation:
4m]f.1e
s= (4.24)
70

where '7 is the viscosity, e is the dielectric constant of the solution, and J.le is the
electrophoretic mobility. The linear velocity, v, of the e1ectroosmotic flow is given by
v = --Et; (4.25 .)
The double layer is typically a very thin layer (up to several hundred nanometers) relative
to the radius of the capillary (typically 50-100 Ilm). Therefore, the electroosmotic flow
may be considered to originate at the walls of the capillary.
The magnitude of the zeta potential is determined by the surface charge on the capillary
wall. This charge is pH dependent; thus the magnitude of EOF varies with pH. At high
pH, the silanol groups are predominantly deprotonated and the EOF is much greater than
at low pH where the silanol goups become protonated. The EOF can vary by more than
an order of magnitude between pH 2 and 12. The pH and applied voltage have been
found to increase flow linearly. The zeta potential is also dependent on the ionic strength
of the buffer. Increased ionic strength leads to double layer compression, decreased zeta
potential and reduced EOF.
4.3.5 Efficiency
Efficiency is gauged by the number of theoretical plates generated by the column. In CE,
the number of theoretical plates is not dependent on the length of the column as in HPLC
or GC but rather on the applied voltage as expressed in equation 4.26 .
IlV N=-
2Dm
where ~l is the mobility and V is the applied voltage.
4.3.6 Flow Profile
(4.26)
An important feature of the electroosmotic flow is its velocity flow profile. In an
electrically driven system, the liquid flow caused by electroosmosis shows a plug profile
71

driving force is uniformly distributed along the capillary. Consequently, a uniform flow
velocity vector across the tube occurs. Unlike in pressure-driven flow system such as
HPLC, frictional forces at the liquid-solid boundaries cause a strong pressure drop across
the capillary. These forces result in a laminar or parabolic flow profile. As a consequence,
a cross-sectional velocity gradient occurs within the capillary resulting in a velocity profile
such that the velocity vector is highest in the middle of the tube and goes toward zero
approaching the walls. Hence zone broadening caused by the laminar flow profile in
HPLC is therefore negligible in CE. Figure 4.5 illustrates the velocity profiles of liquid
flowing in a capillary under the action of (a) electroosmosis and (b) hydrostatic pressure.
(a)
(b)
Figure 4.5 Velocity profiles of liquid flowing in a capillary under the action of (a) electroosmosis and (b) hydrostatic pressure.
72

4.3.7 Modes of capillary electrophoresis.
The versatility of CE is partially derived from its numerous modes of operation. The
separation mechanisms of each mode are different and thus can offer orthogonal and
complementary information. The basic methods encompassed by CE include capillary
zone electrophoresis (CZE), micellar electrokinetic capillary chromatography (MECC),
capillary gel electrophoresis (CGE), capillary isoelectric focusing (ClEF), and capillary
isotachophoresis (CITP). In this study MECC was used in the separation of the plant
extracts as a complementary technique to the other chromatographic methods employed
and is hence the only mode that is discussed further.
4.3.7.1 Micellar Electrokinetic Capillary Chromatography
Micellar electrokinetic chromatography (MECC) is a mode of CE in which surfactants are
added to the buffer solution. Surfactants are molecules which exhibit both hydrophobic
and hydrophilic character. They have polar "head" groups that can be cationic, anionic,
neutral, or zwitterionic and they have nonpolar, hydrocarbon tails. The formation of
micelles or "micellization" is a direct consequence of the "hydrophobic effect." The
surfactant molecules can self-aggregate if the surfactant concentration exceeds a certain
critical micelle concentration (CMC). The hydrocarbon tails will then be oriented toward
the center of the aggregated molecules, whereas the polar head groups point outward.
Micellar solutions may solubilize hydrophobic compounds which otherwise would be
insoluble in water. Every surfactant has a characteristic CMC and aggregation number,
i.e., the number of surfactant molecules making up a micelle. The size of the micelles is in
the range of 3 to 6 nm in diameter; therefore, micellar solutions exhibit properties of
homogeneous solutions.
4.3.7.2 Principles of separation in MECC
The separation principle of MECC is based on the differential partition of the solute
between the micelle and water. Figure 4.6 shows a schematic representation of the
principle ofMECC.
73

- e-v-
o-v-= Surfactant (negative charge)
- =-Solute
------------------------
____ "_> = Electroosmotic Flow
4 = Electrophoresis
Figure 4.6 Schematic representation of the separation principle ofMECC.
When an anionic surfactant such as sodium dodecyl sulfate (SDS) is employed, the micelle
migrates toward the positive electrode by electrophoresis. The electroosmotic flow
transports the bulk solution toward the negative electrode due to the negative charge on
the surface of fused silica. The electroosmotic flow (EOF) is normally stronger than the
electrophoretic migration of the micelle under neutral or alkaline conditions and, therefore,
the anionic micelle also travels towards the negative electrode at a retarded velocity.
When a neutral analyte is injected into the micelle solution, a fraction of it is incorporated
into the micelle and it migrates at the velocity of the micelle. The remaining fraction of the
analyte remains free from the micelle and migrates at the electroosmotic velocity" The
migration velocity of the analyte thus depends on the distribution coefficient between the
micelle and the non-micellar (aqueous) phase. The greater the percentage of analyte that
is distributed into the micelle, the slower it migrates. The analyte must migrate at a
velocity between the electroosmotic velocity and the velocity of the micelle, provided the
analyte is electrically neutral. In other words, the migration time of the analyte, t" is
74

limited between the migration time of the bulk solution, to , and that of the micelle, tme .
This is often referred to in the literature as the migration time window in MECC and is
illustrated clearly in Fi~ure 4.7. This technique, originally introduced by Terabe et at. in
1984, has been well applied to the separation of both neutral and ionic molecules present
in natural product matrices (15-19) .
(A) Micelle Solute Water
I I I inj. column del
Water Solute Micelle (8)
'------'~. ·~L..---_l ------.---..,.-------------r-+~ Time o
Figure 4.7 Schematic representation of the zone separation in MECC.
4.3.7.3 Theory of MECC
In the previous chromatographic techniques described, the capacity factor is obtained by
the use of equation 4.5. However in MECC, k' can be obtained by the following equation
(20):
k'=----- (4.27) to (1 - t,llme)
As tme becomes infinite (micellar phase becomes stationary), equation 4.27 reduces to the
analogous equations for conventional chromatography. The parameters to al!d tme are
75

experimentally determined by injecting methanol, which is assumed not to interact with the
micelles and Sudan III which is assumed to be fully· solubilised. , ,
Resolution in MECC is given by (21):
R= (4.28) 4 a
'----J
\ \ \ . Efficiency Selectivity Retention
where Cl is the separation factor given by k'2/k', . The differences between MECC and
conventional chromatography are accounted for in the last term of the equation. As tme
becomes infinite, the latter term equates to unity and results in an expression for resolution
that is identical to that of conventional chromatography.
In MECC fast efficient separations can be obtained because of three important
phenomena. First, the flat flow profile of the EOF does not require mass transfer in the
mobile phase across the capillary diameter. Secondly, fused silica capillaries dissipate heat
efficiently, thereby minimizing thermal effects. Thirdly, micelles are dynamic structures,
allowing for fast solute entrance/exit kinetics.
References
1.. V. Sewram, 1.1. Naif, D.A Mulholland and M.W. Raynof, 1. High Resolut.
Chromatogr., 18 (1995), 363.
2. AA Elujoba, AF. Fell and P.A Linley, 1. Pharm. Biomed. Anal., 9 (1991),711.
3. W.K. Modey, D.A Mulholland, H. Mohamed and M.W. Raynor, 1. Microcol.
Sep., 8 (1996), 67.
4. S-J, Sheu and C-F Lu, 1. High Resolut. Chromatogr., 19 (1996), 409.
5. C-T Chen and S-1. Sheu, 1. Chromatogr. A., 710 (1995),323 .
76

4. S-J, Sheu and C-F Lu, J. High Resolut. Chromatogr., 19 (1996), 409.
5. C-T Chen and S-J. Sheu,1. Chromatogr. A., 710 (1995),323 .
6. M.I. Gil, F. Ferreres and F.A. Tomas-Barbenin, 1. Liq. Chromatogr., 18 (1995),
3007.
7. J.1. van Deemter, F.J. Zuiderweg & A. Klinkenberg, Chem. Eng. Sci., 5 (1956),
27l.
8. MJ.E. Golay, In: Gas Chromatography, D.H. Desty (Ed.), Butterworths, London,
UK (1958), p.35.
9. D.N. Heiger, High Performance Capillary Electrophoresis, Hewlett Packard
Company, Waldbronn, Germany (1992), p.7.
4. D. N. Heiger, High Performance Capillary Electrophoresis- An Introduction,
Hewlett Packard, Waldbronn, Germany (1992), p.15.
1l. T.S. Stevens & H.1. Cortes, Anal. Chem., 55 (1983), 1365.
12 DJ. Shaw, Electrophoresis, Academic Press, London, UK (1969) p.29.
13 F. Foret and P. Bocek, Adv. Electrophoresis, 3 (1990), 272.
14. K. Solomon, D .S. Burgi and J.e. Helmer,1. Chromatogr., 559 (1991),69.
15. S-J. Sheu and C-F Lu, 1. High Resolut. Chromatogr., 19 (1996), 409.
16. M-W. Hsiao and S-T. Lin,1. Chromatogr. Sci., 35 (1997),259.
17. M.I. Gil, F. Ferreres and F.A. Tomas-Barberan, 1. liquid. Chromatogr., 18
(1995), 3007.
18. K-L. Li and S-J. Sheu, Anal. Chim. Acta, 313 (1995), 113 .
19. C-T. Shen and S-J. Sheu,1. Chromatogr., 710 (1995),323.
20. S. Terabe, K. Otsuka, K. Ichikawa, A. Tsuchiya and T. Ando, Anal. Chem., 56
(1984), Ill.
21 S. Terabe, K. Otsuka and T. Ando, Anal. Chem., 57 (1985), 834.
77

CHAPTERS
Experimental techniques
5.1 Introduction
This chapter describes the experimental details of the techniques employed for the
extraction and analysis of the plant extracts from Ekebergia capensis, Clivia miniata and
Grewia occidentalis and the individual components isolated. Both the off-line and on-line
bioassay techniques are discussed as well as the various chromatographic and
spectroscopic techniques used.
5.2 Plant material
Initially, when this project was initiated, fresh plant material of Ekebergia capensis
Sparrrn. was obtained from a patient attending the ante-natal clinic at King Edward VIII
hospital in May 1995. The identity of this plant was authenticated by comparison with a
reference specimen at the Natal Herbarium. Plant material of Grewia occidentalis L. and
Clivia miniata L. was obtained from the Silverglen Medicinal Plant Nursery (KwaZulu
Natal, SA). Thereafter, for further analysis, a second batch of all three plants was
obtained from the Medicinal Plant Nursery in November 1995. The wood of E. capensis,
G. occidentalis and C. miniata was debarked, finely ground and left to air dry for 72
hours. Due to the high moisture content of C. miniata the roots were initially dried and
then ground into a fine powder.
5.3 Preparation of crude aqueous extracts
Aqueous extracts of the plants were prepared by heating 6.0 g of milled plant material in
50 rnl distilled water for 30 minutes. The resulting decoction was filtered through a fluted
Whatman 542 filter paper (Whatman International Ltd, Maidstone, England, UK) and
freeze dried.
78

5.4 Off-line supercritical fluid extraction of plant components.
Initial SFE studies were performed on a home assembled SFE system. The SFE apparatus
comprised of a Lee Scientific Series 501 syringe pump (Dionex, Sunnyvale, CA, USA)
controlled by Lee Scientific software and a Perkin-Elmer Sigma chromatographic oven
(Perkin Elmer, Norwalk, Connecticut, USA) to house the extraction cell (Figure 5.1). A
simple schematic diagram is shown in Figure 2.4.
Figure 5.1 Photograph of the home assembled SFE system.
5.4.1 Pump
The syringe pump (Figure 5.2) had a cylinder capacity of 150 ml and could deliver a fluid
up to 400 atm in pressure. An electronically-actuated valve within the pump was switched
so as to connect the pump cylinder with either the gas cylinder or the extraction vessel.
Direct introduction of a liquid from a high pressure tank into a cooled pump cylinder head
was the recommended method for filling the pump with CO2. It is usually necessary to
cool the pump head when working with eluents that are gaseous at ambient temperatures.
79

Cooling reduces the tendency of the liquid eluent to undergo gasification in the pump head
and also enhances the pumping efficiency. As an added advantage, cooling results in a
maximum fill of the pump cylinder. The pump cylinder jacket was therefore cooled by
circulating cold water at 5 °C around it. This cold water was generated by a cooling unit
(Grant Inst., Cambridge, UK). A piece of rubber tubing was connected from the outlet of
the water bath to the 114 inch brass bulkhead fitting on the pump labelled coolant inlet.
Another piece of rubber tubing was connected from the coolent outlet bulkhead fitting on
the pump back to the inlet of the water bath to ensure the constant flow of the cooling
solvent around the pump cylinder jacket. Both the pump cylinder jacket and the coolant
transfer lines were insulated using a cut-to-fit polymer foam material. This step was
essential to prevent excessive air moisture condensation and loss of cooling efficiency.
3-wayvalve
. inlet - ===t:::-... ...-: 'F== outlet
cylinder
piston
ball screw & nut
computer/controller
stepper motor
Figure 5.2 Schematic diagram ofa syringe pump (1).
80

5.4.2 Plumbing
The plumbing was accomplished as follows: A 1.5 m x 1116 inch o.d. stainless steel tube
soldered onto a 10 cm x 1/8 inch o.d. tubing was used to connect the high pressure tank
containing SFE/SFC grade liquid CO2 (Air products and Chemicals Inc., Allentown, PA
USA) to the 1116 inch bulkhead fitting labelled gas source at the back of the series 501
pump. The ends of the stainless steel tubing were pushed through (A) a 1116 inch
swagelok nut and a 1116 inch stainless steel Swagelok ferrule (Swagelok Co. , Solon, OH,
USA) at the end for connection to the pump, and (B) a 118 inch swagelok nut and a 118
inch brass swagelok ferrule at the end to the high pressure CO2 tank. Both ends were
connected to the pump and tank respectively. A piece of 1116 inch o.d. stainless steel
tubing with 1116 inch nuts and ferrules fitted at both ends were connected from the 1/16
inch bulkhead on the pump labelled carrier fluid to a 4-port valve (Valco Inst., TX, USA)
fixed outside the GC oven. This served as an on/off valve to control the entry of the fluid
into the extraction vessel. A short piece of 1/16 inch o.d. stainless steel tubing was again
connected from the 4-port valve to the extraction vessel housed in the GC oven. Finally,
the outlet of the extraction vessel was connected to a high pressure 2-way valve (Supe\co,
Bellefonte, P A, USA) placed outside the oven. This served to control extractions either in
the static or dynamic mode. A 20 cm x 50 IJ.m i.d. deactivated fused silica capillary (SGE,
Australia) was placed on the outlet of the 2-way high pressure valve for fluid
decompression and also as a back pressure regulator. One end of the capillary was
threaded through a short 1116 inch o.d. polyetheretherketone (PEEK) sleeve (Upchurch
Scientific, Washington, USA) which was pushed through a 1116 inch nut and stainless
steel ferrule in that order before connecting that 2-way pressure valve. The end of the
capillary restrictor was immersed into 15 rnl methanol (BDH Laboratory Supplies, Poole,
England) contained in a round bottom flask for trapping of the extracted anal)rtes.
5.4.3 Extraction vessels
Two stainless steel commercially available extraction vessels (Keystone Scientific,
Bellefonte, P A, USA) were used in this study. One vessel had a volume of 24 ml while
the other a volume of 10 rnI. Figure 5.3 below shows a diagram of a 24 rnl vessel with
81

high pressure end caps. Both end caps were fitted and sealed manually and housed a 5 Jlm
bed support and a spring-loaded polytetrafluoroethylene (PTFE) cap seals. The vessels
had a maximum pressure rating of 666 atm (10 000 psi).
BED SUPPORT HIGH
PRESSURE FITTING
MALE FITTING
Figure 5.3 A diagram of a commercially available stainless steel extraction vessel with fingertight end caps. (2)
5.4.4 Extraction parameters
Total extractions were performed on the dry milled samples at 400 atm and 80°C. The
samples were spiked with 2 mol % H20 as modifier to increase the solvating power of
supercritical C02. The plant samples were packed tightly into the extraction vessel to
reduce the vessel void volume. The masses of the plant samples varied due to the particle
size of the material and will hence be given in the later chapters when discussed
individually. The vessel was placed horizontally in the oven and the extraction performed
for 50 minutes static period followed by a 20 minute dynamic extraction period. Although
this orientation of the vessel is generally not recommended, it was not possible to keep the
the vessel vertical due to the dimensions of the oven. Supercritical fluid fractionation was
also performed to decrease the complexity of the total extract. Sequential extracts were
thus obtained by simply increasing the pressure at constant temperature while performing
extractions on the same sample.
82

5.5 Uterotonic bioassay
A schematic diagram of the bioassay setup is seen in Figure 5.4. Mature non-pregnant
guinea pigs were obtained from the Biomedical Resource Centre, University of Durban
Westville (KwaZulu-Natal, RSA). 20% pentobarbitone (Maybaker, Port Elizabeth, RSA)
was administered intramusculariy as an anaesthetic, at a dose of 0.2 glkg. The uterus was
removed by a midline incision into the lower abdominal cavity and washed immediately in
Tyrodes solution at 4°C. The bioassay was performed by placing a 2 cm longitudinal strip
of uterine muscle into the muscle bath containing 10 ml Tyrodes solution maintained at
37°C. The lower end of the muscle was fixed to a glass capillary tube while the upper end
was suspended by a thread attached to a Harvard 386 smooth muscle isotonic transducer
(Harvard Apparatus Company, Inc., Massachussets, USA) which transformed the change
in muscle length into a proportional electrical signal. A continuous supply of 95% O2 and
5% CO2 (MG Fedgas, Durban, RSA) was administered through the glass capillary tube at
a flow rate of 60 mlImin to provide tissue oxygenation and act as a suitable buffer. This
signal was recorded using an electrically driven Beckmann R511 A chart recorder
(Beckman, Inc., Illinois, USA) at a chart speed of 0.05 mm1sec. Caution was exercised in
ensuring that the lumen of the uterus remained open at both ends during the assay. 0-
Acetylcholine hydrochloride (ACh) (BDH Chemicals, England, UK) was used as a
standard smooth muscle stimulant at a concentration of 1 IlglIOO Ill. The extracts were
dissolved in 0.9% sodium chloride (Sabax Ltd, Johannesburg, RSA) at known
concentrations and dispensed into the muscle bath using Eppendorf pipets. Physiological
fluid (Tyrodes solution) was prepared by dissolving 2.70 mmol KCI, 1.05 mmol
MgCh.6H20, 0.40 mmol NaH2P04, 1.80 mmol CaCh, 137.00 mmol NaCl, 11.90 mmol
NaHC03 and 5.60 mmol o-glucose in distilled water.
83

thread attached to __ isotonic transducer
polypropylene bath containing Tyrodes __ solution
o water bath (37 C)
strip of uterine smooth muscle
lumen -I-----+--I:::~
fixed thread -I----~
917 caPilla~ inlet for COl. and ~
electrical "pen recorder
Figure 5.4 Schematic diagram of the uterotonic bioassay setup used to monitor muscle activity.
84

5.6 On-line SFE-Bioassay.
The schematic diagram of the on-line SFE-bioassay setup is shown in Figure 5.5. SFE
was performed using a Lee Scientific series 600 SFC pump (Dionex, Sunnyvale, CA,
USA) to deliver the SFE fluid, and the series 600 SFC/GC oven to house the extraction
vessel. A 24 ml stainless steel extraction vessel (Keystone Scientific; Bellefonte, P A) was
housed vertically in the oven maintained at 80°C. A Lee Scientific supercritical fluid
extraction injection accessory controlled the passage of CO2 to and from the extraction
vessel. This consisted of a temperature controlled block maintained at the same
temperature as the oven and a multi port valve which enabled switching between dynamic
and static modes of extraction. As shown by the schematic diagram of the system in
Figure 5.6, fluid from the pump was intially allowed to pass through onloffvalve VI into
the extraction vessel, while keeping the vent valve at position 10 closed, and the multiport
valve in the static mode. This allowed the vessel to pressurise to the required pressure,
hence allowing static extraction to proceed for 50 minutes. The multiport valve was
thereafter switched from position 9 to position 8 thereby linking ports 1 and 2 to facilitate
dynamic extraction. The 1/16 inch stainless steel tubing connected to port 2 was redirected
back into the oven in an attempt to maintain constant temperature during transport of the
extracted analytes. Upon exit from the oven, the fluid passed through a 50 !lm tapered
restrictor (SGE; Australia) and decompressed into the muscle bath at a flow of 18 mllmin
at 150 atm (Figure 5.5).
85

00 0\
pump
\ cOtcarrier line
compute~ 0 port valve
vent
0 1\
restrictor heating block
oven
50pm tapered restrictor
extradion vessel
extract' collection chamber
thread attached to -isotonic transducer
glass capillary
forbOgen inlet I. ~.
polypropylene bath containing Tyrodes solution strip of uterine 'smooth muscle
water bath (37 DC)
t Tyrodes outlet
electrical pen recorder
Figure 5.5 Schematic diagram of the on-line SFE-bioassay setup

00 -....l
Fluid from pump
dynamic 8:.·.·. · ...... . . . . . .
static
oven
4
3
extraction vesssel
V2
Figure 5.6 Plumbing schematic of the multiport valve used for switching between static and dynamic modes of extraction.
V1

SFC grade CO2 (Air products and Chemicals; Allentown, PA) was used as the extraction
fluid. Each plant sample was tightly packed into the extraction vessel and 200 III H20
added to the matrix. Extraction was carried out at 400 atm and 80 QC for 50 minutes
static followed by a 20 minute dynamic extraction period. Further, SFE fractions were
obtained by sequentially increasing the pressure at constant temperature and modifier
concentration. Extractions were performed at 200, 300 and 400 atm respectively. After
the 20 minute dynamic extraction period for each sample, the multiport valve was
switched back to the static mode (port 9) followed by closure of valve VI (Figure 5.5).
Valve V2 was thereafter opened allowing pure CO2 of the same density as the extracting
fluid, to flow through ports 3 and 2. This procedure enabled flushing and cleansing of the
1/16 inch transfer line as well as the tapered restrictor, thereby eliminating the possibility
of memory effects during analysis. The vessel was simultaneously vented through port
10. The bioassay was performed as described in section 5.4, however modifications to
the Tyrodes solution as well as the muscle bath were carried out to alleviate the side
effects of excess CO2• These are discussed in chapter 8.
88

5.7 Muscle bath construction.
5.7.1 Muscle bath A
Muscle baths were constructed in house from 10 ml polypropylene syringes (T erumo
Corporation, Tokyo, Japan) . The first bath was designed for horizontal flow of CO2
directly into the muscle bath. This was accomplished by attaching a 10 cm length of
PEEK tubing (Up church Scientific, Washington, USA) from the wall of the polypropylene
syringe to the wall of the Perspex water bath (Figure 5.7). The restrictor passed through
the PEEK tubing until it protuded into the muscle bath.
PEEK tubing ~
25 ).lm i.d~d restrictor
~ isotonic transducer
Figure 5.7 Polypropylene muscle bath designed for horizontal flow of CO2 with direct introduction into the muscle bath.
89

5.7.2 Muscle bath B
A second bath was designed for vertical flow of CO2 due to failure of the first horizontal
flow bath to perform efficiently. The reasons for this are discussed in Chapter 8. This
second bath consisted of a second chamber of 6 ml capacity called the extract collection
chamber, linked via a detachable side arm to the muscle bath (Figure 5.8). The extract
collection chamber functioned as a CO2 reduction interface with extractions performed
directly into this chamber while the muscle remained in the muscle bath. The muscle bath
was filled with Tyrodes solution by upward displacement until the level of Tyrodes in the
extract collection chamber had reached a volume of 4 ml.
extract collection chamber (COzreduction interface) t
------
~. t· d ISO OnlC trans ucer
carbogen inlet
\ r;:::::===~
strip of uterine muscle
Figure 5.8 Polypropylene muscle bath designed for vertical flow of CO2 with direct introduction into a CO2 reduction interface.
90

5.8 Tapered restrictor fabrication.
The end of a length of 25 J.lm and 50 J.lm i. d. deactivated capillary tubing (SGE; Australia)
was held in the tip of a bunsen burner flame. Tension was applied by hand on both sides
of the heated area. As the fused silica melted, the capillary was pulled to a hair like taper
and removed from the flame (Figure 5.9). The restrictor orifice was thereafter adjusted by
cutting back the taper and measuring the gaseous flow rate at room temperature and at a
pressure of 150 atm (3).
1.
3.
4.
poIyimide resin
:6::::2:: =:::O:>l:.=======7==(~)---"--J , capillary sleeve
t cured poIyimide resin
Figure 5.9 Schematic steps showing the preparation of a tapered capillary restrictor. (1) a mico-Bunsen burner is used for localized heating of the capillary. (2) tension is applied and the capillary pulled to a hair like taper. (3) polyimide resin is applied to the taper which is subsequently positioned
with a capillary sleeve. (4) the resin cures and glues the taper to part of the inner wall of the sleeve .. (3)
91

5.9 pH measurements of Tyrodes solution.
The effects of CO2 on the pH of Tyrodes solution was monitored by using the pH meter
300 (Zeiss, W. Germany) with a combination pH electrode (Beckmann Instr. CA, USA).
The instrument was calibrated with pH 7 and pH 4 buffer solutions supplied by Beckman
Instruments (Fullerton, ·CA, USA).
5.10 Isolation and structural elucidation of plant components
5.10.1 Column Chromatography
Exhaustive supercritical fluid extractions of the plant samples were performed into
methanol using the 24 ml extraction vessel until subsequent extractions yielded no further
extractables. Column chromatography was thereafter performed repeatedly in order to
separate and purify the compounds present in the extracts. The length and diameter of the
columns as well as the particle size of the stationary phase had to be varied in order to
optimize resolution of the compounds.
Initially, use was made of a 50 cm x 5 cm i.d. glass column packed with silica gel 60
(0,2-0,5 mm particle size, 35-20 mesh ASTM, Merck Art 7734, Merck Chemicals,
Darmstadt, Germany), with gravity elution. This was followed by the use of gravity
columns (50 cm x 3.5 cm) packed with silica gel 60 (0,040-0,053 mm particle size 230-
400 mesh ASTM, Merck Art. 9385, Merck Chemicals, Darmstadt, Germany). In certain
cases, flash chromatography was found useful for the speedy separation of mixtures. The
latter technique involved the use of pressure in order to elute the various fractions from
the column. The flow rate was maintained at approximately 60 mlfrnin for flash
chromatography.
5.10.2 Thin layer chromatography
Thin layer chromatography was conducted on the crude extracts and the various fractions
collected, using pre-coated 0,2 mm thick aluminium-backed silica gel 60 TLC plate
(Merck Art 5553, Merck Chemicals, Darmstadt, Germany). The spots on the plates were
visualised by spraying with a reagent comprising anisaldehyde (Fluka Chemicals; Buchs,
92

Switzerland), concentrated sulphuric acid (BDH Chemicals, England, UK) and methanol
(polychem Supplies, Durban, RSA) in the ratio 1.25: 2.5 : 96.25 . Coloured spots were
observed after heating the plates with a heatgun.
5.11. Spectroscopic techniques
5.11.1 IH and I3C NMR spectroscopy
All IH NNfR, l3C NMR and 2-dimensional NMR spectra were recorded at room
temperature on a Varian Gemini 300 MHz spectrometer (Varian Instruments, Palo Alto,
California, USA). The solvents used were deuteriochloroform (CDCh) and
deuteriomethanol (Merck Chemicals, Darmstadt, Germany) and all 6 values were relative
toTMS.
5.11.2 Infrared Spectroscopy
The samples were prepared on KBr discs and infrared spectra recorded on a Mattson 2020
Galaxy series FTIR spectrophotometer (Mattson Instruments, Inc., Madison, USA). The
samples were dissolved in dichloromethane (Saarchem Holpro, Krugersdorp, RSA) and
added dropwise onto the surface of the KBr disk (FTIR grade, Sigma-Aldrich S.A. (Pty)
Ltd, Midrand, RSA). The solvent was allowed to evaporate off, leaving a thin film of
sample on the disk for analysis. The data was acquired using the Mattson software
(copyrighted 1989).
5.11.3 High Resolution Mass Spectrometry
High resolution mass spectra at the recorded at the Cape Technikon on VG 70E WRM
spectrometer while mass measurements were performed on a Kratos High Resolution MS
9/50 mass spectrometer by Dr P. Boshoff The voltage of the ion source was maintained
at 70 eY.
93

5.11.4 Acetylation of compound 4 from Ekebergia capensis Sparrm.
Compound 4 (2 mg) was dissolved in pyridine (1 ml) (Holpro Analytics, Midrand, RSA)
and the solution gently warmed on a steam bath. Acetic anhydride (1 ml) (Saarchem
(Pty). Ltd, Muldersdrift, RSA) was then added to the solution, which was stirred and left
to stand overnight at room temperature. Thereafter methanol (10 ml) was added to
hydrolyse the residual anhydride. Two portions of toluene (each 10 ml) (BDH Chemicals
Ltd, Poole, England) were then added to the mixture and successively removed under
reduced pressure in order to remove traces of pyridine. The residual toluene was
removed under reduced pressure by the addition of aliquots of methanol (each 10 ml).
5.12 Chromatographic and electrophoretic analysis of the plant extracts
5.12.1 High performance liquid chromatography.
HPLC was carried out using a Hewlett Packard HP 1090 liquid chromatograph equipped
with dual pumps, a Model 7010 sample injection valve, an automatic injector capable of
injecting up to 25 Jll and a UV photodiode array detector (Hewlett Packard, Waldbronn,
Germany). A 50 JlI aliquot of a solution of the extract dissolved into methanol was
injected onto' a Bondclone-lO C18 reverse phase column packed with 5 Jlm particles (300
x 3.9 mm i.d., Phenomenex, Torrance, CA, USA). A 70 x 3.9 mm guard column packed
with 5 Jlm C18 packing (phenomenex, Torrance, CA, USA) was inserted between the
solvent delivery system and the column to increase column lifetime and ensure that
contaminants did not interfere with analyses. Solvents were made up from HPLC grade
solvents and Milli_Q50 water and filtered through Millipore 0.45 Jlm RV organic-aqueous
compatible filters. All solvents were degassed with helium prior to use. Columns were
washed with methanol after runs and stored in methanol. All injections were performed
through the automatic injector.
A UV photodiode array (PDA) detector was used and the absorbance measured at 280
nm. The PDA detector was used to scan the entire UV wavelength region and 280 nm
was found to be the optimum wavelength at which most of the eluting compounds were
detected. The mobile phase was composed of both water (A) and methanol (B) at varied
94
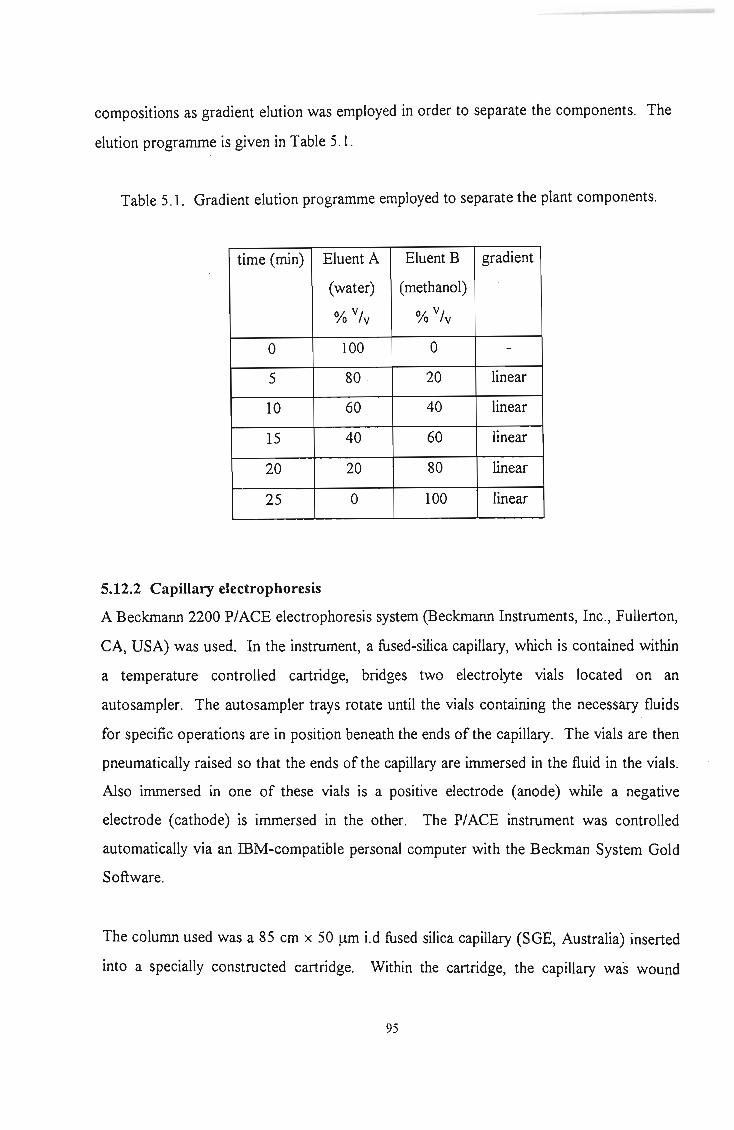
compositions as gradient elution was employed in order to separate the components. The
elution programme is given in Table 5.1.
Table 5.1. Gradient elution programme employed to separate the plant components.
time (min) Eluent A Eluent B gradient
(water) (methanol)
% vlv % vlv
0 100 0 -
5 80 20 linear
10 60 40 linear
15 40 60 linear
20 20 80 linear
25 0 100 linear
5.12.2 Capillary electrophoresis
A Beckmann 2200 PlACE electrophoresis system (Beckmann Instruments, Inc., Fullerton,
CA, USA) was used. In the instrument, a fused-silica capillary, which is contained within
a temperature controlled cartridge, bridges two electrolyte vials located on an
autosampler. The autosampler trays rotate until the vials containing the necessary fluids
for specific operations are in position beneath the ends of the capillary. The vials are then
pneumatically raised so that the ends of the capillary are immersed in the fluid in the vials.
Also immersed in one of these vials is a positive electrode (anode) while a negative
electrode (cathode) is immersed in the other. The PlACE instrument was controlled
automatically via an mM-compatible personal computer with the Beckman System Gold
Software.
The column used was a 85 cm x 50 /.lm i.d fused silica capillary (SGE, Australia) inserted
into a specially constructed cartridge. Within the cartridge, the capillary was wound
95

around a mandrel a number of times depending on its length (Figure 5.10). The effective
length of the column was 75 cm and the polyimide coating was removed by heating over a
bunsen flame leaving an optically transparent window. This window was fastened to an
aperture and to the housing itself so that it was permanently aligned with an opening in the
housing for use with the detector optics. PI ACE capillary cartridge coolant (a
fluoroorganic fluid) flowed through the cartridge via two openings in the bottom of the
housing (located between the ends of the capillary). This fluid circulated around the
capillary within the cartridge and maintained a preset temperature (25°C) through
convective heat removal. The cartridge was inserted into the rear of the autosampler. A
variable wavelength detector was used to monitor the complexity of the extracts.
Components from Ekebergia capensis and Clivia miniata were monitored at 280 nm
while that of Grewia occidentalis monitored at 254 nm. Other detection wavelengths
could be obtained by changing the filter.
Mandrel
Figure 5.10 Interior of the capillary cartridge. (4)
96

The column was pressure rinsed with 0.1 M NaOH for 1 minute before being rinsed with
the running buffer for another minute. Samples were prepared in methanol and introduced
onto the column by pressure injection for 1 second. The column ends were then
automatically placed back into the buffer vials and a voltage of 20 kV was applied. The
run time was set at 40 minutes but could be stopped manually when necessary. At the end
of each day the column was first pressure rinsed with 0.1 M NaOH followed by a rinse
with water for 5 minutes each respectively. This ensured that there was no buffer present
in the capillary which could crystallize out and hence block the capillary column.
5.12.2.1 Buffer preparation
The analysis of E. capensis was performed using 20 mM Na2B407.1 OH20 (BDH
Chemicals Ltd, Poole, England, UK) and 120 mM sodium cholate (Sigma Chemicals, St.
Louis, MO, USA). Extracts of G. occidentalis were analysed with 20 mM
Na2B407.10H20 (BDH Chemicals Ltd, Poole, England, UK) and 100 mM sodium cholate
(Sigma Chemicals, St. Louis, MO, USA). The extracts of C. miniata were analysed using
30 mM dt-sodium phosphate buffer (BDH Chemicals Ltd, Poole, England, UK) with 120
mM sodium cholate (Sigma Chemicals, St. Louis, MO, USA). All buffers were prepared
in deionised water and ultrasonicated for 10 minutes to remove any dissolved air and then
subsequently cooled to room temperature. The buffers were filtered prior to use by
passage through a 0.2 mm syringe filter (Lida, Kenosha, WI, USA).
5.12.2.2. Sample preparation and injection
All samples were prepared in methanol and filtered through a synnge filter (Lida,
Kenosha, WI, USA) prior to injection onto the capillary. The samples were placed in
microvials (Beckmann Instruments, Inc., Fullerton, CA, USA) making possible the
injection of sample in the micoliter scale (Figure 5.11).
97

• ..
..
rubber cap
sample
microvial
spring
glass vial with water
Figure 5.11 Assembly for sample-injection in the microliter scale. (4)
98

5.12.3 Supercritical fluid Chromatography
In this work, packed capillary SFC analysis was carried out on a Lee Scientific Series 600
supercritical fluid chromatograph with a Series 600 Controller interfaced with a Varian
4270 integrator. CO2 (Air Products and Chemicals, Allentown, PA) and HFC-134a (lCI
Fluorochemicals, New Castle, USA) was evaluated as mobile phases using two separate
pumps to avoid contamination of the mobile phases.
The density of the mobile phase was controlled by alSO ml syringe pump equipped with a
refrigeration unit. The pressurised fluid was delivered from the pump to a Valco C14W
microvalve injector (Valco Instruments, USA) which was a pneumatically actuated timed
split injector. The injection valve was fitted with a 200 nl internal sample rotor and set up
for time-split injection by installing precoloumn directly into the injection valve (Figure
5.12). Initiation via an electronic signal caused the valve to be switched rapidly (in the
order of milliseconds) from the load to the inject position and back again. Helium was
used to power the actuator because the fast valve action requires a low viscosity gas. Due
to the speed of the valve switching action, only a portion of the loop contents (-50 nL)
was transferred onto the column by a mobile phase, the rest of the sample remaining in the
injection loop. Therefore, injection volumes could be easily altered by increasing or
decreasing the time of injection. The injector was cooled to 5 °C with a cooling jacket.
Valve body
Rotor Pre-load 'assembly
Figure 5.12 Schematic diagram of injection valve for SFC (5).
99

A 30 cm x 50 ~m i.d. fused silica tubing was connected between the injector and the
packed column. This so called precolumn functioned as a retention gap. A 30 cm x 100
~m Ld. column packed with 5 ~m ODS-2 was used to investigate the complexity of the
extracts. The column was housed inside the oven, with one end leading from the
precolumn and the other end connected to a 70 cm x 50 ~m fused silica capillary. This
capillary acted as a transfer line to a Spectra-Physics UVIOOO variable wavelength UV
detector (Spectrasystem, San Jose, CA, USA). A transparent window was formed as
described in section 5.11.2 and mounted to the detector optics to facilitate detection of the
compounds that they passed through the transfer line. The end of the transfer line was
then connected to a 20 cm x 10 ~m i.d. linear restrictor with a flow between l.20 and
1.50 mlImin at 150 atm at room temperature. All connections were made via a SGE
minimum dead volume butt connector (SGE, Australia) which consisted of a stainless steel
screw-tightened assembly (Figure 5.13). The linear restrictor was directed into the heated
block (325°C) of the FID to prevent restrictor blockages.
butt capillary connector
Slee.~ ! LI_ LJ.~
'i
capillary c olumn~~=======rQ=~·-===:ll"==~==:::;~;;;;U:::::;:=======re=s=tn=·=ct=or
graphite ferrule
Figure 5.13 Schematic diagram of butt-connection of column to restrictor
100

Before use, the SFC pump was filled with CO2 using the pump "fill" function. Once the
required amount was present in the pump, the pump valve function was switched to
"carrier" which directed the flow to the column. The CO2 from one filling could easily
last several days if the pump pressure was maintained when not in use. The required
operating method for the analysis was programmed into the Series 600 controller. This
involved setting the oven temperature, detector temperature, pump conditions and the
duration of inj ection.
Once the system had stabilized and was ready for use, the required operating method was
loaded. An excess of analyte was injected into the loop using a Unimetrics blunt-tipped
50 /ll syringe, and at the electronic prompt the injector was fired and the integrator
activated manually. At the end of the analysis, the SFC was returned to its original
position in readiness for next analysis.
5.13 Column packing
Packed capillary columns with ODS-2 were prepared using supercritical fluid CO2 by a
method outlined by Bartle et al. in 1994 (6). A schematic diagram of the packing system
is shown in Figure 5.14. A Lee Scientific Series 600 syringe pump was used to deliver
the CO2 to the column via the packing reservoir. The reservoir was a 6 cm x 1/8 inch
stainless steel tubing with a stainless steel frit (pore size < 0.2 /lm) mounted in the inlet
union. The reservoir was connected to a length of fused silica capillary tubing via a
reduction union. An appropriate amount of packing material depending on the length of
the column was placed into the reservoir. A porous ceramic frit, as discussed in section
5.14, was made at the exit end of the column and this was connected to a linear restrictor
(15 cm x 10 /lm i.d. fused silica capillary). The column tubing and the restrictor were
placed under water in an ultrasonic bath. Liquid carbon dioxide was introduced by
opening the high pressure valves, VI and V2. The column was sonicated during the
whole packing process, and the temperature of the water was maintained at approximately
50°C. The carbon dioxide in the reservoir and in the section of the column above the
water was in the liquid state. This aided the dispersion of the packing material.
101

However, the carbon dioxide flowing through the section of the column beneath the water
was in the supercritical fluid state with consequent faster velocity and lower viscosity
than in the liquid state. Slow pressure programming was used during the packing
procedure. After the packing bed in the column had grown to the required length, the
packing pressure was kept constant for approximately 30 minutes at 300 atm before
cessation of sonication and depressurization. Sudden depressurization was avoided, since
this causes backfilling of the packing material or break up of the packed bed resulting in a
significant decrease in column efficiency. The pressure was slowly reduced to 80 atm at
a rate of 3 atmlmin. Valves VI and V2 were thereafter closed. The restrictor was
removed once the column was taken out of the water bath. The column was left
overnight so that the pressure drop across the column fell to zero. At this point, no
bubbles were observed coming from the end of the column. A porous ceramic frit was
finally made at the inlet of the column to hold the packing material in place.
vent
valve V2 valve VI
on/off valve
reservoir
ultrasonic ba t h
column
warm water \ Pump
restrictor
Figure 5.14 Schematic diagram of the supercritical fluid CO2
packing system. (6)
102

5.14 Preparation of porous ceramic frits
Porous ceramic frits were prepared from potassium silicate. A few drops of 20 %
potassium silicate was added to solid silica of 5 mm particle size to form a paste. The
paste was then pressed 0.2 - 0.33 mm into the capillary. The capillary was then heated
over a bunsen flame and the silica paste sintered as a result of the high temperature to
form a porous frit.
5.15 GC-MS Analysis of Clivia miniata L.
The fatty acid fraction of C. miniata was analysed using a Hewlett Packard (HP) 5890
series Gas Chromatograph with an HP 5971 Series Mass selective detector (electron
impact) (Hewlett Packard, Waldbronn, Germany) controlled by an HP Vectra 486/33N
computer. The column used was a HP-5 M.S. (Crosslinked 5 % phenylmethyl silicone)
(Hewlett Packard, Waldbronn, Germany), 25 m x 250 J..lm i.d. capillary column with a film
thickness of 0.25 J..lm. All injections were performed with an SGE syringe (SGE,
Australia) with the injector in the splitless mode. Helium was used as the mobile phase at
a flow 0.5 mlImin (6.43 psi). The following conditions were used:
Solvent delay: 3.00 minutes
EM Voltage: 70 eV
Inlet temperature: 150 QC
Initial inlet pressure: 21. 0 psi
Detector temperature: 280 QC
A temperature programme was executed as follows:
An initial oven temperature of 150°C that was held for two minutes. Thereafter, a
temperature ramp of 7 QC/min was irutiated to a temperature of 180 QC. After a hold time
of 10 minutes at this temperature, the ramp was continued at 7 QC/min to a final
temperature of250 QC. The final hold time was 20 minutes.
103

5.16 Esterification of fatty acid mixture
Since the free fatty acids are highly polar, they often have great difficulty in eluting from a
GC column. Hence, the methyl esters of these fatty acids have to be formed so that
analysis could be made possible. The fatty acid mixture was esterified as follows:
The esterification mixture was made by mixing methanol (10 rnI), chloroform (10 rnI) and
concentrated sulphuric acid (0.1 rnI) in a beaker. The sample (20 mg) was placed in a
small test tube and to it the esterification mixture added to make the tube 3/4 full . The
sample was mixed well with the reaction mixture and placed in the bomb. The bomb in
turn was placed in a heatable block that was preheated to 170°C. An empty tin was
inverted and placed over the bomb to contain possible explosions. The sample was left in
the heated block for 20 minutes. The bomb was thereafter removed from the heated block
and allowed to cool to room temperature. The test tube was removed and the contents
washed several times with water. All the washings were discarded and the chloroform
solution of the methyl esters were transferred into a clean test tube. The solution was
finally placed on the heated block together with the passage of air into it until the solution
became clear. The solution now consisted of the methyl esters that were ready for
injection into the GC (7).
5.17 Identification of active components and assessment of mode of action
The compounds isolated from the three plant extracts were further subjected to in vitro
screening as described in section 5.5 and the uterotonic compounds identified. An
assessment on the mode of action of the active compounds was carried out by the use of
two receptor agonists and antagonists. Bradykinin (Sigma Chemicals, St. Louis, MO,
USA) was used as the standard B2 receptor agonist while acetylcholine (BDH Chemicals,
England, UK) was used as the cholinergic receptor agonist. The biological activity of the
compounds were assessed both before and after addition of the receptor blockers. HOE
140 (a peptide antagonist) (Sigma Chemicals, St. Louis, MO, USA) was used as the B2
receptor blocker while atropine (Sigma Chemicals, St. Louis, MO, USA) was used as the
cholinergic blocking agent. Bradykinin and acetylcholine were prepared to a final
concentration of30 ng/100 III and I 1lg/100 III respectively while HOE 140 and 'atropine
104

were made to a final concentration of 1000 1lg/100 III and 60 1lg/100 III respectively.
Accurate doses were dispensed into the muscle bath using Eppendorf pipettes. The plant
compounds were dissolved in 0.9% saline and in 1 % DMSO solution and administered to
the strips of uterine muscle accordingly as described in chapter 12.
5.18 Extractives from Ekebergia capensis
5.18.1 Physical data of compound 1
24-Ethylcholest-5-en-3/3-01, /3-sitosterol
Yield: 5.5 mg
Mass spectrum (spectrum la):
EIMS rnlz 414.3848 (C29HsoO, req. 414.3861), 396 [M - H20r
Infrared spectrum (spectrum 1 b):
Umax (KBr): 3430 cm-I (O-H stretching), 2936 cm-I, 2867 cm-I (saturated C-H
stretching), 1049 cm-I (C-O stretching), 1460 cm-I, 1378 cm-I (C-H deformation)
Optical rotation:
[a]D = -34.1 ° (CHCI3, c 0.050), (lit value -35 0) (8)
Melting point:
134-136 °c (lit. value 136-137 QC) (8)
IH NMR (spectrum 1c)
8 (ppm): 0.66 (3H, s, H-18), 0.78 (3H, d, J= 7.1 Hz, H-27), 0.80 (3H, d, J=
7.9 Hz, H-26), 0.82 (3H, t, J= 7.2 Hz, H-29), 0.91 (3H, d, J= 6,4 Hz, H-2I),
0.99 (3H, s, H-19), 3.50 (IH, rn, H-3a), 5.32 (lH, rn, H-6)
13C NMR (Table AI)
5.18.2 Physical data of compound 2
3-0xo-12-0Ieanen-28-oic acid, oleanonic acid
Yield: 8.5 mg
Mass spectrum (spectrum 2a):
EIMS rnlz 454.3471 (C3oli4603' req. 454.3447), 439[M - CH3r, 410 [M - co2t
105

Infrared spectrum (spectrum 2b) :
U max (KBr): 3421 cm-I (O-H stretching), 2922 cm-I, 2850 cm-I (saturated C-H
stretching), 1749 cm-\ 1726 cm-I (C=O stretching), 1049 cm-I (C-O stretching),
1462 cm-I, 1377 cm-I (C-H deformation), 1271 cm-I (C-O stretch)
Optical rotation:
[0.]0 = +99.4 ° (CHCb, C 0.022), (lit value + 101 0) (9)
Melting point:
225-228 °C (lit. value 226-229 °C) (9)
lH N11R (spectrum 2c)
o (ppm): 0.75 (3H, S, H-26), 0.82 (3H, S, H-30), 0.88 (3H, S, H-29), 0.98 (3H, S,
H-24), 0.99 (3H, S, H-25), 1.03 (3H, S, H-23), 1.04 (2H, m, H-21), 1.06 (lH, m,
H-15b), 1.09 (3H, S, H-27), 1.10 (lH, m, H-19b), 1.26 (1H, m, H-5), 1.28 (2H,
rn, H-7), 1.34 (lH, dd, i l = 3.7 Hz, i2 = 12.0 Hz, H-1a), 1.28 (2H, d, i= 5.6 Hz,
H-6), 1.57 (IH, m, H-19a), 1.60 (IH, rn, H-9), 1.62 (IH, m, H-16a), l.72 (2H,
dd, i l = 4.0Hz, i2 = 15.7 Hz, H-15a), 1.81 (lH, rn, H-1b), 1.88 (2H, m, H-22),
l.93 (2H, m, H-II), l.99 (lH, m, H-16b), 2.30 (IH, rn, H-2a), 2.50 (lH, rn, H-
2b), 2.78 (1H, dd, i l = 3.5 Hz, i2 = 12.1Hz, H-18), 5.24 (lH, bs, H-12)
l3C N11R (Table AI)
5.18.3 Physical data of compound 3
3 a-Hydoxy-12-oleanen-28-oic acid, 3-epioleanolic acid
Yield: 5.2 mg
Mass spectrum (spectrum 3a):
EIMS mlz 456.3590 (C3olI4s03, req. 456.3603),
Infrared spectrum (spectrum 3b):
U nux (KBr): 3404 cm-l (O-H stretching), 2947 cm-I, 2879 cm-l (saturated C-H
stretching), 1709 cm-I (C=O stretching), 1444 cm-I (O-H in-plane bending), 1379
cm- l (C-H deformation), 1249 cm-I (C-O stretch)
Optical rotation:
[0.]0 = +69.20 (CHCI3, c 0.0l3), (lit value +68 0) (10)
106

Melting point:
>250°C (lit. value 294-296 °C) (10)
IH NMR (spectrum 3c)
8 (ppm): 0.73 (3H, s, H-26), 0.81 (3H, s, H-30), 0.88 (3H, s, H-29), 0.90 (6H, s, H-24,
H-25), 0.93 (3H, s, H-23), 1.10 (IH, m, H-la), 1.12 (3H, s, H-27), 1.15 (lH, m,
H-19a), 1.30 (lH, m, H-1b), 1.60 (lH, m, H-19b), 1.66 (lH, m, H-2a), 1.74 (2H,
m, H-11), 1.87 (lR, m, H-2b), 2.79 (lH, dd, J1 = 3.9 Hz, J2 = 13.3 Hz, H-18),
3.39 (lH, s, H-3B), 5.23 (lH, m, H-12)
13CNMR (Table AI)
5.18.4 Physical data of compound 4
2,3,22,23 -Tetra hydroxy-2,6,10,15,19,2 3-hexamethyl-6, 1 0, 14, 18-tetracosatetrene
Yield: 16.0 mg
Infrared spectrum (spectrum 4b):
Umax (KEr): 3437 cm-I (O-H stretching), 3000 cm-I - 2879 cm-I (saturated C-H
stretching), 1638 cm-I (C=C stretching), 1459 cm-I, 1381 cm-I(C-H deformation),
763 cm-I (C-R out-of-plane bending)
Optical rotation:
[a]D = +22 ° (CRCI3, c 0.035), (lit value +23°) (11)
IH NMR (spectrum 4c)
8 (ppm): 1.12 (6H, s, 2 x CH3), 1.17 (6H, s, 2 x CH3), 1.38 (2H, m, H-4a, H-21a), 1.50
(2H, m, H-4b, H-21b), 1.57 (6H, s, 2 x CH3), 1.59 (6H, s, 2 x CH3), 1.98 (8H, m,
H-9, H-I2, H-13, H-16), 2.04 (6H, m, H-5a, H-20a, H-8, H-I7), 2.19 (2H, m, H-
5b, H-20b), 3.32 (2H, dd, J1 = 2.0 Hz, J2 = 10.3 Hz, H-3, H-22), 5.14 (4H, m, H-
7, H-II, H-I4, H-I8),
13C NMR (Table AI)
107

5.18.5. Physical data of compound 5
7 -Hydroxy-6-methoxycoumarin, scopoletin
Yield: 4.2 mg
Mass spectrum (spectrum Sa):
ETh1S mlz 192.0418 (C lOHg0 4, req. 192.0422),177 [M - CH3f, 149 [M - CH3 -
COr, 121 [M - CH3 - 2cof
Infrared spectrum (spectrum Sb):
Uma.'C (KBr): 333S cm-1 (O-H stretching), 28S0cm-1 (symmetrical stretch of -OCH3),
1706 cm-1 (C=O stretching), lS6S cm-t, lS09 cm-1 (C=C stetching), 922 cm-\ 860
cm-1 (C-H out-of-plane bending),
Melting point:
201-202°C (lit. value 204°C) (12)
IH NMR. (spectrum Sc)
o (ppm) : 3.94 (3H, s, OCH3), 6.10 (lH, s, OH), 6.24 (lH, d, J3,4 = 9.6 Hz, H-3), 6.83
(lH, s, H-S), 6.90 (lH, s, H-8), 7.S8 (lH, d, J3,4 = 9.6 Hz, H-4)
5.19 Extractives from Clivia miniata
5.19.1 Physical data of compound 6
{Z,Z)-9,12-octadecadienoic acid, Linoleic acid
Yield: l.0842 g
Mass spectrum of methyl lino le ate (spectrum Sa):
ETh1S mlz 294,262, ISO, 136, 123, 9S
5.19.2 Physical data of compound 7
5-Hydroxymethyl-2-furancarboxaldehyde
Yield: 6.6 mg
Mass spectrum (spectrum 7a):
EIMS mlz 126.0307 (C lOH80 4, req. 126.0317), 109 [M - OHf, 97 [M - CHOr
108

Infrared spectrum (spectrum 7b):
U max (KEr): 3423 cm-I (O-H stretching), 2924 cm-\ 2855 cm-I , 1670 cm-I (a.,~
unsaturated aldehyde C=O), 1190 cm-I (C-O-C symmetric stretching), 1521 cm-I
(C=C stretching)
IH NMR. (spectrum 7c)
8 (ppm): 3.39 (lH, s, OH), 4.65 (2H, s, OCH2), 6.62 (1H, d, J3,4 = 3.6 Hz, H-4), 7.42
(lH, d, J3,4 = 3.6 Hz, H-3), 9.57 (lH, s, CHO)
l3c NMR. (Table A2)
5.20 Extractives from Grewia occidentalis
5.20.1 Physical data of compound 8
3-( 4-hydroxy-3-methoxyphenyl)-2-propenal, coniferaldehyde
Yield: 7.5 mg
Mass spectrum (spectrum 8a):
ElMS mlz 178.0625 (C IOH IO0 3, req. 178.0630),177 [M - Hr, 163 [M - CH3r
149 [M - CHOr
Infrared spectrum (spectrum 8b):
U max (KEr): 3424 cm-I (O-H stretching), 2700 cm-I, 2850 cm-I, 1664 cm-I (a.,~
unsaturated aldehyde), 1587cm- l, 1514 cm-I (C=C stretching), 971 cm-I (C-H out
of-plane bending)
IH NMR. (spectrum 8c)
8 (ppm): 3.93 (lH, s, OCH3), 5.95 (lH, s,OH), 6.57 (1H, dd, JI' ,2' = 15.9 Hz, J 2',3' =
7.65 Hz, H-2'), 6.94 (lH, d, 15,6 = 8.2 Hz, H-5), 7.05 (lH, d, J2,6 = 1.8 Hz, H-2),
7.10 (IH, dd, J5,6 = 8.2 Hz, J2•6 = l.8 Hz, H-6), 7.38 (1H, d, JI',2' = 15.9 Hz, H-l'),
9.63 (1H, d, J1:,3' = 7.65 Hz, CHO)
109

5.20.2 Physical data of compound 9
2,2',6, 6'-Tetramethoxy-4'-al-4-( oroxo-E-propenyl)-biphenyl
Yield: 15.5 mg
Infrared spectrum (spectrum 9b):
U max (KEr): 3418 cm-' (O-H stretching), 2939 cm-I, 2847 cm-I, 1677 cm-' (a,B
unsaturated aldehyde), 1588 cm-' (C=C stretching)
IHN1v1R (spectrum 9c)
cS (ppm): 3.92 (6H, S, 2 x OCH3), 3.95 (6H, S, 2 x OCH3), 6.59 (57 (lH, dd, J1",2" =
15.9 Hz, J2",3" = 7.65 Hz, H-2"), 6.79 (2H, S, H-3, H-5), 7.13 (2H, S, H-3', H-5'),
7.36 (lH, d, J1",2" = 15.9 Hz, H-1"), 9.64 (lH, d, J2",3" = 7.65 Hz, CHO); 9.80 (IH,
S, CHO)
l3C NMR. (Table A2)
5.20.3 Physical data of compound 10
Data as for compound 2
110

References
1. M. Saito, Y. Yamauchi and T. Okuyama, Fractionation by packed column SFC
and SFE, VCH publishers, New York, USA (1994), p.112.
2. B.S. Musser, M . Piserchio, R.A. Henry and E.L. Boone, Proc. 5th 1nt. Symp.
Supercritical Fluid Chromatography and Extraction, Baltimore, Maryland,
January 11-14 (1994), D5.
3. M.W. Raynor, K.D. Bartle, 1.L. Davies, A.A. Clifford & A. Williams, J High
Resolut. Chromatogr. & Chromatogr. Commun., 11 (1989), 289.
4. Beckmann PlACE 5000 series instrument manual, Beckmann Instruments,
Fullerton, USA (July 1993).
5. Lee Scientific series 600 supercritical fluid chromatograph instrument manual,
Dionex, Sunnyvale, USA (November 1988).
6. D. Tong, K. D. Bartle & A.A. Clifford, J Microcol. Sep., 6 (1994), 249.
7. K. Devchand, M.Sc. thesis, University of Natal (1994), p.32.
8. Dictionary of Natural Products, l Buckingham, F.M. Macdonald, H.M. Bradley
(Eds.), Chapman & Hall Chemical database, London, UK, 5 (1994), 5258.
9. Dictionary of Natural Products, l Buckingham, F.M. Macdonald, H.M. Bradley
(Eds.), Chapman & Hall Chemical database, London, UK, 4 (1994),4395 .
10. Dictionary of Natural Products, l Buckingham, F.M. Macdonald, H.M. Bradley
(Eds.), Chapman & Hall Chemical database, London, UK, 3 (1994), 3132.
11. Y. Nishiyama, M. Moriyasu, M. Ichimaru, Y. Tachibana, A. Kato, G. Mathenge;
IN. Nganga and F. D. Juma, Phytochemistry, 42 (1996), 803 .
12. Reference 10, p.3072.
III

CHAPTER 6
SFE optimization by application of dynamic extraction model for the
extraction of plant components
6.1 Introduction
Optimization of conditions in any SFE experiment is important as it ensures maximum
recovery of analytes. However, in natural product matrices this is sometimes difficult to
achieve unless the structures of the target analytes are known prior to extraction. A
knowledge of the physical and chemical properties of the solutes can be of considerable
aid in establishing optimal conditions for conducting the extraction, since this will effect
the time required for executing a particular extraction. Utilizing the solubility parameter
theory developed by Giddings, King and Friederich (1) developed a method which
permitted the quantitative estimation of solute solubility levels in dense and liquified gas
media over a range of pressures and temperatures. The method incorporates the ratio of
the solubility parameter of the extraction gas to that of the dissolved solute, thereby
permitting correlations to be made for number of solute-gas combinations as well as
solute solubilities to be estimated from a knowledge of the solute's molecular structure.
However, when dealing with complex matrices of unknown chemical constituents,
conditions can be optimised on the basis of total extractable material obtained per unit
time (2, 3). Although the optimization would have been more meaningful if one
particular important analyte was targeted, in reality this was not possible at this time
because the structural elucidation was not complete and the active components not
identified. It was therefore uncertain whether the active components followed an
extraction profile similar to that illustrated in Figure 2.9 or whether the active
components were extracted largely at a particular point within the extraction period. In
order to effectively utilize SFE, the fundamental thermodynamic and kinetic parameters
that impact on the distribution of the analyte between the dense fluid phase and the
112

substrate being extracted, needed to be evaluated. Initial extraction conditions were
selected on an empirical basis.
6.2 The Extraction Model
For the extraction of uterotonic compounds from Ekebergia capensis, Grewia
occidentalis and Clivia miniata, the "hot ball" model (4) was employed which describes
the kinetics of extraction with supercritical fluids. This model, as discussed in section
2.12, requires a knowledge of the matrix characteristics, which in the case of natural
products is difficult to understand due to irregular particle shapes and sizes. The model
also assumes that the rate of flow of the fluid is so high that the fluid remains infinitely
dilute, and also the solute is uniformly distributed throughout the matrix. It is then
necessary to solve the diffusion equation for the system with appropriate boundary
conditions. The problem is mathematically similar to that of the immersion of a hot
sphere into a cold fluid (hence the name "hot ball" model) for which the solutions are
given by Carslaw and Jaeger (5).
In a later publication, Crank (6) translated the equations into diffusion terms. Adaption
of the published solutions (7, 8) leads to the following equation for the ratio of the mass,
m, of extractable material that remains in the matrix sphere after extraction for time, t, to
that of the initial mass of extractable material, mo"
co
mlmo = (6/;r2) L (lln2) exp (-n2;r2Dtl,2) n=l
(6.1)
where n is an integer and D the diffusion coefficient of the material in the sphere.
Equation 6.1 may be simplified by defining quantity tr , which is proportional to time for
any given system (and is therefore a reduced or scaled time) by the following equation:
(6.2)
In terms of the scaled time, equation 6.1 becomes
113

mlmo = 617r 2 [exp (-tr) + 1/4 exp (-4t,) + 1/9 exp (-9tr) + ... ] (6.3)
The solution is therefore a sum of exponential decays, and at long times the later (more
rapidly decaying) terms will decrease in importance and the first exponential term in the
square brackets will become dominant. A plot of In (m/ma) verses time, or a quantity
proportional to time, therefore becomes linear at long times as shown in Figure 2.9. The
curve falls steeply initially, the rate of fall then drops and becomes approximately linear
after a time corresponding to a value of tr of around O.S. Extrapolation of the linear
portion of the curve to the t = 0 axis gives an intercept of approximately -0.5 [in fact
In (6/;r2) = -0.4977]. The physical explanation of the shape of the extraction curve is that
initially there is a step in concentration at the surface of the sphere and diffusion out is
rapid. As the extraction continues, this step becomes eroded, but nevertheless the
concentration gradient near the surface is large, and diffusion, which is proportional to
the concentration gradient, continues to be at a high rate. Eventually, however, a
smoother concentration profile is established over the whole sphere and diffusion loss
becomes a simple exponential decay.
6.3 Selection of extraction temperature
Supercritical fluid extractions of the three plants with water modified CO2 were
performed under the following conditions: 80°C, 400 atm, 2 mol % H20 in a 10 ml
extraction vessel. The oven temperature of 80°C ensured that the CO2-water mixtures
were fully miscible (7), but minimised the risk of unnecessary thermal decomposition
before extraction, although it was not clear whether such a temperature was effective in
extracting the uterotonic components. It is important to remember that when extracting
solid substrates, a knowledge of the solute melting point is critical as supercritical fluids
are more effective extracting agents when the extraction is performed at a temperature
above the melting point of the substrate. In this case, both mass transfer of the solute into
the supercritical fluid is improved as well as solute solubility due to the weakening of the
cohesive forces of the solid. Likewise, knowledge of the vapour pressure of the solute as
114

a function of temperature can have a profound effect on both the recorded solubility and
the separation factors that are obtained in multi-component solute separation schemes (8).
6.4 Selection of extraction pressure
The fluid pressure of 400 atm gave rise to a high fluid density which usually ensures high
solubility. The solubility of a substance in a supercritical fluid is primarily a function of
the density of the fluid. The solubility of a substance at constant temperature is a
function of pressure and in terms of mole fraction has the schematic form of Figure 6.1.
In section A-B, which is at very low pressures not of concern in most extraction
processes, the mole fraction (x) falls as the solute is diluted by the fluid. In section B-C
there is a rapid rise in x at a so-called threshold pressure characteristic of the solute-fluid
system, which is a pressure somewhat above the critical pressure of the fluid. This occurs
because of the rapid rise in the density, and therefore solvating effect of the fluid at
around this pressure. One must also remember that the solubility maximum is also
determined by the extraction temperature since by increasing temperature the volatility of
the solute also rises and eventually this effect exceeds the effect of the falling solvation
and the solubilty rises (11).
c: .Q -0 co .... - / ~ E 0 C / E ~ .2 0 Cl)
pressure
Figure 6.1 Generalized solubility isotherm as a function of pressure at constant temperature.(9)
115

6.5 Selection of dynamic extraction time
The optimum extraction time is dependent on the experimental pressure and temperature
as well as on the flow rate of the fluid through the extraction cell. For unknown samples,
the extraction time can best be found by experimentally conducting successive
extractions to determine the completeness of extraction. The extraction time was
determined by assessing the cumulative weight of the extract obtained from the three
plants after extraction times of 10 - 80 minutes at 10 minutes intervals. These results
indicate the total rates of supercritical fluid extraction of the target analytes and these
analytes account for only a proportion of the total mass of the extract. It is therefore
uncertain whether the extraction of these compounds follows a curve with the form of
that in Figure 2.9, or whether these compounds are largely extracted at a particular point
within the extraction period.
6.6 Supercritical fluid extraction of Ekebergia capensis
Milled wood of E. capensis (3.0 grams) was extracted into methanol. From Figure 6.2, it
can be seen that approximately 85% of the extraction occured within 60 minutes.
Thereafter the rate of extraction dropped rapidly, the mass barely increasing after 70
minutes. The extraction was carried out for 25 minutes to obtain an extracted mass m 1,
followed by two successive extractions to obtain extracted masses m 2 and m 3. Equation
2.2 (section 2.12) was then used to determine the total mass of the extractable material in
the matrix. The results of the extraction are given in Table 6.1.
Table 6.1 Data used to obtain mo for Ekebergia capensis Sparrm.
Extraction time mass extracted
(min) (mg)
50 17.1
100 19.2
150 20.3
116

arm m
mo was calculated to be 21.51 mg and from this, the plot of In (m/maJ vs. time was
obtained (Figure 6.3). The data used to obtain this plot is given in Table 6.2.
The curve was found to differ from the theoretical curve of Figure 2.11, in that it did not
fall steeply from zero, and this is thought to be due to the effect of solubility limitation
(12). Extrapolation of the linear portion of the curve to the time-zero axis, gives an
intercept of -0.87 that is, 1= 0.87, compared with a value for the sphere of 0.4977.
Table 6.2 Data used to obtain Kinetic Plot for the extraction of Ekebergia capensis
Sparrm.
Extraction time me (mg) m (mg)* mlmo In mlmo
(min)
10 4.80 16.71 0.7768 -0.2525
20 10.20 11.31 0.5258 -0.6428
30 13.80 7.71 0.3584 -1.0260
40 15.90 5.61 0.2608 -1.3440
50 17.10 4.41 0.2050 -1.5846
60 18.30 3.21 0.1492 -1.9022
70 18.60 2.91 0.1353 -2.000
* m = ma - me where me IS the mass of extract
117

90
ao
70
'0 60 Cl) ..-IJ ca "- 50 ..-)(
UJ CII
40 CII ca
::E ~ • 30
20
la
0
0
-0.2
-0.7
o
~ e: - -1 .2 .E
-1 .7
10 20 30 50 60 70
Extraction time (min)
Figure 6.2 Extraction curve of mass of extract from Ekeberia capensis Sparrm. as a function of extraction time (min).
----
80
-2.2 +-----+------+------+-----t------+------i-----+---_-..; o 10 20 30 40 50 60 70
Extraction time (min)
Figure 6.3 Plot of In (ml moJ against extraction time (min) for the supercritical fluid extraction of Ekebegia capensis Sparrm.
118
80

mm 71
6.7 SupercriticaI fluid extraction of Grewia occidentalis
Milled wood of G. occidentalis (2.0 grams) was extracted. From Figure 6.4,
approximately 72% was extracted within 50 minutes. The data provided in Table 6.3
below enabled calculation of moo
Table 6.3 Data used to obtain mo for Grewia occidentalis
Extraction time mass extracted
(m in) (mg)
50 6.40
100 7.90
150 8.50
mo was calculated to be 8.90 mg. The data used to obtain the plot of In (mlmJ vs.
extraction time is given below in Table 6.4.
Table 6.4 Data used to obtain Kinetic Plot for the extraction of Grewia occidentalis L.
Extraction time m,,(mg) m (mg) mlmo In mlmo
(min)
10 . 1.80 7.10 0.7977 -0.2260
20 3.80 5.10 0.5730 -0.5568
30 5.00 3.90 0.4382 -0.8251
40 5.80 3.10 0.3483 -1.0546
50 6.40 2.50 0.2809 -1.2698
60 6.60 2.30 0.2584 -1.3531
70 6.80 2.10 0.2360 -1.4441
119

"-
0
-€ S .E
ao
70
60
'C ell 50 t) 1\1 ... ... )(
ell 40 Cl) Cl) 1\1
~ 30 ~ 0
20
10
0 0 10 20 30 40 50 60 70 80
Extraction time (min)
Figure 6.4 Extraction curve of mass of extract from Grewia occidentalis L. as a function
of extraction time (min).
0
-0 .2
-0.4
-0.6
-0.8
-1
-1 .2
-1 .4
-1 .6
-1 .8
0 40
extraction time (min)
so 60 70
Figure 6.5 Plot of In (m/mo) against extraction time (min) for the supercritical fluid extraction of Grewia occidentalis L.
120
80

From Figure 6.5, the I intercept was extrapolated to -0.68. In the case of the spherical
model, the occurrence of an intercept below that of the theoretical value indicates either
non-uniform distribution of extractable compounds or irregular particle shape with a larger
surface-to-volume ratio than that of the sphere. With real samples, the particles will not
be exact spheres, but of irregular shape, and the concentration of extractable components
in the supercritical fluid will not be zero, but often, and, especially at the beginning of the
extraction, an appreciable fraction of the solubility. Furthermore, the species to be
extracted may not be uniformly distributed within the matrix. Exact modelling of these
more complex situations is difficult, as the parameters involved will vary and will generally
not be known. The steep fall as depicted by the theoretical model is once again absent.
Instead, a similar trend is seen as for Ekebergia capensis indicating a solubility limitation
possibly due to the highly polar nature of the chemical constituents. The effect of
solubility limitation is to reduce the high rate at the beginning of the extraction and also to
reduce the slope of the linear portion, with the extent of these effects increasing as the
pressure falls and the solubility decreases.
6.8 Supercritical fluid extraction of Oivia miniata
Dry milled root of C. miniata (2.0 grams) was extracted and from Figure 6.6, it was
evident that approximately 92% of the extraction was complete within 50 minutes. The
plot of In (mlmoJ vs. time yielded an intercept of -2.00, indicative of irregular particle
shape (Figure 6.7). The curve was also flattened indicating solubility limitation due to
high polarity of the compounds being extracted. The kinetic data can be seen in Tables
6.5 and 6.6.
Table 6.5 Data used to obtain mo for Clivia miniata L.
Extraction time mass extracted
(m in) (mg)
50 153 .80
100 162.50
150 165.00
121

'0 Cl) -IJ
"' ... -)( Cl)
en en
"' :t ~
Table 6.6 Data used to obtain Kinetic Plot for the extraction of Clivia miniata L.
Extraction time me(mg) m (mg) mlmo In mlmo
100
90
80
70
60
so
40
30
20
10
0
(min)
10 61.20 104.80 0.6313 -0.4599
20 104.20 61.80 0.3722 -0.9881
30 136.40 29.60 0.1783 -1.7242
40 150.20 15 .80 0.0952 -2 .3520
50 153.80 12.20 0.0735 -2 .6106
60 155 .60 10.40 0.0626 -2 .7702
70 156.40 9.60 0.05783 -2.8502
0 10 20 30 40 so 60 70 80
Extraction time (min)
Figure 6.6 Extraction curve of mass of extract from Clivia miniata L. as a function of extraction time (min).
122

Or-~------------------------------------------------------------~
·0.5
·1
o
~ .§. ·1.5
.5
·2
--·2.5
·3+-------~------~------_r------_+------_+------~------~------~ o 10 20 30 40 50 60 70 80
Extraction time (m in)
Figure 6.7 Plot of In (mlmoJ against extraction time (min) for the supercritical fluid extraction of C/ivia miniata L.
6.9 Conclusion
In all three cases, solubility was the controlling factor in achieving an interactive
extraction. The extraction pressure could not be raised to increase the fluid density as this
was a limitation of the instrument. The extraction temperature could not be lowered since
water was used as the modifier and modifiers greatly increase the critical point of the fluid
and it was therefore important that the temperature remained high enough to maintain a
single phase region during extraction. Another reason for the solubility limitation even
after adding a modifier could have been the possible displacement of the modifier out of
the extraction vessel upon commencing with dynamic extraction. It was therefore
necessary to include an equilibration period during extraction to prevent the modifier
from being displaced in order to achieve an interactive extraction. This was
accommodated for by using an initial 50 minute static extraction period followed by 20
minutes of dynamic extraction. Although the model indicated that only 43-67% of the
123

extractables were obtained within 20 minutes, the introduction of a static extraction period
would most certainly enhance the extraction. Longer dynamic extraction times could have
been employed however the total extraction time would have increased tremendously and
as the final aim was to couple this technique to the uterotonic bioassay as described in
Chapter 8, the extraction had to be performed within a short time together with a
sufficient quantity of the extractables to induce a uterotonic response. Hence, a
compromise had to be reached.
In companson of the theoretical model with experimental extraction data, the model
performed reasonably well in spite of the non-ideal nature of of the samples studied. The
results obtained can be explained in individual cases in terms of particle shape, solubility
limitation, and non-homogeneous distribution of extractable components within the
sphere. For the systems studied, the model and associated treatment appears to be a
suitable basis for the analysis and discussion of kinetic extraction data. Although the
model gives information about the early stages of extraction, in which the majority of
material is extracted, previous considerations of solubility will be more helpful. However,
the extraction of the remaining amount of extractables is vital in quantitative analytical
applications and of economic importance in industrial extraction processes. For process
engineering, a kinetic study and analysis of the result using this model is an important tool
in designing extraction processes for maximum economic performance.
References
l. l.W King & 1.P Friedrich, J. Chromatogr., 517 (1990),449.
2. D .M. Heaton, K.D. Bartle, C.M. Rayner and A.A. Clifford, J. High Resolut.
Chromatogr., 16 (1993), 666.
3. N.O. Maness, D. Chrz, T. Pierce and G.H. Brusewitz, JADCS, 27 (1995),665.
4. K.D. Bartle, A.A Cifford, S.B Hawthome, JJ. Langenfeld, DJ Miller & R.
Robinson, 1. Supercrit. Fluids, 3 (1990), 143 .
124

5. H.S . Carslaw & lC Jaeger, Conduction of Heat in Solids, Clarendon, Oxford, UK
(1959), p 233 .
6. 1. Crank, The Mathematics of Diffusion, Clarendon, Oxford, UK (1975), p 89.
7. A. B Newmann, AIChE Trans., 27 (1931), 302.
8. G. C So & D.G McDonald, Canadian J Chem. Eng., 64 (1986),80.
9. S.H. Page, S.R. Sumpter & M.L. Lee, J Microcol. Sep., 4 (1992), 9l.
10. E. Stahl, K.W. Quirin, A. Glatz, D. Gerard & G. Rau, Ber. Bunsenges. Phys.
Chem., 88 (1984), 900.
11. A.A. Clifford, In: Supercritical Fluid Extraction and its Use in Chromatographic
Sample Preparation, S.A. Westwood (Ed.), Blackie, Glasglow, UK, (1993), p.3l.
12. K.D. Bartle, T. Boddington, A.A. Clifford, N.J. Corton and C.J. Dowle, Anal.
Chem., 63 (1991), 2371.
125
CHAPTER 7
The role 0/ bioassays in medicinal plant analysis and a preliminary
investigation o/the plant extracts/or uterotonic activity
7.1 Introduction
Once a medicinal plant has been identified, a good initial investigation is biological
screening. The objectives of this screening are [1] to provide a rationale for clinical use of
traditional drugs even if activity is not of an order high enough to warrant development of
the active moiety as a new drug [2] to find new drugs and [3] to discover lead molecules
(essentially novel chemical moieties) which can be modified through chemical means into
new drugs. Furthermore, the role of bioassays on a batch to batch basis is important to
confirm consistency and, hence, clinical efficacy and safety for specific case studies (1-3).
A bioassay is a semi-quantitative procedure using a functional response, either in vivo or
in vitro, for the determination of the amount of active substance usually against a standard
calibrant. Bioassays can reflect the mode of action of a drug and the purity or potency of
a product. As the composition of plant components vary from one season to another
together with the co-occurrence of undesirable or perhaps toxic compounds, it becomes
necessary to also evaluate the risk associated with these compounds. This might involve
screens for antibiotic activity; in vitro inhibition tests; pharmacologic, agricultural, or
veterinary screens that require diverse in vitro assays; and/or in vivo animal models and
cytotoxicity testing using cells in culture. The rapid progress in the field of bioactive
metabolites is due in large part to the utilization of bioassay-guided fractionation
techniques. With this method most substances isolated will be those that have activity in a
particular bioassay or set of bioassays, although metabolites occurring in significant
quantities should not be overlooked.
126

7.2 Selection of bioassays
Several bioassays can be performed on plant derived products in order to identify the
activities they possess. Bioassays can be selective in order to detect substances having a
particular activity or broad based in order to find out if it has any exploitable potential.
The cost of bioassays can be high, in terms of the animals used, labour, facilities and time.
The legal requirements governing the design, safety, staffing and use of animal facilities
are also becoming ever more demanding. Hence careful consideration is required for the
selection of the most appropriate bioassay system for a particular purpose. It is essential
to evaluate the practical elements of assay precision, ruggedness, cost and speed. The
assay must then be validated, and its relevance for its intended purpose demonstrated.
7.3 The uterotonic bioassay
Isolated tissues have been used effectively in medicinal plant research to obtain
information on the activity and toxicity of plant extracts. In this work selective screening
was undertaken using strips of guinea pig uterine smooth muscle in vitro to detect
uterotonic components in plant extracts. Guinea pigs were used as they are small, cheap
and easily available models for certain aspects of human reproductive endocrinology.
They have spontaneous ovulations with cyclic, progresterone-secreting corpora lutea of
about 14 days duration (4), their uterine motility is not influenced by progesterone (5) and
the placenta is steroid-secreting (4). Uterine smooth muscle in vitro has been used
extensively for many years, not only for the purpose mentioned above but also for an
understanding of the relationship between the structure and activity of biologically active
peptides (6), to help with the characterization of drug receptors and the understanding of
receptor mechanisms in the uterus (7, 8). An important advantage of in vitro analysis is
the elimination, to a large extent, of pharmacokinetic variables. The response to an
agonist is proportional to the concentration of that agonist and the density of its receptor
sites. Unfortunately, in intact animals, this concentration is determined by many other
factors besides the dose of the agent administered. Thus, a change in the response to a
fixed dose might be brought about, not because the target organ has become more or less
sensitive, but because a different concentration of the agent is reaching the receptor site as
127

a result of changes in pharmacokinetics. Although changes of a pharmacokinetic nature
can occur in vitro, the number of variables is considerably reduced and interpretations are
more direct. The pharmacokinetic influences are illustrated in Figure 7.1.
Agent administered
! /1 Absorption I
! Metabolic ~ inactivation
1
Pool of readily Pool of agent ~I I ;;;==!':: available agent excretion not readily available
in body
1 Agent in biophase at receptor sites
Figure 7.1 The pharmacokinetic influences on a biologically active agent.
In setting up the experiment, many factors were considered to ensure the pnmary
requisites for isolated tissues, namely uniformity and stability. The first factor that was
considered was preservation of tissue viability. Historically, pioneering work by many
researchers such as Tyrode (9) and Krebs (10) has led to the definition of nutrient
solutions capable of preserving isolated tissues in a viable state. Different tissues require a
different milieu of ions and nutrients. Changes in ionic content and composition can affect
tissue reactivity and base-line activity. For example, high osmotic pressure depresses
cardiac pacemaker activity (11) while changes in levels of potassium ions (12, 13, 14) or
128

magnesIUm Ions (15) can greatly modify isolated blood vessel tone and reactivity to
agonists. Specific changes in ionic composition can eliminate spontaneous activity in
some tissues and allow stable steady-state responses to agonists (16, 17). Tyrodes
solution of constant ionic strength was therefore prepared prior to each set of experiments
to provide the isolated tissues with the necessary nutrients.
Adequate delivery of oxygen to the tissue is another prime consideration. The basal
activity of smooth muscle and cardiac muscle can be affected by changes in the partial
pressure of oxygen (Po2) in the organ bath. For example, the contractile responsiveness of
arterial smooth muscle decreases with decreasing Po2, the effects being more pronounced
for thick- rather than thin-walled vessels and also for high levels of contractile stimulus
(18, 19). Once the tissues were removed from the animal, they were placed immediately
in cold Tyrodes together with the passage of 95 % O2 and 5 % CO2 at a flow rate of 60
mlIrnin. This ensured that the muscle remained in a viable state during the experimental
period.
7.4 Theory of smooth muscle contraction
Smooth muscle is found in the walls of blood vessels, intestines, urinary and reproductive
tracts. The long spindle-shaped cells associate to form a muscle in patterns appropriate to
their function, such as an annular arrangement in blood vessels and a crisscross network in
the bladder (20). The basic principles of contraction are the same as in striated muscle in
that myosin molecules exert force on actin filaments, using ATP hydrolysis as the source
of energy. Ca2+ is essential for smooth muscle contraction. In the head of each myosin
molecule are two small polypeptides known as myosin light chains (NILC); this is in
addition to the heavy myosin chains. In smooth muscle, one of these . light chains (the p
light chain) inhibits the binding of the myosin head to the actin fibre, and thus prevents
contraction. Ca2+ activates a myosin kinase that, with ATP, phosphorylates the p-light
chain and abolishes its inhibitory effect, thus triggering contraction. The Ca2+ does not
directly activate the kinase; instead it combines with a protein, calmodulin to form a
calcium-calmodulin complex which induces a conformational change in the latter such that
129

it combines with the inactive kinase and activates it. When the Ca2+ level falls, the process
reverses and a phosphatase dephosphorylates the myosin light chain causing muscle
relaxation. The scheme is summarised in Figure 7.2. Free calcium levels are regulated by
the intracellular calcium pool, by the actions of the storage vesicles and of the myometrial
cell membrane. The membrane contains the calcium channels and the calcium-magnesium
stimulated ATPase system, both of which are important in the regulation of the
transmembrane calcium transport.
130

Sarcoplasmic reticulum
Calmodulin (CAM)
high Ca2+
-Ca2+
... _____ J acti\e calcilJ11
pump
CAM
CaJrrodulin-Ca2+ complex y
MLCK (inacti\e)
Myosin lig,t chain kinase (MLCK)
Inacti\e myosin
Myosin light chain-®
1 Acti\e myosin
1 Contraction
Figure 7.2 Diagram oftll! Irechani<5rn of activafun of sIrooth lllJScle contraction by Ca2+.
131

7.5 The effect of acetylcholine (ACh) on smooth muscle
ACh was used as the standard smooth muscle stimulant as this is the natural agonist or
mediator at postganglionic parasympathetic nerve endings in the myometrium. ACh is
synthesised in cholinergic neurons by the enzyme-catalysed transfer of the acetyl group
from acetyl coenzyme A (acetyl CoA) to choline, a quaternary ammonium alcohol (21).
The enzyme catalysing this reaction, choline acetyl transferase is also synthesised by the
neuron (Figure 7.3).
~COOH HO I
NH2
o )l ~N(CH3h
H3C 0
ACh
Serine ~
Decarboxylase
Choline N-methy'-l S-Adenosyl-transferase methionine
Acetyl-S~oA ~
Choline Acetyltransferase
+ . ~N(CH3b
HO
choline
Figure 7.3 Biosynthesi<; of Acetylcholine
Most newly biosynthesised ACh is actively transported into cytosolic storage vesicles
located in the presynaptic nerve endings, where it is maintained until a release is initiated
by an action potential that has been carried down the axon to the presynaptic nerve
membrane. This action leads to the opening of voltage-dependent calcium channels
affording an influx of Ca2+ and an exocytotic release of ACh into the synapse. ACh in the
synapse can bind with receptors on the postsynaptic or presynaptic membranes to produce
a response. Free ACh, that which is not bound to a receptor, is hydrolysed by
acetylcholinesterase. This hydrolysis is the physiologic mechanism for terminating the
action of ACh together with the rapid sequestering of intracellular Ca2+. Bot~ applied
132

ACh and parasympathetic nerve stimulation have similar effects on smooth muscle. In this
experiment the muscle was separated from the nerve endings hence ACh was administered
directly to the muscle. Figure 7.4 displays the electrical recording of a guinea pig uterine
smooth muscle contraction induced by 1 Ilg acetylcholine hydrochloride (ACh).
Administration of this drug induced an immediate contraction. Thereafter the muscle was
washed by flushing the tissue bath twice with Tyrodes solution at 37°C.
a..> Cl)
c: o 0.. Cl)
a..> M
a..> -u Cl)
:::s E
m uscle contracted
I IW
1 Ilg Ch
o 5 time (min)
m uscle relaxed
i = point of injection
w = muscle wash
Figure 7.4 Electrical recording of Guinea Pig uterine smooth muscle contraction induced by 1 Ilg O-Acetylcholine hydrochloride (ACh).
133

In certain cases a higher dose of ACh was required to induce an agonistic response as a
result of tissue variation. A great deal of pharmacological inference is derived from the
relative senstivity of tissues to agonists. Many factors including animal variation with
respect to agonist uptake mechanisms, numbers of viable receptors, and differences in the
efficiency of stimulus-response mechanisms can cause heterogeneity in sensitivity of
tissues to agonists. The most common problem is animal maturity which affects receptor
density and the reactivity of the isolated tissue (22).
The adsorption of drugs to the surface of the organ bath can serve as a physicochemical
process of drug removal from the receptor compartment. This methodological problem
has been encountered with basic antihistamines such as promethazine (23) where
substantial dilution errors were introduced into experiments by use of glass containers.
Adsorption to glass surfaces has been encountered with peptides such as substance P (24).
Hence, to overcome surface adsorption and subsequent leaching into fresh physiological
fluid, polypropylene organ baths were used as this was observed to eliminate the problem
in previous experiments (25).
In this study, the uterotonic effects of three plants viz. Clivia miniata (Lindl.) Regel.,
Ekebergia capensis Sparrm., Grewia occidentalis L. were evaluated. These plants are
used frequently during the late stages of pregnancy.
7.6 Analysis of extracts of Ekebergia capensis Sparrm.
7.6.1 Aqueous extract
The aqueous extract of Ekebergia capensis was prepared as outlined in section 5.3 . An
irreversible increase in uterine contractility was initiated 100 seconds after administration
of 588 Ilg of the aqueous extract of Ekebergia capensis into the organ bath (Figure 7.5a).
Attempts to reduce or stop the contractions by the addition of mepyramine, an
antihistamine, were ineffective and as a result, a second strip of muscle tissue had to be
prepared in order to confirm our initial findings. The second strip of muscle responded to
134
--

2 J..l.g ACh however 12.5 Ilg of mepyramine was required to reduce the spontaneous
contractile activity of the muscle. The muscle thereafter failed to respond adequately to
up to 12 Ilg ACh, however when 700 Ilg of the aqueous extract was dispensed into the
bath, a similar irreversible contractile response was initiated (Figure 7.5b). Subsequent
addition of antihistamine failed to decrease the uterine contractions. Activation of HI
receptors (histamine sites blocked by mepyramine) stimulates the contraction of smooth
muscles in many organs such as gut, uterus and bronchi. Such effects are readily blocked
by compounds known as HI antagonists (26) . In this study mepyramine, an antihistamine,
was used to reduce the activity induced by the extract however the results indicated that
the active components stimulated muscle contraction through other receptors. Further
investigations into the receptor pharmacology are discussed in a later chapter. These
results however confirm that the aqueous extract of the wood of Ekebergia capensis is
indeed uterotonic and that the active components do not act via histamine receptors since
the addition of extract after mepyramine stimulated muscle contractions and the
subsequent addition of antihistamine to the organ bath after administration of the extract
failed to reduce the contractile actvity of the muscle.
a
b
Figure 7.5
JJDWVJNMUl 1 jw wre1ax.cdj w w w j w w 111& ACII 511 11& aqueous cxlrlCl W 1'& mcpynmioa
0 S 10 1S 20 25 30 3S 40 4S SO SS 60 timc(~)
11.5 '" "Plam'D. 1l.5",
w w ~~J~~ I I I I I I I 0 5 10 15 20 15 30 3$ 40 4S 50 5! 60 65 70 75
tiJDe(ml.a)
Electrical recording of non pregnant guinea pig uterine smooth muscle contraction induced by (a) 588 Ilg of the aqueous extract of milled wood of Ekebergia capensis and (b) 700 ~Lg of the aqueous extract after administration of mepyramine. w = muscle wash
135

7.6.2 SFE extracts
Initial SFE extracts of the first batch of dry, milled plant material obtained at various
densities of pure supercritical CO2 were uterotonically inactive probably due to the low
solubility of active compounds and limited polarity or solvent strength of CO2. The
polarity of the fluid was increased by the addition of 200 III water directly to 6.5 grams
plant matrix; a common practice in SFE. The addition of modifier aided the recovery of
target analytes possibly due to the enhanced solubility of the analytes in the modified fluid.
The addition of modifiers has also been shown to change the morphology of the substrate
that is being extracted resulting in an improved extraction flux, e.g. in the extraction of
caffeine from coffee (27) and also to aid in the desorption of analytes from highly
adsorptive sample matrices by displacing the analyte from the surface (28) . However,
modifiers greatly increase the critical point of the fluid and it was therefore important that
the experimental parameters were altered to maintain a single phase region during
extraction. An equilibration period was also necessary to prevent the modifier from being
displaced out of the extraction vessel in order to achieve an interactive extraction. This
was accommodated for by using an initial 50 minute static extraction period followed by
20 minutes of dynamic extraction. The extractables were collected into methanol which
was later evaporated and weighed. Thereafter, the extracts were reconstituted in 0.9%
normal saline solution at known concentrations.
The SFE extracts were subsequently evaluated. Figure 7.6 displays the muscle
contractions induced ~y the total 400 atm SFE extract on a non pregnant uterus. The
response to 760 Ilg of the extract was monitored for 260 seconds. Once the crest of the
contraction peak was reached, the muscle was immediately washed to facilitate rapid
relaxation. Thereafter a similar dose of the extract was repeated however the muscle
wash was performed after the muscle had spontaneously relaxed. A third dose of 3800 Ilg
was finally administered and on each response, an increase in the area beneath the
contraction peak tracing was observed indicating that the SFE extract produced a dose
response uterotonic activity. A larger dose of 7500 Ilg of the SFE extract was
administered to the muscle and an irreversible contractile response was initiated. This
136

study confirms that water modified supercritical CO2 possessed the solvating power to
extract the uterotonic components.
Q) en ~ o 0. en Q)
""" Q) -C) en
= E
contracted
l t W
1 ).1g ACh
o
1 ~gACh
•
o
,I I
i w
5
relaxed
5 10 15
7500 ~g extract
•
10
\ '(
15 20
time (min)
20 . 25 30
time (min)
i i
1, \j
25 30 35 40
Figure 7.6 Electrical recording of contractions induced by the SFE extract of Ekebergia capensis.on a non-pregnant uterus. w = muscle wash
137
35 40

When these results were compared to those obtained using a pregnant uterus, it was found
that a lower dose of the extract was required to bring about a contractile response in the
pregnant uterus (Figure 7.7). This may be explained due to increased sensitivity of the
uterus as a result of hormonal changes during pregnancy. During pregnancy, the uterus is
exposed to, and is altered by, the changing hormonal environment. Circulating estrogen
and progesterone increase substantially due primarily to enhanced production of these
hormones from the ovaries and placenta. There is also a substantial increase in the agonist
receptors in the myometrium (29).
u '" c:: 8. '" u ... u
U '" ::J E
contracted
o 5 10 15 20 25 time (mm)
30 35 40
Figure 7.7 Electrical recording of contractions induced by the SFE extract of Ekebergia capensis.on a pregnant uterus. w = muscle wash
7.6.3 Supercritical fluid fractionation of Ekebergia extracts
45 50
Co-extraction of unwanted solutes along with target analytes frequently occurs during
extraction. Just as one can extract chemical compounds of varying polarity with solvents
of different polarity, so too can one extract compounds of different classes using
supercritical fluids. In an attempt to decrease the complexity of the extract, SFE fractions
were obtained by sequentially increasing the pressure at constant temperature and ~odifier
138
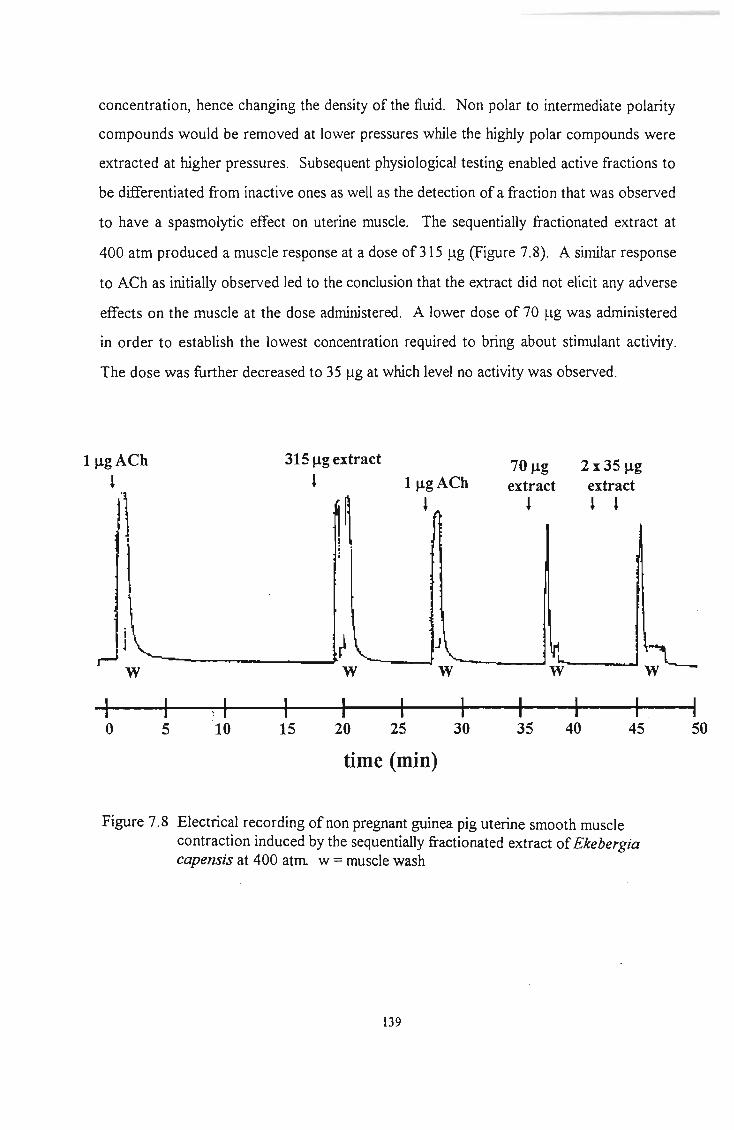
concentration, hence changing the density of the fluid. Non polar to intermediate polarity
compounds would be removed at lower pressures while the highly polar compounds were
extracted at higher pressures. Subsequent physiological testing enabled active fractions to
be differentiated from inactive ones as well as the detection of a fraction that was observed
to have a spasmolytic effect on uterine muscle. The sequentially fractionated extract at
400 atm produced a muscle response at a dose of 315 J.lg (Figure 7.8). A similar response
to ACh as initially observed led to the conclusion that the extract did not elicit any adverse
effects on the muscle at the dose administered. A lower dose of 70 J.lg was administered
in order to establish the lowest concentration required to bring about stimulant activity.
The dose was further decreased to 35 J.lg at which level no activity was observed.
1 J,lg ACh 315 J,lg extract 70 J,lg 2 x 35 J,lg l l 1 J,lg ACh extract extract
"j ,~ l l l l
•
I ~ .
~ J
~ W W W W
; I I 0 5 10 15 20 25 30 35 40 45
time (min)
Figure 7.8 Electrical recording of non pregnant guinea pig uterine smooth muscle contraction induced by the sequentially fractionated extract of Ekebergia capensis at 400 atm w = muscle wash
139
I 50

The extract at 350 atm also displayed stimulant activity at a dose of 317 J.lg. However,
this was followed by a reduction in the muscle response to 1 J.lg ACh indicating the extract
to be active as well as spasmolytic to a certain extent (Figure 7.9). Spasmolytic activity
was observed by the decrease in muscle response to ACh after addition of the extract to
the muscle chamber. This antagonistic behaviour of the extract would defeat its intended
purpose.
1 J.lg ACh , 317 J.lg extract ,
1 J.lg ACh ,
w w w
o 5 10 15 20
time (min)
Figure 7.9 Electrical recording of non pregnant guinea pig uterine smooth muscle contraction induced by the sequentially fractionated extract of Ekebergia
capensis at 350 atm. w = muscle wash
140

The 300 atm extract was inactive at all three doses, i.e 325 (..lg, 659 (..lg and 1300 ~lg . The
ACh response decreased with each dose indicating spasmolytic activity (30) (Figure 7.10).
Ij..lg ACh
J
I I ..
650 j..lg extract
l
Ij..lg ACh
J
1300 j..lg extract
l
Ij..lg ACh J
_---.. ...... I-----....... -"""----J w
Figure 7.10
W W
I I o 5 10 15 20 25 30
time (min)
Electrical recording of non pregnant guinea pig uterine smooth muscle contraction induced by the sequentially fractionated extract of Ekebergia capensis at 300 atm. w = muscle wash
The extract obtained at 250 atm was non-reactive even at doses up to 2600 f..lg. It was
difficult to evaluate the aqueous extract as opposed to the fractionated SFE extracts for
toxicity due to the irreversible contractile response exerted by the aqueous extract on the
muscle. Many traditional healers believe that herbal remedies are non toxic, however it is
possible that due to the complex nature of the aqueous extract, the toxic effects of certain
compounds are masked especially if the toxins are present at low concentrations.
Supercritical fluid fractionation (SFF) has thus displayed tremendous potential in the
evaluation of these extracts.
141

possible that due to the complex nature of the aqueous extract, the toxic effects of certain
compounds are masked especially if the toxins are present at low concentrations.
Supercritical fluid fractionation (SFF) has thus displayed tremendous potential in the
evaluation of these extracts.
7.7 Analysis of extracts of Clivia miniata (Lindl.) Regel
The aqueous and SFE extracts of the root of Clivia miniata were screened on a pregnant
guinea pig uterus.
7.7.1 Aqueous extract
The guinea pig uterine smooth muscle was observed to produce an agonistic response to 1
)lg ACh. The subsequent addition of 400 )lg of the aqueous extract induced a contractile
response of similar amplitude as the ACh response (Figure 7.11). The contractions were
observed to occur at almost equal time periods however the decrease in tension was
followed by a more spasmolytic type of response. The aqueous extract of the leaves of
this plant was also evaluated by Veale et al. (29) and found to produce concentiation
dependent contractions in rat ileum and uterus. However there are no reports on the
evaluation of SFE extracts nor the identification of the active components.
1 )lg ACh 400 )lg extract l l
w
I 0 5
I 10
time (min)
I'
15 20.
Figure 7. I I Electrical recording of pregnant guinea pig uterine smooth muscle contraction induced by the aqueous extract of Clivia miniata (Lindl.) Regel. w = muscle wash
142

7.7.2 SFE extract
After responding to a dose of 1 Ilg ACh, the muscle was exposed to 250 ~lg of the 400
atm SFE extract of Clivia miniata. The extract was found to elicit an immediate
contractile response of high amplitude which persisted following three subsequent washes
with Tyrodes solution (Figure 7.12). The muscle was monitored for a period of 45
minutes during which time there was no indication of a reduction in the contractile
response. The contractions were observed to be irregular and more prolonged. Unlike
the aqueous extract, a smaller dose of the SFE extract brought about a much larger effect
on the muscle indicating the SFE extract to be more potent as a result of the increased
selectivity of the extraction technique hence obtaining an extract with a much larger
concentration of the active component.
1 J.!g ACh 250 J.1g extract
l l (l~
~~www w
o 5 10 15 20 25 30 35 40 45
time (min)
Figure 7.12 Electrical recording of pregnant guinea pig uterine smooth muscle contraction induced by the SFE extract of Clivia miniata (Lindl.) Regel. w = muscle wash
143

7.8 Analysis of Grewia occidentalis L.
The aqueous and SFE extracts of the wood of Grewia occidentalis were screened on a
pregnant uterus.
7.8.1 Aqueous extract
The aqueous extract was found to elicit a muscle response of similar amplitude as that
induced by 1 J.lg ACh. 250 J.lg of the extract was administered and an immediate
development in tension was observed (Figure 7.13). Upon washing the muscle with
Tyrodes solution, the contractile response decreased. A subsequent addition of 200 J.lg of
the extract to the muscle bath confirmed that the aqueous extract was uterotonic by
producing a concentration dependent muscle response.
1 Jlg ACh
l
w
o
250 J.Lg extract l .
----40--1 r w
5 10 15
time (min)
200 Jlg extract
~
20 25 30
Figure 7.13 Electrical recording of pregnant guinea pig uterine smooth muscle contraction induced by the aqueous extract of Grewia occidentalis L. w = muscle wash
144

7.8.2 SFE extract
The SFE extract was tested and found to stimulate muscle contraction although at much
lower doses. Unlike the aqueous extract, only 112 Ilg was sufficient to induce a
contractile response. The increase in tension was followed by spasmodic type behaviour
however, upon washing the muscle, the response decreased (Figure 7.14). A repetition of
the dose produced a similar effect as the first, confirming uterotonic activity of the SFE
extract. Once again, the low doses of the SFE extract necessary can be explained due to
the increased selectivity of the extraction technique and the increased sensitization of the
uterus as a result of hormonal changes during pregnancy.
1 ~gACh . l
112 ~g extract 112 ~g extract
l l
I W
o 5 10 15 20 25 30 35
time (m in)
Figure 7.14 Electrical recording of pregnant guinea pig uterine smooth muscle contraction induced by ~he SFE extract of Grewia occidentalis L. w = muscle wash
7.9 Conclusion
Supercritical fluid extraction was found to be rapid and effective in isolating target
analytes that displayed distinctive results when screened for uterotonic activity. The
screening technique employed also proved to be successful in evaluating the plant extracts
Having outlined the theory of muscle contraction, it can be stated that the components
145

contained in the plant extracts may have stimulated muscle contraction by either increasing
the permeability of the cell membranes to calcium ions or by acting directly on the
contractile proteins or the receptor sites. Nevertheless, this preliminary investigation
warranted a further detailed study of the plant extracts in order to identify the active
compounds in the hope of finding new drug leads and to study the mode of action.
References
1. S. Jeffcoate, Trends in Biotechnology, 14 (1996), 121.
2. D .V.M. Frank Welsch, Teratology, 53 (1996),332.
3. K. I<..rishnan, M.L. Gargas and M.E. Andersen, Alternative Methods in
Toxicology, 9 (1993), 185.
4. 1. Hilliard, Bioi. Reprod, 8 (1973), 203.
5. D.G. Porter, 1. Endocrinol., 46 (1970), 425.
6 J. Rudinger, V. Pliska and I. Krejci, Recent Prog. Horm. Res., 28 (1972), 131.
7. DJ. Crankshaw, Eur. 1. Pharmacol., 101 (1984), 1.
8. G.J. Moore, Pharmacol. Ther., 33 (1987), 349.
9. M.V. Tyrode, Arch. Int. Pharmacodyn. Ther., 20 (1910), 205.
10. H.A Krebs, Biochim. Biophys. Acta., 4 (1950), 249.
11. 1. Koch-Weser, Am. 1. Physiol. , 204 (1963),957.
12 N. Skaug and R. Detar, Am. 1. Physiol., 240 (1981), H971.
13 . M. Gellai and R. Detar, Circ. Res. 35 (1974),681.
14. 1.M. Norton and R. Detar, Am. 1. Physiol., 222 (1972), 474.
15. B.M. Altura and B.T. Altura, Fed Proc., 40 (1981), 2672.
16. AS.F. Ash and H.O. Schild, Br. 1. Pharmacol. Chemother. , 27 (1966),427.
17. T.P. Kenakin,1. Pharmacol. Exp. Ther., 223 (1982),416.
18. A Chang and R. Detar, Am. 1. Physiol., 238 (1980), H716.
19. R. Detar, Am. 1. Physiol., 238 (1980), H761.
20. W.H. Elliott and D.e. Elliott, Biochemistry and Molecular Biology, Oxford
University Press, Oxford, UK (1997), p.394.
146

21. S. Tucek, In: The Cholinergic Synapse, Handbook of Experimental
Pharmacology, V.P. Whittaker (Ed.),Springer-Verlag, Berlin, Heidelberg,
Germany (1988), p.125.
22. T.P. Kenakin, J Pharmacol. Rev. 36 (1984), 165 .
23 . P .B. MarshaIl, Br. J Pharmacol., 10 (1955), 270.
24. S.P. Watson, B.E.B. Sandberg, M.R. Hanley and L.L. Iversen, Eur. J
Pharmacol., 87 (1983), 77.
25. R. Franco, M. Costa, and lB. Furness, Naunyn-Schmeideberg's Arch.Pharmacol.
306 (1979), 195.
26. AS.F. Ash and H.O. Schild, Br. J Pharmacol., 27 (1966), 427.
27. lW. King and I.E . France, In: Analysis with Supercritical Fluids: Extraction and
Chromatography, B. Wendawiak (Ed.), Springer-Verlag, Berlin, Heidelberg,
Germany (1992), p.32.
28. KM. Dooley, c.P. Kao, R.P. Gambrell, and F.C. Knopf, Ind. Eng. Chem. Res. 26
(1987), 2058.
29. G.D. Thorburn, I.R.G. ChaIlis, Physiol. Rev., 59 (1979), 863.
30. G.K Patnaik, KK Banaudha, KA Khan, A Shoeb and B.N. Dhawan, Planta
Med., 53 (1987),517.
31. D.J.H. Veale, D.W. Oliver, N.S. Arangies and KI. Furman, J. Ethnopharm., 27
(1989),341.
147

CHAPTERS
Coupling supercritical fluid extraction to uterotonic bioassay:
An on-line approach to analysing Medicinal Plants
8.1 Introduction
Current trends in analytical science are directed towards the analysis of the components
through on-line approaches. SFE has been successfully coupled on-line to various
chromatographic and spectroscopic methods. Modey et al. (1) used on-line SFE-GC for
the analysis the limonoid cedrelone in the wood and bark of Cedrela toona (Meliaceae).
SFE has also been successfully coupled to SFC. This approach is recommended when
the sample contains thermally unstable, reactive or involatile compounds. Xie et al. (2)
used this approach to extract and separate ouabain, a biologically active cardiac
glycoside, spiked onto an inert adsorbent. SFE-HPLC has been performed by Nair and
Huber (3) for the analysis of ground tablets for ibuprofen, however, the pumping of the
mobile phase became difficult and erratic when gas was present in the plumbing of the
HPLC system. On-line SFE-TLC has been shown to provide a rapid and simple insight
into the extraction performance of compounds from various matrices (4, 5), however
quantification was found to be difficult and the stability of the components on the support
material or in the presence of oxygen posed a problem. For compounds showing unique
regions of absorbance in the infrared region, direct coupling of the SFE effluent to an
FTIR can be of great importance. The recovery and detection on n-tetracosane from a
solid matrix by directly coupled SFE-FTIR was carried out by Kirschner and Taylor (6).
In addition, Kalinoski et al. (7) used on-line SFE with chemical ionisation MS .detection
and collision-induced dissociation tandem MS (MS-MS) for the rapid identification of
trichothecene mycotoxins. The limitation of SFE-MS is the possibility of overloading the
mass spectrometer with co-extracted compounds when complex samples are analysed.
Nevertheless SFE has proved to be an extremely versatile technique and we have thus
exploited its potential in an attempt to couple this technique directly on-line to the
148

uterotonic bioassay to serve as a rapid screening tool to assess plants for uterotonic
activity.
Bioassays are a common adjunct to chemical analysis. Traditionally, samples to be used
for bioassay have been prepared by solvent extraction, vacuum distillation, membrane
processes, lyophilization, etc (8). These techniques offer some success but also
significant disadvantages. SFE has proven to be a valuable alternative method of
extraction that has received tremendous attention in recent studies (9). In comparison
with classical liquid-solid extraction methods, SFE offers many potential advantages as
discussed in section 2.3 . In addition, CO2 provides an extraction environment free from
molecular oxygen, thereby limiting potential oxidation of the extracted solutes (10).
Although there have been reports of SFE coupled to immunoassay analysis, these studies
have been performed using off-line collection of the extracted analytes (11, 12). On-line
approaches provide potential for combined sample preparation and analysis and the
ability to transfer every extracted analyte molecule to the detection system thereby
increasing sensitivity. A further advantage is the elimination of sample handling prior to
the bioassay hence eliminating the possibility of sample contamination.
Supercritical CO2, unlike many liquid extraction solvents, is a nontoxic extraction
medium making it appropriate for interfacing with the bioassay since the problems of
artifactual solvent toxicity inherent in conventional extraction and fractionation schemes
is eliminated. Unfortunately, CO2 is not sufficiently polar to extract highly polar
components. Polar compounds therefore show limited solubility in pure CO2 and in such
cases either a more polar supercritical fluid should be used or a modifier added. For our
purpose, water was used as a modifier and added directly to the matrix. Although water
is scarcely soluble in liquid carbon dioxide (around 0.1 % mfm at 20°C), its solubility
increases with increasing temperature (around 0.3% mfm at 50°C), and has thus proven
effective in many extraction applications (13, 14).
149

Using the on-line system, the uterotonic effects of three plants viz. Clivia miniata (Lindl.)
Regel., Ekebergia capensis Sparrm., Grewia occidentalis L. were evaluated. These
plants are used frequently during the late stages of pregnancy. The aqueous extract of C.
miniata was previously found to be active (15). Off-line studies have shown the aqueous
and SFE extracts of E. capensis, G. occidentalis and A. fruticosa to stimulate uterine
contractions in vitro. These plants were selected to demonstrate the potential of SFE
linked directly to the bioassay, which could be used to rapidly screen various other plants
containing uterotonic compounds.
8.2 Results and Discussion
Prior to coupling SFE to the bioassay, two factors were considered, viz. the effects of
supercritical CO2 decompression on temperature and pH of the muscle bathing solution.
8.2.1 Temperature effects
Carbon dioxide depressurises at the exit of the restrictor resulting in adiabatic cooling of
the collection solvent. One of the problems with this is that the temperature of the
collection solvent was not maintained and the collection solvent became so cold that
samples containing water caused restrictor plugging from freezing water. Excessive
cooling can also alter muscle physiological activity. Veale et al. (15) showed that when
the organ bath temperature was reduced to 26°C, spontaneous contractions were
inhibited. However factors that interfere with spontaneous contractility may also affect
agonist-induced contractility. There may also be cases where postreceptor mechanisms
involved in the response of one agonist are more temperature dependent than those of
another (16). For these reasons, it was decided to study muscle activity at, or near, body
core temperature. Cooling experiments were performed on muscle bath A (section 5.7.1)
with 25 ~m i.d. fused silica capillaries. A 24.5 cm x 25 ~m i.d. linear restrictor was
initially used at a pump pressure of 400 atm and a reduction in the bath temperature to
35.4 QC was observed within ten minutes after commencing with dynamic extraction
(Figure 8.1). Despite the problems with cooling, the linear restrictor was further evaluated
during extraction of a real sample and was found to plug within 10 minutes of dynamic
150

extraction. This was due to decompression taking place over the entire length of the
capillary resulting in the formation of analyte clusters and small particles during this
process. Frit restrictors were also evaluated and were found to provide excellent
temperature control due to the low flow rate of CO2, Frit restrictors are also more
resistant to plugging due to their multitude of decompression paths, however the frit
failed on many accounts to withstand high pressures. A tapered restrictor of the same
inner diameter as the linear restrictor was subsequently used and found to provide better
temperature control and hence less cooling.
17
tapered restrictor H.J
H
linear restrictor
~-~+-~~~~~~~~~~-+~~--~+-+-~~-+~~~~+-+-~~-+~~ - - - - -.. :: - - - - - -..; .; .. - .. .. .. = -= :! : time (min)
Figure 8.1 The effect of CO2 decompression on temperature of Tyro des solution. ~02 was decompressed from an internal pressure of 400 atm through a 25 Ilm 1. d. tapered restrictor (.) and a linear restrictor (.)
151

The bath temperature decreased to 36.5 °C within 1.5 minutes of commencing CO2 flow
and remained constant at this temperature for the 15 minute period of the experiment.
Hence it is quite apparent that the degree of cooling is controlled by the flow of CO2 or
the rate of decompression. Tapered restrictors allow for the flexibility of optimising flow
rate by simply cutting back at the taper. By perfonning such a procedure, the inner
diameter of the orifice at the end of the taper increases thereby allowing increased flow
rates. Hence a compromise was reached between the rate of decompression and restrictor
plugging, as low flow rates due to small inner diameters of the taper orifice would have
led to blockages by the extract. A flow rate of 18 ml/min at 150 atm was found to be most
appropriate and did not result in blockages. The temperature decrease was also minimized
and found to be close to the desired experiment temperature.
8.2.2 pH effects
When CO2 is introduced into water, it forms carbonic acid resulting in a decrease in pH.
Some of the carbonic acid dissociates to bicarbonate and hydrogen ions. Because
alteration in [It] will alter cellular metabolic processes in which it is a participant, pH
measurements were carried out by placing a pH electrode into the muscle bathing solution
with CO2 flow directed into the muscle bath A. As shown in Figure 8.2, within 30
seconds of commencing flow of CO2, the pH decreased from pH 7.0 to 6.61. The rate of
decrease thereafter became moderate and finally remained constant after 10 minutes at a
pH of 5.75. The pH range compatible with life is about 7.8 - 6.8, however values as low
as 6.0 have been reported for skeletal muscle (17). 5% CO2 present in carbogen forms an
excellent buffer with bicarbonate present in Tyrodes solution. Since the pK of the HC03-
/C02 system is 6.1, extracellular fluid at a pH of 7.4 is not very effective in resisting
changes in pH arising from changes in Peo]. Furthermore, deviations in pH may influence
ionization of drugs or charged chemical groups on receptors thereby changing the moieties
which interact to produce a response (18,19). Intracellular fluid, with high levels of
protein and organic phosphates, is responsible for most of the buffering that occurs when
Peo] changes in biological systems. Since CO2 was used as the extracting fluid in SFE, the
Peo] in extracellular fluid, intracellular fluid and Tyrodes most certainly changed. It was
152
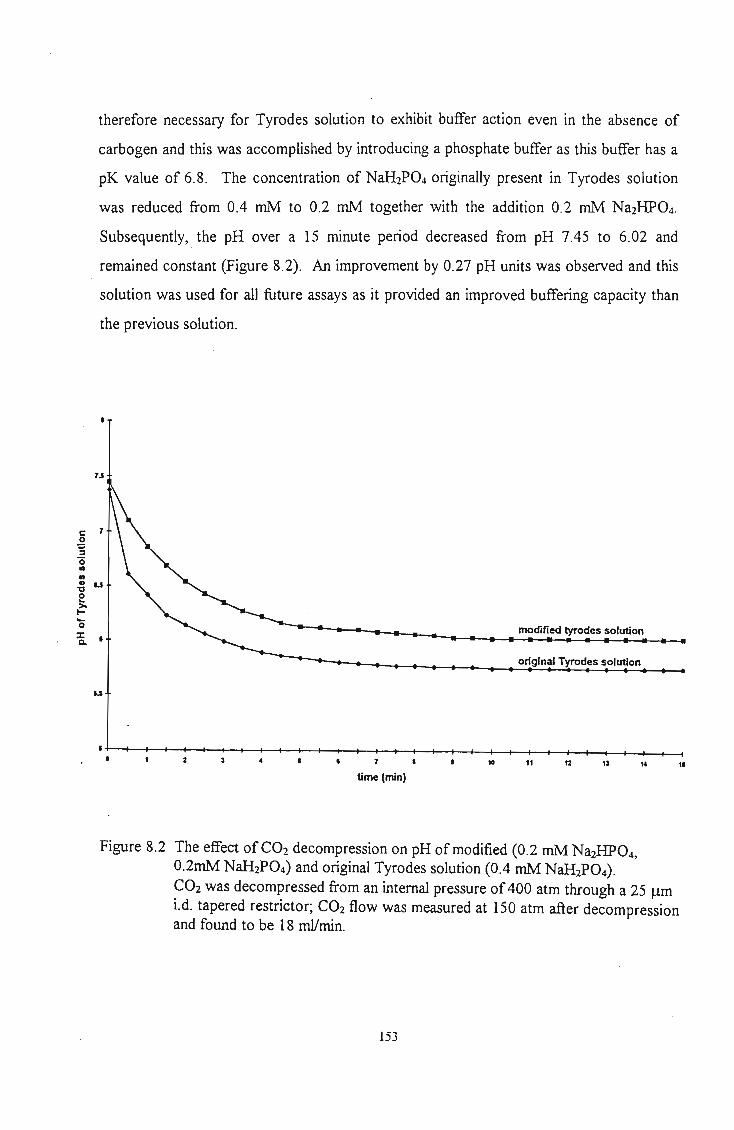
therefore necessary for Tyrodes solution to exhibit buffer action even in the absence of
carbogen and this was accomplished by introducing a phosphate buffer as this buffer has a
pK value of 6.8. The concentration of NaH2P04 originally present in Tyrodes solution
was reduced from 0.4 mM to 0.2 mM together with the addition 0.2 mM Na2HP04 .
Subsequently, the pH over a 15 minute period decreased from pH 7.45 to 6.02 and
remained constant (Figure 8.2). An improvement by 0.27 pH units was observed and this
solution was used for all future assays as it provided an improved buffering capacity than
the previous solution.
7.S
c:: 7 .2 :i '0 It It
~ U
e ~ -o :x: Q.
modified tyrodes solution
original Tyrodes solution
u
10 11 12 12 11
time (min)
Figure 8.2 The effect of CO2 decompression on pH of modified (0.2 mM Na2HP04, 0.2mM NaH2P04) and original Tyrodes solution (0.4 mM NaH2P04) .
CO2 was decompressed from an internal pressure of 400 atm through a 25 J.!m i.d. tapered restrictor; CO2 flow was measured at 150 atm after decompression and found to be 18 ml/min.
153

a
b
Tyrodes solution is a well known nutrient solution capable of preserving tissues in a viable
state and although other buffers may have improved buffering capacity, changes in ionic
content and composition are known to affect tissue reactivity and base line activity (20,
21). Hence minimum alterations to the recipe of Tyrodes solution were performed. The
physiological activity of a strip of uterine muscle was monitored under these conditions.
The muscle was allowed to develop spontaneous contractions and a dose of 1 Ilg ACh
was administered as a standard smooth muscle stimulant (Figure 8.3a).
Dynamic extraction commenced
1J-lg ACh l contracted
l spontaneous contractions
I I
~
5 min
SFE eItract of Antihistamine Dynamic extraction E capensrs (2X12~~ commenced (190~)
~ ~ t ~
I I
relaxed
time (min)
Dynamic extraction 3 x 1 J-l9 ACh
stopped l III
Dynamic extraction stopped
~
Figure S.3 The di~ect effect of CO2 on muscle cont~actility. Muscle activity was inhib·t d followmg a blank extra~ti?n with CO2 at 400 atm and S00C after (a) . I e spontane.ous musc~e activity and (b) after adminstration of an SFE extract f Ekebergla capenS1S. 0
154

A blank extraction was performed at 400 atm and 80 QC and the CO2 flow directed into
the muscle bath via the tapered restrictor. Immediately upon commencing with the
dynamic extraction, a contraction was observed. As the extraction proceeded, the muscle
began to relax and a flat baseline was observed thereafter. The spontaneous contractions
initially observed had ceased altogether. After 45 minutes, the extraction was stopped and
this was followed by the addition of 2 x 1 J..lg quantities of ACh. No response was
observed, however upon administering 3 !J,g ACh, a mild response was observed. The
. effects of CO2 were further seen when an off-line extract of the wood of E. capensis
induced muscle contractions. The contractions failed to stop even after administration of
mepyramine, a (H2) histamine receptor blocker. However when CO2 was directed from
the SFE vessel into the muscle bath, the development of tension was initially noted but this
was followed by muscle relaxation and a flat baseline (Figure 8.3b). These results
demonstrated that apart from the pH decrease, CO2 was directly inhibiting spontaneous
contractility of the muscle. Upon commencing with the dynamic extraction, the pH of
Tyrodes solution decreased resulting in increased tension of the muscle in response to
extracellular acidosis. A similar trend was observed by Cole et al. (22) when investigating
contractile responses of isolated human ureteric smooth muscle to extracellular pH
changes. However, a continuous influx of CO2 into the organ bath resulted in the
inhibition of muscle activity as CO2 entered the cell and acidified the intracellular fluid.
CO2 is an easily diffusable gas and is able to pass through membranes and alter
intracellular metabolic processes. Alterations in intracellular pH could alter smooth
muscle contractility as the following physiological processes are pH sensitive:
1) the rate of myosin ATPase activity (23);
2) the sensitivity of the contractile unit to Ca2+ (24, 25);
3) transmitter release and receptor sensitivity (26);
4) competition at calcium binding sites (27); and
5) late energy production (28).
Hypoxia could also alter force development and has been shown to impair contractility in
tracheal smooth muscle (25) . During hypoxia there is an increase in glycolysis and a
concomitant increase in intracellular lactate. Thus the reduction in force during hypoxia is
155

assumed to be due to a decrease in pH. Nevertheless, no matter what mechanism
prevailed in altering the force development during hypercarbia, it was a reversible process.
Once the flow of CO2 ceased and the Tyrodes solution changed, the muscle regained
normal physiological activity after passing carbogen through the solution for a few
minutes. Having undertaken various measures to avoid temperature and pH effects, it was
concluded that muscle bath A was not appropriate for on-line coupling since the muscle
was in direct contact with the incoming CO2 from the extraction vessel. The high Peo2
influenced muscle activity thereby making it impossible to analyse for uterotonic activity
induced by plant extracts. Since CO2 penetrates through cell membranes easily and alters
the intracellular activities, this excess had to be minimised. A second muscle bath was
therefore designed to eliminate the effects of excess CO2. It consisted of two
polypropylene chambers attached via a detachable sidearm. Dynamic extraction was
performed into 4 m1 of Tyrodes present in the extract collection chamber while the muscle
equilibrated in the 10 m1 muscle bath (Figure 5.5). In this way the muscle was protected
from the direct effects of high Peo2. The passage of carbogen into the extract collection
chamber further assisted in the rapid displacement of CO2. It was hypothesised that as the
dynamic extraction proceeded, the concentation of the extracted material in the extract
collection chamber would increase and mix with the Tyrodes solution in the muscle
chamber. The carbogen flowing into the muscle chamber facilitated the rapid mixing of
the plant extracts until the uterotonic components reached a sufficient concentration to
induce a contractile response. If required, at the end of the dynamic extraction period, the
Tyrodes solution from the extract collection chamber could be flushed into the muscle
chamber to provide a higher concentration of the extract. A 50 Ilm i.d. tapered restrictor
designed to produce the optimum flow of CO2 was used in this setup together with the
passage of carbogen into the extract collection chamber. The passage of carbogen was
found to assist in maintaining the desired pH of the Tyrodes solution by rapidly displacing
any excess CO2.
156

8.2.3 Evaluation of Extracts
The plants used for the on-line analysis were collected during October 1995 and were
hence different to the batch used for the preliminary analysis. Each plant was initially
evaluated by extraction at a pressure of 400 atm and 80 QC to ascertain whether the
uterotonic components were of sufficient concentration to initiate a muscle response using
this new technique. Subsequent analysis was performed by sequentially extracting the
components at 200, 300 and 400 atm respectively in order to decrease the complexity of
the extracts and hence minimise possible antagonistic effects from interfering compounds.
Fractionation also aided in determining the most potent extract of the plant which would
be useful in further analysis. The response of the muscle to ACh before and after
extraction of the plant components was determined for each assay.
8.2.3.1 Analysis of Ekebergia capensis
Following an equilibration period of 30 minutes, during which time static extraction was
perfonned, the muscle was found to produce an adequate response to 5 ~g ACh (Figure
8.4a.). Ten minutes after dynamic extraction at 400 atm commenced, the muscle was
observed to develop tension. The probability of cold zone contracture was ruled out as
the fluid temperature in the muscle bath during this period was found to be 37 QC. The
contractile process lasted approximately 3 minutes. Once the 20 minute dynamic
extraction period had lapsed and the contents of the extract collection chamber transferred
to the muscle bath, the muscle developed rythmic activity of increasing amplitu~e followed
by a period of sustained contraction-relaxation cycles, which were observed for a period
of 30 minutes. Subsequent addition of 5 ~g ACh to the muscle bath produced a
prolonged response of greater amplitude than the original cholinergic stimulation. A
similar cholinergic response following a muscle wash with Tyrodes indicated that the
extract may have sensitized the contractile mechanism thereby increasing the agonistic
response of ACh.
Sequential extractions at 200, 300 and 400 atm were thereafter performed and Figure
8.4b-c displays the contractions induced by the sequentially fractionated ' extracts.
157

Approximately 6 minutes after commencing dynamic extraction at 200 atm, the muscle
developed extreme tension of much larger amplitude than the ACh response (Figure 8Ab).
This contraction lasted approximately 10 minutes. After completing dynamic extraction,
the extract was flushed into the muscle chamber producing an increase in muscle tone.
This was monitored for a 17 minute period followed by administration of ACh. Once
again, in the presence of the plant extract, the muscle produced an enhanced agonistic
response to ACh, however, when the muscle was washed, the response elicited was
observed to be similar to the initial response. The 300 atm extract also produced a
contraction approximately 15 minutes after commencing with dynamic extraction,
however, when the extract was transferred to the muscle chamber, muscle activity was
enhanced and a period of sustained contraction-relaxation cycles was initiated within 3
minutes (Figure 8.4c.). These contractions were monitored for approximately 20 minutes
followed by the administration of ACh. Figure S.4d displays the contractions induced by
the sequentially fractionated 400 atm extract. An increase in muscle tension was observed
approximately 15 minutes after commencing with the 400 atm extraction. As the extract
concentration increased the muscle developed contractile activity of much larger amplitude
than the 400 atm total extract indicating that the sequential extract contained a larger
quantity of the active components or perhaps a smaller concentration of the interfering
compounds that may have induced antagonsitic effects. This extract indeed produced
stimulating action followed by an increase in the frequency of contractions. The ACh
response was also enhanced even after washing of the muscle with Tyrodes solution.
Upon comparison of these results with those obtained from the off-line studies, one could
possibly attribute the difference in the biological activity of the sequentially fractionated
extracts to seasonal changes. Seasonal changes are known to cause variation in the
concentration of compounds in plants due to changes in biosynthetic conditions. Unlike
the first batch of E. capensis, this batch did not elicit spasmolytic activity.
158

a
b
5 J.19 ACh
t Dynamic extraction commenced
5 119 ACh
t t
J~_' ----'~ contracted ~J\J1
relaxed ~vJJJJ,~~~ijJJ/ ~ l' J l 1--1 5min
I ~ I
Dynamic extraction 5 119 ACh commenced
~~ I I
r-----I 5 min
time (min)
time (min)
W I
5 J.19 ACh
t
w
mug', WUA
C 10 J.19 ACh
d
t Dynamic extraction t commenced
J '---___ ---J
1--1 5 min
5 J.19 ACh
t
I----! 5 min
Dynamic extraction commenced
time (min)
5 P,9 ACh
t t
w
time (min)
Figure 8.4 The effect of SFE extract of E. capensis on Guinea Pig uterine smooth muscle. a) total 400 atm extract, b) sequentially fractionated extract obtained at 200 atm, c)300 atm and d) 400 atm demonstrating that the 400 atm extract
was most potent.
o point at which contents of the extract collection chamber was transferred to the muscle bath; W = muscle wash with Tyrodes solution.
159

8.2.3.2 Analysis of Grewia occidentalis
The total 400 atm extract of G. occidentalis produced active tension within 2 minutes of
commencing dynamic extraction, however at the end of the dynamic extraction period, a
tonic rythm of extremely Iow amplitude was observed. This was followed by an extremely
low response to ACh indicating the possibility of toxic components, however this
inference remains to be confirmed (Figure 8.Sa). The 200 atm sequential extract did not
provide conclusive evidence of uterotonic activity although a single contraction lasting
approximately 30 seconds was observed (Figure 8.Sb). However, the 300 atm extract
produced a well synchronised response leading to the production of regular, rythmic
contractions that were monitored for a 30 minute period (Figure 8.5c). Addition of ACh
was observed to produce a contraction similar to the initial response. The 400 atm extract
was also found to induce phasic contractions, however of much lower amplitude than that
induced by the 300 atm extract (Figure 8.Sd). This study clearly demonstrated the
potential of supercritical fluid fractionation as the 300 atm sequential extract was observed
to be the most potent.
160

(a)
(b)
(c)
(d).
1 )!9 ACh
J\ Dr_'ti_on ....... ~!_. ____ -r t !---i 5 min
1 )!9 ACh
time (min)
'
Dynamic extraction , commenced
L ' ~ I I I I--i 5min time (min)
1 )!9 ACh Dynamic extraction I , commenced
I I ~
5 min
1 )!9 ACh
t
I I I--l 5 min
Dynamic extraction ,commenced
time (min)
time (m in)
1 ~g ACh 1)!g ACh
t t
Ld I W I
1 ~g ACh
~L
1 ~g ACh t .
Figure 8.5 The effect of SFE extract of G. occidentalis on Guinea Pig uterine smooth muscle.
o
a) total 400 atm extract, b) sequentially fractionated extract obtained at 200 atm, c) 300 atm and d) 400 atm demonstrating that the 300 atm extract was most potent.
point at which contents of the extract collection chamber was transferr~d to the muscle bath; W = muscle wash with Tyrodes solution.
161

8.2.3.3 Analysis of Clivia miniata
The total 400 atm extract of the roots of C. miniata was found to initiate contractile
activity within 4 minutes of commencing with dynamic extraction. An increase in muscle
tension was observed together with occasional spiking. The muscle remained in this state
of contraction for approximately 8 minutes, however upon completion of dynamic
extraction an intense contractile activity of high amplitude was detected (Figure 8.6a).
The contractions were observed to be more irregular, more prolonged and less frequent
than the contractions induced by G. occidentalis. The 200 atm sequential extract
produced regular contractions of varied amplitude (Figure 8.6b) while the 300 atm extract
was found to develop contractile activity approximately 5 minutes after stopping dynamic
extraction. The contractions were observed to be phasic together with tension
development (Figure 8.6c). Unlike the activity induced by the 200 atm extract, these
contractions were of a greater amplitude and frequency. These contractions were
monitored for a 35 minute period followed by two muscle washes in order to stop
contractile activity. Addition of ACh was found to elicit a much greater response than the
initial contraction and this could once again be explained by the sensitizing nature of the
extract on the contractile mechanism of the uterine muscle. The 400 atm sequential
extract also produced contractions which initially increased in amplitude with periods of
quiescence alternating with periods of activity. The contractions were initially observed to
be irregular and prolonged however with time, the amplitude decreased, followed by an
increase in the frequency of contractions (Figure 8.6d). The decrease in amplitude of the
contractions could be attributed to muscle fatigue .
162

(a)
(b)
(c)
(d)
Dynamic extraction commenced
I
I---i 5 min time (min)
1 J,l9 ACh
t
J Dynamic extraction I commenced
I I 1----1 5 min
1 J,l9 ACh
t D ' t' ) ynamlc extrac Ion j I commenced
w I I I----i 5 min
1 J,l9 ACh
I Dynamic extraction I commenced
I I I--i 5min
I
~
time (min)
time (min)
I .
time (m in)
1 ""g ACh
t 1 ""9 ACh
t
1 ""9 ACh
t
Figure 8,6 The effect of SFE extract of C. miniata on Guinea Pig uterine smooth muscle. a) total 400 atm extract, b) sequential extract at 200 atm, c) 300 atm d) 400
atm demonstrating that the 400 atm extract was most potent.
o point at which contents of the extract collection chamber was transferred to the muscle bath; W = muscle wash with Tyrodes solution.
163

8.3 Conclusions
The results presented herein show that the on-line assay is a rapid, safe and sensitive
method for determining the uterotonic activity of medicinal plants. The selectivity of the
extraction was successfully varied through pressure control thereby minimising the
possibility of interfering compounds. The method could be adapted to screen plants with
other therapeutic potential (eg. plants used in the treatment of diabetes mellitus and
hypertension). On-line bioassay guided fractionation further enhanced the potential of this
technique as it allowed expeditious identification of the most potent fractions which could
then be subjected to further analysis.
References
1. M.W. Modey, D.A. Mulholland, H. Mohamed and M.W. Raynor, J. Microcol.
Sep., 8 (1996), 67.
2. Q.L. Xie, K.E. Markides and M.L. Lee,1. Chromatogr. SCi., 27 (1989), 365.
3. lB. Nair and J.W. Huber, Le GC, Mag. Chromatogr. Sci., 6 (1988), 107l.
4. E. Stahl and E . Willing, Planta Med., 34 (I978), 258 .
5. E. Stahl and W. Schilz, Fresenius Z. Anal. Chem., 280 (1976), 99.
6 C. H. Kirschner and L.T. Taylor, Proceedings of the 4th International Symposium
on Supercitical Fluid Chromatography and Extraction, Cincinnati, Ohio, USA
(1992), p.173.
7. H.T Kalinoski, H.R. Udseth, B.W. Wright and R.D. Smith, Anal. Chem., 58
(1986), 2421.
8. M.F. Wolfe, IN. Seiber and D.E. Hinton, Proceedings of the 5th International
Symposium on Supercritical Fluid Chromatography and Extraction. Baltimore,
USA (1994), 20.
9. P. Subra and P. Boissinot, 1. Chromatogr. 543 (1991), 413.
10. B. Thomas, P. Wilhelm, T Gerda,1. Prakt. Chem., 334 (1992),403.
1l. G.K. Stearman, M.J.M. Wells, S.M. Adkisson and TE. RidgilI, Analyst, 120,
(1995),2617.
12. J.F. Morrison, S.N. Chesler and J.L. Reins, 1. Microcol. Sep. 8 (1996), 37.
164

13 . H. Engelhardt and A. Gross, Trends in Anal. Chem. 10 (1991), 64.
14. J.L Janicot, M. Caude and R. Rosset, J. Chromatogr. 505 (1990), 247.
15. DJ.H. Veale, D.W. Oliver, N.S. Arangies and K.I. Furman, J. Ethnopharm . 27,
(1989), 34l.
16. DJ. Crankshaw, In: Uterine Contractility - Mechanisms of control, R. E. Garfield
(Ed.), Serano Symposia, USA (1990), p.85.
17. J. Baggott, in Textbook of Biochemistry with Clinical correlations, T.M. Delvin,
(Ed.), John Wiley & Sons, New York, USA (1982), p.1088.
18. M. Roche E Silva, Arch. 1nt. Pharmacodyn. Ther, 128 (1960), 355.
19. M. Roche E Silva, in Handbook of Experimental Pharmacology, 18, Springer
Publishing Co., Inc., New York, USA (1966), p.225.
20. J. Kock-Weser, Am. J PhysioI., 204, 957-962 (1963).
21. lM. Norton and R Detar, Am. J. Physiol., 222 (1972), 474.
22. RS. Cole and C.H. Fry, J. PhysioI., 391 (1987), 49p.
23. V. Mrwa, I. Achtig and le. Ruegg, Blood Vessels, 2 (1974), 277.
24. V. Pieper, J Cardiovascular Pharm. 6 (1984),5328.
25 . V. Pieper, M. Ehl, V. lohnson and R. Laven, Pfluegers Arch. 364 (1976), 135.
26. S. Wray, Am. J. PhysioI., 254 (1988), C213.
27. e.H. Fry and P.A. Poole-Wilson, J. PhysioI. 313 (1981), 141.
28. RD. Cohen and RA. IIes, Crit. Rev. Clin. Lab. Sci. 6 (1975), 101.
165

CHAPTER 9
Extractives from Ekebergia capensis Sparrm.
9.1 The Genus Ekebergia
The genus Ekebergia belongs to the family Meliaceae. Previous investigations into the
chemical constituents of this genus resulted in the isolation and identification of a group of
tetranortriterpenoids known as limonoids. Structurally, the limonoids are derived from
tetracyclic triterpenoids similar to euphol or tirucaIlol by a series of oxidative changes,
brought about by peroxidase enzymes in the plant, interspersed with molecular
rearrangements. A step wise oxidation has been proposed for this process during which
four of the side chain carbon atoms are eliminated. According to the proposed mechanism
(1), the tirucallol side chain is first oxidised to form a C-21 aldehyde group, a C-23
hydroxy group and a C-24,25 epoxide in place of the double bond to afford, after a
subsequent cycIisation, a turraeanthin side chain (Scheme 9.1).
-tiucallol-l)pe side chain
1 o 0
HO~ -~
Schem: 9.1 Oxidation of s ide chaD
166
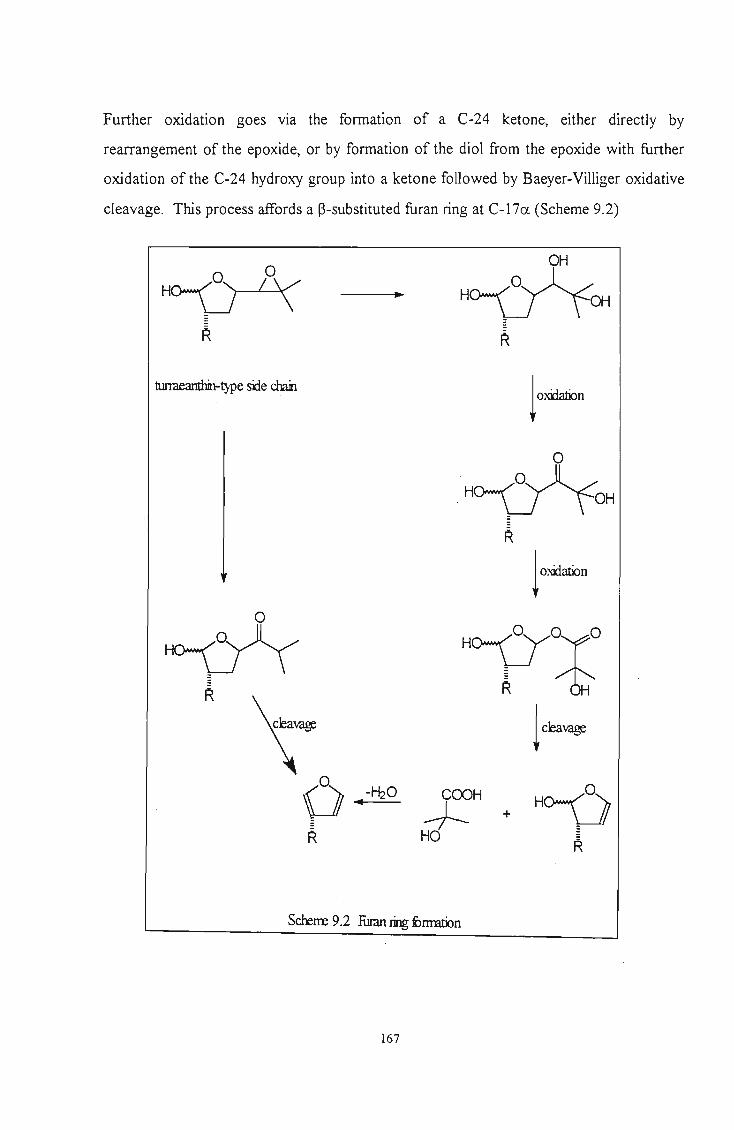
Further oxidation goes VIa the formation of a C-24 ketone, either directly by
rearrangement of the epoxide, or by formation of the diol from the epoxide with further
oxidation of the C-24 hydroxy group into a ketone followed by Baeyer-Villiger oxidative
cleavage. This process affords a ~-substituted furan ring at C-17u (Scheme 9.2)
o 0
~ OH
~
turraeantbin-twe siie chan
o
! OJOO""n
H~yO R~ ! ckavage
-~O .. COOH -+- + HO
Scherre 9.2 .furan ring fmmtion
167

The validity of the proposed pathway was also supported by a number of synthetic
studies where partial synthesis of the furan ring was carried out (2, 3). Limonoids are
classified according to the modifications of their triterpenoid rings, which brings about
twelve possible groups.
Ekebergia capensis is a fairly large tree, widespread in eastern Africa from Sudan to the
Cape. The timber is not durable, but the tree is cultivated for shade and as an ornamental
on account of its striking clusters of cherry-like but inedible red fruit. The tree is also
known to be used for medicinal purposes. Decoctions made from the chopped bark are
taken as emetics for heartburn and for respiratory chest complaints and coughs (4).
Leaves are used in an unfusion as a purgative parasiticide. The work reported in the
previous chapters has shown this plant to contain uterotonic properties supporting its
claim to induce or augment labour (5).
A previous investigation of the seed of E. capensis collected in the Eastern Cape yielded
a crystalline limonoid to which the name ekebergin was given (6). This compound was
identified as a diacylated methyl angolensate derivative.
o
HO'" ",
Ekebergin
168

Continued investigations into the hexane extract of the seed of Ekebergia capensis yielded
a number of different esters of the ekebergolactones as seen below (14).
capensolactone 1
RI = 2- methylbutymte, R2 = ni:otinate
capensolactone 2b
,?Ac ;
o
R = nicotinate, 2-methyIpropionate
capensolactone 4
169
~AC
o
RI = ni:otinate, R2 = 2-methylbutyrate
capensolactone 2a
~AC
R = nicotinate, 2-rnethyIpropionate
capensolactone 3
~Ac ::
o
capensolactone 5

Further investigations into the chemical constituents of the bark of E. bengue!ensis
resulted in the isolation of two acyclic triterpenoids [A] and [B] along with oleanonic acid
and 3-epi oleanolic acid (7) .
[A]
[B]
oleanonic acid 3-epioleanolic acid
170

A previous investigation of the timber of E. senegalensis (collected in Nigeria), which is
now considered conspecific with E. capensis (8), yielded the ekebergolactones A and B
(9).
Ekebergolactore A (R1' Rz = Ac, iBu; R3 = 2-MeBu)
Ekebeigolactore B (R1, Rz = Ac, iBu; ~ = Ac)
Investigations undertaken by Taylor et al. (10) on the seeds of E. pterophylla revealed the
presence of ekebergin as well as compounds named E.P.l (methyl 2a-acetoxy-3a
hydroxy-3-deoxoangolensate), E.P.2 (methyl 3a-hydroxy-3-deoxoangolensate), and E.P .3
(methyl 2a, 1513-diacetoxy-3 a -hydroxy-3 -deoxoangolensate).
E.P.l RI = OH, R2 = OAc, R3 = H
E.P.2 RI = 0 H, R2 = H, R3 = H
E.P.3 RI = OH, R2 = OAc, R3 = OAc
E.P.6 RI =OH,R2= '>==<. R3 =OH . H COO
171

Further studies on the seed of E. pterophylla by Kehrli et al. (11) led to the isolation of
the above mentioned compounds including two other compounds named E.PA and E.P.5,
whose structures were shown to be similar to those of the trijugins isolated from Heynea
trijuga (12).
?Ae Co 9Ae po A eO",
'" 0 AeO",
'" 0
COO""" HO"'\\\
>=< COOMe
E.PA E.P.5
Although coumarins are not common in the Meliaceae family, in recent studies (14), the
seed of E. pterophylla yielded six novel coumarins, the structures of which are given
below.
OH
pterophyllin 1 pterophyllin 2 pterophyllin 3
o
pterophyllin 4 pterophyllin 5 pterophyllin 6 .
172

In the current investigation of the supercritical fluid extract of E. capensis wood,
extensive silica gel chromatography led to the isolation of five compounds. From spectral
evidence and chemical transformation, the compounds were identified as ~-sitosterol;
oleanonic acid; 3 -epioleanolic acid; 2,3,22,23 -tetrahdroxy-2,6,10,15,19,23 -hexamethyl-
6,10, 14, 18-tetracosatetraene and 7 -hydroxy-6-methoxycoumarin. The structure
elucidation of these compounds is discussed.
9.2 Structure elucidation of compounds isolated
9.2.1 Compound 1
[1]
This compound was isolated as a white precipitate and displayed an Rc value of 0.67 with
a mixture of ethyl acetate (10%), hexane (15%) and methylene chloride (75%). High
resolution mass spectrometry indicated that the compound had a molar mass of 414.3848
g.mor1 consistent with a molecular formula C29HSOO (calculated 414.3861) (spectrum la).
The mass spectrum displayed a peak at mlz 396 [M - H20f, due to the ready dehydration
of the compound, indicating the presence of one hydroxy group.
The infrared spectrum (spectrum lb) displayed a strong band at 3430 cm-1 indicating the
presence of a hydroxyl group. Differentiation between primary, secondary and tertiary
alcohols is possible in many cases from the position of the C-O stretching bands. In this
173

spectrum, the strongest C-O stretching band at 1049 cm- l suggested a secondary hydroxy
group. The strong bands at 2936 cm- l and 2867 cm- l arose due to the presence of alkyl
groups and the presence of methyl groups was shown by C-H deformation bands at 1460
cm-I and 1378 cm-I.
The IH NMR spectrum (spectrum 1c) was compared with library spectra which suggested
the compound to be f3-sitosterol. Characteristic resonances of this compound were the
multiplet at 05.32 assigned to the H-6 proton in the steroid skeleton. Another multiplet at
03 .50 (W1l2 = 15 Hz) was ascribed to the H-3a. proton, with a hydroxyl group attached at
C-3f3.
The l3C NMR spectrum (spectrum Id) indicated a doublet occurring at 871.8, a typical
chemical shift for a carbon atom with an attached oxygen and was assigned to the C-3
carbon atom. The singlet at 0141.0 and doublet at 0121.9 indicated the presence of one
trisubstituted double bond and were assigned to C-5 and C-6 respectively. Chemical shifts
for the methyl group protons as well as the melting point and optical rotation correlated
well with published data. This compound was hence undoubtedly confirmed to be f3-
sitosterol. This compound is frequently found in the plant kingdom.
174

9.2.2 Compound 2
[21
This compound was isolated as colourless needles after recrystallisation from chloroform
and displayed an Revalue of 0.50 with a mixture of ethyl acetate (10%), hexane (15%) and
methylene chloride (75%). High resolution mass spectrometry of this compound showed
that the M'" peak occurred at mlz 454.3471 which correlated with the molecular formula
C30f4;03 (calculated 454.3447 g.mor!) suggesting that compound 2 was a triterpenoid
(spectrum 2a). The mass spectrum also displayed peaks at mlz 439 [M - CH3f and mlz
410 [M - C02r, the latter indicative of a carboxylic acid.
The infrared spectrum (spectrum 2b) displayed two prominent bands at 2922 cm-! and
2850 cm-! indicating the presence of alkyl groups and this was confirmed by the band at
1462 cm-! while the band at 1377 cm-! indicated that methyl groups were present. The
bands at 1749 cm'! and 1726 cm-! were due to the carbonyl streching vibrations of a
ketone and a carboxylic acid group respectively while the band at l271 cm-! was due to C
O stretching vibrations. The medium band at 3421 cm-! was due to the O-H stretching
vibrations.
The l3C NMR. spectrum (spectrum 2d) displayed strong resonances for 30 carbons.
Multiplicity assignments made from the DEPT spectrum indicated seven quartets, ten
triplets and four doublets. The remaining nine carbon resonances were assigned as
175

singlets. The resonances at 6122.3 (d) and 6143.6 (s) confirmed the presence of a
trisubstituted double bond, the chemical shifts of which are charactersitic for oleanane
triterpenoids with a ~12 double bond (13). The two singlet resonances at 6184.4 and
6217.8 were ascribable to the carboxylic acid carbonyl carbon and the keto group carbon
respectively.
The IH NMR spectrum (spectrum 2c) displayed a resonance at 65 .24 (lH, bs) assigned to
H-12. In the HETCOR spectrum (spectrum 2e), this was observed to correlate with the
carbon resonance at 6122.3 (d). A comparison of the data with that of a previously
isolated compound indicated that this compound was oleanonic acid. The carbon and
proton resonances were found to correspond with values reported in earlier studies (14).
Furthermore, from the COSY spectrum (spectrum 2t), H-12 was seen to be coupled to a
broad multiplet at 61.93 (2H, m) and this resonance was ascribed to 2H-11. The
resonance assigned to 2H-ll was, in turri, coupled to a multiplet at 61.60 (IH, m)
ascribed to H-9. The doublet of doublets at 62.80 (1H, dd) was assigned to the H-18
proton, which was seen to be coupled to H-19a (61.56, m) and H-19b (6 1.10, m).
Hence on the basis of this information, compound 2 was confirmed as being oleanonic acid
and has been isolated previously from this species.
176

9.2.3 Compound 3
[3]
This compound displayed an Rr value of 0.20 with a mixture of ethyl acetate (5%), hexane
(15%) and methylene chloride (80%) and was isolated as colourless needles after
recrystallization from methanol. High resolution mass spectrometry of this compound
showed a molecular ion peak at m/z 456.3590, suggesting a molecular formula C30~803
(required 456.3603 g.mor l) (spectrum 3a).
The infrared spectrum (spectrum 3b) displayed an intense band at 3404 cm- l due to O-H
stretching vibrations. The bands at 2947 cm- l and 2879 cm- l arose from alkyl groups
while the presence of methyl groups were shown by the presence of a band at 1379 cm-I.
The strong sharp band at 1709 cm- l was due to a carbonyl stretching vibration while the
band at 1249 cm- l was attributed to a C-O stretch. These bands suggested that a .
carboxylic acid group was present in the molecule. The band at 1444 cm- l was due to the
O-H in-plane bending vibration.
The l3C NMR and IH NMR spectra closely resembled the spectra of oleanonic acid with a
few minor changes observed. The l3C NMR spectrum (spectrum 3d) showed resonances
for 30 carbon atoms. Multiplicity assignments indicated seven quartets, ten triplets and
five doublets, while the remaining eight signals were assigned as singlets. The l3C NMR
177

spectrum, unlike that of oleanonic acid, lacked the singlet ascribed to the C-3 keto group
carbon at 8217.8 however a doublet at 876.2 was now observed. The double bond carbon
resonances occurred at 8122.7 and 8143 .6 while the resonance at 8183.1 ascribable to the
carbonyl carbon of the carboxylic acid group, remained unchanged.
The IH N?v1R spectrum (spectrum 3c) showed the resonances for H-12 of the ~12 double
bond at 85 .23 and the characteristic H-18 doublet of doublets at 82.79. The two H-2
proton multiplets at 82.20 and 82.50 in the spectrum of oleanonic acid, now occurred at
81.87 and 81.66 and a new broad singlet appeared at 83.39. This suggested that the keto
group at C-3 had been replaced by a hydroxy group. Furthermore, a WI12 value of 7 Hz
indicated that H-3 was ~ orientated leaving the hydroxy group in the a. position. This
compound was hence identified as being 3-epioleanolic acid. Though it has been
demonstrated that the biosynthesis in plants leads to the 3 ~-configuration, subsequent
epimerisation could occurr to produce the 3a. compounds (15). 3-epioleanolic acid is a
known compound in the plant kingdom although not as widely spread as the 3 ~-isomer.
178

9.2.4 Compound 4
24
OH
[4]
This compound was isolated as a colourless oil and displayed an Rr value of 0.17 with a
mixture of ethyl acetate (50%) and methylene chloride (50%). The highest peak in the
mass spectra occured at rnJz 348.2287, however the molecular formula obtained
(C2IHn 0 4) for this analysis did not agree with other spectroscopic data, indicating that the ,
compound may have decomposed or undergone a rearrangement reaction in the ion source
or perhaps the molecular ion may have been too weak to be detected (spectrum 4a). The
IH NMR. and the l3C NNfR spectra indicated that this compound closely resembled
squalene.
The infrared spectrum (spectrum 4b) showed a strong band at 3437 cm-I indicative of a
hydroxy group. The bands between 3000 cm-I and 2800 cm-I are due to alkyl groups, and
the presence of methyl groups is shown by bands at 1459 cm-l and 1381 cm-I . The band at
1638 cm-I
is due to C=C stretching vibrations while the strong sharp band at 763 cm- l
arises due to the C-H out of plane bending vibrations.
The structure of this compound was established on the basis of the lH NNfR and l3C NNfR
data, all of which compared well with data for these compounds which were recently
isolated from Ekebergia bengueiensis from Tanzania. The BC NNfR spectrum (spectrum
4d) showed resonances for fifteen carbons however the lH NNfR spectral features
(spectrum 4c) indicated that this compound structurally resembled squalene [4a], an
acyclic triterpenoid. Consequently, a symmetrical structure with thirty carbons was
suggested.
179

24
[4 a]
The l3C NMR spectrum displayed strong resonances for fifteen carbons. Since squalene is
formed from the alignment of two C 15 units in a tail-to-tail fashion, it was quite evident
that the l3C NMR spectrum represented one of these units as it was a symmetrical
molecule. Multiplicity assignments made from the DEPT spectrum indicated four
quartets, five triplets and three doublets. The remaining three carbon resonances were
assigned as singlets. The four resonances at 0134.9 (s), 0134.8 (s), 0125 .1 (d) and 0124.4
(d) were due to olefinic carbons in the molecule while the signals at 078.3 (d) and 073.0
(s) indicated the presence of a secondary and tertiary carbinol group respectively. Since
squalene is known to form the 2,3-epoxide, the two oxygen-bearing carbons were placed
at positions 2 and 3 since this was the most biosynthetically probable position.
The IH NMR spectrum displayed resonances at 01.12 (6H, s, 2 x CH3) and 01.17 (6H, s,
2 x CH3) indicative of four methyl groups. In squalene, the four terminal methyl groups
are attached to Sp2 carbons and hence resonate at 01.68 and 01. 60. In contrast, the
corresponding methyl groups of this compound suggested that these methyl groups were
attached to Sp3 carbons as the signals appeared higher upfield. A further two signals
occuring at 01.57 (6H, s, 2 x CH3) and 01.59 (6H, s, 2 x CH3) were indicative of four
methyl groups attached to Sp2 carbons. The spectrum also showed a four proton multiplet
at 05. 14 ascribable to H-7, H-Il, H-14 and H-18. Two equivalent CH group protons
were present as observed by the resonance at 03.32 (2H, dd, JI = 2.1 Hz, J2 = 10.3 Hz, H-
3, H-22).
180

To confirm whether the molecule contained an epoxide or hydroxy groups, acetylation of
[ 4] with acetic anhydride/pyridine at room temperature was carried out. A diacetate [4b]
was formed . This product was isolated as a colourless oil. The IH NMR of [4b] showed
a signal at 82.08 (6H, s) due to two acetate group methyl protons (spectrum 4e). The
double doublet that initially resonated at 83.32 was shifted downfield to 84.35 due to
deshielding induced by the acetate carbonyl groups. Because both C-3 and C-22 hydroxyl
groups were acetylated, [4b] was a symmetrical compound. The tertiary hydroxy groups
at C-2 and C-23 did not acetylate as special conditions are required for the acetylation of
tertiary hydroxy groups. Hence, based on these results, structure [4] was concluded to be
the acyclic triterpenoid 2,3,22,23-tetrahydroxy-2,6, 10, 15, 19,23-hexamethyl-6, 10,14,18-
tetracosatetrene. This suggested that [4] was a derivative of squalene in which two
hydroxyl groups were added to each of the terminal double bonds. The rest of the signals
closely matched literature values.
[4b]
181
emS'

9.2.5 Compound 5
[5]
This compound was found to be a coumarin known as scopoletin and was isolated as
colourless needles after recrystalisation from methanol. This compound did not show up
on a TLC plate after using the anisaldehyde spray reagent. Instead, it fluoresced with a
bright blue spot under UV light at 365 nm having an Rr value of 0.25 with a mixture of
ethyl acetate (10%), methylene chloride (80%) and hexane (10%). The most obvious
physical property of most natural coumarins is the fluorescence they display under UV
light at 365 nm and this feature has been employed widely for their detection on paper (16,
17). It is often possible to make tentative assignments of the structural class of a
coumarin from the colour it displays (18). 7-Alkoxycoumarins generally have a purple
fluorescence whereas 7 -hydroxy coumarins and 5,7 -dioxygenated coumarins tend to
fluoresce blue. The structure given below outlines the numbering system of a basic
coumarin. The vast majority of natural coumarins carry an oxygen substituent at C-7.
o
coumarm
182
Ems

High resolution mass spectrometry indicated that [5] had a molar mass of 192.0418 g.
mor! consistent with a molecular formula C lOHg0 4 (calculated 192.0422 g.mor!)
(spectrum 5a). Characteristic peaks were displayed at mlz 177 [M - CH3f ; mlz 149 [M -
CH3 - COr and mlz 121 [M - CH3 - 2COr.
The infrared spectrum (spectrum 5b) showed an intense band at 3335 cm'! due to the O-H
stretching vibration. The medium band at 2850 cm'! was due to the symmetrical stretch of
a methoxy group with the symmetric bend at 1450 cm'! . The strong sharp band at 1706
cm'! is due to the carbonyl stretching vibrations of an a,p unsaturated lactone. The sharp
bands at 1565 cm'! and 1509 cm'! indicated that this was an aromatic compound. The
sharp bands at 922 cm'! and 860 cm'! were due to the C-H out-of-plane bending vibrations
of the aromatic ring while the C-H in-plane bending vibrations occurred at 1020 cm'!. The
strong band at 1292 cm'! was due to C-H in-plane bending of olefinic carbons.
The !H-NMR spectrum (spectrum 5c) showed a resonance at 03.94 (3H, s) arising due to
methoxy group protons. A pair of doublets at 07.58 (lH, J3,4 = 9.5 Hz) and 86.24 (lH,
J3,4 = 9.5 Hz) were characteristic of the H-4 and H-3 signals respectively. The H-4
resonance is found in the region of 87.5-7.9 in coumarins lacking a C-5 oxygen function
(19) as an oxygen or alkyl substituent at C-5 will characterstically shift the resonance of
H-4 downfield by -0.3 ppm (the peri effect) with H-4 being found at 07.9-8.2 (20, 21).
The signal at 86.10 (lH, s) was due to a hydroxy proton while the H-5 (lH,s) and H-8
(IH, s) resonances were observed at 86.83 and 86.90 respectively.
Nuclear Overhauser Effect (NOE) experiments were carried out to establish the position
of the methoxy and hydroxy groups. This experiment is useful for studying molecular
conformation and depends on the dipolar relaxation of one proton by another. The effect
is proportional to the inverse sixth power of the internuclear distance and is thus sensitive
to conformational changes. Irradiation of the signal at 87.58 (H-4) led to the observation
of difference peaks at 86.83 (s) and 86.24 (d) hence verifying the close proximity of these
183

=cm r
protons to H-4 (spectrum 5d). The doublet at 66.24 has already been assigned to H-3,
hence the resonance at 86.83 was assigned to H-S . Upon saturation of the H-5 signal, the
intensities of the resonances at 87.58 (H-4, d) and 83.94 (OCH3) were increased
(spectrum Se). From this it was concluded that the methoxy group was in close proximity
to H-5 and hence must be located at C-6. Subsequent irradiation of the methoxy signal
only increased the intensity of the H-5 signal (spectrum Sf). This indicated that the
substituent at C-7 was the hydroxy group. The resonance at 86.90 (H-8) was irradiated
but there was no NOE observed between H-8 and the other protons confirming the
position of the hydroxy group at C-7.
The l3C NMR spectrum (spectrum 5g) however only showed resonances for five carbons
as the sample was extremely weak. The signals at 8143.3 (d), 8113.4 (d), 8107.5 (d) and
8103 .2 (d) were due to methine carbons while the signal at 856.4 (q) was due to the
methoxy group at C-6. The singlet carbons were not observed. Based on the data
obtained, compound 5 was assigned structure [5] and identified as 7 -hydroxy-6-
methoxycoumarin, the common name of which is scopoletin.
Scopoletin [5] is possibly biosynthetically derived from ferulic acid following the scheme
outlined below. Normally the ortho - hydroxy group undergoes glucosylation (which
results in isomerisation of trans ferulic acid derivatives to the cis form). The subsequent
hydrolysis of the sugar moiety leads to closure of the ring leading to scopoletin (22).
184

fen.iic add trans-derivative
j ~CO~
- ~rlCOOH HO O_glucose
scopoletin ds-<lerivative
Sdx:rre 9.3 Biosynthesis of scopo£tin
This compound occurs widely in the plant world and could possibly be used as a
spasmolytic agent. Patnaik et a/. isolated angelicin from the aerial parts of Heracleum
thomsoni (Apiaceae) and found this compound to exhibit nonspecific spasmolytic activity
in a variety of in vivo and in vitro test models (23). This compound had a relaxant effect
on a wide variety of smooth muscle preparations from various species.
angelicin
Various other coumarins have been isolated and all have displayed spasmolytic activity
(24-27).
185

References
1. C.W.L. Bevan, D.E.U. Ekong, T.G. Halsall and P. Toft,1. ehem. Soc. (e) ,
(1967), 820.
2. lG.St.C. Buehanan and T.G. Halsall, Chem. Comm., (1969), 48.
3. lG.St.C. Buehanan and T.G. Halsall, ehem. Comm., (1969),242.
4. A Hutehings, AH. Seott, G. Lewis and A Cunningham, Zulu Medicinal Plants,
University of Natal Press, South Africa (1996), p.157.
5. V. Sewram, M.W. Raynor, D.A. Mulholland, D.M. Raidoo, Journal of
Phannaceutical and Biomedical Analysis, in press.
6. D.AH. Taylor, Phytochemistry, 20 (1981), 2263.
7. S.A Jonker, M.H.H. Nkunya, L. Mwamtobe, l Geenevasen and G-J, Koomen,
Nat. Prod Lett., 10 (1997), 245.
8. T.D. Pennington, and B.T. Styles, Blumea, 22 (1975), 476.
9. lD. Connolly, Chemical Society Symposium on Natural Products, (1976),
Nottingham.
10. ARH Taylor and D.AH. Taylor, Phytochemistry, 23 (1984), 2676.
11. ARH Kehrli, D.AH. Taylor and M. Niven, Phytochemistry, 29 (1990), 153 .
12. KK Purushothaman, M. Venkatanarasimhan, A Sarada, lD. Connolly and D.S.
Ryeroft, Can. 1. Chem., 65 (1987),35 .
l3. P.K Agrawal and D.C. Jain, Progress in NMR Spectroscopy, 24 (1992), 1.
14. S. E. Iourine, Extractivesfrom the eelastraceae andMeliaceae, PhD thesis,
University of Natal (1996).
15. P. Crews and E. Kho-Wiseman, Tetrahedron Lett., 1978, 2487.
16. T. Beyrich, 1. Chromatogr., 13 (1964), 181.
17. D.l Crosby and RV. Berthold, Anal. Biochem., 4 (1962), 349.
18. R.D.H. Murray, l Mendez, S.A Brown, The Natural Coumarins, 1. Wiley &
Sons, New York, USA (1982), p.22.
19. W. Steck and M. Mazurek, Lloydia, 35 (1972),418.
20. 1. F. Fisher and HE. Nordby, J. Food Sci., 30 (1965), 869.
186

2l. 1. F. Fisher and H.E. Nordby, Tetrahedron, 22 (1966), 1489.
22. Reference 14, p.62.
23. G.K Patnaik, KK Banaudha, K. A. Khan, A. Shoeb and B.N. Dhawan, Planta
Med., (1987), 517.
24. G.K Patnaik, A. Shoeb, M.D. Manandhar, R.S. Kapil, S.P. Popli and B.N.
Dhawan, Indian J. Pharmacal., 10 (1978), 82.
25 . A. Shoeb, M.D. Manandhar, R.S. Kapil and S.P. Popli, J. Chem. Soc. Chem.
Commun., (1979), 28l.
26. S.H . Rizvi, A. Shoeb, R.S. KapiJ, S.P. Popli, Indian J. Pharm. SCi., 41 (1979),
205 .
27. G.K. Patnaik and B.N. Dhawan, J. Ethnopharmacol., 6 (1982), 127.
187

CHAPTER 10.
Extractives from Clivia miniata (LindL) Regel.
10.1 The genus Clivia
Clivia miniata belongs to the Amaryllidaceae family which is extremely widespread. This
family contains a large number of species that are indigenous to nearly every part of the
world except the tropics where only few species have been found (1). The Amaryllidaceae
alkaloids have aroused interest in a wide range of biological fields . They are known to
exhibit different pharmacological and microbiological effects such as antiviral, antitumoral
and anticholinergic (2). Some of them have been used in the treatment of myasthenia
gravis, myopathy, and diseases of the nervous system.
Clivia miniata is indigenous to KwaZulu-Natal and is used for a number of medical
purposes. The root is used as a snake-bite remedy by the Zulu and by the Xhosa in the
Transkei (3). The Zulu also use the root in treating febrile conditions and the herb to
facilitate delivery at childbirth or to initiate parturition when its onset is retarded (4). The
bulb decoctions are also used by the Xhosa for infertility and urinary complaints (3).
Previous investigations into the chemical constituents of this plant has resulted in the
isolation of several alkaloids. The alkaloids ciivonine, ciivatine, lycorine and clivonidine
were isolated from the total plant cultivated in Egypt (5).
188

o
< o o
Clivonire
HO .••
o
< o
Lycom
o
< o
OH
o
< o
o
Clivatire
o Clivonrlire
o OH
O~CH3
Small amounts of clivi mine and lycorine have also been isolated from the leaves by
Jaspersen-Schib (6).
o )
o o
Clivimine
189

Other alkaloids isolated from the plant include cliviahaksine, cliviamartine, clivojuline
and clivisyaline (8-11)
OH
o CJiviahaksine CJiviamutine
OH
Clivisyaline CJivojuline
Lycorine is the most widespread of the Amaryllidaceae alkaloids and is responsible for
the antiviral activity this plant is said to exhibit (12). Poliomyelitis virus inhibition
occurred at lycorine concentrations as low as 1 Jlglml, while concentrations exceeding 25
Jlglml were cytotoxic. Clivimine, clivonine and cliviamartine showed no antiviral
properties.
In this study the supercritical fluid extract of the roots of C. miniata were analysed in an
attempt to identify the uterotonic principle present. While the literature review of this
plant indicated that alkaloids were the main group of compounds present, there were no
alkaloids found in the SFE extract of this plant suggesting that the extraction conditions
employed were not favorable for the extraction of these compounds.
190

10.2 Structural elucidation of compounds isolated from Oivia miniata
10.2.1 Compound 6
[6]
Compound 6 was identified as linoleic acid [6] and it was the major component contained
in the fatty acid mixture. This mixture was insoluble in methanol and it appeared as a
white precipitate as the SFE extract was passed into methanol during extraction.
However, upon removing this precipitate from methanol, it turned into a colourless oil.
The IH NMR spectrum of this compound (spectrum 6a) revealed that it was a fatty acid.
Since fatty acids generally occur as mixtures and are difficult to separate by gravity
column chromatography, GC-MS analysis was carried out on this mixture. The
experimental condItions for analysis are outlined in section 5.15 . Free fatty acids are
highly polar and often have great difficulty in eluting from a GC column. Hence, the
methyl esters of these fatty acids were formed so that analysis could be made possible.
The fatty acid fraction was esterified following the method described in section 5.16.
Figure 10.1 shows the total ion chromatogram of the esterified fraction with the major
component having a retention time of 34.74 minutes. The mass spectrum of this
compound compared well with the mass spectrum of methyl lino le ate (Figure 10.2), hence
the major component in the esterified fraction was identified as linoleic acid.
191

undance
2500000
2000000
1500000
1000000
500000
o irne'--> ,--
Figure 10.1 GC-MS total ion chromatogram of esterified fatty acid mixture showing methyllinoleate as the major component.
192

Abundance i I
8000
6000
4000
2000
6'7
55
Scan 2809 (34.735 min): VIK7.D (*)
81
I 95
263 294
/z--> O~~~~~~~~~~~~~~~~~rrrrnl"~I""""~rr~,,~,,
60 80 100 120 140 160 180 200 220 240 260 280 ~undance I
#127419: 9,12-octadecadienoic acid (Z,Z)-, methyl ester (*)
I
I I i
i i I !
8000
6000
4000
2000
i ,m/z-->
o
67 8 ~ 95
54 I I
I
123 I 136150 I I j
I
I 11 262 i ' I 1 ' I ' I 1 1 I I
60 80 100 120 140 160 180 200 220 240 260 280 .1. ' l 1 I
Figure 10.2 El mass spectrum for methyllinoleate with the matching spectrum from the Wiley library confirming the identity of linoleic acid.
193
294 l
I

Linoleic acid is of great significance in this plant as it may attribute to the uterotonic
effects of this extract and hence support the ethnomedical claims of its use in initiating
labour. It is a precursor of the eicosanoids (20-carbon fatty acids) which include
leukotrienes, prostaglandins, thromboxanes and related compounds. Linoleic acid is
esterified to form phospholipids (primarily phosphatidylethanolamine or
phosphatidylcholine) in cell membranes activating phospholipase A2 which, in turn ,
hydrolyses membrane phospholipids resulting in the release of arachidonic acid. The
arachidonic acid is then acted on by the enzyme arachidonic acid cyclooxygenase
(prostaglandin endoperoxide synthetase) to produce prostaglandins (13) . Prostaglandins
F2a. and E2a. have direct stimulatory effects on uterine contractility and are synthesised in
large quantitities during initiation of labour. In support of the proposition that the release
of arachidonic acid is crucial to the onset and maintenance of labour, it was found that the
concentration of nonesterified arachidonic acid in amniotic fluid obtained after the onset of
labour increased six-fold compared with that in amniotic fluid obtained at term before the
onset oflabor (14).
194

10.2.2 Compound 7
[7]
High resolution mass spectrometry indicated that the compound had a molar mass of
126.0307 g.mol-' correct for the formula C6H60 3 (calculated 126.0317) (spectrum 7a).
Characteristic fragments occurred at mlz 109 [M - OHt and at mlz 97 [M - CHOt. The
small signal at mlz 234 may have resulted due to dimer formation resulting in [7a] below.
[7a]
This may have occurred in the GC-MS due to dehydration ofthe molecule.
The infrared spectrum (spectrum 7b) showed a strong band at 3423 cm-' indicative of a
hydroxy group_ The intense sharp band at 1670 cm-' together with the signals at 2924cm
, and 2855 cm-' confirmed the presence of an a,~ unsaturated aldehyde. The small, sharp
band at 1190 cm-' suggested that an ether linkage was present as this band arose from the
C-O-C symmetric stretching vibrations. The band at 1521 cm-' indicated unsaturation in
the molecule.
195

indicated that the aldehyde group was attached to a quaternary carbon. Two resonances
occurring at 67.42 (lH, d, J3•4 = 3.6Hz) and 66.61 (1H, d, J3•4 = 3.6 Hz) were due to
vicinal protons in an unsaturated heterocydic system and were assigned to H-3 and H-4
respectively. The signal at 63 .39 was due to a hydroxy group proton while the -CH20
group protons resonated at 64 .65 (2H).
The BC NMRspectrum displayed resonances for six carbons (spectrum 7d). Multipicity
assignments from the DEPT spectrum indicated three doublets and orie triplet. The
remaining two signals were assigned as singlets. The doublet at 6177.7 was due to the
aldehyde carbon while the resonances at 8122.7 (d) and 8110.0 (d) were due to C-3 and
C-4 respectively. The signal at 857.6 (t) was due to a -OCH2 group carbon and this was
supported by the resonance in the IH NMR spectrum at 84.65 (2H). The two singlets at
8160.5 and 8152.4 were due to quaternary carbons and were assigned to C-5 and C-2
respectively. This compound was established as a 2,5-disubstituted furan. The carbon
resonances compared well with published data (15).
An NOE experiment was carried out by irradiating the aldehyde proton signal at 89.57.
This led to an incease in the intensity of the signal at 67.42 revealing the close proximity of
H-3 (spectrum 7e). Based on the spectral data, this compound was identified as 5-
hydroxymethyl-2-furancarboxaldehyde. This compound is obtainable from various
carbohydrates and is a constituent of numerous plants. Recently, it was found to be
present in a Chinese crude drug (15) where it was found to possess aldose reductase CAR)
inhibitory activity.
196

References
1. O. Queckenberg, A.W. Frahm, D. Muller-Doblies and U-Muller-Doblies, Planta
Med, 58 (1992), A699.
2. M.A. Abd El Hafiz, M.A. Ramadan, M.L. lung, lP. Beck and R. Anton, Planta
Med., 57 (1991), 437.
3. lM. Watt and M.G. Breyer-Brandwijk, The Medicinal and Poisonous Plants of
Southern and Eastern Africa, E&S Livingstone Ltd, London, UK (1962), p.28.
4. DJ.H. Veale, K.I. Furman and D.W. Oliver, J Ethnopharm., 36 (1992), 185.
5. A.A. Ali, S.A. Ross, A.M. EI-Moghazy and S.A. EI-Moghazy, J Nat. Prod. , 46
(1979), 350.
6. R. Von Jaspersen-Schib, Pharm. Acta. Helv., 45 (1970), 424.
7. S. Kobayashi, H. Ishiawa, E. Sasakawa, M. Kihara, T. Shingu and A. Kato, Chem.
Pharm. Bull., 28 (1980), 1827.
8. W. Dopke and S.A. Roshan, Z. Chem, 22 (1982), 310.
9. W. Dopke and S.A. Roshan, Z. Chem, 20 (1980), 374.
10. W. Dopke and S.A. Roshan, Z. Chem, 21 (1981), 223.
11. W. Dopke and S.A. Roshan, Heterocycles, 16 (1981),529.
12. M . Ieven, A.J. Vlietinck, D.A. Van Den Berghe, l Totte, R. Dommissee, E.
Esmans and F. Alderweireldt, J Nat. Prod., 45 (1982), 564.
13. Ronald F. Borne, In: Principles of Medicinal Chemistry, W.O. Foye, T.L. Lemke
and D.A. Williams (Eds.), Williams & Wilkins, Baltimore, USA (1995), p.538.
14. l Seitchik and N. Chattkof, Ohstet. Gynecol., 48 (1976), 436.
15. M. T. W. Ream, Aust. J Chem., 29 (1976), 107.
16. M. Shimizu, Y. Zenko, R. Tanaka, T. Matsuzawa and N. Morita, Chem. Pharm.
Bull., 41 (1993), 1469.
197

CHAPTER 11
Extractives from Grewia occidentalis
11.1 The genus Grewia
The genus Grewia belongs to the Tiliaceae family which is a fairly large family found
throughout the world but especially abundant in the tropical and subtropical regions (1).
Grewia is a large genus of more than 400 species widely distributed in Africa, Asia and
Australia.. Extracts from Grewia asiatica Linn. produces significant hypoglycaemic
effects in diabetic rats (2). Lakshmi and Chauhan (3) isolated grewinol, a long chain keto
alcohol from the flowers of this plant
grewinol
Further investigations into this species resulted in the isolation of a new B-Iactone 7-
hydroxy-3 ,21 ,24-trimethylhentriacontan-5-olide (1).
7-h ydroxy-3,21,24-trimethythentriacontan-5-olide
198

Bashir et al. (4) carried out chemical investigations on the roots of Grewia villosa and
isolated 12-ursene-3, 19,28-trioI.
12-u rsene-3 ,19,28-triol
There have been no reports on the analysis of extracts from Grewia oecidenta/is. This
plant is much used by the Zulu as a medicine. The root and wood are used to facilitate or
procure delivery while the bark is used for bladder ailments (5) . There have been no
reports cited in the literature of chemical investigations being carried out on this plant.
Hence the SFE extracts of the wood of this plant were analysed in order to determine the
active principle responsible for its uterotonic effects.
199

11.2 Structural elucidation of compounds isolated from Grewia occidentalis
11.2.1 Compound 8
HO
[8]
This compound was isolated as a light yellow amorphous material displaying an Rr value
of 0.33 with a mixture of hexane (50%), methylene chloride (40%) and methanol (10%).
High resolution mass spectrometric analysis (spectrum 8a) of this compound showed that
the ~ peak occurred at mlz 178.0625, correct for the formula C lOH lO0 3 (calculated
178.0630). The fragmentation pattern was consistent with a monomethoxy monohydroxy
cinnamaldehyde (6). Characteristic peaks occured at mlz 177 [M - Hr, mlz 163 [M -
CH3r and mlz 149 [M - CHOr.
The infrared spectrum (spectrum 8b) displayed a strong band at 3424 cm-\ indicating the
presence of a hydroxy group . The sharp band at 1664 cm-\ was due to the presence of an
a.,~-unsaturated carbonyl group while the two bands between 2700 cm-\ and 2850 cm- l
strongly suggested that the compound possessed an aldehyde group. Strong sharp bands
at 1587 cm- l and 1514 cm-\ indicated that the compound was of an aromatic nature while
the bands at 1286 cm-\ and 1130 cm-\ suggested that the aromatic nucleus was 1,3,4-
trisubstituted. The band at 971 cm- l was due to the C-H out-of -plane bending of a trans
methine group.
200

The IH NMR spectrum (spectrum 8c) displayed resonances at 89.63 (lH, d, J 2',3' = 7.65
Hz), 87.38 (lH, d, J 1',2' = 15.9 Hz) and a double doublet at 86.57 (lH, dd, J 1',2' = 15 .9
Hz, J 2',3' = 7.65 Hz) indicating the presence of a trans CH=CH-CHO moiety as shown
below,
l ' 3'CHO Ar~ z
From the above diagram it can be seen that both H-3' and H-l' are split into doublets as a
result of H-2' while H-2', in turn, is split by H-l' into a doublet and further by H-3'
resulting in a double doublet. The coupling of H-2' to both H-l' and H-3' was confirmed
. by the COSY spectrum (spectrum 8d)
The IH NNfR spectrum also showed resonances at 83.93 (IH, s, OCH3) and 85.95 (lH,
OH) due to methoxy and hydroxy group protons respectively. The hydroxy group proton
signal was confirmed by its disappearance after addition of D20 to the sample (spectrum
8e). The resonances in the region 86.88 to 87.20 were due to the protons on the aromatic
nucleus. The resonance at 86.94 (lH, d, J 5,6 = 8.2 Hz) was due to H-5 and was arrha
coupled to H-6. The resonance at 87.10 (lH, dd, J 5,6 = 8.2 Hz, J 2,6 = 1.8 Hz) was
attributed to H-6 as it was observed to be arrha coupled to H-5 resulting in a doublet
followed by further splitting into a double doublet as a result of meta coupling to H-2, the
signal of which was observed at 87.05 (lH, d, J2,6 = 1.8 Hz). While at this point it was
known that the aromatic ring was 1,3,4-trisubstituted, the position of the methoxy and
hydroxy groups was uncertain.
NOE experiments were carried out by irradiating the methoxy group proton signal at
83.93. This resulted in an enhancement of the H-2 signal at 87.05 as shown below
(spectrum 8t). As there were no more NOE signals observed, it was clear that the
hydroxy group was attached to the neighbouring carbon.
201

Irradiation of the H-2 signal at B7.05 resulted in the enhancement of the resonances at
B3 .93, B6.57 (H-2') and 07.38 (H-I') indicating that this proton was in close proximity to
the propanoid side chain (spectrum 8g). There is free rotation about the C-I, C-l' bond,
thus one would expect to get positive signals for both these protons when H-2' is
irradiated.
This compound was hence deduced as 3-( 4-hydroxy-3-methoxyphenyl)-2-propenal, the
common name of which is coniferaldehyde. This compound compared well to published
data and has also been reported to occur in the roots of Tamarix nilotica (Tamaricaceae)
(6) .
202

11.2.2 Compound 9
[9]
This compound was isolated as a brown amorphous substance displaying an Rf value of
0.25 with a mixture ofhexane (50%), methylene chloride (20%) and ethyl acetate (30%).
High resolution mass spectrometric analysis indicated a molar mass of 208 .0700 g.mor!
correct for the molecular formula CllH120 4 (calculated 208 .0735) (spectrum 9a) but
subsequent elucidation of the structure using NMR techniques indicated that this was not
the molecular ion. Hence, the mass spectrum results were inconclusive as the molecular
ion peak may have been too weak to be detected or the molecule may have fragmented
prior to detection of the molecular ion.
The infrared spectrum (spectrum 9b) displayed a resonance at 3418 cm-I due to OH
stretching vibrations. This band was later attributed to traces of water contained in the
sample as the final structure did not possess a hydroxy group. The strong, sharp band at
1677 cm-! was due to the presence of a carbonyl group while the bands at 2939 cm-! and
2847 cm-! suggested that the compound contained an aldehyde group. The strong band
at 1588 cm-! indicated unsaturation in the molecule while the bands in the region 1513
cm-! to 1330 cm-! indicated that the compound was of an aromatic nature.
203

The IH NMR spectrum of this compound (spectrum 9c) showed certain similarities to that
of the previous compound. The resonances at 69.64 (lH, d, J 2",3" = 7.65 Hz), 67 .36 (lH,
d, J \",2" = 15.9 Hz) and a double doublet at 86.59 (IH, dd, J 1",2" = 15 .9 Hz, J 2",3" = 7.65
Hz) once again indicated the presence of a trans CH=CH-CHO group. A second
aldehyde proton resonance at 69 .80 (IH, s) indicated that this group was attached to a
quaternary carbon atom as no splitting of the signal was observed. The resonances at
87.13 (2H, s) and 66.79 (2H, s) were each due to two chemically equivalent aromatic
protons as observed from the integration signal. The resonances at 63 .92 (6H, s) and
63 .95 (6H, s) were each due to the protons of two chemically equivalent methoxy groups.
The l3C NMR spectrum (spectrum 9d) displayed twelve resonances. Multiplicity
assignments revealed six doublets and one quartet. The remaining five signals were
assigned as singlets. The signals at 8153 .1 (d) 6126.8 (d) correlated with proton
resonances at 67.36 (H-l") and 66.59 (H-2") respectively in the HETCOR spectrum
(spectrum ge), while the signals at 6106.7 (d) and 6105 .6 (d) correlated with proton
resonances at 67.13 (2H) and 66.79 (2H) respectively. The latter observation indicated
that the carbon signals were each due to two equivalent carbon atoms. The carbon
resonance at 656.4 (q) was found to correlate with the four methoxy group proton signals
at 63 .92 (6H) and 63.95 (6H). The signal at 6147.3 (s) was attributed to the four
chemically equivalent fully substituted carbons bearing the methoxy groups while the
resonances at 6125 .3 (s), 6128.4 (s), 8138.0 (s) and 8140.9 (s) were attributed to the
quaternary aromatic carbons. It was evident that the compound possessed twenty carbons
and the spectral information gathered thus far indicated two symmetrical benzene rings
each with two equivalent methoxy groups and two equivalent protons, hence the following
biphenyl derivative was proposed:
204

R1} R2 OMe or H
R3} ~ OMe or H
NOE experiments were carried out to establish the position of the methoxy groups and
aromatic protons. Irradiation of the signal at 87.36 (H-I") led to the enhancement of the
signals at 89.64 (H-3") and 86.79 (2H, s) (spectrum 9f). This led to the conclusion that
the two equivalent aromatic protons were in close proximity to the propanoid skeleton
and were placed at carbons 3 and 5 indicating two methoxy groups to be placed at C-2
and C-6. Irradiation of the other aromatic proton signal at 87.13 (2H) led to the
enhancement of the signals at 89.80 (IH, s, CHO) and 83.92 (6H, s, 2 x OCH3)
confirming the position of H-3' and H-5' as well as showing that these protons occurred
adjacent to the aldehyde and methoxy groups (spectrum 9g). Hence this compound was
identified as 2,2' ,6,6'-tetramethoxy-4'-al-4-( ro-oxo-E-propenyl)-biphenyl. This compound
has not been isolated previously although biphenyl derivatives such as zeyherol [9a]
which was isolated from the wood of Zeyhera digitalis (Bignoniaceae) (7) are known.
[9a]
205

11.2.3 Compound 10
This compound was identified as oleanonic acid [2] on the basis of its lH_NMR spectrum
and was also isolated from the SFE extract of the wood of Eke b ergia capensis. The
structure elucidation of this compound is discussed in section 9.2.2.
References
1. V. Lakshrni, S.K. Agarwal and 1.S. Chauhan, Phytochemistry, 15 (1976), 1397.
2. I.A Dogar, M . Ali and M. Yaqub,.J. Pak. Med.Ass., 38 (1988), 289.
3. V. Lahshrni and J.S. Chauhan,1. Nat. Prod., 39 (1976),372.
4. AK. Bashir, M.S.F. Ross and T.D. Turner, Fitoterapia, 53 (1982), 71.
5 1.M. Watt and M.G. Breyer-Brandwijk, The Medicinal and Poisonous Plants of
Southern and Eastern Africa, E&S Livingstone Ltd, London, UK (1962), p.28.
6. H.H. Barakat, M.AM. Nawwar, 1. Buddrus and M. Linscheid, Phytochemistry, 26
(1987),1837.
7. 1. C. Da Silveira, O.R. Gottlieb and G. G. De Oliveira, Phytochemistry, 14 (1975),
1829.
206

CHAPTER 12
In vitro screens and functional assays of isolated compounds
12.1 Introduction
In the drug discovery process, compounds that demonstrate therapeutic potential must
have limited, or preferably be free, of undesirable side effects. Compounds that interact
with more than one target, such as membrane and cytoplasmic proteins and receptors,
have the potential to elicit side effects; in comparison to those compounds that are
selective for a single target. One predictive measure of whether a compound demonstrates
specificity is to profile a compound's activity through a series of receptor binding assays in
what is termed a safety screen. For example, activity in an a- or ~-adrenergic receptor
assay may be indicative of potential cardiovascular side effects. If a compound shows
activity in an opiate receptor assay, then further studies to determine analgesic activity or
addictive liability need to be considered. This chapter discusses the muscle activity
induced by some of the pure compounds isolated from the three plant extracts followed by
a further study on receptor pharmacology.
12.2 Receptors and biological response
The interaction of a drug with a receptor is analagous to a lock and a key. Thus, certain
compounds would fit into the receptor and activate it, leading to a high degree of
specificity. Although such a situation might be considered ideal for drug therapy, in
actuality, few drugs interact only with their intended receptors. A receptor site may bind
only one of many conformations of a flexible drug molecule (1). This pharmacophoric
conformation has the correct spatial arrangement of all the binding groups of the drug
molecule for alignment with the corresponding binding sites on the receptor, as shown in
Figure 12.1. Molecules that can adopt the conformation required for binding may act as
agonists or antagonists to the action of the receptor. An antagonist molecule may be
bound to a receptor site and therefore not trigger the pharmacologic response because of
207

the absence of some key functional groups in the molecule. Alternatively, in the bound
state, the molecule may be conformationally constrained in such a way that the functional
group that effects the response cannot interact with the receptor to elicit the reaction.
a. Agonist molecule with essential groups for binding and eliciting response
b. Antagonist molecule with essential binding groups but lacking the group necessary for eliciting response.
c~ Antagonist and optical Isomer of molecule in a, which
. can bind but cannot elicit response.
Figure 12.1 lllustration of the different conformations of drug molecules and their ability to bind to the receptor surface (7).
For example, in Figure 12.1a, groups A and B are essential for binding, and group C
triggers the response. A molecule possessing groups A and B and not possessing group C
(Figure 12.1 b) will probably bind to the receptor surface but the receptor will not elicit a
response because of the absence of group C's effect on it. In Figure 12.1c, the optical
isomer of the original molecule (Figure 12.la) would possibly be an antagonist, because it
can adopt a conformation that permits binding to the receptor but cannot adopt the
conformation that permits both binding and correct alignment of group C, which elicits the
response.
The activation of receptors by drugs in isolated tissues can be divided into three processes:
[I] the delivery of the drug from the organ bath solution to the receptor compartment, [2]
208

compartment, [2] the interaction of the drug with the receptor, and [3] in the case of
agonists, the transduction of receptor stimulus into tissue response (2). These latter two
processes are termed the "pharmadynamic" phase of drug action (3,4). The first step is
the delivery of the drug to the drug receptor, a bulk diffusion phenomenon that can be
affected by chemical, physical, and biochemical processes.
12.3 The role of chemical bonding
When a drug interacts with a receptor, several chemical attractive forces are responsible
for the initial interaction. Assuming a compound has been distributed properly to the
general area of the receptor in the body, a function simply of its physical characteristics,
the ability of that compound to diffuse in close enough proximity to the receptor to
interact with it depends initially on the types of chemical bonds that can be established
between the drug and the receptor. The overall strengths of these bonds vary (Figure
12.2) and determine the degree of affinity between the drug and the receptor (5). Most
therapeutically useful drugs bind only transiently to their intended receptor. The
combination of a variety of bonds including ionic, hydrogen and van der Waal's attractive
forces can contribute to the initial binding of a drug to the receptor. Once the drug has
bound, a biological response may result (if an agonist). Following binding of the
receptor, a conformational change in the receptor may occur that initiates the activation of
the biological response and also changes the attractive environment between the drug and
the receptor, thereby allowing for the dissociation of the drug-receptor complex. Specific
three-dimensional requirements must be satisfied for a compound to act effectively as an
agonist.
209
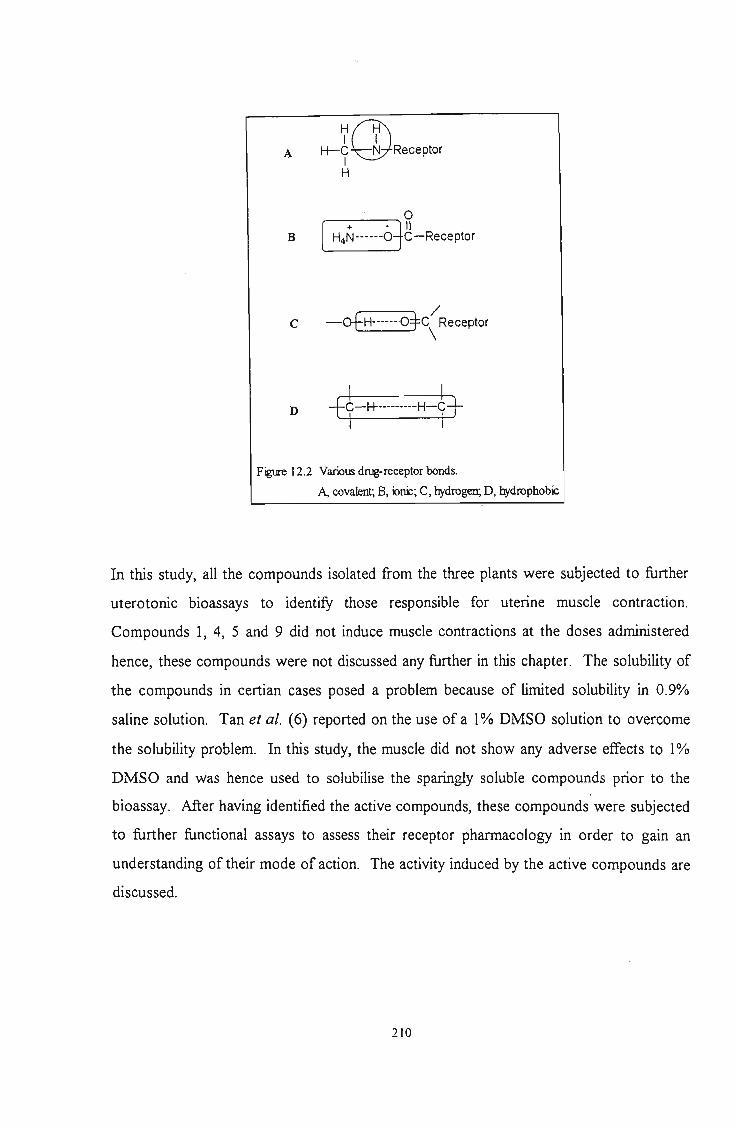
A
B
c
D
I I HQ) H-C N Receptor
I H
, 0
( H4Nm---Oi~-RecePtor
/ -OfH-u-u·03=C Receptor
\
Figure 12.2 Various drug-receptor bonds.
A, covalent; B, x,n£; C, hydrogen; D, hydrophobic
In this study, all the compounds isolated from the three plants were subjected to further
uterotonic bioassays to identify those responsible for uterine muscle contraction.
Compounds 1, 4, 5 and 9 did not induce muscle contractions at the doses administered
hence, these compounds were not discussed any further in this chapter. The solubility of
the compounds in certian cases posed a problem because of limited solubility in 0.9%
saline solution. Tan et al. (6) reported on the use of a 1 % DMSO solution to overcome
the solubility problem. In this study, the muscle did not show any adverse effects to 1 %
DMSO and was hence used to solubilise the sparingly soluble compounds prior to the
bioassay. After having identified the active compounds, these compounds were subjected
to further functional assays to assess their receptor pharmacology in order to gain an
understanding of their mode of action. The activity induced by the active compounds are
discussed.
210

12.4 Analysis of compounds from Ekebergia capensis
12.4.1 Compound 2
Oleanonic acid [2] was dissolved in a 1% DMSO solution at a concentration of 1.83
1-lg/1-lI. Following an agonistic response to 5 I-lg ACh, the muscle was observed to develop
spontaneous contractions that were monitored over a 15 minute period (Figure 12.3).
Oleanonic acid was found to elicit a muscle response after five cumulative additions of366
I-lg quantities of this compound to the organ bath. Subsequent addition of ACh produced ,
a larger response than initially observed. This trend with the increase in ACh response has
been consistent throughout the screening process of Ekebergia extracts. The contractile
activity induced by oleanonic acid was of varied amplitude, with each contractile pulse
lasting approximately 40 seconds.
5 J.lg ACh
J 5 x 366 J.lg of compound 2
J J J J J
w w
I 5 min
Figure 12.3 Electrical recording of contractions induced by compound 2 of Ekebergia capensis on a non-pregnant uterus. w = muscle wash
211
5 J.lgACb
r I I
I w

12.4.2 Compound 3
3-epioleanolic acid [3] was dissolved in a 1% DMSO solution at a concentration of 1.77
Ilg/Ill. 10 Ilg ACh was administered to produce a muscle response followed by the
addition of3541lg quantities of3-epioleanolic acid to the organ bath (Figure 12.4). Apart
from the spontaneous contractions of the muscle, a cumulative dose of 708 Ilg was
observed to increase the amplitude of the contractions in the spontaneously contracting
uterus. Further additions of 354 Ilg quantities of this compound was found to further
increase the amplitude of the contractions in a concentration-dependent manner. The
muscle was thereafter washed and a subsequent addition of 10 Ilg ACh showed an
increased ACh response once again.
10 v.g ACh
10 v.g ACh l
4 x 354 )lg of compOlUld 3
w
15 . mm
Figure 12.4 Electrical recording of contractions induced by compound 3 of Ekebergia capensis on a non-pregnant uterus. w = muscle wash
212

Unlike oleanonic acid, this compound displayed efficacy at much lower doses. An
increase in both the tonicity and frequency of contractions was also observed. The only
difference between these two compounds was the presence of a keto group at carbon 3 for
oleanonic acid and the a-hydroxy group for 3-epioleanolic acid. These minor changes in
the molecule can affect its intrinsic activity on the muscle (7) . 3-epioleanolic acid was
found to induce muscle contraction at much lower doses and within a shorter time period
than oleanonic acid. This may have resulted from the ability of the 3-epi compound to
reach the active site of the receptor or to be metabolised more readily than oleanonic acid.
The longer time period necessary for oleanonic acid to induce activity may have resulted
due to a longer diffusion period required for the compound to enter the receptor
compartment.
The dissolution of a drug from the point of injection into a well mixed organ bath occurs
relatively rapidly, however the diffusion coefficient of drugs in tissues is slower than in
free solution (8). This is due to the longer path that a drug must take through a tissue to
accomodate the numerous obstructions in the morphological organization of the muscle.
One factor thought to be responsible for the difference in diffusion rates is tissue
thickness. The diffusion time is related to tissue thickness (L) by the following equation
(9):
t (12.1) 2D
Considering the morphological architecture of the tissues to be reflected by the tortuosity
factor (2), this equation can be modified to:
L222 t
2D (12.2)
where D is the diffusion coefficient of the drug in free solution. Factors which affect L
will correspondingly alter the diffusion time.
213

Physicochemical properties, such as electronegativity, polarizability, bond angles, van der
Waal's radii, number of substituents and charge of the atom can greatly influence the
physicochemical characteristics of the molecule. Drug molecules in turn exert their effect
by influencing receptor sites through their physicochemical properties. It follows
therefore, that alteration of a group in a molecule will change the physicochemical
properties of the molecule and thereby the biological response to it. The other
compounds that were isolated from this plant were also subjected to bioassays however
these were found to be inactive as there was no indication of uterine muscle stimulation.
12.5 Analysis of compounds from Clivia miniata
12.5.1 Compound 6
Compound 6 was identified as linoleic acid [6] and has a limited solubility in aqueous
media and even a 1 % DMSO solution failed to adequately dissolve this compound. 3 ml
of 1 % DMSO solution was added to 37.8 mg of this compound and the vial shaken to
adequately disperse the compound in solution. Thereafter a cumulative volume of 150 III
(3 x 50 J..lI) was added before a maximum contractile response was observed (Figure
12.5). The dose was repeated however this time the muscle was set into a series of
irreversible, irregular contractions. Further washing failed to stop the contractile process.
Linoleic acid is able to penetrate cellular membranes rapidly to exert its effect, as it is
extremely fat soluble. Washing with tyrodes solution failed to wash away the compound
due to its hydrophobic nature. The significance of linoleic acid is important as it serves
as a precursor to arachidonic acid which, in turn, leads to the production of the
eicosinoids, two of which are the prostaglandins E 2 and F2u' During pregnancy, the uterus
produces large quantities of these prostaglandins which increase myometrial tone hence it
is not surprising that this compound induced uterine muscle contractions.
One must always be aware that when performing in vitro assays, disparity between the
concentration of the drug in the organ bath and the active drug at the receptor site can
arise if the drug promotes release of an endogenous substance in the tissue. It would be
214

expected that the magnitude of the response would be increased if the endogenous
substance produced the same qualitative response.
2 ).1gACh
f
3 x 50).11 of 150).11 of compound 1 compound 1
I , I
~ J , J J
pj I I
, w w w w~
I I 1--1 5 min
Figure 12.5 Electrical recording of pregnant guinea pig uterine smooth muscle contraction induced by compound 6 of Clivia miniata (Lindl.) Regel. w = muscle wash
215
I I

12.5.2 Compound 7
Compound 7 was identified as 5-hydroxymethyl-2-furancarboxaldehyde [7] and was
dissolved in 0.9 % saline at a concentration 1.27 Ilg/Ill. This compound (190 Ilg) was
dispensed into the muscle bath and a contractile response was observed (Figure 12.6).
Subsequent washing of the muscle decreased the muscle tension that initially developed
however the contract ions failed to stop. The compound set the muscle into a series of
contraction-relaxation cycles with the contractile responses being of an irregular nature.
The contractions were observed over a 35 minute period before removal of the muscle
from the bath. Although previous investigations have shown this plant to contain
alkaloids, alkaloids were not detected, however, in the SFE extracts.
1 J.lgACh
~ !\
190 J.lg of compound 2
~ I I
r ~ , I I
W w
I I
5 min
Figure 12.6 Electrical recording of pregnant guinea pig uterine smooth muscle contraction induced by compound 7 of Clivia miniata (Lindl.) Regel. w = muscle wash
216
W'

12.6 Analysis of compounds form Grewia occidentalis
12.6.1 Compound 8
Compound 8 was identified as coniferaldehyde [8] and was dissolved in 0.9% saline at a
concentration ofl.67 Ilg/Ill. The muscle was found to respond adequately to 1 Ilg ACh
after which the addition of this compound in known doses were carried out. A cumulative
dose of 250 Ilg was observed to bring about a maximum contractile response (Figure
12.7a). This was followed by a muscle wash and a subsequent addition of 175 Ilg of the
compound elicited a contraction in a dose-response manner. The addition of a cumulative
dose of 500 Ilg (2 x 250 Ilg quantities) produced muscle contractions of irregular
amplitude but of almost equal time intervals (Figure 12.7b).
a 1 J..Lg ACh
t
I I r---i 5 min
100 I'g 50 I'g 75 I'll
2SI'g t t t
time (min)
175 I'll
t w
b 1).19 ACh
I---l 5mln
250 j.lg
t
250 j.lg
t
time (min)
Figure 12.7 Electrical recording of pregnant guinea pig uterine smooth muscle . contraction induced by compound 8 of Grewia occidentalis L. after a cumulative dose of (a) 250 Ilg and (b) 500 Ilg. w = muscle wash
217

12.7. Assessment of mode of action through receptor binding assays
In order to determine the receptor/s through which these compounds mediated their
effects, use was made of two receptor agonists and antagonists. Two receptors that can
be involved in smooth muscle contraction are the bradykinin B2 receptor and the
muscarinic cholinergic receptor. Bradykinin was used as the standard B2 receptor agonist
while acetylcholine was used as the cholinergic receptor agonist. It is well accepted that
bradykinin can contract or dilate vascular smooth muscle (10) depending on (a) the type of
kinin receptor, (b) the type and potency of kininases present on endothelial cells and ( c)
the ability to generate nitric oxide (NO) also known as endothelium derived relaxing factor
(EDRF) (11). The cholinergic receptors are also responsible for stimulating contractions
of smooth muscles. The biological activity of the compounds were assessed both before
and after addition of the receptor blockers. HOE 140 (a peptide antagonist) (Sigma
Chemicals, St. Louis, MO, USA) was used as the B2 receptor blocker while atropine
(Sigma Chemicals, St. Louis, MO, USA) was used as the cholinergic blocking agent as it
blocks postganglionic receptors by binding to them and preventing access of acetylcholine.
12.7.1 Compound 3 from Ekebergia capensis
Bradykinin (15 ng) was administered to the uterine muscle to elicit a maximum response
(Figure 12.8). Thereafter 500 Ilg of HOE 140 was added to the muscle bath to block the
B2 receptors. Bradykinin was added once again to establish whether the B2 receptors
were blocked. Failure of a muscle contraction indicated that B2 receptors were blocked as
bradykinin did not produce a muscle response. Compound 3 was thereafter added to the
muscle bath. A dose of 354 Ilg induced a maximum response indicating that this
compound did not mediate its response through the B2 receptors as the muscle still
contracted even after blocking off the bradykinin receptors.
A subsequent addition of 1 Ilg ACh elicited a response and this showed the specificity of
the B2 receptor blocker in that, although it blocked the B2 receptor, it did not block the
cholinergic receptor since acetylcholine acts via the cholinergic recpetors. 30 Ilg atropine
was thereafter dispensed into the organ bath to block off the cholinergic receptors. To
218

confirm this, a ten fold increase of ACh was added to the bath and this failed to produce
an agonistic response. Subsequent addition of two 354 Ilg doses of compound 3 did not
initiate a muscle response indicating that the compound mediated its effect through the
cholinergic receptor since blocking the receptor failed to produce a muscle response.
15 ng Bradykinin
t HOE 140 I ~ 500IJg
i J
IS ng
354IJgof
T~ Bradykinin
i
J i
~ ~ I
w
Smin
IlJgACh
30 IJg Atropine
w_
compound 3 2x354IJg
Figure 12.8 Receptor binding assays of compound 3 from E. capensis. w = muscle wash
219

12.7.2 Compound 7 from Clivia miniata
Compound 7 also produced a muscle response at a dose of 190 Ilg even after blocking off
the B2 receptors with HOE 140 (Figure 12.9). The cholinergic receptors were blocked
with 30 Ilg atropine and the addition of 190 Ilg of the compound failed to elicit a
response. A further dose of 190 Ilg however produced an increase in tone followed by a
spasmolytic type of activity. This could be explained by the fact that at high
concentrations the compound has the ability to competitively displace the cholinergic
receptor blocker and bind to the receptor thereby bringing about a biological response.
These results indicate that this compound is a competitive or surmountable agonist hence
bringing about responses at high concentrations in the presence of the receptor blocker.
15ng bradykinin
500 Ilg HOE 140 ,
w
5min
15 ng bradykinin ,
190; Ilgof compound 2
I !
Illg ACh ,
30 Ilg atropine
~ I w
I
Illg ACh
J
2 x 190 Ilg compound 2
J J
Figure 12.9 Receptor binding assays of compound 7 from C. miniata. w = muscle wash
220

12.7.3 Compound 8 from Grewia occillentalis
Compound 8 was tested against the cholinergic receptor. The muscle was found to elicit a
contractile response to 10 IJ,g ACh. This was followed by a dose of 60 IJ,g atropine to
block off the cholinergic receptors (Figure 12.10). However this dose was insufficient as
the subsequent addition of 10 IJ,g ACh still produced a response. The dose of atropine
was increased to 150 IJ,g. Addition of the compound at an initial dose of 400 IJ,g failed to
elicit a response. A further of 1000 IJ,g was added and there was no response monitored
indicating that the compound was non-competitive or insurmountable since the inhibition
by atropine could not be overcome at the doses used. Hence this compound was also
found to mediate its effect through the cholinergic receptors as shown in the figure below.
10 IJ,gACh
~ 10 IJ,g ACh
~ I
I 60 IJ,g
r atropine
~ 150 Ilg atropine
~ 400 Ilg of compound 1 1000 IJ,g of
J compound 1
~ W W
t 5 min 1 119 ACh
Figure 12.10 Receptor binding assays of compound 8 from G. occidentalis.
w = muscle wash
221

12.8 Conclusion
These studies have indicated that the compounds analysed mediated their effects through
the cholinergic receptors . This indicates that apart from uterine muscle contractions, such
compounds may also have the potential to cause vasodilation or decrease the cardiac rate.
The compounds may have also brought about muscle contraction by increasing the
permeability of the cell membranes to calcium ions, however, there were no studies
performed using ionic channel blockers to confirm such a mechanism. Receptor
pharmacology can phl.y an important role in the area of general pharmacology, including
the identification of new lead compounds and the evaluation of these compounds for
potential side effects in a safety screen.
References
1. B. BelIeau, J. Med Chem., 7 (1964), 776.
2. E.J. Ariens, J.M. van Rossum and P.e. Koopman, Arch.1nt. Pharmacodyn. Ther.,
127 (1960), 459.
3. E.J. Ariens, Clin. Pharmacol. Ther., 16 (1974), 155.
4. E.1. Ariens and A.M. Simonis, In: Beta-Adrenoceptor Blocking Agents, P.R
Saxena and RP. Forsyth (Eds.), North-Holland Publishing Company,
Amsterdam (1976), p.3.
5. T .1. Maher, Receptor and Drug Action, In: Principles of Medicinal Chemistry,
W.O. Foye, T.L. Lemke and D.A. Williams (Eds.), WiIIiams and Wilkins,
Baltimore, USA (1995), p.75.
6. G.T. Tan, J.M. Pezzuto, A.D. Kinghom and S.H. Hughes, J. Nat. Prod., 54
(1991), 143 .
7. I. W. Mathison, W.E. SoIomons and RR Tidwell, Structural Features and
Pharmacologic Activity, In: Principles o/Medicinal Chemistry, W.O. Foye, T.L.
Lemke and D.A. Williams (Eds), Williams and Wilkins, Baltimore, USA (1995),
p.25 .
8. N . Brookes and D. Mackay, Br. J Pharmacoi., 41 (1971), 367.
222

9. R.B. Setlow and E.C. Pollard, Molecular Biophysics, Addison-Wesley Inc., MA,
London (1962), pA2.
10. D.M. Raidoo, K.D. Bhoola, Immunopharmacology, 36 (1997), 153.
1l. D. Regoli, J. Barabe, Pharmacol. Rev., 32 (1980), l.
223

CHAPTER 13
Chromatographic and electrophoretic analysis of the plant extracts
13.1 Introduction
The quality control of plant products is a general requirement and is necessary if plant
products are to fill the need for cheap and reliable medicines, or if natural products are to
be used as templates for new drug molecules. Plants biosynthesize a large variety of
compounds and the variation of the active principles from batch to batch needs to be
monitored so that dosage forms can be altered to maintain consistency in pharmacological
activity. In the previous chapter, the active principles were identified, hence it is the aims
of this chapter to characterise the plant extracts and identify the active components within
the plant matrix using different chromatographic techniques.
13.2 Reverse-phase HPLC
Reverse-phase HPLC is a widely accepted, well established and reliable analytical
method, and numerous applications in the field of natural products have been developed
(1-4)
13.2.1 Analysis of extracts from Ekebergia capensis
The total extract of the wood of E. capensis obtained at 400 atm was dissolved in 2 ml
methanol and 25 ~l aliquots injected onto the column. Figure 13.1 shows the HPLC
separation of the Ekebergia components by gradient elution using the conditions
described in section 5. The components were eluted within 30 minutes and the identity of
the peaks were confirmed by injecting the pure compounds that were isolated and further
confirmation was obtained by comparison of the DV spectrum on the photodiode array
detector. Scopoletin, being more polar eluted first from the column while oleanonic acid
and 3-epioleanolic acid eluted at higher methanol concentrations.
223

Figure 13.2 shows the chromatograms of the sequentially extracted fractions. It is quite
evident that the extraction yield of the isolated compounds increased at higher extraction
pressures. Other subtle differences in chemical composition was also observed. The
column efficiency (N) was calculated for each of the isolated compounds using equation
4.6 and was found to be 7862, 9409, and 18010 for scopoletin, oleanonic acid and 3-
epioleanolic acid respectively. The mild uterotonic effects of the 200 atm extract can be
explained due to the lower concentration of the active components than at 400 atm.
Although SFF was initially performed to fractionate the extracts and differentiate active
from inactive fractions, one must realise that in complex matrices, fractionation by SFE is
frequently difficult unless appreciable differences exist in molecular sizes, polarities or
volatilities of the mixture components. However it was observed that by increasing the
pressure of the extraction fluid, enrichment of the solute fractions occurred, however this
result is countered by a time-based fractionation effect.
Upon comparison of Figure 13.3 with Figure 13.1, one can see appreciable differences in
the two batches of Ekebergia capensis. It is quite evident that the first batch, obtained in
autumn, possesses a much lower concentration of the active components than the second
batch, obtained in spring. Seasonal changes are known to affect the chemical
composition of plants (5) and the magnitude of this effect has been observed in this study.
In the first batch, the 300 atm sequentially fractionated extract was observed to be toxic to
uterine muscle while the 300 atm sequentially fractionated extract of the second batch
indicated uterotonic activity with an increased agonistic response to ACh.
224

OAOl A. Slg~2!lO.4 R./~.ao (V1K1V\1<CXrce o)
mAu J
'~I IS) j
j I
'~ ] 0
,~j
100
MeO~
HO~O.)..O
10
time (min)
Figure 13.1 Reverse-phase HPLC chromatogram of total SFE extract of E. capensis wood obtained at 400 atm and 80°C.
Conditions: Bondc1one-l0 C 18 reverse phase column; gradient elution (methanol/water); column temperature 40°C; UV detection at 280 nm.
225

#,. '"" .,. o ,
" / rMui 200 atm ~1 . \
,1 _ "A) VIA.-fJ' ~~'v.r",J' .,.,lvv 0-J' __ o+1 --~-
DAD! A, Sig- 2IlO,4 RefaCiO,80 (VlKW11<DX05.D) :t 300 atm
:1 I
':) JU ~f~u 5 10 15
DADI A, Sig-2IlO,4 RefaCiO,80 (VlK\V1I<lXXXlS.D)
mAu j 11
I !
1
:1 400 atm
15
10
5
0+----'
II ' il ,Il l '
!
time (min)
Figure 13.2 Reverse-phase HPLC chromatogram of sequentially extracted SFE fractions of E. capensis wood.
Conditions: Bondclone-10 C18 reverse phase column; gradient elution (methanol/water); column temperature 40 QC; lTV detection at 280 nm.
226

DAD1 A, Sig=280,4 Ref=4SJ,80 (VIK\EKEBaXl2..D)
mAu
100
o
10
Figure 13.3 Reverse-phase HPLC chromatogram of first batch of SFE extract of E. capensis wood showing the variation of chemical composition with seasonal changes.
Conditions: Bondclone-lO C 18 reverse phase column; gradient elution (methanol/water); column temperature 40 QC; UV detection at 280 nm.
227

13.2.2 Analysis of extracts from C/iv;a miniata
The total 400 atm extract was chromatographed under similar conditions as for Ekebergia
capensis. Two major peaks were observed at 7.71 and 23 .09 min (Figure 13.4). This
extract showed a positive response when tested for uterotonic activity. Bioassay-guided
fractionation indicated that the sequential extract at 400 atm was most potent. Further
chromatography on the sequentially extracted fractions showed the influence of extraction
pressure on selectivity of the components. Upon increasing the extraction pressure, the
extraction yield of peak 1, identified as 5-hydroxymethyl-2-furancarboxaldehyde, was
found to increase (Figure 13 .5). Peak 2 however decreased suggesting that this was
unlikely to be the active component. Peak 1 was subsequently identified as the active
component. Attempts to isolate peak 2 and identify the compound failed as this
compound decomposed. Figure 13.6 shows the effect of seasonal changes on the
chemical constituents of this plant. In spring, the concentration of the active principle was
observed to be high as judged from the peak intensities of this compound in both the IIWI
batches. XIX)
OHC~C~OH
/ 2
15:0
lOCO
time (min)
Figure 13.4 Reverse-phase HPLC chromatogram of total SFE extract of C. miniata root obtained at 400 atm and 80°C. Conditions: BondcIone-l0 C 18 reverse phase column; gradient elution (methanol/water); column temperature 40°C; UV detection at 280 nm.
228
=

-OAOl A. Sig-2IlO.4 Re'-4EO.eo (VlK\CLlVS2El .0)
mAu
200 atm 15::0
1250
IOD
2
~ _~[. ________ J ______ _ ID 20
OAOI A. Sig=2IlO.4 Re'-4EO.eo (VlK\CLIVS3E 1.0)
mAu
300 atm 17S0
15::0
1250
IOD
10 20 OAOI A. Sig-2IlO.4 Ref-4EO,eo (VlK\CLlVS4E2.0)
mAu
400 atm 17S0
15::0
1250
IOD
0+----" L-____________ ~1~0 ________ ~2O~ ______ ~~~ ______ ~~~ ______ ~~=_ __ ~
Figure 13 .5
time (min)
Reverse-phase HPLC chromatogram of sequentially extracted SFE fractions of C. miniata root. Conditions: Bondclone-lO C 18 reverse phase column; gradient elution (methanol/water); column temperature 40°C; UV detection at 280 nm.
229

DAD1 A, SIg'28J,4 Re/Oo45O,eo (VlKICLIVTE01 .D)
mAu
A eoo
o
5 10 15 20 25 DAD1 A, SIg:28J,4 Ret.@,eo(VlKICUV14T1.D)
mAu
B eoo
0-+------'
5 10 15 20 25
time (min)
Figure 13.6 Reverse-phase HPLC chromatogram of total 400 atm SFE extracts ofe. minata root showing the variation of chemical composition with seasonal changes. (A) second batch of plant material obtained during Spring
(B) first batch of plant material obtained during Autumn Conditions: Bondclone-l0 C 18 reverse phase column; gradient elution (methanol/water); column temperature 40°C; UV detection at 280 run.
230

13.2.3 Analysis of extracts from Grewia occidentalis
The total 400 atm extract showed the presence of two major components although other
minor chemical constituents were observed to co-elute (Figure 13 .7). The results obtained
following bioassay-guided fractionation indicated that the sequentially fractionated extract
at 300 atm was most potent. Hence the sequential extracts were chromatographed in
order to observe the differences in the complexity of the matrix as a result of pressure
changes (Figure 13.8). The 200 atm extract showed three minor peaks however the 300
atm extract displayed two major peaks at 12.78 and 14.83 min respectively, as observed
for the total 400 atm extract. The extract at 400 atm displayed an increase in the second
peak height indicating an increase in the concentration of this compound (Figure 13 .8, n =
4089). Peak 1 was found to be the active component and the difference in uterotonic
activity between the 300 atm and 400 atm extracts can be attributed to the possible
antagonistic effects of peak 2 hence limiting the agonistic ability of peak 1 to induce
uterine muscle contractions.
Upon comparison of this batch of extract with the first batch, it is quite apparent from the
chromatographic results that seasonal changes influence the complexity of the extracts
(Figure 13 .9). The extract obtained from the first batch showed positive uterotonic effects
although trace levels of the active component was present. There were also trace levels of
interfering compounds, unlike in the second batch, where both high levels of the active and
interfering compounds were present. In such cases, SFF does prove to be a valuable
method for fractionating extracts as observed in Figure 8.5.
231

OA01 A, Slg=254A Ref=4&l,80 (VIK\GREW4T01.0)
mAu
1200
1CXXl
800 /
10 20
time (min)
Figure 13.7 Reverse-phase HPLC chromatogram of total SFE extract of G. occidentalis wood obtained at 400 atm and 80°C. Conditions: Bondclone-l0 C 18 reverse phase column; gradient elution (methanol/water); column temperature 40°C; UV detection at 254 nm.
232

Figure 13.8 Reverse-phase HPLC chromatogram of sequentially extracted SFE fractions of G. occidentalis root. Conditions: Bondc1one-l0 C 18 reverse phase column; gradient elution (methanoVwater); column temperature 40°C; UV detection at 254 nm.
233

B
100
01-------------~~~-----
5 10 15
time (min)
Figure 13.9 Reverse-phase HPLC chromatogram of total 400 atm SFE extracts of G. occidentalis wood showing the variation of chemical composition with seasonal changes. (A) second batch of plant material obtained during Spring (B) first batch of plant material obtained during Autumn Conditions: Bondclone-lO C 18 reverse phase column; gradient elution (methanol/water); column temperature 40 °C; UV detection at 254 run.
234

13.3 Capillary electrophoresis "
CE has attracted considerable attention and the main reason for this is the possibility of
generating very high efficiencies due to its charactersitic flat flow profile as discussed in
section 4.3.5. The fundamental difference in flow profile is the main reason for the
extremely high efficiencies achievable in CE, where narrower peaks and potentially better
resolution can be readily obtained. Furthermore, peak capacity in CE is much higher than
that in HPLC. Column efficiencies in CE of several hundred thousand to millions of
theoretical plates have been reported (6-11), allowing the resolution of closely eluting
peaks and the separation of a large number of components in a mixture.
This technique has received wide acclaim and has thus been used widely in natural product
analyses. Shue and Lu (12) used this technique for the determination of six bioactive
ingredients in a Chinese herbal formula. A carrier composed of aqueous buffer solution
(50 mM sodium cholate, 15 mM sodium dihydrogen phosphate, and 4.25 mM sodium
borate) - acetonitrile (3:2) was found to be the most suitable electrolyte for the separation.
Gil et al. (13) used MECC with sodium borate buffer and SDS micelles to analyse herbs
and spices for thirty four methylated flavone aglycones. The effect of the structures on
their electrophoretic mobilities were also studied. A MECC method was also developed
by Li and Sheu (14) for the simultaneous assay of six scute flavanoids and four coptis
alkaloids in the scute-coptis herb couple. The effect of pH value, surfactant concentration
and acetonitrile concentration of the carrier on the migration and separation of the solutes
were studied. The electrolyte comprising of 5 mM sodium borate, 15 mM sodium
dihydrogen phosphate and 50 mM sodium cholate together with acetonitrile (3 :2) was
found to be most suitable. illCC methods were also developed for the separation of
coumarins from Chrysanthemum segetum L. (15) and in a crude drug of Angelicae Tuhou
Radix. (16).
In this study MECC was investigated to separate the components and evaluate the
complexity of the extracts in an attempt to identify the active principles as perfonned by
235

HPLC. Comparisons were made with respect to analysis time, resolution and efficiency.
Both SDS and sodium cholate were added to the buffers to influence selectivity.
13.3.1 Analysis of extracts from Ekebergia capensis
The components contained in this extract were successfully separated in a single run under
suitable conditions. The separation was achieved through selection of an appropriate
buffer and surfactant and further optimization of the concentration of surfactant, pH of the
buffer and applied voltage.
13.3.1.1. ButTer selection
Buffer selection is important in CE as the sensitivity of EOF to pH changes requires the
use of buffers that maintain a constant pH. The effect of pH drift in CE was studied by
Zhu et al. (17) and they found that if a buffer solution with high buffering capacity was
chosen as the background electrolyte, then the pH of this electrolyte during CE
separations will remain constant for a relatively long period. Di-sodium tetraborate (20
mM) was chosen as the background electrolyte as it had a useful pH range of8 .24 - 10.24
which ensured ionization of the solutes of interest.
13.3.1.2 Optimization of surfactant concentration
Preliminary experiments were first carried out using 20 mM di-sodium tetraborate with
SDS in the electrophoretic medium. With SDS, the components in the mixture are
separated on the basis of their relative affinities for the micellar environment against the
bulk aqueous phase. In order to study the effect of SDS concentration on the separability, .
two electrolyte systems containing 30 mM and 60 mM SDS were used. The migration
time of all the compounds increased with increasing SDS concentration. At 30 mM three
peaks were observed at migration times of 24.99, 26.27 and 28.17 minutes respectively.
At higher SDS concentrations, the peaks began to resolve however this was countered by
a tremendous increase in migration time. At this point, SDS did not seem to be an
appropriate surfactant to influence the separability. The results obtained are shown in
Figure 13.10.
236

I A
..
" I ::: .. - ! • u .. • S> .. 0
" S> • !
!
!
!
B !
" I ::: ! • I 8 01
• S> .. 0
~ • !
!
0.00 10.00 20.00 30.00 40.00
time (min)
Figure 13 .10 Electropherogram of total 400 atm extract of E. capensis wood obtained with 20 mM Na2B4.07.10H20 and (A) 30 mM SDS and CB) 60 mM SDS, pressure injection for 1 sec, UV detection at 280 run.
237

MECC with sodium cholate was thereafter investigated with 20 mM di-sodium
tetraborate. Four electrolyte systems containing 50, 100, 120 and 150 mM sodium
cholate were used to study the effects of sodium cholate concentration on separability.
The results obtained are shown in Figure 13.11, where the migration times of the
components are plotted against sodium cholate concentrations. There was an increase in
the migration times of the components when the sodium cholate concentration in the
electrophoretic solution increased. This increase can be explained by the fact that at
higher sodium cholate concentration, the' phase ratio of the micelle to the aqueous phase
would be larger. Hence the probability of solubilization of the components by the micelles
would be higher, resulting in an increase in the migration times for these compounds.
30r-~----------------------------------------------------------------~
25
-c:: .- 20 E -Q)
E :;:; 15 c:: o
:;:; ~ .21 10
E
5
O+----------+--________ ~----------~--------_+----------~--------~ 40 60 80 100 120 140 160
concentration of sodium cholate (mM)
Figure 13.11 Variation of migration time as a function of sodium cholate concentration. CA oleanonic acid,. scopoletin,. 3-epioleanolic acid)
238

Bile salts differ significantly in molecular structure from the long chain alkyl surfactants
such as SDS. They consist of a relatively flat-shaped steroid portion, in which the A ring
is cis with respect to the B ring, and a side chain having either a carboxyl or amino group
(18). All hydroxyl groups at the 3a.-, 7a.- and 12a.- positions in the 5f3- cholane structure
are orientated in the same direction, nearly perpendicular to the steroidal frame.
Therefore, the bile salts have both a hydrophilic and a hydrophobic face and tend to
combine together at the hydrophobic face in an aqueous phase. Hence bile salts are
considered to form a primary micelle with up to ten monomers. The structures of bile
salts are shown in Figure 13 .12. The fact that the bile salt monomer is more polar than
SDS leads to a general reduction in k' in .MECC (19). This is particularly advantageous in
dealing with hydrophobic compounds, as separations which prove difficult with
conventional SDS systems are more easily attained with bile salts. In addition, the unique
inverted bile salt micelle appears to tolerate high concentrations of solvents such as
methanol without drastic loss of efficency or dramatic increase in analysis time.
CO~
Bile salt RI R2 R3 R4
Sodium coolate OH OH OH ONa
Sodium taurocholate OH OH OH NHCH2CH2S03Na
Sodium deoxycholate OH H OH ONa
Sodium taurodeoxycholate OH H OH NHCH2CH2S03Na
Figure 13.12 Stru::ture of bile salts
239

SDS displayed poor selectivity when compared to sodium cholate. Since the SDS micelle
has a strong solubilization affect, these solutes possibly migrate with almost the same
migration time as that of the micelle. Sodium cholate, on the other hand, exhibits several
useful chromatographic properties such as the ability to recognise specific enantiomeric
conformations and an increased micelle polarity. Unique selectivity is achieved by the
highly ordered nature of the micelle. In this study, sodium cholate appeared to have a
lower solubilization affect relative to SDS for the extracted components and clearly
exhibited enhanced selectivity over SDS surfactant. The optimum concentration of
sodium cholate was found to be 120 mM.
13.3.1.3 pH optimization
The pH of the buffer is a critical parameter for the separation of ionizable analytes (20).
In separations with closely spaced peaks, it is often essential to find the optimum pH. The
magnitude of the EOF can be expressed in terms of velocity or mobility by:
or
Ve = (8~ / ll)E
Ue = (8~ / ll)
(13.1)
(13 .2)
where e is the dielectric constant of the solvent; ~, the zeta potential at the capillary wall;
ll, the bulk solution viscosity.
The zeta potential is essentially determined by the surface charge on the capillary wall.
Since this charge is strongly pH dependent, the magnitude of the EOF varies with pH (21).
At high pH, where the silanol groups are predominantly deprotonated, the EOF is
significantly greater than at low pH where they become protonated. While the EOF is
usually beneficial, it often needs to be controlled. At high pH, for example, the EOF may
be too rapid resulting in elution of solute before separation has occurred. Conversely, at
low or moderate pH, the negatively charged wall can cause adsorption of cationic solutes
through coulombic interactions.
The pH dependence of migration times was examined with a buffer comprising of 20 mM
borate with , l20 mM sodium cholate in the pH range 9.37 to 10.10 and the results shown
240

in Figure 13 .13. The pH of the run buffer was adjusted with 0.1 M NaOH. The migration
times of the components decreased negligably with increasing pH, although the
electroosmotic velocity remained almost constant, as judged from the migration time of
methanol which can be detected from the ultraviolet absorption due to the slight change in
the refractive index (22). These results can be attributed to the fact that the surface silanol
groups on the fused silica capillary are almost fully ionised resulting in the production of a
constant EOF. In addition to this, another contributing factor is that the electrophoretic
mobility of the solutes in this pH region is constant, indicating that no further ionisation of
the compounds occurred. At low pH it would be expected that the oleanane triterpenoids
isolated would exist in un-ionised forms and would be strongly retained resulting in higher
k' values. The optimum pH was observed to be 9.7 and Figure 13 .14 shows the
electrophoretic separation of the compounds from Ekebergia capensis at this pH.
10
'2 .- 8 E -Q)
E ;:; 6 c o ;:; E .~ 4
~
2
O+-------------~------------_r------------_+------------~ 9.37 9.5 9.7 9.9 10.1
pH value
Figure 13.13 Variation of migration time of the Ekebergia components as a function of buffer pH. Run buffer: 20 mM NazB4.07.10HzO with 120 mM sodium cholate. (A oleanonic acid,. scopoletin,. 3-epioleanolic acid)
241

0.00 5.00 10.00
time (min)
I
15.00
Figure 13.14 Electropherogram of total 400 atm extract of E. capensis wood obtained
at pH 9.70.
242

13.3.1.4 Variation of applied voltage
Variation of the voltage and changing the electric field can have several effects (e.g.
variation in the migration time of samples, EOF, analysis time, resolution, peak sharpness,
and Joule heating) (23). The Joule heating that results from an increase in voltage might
lead to changes in EOF, ion mobility, analyte diffusion and band broadening (24). Figure
13.15 shows the electropherogram of the extract running in 20 mM borate buffer with 120
mM sodium cholate at different applied voltages. The migration times decreased with
increasing voltages. At 25 kV, the migration times of the components were halved in
comparison to the migration time at 15 kV. The elution time was shortened due to the
increased velocity of the analytes and EOF. This is to be expected as equation 13.1
predicts an increase in electroosmotic flow velocity as the field strength increases. The
peak shapes were also greatly improved, however there was a slight compromise on
resolution. High concentration (ionic strength) buffers also produce good peak efficiency
and symmetry because there is effective suppression of electrophoretic dispersion. EOF
can also be affected by adjusting the concentration and ionic strength of the buffer. High
buffer concentrations limit coulombic interactions of solutes with the capillary walls by
decreasing the effective charge at the wall. The zeta potential is also dependent on the
ionic strength of the buffer, as described by the double-layer theory. Increased ionic
strength results in double layer compression, decreased zeta potential, and reduced EOF.
The disadvantages however, include high conductivities, high temperatures, Joule heating,
and viscosity changes that results in poor migration time reproducibility (25).
13.3. 1.5 Separation of components under optimized conditions
Figure 13 .16 shows the electropherogram of the total extract obtained at 400 atm using
the optimised separation conditions. Analysis was complete within 15 minutes unlike the
30 minute analysis time required for HPLC. Furthermore, high efficiency separations were
achieved. The number of theoretical plates (N) for oleanonic acid, scopoletin and 3-
epioleanolic acid was calculated to be 7.676 x 10⁶, 9.752 X 10⁶ and 10.815 x 10⁶
respectively. The high N values obtained is the primary driving force for the better
separations that are possible through capillary electrophoretic techniques.
243

MECC was also perfonned on the sequentially fractionated extracts and similar
conclusions, as drawn from the HPLC analysis, were made (Figure 13 .17). There were no
distinct differences in the electropherograms although the active components did increase
with increasing extraction pressures.
During the injection of samples into the capillary, short injection times were used. Large
injections times would have resulted in sample overload with the end result being a
compromise on the high efficiency of this technique. The injection volume can affect
efficiency by two distinct mechanisms (26) . One mechanism relates to the volume of the
sample injected (qinj) relative to the total volume of the capillary (qc). From equation 13 .3
below, it can be seen that the maximum number of theoretical plates (Nma.,) of the overall
system is constrained to a value proportional to the square root of the ratio of the volume
of the injected sample to the volume of the column.
(13 .3)
The second mechanism imposes a limit on the concentration of the sample injected and is
related to the difference in electrical conductivity of the sample and the electrophoretic
medium. At high sample concentration, system efficiency can be degraded due to
perturbation in the potential field gradient by the sample within the column. Severely
distorted peaks may result. A pressure injection time of 1 second was found to provide
adequate solute signals without any loss in efficiency or the appearance of distorted peaks.
244

!
j ! ... .
I "
I "
• " "
15 kV
!
25 kV
t "
~~·~·T-ri-'~~'-'~~·~--r-~~~~
0.00 5.00 10.00 15.00 20.00
time (min)
Figure 13.15 Variation of migration time of Ekebergia components as a function of applied voltage.
245

0
0.00
~o ...
MeOm HO 0 0
5.00 10.00
time (min)
15.00
~ ... -..,
I 0 ... )( .... 41 0 C .,
.t:l s-o III
.t:l g 0<
~ '"
Figure 13.16 Electropherogram of total 400 atm extract of E. capensis wood obtained under optimised pH conditions Conditions: 20 mM Na2B4. 0 7.1 OH20 with 120 mM sodium cholate at pH 9.70, pressure injection for 1 sec, UV detection at 280 nm.
246

.. co -.!!
I •
.. '~ .!!
· 8 • A ~ • · ~
.. ':
· 1 i :
!
I 4
200 atm
~/ .,,\ '
m
300 atm
!
!
!
!
400 atm
s
~~~ •
1 1 . ! I ~ no ~l'
~
I ..
I 4
0.00 5.00 10.00 15.00
time (min)
Figure 13.17 Electropherograms of sequentially extracted fractions of E. capensis wood obtained under optimised pH conditions Conditions: 20 mM Na2B4. 0 7.1 OH20 with 120 mM sodium cholate at pH 9.70, pressure injection for 1 sec, UV detection at 280 nm.
247

13.3.2 Analysis of extracts from Clivia miniata
The extracts of C/ivia miniata were separated using a phosphate buffer (pH range 6.21-
8.21) comprising of 30 mM Na2HP04, 30 mM NaH2P04 and 120 mM sodium cholate.
Separation was performed at 20 kV at pH 6.95 . Figure 13 .18 shows the
electropherograms of the sequentially fractionated extracts. The results obtained are
similar to those obtained by HPLC analysis however, the analysis time was reduced by 7
minutes. 5-Hydroxymethyl-2-furancarboxaldehyde had a migration time of 6.18 minutes
as opposed to a retention time of 7.7 minutes. Although, the migration time of this
compound did not vary considerably from the retention time, a comparison of the
efficiencies clearly indicated the superiority of this technique. The number of theoretical
plates was calculated to be 1.350 x 10⁶. There was no need to carry out further
optimisation of conditions as the matrix did not reveal any complexity.
When 5-hydroxymethyl-2-furancarboxaldehyde was isolated, it was thought to be an
artefact of the extraction process as this compound can result from sucrose under acidic
conditions and high pressure (27). Since water modified CO2 was used as the extracting
fluid, it was likely to be an artefact due to carbonic acid formation in the extraction vesseL
However, such thoughts were dismissed upon comparison of the electropherograms of the
pure compound with that of the aqueous extract of this plant (Figure 13 .19). It was quite
evident that this active compound was present in large quantities in the aqueous extract
and that water modified CO2 possessed the solvating ability to extract this water soluble
compound.
248

• ¥ " . ~ ~
200 aIm
! ..
I ..
I ..
• ~
• c ..
-300 aIm
~
400 aIm
0.00
..L.
1
10.00 time (min)
I
.! 1
J I
20.00
• c ..
I ..
• l
I ..
!
• ~
!
I !
Figure 13.18 Electropherograms of sequentially extracted fractions of C. miniata root. Conditions: 30 mM Na2HP04, 30 mM NaH2P04, 120 mM sodium cholate, pH 6.95, applied voltage of20 kV, presure injcetion for 1 sec, UV detection at 280 nm.
249

! A OHCVCH,OH
.- '/ r-5
• u
! " .. -.t:J ... 0
" .t:J ..
r--- .~ 1 , I ! ! ,
~ ,
B
I .,;
! ~ -
l 1
0.00 5.00 10.00
time (min)
Figure 13 .19 Electropherograms of (A) SFE and (B) aqueous extracts of C. miniata root showing the presence of 5-hydroxymethyl-2-furancarboxaldehyde in both extracts. Conditions: 30 mM Na2HP04, 30 mM NaH2P04, 120 mM sodium cholate, pH 6.95, applied voltage of20 kV, pressure injection for 1 sec, UV detection at 280 run.
250

-C 'e -(I) E ;: C 0 ;: ns ... ,2' ~
13.3.3 Analysis of extracts from Grewia occidentalis
The components in this extract were separated using 20 mM borate buffer with 100 mM
sodium cholate at 20 kV. The effect of pH on migration time was studied in the pH range
8.10 to 10.30 and the results shown in Figure 13.20. The EOF was almost constant
however the migration times of the components increased with increasing pH.
18
15
I.
12
10
8
Il
• 2
0 8.1 U 8.7 9 9.5 9.8 10.1
pH value
Figure 13 .20 Variation of migration time as a function of pH for the components of G, occidentalis obtained at 400 atm. (. oleanonic acid, • coniferaldehyde, ... 2,2',6, 6'-tetramethoxy-4'-al-4-( ro-oxo-E-propenyl)-biphenyl)
10.3
The constant EOF can be attributed to the fact that the surface silanol groups on the fused
silica capillary are almost fully ionised. The increase in migration times may have resulted
due to electric effects since this is an electrodriven separation. The compounds contained
in this extract contain hydroxy and methoxy groups which are susceptible of ionisation at
high pH and will have a negative charge and therefore an electrophoretic migration to the
251

anode (injection end) and will show higher migration times. Increasing the pH increases
the number of negative charges on the molecules and hence the electrophoretic migration
towards the anode. Nevertheless, all the components are finally carried by the EOF
towards the cathode. The optimum pH for the separation of these compounds was 9.80.
Figure 13 .21 shows the electrophoretic separation obtained under optimised conditions.
The analysis time was similar to HPLC, however, while it was envisaged that only two
compounds were present in the extract following HPLC analysis, MECC was able to
provide a true reflection of the complexity of the extract. Four peaks were observed with
only three of the compounds being identified. Coniferaldehyde and oleanonic acid are
active principles and are well separated using this technique. This application clearly
demonstrates the high resolving power of CE.
Cl CJ = III
..Cl ~ 0 11
..Cl III
8
5
0.00 10.00
H l' 3,1
G:::::O
0
/
time (min) 20.00
Figure 13.21 Electropherogram of total 400 atm extract of G. occidentalis wood obtained under optimised conditions
§ •
Conditions: 20.~ !'l"a2B4.0 7.10H20 with 100 mM sodium cholate at pH 9.80, pressure mJectlOn for 1 sec, UV detection at 254 run. -
252

:MECC of the sequentialIy fractionated extracts revealed the sensitivity of the compounds
to the extraction pressures (Figure 13 .22). At 200 atm, a negligible concentration of
oleanonic acid was extracted while at 300 atm and 400 atm, the compounds becames
extremely soluble in the extraction fluid . Oleanonic acid was also extracted from
Ekebergia capensis at 200 atm, however in larger concentrations, and one may argue how
such phenomenon is possible. The limited solubility of oleanonic acid at 200 atm in this
case could be attributed to matrix effects. In certain cases, chemical compounds can be
very strongly bound to the matrix they are contained in hence the sample matrix can have
a profound effect on the results that are obtained, as discussed in chapter 2.
253

I ..
i 1
• !
. !
j j
I ..
200 aIm
~
-300 aIm
. ~
0.00 5.00
.1 11 I
1
,~
10.00 time (min)
A :L.
15.00
!
!
I •
!
I •
!
!
20.00
Figure 13 .22 Electropherograms of sequentially extracted fractions of G. occidentalis wood. Conditions: 30 mM Na2HP04, 30 mM NaH2P04, 120 mM sodium cholate, pH 6.95, applied voltage of20 kV, pressure injection for 1 sec, UV detection at 254 run.
254

13.4 Packed capillary column SFC
Open tubular SFC has received considerable attention and has been used widely in
separating a wide variety of natural products (28-35). However, in this study an attempt
was made in using packed column SFC as a possible separation technique for
characterising the components contained in the fractionated 400 atm extract of Ekebergia
capensis. Both pure CO2 and a hydrofluorocarbon were evaluated as mobile phases.
Slurry packing methods are commonly employed and can be successful in the preparation
of both packed conventional and packed capillary columns. Recently, dry and
supercritical CO2 packing techniques have been developed to prepare packed capillary
columns (36, 37). The physical properties of CO2, such as low viscosity and low surface
tension, favour efficient packing which leads to the formation of a dense and uniform
packed bed. These columns can advantageously combine many of the valuable properties
of both low flow rates (38), moderate sample capacities and loadabilities (39), high
analysis speeds (40) and the possibility of using a wide variety of commercially available
stationary phases. The results of a number of SFC separations using packed capillary
columns are reported (41).
In this study a 30 cm length of fused silica capillary was packed with Spherisorb ODS2
using the method outlined in chapter 5. The stability of the packed bed is very important
in SFC because pressurisation and depressurisation are repeated quite often. From a
practical point of view, a loose packing will cause instability and result in voids at the top
of the column, which markedly decreases the column effciency due to extensive
rearrangement of the packing material. However, under the experimental conditions
studied, no such voids were observed.
13.4.1 SFC with CO2
Prior to injection of the sample, naphthalene was injected as a test sample using a timed
split injection of 100 msec and excellent peak symmetry was obtained under the conditions
used (Figure 13 .23). However there were no positive results for the extract of Ekebergia
255

capensis. The pressure was initially ramped to increase the solvating power of the mobile
phase followed by an increase in the temperature in order to reduce the solutes' cohesive
energy density, but all attempts failed . This may be due to interaction of the compounds
with the residual active sites on the packing material.
• N
I I I
0.00 5.00 time (min)
Figure 13.23 Packed capillary SFC of 5 mg/ml naphthalene standard Conditions: 300 atm, 50°C, 30 cm x 1 00 ~m i.d. column packed with ODS2, UV detection at 254 nm
Anthony et al. (42) studied the interaction of aldehydes and ketones on silanol groups and
reasoned that these compounds behaved similarly to chlorosilanes With the bonded
silanols, a concerted effect may have been possible in which the proton of one silanol
interacted with the electronegative oxygen atom, while the oxygen of the other hydroxyl
would interact at the electropositive silicon atom as shown in Figure 13 .24.
256

/H \ / Si-O------Si ,-
H---'CI /
-Si-O
/H \ / Si-O------C
11--H---'O
/ -Si-O
Figure 13 .24 Possible interaction of chlorosilanes and carbonyl
compounds with residual silanols (42).
Carbonyl compounds can also interact preferentially at bonded silanols through the
formation of a "bifurcated" hydrogen bond as seen in Figure 13 .25.
Figure 13.25 Forrnafun of , 'bifurcated" hydrogen bond
Finally, it was concluded that pure CO2 was not a suitable mobile phase for these
compounds. Other alternatives would have been to use a modified fluid or a more polar
mobile phase such as a hydrofluorocarbon.
257
13.4.2 SFC with hydrofluorocarbon
1 1 1 2-Tetrafluoroethane (HFC-134a) was thereafter investigated as a mobile phase as , , ,
earlier studies with packed columns indicated that hydrofluorocarbons are comparable in
eluotropic strength to CO2 for polar compounds (43, 44). It has also been stated that
hydrofluorocarbons are more polarizable than CO2 and compounds capable of interacting
with this mobile phase via hydrogen bonding interactions should also be more strongly
solvated and eluted. Attempts to elute the compounds of Ekebergia capensis from the
column failed, possibly due to the strong hydrogen bonds between the silanol and the
carbonyl compounds. At this point the prospect of using SFC for the current studies did
not seem viable and further analysis of the extracts was terminated.
13.5 Conclusion
From this study, it was concluded that both HPLC and CE can be successfully used to
separate the components contained . in the extracts of Ekebergia capensis and C/ivia
miniata. The principles of separation in HPLC are entirely different to MECC and,
therefore, a good agreement between the two techniques strongly supports the integrity of
the data. The differences in selectivity between HPLC and MECC, as observed for the
extracts of Grewia occidentalis, resulted in discrepancies in results with HPLC showing
an underestimation of the complexity of the extract. This occurrence signifies that further
method optimization is required for HPLC. MECC has clearly demonstrated superiority
by its high resolving capabilities and high efficiencies as judged from the theoretical plate
numbers. Although packed capillary column SFC has many advantages, the use of this
technique with both CO2 and 1,1,1 ,2-tetrafluoroethane as mobile phases did not prove
successful in the analysis of the extracts from Ekebergia capensis. This indicated that
modifiers were necessary to overcome possible interactions between solutes and residual
silanol groups in order to elute the compounds. The CE methods can be successfully used
to monitor the occurrence of these compounds at various periods during the year in order
to obtain a concentration profile of the active components in these plants. In this way
total quality assurance of the plant products can be established.
258

References
1. A Hasler, O. Sticher and B. Meier, J Chromatogr., 508 (1990), 236 .
2. AA Elujoba, AF. Fell and P.A LinIey, J Pharm. Biomed. Ana!., 9 (1991), 711.
3. P. Pietta and C. Gardana, l. High Resolut. Chromatogr., 15 (1992), 136.
4. S. L. Richheimer, D.M. Tinnermeier and D.W. Timmons, Anal. Chem., 64 (1992),
2323.
5. T. Uno, Chem. Abstr., 77 (1972), 98769.
6 lW. Jorgenson and KD. Lukacs, Anal. Chem., 53 (1981), 1298.
7. lW. Jorgenson and KD. Lukacs, J Chromatogr., 218 (1981), 209.
8. lW. Jorgenson and KD. Lukacs. J High Resolut. Chromatogr. & Chromatogr.
Comm., 4 (1981), 230.
9. I.W. Jorgenson and KD. Lukacs, Clin. Chem., 27 (1981), 1551.
10. AS. Cohen and B.L. Karger, J Chromatogr., 397 (1987), 409.
11. AS. Cohen, A. Paulus and B.L. Karger, Chromatographia, 24 (1987), 14.
12. S-J, Sheu and C-F Lu, J High Resolut. Chromatogr., 19 (1996), 409.
13. M.I. Gil, F. Ferreres and F.A. Tomas-Barbenin, J Liq. Chromatogr., 18 (1995),
3007.
14. K-L Li and S-J Sheu, Anal. Chim. Acta., 313 (1995), 113.
15 . R.I. Ochocka, D. Rajzer, P. Kowalski and H. Lamparczyk, 1. Chromatogr. A, 709
(1995), 197.
16. C-T Chen and S-l Sheu,1. Chromatogr. A, 710 (1995), 323.
17. T. Zhu, Y. Sun, C. Zhang, D. Ling and Z. Sun, J High Resolut. Chromatogr., 17
(1994), 563.
18. S. Terabe, M. Shibata and Y. Miyashita, J Chromatogr., 480 (1989), 403.
19. R.O. Cole, M. I. Sepaniak, W. L. Hinze, 1. Gorse and K Oldiges, J
Chromatogr., 557 (1991), 113.
20. S. Fugiwara, S. Iwase and S. Honda, 1. Chromatogr., 447 (1988), 133 .
21. R.M. McCormik, Anal. Chem., 60 (1988), 2322.
22. S. Terabe, K Otsuka and T. Ando, Anal. Chem., 57 (1985), 834.
23 . lH. Knox, Chromatographia, 26 (1988),329.
259

24.
25.
26.
27.
28.
29.
S. Hjerten, Electrophoresis, 11 (1990), 665.
T. Tsuda, K.Nomura and G. Nakagawa, 1. Chromatogr., 264 (1983), 385.
H. Lauer and D. McMarugill, Trends Anal. Chem ., 5 (1986), 11.
W.N. Haworth and W.G.M. lones, 1. Chem. Soc ., (1944), 667. .
P. Morin, H. Pichard, M. Caude, H. Richard and R. Gosset, In: Progress in
Terpene Chemistry, D. loulain, (Ed.), Frontiers, Gi£'Yvette, (1986), p.343.
M. W. Raynor, R. Moulder, LL. Davies, lP. Kithinji, lE. Hall, A.A. Clifford and
K.D. Bartle, In: Proc. Tenth Int. Symp. Cap. Chromatogr., P. Sandra and G.
Redant, (Eds.), Huethig, Heidelberg, (1989), p.1366.
30. l Balsevich, L.R. Hogge, A.l Berry, D.E. Games and Le. Mylchreest, 1. Nat.
Prod., 51 (1988), 1173.
31. G. Holzer, L.H. Zalkow and C.F. Asibal, 1. Chromatogr., 400 (1987), 317.
32. lL. Janicot, M. Caude and R. Rosset, 1. Chromatogr., 437 (1988),351.
33. P .Morin, H. Pichard, H. Richard, M. Caude and R. Rosset, 1. Chromatogr., 464
(1989), 125.
34. P. Morin, M. Caude and R. Rosset, Analusis, 15 (1987), 117.
35. V. Sewram, J.J. Nair, D.A. Mulholland and M.W. Raynor, 1. High Resolut.
Chromatogr., 18 (1995), 363 .
36. G. Crescentini and A.R. Mastrogiacomo,1. Microcol. Sep., 3 (1991), 539.
37. A. Malik, W. Li and M.L. Lee, 1. Microcol. Sep., 5 (1993),361.
38. M. Novotny, Anal. Chem., 53 (1981), 1294A.
39. Y. Hirata, F. Nakata and M. Horihata, 1. High Resolut. Chromatogr. Chromatogr.
Commun. , 11 (1988), 81.
40. T. Saito and M. Takeuchi, JEOL News, 25A (1989), 14
41. W. Li, A. Malik and M.L. Lee,1. Microcol. Sep., 6 (1994),557.
42. L.l Anthony, R.A. Holland and S.A. Hefiher,1. High Resolut. Chromatogr.
Chromatogr. Commun., 11 (1988), 167.
43 . J.W. Jordan and L.T. Tayior,1. Chromatogr. Sci., 24 (1986), 82.
44. T.A. Berger and l F. Deye, 1. Chromatogr. Sci., 29 (1991), 390.
260

CHAPTER 14
Overview o/this study and concluding remarks
This study successfully validated the uterotonic properties of the three selected medicinal
plants through a multidisciplinary approach. Water modified supercritical CO2
demonstrated a high solvating ability by producing plant extracts that displayed
distinctive results when screened for uterotonic activity. The activities were comparable
to those induced by the aqueous plant extracts. The application of a dynamic extraction
model to optimize extraction conditions was successful although little was known about
the solutes' molecular structures at the time. During the extraction of all three plants, the
model indicated that solubility was the controlling factor in achieving an interactive
extraction.
In vitro biological assays using guinea pig uterine smooth muscle wer~ found to be a
simple and sensitive method for detecting uterotonic compounds. Furthermore, the
success of coupling SFE directly on-line to the bioassay made this approach more
attractive due to the shorter analysis times and elimination of sample handling prior to the
bioassay hence eliminating the possibility of sample contamination. On-line bioassay
guided fractionation further enhanced the potential of this technique as it increased its
specificity by identifying the most potent fractions which were sUbjected to further
analysis.
Repetitive gravity column chromatography of the plant extracts using various mobile
phases yielded pure compounds whose structures were elucidated through various
spectroscopic and chromatographic techniques. Two compounds from Ekebergia
capensis, two from C/ivia miniata and one from Grewia occidentalis were found to
induce uterine muscle contractions. A further evaluation on the physiological mode of
action indicated that these compounds mediated their effects through the cholinergic
261

receptors. It still remains speculative that these compounds may also have increased the
permeability of the cell membranes to calcium ions, however there were no ionic channel
blockers used to confirm such a mechanism.
CE and HPLC displayed good resolving capabilities for the evaluation of the complexity
of these extracts. However, from a practical viewpoint, the small sample, buffer, and
waste volumes required and generated by CE were less than those generated by HPLC
making this technique an attractive one. The optimized analytical conditions were used
to observe the effect of seasonal changes on the composition of the extracts. As the
composition of the plant components varied with seasonal changes, it becomes important
to monitor the magnitude of these changes so that the doses of the extract can be
regulated to maintain consisistency in activity. A further evaluation on the toxicity of
these compounds is required and can be done using cells in culture.
262

APPENDIX 1
l3C NMR data/or compounds isolated
Table Al: l3C NMR data for compounds 1,2,3 and 4 (75MHz, CDCh, TMS as internal standard). All chemical shift values are expressed in ppm (8) and multiplicities are included in brackets.
Carbon Compound Compound Compound Compound number 1 2 3 4 1 37.3 (t) 39.3 (t) 32.5 (t) 23.3 (q)
2 31.7 (t) 34.1 (t) 27.6 (t) 73.0 (s)
3 71.8 (d) 217.8 (s) 76.2 (d) 78.3 (d)
4 42.3 (t) 45 .8 (s) 37.2 (s) 29.i(i)
5 140.8 (s) 55 .3 (d) 48.9 (d) 36.8 (t)
6 121.7 (d) 19.6 (t) 18.2 (t) 134.8 (s)
7 31.9 (t) 32.2 (t) 32.8 (t) 125.1(d)
8 31.9 (s) 39.1 (s) 39.4 (s) 26.5(1)
9 50.1 (d) 47.4 (d) 47.4 (d) 39.6 (t)
10 36.5 (s) 36.8 (s) 37.3 (s) 134.8 (s)
11 21.1(t) 23.4 ill 23.3 (t) 124.4 (d) 12 39.8 (t) 122.3 (d) 122.2 (d) 28.26) 13 42.3 (s) 143.6 (s) 143.5 (s) 28.2 (t) 14 56.8 (d) 41.1 (s) 41.7 (s) 124.4 (d) 15 24.3 (t) 27.7 (t) 25.2 (t) 134.9 (s) 16 28.2 (t) 23 .0 (t) 22.9 (t) 39.6 (t) 17 56.1 (d) 46.9 (s) 46.5 (s) 26.50 (t) 18 11.9 (q) 41.8 (d) 40.9 (d) 125.1 (d) 19 19.4 (q) 46.5 (t) 45.9 (t) 134.9 -C-s) 20 "36.1 (d) 30.7 (s) 30.3 (s) 36.8 (t) 21 18.8 (q) 33 .8 (t) 33.8 (t) 29.7 (t) 22 33.9 (t) 32.4 (t) 32.5 (t) 78.3 (d) 23 26.1 (t) 26.4 (q) 28.3 (q) 73.0 (s) 24 45 .8 (d) 21.4 (q) 22.2 (q) 23 .3 (q) 25 29.1 (d) 15.0 (q) 15.1 (q) 26.4 (q) 26 19.1(q) 16.9 (q) 17.2 (q) 16.0 (q) 27 19.0 (q) 25 .8 (q) 26.1 (q) 15.9(q\ 28 23.1 (t) 184.4 (s) 183.9 (s) 15.9 (q) 29 11.9 (q) 33.0 (q) 33.1 (q) 16.0 (q) 30 23 .6 (q) 23.6 (q) 26.4 (q)
263,

Table AI : l3C N1v1R data for compounds 7 and 9 (75MHz, CDCh, TMS as internal standard). All chemical shift values are expressed in ppm (6) and multiplicities are included in brackets.
Carbon Compound Compound number 7 9
1 128.4 (s) 2 152.4 (s) 147.3 (s) 3 122.8 (d) 105 .6 (d) 4 110.0 (d) 125.3 (s) 5 160.5 Js) 105.6{d) 6 147.3 (s) I' 138.0 (s) 2' 147.3 (s) 3' 106.7 (d) 4' 140.9 (s) 5' 106.7 (d) 6' 147.3 (s) 1" 153 .1 (d) 2" 126.8 (d) 3" 193.5 (d)
CHO 177.7 (d) 19l.0 (d) 4 x OCH3 56.4 (q)
OCH2 57.6 (t)
264

APPENDIX 2
List of Spectra Page
Spectrum la Mass spectrum of f11 267
Ib Infrared spectrum of f11 268
lc IH NMR spectrum of[1] 269
. Id BC NMR spectrum of[1] 270
Spectrum 2a Mass spectrum of f21 271
2b Infrared spectrum of f21 272
2c IH NMR spectrum of f21 273
2d BC NMR spectrum of [21 274
2e HETCOR spectrum of [21 275
2f COSY spectrum of [21 276
Spectrum 3a Mass spectrum of f31 277
3b Infrared spectrum of [3] 278
3c IH NMR spectrum of [3] 279
3d BC NMR spectrum off31 280
Spectrum 4a Mass spectrum of f 41 281 4b Infrared spectrum of r 41 282 4c IH NMR spectrum of r 41 283 4d BC NMR spectrum of[41 284 4e IH NMR spectrum of [4b] 285
Spectrum 5a Mass spectrum of f 51 286 5b Infrared spectrum of f 51 287 5c IH NMR spectrum of rS1 288 5d NOE spectrum offS1 showing irradiation ofH-4 289 5e NOE spectrum of f51 showing irradiation ofH-5 290 5f NOE spectrum of rS1 showing irradiation of methoxv protons 291 5g l3C NMR spectrum offS1 292
Spectrum 6a IH NMR spectrum r 6] 293
Spectrum 7a Mass spectrum of r71 294 7b Infrared spectrum of r71 295 7c IH NMR spectrum of f71 296 7d l3C NMR spectrum of [7] 297 7e NOE spectrum of [7] 298
265

S~ectrum 8a Mass spectrum of [8] 299 8b Infrared spectrum of [8] 300 8c lH NNfR spectrum of [8] 301 8d COSY spectrum of [8] 302 8e lH NNfR spectrum of [8] with D20 303
8f NOE spectrum of [8] showing irradiation of metho~protons 304
8g NOE spectrum of [8] showing irradiation ofH-2 305
Spectrum 9a Mass spectrum of [9] 306 9b Infrared spectrum of [9] 307 9c lH NNfR spectrum of [9] 308 9d 13C NNJR spectrum of [9] 309 ge HETCOR spectrum of [9] 310 9f NOE spectrum of 19] showing irradiation ofH-1" 311 9g NOE spectrum of [9] showing irradiation of chemically 312
equivalent H-3' and H-5'
266

267

III 0 N 0 . 11 ~
III 01
'If I') ... III 01 N . 10 0
m 01 ID 'Of 0 0 0 al
....sf 11 Cl 0 0
0 al ... . N al
" 0
I') 0 ID 'f
0 0 D ...
0 ~ 0 • D III 0 C.
" ... I')
" N ..
ID N
" .D
I') . I') N e III " . :l
III 01 al C 0 " " • III " > III III UJ Cl ... III o J:
" 0 11 11 D N 01
0 0 ~
0 .-i III .........
4-0
E 2 .....
0 u 0
(!)
II 0-III CIl
"'0 (!) ;.... C'j
~ ;:::: 0 -0
0 II 0 0 ~
11 0 ~
0 III III GI GI ....-<
~
... c.Clc.e~+,+,.cu. E 2 ..... u (!)
0-Cl)
268

o
...
~
....-4 ~
c...,. 0
El 2 ...... u ~
~
~ ~ . . u
,......;
El 2 ...... u ~ 0..
CIJ
269

270
~ ...,.-------.,. en_::-===~l
en _-------l' ~
~_..,.---.J
C>
~
,--, ~ .......... 4-< 0 ~
2 ..... u Q)
0.. (JJ
~ u ...,
~ ~
E -~ ..... u Q)
a. Cl)

. ~ ...... _ . ..... .. ._ .. .. - ",_ . "

N -.) N
-_. __ . ------l liU2.38B 404.B21.
1074 .... 18 41.4880 8
8
T r • n • III ~
t: 80 t:
• n c •
..
r04JH.938 48.18S!
2987.082
29a~.3"1 37.77
.. 0-1 ~-.----,----- --'r-
.. 000 seoo 3000
Spectmm 2b: Infrared spectrum of [2]
I
I 1728.39" 39.80 I
188.078 "4.4151
271.170 ",e~8 800.970 .040.9315
'-----.-r.-- 1"'~~!,,~.!.:~~,~_ - . ___ ~:!,?,,?,:'!:':'~._~~:.!,9 a800 2000 1800 1000 Wav.numbere

273

IV --.J ~
s d
Is t s q
s t d t ~ q q s
q q 5
d tq q t t s 5
d s t t t t t
I lll. 11
~;o ' , ~O~ , ,', ~8~' ~6~ , ~4~ , ~2~ , ~O~ I 'B~ , '6~ , '4! ' '2! ~p~ , 0
Spectrum 2d: l3C NMR spectrum of [2] .

• ~ I i i ~ i I I i 1 i i 'i i i I I J ( I 11 I I I I I I I I i I J i i 1 PP!(
• i I , i i i 1 , J 1111111111
•
•
275

•
I I I 5.0
I I I ~.5
I I I 1.1 I I U 3.5
• •
I I I I 3.0
Q)
~
(J)
~~
~~
. ff!J t!I ~ .OS ~
Q
.@>
276
~ ~
Ii I I I Ii . 1.0 PPM
~
C>
It)
C>
N
It) X
N c.. c..
N C> ~
...,
It)
...,
C>
....
It)
....
C>
It)
......, N '--'
t.o-< 0
E 2 ...-u d)
0-I:Il
~ Cl)
0 u t+-; C"l
E -t:: ...-u d)
0-Cl)

277

N -..J 00
vc~oa 1n K8r.tren.
T70 r e n e .. 1 t ISO t e n c e
a
40
3
'°1 4000
2g047.417 27. lSU·
t1S33.8tO 80.a ..
129B.1715 Ba."7
1278.&a7 83."&
t .. e7.ge2
t ....... 77 ..
t37g.1g0 150.30
t70g.03& .. O.B&
B79.g04 315.151"
12"9.&aa
'--------~------------~ --, -.aooo 31500 3000 eaoo
Wev.number.
SpectnnTI 3b: Infrared spectnlm of [3]
-.-11500
elil ..... 3 7B."153
e 1S0.1e15
a ... 2152
152.a9&
OB".01S3Iag.& .. :s
122.e"2 "3.t30
1&0.£510 7().egg
tooo

ID
CD
279
.. U
M
E 2 .-u Il)
0... Cl)

<:>
'C----~~
,........, ~ '--' c.;..... 0
E p -..... U 0.> 0.. Cl)
(I) ~ U .....,
"0 M
E e ..... u 0.> 0..
C/l
280

81
I .. 3 I
59 71
15~ I 163 ' 318
93 135
107 l 1 N 1,1 11 1111 I1I IJIII[~:. I \,i '161
170 'JI 203 r L 00 . ~ 2) 23i2ii
~~ :"YJJiII'~i~~ p ~~ iO 60 80 100 120 HO 160 190 200 220 2iD 260 28C
300 320 310
SpectnllTI 4a: Mass spectmm of [4]

90
8 T r • " • la
N 1 00 t N t:
a
" c •
80
127<4.872 8<4.01:1
<437.912 78.811:1
7153.7615 76.e9~ 71:1
<4000 31:100 3000 21500 2000 11:100 1000 1:100 Wavenumbere
Spectnllll 4b: Infrared spectrum of [4]

- . - -" -
283
.. u ~
S 2 ...... u Q)
0.. Cl)

S,16'0£ -
1E8'~I
~'~l-
284
l
<:> <.0
<:> ~
<:> ~
<:> <:>
'"
,........, ~ ~
~ 0
E 2 ..... <.) Cl)
0.. Cl)
~ U ..., ..
"'0 -.,::t
E 2 ..... <.) Cl)
0.. Cl)

N 00 VI
-_--.J.----J' 1., . ti
! I1
jOV
r
! (
~ ! ' , I ' I or' , I TIII-[' , I-rr, 'I rrl'- '-TlTT'-TT T TrrTl - 1Il , I
10 9 8 7 6 4 3 2 1 PPH 0
SpectnllTI 4e: lH NMR spectnllTI of [4b]

.-;
VfR179PIl4 xl Bgd=1 12-0CT-9] 14:84+8:82:87 78-258S[Q EI+ Bpft=8 1=4.9\1 H,,=8 TlC=116699888 flcnt: Sys:SYST£ftO[f HnR: 32393898 2 PT= 8' Cal:11097R MSS: 192
18 192
B8
6B In
4B 1 S
N 28 69 lG4 00
0\ 51 79 121 8
48 GB B9 188 128 148 168 188 298 228
Spectnlm 5a: Mass spectmm of [5]

N 00 --....l
T ,.
100 ii
915
e 90 n
• m 1 t t e n c • e1:5
8VPPO~Y: C:'FIRST\eIN/BVpPO~Y
.copol.t1n
l.2 ... 2 ..... 2 60.20~ 921060
1608.I:5S8 88.156 22.884 93.1157
1708.901 715.1:52
020.283 93.1:541:5
"'-.40 .. 27 ..... 80
292.230 79.442
1509.209 84.781:5
I:5SI5.142 79.41:53
r- --- ----- --- - --1
4000 31:500 3000 21500 2000 11:500 1000 1500 Wavenumb.,..
Spectnlm 5b: Infrared spectnlm of [5]

'-
\..
288
. . u
V)
s .5 u v 0..
CZl

11 i
N 00 1.0
- - --
-
\...- U d
81_0 7_6 7_~ Id d d s_b 4.6 4.b PPH
Spectrum 5d: NOE spectrum of [5] showing iITadiation of H-4

N \0 0
B
JJl
7 . ~ 7.b
"r r
I
I I I I
I I . I
~!
j
~ J
-.
6 . ~ d
SpectmITI 5e: NOE spectmm of [5] showing irradiation ofH~5
5.~ 5.b 4.~ 4.6 PPM

r J y -v
,
N 'D
I .......
--
I _.
LJ' \....) LA J 7.~ 7.~ . 6.~ 6.~ 5.~ 5.h 4.~ 4.~ F
I B.O H
I i I
: li SpectnllTI 5f: NOE spectnlm of [5] showing irradiation of methoxy group protons

N \0 Iv
SpectnlID 5g: 13e NMR spectnlID of [5]

Co
"---------- -----.~
--=---0::--.......
N
..,.
ID
,......., \0 ......... ~ 0
.... E f u ~ 0. CIl
CD ~ ::r::
ce \0
E en 2 ......
u ~ 0.
Cl)
293

+ -L.J
Ln CS)
t.O CS)
CS)
+ Ln -t.O -r-.... en
I
a..... L.J o lie a:: L.J r-.... _ en CJ') 0 :>- -CJ') -
V'I ~ :::n to
CJ') ~
CS) CS) _ CS)
~ t.O C CS)
I -NeT') - t.O 11 ~ --r-....
eT') 11 -0 0'1 ea CS)
11 lE
::c -x :> -. -11 ---_ CS)
N 11 ::c lie 0 0-OeaN
en Cl:) -
Cl:) CS) CS) CS) CS) co t.O --
294
t.O N -
r-.... en
r-.... Ln
CS) N
en t.O
-eT') N
-
CS) Ln
CS)
"

N '\D Vl,
91:5
90 T r a n e m 1 t t a n c e BI:5
BO
VCLV 1
B10.051:5 91. 42"- I I 11 --:JP.J 1I "' r 1
BI:5I:5.444 90.6B3
924.B77 B9.93B
11521.74B
1190.974
1021.24B B6.B6
1670.2156 79. 36E115f----~ 779.196 90.B4
~423.44B 77.924
4000 31500 3000 2600 2000 11500 1000
Wavenumbere
Spectrum 7b: Infrared spectmm of [7]
500

£919"9 -18il9"9-
091'" £...,- --===------" 1)5Ct0£ _
296
l
r
t-...
;-:--r-.
L ~
~ .... L I ,..
r-al
r ~ r r-f-I
~ L ra>
~ I
~ ,
too
,...-, t--......... 4-< 0
E 2 ...... u (\)
0.. Cl)
~ .EC
u l:"-
E 2 ...... u (\)
0.. tZl

~ ,...
~~ r r
t I """
~ ~~
t
f§
L E ~ , I
. ~~ ~
......... ~ 0
~ :::
t-~ b
~-u v 0.. Ul
r-~
~g C-
.:0 r---a 2 ...... u
t 297
v 0..
Cl)

I-~ to
~).
f I
r-~ to
f-.~ IX)
.. _Ill
CD
i
J I-~ r: :. :a>.:.·~·:.:7.-. :: .. :: ...
L I [
-

18
88
~ &8 \.0
48
28
VGOll11 Bpft=8 2
xl 8gd=1 12-0CT-9] 14:49·0:01:44 70-258S[Q El· 1=&88AV HA=O TIC=28594888 Rent: Sys:SYSTEnOEf
PT: 0' Cal:11097R
135 14]
68 88 188 128 148
Spectrum 8a: Mass spectnuTI of [8]
178
168 188
HnR: ftRSS:
288
212
4457880 178
228

915
vao 1 (17/18)
B11.9B4 B8.1515
90
971.102 BB.B2..... I I III-M \ =-=ttH
T !582.4BB BB.9Btt- '1111.1\1\ III J
r 13B2.BBO BB.1591 111111--1 .. n 11 B15 m
1029.92784.81.. I Ill" IAA IJ 1 t 14B2.921 B4.531
t.J t .. 0 n 0
1432.061 B3.181
c e 1210.261 B1.138 111111 11
BO 1130.220 72.21
1266.444 72.BO
715
34214.411 72.91 1664.470 72.27
4000 3600 3000 2600 2000 1600 1000 1500
Wevllnumbllrll
Spectnlm 8b: Infrared spectnlffi of [8]

'"
,--, QO ......... !.+-<
\.. 0 \.. . --... ..... 8
= I-< ...... '\. . '-U ~ 0. CIl
~ ~
u 00
8 aI 2 ......
u ~ 0.
L Cl)
301 ~

-
.
j 11 ~l ~ 1 -i i i i 1 i i i i 1 i i i 1 1' 1 1 1 1' 1 i i 1 i i 1 i 1 i ill 1' ill 1' 1 1 1 1' 1 i 1 1' 1 1 1 1' '''1' 1 1 1 1
9 B 7 6 5 4 PPH to
;/. (T')
co . .. oqo
0 to • . oqo
co 0 . to . . .
to
to
co ,....... -\0 X QC) Co ~
Co '4-. to - 0
13 I:) o. N 00 \0 E I.L.
float co E ,.... u
<!) ;ft- . 0.. . " a 0 to C/l .. ,.... >-a CI'.l a co 0 CD U
.. to "0 CD
-00
E co e CTI ....
U <!)
t9 to 0.. Gl Cl CTI
CI'.l
-302 I I

o
N
o cS ~ ...... . ~
303

304
t.i-i 00
6 2 ....... u ~ 0..
Cl)


UG0211918115 xl 8gd=1 12-OCT-s] 14:32+8:82:]6 ]8-258S[Q [1+ 8pft=8 , 1=39211'" ""=8 TlC=13119888 Aent: Sys:SYST£1IO[f fIIIR: 2569888 2 PT= 8' Cal :llDS]A IVlSS : 182
18~ 182
B8
68
v) 48 1 11 288 0 ~
28
8 48 68 B8 188 128 148 IG8 188 288 228
Spectnlm 9a: Mass spectmm of [9]

w o -.....}
80
T 70 r • n • m 1 t t 80 • n c •
~o
341 •• 8215 153.1515
.04000 3~00 3000
Spectnlm 9b: Infrared spectIum of [9]
e8.771
4.143
482.921 .044.487
1~88.288 48.21
214.118 42.87
114.790 33.864 11513.087 38.B~8 ~
2~00 2000 1~00 1000 1500
Wav.numbere

\
l ~ 1
308
<:>
x 0.. 0..
C\I
CD
L
~
0'\ '--' 4-< 0
E 2 ...... u Cl)
0.. V)
~ ::r: u
0\
~
2 ..... u Cl)
0.. c.n

0
~
% ~ ~
1--0 N
-
-0 ~
l-
f-
r-g
I-
l-
t ~O
CZ)
I-
1--0
I-~ < I-
E I-
~~
- I----' l-
t -...
f~ ---. ,........, 0'\ ~
t;...... f- a
a E
r-~ <) Cl)
0.. Ul
I-
~ -'
r-~ U .... -.. "'0 I- 0'\ - a 2 r-g ..... <) N Cl)
0.. C/)
I-
309 r~ I...-N

10 9 J' I' , , '71' , , , I' , , i I 11 i i I i i i , I i i
~ 6
"1""1"" 5 i'll'l""ll"ilil ~ 4 3 .""" ~ ,~ 'I""I""I"iil'"1i1
o
'"
- -r --
.•
..-310
,........., 0\ ........ 4-< 0
E 2 ...... u v 0.. (/)
~ 0 U E-<
~ v
0'1
E 2
~ ...... u <L> 0.
c:/J


w ........ N
-, 10
11
9 8
".1" 7
u
6 5 4 ppm
1 a A
I I .. --.-----~ I I I I '-r-.----w----. 10 9 8 7 6 5 4 ppm
Spectnnn 9g: NOE spectnlln of [9] showing inadiation of chemically equivalent H-3' and H-5'


![Review Analytical-scale supercritical fluid extraction: a ...quimica.udea.edu.co/~carlopez/cromatogc/sfe polluntants... · Analytical-scale supercritical fluid extraction ... [lo],](https://img.dokumen.tips/doc/110x75/5ab139fa7f8b9a6b468c4025/review-analytical-scale-supercritical-fluid-extraction-a-carlopezcromatogcsfe.jpg)