Embed Size (px)
Citation preview

General rights Copyright and moral rights for the publications made accessible in the public portal are retained by the authors and/or other copyright owners and it is a condition of accessing publications that users recognise and abide by the legal requirements associated with these rights.
Users may download and print one copy of any publication from the public portal for the purpose of private study or research.
You may not further distribute the material or use it for any profit-making activity or commercial gain
You may freely distribute the URL identifying the publication in the public portal If you believe that this document breaches copyright please contact us providing details, and we will remove access to the work immediately and investigate your claim.
Downloaded from orbit.dtu.dk on: Mar 16, 2020
Superconductivity. Lecture Notes of Basic Courses
Andersen, N.H.; Mortensen, K.
Publication date:1988
Document VersionPublisher's PDF, also known as Version of record
Link back to DTU Orbit
Citation (APA):Andersen, N. H., & Mortensen, K. (Eds.) (1988). Superconductivity. Lecture Notes of Basic Courses. Roskilde:Risø National Laboratory. Risø-M, No. 2756

$ TfTiT7(TvJ/f^ Risø-M-2756
*
a
|g u w i i ^ i y / ntCtfCVW-D'""""
Superconductivity Lecture notes of basic courses presented at
1st Topsøe Summer School on Superconductivity Editors: N. H. Andersen and K. Mortensen Physics Department
Risø National Laboratory, DK-4000 Roskilde, Denmark December 1988

tyaw**- ft &cøs?z
Risø-M-2756
SUPERCONDUCTIVITY
Lecture notes of basic courses presented at 1st Topsøe Summer School on Superconductivity
Editors: N.H. Andersen and K. Mortensen Physics Department
Abstract This report contains lecture notes of the basic lectures presented at the 1st Topsøe Summer School on Superconductivity held at Risø National Laboratory, June 20-24, 1988. The following lecture notes are included: L.M. Falicov: "Superconductivity: Phenomenology", A. Bohr and O. Ulfbeck: "Quantal structure of superconductivity. Gauge angle", G. Aeppli: "Muons, neutrons and superconductivity", N.F. Pedersen: "The Josephson junction", C. Michel: "Physicochemistry of high-Tc superconductors", C. Laverick and J.K. Hulm: "Manufacturing and application of superconducting wires", J. Clarke: "SQUID concepts and systems"
0: 9903002164
December 1988 Risø National Laboratory, DK-4000 Roskilde, Denmark

ISBN 87-550-1477-1
ISSN 0418-6435
Grafisk Service, Risø 1988

L
CONTENTS Pa«*
PREFACE
SUPERCONDUCTIVITY: PHENOMENOLOGY . . . L.M. Falicov
QUANTAL STRUCTURE OF SUPERCONDUCTrVITY GAUGE ANGLE
A. Bohr and O. Ulf beck
MUONS, NEUTRONS AND SUPERCONDUCTrVITY . . . . C. Aeppli
THE JOSEPHSON JUNCTION N.F. Pedersen
PHYSICOCHEMISTRY OF HIGH Tc SUPERCONDUCTORS C.Michel
MANUFACTURING AND APPLICATION OF SUPERCONDUCTING WIRES
C. Laverick and J.K. Hulm
SQUID CONCEPTS AND SYSTEMS J. Clarke
3
124.)
l'Tl )
(lBO

- 3 -
LECTURE NOTES OF Ist TOPSØE SUMMER SCHOOL ON SUPERCONDUCTIVITY
Preface
The Topsøe Summer Schools have been initiated by the Danish Research Academy in co-operation with the Haldor Topsøe Corporation in an attempt to stimulate the recruitment of young scientists. The Topsøe Summer Schools will be organized in co-operation with Danish universities and research institutes.
The 1st Topsøe Summer School on Superconductivity was organized by and held at Risø National Laboratory, June 20-24, 1988. Superconductivity is a basic disciplin in solid state physics and may as such be justified as a topic for a summer school. It is obvious, however, that the recent discovery of high temperature ceramic superconductors has stimulated the interest for this field of research both on a basic scientific level and with respect to applications. Two major questions appear: What is the origin of superconductivity in high temperature ceramic superconductors, and to what extend will the overwhelming expectations of their technological applications come true? Many scientists in basic and applied physics and chemistry will inevitably face these questions for quite some time in the future. With this in mind SUPERCONDUCTIVITY became a natural choice of topic for the 1st Topsøe Summer School. Future Topsøe Summer Schools comprise: "Physics of small storage rings" to be held at the Institute of Physics, University of Århus, 1989, and "Applied mathematically advanced computer models" in 1990.
The format of the School was basic lectures on superconductivity in the mornings and practical experiments in the afternoons, except for one day which was devoted to: "Workshop on Ceramic Superconductors". During the workshop review lectures, summarizing the evolution and current understanding, as well as presentations of the most recent experimental and theoretical advances in the study of the high temperature superconductors were given, and the participants had the opportunity to present their own work during a poster session.

- 4 -
The basic course on superconductivity
G. Aeppli, AT&T Bell Laboratories: K. Beckgaard, Univ. of Copenhagen: J. Clarke, Berkeley: L.M. Falicov, Berkeley C. Laverick, Private Company:
C. Michel, University of Caen:
N.F. Pedersen, Technical Univ. of Denmark: O. Ulf beck, Niels Bohr Institute:
The workshop lectures included:
S. Amelinckx, University of Antwerp:
D J. Bishop, AT&T Bell Laboratories:
L.M. Falicov, Berkeley: J.D. Jorgensen, Argonne National Laboratory:
H.R.Ott,ETH, Zurich:
P.H. Wu, Nanjing University:
»»prised the following lectures:
Muons, Neutrons and Superconductivity. Superconducting Molecular Solids. SQUID - Magnetometers. Superconductivity: Phenomenology. Manufacture and Application of Superconducting Wires. Physiochemistry of High-Tc Superconductors.
The Josephson Effect Quantal Structure of Superconductivity.
The Study of High-Tc Superconductors by Means of High Resolution Electron Microscopy and Electron Diffraction. Ultrasound and Torsional Oscillator Measurements on Superconductors. Models for High-Tc Superconductivity.
Noval Structural Properties of High-Tc
Superconductors. Some Low Temperature Properties of High-Tc Superpconductors. High-Tc Superconducting Devices for High Frequency Applications: New Chances and New Challenges.

- 5 -
The experimental exercises dealt with:
Synthesis and Characterization Neutron Diffraction Transport- and Magnetic Properties Josephson Effects
Organization and guidance of experimental exercises were performed by:
J. Als-Nielsen, Risø National Laboratory N. Hessel Andersen, Risø National Laboratory J.B. Bilde-Sørensen, Risø National Laboratory K.N. Clausen, Risø National Laboratory C. Schelde Jacobsen, Technical University of Denmark C. Thune Jacobsen, University of Copenhagen I. Johannsen, University of Copenhagen W. Kofoed, Risø National Laboratory J. Gutzon Larsen, Haldor Topsøe Corporation B. Lebech, Risø National Laboratory M.T. Levinsen, University of Copenhagen M. Nielsen, Risø National Laboratory
The present set of notes cover most of the lectures given on the basal courses on superconductivity. They intend to give the students a reference to the lectures presented at the School and more generally to the literature on superconductivity. It is the hope that they may serve as guide and inspiration for further studies of the basic properties of superconductivity and the many possible applications of superconducting materials and devices.
Preliminary notes for all the lectures, essentially based on the lecturers's viewgraphs, were distributed during the School. These and the guides to the experimental exercises are available on request.

- 6 -
The organising committer of the School was:
J. AIs-Nielsen, Risø National Laboratory N. Hessel Andersen (head), Risø National Laboratory J. Bøttiger, Århus University N. Falsig Pedersen, Technical University of Denmark JJC. Kjems, Risø National Laboratory ILT. Levinsen, Copenhagen University K. Mortensen, Risø National Laboratory If. Nielsen, Risø National Laboratory H. Topsøe, Haldor Topsøe Corporation
Secretary of the School was:
G. Olesen, Risø National Laboratory assisted by: K. Kjøller and B. Laursen, Risø National Laboratory
On behalf of the organizing conunittee we would like to thank the lecturers for the inspiring lectures they presented and thereby gave decisive contributions for a successful School. Special thanks are expressed to the lecturers on the basic courses who have taken the time to prepare these lecture notes..
Risø, December 1988
N. Hessel Andersen and K. Mortensen Editors

- 7 -
CH APTER1
SUPERCONDUCTIVITY: PHENOMENOLOGY
LM FaUcw
t of Physics, Urérsity of Cattforaia,
Berkeley. Caajfpnia, 94720. VSJL
MMeriab and Okaaical Sciences Division O: 39C30Q2172 Lawrence Bokeky I abojawy
Bokdey.CaWonua, 94720, U.S.A.
ABSTRACT
L- THE SUPERCONDUCTING STATE,
(a) The sopeicondocting inmition temperature: (b) Zero resistivity; (c) The Meissaer
effect: (d) The isotope effect: (e) Microwave and optical properties; (0 The sopercon-
ducting energy gap.
II.- THE GINZBURG-LANDAU EQUATIONS,
(a) The coherence length; (b) The penetration depth; (c) Flux qnanmation; (d)
Magnetic-field dependence of die energy gap; (e) Quantum interference phenomena; (f)
The Josephson effect.
August 2,1988

-8-
SUPERCONDUCTIVITY: PHENOMENOLOGY
LM.Fmlicm
Umcmy of Cafcfoiwa, Berioeky. CnMfaraii, 94720.
USJL
U k w I C H C C mJmmWJCmCW M*mBlMmmWy
Berixlcy. Gsifania. 94720, USJL
L THE SUPERCONDUCTING STATE.
IA. Background Iwianuikm.
SUPERCONDUCTTVITY is a phase, a smc of maner (m me team dntke and sKani are phases of
[1-3].
The SUPERCONDUCTING STATE has several characterise properties:
1.- When it exists for a given substance, it exists only at temperatims below a so-called TRANSITION
TEMPERATURE, Tc, and in general down u die absolute zero of die temperature scale
(Off =-273.15 C).
2.- It exhibits dc. ZERO RESISTIVITY, Le. infinite conductivity for zero-frequency measurements
(an effect discovered in mercury by Kamerlingh Onnes in 1911),
p«o = 0 ; T < r t ) = 0 . (1)
3.- It exhibits, for weak magnetic fields, perfect DIAMAGNETISM, i.e. its magnetic susceptibility in
Gaussian units is given by

- 9 -
X, = - tf*«) . (2)
mmCPsJ IS ft 10*CC pHprnVawC SSPCVCOBBmCtDVS SWIV D Q H SkaCHBttC feddSs Aumtt CuBCL SJnOVA SS mnm#
MEBSNER EFFECT, was dncovered by Mesw r and Odmaccld in 1933.
4.- Thnmrnnnmuaaamamv v a l u e - c a n U a a E W s ^ I K
system away bom its sane of lowest energy (ate soxanedanaaadsmmXThB e n c l a s p
Ee = 2IAI . (3)
was umjattnmd meumtiumy by F. Loadoa ia 1935. dedaoed from ihriaindjnamii dam • 1946.
mtmred absnptioa w i i w w a i in 1937. down so fonmnriri of dm oder of 1014 cycles per
second showed no differences between dm nofmal and supetcondnebng phases, hncaownve meat-
anemens by H. London • 1940 gave no ajnaamblc absorption of ffcrammsgwtr laomoon by
superconductors up n> a ftcujacmy of l v cycles per second. These two experiments tegiihu gave
nppernad tower boonds to nte snpercondactmg energy gap.
m 1957 Glover and Tnamam wen? successful in reaching da? far mftared region of dm ckcuumag-
aeuc tow Hum and observed, for lead, a sadden drap m dm absorption as dm fmojuency was
la 1960 Gmever distovued dmt dm cmrentAmkage characteristics of lamlwkhu consisting of a
supeiconduckv and eidxr awothcr superconductor or a nomrnl metal, separated by a dan oxide
insulating layer were nonlinear, and dmt dm non-linearity could be easily interpreted in terms of an
energy gap in dm speed urn of Mm superconductors).
5.- There is n surprising dependence on the transition tcmpeiature, Tf, on me isoiopic mass of me
atomic nuclei of dm superconductor. (It is surprising that a phase which is electric and magnetic in
nature, and therefore caused by me electrons, åeftxA'mm^fMAuona^t»K\eM^m/uata,'mfm-
fkumr die mass of the nuclei.) This is me so-caDed ISOTOPE EFFECT, was discovered m 1950,
and establishes that

- 1 0 -
M*Te*tmm*. (4)
WWCK åm B M C a l Q C V V H S H H » U f H j n ø B aavCVJatt«, V C CXBQBCH QL BKBS Hat ^HBC£
a4tS fcr Pb. 0.415 far S * 0.150 forTLOyOK for Ra. aad -0015 for k.
6. • aaarnoa a> ae effect of Ugh • a y i a M r y iaiMiuadauiiiij cat be desaoycd ( w å t u f c i i a
ifc^ a M ^ n l tf^^\ WM f ^ h r « ^ H S ^ ^ ^ g L gf^^tt^ f^Hi^^ft i *± f gw s I M V ^ É^M^Mki ^^M^v^^ £#VI
> «c 2- v* snoaai ae anaoaea aaa ai vane sapenoaaacnas, ane so-uota type u saavKoaaac-
apeicoadacior bat do aot dunwjy Ae SBpesconaacaag; safte.) The ojnaandes fc. 1L^, aad Hcj, are
caled * e CRITICAL CURRENT, and das fnt a d second CRITICAL MAGNETIC FIELDS,
fessectncty.
7.- Sapeicondadivay » a MACROSCOPIC QUANTlAi PHENOMENON, wJA aaanmaJes aad
paabBCS «B90Cåaa%6Q W t t t OaC C M t t t T CaØ PaVMMSBaT Ab I M C I C I O R ) HattSaTKaCBCC aanaW fiamauUaC&Oaa Cff i f t f f f
can be adaeted, m pankahr Ae JOSEFHSOK EFFECT PI- These effects can be fnttdtf
CHaDavTCu Bl BVOCCSSMaC. SKsTanwff. flRQ ICVaCWaC HVOnaMDOAh |jfj_ H OOHDBKT BQaaVOlOST«
IB. Theory.
The caneady, aahenaBy ailt|flwl aaeory of sajnacoadactmty, kaoaa at dte BCS THEORY was
foiaaaaird (5) by Banfeea, Cooper aad Sdaieffar ia 1957. The daaory ia as BKM feacnl fan« stales
dat, if metallic mobile easctnoat iaaenct ATTRACTIVELY was eacb oder, oka daey val coadeaae iaao
a fraand SBK wide
(1) an emrtj rø a die excitation spectnan;
(2) zeroiesistmry;
(3) die Manner effect; and
(4) a phase aansaion to die normal metallic suae 1 a aansition leropciatare Tt.

- 1 1 -
There is an important issue to resolve. How can two electrons - which are charged particles with
identical negative charges, and therefore experience a strong Coulomb-force repulsion - attract one
another? The answer is: by polarizing die crystal lattice. [An instructive simile is the attraction that two
billiard balls experience when placed on a rubber membrane: one billiard ball falls readily into die
depression caused by die other ball, hence it is attracted by die other ball.] Since die polarization of die
crystal lattice depends on die mass of die nuclei which form it, die strength of die electron-electron attrac
tion, which is caused by die lattice polarization, depends die mass of die nuclei, i.e. diere is an ISOTOPE
EFFECT.
The BCS theory yields, in general, an integral equation for die energy gap parameter A, and another
integral equation for die transition temperature Te. These integral equations depend on die electronic
structure of the metal, and on the details of die attractive interaction between die electrons. As an exam
ple of their theory, Bardecn, Cooper and Schrieffer introduced a very simple model, die so-called BCS
MODEL, for which die integral equations can be analytically solved, and that yields
A = 1.76 k Tc = 2-fi <oD txp[ VNV] , (5)
where k is Boltzmann's constant, u^ is die vibration (Debye) frequency of die lattice, JV is die number of
available electronic states per unit energy in die solid (density of states at die Fermi level), and V is die
strength of the attractive (lattice mediated) electron-electron interaction. This formula gives an isotope
effect because <0j>, a lattice frequency, depends on die nuclear mass [it is proportional to .VJ/i].
This simple BCS model gives a good idea of how die BCS theory works: .die transition temperature
can be increased (i) by increasing <aD, (ii) by increasing N, or (iii) by increasing V. [It should be
remarked that the influence of botii N and V on Te is much more dramatic than die simple proportional
ity of Te and aD.] According to formula (5) there is no maximum transition temperature; Tc can be
increased without limit by finding solids with larger and larger N,V,and(0D.
In fact formula (5) is not accurate: it is only a simple model. A very good and accurate theory,
based on die BCS theory, was developed by Eliashberg and McMillan [6] which, starting from precise
experimental information about die crystal lattice vibrations, could accurately - by numerical methods -
calculate the gap parameter A and die transition temperature Tc. The main results of this tiieory are

- 1 2 -
presented in the Appendix. With a precision of a few percent, the equations yield excellent results for the
transition temperature Te and the isotope effect exponent a in several well studied cases, mostly transi
tion metals. Numerical experiments performed with the Eliashberg-McMillan equations produced, for
sensible input of lattice vibration spectra, superconducting transition temperatures which never exceeded
40 K. Therefore, although no rigorous limit was established for a MAXIMUM SUPERCONDUCTING
TRANSITION TEMPERATURE, the belief among most specialists was that such an upper bound
existed, and that it was in the range of 30 K to 40 K.

- 1 3 -
IC. History of the Highest Superconducting Transition Temperatures.
The Table below shows the history of the experimentally found highest superconducting transition
temperatures:
YEAR
1911
-1913
1933
1941
1953
1960
1969
1973
1986
1988
1986
1987
1988
1988
1987
T«[K]
4.2
7.2
9.5
16.0
17.1
18.05
2C.8
23.2
-30
-30
39
-92
-105
125
-230
SUBSTANCE
Hg
Pb
Nb
NbN
V£i
NbjSn
NbAlGc
NbiGe
La-Ba-Cu-0
Ba-K-Bi-O
La-Sr-Cu-O
RE-Ba-Cu-0
Bi-Sr-Ca-Cu-0
Tl-Ca-Ba-Cu-0
RE-Ba-Cu-0
highest T
RE
not
Notes and References.
[1]
[71
[8,9]
c superconductor without Cu [10]
[11]
= various rare earths [12,13].
[14]
[15,16]
reproducible, unstable! [17]
As can be seen, from 1911 to 1973 the increase in maximum observed transition temperatures was
a more-or-less linear function of about 0.3 K per year. No temperature was found to violate die (wrongly
believed) upper bound.

- 1 4 -
For the sake of comparison it should be remembered that liquid helium boils at 4.5 K, liquid hydro
gen at 20.7 K, liquid neon at 27.2 K, and liquid nitrogen (ix. liquid air) at 77.4 K. These are the most
commonly used refrigerants, and any technology based on superconductivity will have its running costs
determined, almost exclusively, by die refrigeration costs. The discovery of superconducting Nb-fic in
1973 was considered a major breakthrough, since for the first time die liquid-hydrogen barrier was
crossed. Needless to say die events of die last two years can be considered, by any standards, fantastic:
first the liquid-neon barrier was broken; soon thereafter the liquid-air temperature was surpassed; and - if
die elusive and unstable very high temperatures reported [17] but easily lost, are both confirmed and sta
bilized - it seems that die dream of room-temperature superconductivity is now within accessible reach.
H.- THE GINZBURG-LANDAU EQUATIONS.
HA. General formulation.
In 19S0 Ginzburg and Landau4,1*"23 (GL) proposed a phenomenological theory of superconduc
tivity, which was independent of die microscopic aspects of the phenomenon. The theory was quantum-
mechanical, in the sense that included coherent, macroscopic quantum effects. It was a pioneering theory
which, independently of the mechanisms responsible for superconductivity, is still valid today. It contains
such diverse phenomena as magnetic-field penetration depths, coherence lengths, magnetic-field iux
quantization, magnetic-field dependence of the energy gap (order parameter), and die Josephson effect U
can be applied to all superconductors, as well as to superfluid 3He, and has become die prototype theory
to study a whole class of phenomena related to second-order phase transitions.
The GL theory introduces a complex order parameter y which is allowed to vary in space. Origi
nally GL interpreted y as an amplitude, and l y I3 as the density of the "superconducting" electrons (they
envisioned a superconductor as two interpenetrating electron fluids, die non-dissipative, non-resistive
"superconducting" electron fluid, and the dissipative, resistive "normal" electron fluid). In 1959, however,
GorTtov34-25 proved, using his own formulation of die BCS theory, Uiat for temperatures below and close

-15 -
to Tt, equations identical to those of GL could be obtained, and that the GL parameters w could be inter
preted (except for a trivial constant of proportionality) as the BCS energy-gap parameter A.
The starting point of the GL theory is die introduction of a magnetic Helmholu free energy FJH for
the supefconductor, derived from plausibility arguments
F » = J åh [FJI,o + AF(lwl2) + (l/2m)|-DtV¥-(e»/c)A¥ |2 + (l/«n)llV)] - (6)
Here Fm is die free-energy density of die nonnal stale m die absence of a magnetic field; AF is die
difference of free-energy densities between the superconducting and the nonnal stales (also in die absence
of a field) and is a functkxi of lyl2. The third term is the gauge invariant "superconducting kinetic
energy", and die last term is die magnetic field energy in die superconductor. The vector potential is A,
H is the magnetic field, and e* is an effective charge, known now to be die diarge of a a "Cooper pair"
e*=7e . (7)
All terms in (6) are functions of die position r, and change widi die magnitude and direction of die mag
netic field.
Because die proper variables of die magnetic Hebnhofc free energy are die temperature T and die
magnetization M, where
M = (l/4x) J dh [H(r)-Ho] , (8)
H0 = applied magnetic field ,
F w is not continuous at die critical fields. The function which is continuous at Hcl and tie* and whose
proper variables are J and Ho, is die Gibbs free energy Qm, given by
G „ = F W - M H 0 . (9)
Substitution of (6) and (8) into (9) yields
GSH=GNH+ j & [AF(lvl2)+(l/2»i)|-i«V»'-(e*lc)Ay|2] + mptrcmttrier
(1/8*) j dh [H(r)-Ho]2 . (10) tiltpau L J

- 1 6 -
where
Gw, = J d*r [FWO + « O / 8 K ]
It should be noted that die last term in (10) is to be integrated over the whole space (both in the super
conductor and outside). Minimization of G with respect to the four functions y and A [or equivalently y
and H] yields the famous GL equations:
v2A=-£^-(y.vy-yVy.] + i 5 £ # > v > 2 A
mc y- J mc
dAF 1 dy* 2m
V x A = Ho on surface ,
2 i
-A c
-mv-iii y=o ,
ifi Vy + — A y c
= 0 ,
OD
(12)
(13)
(14)
where the London gauge
has been chosen.
V A = 0
IIB. Penetration Length and Coherence Length.
In singly connected samples with no penetration of the magnetic flux into the bulk superconductor,
the phase of y can be chosen so that y is real throughout the sample. In particular for a one-dimensional,
singly connected problem, with quantities varying along the x-axis, and with magnetic field and vector
potential given by
H = [ 0 , 0 , W ( x ) l ,
A = [ 0 , A ( * ) , 0 ] ,
the equations (11M14) become

- 1 7 -
(d2vl/<fx2) = (4w*2/mc2)v2v» .
(dA I dx) = H0 on surf ace ,
3y IHC* m <ir2
(dy/<<x) = 0 on surf act
(15)
06)
(17)
(18)
For the free-energy difference AF, the original GL derivation used a power-series expansion in
lyl2, and neglected all terms higher than the second. That expansion is still commonly used, and is
known to be valid for superconductors at temperatures close to Te:
AF = 8JC -fcMwfl- (19)
where H* is the thermodynamic bulk critical field, and y r is the equilibrium value of y in the bulk, at
temperature T, in the absence of a magnetic field.
One of the simplest and most instructive cases to solve is dial of die superconducting half-space,
with a constant magnetic field H0 applied parallel to the surface at x = 0. Integration of (15>(19), under
the assumption of small changes in y near the surface, yields for x > 0
Vr = 1 -
(2-K„2)V8
H*_
H* -Vx, e (20)
and
//Cx)=//0exp(-*At) , (21)
where XL> which governs die decay of the magnetic field into the superconductor, is die London penetra
tion depth
tf- mc" 4nc*2y}
(22)
and K, is a dimensionless constant
K,=(V2e • / * ) * £ / / * (23)

- 1 8 -
Two remarks are necessary at this point First, there are two length scales in the problem: (i) the decay
length for magnetic fields, Aj, and (ii) die decay length, (A / V2K,), for the order parameter y , given by
the first exponent in (20). Second, Gor'kov has shown24-25 that
x„ = 0 .96^ f 1 , CM)
where £, is Pippard's electromagnetic coherence length2*27, now known to be related to die energy gap
parameter
%. =<vF /A (25)
(vf is the Fermi velocity of die electrons in the metal). Values of K0 are small (< 0.707) for die soft, type
* superconductors [0.01 for Al; 0.3 for Pb], whereas it takes large values ( > 0.707) for the hard, type n
superconductors [ ~ 8 for V; extremely large for die new, high Te materials].
A type I superconductor excludes a magnetic field from its bulk completely. If die magnetic field is
increased diere is a value, Hc for which die superconductivity is suddenly destroyed, die system returns to
die nonnal state, and die magnetic field penetrates die specimen completely. A type II superconductor
excludes die field completely up to a value Hel. Above Hel die field is partially excluded, aldwugh die
specimen remains superconducting and exhibits zero resistivity. At a higher field, Hc2, die flux penetrates
completely, superconductivity is destroyed and die specimen returns to its nonnal state.
DC. Flux quantization.
In many applications (diin specimens, weak magnetic fields, etc.), die order parameter y can be
considered to have a constant magnitude n **, aldiough its phase 6(r) can vary appreciably in space,
¥ » » * « ' • » . (26)
From standard quantum-mechanical arguments die electrical supercunent is given in this case by die
usual formula
ne* m
' * v e - — A
c * J
j = 2m V* - H T V - H A v+v , * V - ^ A c

- 1 9 -
Deep inside any superconductor the electric current is zero and, therefore, from (27) one obtains
e*k*4Cc V9 . (28)
In a multiply connected sample one can find a closed path C which encircles a non-
superconducting region where there may be a magnetk: field. Line integration of (28) over that path, use
of Stokes theorem and knowledge that y must be single-valued yields
J A r f s = j VxA do= J H d o r = * cloud C trtaC anmC
= — f V 9 d s = — - 2 « v , (29)
where O is the magnetic-field flux, and v is an arbitrary integer. In other words (29) can be written
4> = v <t>o = v • 2.0678X 10 *7 gauss cm2 . (30)
i.e. if4 a closed path without currents tan be established deep inside a multiply connected superconductor,
then the magnetic-field flux encircled by that path is quantized in units of *o.
ED. Phase-current relationship; the Josephson effect.
From the GL equations it can be easily seen that the order parameter y has an indeterminate arbi
trary, constant phase. In a given superconductor (called 1) its phase 8, is completely arbitrary. If, how
ever, there is nearby a second superconductor (called 2), which is weakly connected to the first one,
although both phases, 8] and 92, are indeterminate by the same additive constant, the phase difference
between the two,
5 = 02-0, ,
is an observable meaningful quantity. As can be seen from (27) a change if 0 over space is responsible for
the existence of a supercurrent. Similarly3,2* a phase difference between two weakly coupled, spatially
close superconductors produces a current flow between them given by
/ * / o «in5 , (31)

- 2 0 -
where J& a constant, describes the maximum possible current which may flow between the the two speci
mens. Equation (31) is Josephson's famous d.c. equation relating current and phase difference. It is
implicit in the GL equations and applies to any system with a macroscopic, quantum-mechanical, com
plex order parameter. It is the consequence3* of the standard quantum mechanical uncertainty relation
between particle number and wave-function phase.
HE. Magnetic-field dependence of the energy gap.
Detailed solution of (15)-(19) for thin films4 clearly exhibit a field dependence of the amplitude of
the order parameter ly l on applied magnetic fields H* As the field is increased the value of lyl
decreases, and there is a value Hj for which it goes (either continuously or discontinuously) to zero and
the film becomes normal. It is found that Hf depends on Hcb,d and the London penetration depth (22),
and that the I y I transition to zero at Hf is discontinuous if
dfXc > V5 .
These results, and many others obtained from the solution of the CL equations for a variety of geometries
and situations, have been confirmed by superconducting tunnelling experiments.
HF. Quantum interference phenomena.
Finally the facts thac
(i) the order parameter y is complex; (ii) y must be single val:ied; (iii) the magnetic field H couples to it
in a gauge invariant form and therefore is directly related to the phase 0 of y; and (iv) the GL equations
are non linear;
result in an enormous wealth of interference and diffraction effects which can be fruitfully used in design
ing interesting electronic devices29'30. It can be said that, in mastering the science of superconductivity,
scientists have promoted quantum mechanics to the macroscopic, everyday-use level.

- 2 1 -
APPENDIX
The integral equations for the normal and pairing self-energies of a superconductor are
{(») - [I - Z(*)] a) = J" da,' Re[(o)'2 ^^ya]
x Jrfo,,a2(<»,) f (a,)[/),(<»' + « ) - / ) , ( « ) ' - <B)] , ( 3 1 )
*<»)=j>H^ ] x I Jrfft), a2(co,) F(o,) [ £ ) > ' + <u) + / > > ' - oi>] - A ( 3 2 )
where D,{<o) = (a> + © , - I O * ) " 1 , J(ft>) = tf>(a>)/Z(a>), and d0 = é(A0). F(<o) is the phonon density of states
f ( < u ) = II^F 5 ( a > " f t , , i ) • (33) X
and a2(w) is an effective electron-phonon coupling function for phonons of energy o>:
•' w 'w - j£j r<#yvwc- - ' j /J . v- »3«) where øj,.j is the dressed electron-phonon matrix element, cofi is the phonon energy for polarization X and wave number q (reduced to the first zone), and DF , is the Fermi velocity. The two surface integrations are performed over the Fermi surface.
In order to solve these equations, the necessary input consists of two numbers, the electron Coulomb interaction pseudopotential f , and the cut-off a> , and the electron-phonon coupling function ccl(co)F(a>) •
ACKNOWLEDGMENT
This research was supported, in part, at the Lawrence Berkeley Laboratory by the Director, Office of Energy Research, Office of Basic Energy Sciences, Materials Sciences Division, U.S. Department of Energy under Contract No. DE-AC03-76SF00098.

- 2 2 -
REFERENCES
1 C. Kittel, Introduction to Solid State Physics, 5th edition (Wiky, New York. 1976). Chapter 12.
2 M. Tinkham, Introduction to Superconductivity (McGraw-Hill, New York, 1975).
3 J. Clarke. Amer. J. Phys. 38.1071 (1970)
4 D. H. Douglass. Jr.. and L. M. Falicov. in Progress in Low Temperature Physics, edited by C. J.
Gorter (North-Holland, Amsterdam, 1964), volume 4 , p 97.
5 J. Bardeen. L. N. Cooper, and J. R. Schrieffer. Phys. Rev. 1Q6.. 162 (1957); J0£, 1175 (1957).
6 For a comprehensive review of this complex subject, see the various articles in Superconductivity,
two volumes edited by R. D. Parks (Dekker, New York, 1969).
7 See the review in Science 182.293 (1974).
8 J. G. Bednorz and K. A. Muher, Z. Phys. B - Condensed Matter 6J, 189 (1986).
9 C. W. Chu, P. H. Hor, R. L. Meng, L. Gao, Z. J. Huang, and Y. Q. Wang, Phys. Rev. Utt. 58,405
(1987).
10 R. J. Cava, B. Batlogg, J. J. Krajewski, R. Farrow, L. W. Rupp Jr., A. £. White, K. Sjort, W. F.
Peck, and T Kometani. Nature 222 > 814 (1988)
11 R. J. Cava, R. B. van Dover, B. Batlogg, and E. A. Rietman, Phys. Rev. Lett 58.408 (1987).
12 M. K. Wu, J. R. Ashburn, C. J. Tong, P. H. Hor, R. L. Meng, L. Gao, Z. J. Huang, Y. Q. Wang,
and C. W. Chu, Phys. Rev. Lett 58 ,908 (1987).
13 See the article Superconductivity seen above the boiling point of nitrogen, in Search and discovery,
Physics Today, April 1987, p 17.
14 M. Maeda, Y. Tanaka, M. Fukutomi, and T. Asano, Jpn. J. App. Phys., Pt 2,22,209 (1988)
15 Z. Z. Sheng and A. M. Hermann, Nature 3J2.138 (1988).
16 S. S. S. P. Parkin, V. Y. Lee, E. M. Engler, A. 1, Nazzal, T. C. Huang, G. Gorman, R. Savoy, and
R. Beyers, Phys. Rev. Lett. # , 2539 (1988).

- 2 3 -
17 C YJIuang. L. J. Dries. P. H. Hor. R. L. Meng. C W. Chu. and R. B. Frankel, Naoøe 2 1 . 4 0 3
(1987).
18 V. LGinzbwgandLD. Landau, Zbw.Eksp. Teor. Fiz. SSSR 2J, 1064 (1950).
19 V.L.Gin2burg.DokLAlad-Nadc SSSR 82.3«5 (1952).
20 V.L-Gin2burK.Noovo Om. 2,1234(1955).
21 V.L.Giiizburg. Zhur. Eksp. Teor. Fa. SSSR 2£, 748 (1955) [Soviet Phys. JETP £,589(1955)].
22 V.L.Giiizbarg.DokI.Akad.Nauk SSSR Ufl . 358 (1956) [S-viet Phys.DoU. 1.102(1956)].
23 V. L. Ginzbafg.Zlmr.Elap. Teor. Fa. SSSR 3 4 . H 3 (1958) [Soviet Phys. JETP 7 .78 (1958)].
24 L. P. Gorlcov. Zhur. Eksp. Teor. Hz. SSSR 30..1918 (1959) [Soviet Phys. JETP 2.1364 (1959)].
25 L. P- Gorlcov. Zhur. Eksp. Teor. Hz. SSSR 32.1407 (1959) [Soviet Phys. JETP Jfl. 998 (1959)].
26 A. B. Pippard, Proc. Roy. Soc. (London) A2Q2. 210(1950).
27 A. B. Pippard. Proc. Rov. Soc fLondonl A216.547 (19531.
28 Aa. Bohr and O. Ulf beck, Quantal structure of superconductivity. Gauge angle., kctores presented
in this Sumner School.
29 J. Clarke, SQUID-Magnetometers. lectures presented in this Sumrner ScbooL
30 N. Falsig Pedersen, The Josephson Effect, kctmts presented in this Summer School.

- 2 4 -
C H A P T E R . _ , „ , 0 0 2 1 » «
Quaatal structure of superconductivity. Gauge angle
Aage Bohr Ole Ulfbeck The Nids Bohr Institute
Two Lectures Prepared for 1st Topsøe Simmer School oa Sapercoaductivity Jaael988
1 Intrinsic motion of superconductor • Pair field
~~ Dcgices of freedom
- Iateractioa. Pair force - Painpin
- Polarization of pairspia. Pair add
• Pair coridatioa
- Eigenstates of individual painpin
- Ground state of total system
- Excitations. Qnasipartides
• Self-consistency. Phase transition
- Ground state
- Critical temperature
2 Gauge angle as dynamical variable
• Rotation in gauge space
- Angle conjugate to particle number
- Spontaneous symmetry breaking
- Dynamics of gauge angle
- Supercurrent in Josephson junctions
• Superflow
- Gauge angle as velocity potential
- Winding number
• Local gauge invariance
- Electromagnetic potentials and coupling to particles - Supercurrent. Spontaneous breaking of gauge invariance
- Impermeability of superconductor to magnetic field

- 2 5 -
The superconducting phase of the electron fluid arises through an instability of the fermi surface due to a weak, effective interaction between pairs of electrons close to the fermi surface . The instability leads to the formation of a static mean field, the pair field, which acts by adding and removing pairs of particles. The pair field thus constitutes a deformation in a new dimension, by which the symmetry associated with particle number conservation is spontaneously broken. The first lecture deals with simple aspects of the electron matter in the presence of the pair field (intrinsic motion).
The deformation defines a direction angle, the gauge angle, conjugate to particle number, and the system thereby acquires the ability to rotate collectively in the new dimension. Moreover, the spatial variation of the gauge angle, by which local gauge invariance is spontaneously broken, manifests itself in the supercurrent. The second lecture addresses some general features of the collective degrees of freedom of the superconducting material, illustrating the effect of the symmetry breaking***
1 Intrinsic motion of superconductor • Pair field
• Pair correlation
• Self-consistency. Phase transition
In normal metals, the metallic electrons form a fermi liquid characterized by a long mean free path. Our starting point is therefore the quanta! states \v) of the individual particles in the mean field from the ions and electrons. For definiteness, we may think of the quantum numbers v as momentum and spin component v = (p,<r), as in a homogeneous medium. The ground state (T=0 Kelvin) of the metallic electrons then forms a fermi sphere, in which all single-particle orbits are occupied up to the fermi surface, with momentum PF and energy ep. The detailed structure of the single-particle orbits, related to the symmetries of the mean potential, is not of significance for the following, but it is assumed that the mean potential respects time reversal symmetry, as is the case for a lattice without magnetic ions. The T-symmetry entails that the orbitals u, no matter how complex their spatial structure, occur in degenerate time reversed pairs, denoted by \v) and \u), respectively. Such orbitals, though orthogonal, follow each other closely in space, with complex conjugate amplitudes for opposite spin components, in the point r. For any mean field with T-symmetry, the ground state of the metallic electrons can therefore be described as a pairwise filling of orbitals v and v, up to the last filled orbit up, with energy (F- Such a picture tacitly assumes that all components of the mean field commute with particle number. However, mean fields of a more general character, changing particle number, can be accomodated in the quanta! description in a straightforward manner. The formation of such a mean field underlies the following discussion.
'The lectures deal with the theory of superconductivity developed by J. Bardeen, L.N. Cooper, J.R. Schrieffer, Phys. Rev. 1Q& 1175 (1957).
3The lectures attempt to describe general concepts that have been developed in the description of superconductivity and which are of broad significance to quantum physics.

- 2 6 -
1.1 Pair field
• Degrees of freedom • Interaction. Pair force • Pairspin • Polarization of pairspin. Pair field
1.1.1 Degrees of freedom
The ground state of the uncorrelated system consists of filled pairs of orbits \vv) that are invariant under time reversal symmetry. This symmetry is maintained in the correlated state describing the superconducting electron fluid. In this state, the time reversed partners v and P always occur together; either both orbitals are occupied, or both are empty. Such a state characterized by a pairwise occupancy of time reversed orbits is referred to as a pair correlation.
The dynamical variables describing the pair correlation are the occupation numbers of the pair of orbitals vv, with eigenvalr.es 1 and 0,
n(VV) \ 0 |n(^) = 0) = |0) (l)
and the Hamiltonian for the uncorrelated system is
/ f ^ E 2 ^ ) ^ ) <V) = €(")-/* (2)
where the single-particle energies d{v) are measured from the fermi surface, also referred to as the chemical potential ft. The notation v > 0 indicates that the summation is over pairs, each pair counted once. (The states \vv) are invariant und« T, since T*|i/) = \v) = -I«'), for a state of a single fermion, and since the two-particle states are antisymmetric under exchange of particles, \vv) = ~\Pv)).
1.1.2 Interaction. Pair force
In the space of pairwise occupied orbits, the interaction that is reponsible for the pair correlation acts by transferring two particles from one pair of time reversed orbits to another. This transfer is performed by the quanta! operators a'(i/),a(v) that add and remove a particle from the orbit v (creation and annihilation operators). Thus the product
a*(P2)a*(u2)a(ui)a(Pl) (3)
gives the transition
v\P\ -»i/ji?2 (4 )
The matrix element for this process can depend on v\ and uj, but since each vP pair is :Kted upon by a large number of pairs in a region around the fermi surface, the forces are n presented by an effective attractive interaction with average matrix element G,
VP = -G J ] at(i/2)at(,/2)a(»/?W-',) (G > 0) (3) «1>0n>0
which acts in the neighbourhood of the fermi s< .»ace.

- 2 7 -
1.1.3 Pairspin
The n(vv) degree of freedom acts on the states \uv) and |0 ) that can be viewed as basis vectors in a two-dimensional space,
|i*) = at(*)«t(„)|0) -> ( l \ |0) = a(V)a(u)\vu) - t °A (6)
Any operator in this space, such as pair addition or removal and the number operator, can be expressed as linear combinations of Pauli matrices
,t(*)at(„) = ^ J ) = \(o,(v) + i*y(v)) = *+(») (7)
a(u)a(v) = s-(v) 5 = 2s s± = sx ± isy
»("*) = (i H^Ja+M")) Thus, by the introduction of operators «(«/), referred to as pairspins3, the pair correlated fermi liquid appears in the guise of a system of interacting spins, one for each vv, and the total Hamiltonian takes the form (see (2) and (5))
H' = H0 + Vp (8)
with
and
H'0 = £ < V ) ( 1 + ».(»)) (9) v>0
V, = -G £ *+(**M"l) (10) *i>o*j>o
= -G £ ft.(^)'*J.(^) (*i=(*x,*»)) V ) > O J * > 0
The transverse pairspin ij . has components sz and «„, perpendicular to the z-axis. The last expression (10) ignores commutators for v\ - t/3, since the number of these terms is negligible compared to those with v\ ^ i/2, when many pairspins contribute to the interaction.
From (7), it follows that the total pairspin in the z-direction is equivalent to the number operator,
s, = 5>,c) (ii) i/>0
= £(«(«*)-|) i/>0 *
where No is a constant depending on the single-particle space included. The axia! symmetry of H'0 and Vp in pairspin space, which implies that these operators commute with 5 „ therefore expresses particle number conservation.
'The description of the pair correlated phase in terms of spin variables (quasi spin) was introduced by P.W. Anderson, Phys. Rev. 112 1900 (1958). With the rapid rise in the use of spin-like qnantities, it seems appropriate to use the more specific term pairspin in the present context.

- 2 8 -
1.1.4 Polarisation of pairspin. Pair field
The interaction Vp is a spin-spin coupling, which seeks to align the transverse components of the pairspins. Were it not for H'0, all spins would line up in the same direction, perpendicular to the z-axis. The single-particle energy H'0 counteracts this alignment. Indeed, H'0 plays the role of a magnetic energy, which tends to align the spins in the i-direction, or opposite to it, with a strength that increases with distance from the fermi surface. Thus, for sufficiently large I«*!, the single-particle energy H'Q dominates. But close to the fermi surface, Vp is the overriding effect, and a large transverse pairspin is formed
Sx = £ 5 i ( " ) (12) *>o
Whereas any single pairspin in this sum has large quanta! fluctuations, the total pairspin can have a well defined magnitude and orientation, since the fluctuations of the constituent pairspins add quadratically.
The interaction (10) can be written
Vp = - G S L ^ I K « / ) (13) i>>0
and the emergence of a collective transverse pairspin S± therefore produces a mean field acting on the individual pairspins. The analysis proceeds in two steps a. We first assume a value for the magnitude of £j. and chose an orientation, in the x-direction. The pair interaction is then replaced by a mean field, the pair field, of strength A,
VP-^U, = -G<S,> £ > ( ! / ) . 2 (14) e>0
= -A£<Tx(l/) (*r = 2*x)
A = G(SX) 0 = G(Sv)
(where a factor 2 takes into account that each product of different pairspins occurs twice in (10)). The pairspins thus move independently of each other in a total field consisting of HQ and the pair field Uv produced by all the other pairs together. This motion of the particles with respect to the orientation of the pairfield is referred to as intrinsic motion (section 1.2). b For the intrinsic motion in the assumed field, the mean polarization (§x) is evaluated. Symmetry ensures that the direction of the polarization coincides with that of the mean field (z-axis). Self-consistency requires that the magnitude of the induced polarization is eqral to the assumed value £ , and this condition connects the strength A with the matrix element G (section 1.3).
With the formation of the pair field, a transverse direction in pairspin space is singled out. This orientation angle is a dynamical variable for the collective motion (topic for the second lecture).

- 2 9 -
1.2 Pair correlation
• Eigenstates of individual pairspin
• Gound state of total system
• Excitations. Quasipartides
1.2.1 Eigenstates of individual pairspin
When the pairspin interaction V, is replaced by the mean field Uv, the total Hamiltonian is a sum over the individual pairspins
with (see (9) and (14))
/r = 5 » ) K>0
ti = d + <?oz - Aax
(15)
(16)
describing a pairspin acted apon by a field with components (A, —€*) in the x- and z-directions (see Fig.l). The Hamiltonian (16) is diagonalized in terms of the component
£=vW+ r A 5
-e
Figure 1: Direction of pairspin in zx-plane The figure is drawn for c' < 0 (Deep below the fermi surface the i- and i'- axes coincide).
ax> in the direction of the field
ti = t-Eo* £ = ((/)* +A2)* ax> = ax coed + ax sind
(17)
cos 4 = —— E
sintf = §
In the ground state |6), the pairspin is therefore polarized in the direction of ~z!,
16) = |<v = 1) = u\az = -1) + v\at = +1) (18)
u = « n -0
V = C O S -

- 3 0 -
- 1 +1
u .s/t t \\v
Figure 2: Pairspin polarisation The figure illustrates the occupancy (n{vu)) (upper) and th* pairspin polarisation {ff{v)) (lower), at a function of single-particle energy. The polarisation is in the xz-plane, with the directions of axes indicated to the left in the figure.
with amplitudes u and v for pairspin down and up, respectively. For the state (18), the mean value of the polarization vector is
(px) = sin ø = 2u» = — E
(<rx) = (»sø = v2 -v2 = -=-E
and the occupancy is
««*)> = JØ + M'W-jil-ljr*)
(19)
(20)
The instability of the fermi surface associated with the transverse polarization is shown in Fig.2. The ground state (18) of the individual pairspin is a superposition of spin up and down and therefore not axially symmetric. Indeed, the transverse polarization - which inherently breaks this symmetry - arises from the superposition.
However, spin up and spin down is but a way of describing the states \vv) and 10), and the ground state
|6) = «(*0|0) + »(*OM = (u{v) + v{v)aHi>)ahv))\0)
(21)
is thus a superposition of states with zero and two particles. This superposition, which entails indeterminacy in particle number, is produced by the pairfield (see (7) and (14)),

- 3 1 -
Up = -A^ot(i>)at(i/) + o(i/)a(i>) (22) v>0
A = ^ ( » W W ) (=<?£<«(«,)<»(*)>) *X> *>0
which adds and removes particles.
1.2.2 Ground state of total system
Since the vv channels are independent in the mean field approximation, the ground state for the entire system is a product
|v = 0) = n («(") + >(iOa*(*)«*(iO)|0) (23)
where v is the quantum number representing the number of excitations (quasiparticles, see 1.2.3), which has the value zero in the ground state. The |v = 0) state (23) is a superposition of states with different particle numbers. Due to the independence of the different vv channels, the fluctuations in total particle number for the state (23) is, however, very small compared to the number of particles participating in the pair correlation, assumed to be large.
In the ground state, the energy of each pairspin is «* — E (see (17)). However, since the total pair field energy (14) counts the pairspin interaction twice, the total energy is given by
e = £«V)-^")+A<M«')> (24)
by means of (19). An evaluation of the sum gives
£' = $ + €.„ (25)
where
v>0 «'<0
is the energy of the uncorrelated system, and where
£e~ = -\p(€p)** (27)
is the correlation energy, expressed in terms of the density P((F) of vv states per unit energy, at the fermi surface. The correlation energy arises primarily from orbits in a region of order A around the fermi surface, in which there are ~ P{(F)^ pairspins, each contributing a binding energy ~ A.

- 3 2 -
kv = -i)
H,|p) £(«/) = V ^ + A 1
|6> = |<v = i)
Figure 3: Excitation energy of states \v) ,\u) and |<v = -1)
1.2.3 Excitations. Quasiparticles
The total space connected with the orbits v and v contains in addition to 10) and \vv) the two single-particle states \v) and \i>). These states are annihilated by the pair field, which only connects the states |0) and \vv),
U,\v) = 0 (v~v) (28)
The single-particle states are therefore stationary
h'{p)\v) = €V)k) («>"•>) (29)
with energy exceeding that of the ground state by E(v) (see (17) and Fig3>). The excitation spectrum thus has a gap A.
The state \v) arises from the ground state (21) by adding a particle to the empty state 10) or removing one from the doubly occupied state \vv). The excitation is referred to as a quasipartide and can be created from the pair correlated ground state by the operators
at(i/) = u{v)(J(v) + v(v)a(v) (30)
a'(P) = u(v)a*(y) - v(v)a(v)
which involve linear combinations of creation and annihilation operators a* and a. (The expression for a*(i>) takes into account that T7 = - 1 , for a state of a single fermion). In terms of the quasipartkle variables a*,a, the Hamiltonian h'(v) has the diagonal form
h'(u) - € » - E{v) + E(v)(a\u)a(v) + a\v)a(v)) (31)
where the operators a(v) and a(v) remove quasiparticles and therefore give zero, when acting on the quasipartide vacuum (|6) or |v = 0)). Thus, the total Hamiltonian H' describes a system of independent quasiparticles.
In tunnelling between a normal metal and a superconductor, a quasiparticle excitation is created in the superconductor by addition or removal of a particle. The current therefore has a voltage threshold eV - A, corresponding to the minimum quasiparticle energy.
t E(u)
~r £( , )

- 3 3 -
1.3 Self-consistency. Phase transition
• Ground state
• Critical temperature
1.3.1 Ground state
The pair field with strength A produces the v = 0 state,
Pair field Uv -^ State |v = 0) (32)
and self-consistency therefore requires
State |v = 0) — Pair field Uv (33)
Thus, the transverse polarizations (sx(u)) of the individual pairspins must add up to $ (see (14) and (19))
A = G(v = 0|Sx|v = 0) (34)
which determines A as a function of G, for the single-particle spectrum considered. In a model with constant G in an interval \^\ < S around the fermi surface, the self-consistency relation (34) gives
= Gp(eF) log —
where the last equation assumes S > A. The relationship (35) shows that the fermi surface is unstable for arbitrary small attractive interactions. The effective value of G needed to produce a given pair field depends on the space of single-particle states, characterized by S.
1.3.2 Oitical temperature
When quasiparticles are excited, thermally or by external fields, the pairspin polarization is diminished,
A(v) = 0(v|S.|v> (36) 1 = G £ j±-M -nq(u)-nq(P))
i/>0 2E(vy
where nq(v) is the number of quasi particles in the orbit u (n, = 0 or 1). Thus, if a single quasi particle is present in the v,v space (n9(e) + nq(u) = 1), the pair field cannot exploit this space, and there is no contribution to A(v). The doubly excited state nq(u) = nq(v) = 1 has a,' = - 1 , and contributes negatively to A(v).

- 3 4 -
The self-consistency relation (36) gives the pair field parameter as a function of temperature, when thermal averages are introduced for n,. Subtracting (35) from (36) one obtains
l o g A ^ = 2C%T~L^ (n,(^)) = (l + e^)-1 (37)
for A(T), which vanishes for
«r.»£ (38) For this critical temperature, the pair correlation disappears, by a second order phase transition.

- 3 5 -
2 Gauge angle as dynamical variable • Rotation in gauge space
• Superflow
• Local gauge invariance
The pair correlation is characterized by the collective pairspin S±, which points in a transverse direction in pairspin space. The symmetry axis in this space (the z-axis) is referred to as the gauge axis. The pairspin polarization may rotate collectively about the gauge axis, and the azimuthal angle of jfj. with respect to this axis is therefore a dynamical variable 4. The second lecture touches on the following aspects of the collective motion a. The relative rotational frequency of two superconductors as observed in a Josephson junction. b_ The superflow connected with a spatial variation of the gauge angle £ The coupling of the supercurrent to the magnetic field, associated with the spontaneous breaking of gauge invariance.
2.1 Rotat ion in gauge space
• Angle conjugate to particle number
• Spontaneous symmetry breaking
• Dynamics of gauge angle
• Supercurrent in Josephson junctions
2.1.1 Angle conjugate to particle number
The total pairspin angular momentum Sx in the direction of the gauge axis is related to particle number by (11). Thus, the gauge angle <j>, defined as half the azimuthal angle of Sx (see Fig.4), is conjugate to particle number
WM=-i (39)
This relation - which applies to any pair of angle and angular momentum variables - expresses N as generator of infinitesimal rotations about the gauge axis. A finite rotation through an angle x (c-number) is represented by
C(x) = c"*** (40)
which produces a shift
G(x)<f>S-Hx) = <t>-x (41)
of the gauge angle. For a state with a definite value of N, the angle <j> is completely indeterminate. (The
probability |(<£pV)|2 is independent of <f>). However, the superposition of components with
'Thi* angle is referred to as the phase angle of the order parameter associated with the pair field. We here nse the more specific notation gauge angle for a variable conjugate to particle number.

- 3 6 -
5x
• x
Figure 4: Transverse polarization S± with azimuthal angle 2<f>
The angle 4>, conjugate to particle number, is referred to as the gauge angle.
different particle number produces states in which the gauge angle emerges from indeterminacy. Thus, a stat«; with a sharpness of orientation A > contains components within a range AAf, where
A^fA^ £ 1 (42)
expresses the complementary relationship between M and <f>.
2.1.2 Spontaneous symmetry breaking
The static pair field constitutes a deformation that defines an orientation relative to the gauge axis. Through this deformation, the system spontaneously breaks away from axial symmetry, and the indeterminacy in the number of particles in a pair correlated state is an inherent feature of this symmetry breaking (see (42)). The static deformation introduces a collective degree of freedom <f> and gives the system the ability to rotate as a whole around the gauge axis. When there are no external forces depending on the orientation <f>, the total Hamiltonian describing collective as well as intrinsic motion has axial symmetry and hence conserves particle number.
Symmetry breaking with features akin to those associated with the formation of a pair field occurs in nuclei for which the shell structure leads to a non spherical equilibrium shape with a deformed mean potential. This deformation defines an orientation in space and thus constitutes a spontaneous breaking of rotational symmetry, associated with an indeterminate angular momentum for the nucleonic motion in the deformed potential. The orientation angles of a deformed nucleus are collective variables that manifest themselves in the rotational spectra. The intrinsic excitations associated with the individual nucleons in the deformed potential is the counterpart of the quasiparticle excitations in the pair field. (Nuclei may also deform relatively to a gauge axis. Such nuclei possess a static pair field, which adds and removes pairs of nucleons in time reversed orbits. This deformation is reflected in sequences of quanta! states with different particle numbers, associated with rotational motion around the gauge axis) 5 .
6For a discuawon of nuclear deformation«, tee e.g. A. Bohr and Ben R. Mottelaon, Nuclear Structure Vol. 2, W.A. Benjamin (1975)

- 3 7 -
2.1.3 Dynamics of gauge angle
The total energy H as a function of AT and ^, for a fixed internal state, gives the equations of motion
# = i[H,X) = -if* H = HJ&4) (43)
When large numbers of particles contribute to the formation of the pair field (Af > 1), the uncertainty relation (42) is compatible with
The gauge angle can then appear as a classical quantity. If the system can turn freely around the gauge axis, unaffected by external forces, H is
independent of 4>, and the particle number is a constant of motion. The second equation (43) shows that <j> rotates with frequency
*=l (45)
where
- s <«> is the chemical potential (energy per added particle, for fixed internal (pair correlated) state).
The identification of fi with the rotational frequency is implicit in the description of the pair correlation by the Hamiltonian (see (8) and (2))
H' = H-ntf (47)
The last term can be associated with a transformation to a rotating reference system in which 4> is stationary
( # = i[jsr',*i (48)
« * - £ = o (The added energy -fiAf is analogous to the Coriolis term -hCSrotI in the Hamiltonian describing motion of particles, with total angular momentum /, in a reference frame rotating with frequency C3rot. Such a term acts, for example, in the intrinsic motion of rotating nuclei).
The chemical potential contains a term -tip, where y> is the electrostatic potential, assumed to be constant over the conductor. Since the absolute value of <p can be chosen arbitrarily (gauge in variance), the rotational frequency ^ for a single superconductor has the same arbitrariness. However, the intrinsic motion (quasiparticle excitations) depends only on the energy differences c'(c) = c(p) - /i, which are independent of the choice of potential.
While there is no reference frame for the gauge angle of an isolated superconductor, the gauge angle of one conductor may be referred to that of another.

- 3 8 -
2.1.4 Supercurreat ia Josephsoa jaactioas
A coupling between gauge aagks arises if two coadactors are coaaected by a. weak link (Josephson junction). Dae to the indeterminacy in the occapatioa numbers for the vv channels in either conductor, a condoled electron pair (superposition of maay vv chaaads) may tunnel from the v = 0 state ia oae conductor and merge into the v = 0 state for the other. No qaasipartides are exited, aad the transfer of electrons is therefore referred to as a supercurreat.
An interaction, which liaks the states | v\ v\) and | I^PJ ) ia the two coaductors, can be expressed as (see (5) aad (7))
Hw = £ Hr(*i*)>tto)«^*>»>k)«(»k)+ *erinj«aw cwsjafafc (49)
ia terms of the matrix elements W(v\ri) for the transfer of a pair of particles. If di aad d* are the gauge angles on the twc sides of the junction, the meaa azimuthal orientations of the pairspias are 2.'i aad 2d%, respprtivdy (see Fig.4). The components *±{vij) thus have the phase factors c*'2*1-2 (see (7)), and tbe interaction energy, averaged over the iatriasic motion, is therefore of the form
Rw = -W0a»U * = d 3 - * i (50)
where Wo is a constant energy characteristic of the junction. (A phase in W(v\ vj) leads to a shift in the phase of (SO), which is not of significance for the following).
The coupling (50) implies a time variation of M.2. which gives tbe current
J (= ,7 ( l ->2) ) = -e/iTj = eVi (-c = e/eclrow charge) (51)
edHw
or
J = Jo sin 2d Jb = jWo (52)
Thus, by means of a constant external current J{< Jo), the relative orientation of the gauge angles can be adjusted to take on any value.
If the conductors are kept at a constant potential difference V(= tft — <fii), an energy eV per electron is associated with the tunnelling,
/rK = -i eK(jV2-Ar,) (53)
This energy difference forces the gauge angles to rotate with different angular velocities,
* = \\HvM (54)
*V , 1 1 1 -— — T \9 = V2- <n)

- 3 9 -
and an alternating current results
2eV 2e J = -Josinu(t-to) u = -2<f>= — J0 = =?W0 (55)
ft n The frequency of this current is universally related to the voltage (the work associated with the passage of an electron across the junction) and is independent of the characteristics of the junction.
In the above discussion, <f> was treated as a classical quantity with a definite value. Quanta! fluctuations in gauge angle and particle number reveal themselves in the quantized oscillations of the junction in the potential (50). (The kinetic energy of oscillation arises from the voltage generated by the transfer of charge, inversely proportional to the capacity of the junction).
2.2 Superflow
• Gauge angle as velocity potential
Winding number
The rotations considered thus far refer to a gauge axis common to the entire superc n-ductor and therefore generate a global (or overall) change of the state. The pair correlated system, however, is capable of distortions in which the gauge angle <p{?) changes slowly as a function of spare, with the magnitude A of the deformation staying constant. The variation of <j>(r) is associated with a collective flow of the electron fluid. The consequence of local gauge invariance for the superflow (coupling to the magnetic field) is considered in section 2.3.
2.2.1 Gauge angle as velocity potential
The degree of freedom associated with a spatial variation of </>(r) involves •*. local gauge axis for each point in space. The global rotation (40) thus develops into local rotations x{?) generated by the local particle number (density) p(f). The total rotation operator, which contains a factor for each point in space, is therefore
G(x) = e-ijfrrimr) (56)
which is a functional of x(f) and changes the local gauge angle in analogy to (41),
G(X)<K?)G-Hx) = <Kr) - X(r) (57) (The transformation (56) rotates the local pairspin by an angle 2\(r) about the gauge axis
and multiplies the quanta! operators a* by the phase factor e~'x^). The expression (56) shows that the sites of the rotation axes are the particle co-ordinates,
which are left invariant by the local rotations
G(x)rkQ-l(x) = h (58)
Thus, if p(r) is expressed as a sum of delta functions for each particle, the gauge operator (56) can be written
G(X) = «"• £ * *<f*) p(r) = £ 6(f - ffc) (59)

- 4 0 -
which is a function of the particle co-ordinates, hence commuting with r*. By contrast, the particle momentum pit, which connects neighbouring points, has the transformation
S(x)Pk 6-\x) = Pk+ ftVfcX(r*) (60)
which registers the change in rotation angle \(f) between infinitesimafly separated gauge axes.
The increment ft Vx of the particle momenta associated with the shift of the gauge angle from ^ to <(> — x shows that a state, in whirii the local gauge angle varies from point to point, carries a momentum current
rp = -nhV<j> (61)
The parameter n is referred to as the density of superconducting electrons (and is temperature dependent, see below). The local velocity is
ff(r) = - ^ V # r ) (62) m
and the gauge angle thus appears as the velocity potential of a collective flow superposed on the pair correlated intrinsic motion. The superflow is undamped, because the internal degrees of freedom are frozen, by the energy gap.
The pair correlation is built out of single particle states in a narrow momentum interval Sp ~ £• around the fermi surface, and the corresponding spatial extension is characterized by the parameter
( = % (63)
referred to as the coherence length. The distortion of the intrinsic motion produced by 4>{f) is relatively small, if 4{f) is approximately constant over distances comparable with (.
The quasi particle excitations have the energy E (see Fig. 3), when described in a coordinate system moving with the local velocity u of the superflow. In the fixed co-ordinate system of the lattice, a quasi particle with momentum p has the energy E + pu, to first order in u, as follows from a Galilean transformation. Thus, when the fluid is in thermal equilibrium with the lattice, more quasi particles move against the flow, than in the direction of the flow (see (37)). This reduction in the momentum carried by the flow implies that the density n of superconducting electrons in (61) is a decreasing function of temperature, which vanishes for T = Tc.
The gauge rotation (56) is not a symmetry operation, since it produces a distortion of the electron system resulting in an increase in the energy, through the kinetic energy of the flow. With the incorporation of local gauge invariance, however, the rotation (56) becomes part of more extensive symmetry operation, which links the superflow to the magnetic vector potential (see section 2.3.2).

- 4 1 -
2.2.2 Winding number
The line integral
/
2u{f)df = -A(# r-2)_# r-)) (64) m
measures the change of <f> between two points. For a closed loop, this change must be a multiple v of r, since 2<t> is the orientation of the local pairspin polarization §±.(r), which has a well defined direction at each point in space,
/ V<j>ds = rv i/ = 0 , ± l , ± 2 , . . . (65)
The integer ", which gives the number of revolutions of the pairspin polarization along the loop, is referred to as the winding number.
The loop integral has the same value for curves that can be continuously deformed into each other. Thus, for a singly connected domain, the winding number is zero for any loop. For doubly connected domains, such as the interior of a torus, the flow is characterized by a single winding number. More generally, the flow possesses a set of winding numbers for the topologi cally distinct loops.
For a stationary flow, the continuity equation requires the divergence of u(f) to vanish. The velocity potential $(T) therefore satisfies
V 2 # r ) = 0 (66)
which, together with the winding number and the boundary condition for the flow through the surface
-mTn=U» ( 6 7 )
completely specifies <j>(f). Thus, for a singly connected specimen with no currents flowing to and from the system, the gauge angle is a constant throughout the conductor.
The winding number u is a measure of the circulation per particle, and can be expressed in terms of the action integral (see (62) and (65))
v = -- 6pu-ds p„ = m« (h = 2irh) (68)
For example, in cylindrical symmetry, the action is the angular momentum, and the flow carries the total angular momentum \hNu. The condition (65) is therefore a quantization in macroscopic scale, and states with different winding numbers v constitute different phases of the pair correlated substance. Hence, the quantity v can only be altered by disrupting the coherence of the pair correlation in the multiply connected domain, by passing a section of the substance through an uncorrelated phase.

- 4 2 -
2.3 Local gauge invariance
• Electromagnetic potentials and coupling to particles
• Supercurrent. Spontaneous breaking of gauge invariance
• Impermeability of superconductor to magnetic field
The local gauge rotations, which act on the electrons through (56), are part of a more comprehensive symmetry operation. Thus, the quantal states acquire invariance under local gauge transformations, when the relationship between the dynamical variables is modified in a manner that involves interactions between particles. For the case of gauge rotations around an axis, the extended symmetry- referred to as local gauge invariance- introduces the electromagnetic field and prescribes the equations of motion of particles and field (Maxwell and Lorentz equations).
The electrodynamic potentials have orientation with respect to the local gauge axis and are therefore indeterminate in a gauge invariant state. In a superconductor, however, the spontaneous breaking of local gauge symmetry associated with the formation of the pair field provides a reference for the potentials. The relative orientation of potential and pair correlation manifests itself in the supercurrent. The connection between field and current gives mass to the photon, and a static magnetic field therefore cannot penetrate into the superconductor.
2.3.1 Electromagnetic potentials and coupling to particles
In a description that recognizes local gauge rotations as a conserved symmetry, the invariance (58) of the particle position implies that also the velocity is a gauge invariant quantity. However, the momentum is affected by a local operation (see (60)), and this difference between momentum and velocity introduces a new degree of freedom A(f), the vector potential, which for r*= fk satisfies
mf/t — pk -J- -A(fic) ( - e = electron charge) (69) c
where e is a coupling constant (the elementary unit of charge), and where the velocity of light is introduced to give the field A the dimension of charge x L~x. The gauge invariance of the velocity f* implies that the vector potential has the gauge transformation
Q(x)A(f)o-Hx) = Mn-jVx(n (TO) in which case the displacement (60) of p cancels that of A.
The transformation (70) requires the total gauge operator G(x) to act on the degrees of freedom of the field, as well as on the particles through (56). (The field operator that is conjugate to A(f) and produces the shift (70) is the electric field £(r), aid the generator of 0{x) therefore has a term proportional to $£).
Local gauge symmetry for the system as a whole is obtained in quantal states that are invariant under gauge transformations affecting particles and field at the same time. By this invariance, the field is anchored in the particles (through Maxwell's equation $E = 4ay>, and the corresponding equation for the current).

- 4 3 -
The relation (69) connects spatial components of four-vectors, and the analogous relation for the time components introduces the scalar potential <p and gives the equation of motion for the particles in the electromagnetic field ( \mvl = £+evH*i )ot H = ^ ; (?+f A )2—<¥>)•
The gauge shift (70) can be exhibited as a rotation of an angular variable about the local gauge axis. Thus, a vector field A(r), assumed to vanish at infinity, is determined by its divergence V • A and rotation V x A and can therefore be uniquely divided into transverse and longitudinal components
Å=ÅtT + A? V - i* r = 0 V x v ? = 0 (71)
also assumed to vanish at infinity. These components can be expressed as integrals of A over all space. The transverse part of A, determined by V x A is unaffected by the gauge transformation (70), and the longitudinal part can be expressed as a gradient
A* = ^ V ^ (72)
where 4>A is dimensionless and has the transformation (see (70))
G{X)<f>A(r)G~HX) = Mr) ~X(r) (73)
Thus, 4>A(r) can be viewed as an angular variable, which gives the direction of the vector potential with respect to the gauge axis.
Any quantity, such as the vector potential A(f), that is affected by gauge transformations (gauge dependent quantity), is indeterminate in a state that is invariant under gauge transformations. The gauge dependence of A(f) is carried by the field angle fø(r ), which -as an azimuth with respect to the gauge axis - is completely indeterminate in a rotationally invariant state.
In classical electrodynamics, gauge invariance appeared as a freedom in the choice of electromagnetic potentials in the description of the physical phenomena. In the quantal description, this freedom can be viewed as an indeterminacy of the potentials in a gauge invariant state. The standard description of gauge transformations, which is taken over from classical physics, is expressed by
A-+A + $e 9 = - - x (74) e
with a function 0 of dimension charge. The quantity 6 is connected with the rotation angle X by a relation in which Planck's constant enters, and the interpretation of gauge symmetry as a rotational invariance for particles and field was therefore outside the scope of classical physics.
2.3.2 Supercurrent. Spontaneous breaking of gauge invariance
The superconducting phase is distinguished from ordinary matter by the deformation, which defines a gauge angle 0(F) for the electron system. The emergence of this angle has a profound effect on the electrodynamic properties of the superconductor. Thus, the link (69) between particles and field implies that the superflow with momentum density (61)

- 4 4 -
carries the electric current
r - - = * - = * <75» m mc
»>«ft ;. »e2 r = Vj> A
m mc Like the particle velocity, the current (75) is invariant under combined gauge transformations of particles and field (see (57) and (70)). The relation (75), involving the vector potential, is specific to the superconductor, for which the indeterminacy in A(f) can be compensated by a corresponding indeterminacy in ø(r*), so that the resulting current can have a definite valne. In (75), as in (61), the effective density n of superconducting electrons is a decreasing function of temperature, which vanishes at the transition to the normal state.
The local relation (75) between current and vector potential assumes fields that are approximately constant over distances comparable with the coherence length £, which characterizes the non-locality of the pair correlation (see (63)). When A varies more rapidly, the internal degreees of freedom come into play (virtual quasipartkle excitations), and the induced current is smaller than (75) (by a factor ~ (<fO-1 f°r * wave number q large compared with £ -1)- A similar effect irises from impurities that cause a finite mean free path for the electrons. However, the deformation in the superconductor with orientation #(f) continues to manifest itself in a linear, though non-local, relation between vector potential and current.
In the gauge invariant description of field together with particles, the formation of the pair correlation in the superconductor acquires the character of a spontaneous symmetry breaking, like that of the global symmetries considered in section 2.1.2. This symmetry breaking introduces an orientation ^f*), which provide« a reference (intrinsic frame) for the direction 4>A(?) of the vector potential; inversely, the orientation of the field (externally or internally produced) can act as a reference for the direction of the pair field. In the gauge invariant state for the total system, any azimuthal angle, such as <f){f) or <t>A{f), is completely indeterminate, but relative angles can have definite values.
The orientation of vector potential with respect to pair correlation manifests itself in the supercurrent (75). If A is decomposed into longitudinal and transverse parts (see (71) and (72)), the current takes the form
_ neh,~ , e •* ._„.
TO mc
T h e first term is the superflow (61) , in which the orientation <f>(r) is referred to the direction of 4>A{?)' This term brings in the longitudinal part of A and is therefore complemented by the second term, since only the total field has a local significance.

- 4 5 -
2.3.3 Impermeability of superconductor to magnetic field
The connection (75) between current and vector potential modifies the propagation of the electromagnetic field in the superconductor. Thus, a magnetic field generates a current with a local circulation,
ne2 - - - -V x r = H « = V x 4 (77)
mc and this current, in turn, generates a magnetic field
V x H = — t (78)
by Maxwell's equation for stationary fields. For given boundary conditions, specified by external magnetic fields and by currents
flowing in and out of the conductor, the equations (77) and (78) uniquely determine the current and magnetic field, for a singly connected domain. The equation for ti, obtained by elimination of 7,
**-£* - o * - £ m ( V x ( V x W ) = V ( V W ) - V 2 W V W = 0)
describes a field that decays exponentially in the superconductor, with a characteristic length A (London length). The same equation is obtained for the current f.
Thus, for a superconductor of linear dimensions R large compared with A, the field and current are confined to a surface region of thickness A. The current flowing in this region shields the interior of the superconductor from the magnetic field (Meissner effect). In the opposite limit (R < A), the screening effect is small, and the current is the potential flow considered in section 2.2.
If the parameter A, or the mean free path for scattering, is tmaller than the coherence length, the current (77), induced by the magnetic field, is reduced (see 2.3.2), and the effective penetration depth is correspondingly increased. The v?lues of these parameters can vary over a wide range, depending on material, temperature, and other parameters.
For doubly connected regions, the field equations (77) and (78) are supplemented by the topological condition (65) for the winding number, which gives the relation (see (75))
itds=~xv-—* *=lÅds= Itidf (80) J m mc J J
where v is the magnetic flux passing through the loop. If the dimensions of the conductor are large compared with the penetration depth, the current is confined to the surface region, and the integral (80) therefore vanish«« along any integration path confined to the interior of the conductor. For such a loop, it follows from (80) that the enclosed flux is quantized
* = !*«, *o = ;r«' e = 0 ± l , ± 2 . . . (81) 2e
in units of the flux quantum $o- However, in contrast to the underlying quantization of circulation, which is of general validity, flux quantization only holds in the limit of complete screening.

- 4 6 -
The linear field equation (79) describes photons, which have a mass
when propagating in the sapercondnctor. (For time dependent fields, the addition of the displacement current *£ to (78), combined with the induction law $ x£= -^W, gives the
extra term -jtH in (79)). The static magnetic field may thus be viewed as a xero frequency condensate of these massive photons.
A methamorphosis of massless gauge bosons, similar to that occurring in the superconductor, arises in the unification of the weak and electromagnetic interactions. This extended local gauge symmetry involves rotations about four different axes and introduces four mass-less gauge fields. The symmetry is spontaneously broken by a static deformation of a field, referred to as the Higgs field, which plays the role of the pair field (A,^). The orientation (in gauge space) of the Higgs field thus provides a frame of reference for the gauge fields, and the propagation of the gauge fields is thereby modified in such a manner that three of the bosons become massive (W^.Z particles). The fourth (the photon) is blind to the deformation and remains massless - until it encounters a superconductor. (There is little evidence so far concerning the structure of matter underlying the orientation in gauge space attributed to the Higgs field).
The pair correlated ground state is based upon invariance under time reversal T (see 1.1.1). However, the collective flow and the magnetic field are odd under T, and therefore subject the intrinsic motion to forces that violate time reversal symmetry, hence acting differently on the conjufate single-particle states v and v. When the current and magnetic field reach critical values - for which the time reversal violating single-particle energies are comparable with A - the pair correlated phase becomes unstable.

- 4 7 -
CHAPTKR3 ft: 59C30 C2T99
MUONS, NEUTRONS AND SUPKRCONDUCTIVITY
G. Aeppli AT&T Bell laboratories
Murray Hill NJ 07974 and
Physics DepL Risø National laboratory
DK-4000 Roskilde, Denmark
Abstract
The principles of the neutron scattering and muon spin relaxation (uSR) techniques and their applications to studies of superconductors are described briefly. uSR and neutron scattering work on magnetic correlations in superconductors and materials directly related to superconductors are reviewed.

- 4 8 -
I. Introduction
Magnetic correlations are central to the phenomenon of superconductivity, as can be seen from examining the BCS (pairing) wavefunction. Furthermore, some of the essential macroscopic properties, such as the Meissner-Ochsenfeld effect, of superconductors are magnetic. Consequently, magnetic probes are of considerable value for examining superconductors. In the present lecture, we discuss two probes of microscopic magnetism, namely neutron scattering and muon spin relaxation (uSR), whose roots are in nuclear and particle physics but which have proven themselves as useful tools in condensed matter physics. We first describe the neutron scattering technique and its application to determining the microscopic and macroscopic properties of superconductors after which we do the same for uSR. The final section of these notes is devoted to a brief survey of the interplay between microscopic magnetic correlations and superconductivity (1), as determined by neutron scattering and pSR.
II. Magnetic Neutron Scattering
Various textbooks give thorough introductions to neutron scattering (1). What is imports nt here is that the magnetic cross-section is directly proportional to the Fourier transform (in space and time) of the two-spin correlation function:
d£2<n£
ye2 |2lM jTT \MQf X i 2(8 -QaQ )SaP(Q>U) x exp(-2W(Q)) ( 1 )
IlleC - lk i l ft „J
where
Sop(Q,u>) = —Jdtexp(-iwt) X Y expfiQ- (r -r )] X <S° (t)Sp(0)> . (2) 0»| —•* m n m n
m,n
In Eq. (1), kj and kf denote the wave vectors of the ingoing and outgoing neutrons, respectively; Q = kf—kj, Q = Q/|Q|, f(Q) refers to the atomic form factor of the magnetic species, and exp(-2W(Q)) is the Debye-Waller factor; in Eq. (2), rm
represents the positions of the spins Sm. The angle brackets (<*•*>) refer to a thermal (statistical) average. The correlation function is a sum of contributions due to dynamic (oscillatory and relaxational) processes and the equilibrium arrangement of the spins;
S°P(Q(W) = i(l -exp-pAw)-^" (Q,w)+ Sop(Q)8M (3) n "P

- 4 9 -
JCap"(Q,») is the imaginary part of the generalized magnetic susceptibility due (via
the fluctuation-dissipation theorem) to the spin dynamics. SoP(Q) is the static
(infinite-time) two-spin correlation function.
We first discuss Sop(Q), which is defined as:
S°P(Q) = V expIiQ- ( r - r ) | < S 0 (t = »)St,(t = 0)> iti.n
(4)
If the spins S n are aligned ferromagnetically, for example along the z axis, Sap(Q)
vanishes except when a = 0 = z, in which case it is directly proportional to the
Fourier transform p(Q) of the pair-correlation function for the magnetic ions:
S"(Q) = |<S Z >| 2 X expliQ- (rm-rn)l = |<Sx>|2p(Q). m,n
(5)
For a crystalline system, p(Q) is a sum of 8 functions centered at reciprocal-lattice
points and vanishes elsewhere. Of course, this result is only a consequence of
Fourier's theorem, and does not depend on the origin of the ferromagnetic
alignment. In particular, it can be due either to spontaneous order of the type
found in, for example, Fe below its Curie point, or, which will be of greater
interest to us below, to an external magnetic field applied to the sample.
s0to,u>)A
Pig. 1. Dynamical correlation function S0(Q,co) for non-interacting Fermi Kquid. From ref. 2.

- 5 0 -
For a simple ordered antiferromagnet, the magnetic unit cell is generally larger than the nuclear cell, and S"(Q) will be a sum of S functions centered at the reciprocal lattice points corresponding to the enlarged (magnetic) unit cell. Note that this means that for most antiferromagnets, new Bragg peaks appear in neutron diffraction spectra, while for ferromagnets the magnetic peaks appear at nuclear Bragg points; the onset of a ferromagnetic phase is usually signalled by an increase in intensity of a pre-existing nuclear reflection.
The dynamic response xap(Q,o)) is due to magnetic relaxation processes which are due to interactions among the electronic moments themselves (category I) and between the electronic moments and charge fluctuations (category II) and lattice vibrations (category III) in the solid. Spin waves in magnetically ordered materials are examples of processes in category I, while decays of magnetic correlations in mixed valence materials (such as CePd3) belong to category II. For a non-interacting Fermi liquid with a spherical Fermi surface, jr'(Q,o) is a Lindhard function due to intrahand transitions (2); it is shown in Fig. (1). Note that jr~(Q,G>) is gapless for all Q < 2kf, this corresponds to the production of electron hole pairs with arbitrarily small energy. Furthermore, x"(Q,w) has a Q-dependent maximum at Qvf (for small Q) where vf is the Fermi velocity.
III. Magnetic Neutron Scattering from Superconductors
As described above, neutron scattering is a direct probe of magnetic correlations in solids. The two distinct magnetic manifestations of superconductivity are related to the two magnetic lengths associated with superconductors, namely the penetration depth Å and the pair coherence length £3. A owes its existence to the special connection between electric current and magnetic vector potential in a charged superfluid (known as the London equation) combined with Maxwell's equations.. For superfluids such as 3He, composed of Fermions without charge, A = <*>. The finite value of A is responsible for many macroscopic properties of superconducting solids, notably the Meissner effect and flux lattices in type I and II materials, respectively.
\ corresponds roughly to the typical separation of paired electrons. Because the pairs in conventional S-wave superconductors consist of electrons with opposite spin, on distance scales large compared to K the magnetic moments of the conduction electrons are effectively hidden.

- 5 1 -
Magnetic neutron scattering experiments performed On superconductors to date have been devoted to three issues. The first two are ramifications of the two respective magnetic lengths, £ and A. The corresponding measurements could in principle (but not in practice) be performed for any superconductor. The third theme is the interplay of magnetism and superconductivity as demonstrated by exploration of phase diagrams (with e.g. composition, magnetic field, pressure, and temperature as variables) containing both superconducting and magnetic regimes. The next two sections briefly survey the first two categories of studies, while Chapter V of these notes summarizes neutron scattering as well as uSR results relevant to the third theme.
A. Flux exclusion, A, and "macroscopic" phenomena
(i) Observation of Flux Lattices The Abrikosov lattice is an ordered array of vortices, each admitting one quantum of magnetic flux. Therefore, there is a modulated magnetic field in the solid. For neutron diffraction, the situation is exactly as for the ordered antiferromagnet (as discussed in section II above), and corresponding superlattices are expected. Thus, neutron scattering is a direct, in-situ method for measuring the properties of flux lattices. Extensive neutron studies of equilibrium and non-equilibrium effects in conventional superconductors such as Nb have been performed4. On the other hand, attempts to study high-Tc materials in similar fashion have at the time of writing, failed.
(ii) Measurements of A For scattering angles sufficiently close to grazing, neutrons are subject to total external reflection of the type also found for photons (light, X-rays....). By measuring reflectivities as a function of scattering angle and/or wavelength, it is possible to extract detailed information concerning the reflecting interface. In particular, polarized neutrons can be used to measure gradients in magnetization density associated with a type I superconductor (or type II material with H < Hci) in a magnetic field. This gradient is directly related to A, and has been measured successfully for polished single crystals of Nb. Because of the sensitivity of the technique to surface imperfections, work on sintered powders of YBa2Cu307-g has been less successful in the sense of yielding results for A roughly one order of magnitude smaller than those obtained by all other means5.

- 5 2 -
B. Bound singlet formation in the superconducting state (0
In a conventional (s-wave) superconductor, electron pairs are singlets with respect to their spin degrees of freedom. This implies that the spin susceptibility, jr., but not the orbital susceptibility, jr., vanishes in the superconducting state. In a classic experiment using polarised neutron diffraction in an external field, Shull and Wedgwood* showed this to be the case for V3S1. The basic idea is to polarise the superconductor well within its flux lattice regime (where the lattice constant d ~ (^Hcxp)"2 < A) and to measure the uniform magnetic contribution to the Bragg scattering by measuring-the difference between the scattering intensities with neutron spins polarised parallel and antiparallel to the applied field:
where fa and fM are the nuclear and magnetic scattering lengths, respectively. Since fy - xflQ) where * is the net susceptibility and flQ) is the magnetic formfactor, the temperature dependence of j can be monitored. Note that since nuclear scattering lengths are known with considerable precision, jflQ) is readily established in absolute units and can be compared directly to calculations with not even an adjustable scale factor. Fig. 2 shows the results. Note that as predicted, j is reduced only by *., with the orbital susceptibility j , surviving in the ordered state.
20 . M
Figure 2. Temperature dependence of the electronic scattering amplitude of the (210) Bragg reflection of V3S1 through the superconducting transformation. The spin component is suppressed at low temperature, leaving only the orbital component. %, as calculated by Yosida is matched to the data. From ref. 6.

- 5 3 -
References for Chapters I-III
1. See, e.g. S.W. Lovesey, Theory of neutron scattering from condensed matter, Vols I & II, Clarendon Press, Oxford (1984).
2. D. Pines and P. Noziéres, Quantum Liquids, Benjamin, NY (1966). 3. An introduction to these concepts is by P.G. DeGennes, Superconductivity
of Metals and Alloys, Benjamin, NY (1966). 4. The pioneering work was by D. Cribier, B. Janot, L.M. Rao, and B. Farnoux,
Phys. Lett. 9,106 (1964). 5. See R. Felici et al., Nature 329,503 (1987) and references therein. 6. C.G. Shull and F.A. Wedgwood, Phys. Rev. Lett. 16,513 (1966).
IV. Muon spin relaxation (based on ref. 2)
Like neutron experiments, muon spin relaxation measurements fall into categories relating to macroscopic and microscopic magnetism. In this chapter, we give a brief introduction to the technique and then describe its application to studies of the magnetic penetration depth. Use of the technique for surveying magnetism of materials related to superconductors will be reviewed below.
A. Brief introduction to pSR1
In time-differential pSR experiments, muons with known initial spin polarization are stopped one at a time in a sample, where they decay via a parity-violating process emitting positrons preferentially along their final polarization. The relevant processes in the generation and subsequent decay of the muons (generally positive) are as follows:
n++d
p+p-M n + +n+p (7)
n +n"'+p + p
n -»u +v
+ • <9> u -»e +v + v e p

- 5 4 -
The proton-proton collision of (7) is produced by the acceleration (by e.g., a cyclotron) of protrons into a fixed target. The pion (n +) and muon (u+) rest masses and lifetimes are 139.6 MeV, 105.7 MeV, 2.6X10 8 s, and 2.2Xl0~ s s, respectively. Data are collected as a function of time t after arrival of the individual muons in the sample by counting the numbers N+(t) and N_(t) of positrons emitted in the directions parallel and antiparallel to the incident muon spin. Typically, more than 106 muon decays are timed to yield suitable N+(t) and N_(t) histograms. The resulting ratio, [N + (t)-N_(t)]/[N + (t) + N_(t)], is proportional to the time-dependent polarization of the muon ensemble. A magnetic field can be applied either parallel (longitudinal) or perpendicular (transverse) to the initial muon polarization, yielding, respectively, a Ti-type relaxation function Gzz(t) or a T2-like relaxation envelope Gxx(t) molulating a precessing muon decay asymmetry, just as for the free induction decay in NMR7. Of course, the muon precession observed in the presence of either an external or internal field is simply Larmor precession where the frequency co = y^H, and y = 2n X 135.5 MHs/T is the gyromagnetic ratio of the muon. External fields are generally applied for studies of the response to external fields, while internal fields arise in systems with frozen magnetic moments.
B. Measurements of the magnetic penetration depth
Instead of giving a survey of the vast literature on this subject, we simply describe one such measurement2, which was performed on Lai ssSro 15CUO4, with a superconducting transition atTc = 37 K.
Fig. 3 shows the transverse-field (TF) pSR precession signals for a field of 80 G at room temperature and at 10 K after zero-field cooling (ZFC). The enhanced relaxation rate at 10 K is obvious. The solid lines are the results of fits made to a Gaussian relaxation function, Gxx(t) = exp —(At)2, which corresponds to a Gaussian distribution of internal fields. The low field in these spectra is convenient for illustrative purposes, but for measurements of A, we used an external field Hext = 4 kG, which is well above Hci ( - 150 G at 10 K, from other measurements) and well below Hc2 for T < 35 K. Fig. 4 displays the muon depolarization rate A as a function of increasing temperature after cooling in an external field of 4 kG. Above Tc = 37 K, the fitted A, which is due to static nuclear dipole relaxation, is small [0.102(2) X106s~']; below Tc, A increases by an order of magnitude indicating that the internal field becomes more inhomogeneous as the superconducting state is entered. NMR3 and uSR4

- 5 5 -
experiments on other type-II superconductors have revealed the same effect, due to the vortex lattices formed when the external field penetrates the materials. The mean square inhomogeneity in the field sampled by the muons in pSR or nuclear spins in NMR is5, for fields H with
Hc| « H <* Hc2, <|AH|2> = 0.00371 <^A-4
where A is the London penetration depth and $ is the magnetic flux quantum, 2.068XlO-7Gcm2.
Q>
E E > \ CO
<
o u Q> Q c-o D
-0.2 -
-0.2 -
-0.3
-0.2 -
-0.3 0.5 1 13 2
TIME tøs) 2.5
Fig. 3. Muon-spin-relaxation signal in a transverse field of 80 G for T above and below Tc=37 K. The 10 K data were obtained after cooling in a 4 kG field.

- 5 6 -
1.0
0)
3-0.8
o Of c o
0.6 -
g 0.4 v or § 0.2
S.
1 1 r— i i —
- C^^xA(a)
\
H«t = 4 kG \
A
A A A *
Mb)
• i i i i
, , + ,
*
V A
• •
1 1 1
~~T—
-
-
1
10000
8000
6000
4000
- 2000 S-
!
1 o 3 O 9 "O
0 5 10 15 20 25 30 35 40 45 50
Temperoture (K)
Fig. 4. Temperature dependence of (a) (circles) the Gaussian relaxation rate A obtained for a transverse field Hext=4 kG after cooling in zero applied field; and (b) (triangles) the magnetic penetration depth A inferred from A using Eq. 1 after correcting for a fixed nuclear dipolar relaxation rate Ao=0.102(2)Xl06 s _ I , assumed to add in quadrature with the depolarization rate due to the vortex lattice. The solid curve is a guide to the eye.
Because AV2 = yp <|AH|2>,/2, Eq. (2) implies that A can be extracted from pSR data. In particular, for high fields, d < A and Eq. (2) becomes A(us_I) •» [2025/A(A)]2. For Lai.ssSro.i 5Cu04, the corresponding value for A at 6 K is 2150 Å, which is comparable to those of A15 compounds such as NbaSn and V^Si. In type-II superconductors, the London formula gives an approximate value for A,
A = 4nn e
s
1/2 m*/m
4nn r s e
1/2 (2)
where re = e2/mc2 = 2.82X 10"6 Å is the classical radius of the electron, m* is the effective carrier mass, and ns is the superfluid density, which for ordinary superconductors at T = 0, is identical to the carrier density (n) for T > Tc. The Sommerfeld constant can also be expressed in terms of m* and n,
y = k2J(ii/3)2/Vn1/3/A2,
(3)

- 5 7 -
for a three-dimensional (isotropic) electron gas and
y = k|(ii/3)m»/(*2A)
for a stack of two-dimensional systems with spacing A between them. In the two-dimensional case, m* is a strong function of angle 6 between the electron propagation direction and the basal planes: m*(6 = 0) = m*ab, while m*(6 = 90°) = <*>. This implies that X is also strongly angle-dependent (see eq. (2)), with the result that for a powder, eq. (1) must be modified to read:
(5) <|AH|2> = 0.0085 <t£\^4
Recent measurements7 on single crystals of YBa2Cu307-5 strongly indicate the two-dimensional nature of the carrier liquid in high-Tc copper oxide superconductors, which makes Eqs (4) and (5) more appropriate than (1) and (3). We can solve Eqs. (3) and (4), using the measured values of Aab and y (** 6 mj/mole K2), to obtain a small n, 0.4 X10²² carriers/cm3 ( = 0.3 carriers/formula unit), and a sizable m*/me of 4. We emphasize that our values for n and m*/nie are merely estimates based on Eqs. (2), (4) and (5); it remains to be seen whether the uncorrected London formula is valid for samples such as ours.
Fig. 4(b) shows the temperature dependence of A computed from A and Eq. (2). Attempts to fit the present data to the form,
4.1/2 ( 6 ) A(T) = A(0)[1-(T/Tnuz , c
which generally describes the behavior of ordinary superconductors as well as YBa2Cu3<>78, failed. The failure can be due to inhomogeneities, which lead to a distribution of Tc's or to the pressed powder's granularity, which causes percolation, finite size, and weak link effects. We note also that when the electronic mean free path I becomes comparable to £o, which might well be the case for Lai.ssSro.isCuO^ the standard expressions, Eqs. (3) and (5), for A(0) and A(T) become invalid.

- 5 8 -
References for Chapter IV
1. An introductory text is A. Schenck, Muon Spin Rotation Spectroscopy, Principles and Applications in Solid State Physics (Hilger, Bristol, 1985).
2. G. Aeppli et al., Phys. Rev. B 35,7129 (1987). 3. P. Pincus et al., Phys. Lett. 13,21 (1964). 4. A.T. Fiory et al.» Phys. Rev. Lett. 33,969 (1974); Y.J. Uemura et al., Hyperfine
Interact. 31,413 (1986). 5. E.H. Brandt, Phys. Rev. B 37,2349 (1988). 6. W. Barford and J. Gunn, preprint (1988). 7. D. Harshman et al., preprint (1988). 8. D. Harshman et al., Phys. Rev. B 36,2386 (1987).
V. Magnetic Fluctuations and Order in Materials Related to Superconductors (from ref. 18)
A. Introduction There are by now three classes of superconductors with potentially unconventional pairing mechanisms. For all three, namely the heavy fermion systems, the cuprous oxides, and the organic superconductors, magnetic fluctuations have been proposed as the source of the pairing. While examination of the magnetic fluctuations in these systems will not necessarily provide direct and unambiguous proof that magnetic fluctuations are responsible for superconductivity, it should, at the very least, prove useful in the sense that the study of phonons in conventional
. superconductors has been useful. In the present chapter, we give a brief overview of work on the magnetic fluctuations and order in various heavy fermion and copper oxide systems.
B. Heavy Fermion Systems Antiferromagnetic correlations have been found in all heavy fermion compounds of which large single crystals are available. The list of such compounds includes superconducting UPt3', antiferromagnetic l^Znn2 , and paramagnetic CeCug3. For example, Fig. 5 shows data collected for UPt3, in directions parallel to a* (in the basal planes) through the (0,0,1.05) and (0,0,2.05) points in reciprocal space. In addition to sharp phonon

- 5 9 -
scattering, indicated by the dashed lines, there is diffuse magnetic scattering which peaks near (0,0,1) and (±1,0,2). This implies that the U moments, when fluctuating at the rate corresponding to 8 meV, are antiferromagnetically correlated with respect to their nearest neighbors. More recent work4*5 shows that at much smaller energy scales (fto s 1 meV), there are diffuse scattering maxima at Q = (± 1/2,0,1), reciprocal lattice points where relatively strong magnetic Bragg reflections occur in (Ui-xThx)Pt3 and U(Pti-xPdx)3
6. A greater surprise was that all of the nominally pure single crystals of UPt3 examined4 displayed magnetic order below 5 K, with the same wavevector but also with a greatly reduced ordered moment ((0.02±0.01)PBAJ ion). Previous muon spin relaxation (uSR) measurements had suggested the presence of magnetic order in polycrystalline UPt37. The onset of the ordering is close to the hitherto unexplained maxima in the temperature derivative of the resistivity and magnetoresistance of pure UPt38.
s
200
100
3 3 0 0 ->-W 2 id
200
100
T 1 1 1 4 0 - 4 0 - 4 0 ' - 3 0 ' UPt3
V% t f = l4.7meV
ST* (0„,0,l.05)
(Qs,O,2J05)
JL J_ JL -I 0 1 2 3 4
0,(RECIPROCAL LATTICE UNITS)
J i
Fig. 5. Constant-Aw scans for UPt3 carried out at the thermal beam H7 of Brookhaven national Laboratory.
It is quite clear that the antiferromagnetic fluctuations revealed by neutron scattering from UPt3 coexist with superconductivity. Furthermore, theoretical work9 shows that such fluctuations are of the correct type to yield the peculiar superconductivity of UPt3. However, until recently, no direct evidence for coupling of magnetic and superconducting order

- 6 0 -
parameters has been found. It is therefore satisfying that our newest experiments4 show that the magnetic order parameter actually decreases below the superconducting Tc, a result which indicates such a coupling whether or not the magnetic order is stabilized by defects or impurities.
C. l>a2-xSrxCu04
Shortly after the discovery of (relatively) high-Tc superconductivity in L&2-x(Sr,B&)xCu04, many groups11 reexamined the question of magnetic order in the parent compound, La2CuC>4. Neutron diffraction work12
confirmed that La2Cu04 is indeed an antiferromagnet. Furthermore, both bulk and neutron data indicate that the ordered moment and Néel temperature depend strongly on oxygen deficiency and dopant concentration, x. In particular, for x > 0.06, magnetic order is absent. Inelastic neutron scattering measurements on nearly stoichiometric La2CuC>413, and the isostructural analog, La2NiC>4u, reveal strong two-dimensional correlations above the three-dimensional Néel temperature, TN. Furthermore, two-dimensional fluctuations (spin waves) reduce the three-dimensionally ordered moments. While readily observed by neutron scattering these fluctuations are not visible by the muon spin relaxation (uSR) technique for x = 01516. On the other hand, both inelastic neutron scattering17 and uSR15 performed on sintered powders with the optimal composition (x =» 0.15) for superconductivity failed to reveal magnetic fluctuations. However, for samples with low but non-zero Néel temperatures, magnetic fluctuations are visible even by pSR. We conclude that the effective exchange coupling, Jeff, is greatly reduced on introduction of charge carriers. Well beyond the impurity concentration at which Jefr and TN are reduced to zero, the magnetic fluctuations could simply have an energy scale of order the bandwidth, W, for the charge carriers, which would make their detection by thermal neutron scattering difficult. Clearly, neutron scattering studies of large single crystals are required to firmly establish whether magnetic correlations exist in the superconducting systems. We close by noting that for La2-xSrxCu04, it seems that JefipW becomes small very rapidly as x is increased and the best superconducting properties achieved. In contrast, for heavy fermion systems, superconducting and otherwise, Jefl/W is always of order unity.

- 6 1 -
References to Chapter V
1. G. Aeppli, A.I. Goldman, G. Shirane, E. Bucher and M.-Ch. Lux-Steiner, Phys. Rev. Lett. 58 (1987) 808; A.I. Goldman, G. Shirane, G. Aeppli, E. Bucher and J. Hufnagl, preprint (1987).
2. D.E. Cox. G. Shirane, S.M. Shapiro, G. Aeppli, Z. Fisk, J.L. Smith, J. Kjems and H.R. Ott, Phys. Rev. B 33 (1986) 3614; C. Broholm, J.K. Kjems, G. Aeppli, Z. Fisk, J.L. Smith, S.M. Shapiro, G. Shirane and H. R. Ott, Phys. Rev. Lett. 58 (1987) 917.
3. G. Aeppli, H. Yoshizawa, Y. Endoh, E. Bucher, F. Hufnagl, Y. Onuki and T. Komatsubara, Phys. Rev. Lett. 57 (1986) 122; L.P. Regnault, W.A.C. Erkelens, J. Rossat-Mignod, J. Flouquet, E. Walker, D. Jaccard, A. Amato and B. Hennion, J. Magn. Magn. Mat. 63 & 64 (1987) 289.
4. C. Broholm, J. Kjems, G. Aeppli, E. Bucher and W.J.L. Buyers, in: Proc. Torino Meeting on Magnetic Excitations and Fluctuations H (Springer, Heidelberg (1987); G. Aeppli, E. Bucher, C. Broholm, J. Kjems, J. Baumann and J. Hufnagl, Phys. Rev. Lett. 60, 615 (1988); C. Broholm, D. Bishop, G. Aeppli, and E. Bucher, unpublished (1988).
5. P. Frings, B. Renker and C. Vettier, preprint (1987). 6. P. Frings, B. Renker and C. Vettier, J. Magn. Magn. Mat. 63-64 (1986) 6561. 7. R. Heffner, paper presented at International Conference on Valence
Fluctuations (Bangalore, 1987). 8. A. de Visser, Ph.D. thesis (University of Amsterdam, 1986). 9. N. Miyake, S. Schmitt-Rink and CM. Varma, Phys. Rev. B 34 (1986) 6554;
M.T. Béal-Monod, C. Bourbonnais and V.J. Emery, Phys. Rev. B 34 (1986) 7716.
10. J.G. Bednorz and K.A. Muller, Z. Phys. B 64 (1986) 189; S. Uchida, H. Tagaki, K. Kitazawa and S. Tanaka, Jap. J. Appl. Phys. I-ett. 26, LI (1986); C.W. Chu, P.H. Hor, R.L. Meng, L. Gao, Z.J. Huang and Y.Q. Wang, Phys. Rev. Lett. 58 (1987) 405: R.J. Cava, R.B. van Dover, B. Batlogg and E.A. Rietman, Phys. Rev. Lett. 58 (1987) 408.
11. L.F. Schneemeyer, J.V. Waszcak, E.A. Rietman and R.J. Cava, Phys. Rev. B 35 (1987) 8421: Y. Yamaguchi, U. Yamauchi, M. Dhashi, II. Yamamoto, N. Shimoda, N. Kikuchi and Y. Syono, Jpn. J. Appl. Phys. Part 2, L447 (1987); R.L. Greene, H. Maletta, T.S. Plaskett, J.G. Bednorz and K.A. Miller, Solid State Comm. 63 (1987) 379.
12. See, e.g., D. Vaknin, S.K. Sinha, D.E. Mon c ton, D.C. Johnston, J. Newsam, C. Safinya and H. King, Phys. Rev. Lett. 58 (1987) 2807.

- 6 2 -
13. G. Shirane, Y. Endoh, R.J. Birgeneau, M.A. Kastner, Y. Hidaka, M. Oda, M. Suzuki and T. Marakami, Phys. Rev. Lett. 57 (1987) 1611.
14. G. Aeppli and D. Buttrey, Phys. Rev. Lett. 61,203 (1988). 15. D. Harshman, G. Aeppli, G. Espinosa, J. Remeika, E. Ansaldo, T. Risaman,
D. Williams, D. Noakes, B. Eliman, and T. Rosenbaum, Phys. Rev. B 38,852 (1988).
16. Y.J. Uemura, W.J. Kossler, X. EL Yu, J.R. Kemp ton, DL E. Shone, D. Opie, C.E. Stronach, D.C. Johnston, M.S. Alvarez and D.P. Goshorn, preprint (1987).
17. B. Yang, G. Shirane, D. Johnson, R. Cava and G. Aeppli, unpublished. 18. G. Aeppli, in Proceedings of Yamada Conference on Correlated
Electron Systems (Sendai, 1987).
Acknowledgements
The author is grateful to D. Bishop, C. Broholm, E. Bucher, D. Buttrey, J. Kjems, G. Shirane, A. Goldman, B. Yang, D. Johnson, R. Cava, D. Harshman, G. Espinosa, J. Remeika, J.H. Brewer, T. Riseman, D. Williams, S. Dodds, E.J. Ansaldo and D.R. Noakes for the fruitful collaborations which led to the results briefly surveyed in these notes. Work at Brookhaven was supported by the division of Materials Sciences, U.S. Department of Energy under contract DE-AC02-76CH00016. The author also thanks Risø National Laboratory (Denmark) and TRIUMF (Canada) for their hospitality.

-63-
CHAPTER4 D: a9C30Q22C2
The Josephson Junction.
N.F. Pedersen Physics Laboratory I
The Technical University of Denmark DK-2800 Lyngby, Denmark
Abstract.
The basic equations for the Josephson junction are derived in a simple way. We discuss the properties of such junctions under various circumstances - including the effects of damping and capacitance - according to the shunted junction model. Also the effects of an external rf bias current are discussed; this leads to a definition of the various characterizing frequencies and to the appearence of many new phenomena, rf-applications such as SIS-mixers and parametric amplifiers will be mentioned. The introduction of spatial dimensions leads to problems concerning cavity exitations and solitons. Finally conditions for the appearence of chaos in Josephson junctions will be discussed.
1« Introduction.
The following description concentrates on the properties of superconducting Josephson junctions, in particular the unique nonlinear properties that has so much promise for useful applications. Although we largely think in ierms of the "old" superconductors simply because the corresponding thin film Josephson junctions are well characterized, we expect most of the following to hold also for the new high Tc
ceramic superconductors if and when high quality thin film Josephson junctions become available; modifications may occur, of course, because of changed parameters. The basic physics of superconductivity ("old" and "new") has been discussed by others at this conference and will not be dealt with in any detail here. Section 2 gives an account of the properties of the (autonomous) Josephson junction. Section 3 deals with the magnetic field dependence, while section 4 introduces the topic of external pumping with time varying signals, i.e. rf properties. Section 5 deals very briefly with the temperature dependence of the Josephson effect. Section 6 deals with the Josephson junction in external circuits, in particular a cavity, while section 7 discusses the properties of a long Josephson junction, i.e. cavity exitations and solitons on a Josephson transmission line. Finally section 8 discusses the chaos that often appears in the case of very large pumping signals. The paper is summarized in section 9.

-64-
2. The autonomous Josephson -junction«
The basic properties of superconductors have been discussed by others at this conference [1,2]. Here I will concentrate on the properties of Josephson junctions with special emphasis on the non-linear behaviour.
A Josephson junction consists of two weakly coupled superconductors as shown in Fig. la. The superconductors are so close that the wavefunction of the left superconductor, ^L, is having an overlap with the superconductor to the right and vice versa. A rigorous derivation of the properties of such a structure was first given by Josephson [3]. However a very simple and elegant argument by Feynman [4] reproduces the essentials of the original derivation, and gives the necessary weak coupling between the two sides. It leads to a tunneling pair current that may be expressed as I0siwJ>, where <t> is the difference between the phases of the superconducting wavefunctions on either side of the barrier and IQ is the maximum pair current. Allowing also for a shunt resistance R carrying a normal electron current (V/R), and a capacitance c carrying a capacitive current C(dV/dt), one obtains a total current I„
dc CdV/dt + V/R + Isin* = I d c (la)
The argument by Feynman also reproduces Josephson's result for the time rate of change of the phase difference, as
d*/dt - 2eV/R, (lb)
where R is Planck*s constant and e is the electron charge.
S) _ b) \\&
IR'J iosin«>
Fig. 1 (a) Schematic drawing of a Josephson junction. Left and right superconductors and wave functions, (b) Equivalent diagram for a small Josephson junction.
Eq. (lb) is the famous Josephson frequency to voltage relation and Eq. (la) is Kirchoffs law applied to the Josephson junction equivalent circuit shown in Fig. lb.
This current-driven Josephson junction is the most widely investigated Josephson junction system; a description may be found for example in one of the good recent books on the subject [5,6], or in a more classic text on superconductivity [7]. The equation for the Josephson junction also describes other important physical systems, such as the synchronous motor, the phased-locked loop, pinned charge density waves, and the damped driven pendulum.
In a Josephson junction the tunneling currents are from two different kinds of charge carriers, Cooper pairs and normal electrons. The unique non-linear properties are due to the Cooper pair current, or supercurrent, as it is often

-65-
called. With time normalized to the reciprocal of the socalled plasma frequency, é£* = (RC/2eIo)*, and currant normalized to the critical current Ip, Eqs. (la(lb) muy be simplified to the dimensionless equation, [5,6]
•*.*. + a $ t + sin<fr = n
v = *,.
(2a)
(2b)
The plasma frequency, <*>_, is a natural oscillation frequency for the Josephson junction, corresponding to the pendulum frequency in a pendulum. Bc - the (dimensionless) Nc-Cumber parameter - is given by B =_2eR2I C/fi, and the damping parameter a is given by (1/^). H is the normalized (to I ) dc bias current, and v is the voltage normalized to liu /2e.
The dynamical behaviour of Eq. (2a,2b) may be described in the following way. For n (current) below one, a time independent solution $ = arcsinii and voltage v = 0 is possible. For very large values of \ the average voltage <v> is determined by the resistance (the average of the capacitive current is zero, and the average value of the supercurrent is less than one) i.e. n * a <#t>« If ve chose another normalizing frequency, the socalled characteristic frequency (*c « 2eRIQ/R, and normalize the time to 1/
UQ and
the voltage to RIQ, we may obtain a convenient plot of a series of I-V curves with Bc as a parameter [5,6]. These are shown in Fig. 2a. We notice that for high damping, Bc « o, the I-<v> curve is single valued. For Bc > o hysteresis occurs i.e. for He < n < 1 a zero-voltage solution coexist with a solution at a finite voltage. The threshold bias value nc is a function of the damping parameter, which is shown in Fig.2b.
M 10
Fig. 2 (a) IV curves for the shunted junction model (b) The McCumber curve

-66-
The details of the dynamical behaviour of this socalled shunted junction »odel say be found in [5,6]; it is the most important and videly used Josephson junction »odel. It should be Mentioned that no general analytical solution to the model exists; however the qualitative behaviour, approximation formulas, and numerical calculations are described in great detail in the literature.
1* Magnetic fjeld dependence.
If a magnetic field is applied to the Josephson junction parallel to the plane of the barrier, a spatial dependence of the phase is introduced [7,5,6]. The phase • varies linearly with distance x perpendicular to the magnetic field H in the plane of the barrier, and the pair current becomes spatially dependent
J(x) = Jj sin (2*d/*0 H x + •„) (3)
Here J denotes the current density and 4oCjttie magnetic flux quantum, is given by *o = h/2e = 2.064x10 Vs. d is the magnetic thickness of the junction, d = 2 A. + t where A, is the socalled London penetration depth, and t is the oxide thickness. This spatial dependence of the pair current gives a total current that is an oscillating function of the magnetic field, as may be seen by integrating the current density, Eq. ^3) over the junction dimensions [5,6,7].
1*. rf properties fif £fee. Josephsom jw»cttomt
If we apply a time varying bias current I - I - sinut in Eg. (la) we may quite generally assume that to some approximation the voltage has the same fundamental frequency; accordingly we may write
V -= V0 + V ^ sin(btt + Y) (4)
where V0,Vrf and the phase y has to be determined. From Eq. (lb) this leads to a phase • (t) of the form
*(t) = (2eVQ/R) -t + ^sin(ut + y) + • o (5)
which g ives a supercurrent of the form I = I s in* = I s in (u T t + t^sinuit + O (6)
O O J X • where <t>i and $Q has to be determined, and the Josephson frequency uu is given by uj = 2eVo/r». The evaluation of the double sine in Eq. (6) gives rise to the socalled rf-induced steps in the IV-curve, the amplitude of which depends on the applied rf power as Bessel functions. Pig. 3 shows schematically an example of an IV curve with such rf-induced steps at a spacing Av = F.u>/2e.
Fig. 3 rf induced steps in the IV-curve (schematic draving).

-67-
A very important topic within Josephson junctions is the rf-applications. Such applications include millimeter wave sources and low noise SIS mixers, detectors and parametric amplifiers for the millimeter wave region. For the latter applications the pump power levels are moderate and below the threshold for chaos, (though often not very far below) for best performance. In the section on chaos we will consider the situation when the pump strength is above the threshold.
5. Temperature dependence.
Near T=0 all electrons are paired, and the supercurrent has its maximum value. The number of pairs - and hence the superconducting properties - disappear in a gradual way as the transition temperatur Tc is approached. For the 'old' superconductors the temperature dependence is discussed in detail in [5,6,7]. For the 'new' superconductors there are no well established theory yet, although experiments show the same gradual transition as for the 'old' superconductors.
£*. Xbt. Josephson junction With external circuits,
For the purpose of the present section we will write Eg. (2a,b) as a set of two coupled first order equations.
0 n - av - sin<j> - i,
(7a)
(7b)
where we have introduced is for the interaction with the external circuit (see Fig. 4a). Eqs. (7a,7b) is a set of coupled first order differential equations, that with is - 0 describes the autonomous junction. For a Josephson junction interacting with external circuits (ig > 0) additional equations describing those circuits are necessesary. An example is a Josephson junction coupled to a cavity. Its equivalent diagram is shown in Fig. 4a; with time normalized to the inverse plasma frequency w0
_1 = (Rc/2eI0)J it is
described by Eqs. (7a,7b) for the basic Josephson junction together with
(v - (<*>_/"-) (r'/R)is)/eL (8)
i
3.
Fig. 4 Josephson junction coupled to a cavity. (a) The equivalent diagram (b) The IV-curve with a cavity induced step near P.

-68-
for the series resonance circuit. Here r# is the resistance of the series resonance circuit, r is the same resistance normalized to the junction shunt resistance R and B, = 2eLI0/R [8].
The qualitative behaviour of a junction coupled to a cavity is the following [5,6]. A Josephson junction with a dc voltage V0 oscillates at a frequency which is given by uij = 2eV0/R. When that frequency is in the vicinity of the cavity resonance frequency, a non-linear interaction with frequency locking may occur. For strong locking the oscillation frequency is determined by the cavity frequency. When the frequency is only sligthly detuned from resonance, the system may oscillate at the cavity frequency for some time and then shift to the "Josephson frequency" for some time - before going back to the cavity frequency, and so on. The motion becomes intermittent [5,6,8]. The IV-curve of such a system is shown qualitatively in Fig. 4b. The detailed dynamical behaviour of the system, Eq. (7a,7b,8) is described for example in [8].
7. Long Josephson junctions: spatial dependence.
Already in the previous section, the cavity mode involves a spatial variation of the phase, although it is not explicitly visible in the lumped element equivalent circuit diagram.
In the weakly non-linear limit the spatial variations may form in such a way that an integral number of half wavelengths appear across the junction. This gives rise to the cavity modes that may be seen directly in the IV-curve (cf. Fig. 4b and section 6). Since a magnetic field changes the spatial variation (section 3) many of the cavity modes can be exited by a magnetic field [5,6].
In the following we will consider the highly non-linear limit when a large spatial variation of the pair phase difference is allowed. We may then get a new type of excitation called a soliton, which is a localized 2ir variation of the phase that may move like a particle under external driving. Indeed the very long Josephson junction, or the Josephson transmission line (JTL) is one of the physical systems where soliton propagation is accessible for direct experimental measurements [9,10]. For the purpose of this presentation it suffices to note that the physical manifestation of the soliton is a fluxon, i.e. a quantum of magnetic flux *o « h/2e • 2.064xl0"15 Vs. Moving fluxons in the Josephson transmission lines manifest themselves as the socalled zero field steps (ZFS) in the dc current-voltage characteristic of the Josephson junction - somewhat similar in appearence to the cavity step discussed in the previous section. Figure 5a shows the equivalent diagram fox a JTL and Fig. 5b shows the geometry of a long junction of the socalled overlap type. The physical origin of the inductance 1/ shown in Fig. 5a is Cooper pair currents within the London penetration layer of thickness *L (Fig. 5b) . A possible resistance, R', due to a flow of normal electrons in the

-69-
Fig. 5 (a) Equivalent diagram for a Josephson transmission line,
(b) Schematic drawing of the junction geometry.
same layer is also shown. Taking all these circuit elements into account, the wave equation for the JTL may be written as an extension of Eq. (2)
-*xx + * t t + s in* - n - a<J>t + 6<t>Xxt (9) with (normalized) voltage v = 4>t (as in Eq. 2b) and (normalized) current i = -<t>x* The additional normalisations used are as follows: Length is measured in units of the socalled Josephson penetration depth Aj = /(R/2deM0
J)' • The damping parameter $ is given by 3 - L'to0/R', J is the current density and d is the magnetic thickness of the junction, d = 2AL + t. The junction length, L, is assumed large, and the width, W, is assumed small compared to the Josephson penetration depth. Finally velocities become normalized to the velocity of light in the barrier, o, given by o - c/t/d) , where c is the velocity of ligth in vacuum. The expression for o reflects the fact that electric fields exist only across the tunneling barrier of thickness, t, whereas magnetic fields exist both in the barrier and the penetration layers (see Fig. 5b). For typical experimental junctions ( "old" superconductors) c is a few percent of c.
IAJ. Perturbation calculation lor. £hj. infinite line.
PPlltPB Dynamics. The methods and ideas in this section are largely based
on the work of McLaughlin and Scott [9]. With the rigth hand side equal to zero, Eq. (9) is the sine-Gordon equation. The loss and bias terms on the rigth hand side are considered as a perturbation to the sine-Gordon equation. The unperturbed sine-Gordon equation has the well known analytical single soliton solution [9].
• « 4tan"1 exp6 (10)
where 9 - (x-ut)Y(u) and Y(u) • l//(l-u2) is the Lorentz factor. The solution gives rise to a 2v phaseshift over a length of a few *j, and its derivative *t represents a voltage pulse. Note that the form of the solution - a traveling wave in the parameter ^ « Y(u)(x-ut) - is a consequence of the Lorentz invariance of the sine-Gordon

-70-
equation. The sine-Gordon soliton behaves very much like a relativistic particle with energy, H, and momentum, P, given by
H - 8<r(u) , P - 8UY(U) (11)
With the normalisations used here the rest mass of the soliton is 8. In Eg. (10) the velocity u is a free parameter. As shown in [9] the perturbation terms are included by assuming a solution of the same form as that in Eg. (10), but with u to be determined by a power balance equation. Requiring either the Hamiltonian or the momentum to be independent of time one finds the velocity (momentum) to be determined by [9,10,11]
wn/4 - UY(u)(a + B/(3(l - u2))) • (12)
As is clear from Eq. (12) the velocity is determined by a balance between the losses represented by a and 8 and the energy input represented by the bias term *[. In most of what follows we will assume 6 = 0 and take only shunt losses into account. In that case the velocity may be found explicitly as
u - 1//(1 + (4a/irn)2) , (13)
Because Eqs. (12,13) are derived by a perturbational approach, they are not expected to be valid if the perturbing terms are large, i.e. if the bias term approaches one and/or the system is heavily damped. Various corrections applicable to that situation have been considered in [12].
2b_j. politon experiment«s fig IV-curve«.
Xbf. overlap JTL. In the overlap junction (Fig. 5b) the bias current is
uniformly distributed over the junction length, and r\ « I0/JWL may be assumed in Eq. (9). Due to the moving fluxon, the mechanism of which is described below, a phaseshift of 2 IT takes place in a time interval 1/u, where 1 is the (normalized) length of the junction. This in turn gives rise to a (normalized) dc voltage, v given by
v - (2ir/l)u (14)
The overlap junction has boundary conditions requiring that no currents flow out at the ends, i.e.
•x(0,t) - Ml,t) - 0 (15)
It may be shown that this boundary condition is mathematically equivalent to a soliton antisoliton collision, that may be treated analytically within the framework of perturbation theory [10,13]. The collision gives rise to an energy loss and a phaseshift that changes sligthly the average velocity from that of the infinite line.
Fig. 6a shows a numerical simulation of a collision between a soliton and an anti-soliton on a Josephson transmission line.
In the l-v-curve the moving soliton gives rise to the so-called zero field steps (ZFS). The mechanism for the first

-71-
Fig. 6 (a) Soliton-antisoliton collision (A. Davidson and N.F. Pedersen, unpublished)
ZFS, n = l, is that a fluxon moves along the junction and is reflected at the boundary as an antifluxon. Since the reflection at x • 1, is equivalent to a collision with a virtual antifluxon at x = 1, the problem may be treated in the framework of perturbation theory for the phaseshift and the energy loss. If the junction length, lf is very large, the details at the boundaries play only a minor role, and the voltage of the first step is given by Eg. (14). Thus for example Pedersen and Weiner [11] were able to completely neglect the effects of collisions in a comparison between experimental soliton ZFS on a very long overlap junction (1 * 45) and perturbation theory. Fig. 6b shows an example of one of their experimental curves. If the junction length is smaller (for example of the order 5 - 10), the energy loss and the phaseshift will give rise to corrections [13].
Fig. 6 (b) Experimental zero field steps of a long overlap junction. (From ref. 11).
vyvt

-72-
7c. Direct sampling measurement of the soliton waveform.
The smallness of the flux quantum, *o ~2xl<r15 Vs, gives some rather difficult specifications on the bandwidth and sensitivity of the amplifiers to be used. Most of the experimental work has been performed in Japan. A very nice method for the experimental verification of Josephson junction sol i tor. s is to take advantage of the properties of Josephson junction electronics. In [14] Josephson pulse generator and a Josephson sampling circuit was fabricated directly on the same substrate as the JTL; a time resolution of less than 10 ps and a current sensitivity of a few^iA was obtained. They also investigated fluxon dynamics [15] by evaporating a resistor (of length a few Jtm) on top of the JTL. By means of a control current supplied to the resistor it was found that a fluxon could be accelerated, made to pause, or even reverse its direction of propagation. Details of the reflection at an open boundary (section 7b) [16] and in particular of the fluxon antifluxon collision [17] has been revealed by direct measurement with on-chip Josephson electronics. T.\ that way most of the expected dynamical behaviour of the solution has been confirmed in direct measurements. It is now feasible to talk about Josephson soliton electronics.
Solitons on the JTL may very well have technical applications. Three possible candidates for applications that have emerged are microwave oscillators and amplifiers, digital information processing, and analog amplifiers.
8t Chaos jn Josephson junctions.
Another non-linear signature appearing quite often in Josephson junctions is chaos - together with its accompagnying bifurcations. In fact, quite often the Josephson junction is used as a model system for chaos in numerical simulations. A particular feature of chaos in Josephson junctions is that the effect of thermal noise and the effect of deterministic noise (chaos) are both very important for the experiments. The interplay between those two sources of noise is at best very complicated, and at worst makes it impossible to interpret experiments. This has led to new theoretical and numerical work on the non-linear interaction between thermal and deterministic noise.
£&*. Deterministic chaos in. the Josephson junction.
The most widely investigated Josephson junction system is the rf-driven Josephson junction for which the equation may be obtained by adding a term Irf sinwt to Eq. (la), i. e. in normalized units Q.= w/a>0)
<frtt + a<J>t + sin<t> * nQ + ni sinQt (16)
This equation is the same as the one discussed in section 4; here however the value of the rf drive is typically larger than when rf applications are considered.
Since analytical solutions do not exist, one has to do numerical simulations in the four dimensional parameter space of a, n0, nj, and fi [18-23]. A particularly thorough investigation of the parameter space was done in [23].

-73-
Typically the system has been investigated numerically in the m - ft plane for a fixed damping parameter a, a plot which more or less has become a standard for such systems [18-20].
Fig. 7. Characterization of solutions in the fi-ni plane.
6C= 25, nQ • 0. Crosshatched region: chaos. Hatched region: complicated periodic. Indexing (p,q) corresponds to the pth subharmonic on the qth rf induced step. (From ref. 19).
Fig. 7 shows such a plot with its complicated mapping of different dynamical behaviour. Note that for u> > uQ, i.e. fi > 1 the threshold rises dramatically because the capacitor shorts out the applied rf-current. For u> < 1/RC, i.e. ft < 1//$^, the system is able to adiabatically follow the rf-current, and chaos only occur if m > 1» For u z u , the threshold for chaos is lowest.
Another method of a somewhat computational nature is to use electronic analogs simulating the Josephson equation. Such systems have the advantage of being very fast, and poincare sections and bifurcation diagrams may be readily displayed [20,24]. The disadvantage is the limited precision and resolution, and the drift of analog electronic circuits.
fife*. Experiments oj| real Josephson junctJOBt
Common to all the experimental results is that they are not nearly as spectacular as the numerical simulations. The main reason is that thermal noise, which is most often not taken into account in simulations, has a major effect on the outcome of the experiments. This is because the energy levels in the thermal oscillations may very well be of the same order of magnitude as the intrinsic energy levels in the Josephson junction and complicated non-linear interactions occur.
Thermal effects may produce not only quantitative changes but also qualitative and quite dramatic changes. Two examples will be given below.
d£ obsfryition ol £&•££*. Before the term chaos was connected to Josephson
junctions, researchers sometimes noted very irregular and erratic IV curves in samples subject to strong applied rf signals. In many cases such junctions were discarded because of assumed defects during fabrication.

- 7 4 -
It is now known that such irregular IV curves »ay be a signature of chaos. Examples of such irregular behaviour, in particular the loss of phaselock on an rf induced step has been published in several cases [25-27].
By comparing such experimentally obtained, irregular IV curves to numerically obtained ones, one has in principle the simplest experiment on chaos [25]. A numerical calculation of the IV-curve without noise will show a lot of complicated fine structure with many different phaselocked steps that exist only over a very small region of bias current. Small amounts of thermal noise will soften those steps to a smooth curve. An example of such a dc experiment is illustrated in Fig. 8, which shows an experimentally obtained IV curve [27] with loss of phaselock on the rf induced step. Also shown in
Fig. 8. Experimental, microwave irradiated IV-curve and the corresponding spectrum of half harmonic qeneration. f « 17.6 GHz, T * 3.54K. (From ref. 27).
0 500 1000 KliA)
the figure is the spectrum of half harmonic generation as measured with a sensitive microwave spectrometer. Note that these experimental curves, which contain two period doubling bifurcations and a chaotic region on a rf-induced step, can be considered as a standard example of the period doubling route to chaos.
S&fifil ABfl parametric amplification. The externally pumped Josephson junction parametric
amplifier is basically governed by Eq. (16). For such Josephson junction parametric amplifiers low noise temperatures have been in some cases, however, more often experiments showed considerable excess noise [28]. For experimentalists the observed noise rise has been a major puzzle. A large number of theoretical and numerical papers [29] have dealt with the problem. The conclusion is that the very large noise temperatures cannot be explained by traditional noise sources such as Johnson noise, shot noise, or quantum noise. Hubermann et al. [18] first suggested that chaos was the origin of the excess noise. This suggestion was further substantiated in ref. 19.
More recently a sligthly different type of Josephson junction parametric amplifier was investigated [30]; for this

-75-
amplifier it was concluded that the large noise cannot arise from deterministic chaos alone: The observed noise rise required the presence of thermal noise. They suggested that the noise rise was due to thermally induced hopping between a bias point that would be stable in the absence of thermal noise and an unstable point. The observation demonstrates the importance of thermal noise in. modeling chaos in Josephson junction systems. As much as 10 K of noise temperature may be obtained by such thermally induced hopping.
IJ. conclusion, This paper has discussed mainly the non-linear
properties of Josephson junctions, that has so much promise for both applications and continued research on fundamental problems. The problems we have dealt with have all been defined on the basis of the old superconductors. The future work involving the new high Tc superconductors will most likely have to deal not only with the same type of problems with changed parameters, but also with completely new non-linear phenomena for example due to anisotropy. It may be safely predicted that a lot of interesting non-linear physics lies ahead.
References.
1. L. Falicov. This conference.
2. 0. Ulfbck. This conference.
3. B.D. Josephson, Phys. Lett. 1, 251 (1962)
4. R.P. Feynman, R.B. Leighton, and M. Sands, The Feynman lectures on physics, Vol. Ill, Addison-Wesley, 1965, Chapt. 21.
5. A. Barone and 6. Paterno, Physics and Applications of the Josephson Effect, New York: Wiley-Interscience, 1982.
6. K.K. Likharev, Dynamics of Josephson junctions and Circuits. Gordon and Breach, New York (1986).
7. M. Tinkham, Introduction to superconductivity, McGraw-Hill, New York 1975.
8. R.F. Miracki, M.H. Devoret, and J. Clarke, Phys. Rev. AH, 2509 (1985)
9. D.W.McLaughlin and A.C.Scott, Phys.Rev.A18, 1652 (1978)
10. N.F. Pedersen in " Solitons in Action" MPCMS, Eds. A.A. Maraduddin and V.H. Agranovich, North Holland, 1986. ptøl.
11. N.F. Pedersen and D. Weiner, Phys.Rev.B29, 2551 (1984)
12. M. Buttiker and H. Thomas, Phys. Rev. hH, 235 (1988) M. Buttiker and R. Landauer, Nonlinear Phenomena at Phase Transitions and Instabilities, (Plenum Publishing Corp.), 1982, p.Ill
13. N.F. Pedersen, M.R. Samuelsen, and D. Weiner, Phys.Rev.B30, 4057 (1984)

-76-
14. S. Sakai, H. Akoh, and H. Hayakava, Jap. Journ. of App. Phys. 21. L479 (1983).
15. H. Akoh, S. Sakai, A. Yagi, and H. Haykawa, IEEE Trans. Magn. MAG-21. 737 (1985).
16. H. Akoh, S. Sakai, and S. Takada, Phys. Rev. B35. 5357 (1987)
17. A. Fujimaki, K. Nakajima and Y. Sawada, Phys. Rev. Lett. 59, 2895 (1987)
[18] B<A. Huberman, J.P. Crutchfield, and N.H. Packard, Appl. Phys. Lett. 22, 750 (1980)
[19] N.F. Pedersen and A. Davidson, Appl. Phys. Lett. 3_9_, 830 (1981)
[20] D. D'Humieres, M.R. Beasley, B.A. Huberman, and A. Libchaber, Phys. Rev. hZå., 3483 (1982)
[21] R.L. Kautz, J. Appl. Phys. ££, 3528 (1981) M. Octavio, Phys. Rev. 12!, 1231 (1984) Kazuo Sakai and Yoshihiro Yamaguchi, Phys. Rev. B30. 1219 (1984)
[22] R.L. Kautz, J. Appl. Phys. 52, 6241 (1981)
[23] R.L. Kautz and R. Monaco, J. Appl. Phys. 5J., 875 (1985)
[24] H. Cirillo and N.F. Pedersen, Phys.Lett. ££&, 150 (1982) W.J. Yeh and Y.H. Kao, Appl. Phys. Lett. 12, 299 (1983) H. Seifert, Phys. Lett. SM, 213 (1983) Da-Ren He, H.J. Yeh and Y.H. Kao, Phys. Rev. BJU, 1359 (1985) V.K. Koraev, K.Yu. Piatov and K.K. Likharev, IEEE Trans. Magn. HbS=21, 586 (1985)
[25] D.C. Croneneyer, C C . Chi, A. Davidson, and N.F. Pedersen Phys. Rev. £3JL, 2667 (1985)
[26] K. Okuyama, H.J. Hartfuss, and K.H. Gundlach, J. Lov Temp. Phys. H , 283 (1981)
[27] N.F. Pedersen, O.H. Sørensen, B. Dueholm, and J. Mygind, J. Low Temp. Phys. 3_8_, 1 (1980)
[28] R.Y.Chiao, M.J. Feldman, D.W. Peterson, B.A. Tucker, and M.T. Levinsen, Future trends in superconductive electronics, AIP Conference Proceedings H , 259 (1978)
[29] For references on this see e.g. N. F. Pedersen in SQUID 80, edited by H.D. Hahlbohm and H. Lubbig (de Gruyter, Berlin, 1980), p739.
[30] R.F. Miracky and J. Clarke, Appl. Phys. Lett. 12, 508 (1983)

-77-
CHAPTER5
PHYSICOCHEMISTRY OF HIGH Tc SUPERCONDUCTORS
Claude MICHEL
Laboratoire CRISMAT - ISMRa - Bid du Maréchal Juin - F-14032 CAEN Cédex
The main direction for research of superconducting oxides lays in
investigating non stoichiometric oxides involving transition or post
transition metal ions, characterized by a mixed-valence. This idea is
supported by the existence of three families of superconductors AgVOj (A -
K, Rb, Cs, Tl), LiTi204 and BaP^^B^Oj which are characterized by :
- Axiroj : Tc * 0.6-6.7 K, mixed-valence W(B) - W(5B) - LiTi204 : Tc * 13.7 K, mixed-valence Ti(I) - Ti(ID) - BaPb^BijjOj : Tc K 13 K, mixed-valence Bi(I) - Bi(D)
In all these oxides the individual mixed-valence ions cannot be
identified since the electrons are delocplized in a conduction band which
results either from the overlapping of the orbitals of metallic and oxygen
atoms or from the direct overlapping of the orbitals of the metallic atoms.
A well known example is that of the metallic oxygen tungsten bronzes HaxU03
of perovskite structure. In these oxides, the conduction band is the ""*
band which results from the overlapping of the tungsten 5dt2. orbitals with
the 2pir oxygen orbitals (Fig. 1).
The superconductivity discovered by Muller in the copper oxides is
in agreement with this point of view since copper exhibits theorically two
oxidation states simultaneously, Cu(H)- Cu(l). However the surprising
feature is in the high value of the critical temperature of those oxides :
Tc=30-40 K in the Ba-La-Cu-0 and Sr-La-Cu-0 systems, TC*90 K in the
Y-Ba-Cu-0 system and related, Tc*22K and 80-110 K in bismuth compounds and
Tc«60-125 K in superconductors with thallium. For the theorists, these
high values of the critical temperature is attributed in addition cf the
mixed-valence of copper, to the low dimensionality of their structures. So
it may be an interesting way for the comprehension of the superconductivity
in these compounds, to analyse their crystal chemistry in relation with the
superconducting properties.

-78-
Fig. 1- Perspective view of the tungsten 5dt2_ orbitals and 2pir
oxygen orbitals, and band diagram for the metallic
perovskite N axW 03-
I) HlffiP-VALgHgE QF CPffff
a) Stabilization of Cudl
Contrary to its neighbourgs of the first transition period such as
iron and nickel, for which higher oxidation states Fe(EZ) and Ni(l) can
easily stabilized in oxides, copper is not commonly observed in its highest
oxidation states, Cu(I). Only a few ternary copper oxides A ^ C u ^
containing trivalent copper can be prepared under 1 ata oxygen pressure or
high oxygen pressure according to the nature of the A eleaent, for exanple
sone A elements, such as alkaline earths : bariua, calcium or strontium
allow the formation of Cu(M) in air. But the ability of copper to be
oxidized into the three-valent state also depends upon the structure. It
can be observed that among the oxides of the systeas A-Cu-0 and A-Ln-Cu-0
(A - Ba, Ca, Sr, Ln - lanthanides and Yttrium), only those related to the
perovskite exhibit the mixed-valence. For example, in the system Y-Ba-Cu-O,
the oxides Y2BaCu05 ("the green phase") and YBa2Cuj07.8 exhibit only Cu(H)

-79-
and aixed-valence of copper respectively. In the first one, divalent copper
ions are surrounded by five oxygens in a distorted pyraaidal configuration
(Fig. 2). and are isolated in the structure, whereas the second one is an
oxygen deficient perovskite (Fig. 7). The reason of this difference can be
explained in tens of anionic vacancies. To stabilize Cu(l) at a rather low
oxygen pressure, the host lattice of the structure sust be able to present
a great number of oxygen vacancies favourable for the intercalation of
oxygen. In this respect, the very flexible perovskite framework is a
potential candidate. This phenomenon is enhanced in the case of copper
perovskftes by the ability of copper to take several coordinations : square
planar, square pyraaidal, tetrahedral and octahedral.
Fig. 2 - Part of the structure of YjBaCuQg showing copper in square pyraaidal coordination.
The study of the electrical properties of the mixed-valence copper
oxides shows that they are all p type conductors due to the presence of
Cu(I). This valence sust be considered as forsal and does not iaply the
existence of a 3d* configuration for copper. The recent study of the copper
Lj edge by X ray absorption spectroscopy of LajCuO^, La| > a sSr Q 1 sCu0 4. and
YBajCujC^.g is aost compatible with a 3d9 ligand hole state leading to holes delocalized a conduction band aainly built up froa 2p oxygen orbitals. The 3d9 ligand hole state is also often noted (Cu2*- 0').
b) Determination of the mean oxidation state of copper
As it will be discussed latter, the mean oxydation state of copper,
i.e. the "Cu(I)" content, is a very important parameter which must be known
with accuracy to be related with the superconducting properties. It can be
determined by chemical or theraograviaetric analyses :
• chealcal analysis
It is a lodoaetric titration. In an acidic solution and in the presence of an excess of I' ions, copper ions lead to the Hollowing reaction :
Cu^+nr « Cul H~n2

- f l O -
or (Cu - 0) D* • (2+p)I" c-i^ieli., Any Cu * in the saaple will precipitate out as Cul, without
generating any neutral iodine. All species oxidized beyong Cu* will react
to yeld a quantity of iodine directly proportional to the degree of
oxidation greater than Cu*. This quantity can be accurately detenained by
titrating with a sodium thi osulfate solution and using starch as an
indicator.
- thexmogravimatrie analysis
The oxydation state of copper is directly related to the oxygen
content of the saaples which can be determined by measuring the weight loss
with a sensitive thermobalance, when the oxides are heated in a reducing
atmosphere. For superconductors with lanthanides or Yttrium, only copper is
reduced. For YBajCujC^.i. the reaction can be written :
VBajCujOy., -* 1/2 Y20j + 2Ba0 + 3Ca + (3.5-&)B^O
The temperature of the end of the reduction is dependant on the
nature of the oxide (Fig. 3)).
300 ••• r c »o«
E
E
\ \ v? \b
\1.
Fig. 3 - TGA curves for La, s s Sr 0 1sCu04.y (a) and YBajCu,^ (b) under reducing atmosphere.

- 8 1 -
H) SYNTHESIS OF COPPER OXIDES
Usually, the mixed-valence copper oxides are synthesized at high
temperature by Solid state reaction between oxides , peroxides or
carbonates . The procedure depends on the nature of the reactants. For the
actually known superconductors, it can be summarized as follow :
AO, AC03 (A= Ba, Ca, Sr)
BaO- (Tl compounds)
CuO MJOJ (M= Ln.Y, Bi, Tl)
Mixing and grinding
1100°C
in 0,
(
900 - 1000°C
in 0,
slow cooling and annealing
under 02 flow at 400°C
K2NiF4 type
oxides
YBa2Cu30?
and related
1 1 »v870oC 780-830°C
in air in sealed quartz tubes
natural cooling of ths furnace
oxides involving oxides involving
bismuth thallium
Variations in the procedure of preparation of samples can Induce
variations in the superconducting properties as it will be shown in
sections I and d .

-82-
1) STRUCTURE AND ELECTRICAL PROPERTIES OF MIXED-VALENCE COPPER OXIDES
RELATED TO THE PEROVSKITE
Among the mixed-valence copper oxides related to the perovskite,
two classes can be distinguished:
- oxygen deficient perovskites
intergrowths of the oxygen deficient perovskite structure and of
the sodium chloride-type structure.
Recalls on structural determinations
The localization of oxygen vacancies in the structures of these
oxides is important, so most of the structural studies have been undertaken
using neutron diffraction.
Why is the neutron diffraction better than the X ray diffraction ?
In every expression for the intensity of the beam of X-rays (or
neutrons) diffracted in any given direction from a crystal (or powder) a
factor F occurs, the structure factor which is a measure of the composite
wave due to the combined scattering of all the atoms in the units cell in
the given direction. It depends on:
- the nature of the scattering material
- the arrangement of the scattering material
- the direction of the scattering
For X ray : Fhkl- Z fn exp2iri(hxn+ kyn+ lzn)
fn is the scattering power of the element n, it is dependent on its
electronic structure and on the hkl direction. It varies from 1 (hydrogen)
to about 100 (Actinides). So it is clear that the influence of oxygen (f -
10) with regard to "heavy" metal ions like La3* or Ba2* (f - 54) or Bi3* (f
- 80) is very weak in the structure factor calculations (Fig. 4).
For neutrons diffraction : Fhkl- Z bn exp2iri(hxn+ kyn+ lzn)
bn is called the neutrons scattering length of the element n, it depends on
its nucleus and it is independent of the hkl direction. For all elements of
the periodic table, bn varies only in a ratio 3 or 4, and for example the
oxygen scattering length is greater than the barium one (Fig. 4).

- 8 3 -
° O
o o OO o O O Ca Cu Y Ba Bi
X rays
neutrons
Fig. 4 - The v i s i b i l i t i e s of sone elements involved in high Tc superconductors for X rays and neutrons. The radi i of the c i r c l e s are proportional to the scattering amplitude.
La4BaCu5013 t , L a8.xS rxC u8°20.e
Fig. 5 • Projection onto (001) of the structure of the oxides BaLa^ Cuj013 and La8.%Srx CugOg0.

-84-
A Oxygen deficient perovskltes
Ordered deficient perovskites can be generated by elimination of
rows of oxygen atoms in an ordered manner in the perovskite framework. This
is the case in the tetragonal oxides La^BaCujO^j and La8.xSrxCu.020
(1.3 < x < 1.9) which were synthesized in Caen (fig.5). Their host lattice
is built up either from Cu06 octahedra and Cu05 pyramids, or Cu06 octane-
dra, CuOs pyramids and Cu04 square planar groups and forms tunnels running
along c. These structures are deduced from that of the stoichiometric pe
rovskite by elimination of rows of oxygen atoms along the [001] direction.
In the compound with barium, ordering between barium (in the perovskite ca
ges) and lanthanum (in the tunnels) is observed. It is clear that in this
oxide, the ordering of these cations is favoured by their different sizes
and is related to the ordering of the oxygen vacancies. The amount of Cu(X)
is about 40 % and 15 % in the barium and strontium oxide respectively. Both
exhibit metallic behaviour (fig.6), but no sign of superconductivity was
observed likely owing to the three-dimensional character of their structu
re. The importance of the bidimensional character of the structure in su
perconductivity has been outlined by several authors, in particular in
France by Labbe and Bock. It is confirmed by the structure of the supercon
ductor YBa2Cu307.
Superconductivity in the system YBaCuO was discovered by Chu and
the superconductivity phase YBa2Cu307 (33 % Cu • ) , called "123" was isola
ted almost simultaneously by several labs. The symmetry of this oxide is
orthorhombic and its structux • is built up from triple layers of
corner-sharing Cu05 pyramids and CuO^ square planar groups (fig.7), it can
be deduced from the stoichiometric perovskite by ordered elimination of
rows of oxygen atoms parallel to the [010] direction. The triple layers can
be described as formed of two single [Cu02 5 ] c o layers of Cu05 pyramids sur
rounding one (CuOjJg,, layer of Cu04 square planar groups. The latter layer
forms planes parallel to b. Once again, yttrium and barium atoms are orde
red forming planes parallel to the (001) plane of the orthorhombic cell.
This ordering of the cations is also likely to be the origin of the oxygen
vacancies, since the cohesion between the triple layers is only ensured by
yttrium ions. In this structure, yttrium ions can be replaced by almost all
the elements of the rare-earth series. All the samples are superconductors
with a Tc of about 90 K (Fig.8), except LaBa2Cu307 which exhibits a lower
Tc (75 K) . Superconducting properties can be influenced by the thermal
treatment as shown in (Fig.8), they will be intensively discussed in sec
tion 01.
Although closely related to the previous oxides Ba, jLa, J C U J O ^ J
differs by its symmetry which is tetragonal and results in a random distri
bution of the oxygen atoms situated at the same level as the copper ions of
the Cu04 groups. This difference can be due to the fact that inside the

- 8 5 -
Fig. 6 - p - f(T) for La6 ^Sr, 6Cu3020 (a) and fiaLa4Cu5Ou (b).
O O Cu •
Fig. 7 - Structure of the stoichiometric perovskite and of the
superconductor YBa2Cuj07.
4000
3000
•3 2000
>
i 1 1000
W B>,Cu,0t.r
.&*** Cr „ .
1J0 200
Temperature (K) NO
E
d « E 0.4
2
0
"?_ '—
# ' < r % 0 l ' , / . ' • 0 0 c... »/ /
fclisi. - \ ' • 0 f»0 T K
Fig. 8 - p - f(T) for the superconductors REBa2Cuj07.5 (RE - lanthanides
and yttrium) and influence of the thermal treatment upon the superconduc
ting properties of YBajCujC^.g.

-86-
triple layers, barium ions are partly replaced by lanthanum ions. The elec
trical properties of this oxide are very sensitive to the thermal treatment
which influences the S value (Fig. 9). Ve can observe a smooth transition
from a semiconductive behaviour to a semimetallic behaviour, but never su
perconductivity was observed. This difference could be partly explained by
high resolution electron microscopy. This study which was carried out in
Caen shows effectively that this oxide appears more as a juxtaposition of
oicrophases whose composition may vary rather than a single phase (Fig.
10).
B Intergrowths of oxygen deficient perovskltes and "AO" sodium chloride
type structure
A way to create anisotropy in the physical properties of perovski-
tes and especially in their electron transport properties is to realize an
intergrowth with another structure. In this respect the sodium
chloride-type structure of SrO is an interesting candidate since both
structures exhibit a bidimensional accord along (001) fFig. 11).
Before 1987, only two families were known La^.^^CvQ^.^#2*8 a n a
La2-xA1 + xC'a2°6-x/2+5' k u t w* t n t n e recent discovery of superconductivity in
the systems Bi-Sr-Cu-0, Bi-Sr-Ca-Cu-0 and Tl-Ba-Ca-Cu-O, the number of fa
milies is greatly increased. All the compounds corresponding to such inter-
growths can be described with the same formula :
(AO)n(A'CuOJ.y)-
(1 < n % 3 , 1 < m < 3) where n and m correspond to the multiplicity of the
sodium chloride-layers and of the oxygen deficient perovskite type layers
respectively. The n value depends on the nature of the A elements.
1) Oxides involving lanthanum
n - 1, m - 1 : the oxides La2-xAxCuOt-x/2*S
The structure is known as the KjNlF^-type structure (Fig. 11). The
se oxides can be synthesized for A - Ba,Ca,Sr. The homogeneity range
depends on the nature of the A cation : narrow for calcium and barium
(0 < x < 0.2) and rather wide for strontium (0 < x < 1.33) whose size is
similar to that of lanthanum. In those oxides, the SrO-type layers are
stoichiometric, whereas the oxygen vacancies are distributed in the basal
plane of the octahedra of the single perovskite layer.
In the La2-x**rxCu04-x/2+8 t h e pfcysicochemistry is complex ; it has
been extensively studied in Caen (Nguyen et al.). For sampled prepared in
air without annealing, three domains of composition can be distinguished :
0 < x < 0.1
The cell symmetry is orthorhombic, 6 (consequently the ratio
Cu(l)/Cutota() and the number of oxygen vacancies are weak. Oxygen interca-

-87-
Fig. 9 - a - f(l/T) for some S values of the oxides Ba., 5La., JCUJO^J-. 1) 0.22; 2) 0.19; 3) 0.17, 4) 0.15; 5) 0.12; 6) 0.10; 7) 0.05; 8) 0.02.
. a.3a jji
.a — a¥:>- aV5
§
'CT
"@/
®j
#
V
V
V L§J
r§1 ®K
V §; &
®> ^
rfi >®
V
$
V 1$
K@/l
®K
fåy
• •
•
•
•
•
r§i o <D>
&
<§>
K O I
V &
&
&
* 3a a a ;< 3 a nVj ntf5
Fig. 10 - High resolution image of an array of small domains and models.

- 8 8 -
la.ar.o.
h+ik^fi 1 i i » i b r i
11 - Structure of the oxides l^-x^x^^i-x/Z+S '©suiting fro« the intergrowth of perovskite and sodiun chloride structures.
— amMaUrf k Oj
Oil - **~ •.••*«fc»«' r —aaaaaU« i« ncavM
r^
^ I T -fi-
Fig. 12 - & - f(x) for various thermal treatments.

-89-
lation is possible allowing the stoichioaetry to be reached.
0.1 < x < 1
The cell syaaetry is tetragonal. 6 reaches a aaxiaua at about x -
0.3 (Cu(l)/Cutot sf 25%). Oxygen is easily intercalated, but the stoichio
aetry is not easily reached (the nuaber of oxygen vacancies increases as x
increases).
1 < x < 1.33
No aixed-valence is observed. Superstructures appear due to the or
dering of the oxygen vacancies.
The curves S - f(x) for different theraal treataencs and o - f (1/T)
for soae x values ( quenched saaples ) are plotted in Fig. 12 and Fig. 13
respectively.
Superconductivity is only observed in a narrow range of coapOFltion
(0.06 £ x £ 0.3) with a aaxiaua of Tc (= 40 K ) for x - 0.15 as shown in
Fig. 14 ( Tarascon's data ). For soae authors the appearence of this pro
perty can be related to the transition orthorhoabic-tetragonal and the Tc
value to the temperature where this transition occurs ( Fig. 14 ). However
La 2Cu04 whose syaaetry is orthorhoabic at rooa teaperature and was claiaed
to be a semiconductor or an insulator at low teaperature, can be prepared
as a superconductor ( see section IV ). As for YBajCiijOj, the superconduc
ting properties of these oxides are dependant of the thermal treatment
(Fig. 15).
The nature of the A eleaent seeas to have an influence on the value of the critical temperature since Ba*2 and Ca*2 which are respectively smaller and bigger cations than La*3 lead ,for the saae x value, to lower Tc than Sr*2 which is about of the saae size than lanthanum.
n - 1, a - 2 : the oxydes I*2.,,*1+xCtt206.J(/2+$
They have only been synthesized for strontium (0 < x < 0.14) and
calcium (x - 0.1) (Nguyen et al.). The cell is tetragonal and the oxygen
vacancies can be numerous as shown for exaaple for L^SrCujO^, involving
only Cu(II), whose double oxygen deficient perovskite layer [LaSrCujOjJ^ is
only formed of corner-sharing Cu05 pyraaids (Fig. 16). No superconctivity
was observed in this series in spite of the bidimensional character cf the
structure.
2) Oxides involving Blsmutly
The first sign of superconductivity in the systea Bi-Sr-Cu-0 (
Tc ^ 22 K ) was discovered in Caen one year ago. The study of the systea
Bi-Ca-Sr-Cu-0 allows Maeda et al., then Chu et al. and Politis to give
evidence of superconductivity in the range 80-110 K for the composition
BijSr^CBjCujOg with x * 1 (Fig. 17).

- 9 0 -
E
C
1 -
a
-—_-____
i '
• =0 16
jt = 0 0 9
< = 0 0
i 1 I
5 6
loVr
» = 0 3 3
0 50
* 0 25
J ' i L. 3 4 5 6 7 8
itf/r
Fig.13 - o - f(l/T) for different x values (quenched saaples).
*
»-
200
100
0
\ \
* \ O r t h . \ T « t .
\ \ \
t i
i i i
•00 200 TEMKMTMf |K)
300 0.1 02
14 - p - f(T) for different x values (Tarascon et al.) (a), and Tc
f(x) and temperature of transition vs x (Kang et al.) (b).

- s i
s ' o E
1
" • • J — -
f > "US*—
J t " •••£ —
t - * 10 T K «o
Fig. IS - Influence of the thermal treatment on the superconducting properties of La 1 a 4 Sr 0 16Cu04.y (Fueki e t a l . )
rfi^Tr
Fig. 16 - Structure of LajSrCujO,

- 9 2 -
120 KO Temperature (Kl
Fig. 17 - p - f(T) for oxides in the syste« Bi-Sr-Ca-Cu-O.
Fig. 18 - Structure of Bi2Sr2Cu06 (a) and BijS^CaCi^Og for Tarascon's and Sleight's models (b).

-93-
B - 3, • - 1 : The oxide BijS^CuO^
This oxide is also called "2201". Its structure (Fig. 18) results
in an intergrowth between a single perovskite layer and a triple "AO" layer
built up from one SrO layer and a double "bisauth-oxygen layer".
n - 3, • - 2 : the oxide BijSrjCaCujO,
In this oxide which is called "2212". the triple "AO" layer is the
saw as in the previous oxyde. The double oxygen deficient perovskite layer
[SrCaCu 2 ° 5] 00 i s like that in La jSrCujC^. The cohesion between the two
corner-sharing CuOj pyramid layers is ensured by a calcium plane (Fig. 18).
The cell syaaetry of these two oxides is orthorhoabic and super
structures are observed along the b axis owing to the nature of the
•bismuth-oxygen" layers which is actually not known with accuracy in spite
of single crystal structural studies. Tarascon proposes for Bi7Sr2CaCu208 a
double distorted rock salt-type layer ((Bi0)2); Sleight observes a split
ting of the bisauth positions and proposes a Bi2(>2 layer as in the Aurivil-
lius phases, and von Schnering proposes a double (BiOj.y) layer like the
CuOj layer of the perovskites. High electron aicroscopy ( Fig. 19) suggests
froa careful simulations of the images that the "bismuth-oxygen" layers are
rather distorted NaCl-type layers than Aurivillius-type or perovskite-type
layers. The oxygen content of these layers is also unknown, this can result
in the mica-like nature of the crystals ( Fig. 20 ) which makes the struc
tural study difficult. The mica-like character is due to weak intersheet
Bi-0 bonds : the distance between adjacent bisauth sheets is unusually long
( 3.25 Å ) compared to the Aurivillius phases ( 2.7 A ).
3) Oxides involving thallium
Superconductivity in mixed-valence copper oxides involving thal
lium, bariua and calcium was recently discovered by Sheng et al. Actually
five compounds are known whose Tc are in the range 60-125 K. The curves p -
f(T) are given in fig. 21 for the three first known compositions. The cell
symmetry of those oxides is tetragonal. Most of the structures have been
determined by powder X rays diffraction, so the positions of the oxygen
atoms were not determined with accuracy. However, the help of high resolu
tion aicroscopy allows the sequences of planes along the c axis to be de
termined, like the nature of the T10 layers which are distorted sodium
chloride-t/pe layers.
r. - 3, m - 1 : the oxide Tl2Ba2Cu06 ( or "2201")
Its structure is like that of Bi 2 Sr 2Cu06 where bismuth and
strontium are replaced by thallium and barium respectively ( Fig. 22). The
critical temperature is found to be at about 85 K ( Fig. 21 ).

-94-
Fig. 19 - HREM image of the "2212" bismuth superconductor showing the
sequence ...Bi-Bi-Sr-Cu-Ca-Cu-Sr-Bi-
Fig. 20 - Electron mocroscopy image showing the lamellar character of the
bismuth superconductors
60 80 100 120 140 160 180 200 220 240 260 280 300 T(K)
Fig. 21 - p - f(T) for some thallium superconductors.

- 9 5 -
n - 3 . • - 2 : the otid« TljB^CaCi^Og ( or "2212")
I t s Tc i s 107 K (Fig. 21 ) . The structure i s s imilar to that of the bismuth oxide involvi'ig the same n and m values ( Fig. 22 ) .
n - 3 . • - 3 : the oxide T ^ B a ^ C ^ O , , , ( or "2223")
The structure differs from the previous one by the presence of a
triple oxygen deficient perovskite layer [BaC&j C uj % loo built up from
[Cu04 Jo,, single layer of corner-sharing Cu04 square planar groups sandwiched
by two [CvtO 2.5 1 eo single layers of corner-sharing CuOj pyramids. The
cohesion is ensured by two calcium planes ( Fig. 22). To explain the
superconducting properties of this oxide ( Tc - 125 K ), the formation of
Cu(l) must be considered, this involves the presence o: "extra" oxygen
atoms in the calcium planes.
The presence of defects in the plane stacking, observed in the HREM
images ( Fig. 23 ), allowed us to synthesize two other superconducting
oxides involving only a distorted rock salt-type bilayer built up from one
T10 single layer and one BaO single layer ( Fig. 24 ).
n - 2, m - 2 : the oxide TlBa2CaCu307 ( or "1212")
Its structure differs from the "2212" by the bilayer (T10)2which is
replaced here by a single layer (T10) (Fig. 24). Superconductivity is
observed at about 60 Kelvins.
n - 2, • - 3 : the oxide TlBa2Ca2Cu3010.y (or "1223")
It exhibits a superconductivity behaviour with Tc * 120 K. Its
structure results in the stacking of a triple oxygen deficient perovskite
layer with a bilayer of sodium chloride type (one BaO layer and one T10
layer) (Fig. 24).
The structure of the superconductors (A0)n(A'Cu0j )m are summarized in (Fig. 25).
BI 8DPERC0MDDCTIVITY IW La^CuO^ TYPE OXIDES
Up to February 1987, L^CuO^ was claimed to be a semiconductor or
an insulator at low temperature. A recent study we carried out in Caen in
collaboration with CRTBT in Grenoble (Tournier et al.) and LPCS in Bordeaux
(Etourneau et al.) clearly shows for the first tine that La2Cu04 can be
prepared as superconductor with a Tc- 37 K (Fig. 26 a) by just working at

-96-
Fig. 22 - Structures of the thallium superconductors
"2223".
"2201", "2212" and
Fig. 23 - HREM image of the "2212" oxide showing defects in the stacking
of the AO layers

-97-
ti*? $1*9
'AP i i i !
• ; * * m o 6.U
. Cu
• Ca
Oo • T| • a a
Fig. 24 - Strutures of the thallium superconductors "1212" and " 1223*
HK)
10
« »
a ., .01
1E-03
1E-04
IE-OS 50
• " • • • •
] ^ 5 » ^ t » - 0 . 9 8 (A) /
/ J
1 1 1
r - » * ^ T x-1.02 ( A ) ^ " 2 1 : ^ ^ : -
fx-1.02(8) - » ^ 1
!
l x - 1 . 0 4 ( B )
100 ISO 200 250 T (K)
Fig. 26 - p - f(T) for LajCuO and La2Cux04 (A: annealing at 450*C under p02- lb; B: annealing at 900*C under p02 - 500b)

- 9 8 -
(Ad)n(A'Cu03.y),
m»1 m*3
/tvis
/K>|S
n-2
• o • o •
/K/fsT/N
/KVKVK
M/N/.V • o • o •
o • o
. * $ & &
o • o
< & »
• o • 0 * 0
4S*/N'/N • •
V.M/.SK 0 * 0
• •
/K/K
,>K/NVN • •
• o • o • • o •
/N7K
^ 7 ^
Fig. 25 • Structures of high Tc superconductors resulting from intergrowths
between perovskite and sodium chloride-type structure.

higher oxygen pressure or by introducing an excess of copper oxide : the
Meissner effect study shows a bulk conductivity without any ambiguity. This
can be explained by the fact that seal-conducting stoichiometric LajCuO^
prepared in air contains only Cu(B). but exhibits Schottky defects
according to the formulation Laj.jt^-t°4-*t • Annealing this compound
under s higher oxygen pressure allows oxygen to be fixed on the anionic
vacant sites leading to the limit formula La2.2tCu^!6^04 , which is
characterized by the mixed-valence of copper necessary for
superconductivity. In the same way, an excess of copper oxide, favours the
formation not only of lanthanum vacancies but of anionic vacancies
according to the hypothetical non superconducting oxide La2.8Cuu04.38/2 ;
the latter can easily be oxidized under an oxygen flow, owingto its excess
of anionic vacancies, leading to the nixed-valence lag. gCur» *0 4 .
An excess of lanthanum favours also the superconducting state, leading
again to the mixed-valence in agreement with the limit formulation
LajCuyie^O^. However in this latter case the critical temperature decreases
drastically, likely owing to the presence of vacancies on the copper sites.
(Fig. 26 b)
2/ Introduction of bismuth in the La^^&^fiufit.yOxljisa
Lanthanldes and yttrium as well as alkaline earth ions are not di
rectly involved in the superconducting properties of the copper oxides.
Lanthanides and yttrium are very useful ions because of their rather high
charge and their big size compared to copper, allowing the charge balance
to be satisfied. Bi (I) owing to its similar size to the lanthanides
cations can replace these cations. This hypothesis was recently confirmed
in Caen by synthesis of the KjNIF^-type La2.xBix,Srx.x,Cu04. t and espe
cially by study of the compound La1 7BiQ ^r^ 2Cu04-y> which was found to
be a superconductor at 42 K (cf. 38 K for Lai.85Sro.15Cu04-y) (FiS> 27>•
However, annealing under oxygen flow breaks the superconductivity. This is
probably due to the partial oxidation of Bi (I) into Bi (V), so that a syn
thesis in air without annealing is sufficient for the synthesis of the best
superconductor.
The study of the superconductor YB^CujO^g (6*0) is a good example
to show the complexity of the physicochemistry of these oxides and that
perfect crystals do not exist even in carefully synthesized samples. The
crystals are twinned and many oriented domains are observed ; moreover,
different defects involving deviation from oxygen stoichiometry are
observed.
Mlcrotvlimlng

-100-
TBa2Cus07 is orthorhombic, by heating it looses oxygen to finally give the tetragonal semiconductor YBajCUjOf.
All the crystals the orthorhoabic fora are twinned, due to the orthorhombic-
tetragonal transforaation which takes place at 750*C. The twin boundaries,
which are parallel either to (110) or to (110), can be parallel or
quasi-perpendicular. Such a phenoaenon results froa a change in the vacancy
ordering in the core of the matrix without any large displacement of the
cations in the host lattice.
Through such boundaries, the chains O-Cu-0 are not broken but zig
zag in the [CUOJIQO layer of the matrix. Several aodels can be proposed
which show the change of orientation of the Cu04 planes froa one doaain to
the next (Fig. 28 + 29).
It should be noted that these twinning domains are in fact small,
the distance between the boundaries ranging from 500 to 1000 Å. They also
lead to a change of oxygen content at the boundary enabling the
aixed-valence Cu(I)- Cu(H) to be modified in a local way, as well as the
structure.
Oriented domains (Fig. 30)
A second type of doaain forming slices perpendicular to the c axis,
is often observed. They correspond to a change of orientation of the
Cu02leJ-ayers froa the triple layer of polyhedra to the adjacent one, forming
'oriented' slices perpendicular to the c axis ; they are, thus,
characterized by a junction involving the juxtaposition of two different
parameters 'a' and 'b' at the boundary.
Extended defects
Three sorts of extended defects can be mainly distinguished :
i/Pxygen oyemolgMomeyrY (Fig. 3i)
Such defects whose size ranges from 30 to some hundred Å are
characterized by a progressive change of contrast, which could be
interpreted from the image simulation by the Intercalation of additional
oxygen between the Cu04 planes belonging to the [Cu02]oolayetB, leading to
the formation of Cu06 octahedra, i.e. tending to the formation of the
YBajCujOg structure.
2/0xvyen subBtolchiometrv (Fig. 32).
A variation of the spacing of the ion spots appears in region« of
about 10-20 Å diameter. Such a phenomenon can be interpreted by the forma
tion of a double row of edge-sharing Cu04 groups similar to that encountered

-101-
M I M M
Fig. 27 - P/p,00K- f(T) for the oxide La, yBi, ,Sr0.2Cu04 ( C: annealed in air, D: quenched in air, E: annealed in 0j, F: synthesized and annealed
Fig. 28 - Low resolution inages showing twinning domains.
a
Fig. 29 - Idealized aodels of junction between twinning donains.

- 1 0 2 -
r en
[3C]
r o o o o
Fig. 30 - Idea l ized drawing of junc t ion between two oriented domains.
YtfcCujO,
^ • - 4 0 0 A
C«0>
' CoO,
o • o
o e • v YB«,Cu,0t
Fig. 31 - (a) HREM [001] iaage of a region of oxygen overstoichioaetry and
calculated [001] images for YBa2Cu}07 and YBajCujOj , (b) idealized
structure of YBajCujOg.
Doubte-row of
&1O4 groupf
Fig. 32 - (a) HREM [100] inage of the defect (arrow); (b) nodel of the
defect

- las-
in the SrCuOj type structure.
i/r*«^- « f T - > É cation« ordering (Fig. 33)
These defects, whose dimensions ara similar to dia previous ones, ara
characterized by a c/3 shifting of die fringes ; they can easily be interpreted
by a reversal of one bariua and one yttrium layer froa one part of die
defect to die odier, while one barium layer renins unchanged dirough die
defect.
in TOWI mm mwBSMax m iHgflfrgy.i
The mixed-valence of copper is absolutely necessary for supercon
ductivity. Thus the oxygen non-stoichioaetry will play an iaportant role in
die superconductivity of dies« oxides. Ordwrhodbic TBajCujO^ looses oxygen
by heating (Fig. 34) to finally give die tetragonal oxide YBa2Cus04 whose
structure is represented on fig. 37. The ordtorhoabic fora of die oxides
YBaj CujOy.s disappears for 6 ^ 0.6 (Fig. 35). Only die orthorhombic oxides
are superconductors. They give a good example of the dramatic influence of
die oxygen content upon die critical temperature (Fig. 36). Although all
die results do not coincide from one audtor to die odier, due to die medtod
of synthediis and also to die accuracy in the determination of the oxygen
content, it is well established diat Tc decreases drastically from 92 K for
& - 0, to 22 K for 6 - 0.6, value beyond which superconductivity disap
pears, as shown for example by the results obtained by Tarascon et al., No-
nod at al., Cava et al. and Tokumoto et al.
Only consideration of electroneutrality leads to consider two do
mains :
0 < 6 < 0.5 involving Cu(S) and Cu(l)
0.5 < & < 1 involving Cu(I) and Cu(I)
Thus die second domain should not exhibit any superconductivity
owing to die absence of the mixed-valence Cu(l)-Cu(H). However we have to
take Into consideration the coordination of copper. From the chemical point
of view it is indeed well-known that Cu(I) or Cu (•) can only take coordi
nations greater than 3, whereas Cu(I) takes only the linear twofold coordi
nation in oxides.
A model based on the continuous transition froa the YBajCujOf
structure to the YBajCujO^ structure (Fig. 37) can be proposed. In order to
respect the coordination of copper the different compositions corresponding
to 0 < & < 1 will be described as disorded Intergrowths of the "07" and "
Of" structures.
In this model the pyramidal layers [ Cu02 5] remain untouched whereas (Cu02 ]<» rows of Cu04 square planar groups alternate with [Cu0]w
rows of Ctr02 groups either In the same layer (Fig. 38a) or from one layer to tha next (Fig. 38b). Longitudinal intergrowths of Cu04 square planar groups and Cu02 groups within a same chain can also be considered (Fig.

-104-
Fig. 33 - Variation of the Y-Ba ordering: (a) »fit iaage, (b) idealized
andel
•
•
V
1
I 1
1 1
1
•
- s
T — 3 M
r— • • • T 'C * • •
\ A r \ O,
\ \ \ \ \ \ \ \
X
Fig. 34 - TG curves showing the behaviour of YBajCujC^ heated in 0j and Ar
ataospher*.

-106-
• «• TT
x««
».•o
J L _
c-
0
»,'
c
«v?
c« "5-r
• • i «
Fig. 35 - X rays patterns of the orthorhoabic and tetragonal foras of the
oxides YBagOiyOr.s and evolution of the cell parameters vs 6
• TOKUMOTO O RAVEAU O TAKASCON • MONOO » CAVA
» • V ^ T . «
Fig. 36 • Variation of Te w S fro« different authors.

-106-
38c).
This structural nodel which is characterized by a partial dispro
portionation of Cu(H) into Cu(l) and Cu(I) leads to the formulation
YBaj [Cujcu^ ], _ 8 [CuJcuI06 ] 8
It is supported by the observations by X-ray absorption of noticeable
amounts of Cu(I) in all the domain 0 < S < 1 simultaneously with Cu 3d9L.
(Baudelet et al. ; Oyanadgi et al.).
The examination of this formulation shows that the Cu(M) content is
moch greater than that deduced from the knowledge of &. Using this formula
tion, Tc increases approximatively continuously as the ratio
[Cu(I)/Cutotal] increases for Monod's data, whereas the plateaus observed by
different authors could be due to an ordering of the oxygen vacancies which
is not yet really elucidated (Fig. 39).
This prominent influence of the [Cu(l)/CuT0T ] ratio upon the Tc va
lue is confirmed by the study of the oxides La2.xSrxCu0^.y. In this case no
disproportionation of Cu(H) into Cu(M) and Cu(I) needs to be considered
since the oxygen deficiency does not introduce for copper at coordination
smaller than four. From the data obtained by Rang et al. it can be establi
shed that there is no discontinuity in the evolution of Tc versus the
Cu(M)/Cutot ratio. In the same way pure orthorhombic La1 95Cu04 prepared un
der high oxygen pressure (Tournier et al.), which exhibits bulk supercon
ductivity below 37 K, corresponds to a [Cu(l)/CuT0T] ratio close to that ob
served for La1 55Sr0 15Cu04 in agreement with the similar values of Tc for
these two compounds.
m SUBSTITUTIONS is Tgȣ%QZls
Many studies have been carried out these last months in order to
determine the influence of doping upon the superconducting properties of
these phases (Tarascon et al., Tsurumi et al.) (Fig. 8). This confirms the
very weak influence of the interleaved rare-earth ions upon superconducti
vity of these materials. On the opposite, Takita has shown that Tc decrea
ses dramatically as barium is partially replaced by rare-earth ions in the
oxides Ln,+xBa2.xCu307„8 (Ln - La, Nd, Sm, Eu). This variation is accompa
nied by a decrease of the orthorhombic distortion leading to a tetragonal
symmetry around x - 0.20 for Nd which composition remains superconductive
(Tc - 60K). The lack of data concerning the oxygen content does not allow
to decide here whether the decrease of Tc is due to the introduction of ra
re- earth ions in the barium sites or to a simple decrease of the
[ C u W / C u ^ ]ratio.
Several studies of the replacement of copper by different metallic
elements have shown that only a progressive decrease of Tc was observed
even for magnetic ions such as irr.i (Fig. 40) Marno et al., Oseroff et
al.). Here again the lack of da**., concerning the oxygen content makes dif -

-107-
Ba Y O O O CU
Fig. 37 • Structure of the superconductor YBa2Cuj07 and of the semiconductor YbajCuj06.
O O O O O
Fig. 38 - Hypothetical models of intergrowths between n07'' and "06" structures.

-108-
Fig. 39 - Variation of Tc vs Cu(I)/Cutot.
3
S o
cr — •—
— " i
, . 1 r— •
i * *
f • M = Ga
*
# . Fe * H"' ,^hw^ * ,
* S^Ujtm.'"•"'s wio*uaj"^
100
60
W 100 200
T {K)
Al
l 1 1 1 1
/ N
t / }/l >
1 1 1 1 1
— 1 1
\ \
\ •
V-\ 1
\ •
Fe Co Ni Cu Zn Ga
Fig. 40 - Superconducting properties of the oxides YBa^Ciij 9MQ .jOy.g,
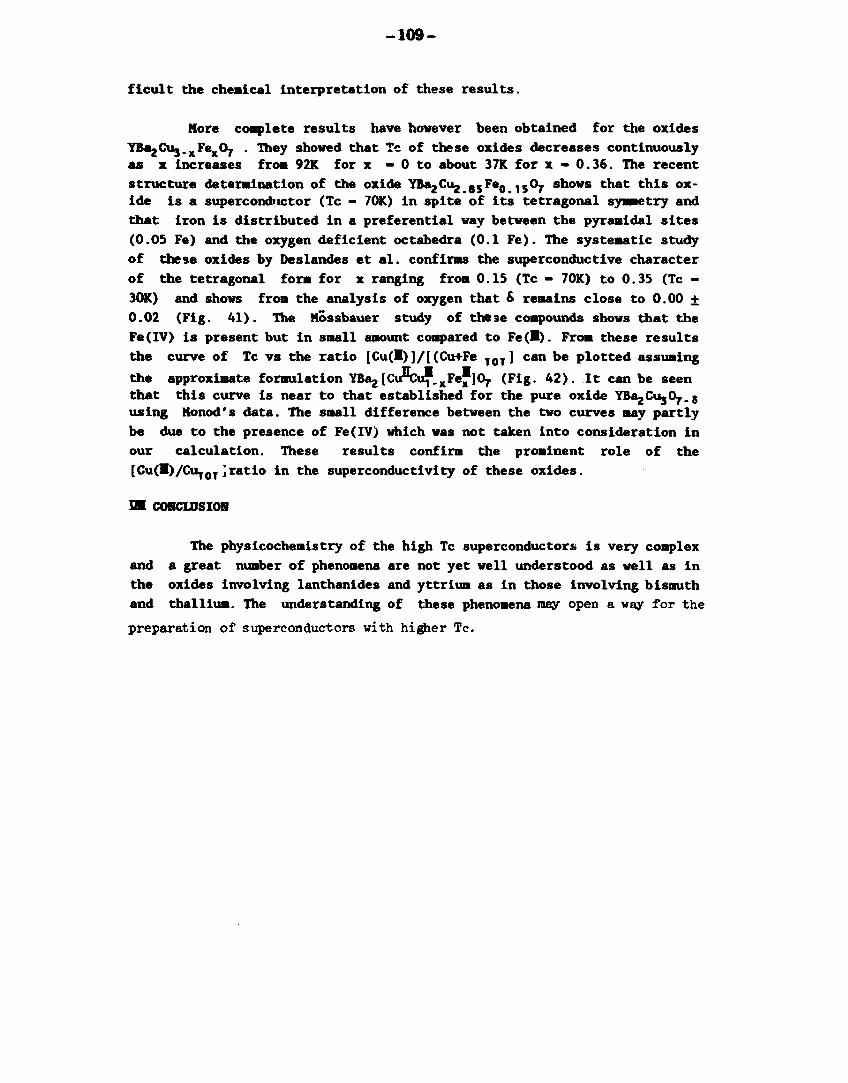
-109-
ficult the chemical interpretation of these results.
More complete results have however been obtained for the oxides
YBajCug.gFegOr . They showed that Tc of these oxides decreases continuously
as x increases from 92K for x - 0 to about 37K for x - 0.36. The recent
structure determination of the oxide YKa 2Cu2 > 8 5Fe 0 1 5O 7 shows that this ox
ide is a superconductor (Tc - 70K) in spite of its tetragonal symmetry and
that iron is distributed in a preferential way between the pyramidal sites
(0.05 Fe) and the oxygen deficient octahedra (0.1 Fe). The systematic study
of these oxides by Deslandes et al. confirms the superconductive character
of the tetragonal form for x ranging from 0.15 (Tc - 70K) to 0.35 (Tc -
30K) and shows from the analysis of oxygen that & remains close to 0.00 ±
0.02 (Fig. 41). The Mossbauer study of these compounds shows that the
Fe(IV) is present but in small amount compared to Fe(l). From these results
the curve of Tc vs the ratio [Cu(l)]/[(Cu+Fe T 0 T] can be plotted assuming
the approximate formulation YBa2[CuIICu^.xFe']07 (Fig. 42). It can be seen
that this curve is near to that established for the pure oxide YBa2Cu307.$
using Nonod's data. The small difference between the two curves may partly
be due to the presence of Fe(IV) which was not taken into consideration in
our calculation. These results confirm the prominent role of the
[Cu(M)/CuT0T jratio in the superconductivity of these oxides.
SI CONCLUSION
The physicochemistry of the high Tc superconductors is very complex
and a great number of phenomena are not yet well understood as well as in
the oxides involving lanthanides and yttrium as in those involving bismuth
and thallium. The understanding of these phenomena nay open a way for the
preparation of superconductors with higher Tc.

-110 -
TcflO 6 -•0.1
80
|0
-0.1
40
L^ j l_ I I L.
0.1 0.2 0.3 a4
'' lattice paramatars (Å)
3.9" c ' 3
3.8 j i, ai 02 a3 a4
J «-TT*»
Fig. 41 - Variation vs x of Tc and 6 (a), and of the cell parameters (b) for the oxides YBajCuj^Fe^.j.
I 0.1 02 0.3
CiT
Cut8f.F.
Fig. 42 - Tc vs Cu(I)/(Cu+F«)tot.

- 1 1 1 -
SOME OP THE CITED LITTERATURE
Bandet F. et al., Z. Fhys. B.69 (1988) p.141.
Cava R.J.et al., Nature, 329 (1987) p.423.
Cha C.W. et al., Phys. Rev. Lett., 58 (1987) p.911; Phys. Rev. Lett., 60
(1988) p.1174.
Eterof S.B. et al., Novel Superconductivity, S.A. Wolf Ed., (1987) p.679.
Kang V. et al., J. Phys. Fr., 48 (1987) p.1181.
Maeda H. et al., Jpn. J. Appl. Phys., 27 (1988) L209, L548.
Maeno T. et al., Novel Superconductivity, S.A. Wolf Ed., (1987) p.1073.
Magneli A., Arkiv Cheni, 1 (1949) p.213.
Michel C. et al., J. Solid State Chem., 37 (1981) p.151; Rev. Chim.
Miner.,21 (1984) p.407; Tiat. Res. Bull., 20 (1985) p.667; J. Solid State
Che«., 68 (1987) p.143; C. R. Acad. Sci., 304 H (1987) p.1059; Z. Phys. B,
68 (1987) P.421.
MOller K. A. et al., Z. Phys. B, 64 (1986) p.189.
Monod P. et al., J. Phys. Fr., 48 (1987) p.1367.
Nguyen N. et al., J. Solid State Chem., 39 (1981) p.120; J. Phys. Chem.
Solids, 44 (1983) p.389.
Oyanagi H. et al., Jpn. J. Appl. Phys., 26 (1987) L649.
Politis C , Appl. Phys., A45 (1988) p.261.
Roth G. ét al., Z. Phys. B, 69 (1987) p.53; Z. Phys. B, 71 (1988) p.43.
Sheng Z.Z. et al., Nature, 332 (1988) p.55; Phys. Rev. Lett., 60 (1988)
p.937; Appl. Phys. Lett., 52 (19888) p.1738.
Sleight A.tf. et al., Science, 239 (1988) p.1015; Nature, 332 (1988) p.420..
Tarascon J.M. et al., Phys. Rev. B, 35 (1987) p.7245; Science, 235 (1987)
p.1373; Phys. Rev. B, 37 (1988) p.9382.
Tokumoto M. et al., Jpn. J. Appl. Phys., 26 (1987) L1566.
Tottxnier R. et al., C. R. Acad. Sci., 304 H (1987) p.1097; Physica B, 46
(1987) p.307.
Tsoruml S. et al., Jpn. J. Appl. Phys., 26 (1987) L1865.
Von Schnering H.G. et al., Angew. Chem., 27 (*988) p.574.

- 1 1 2 -
CHAPTER6 D : 8 9 U 3 0 0 2 2 2 9
MANUFACTURING AND APPLICATION OF SUPERCONDUCTING WIRES
Charles Laverick 16, Roslyn Court
Patchogue NY 11772
and
John K. Hulm Westinghouse R&D Center Pittsburgh PA 15235
ABSTRACT
The discovery of materials which exhibit superconductivity up to 125 Kelvin is a major scientific event and may lead to an extension of the range of superconductor application beyond that which has so far been attained in over 25 years of effort. Some reports suggest that superconductivity may exist even at room temperature or beyond: an exciting prospect which could revolutionize electrotechnology as we know it.
The new superconductors offer the prospect of operation up to the temperature of boiling liquid nitrogen at atmospheric pressure (77 K) as opposed to the temperature region around 4.2 K. This could lead to cheaper and simpler refrigeration.
It may be that the new superconductors will be u->ed in applications which we have not as yet conceived or that the true value of the discovery will lie in our enhanced understanding of the nature of the solid state. Only time will tell.
In this paper, some of the characteristics of the new materials bearing on their utilization are examined and some of the principal barriers to application are * assessed. Some of the promises and successes in applying superconductors over the past 28 years are discussed and the implications of the new discoveries from the point of view of application considered.

-113-
THK LOW TEMPERATURE SDPKRCONDDCTORS: APPLICATIONS - PAST & PRESENT
INTRODUCTION
The story of superconductivity begins with the discovery and liquefaction of helium, since a liquid helium environment was essential for the early superconductors.
HELIUM DISCOVERIES:
1868 - IN THE SUN; 1895 - IN THE EARTH'S ATMOSPHERE;
1905 - IN KANSAS NATURAL GAS; 1908 - HELIUM LIQUEFIED.
1911 - SUPERCONDUCTIVITY DISCOVERED IN MERCURY
Soon after the discovery of superconductivity in 1911 it was recognized that many elements were superconductors, but that they were too limited in magnetic field and current to be of practical use. In the fifty years to 1961 the physics of superconductivity came to be understood, but its practical application remained elusive. Important milestones on the road to practicality were the discovery of superconductivity in niobium zirconium in 1953 and in niobium tin in 1954 by Hulm and Mathias, but they failed to check the current carrying capacity of these materials in magnetic fields: this was left to Kunzler et al. in 1960.
The search for practical superconducting magnets was advanced in 1965 by G.B. Yntema who reported on the operation of a 7 kG superconducting coil using cold worked niobium wire. Five years later, in 1960, S.H. Autler reported on the operation of a similar magnet up to 10 kG using an iron yoke. This was the first coil to show that superconducting windings could be used successfully in an iron magnet.
In 1961 the group at Bell Laboratories (Kunzler et al) was asked to develop a compact liquid helium cooled magnet to operate in conjunction with a maser. They first operated a coil wound with cold worked molybdenum rhenium wire to 15 kG but in the same year were also successful in developing niobium tin wire which produced even higher fields without loss: the practical potential of superconductivity had gained a new lease on life. Within weeks, at an MIT conference on high magnetic fields, several workers reported on the successful construction and operation of superconducting magnets wound from the new materials. These included small bore niobium tin ( Kunzler et al. > 7T) and niobium zirconium solenoids ( Hulm et al., 5.5T and Hake et al., 5.9T). In the same year, commercial quantities of these materials were being produced in wire and tape form and researchers world-wide began the task of producing useful superconducting magnets.

-114-
Table l: PRINCIPAL SUPERCONDUCTOR APPLICATIONS
CURRENT POTENTIAL
COMMERCIAL AND INDUSTRIAL USES
MAGNETIC RESONANCE IMAGING MR SPECTROSCOPY GYROTRONS R&D MAGNETS SEPARATORS MAGNETIC SHIELDING
PHYSICS MACHINES AND DEVICES
HIGH ENERGY COLLIDERS SMALLER MACHINES RADIO FREQUENCY CAVITIES DETECTOR MAGNETS
ELECTRIC UTILITIES
POWER TRANSMISSION ENERGY STORAGE ROTATING MACHINERY TRANSFORMERS CURRENT LIMITERS
ENERGY CONVERTERS
MAGNETIC FUSION MAGNETOHYDRODYNAMICS
TRANSPORTATION
HIGH SPEED TRAINS SHIP PROPULSION
ELECTRONIC APPLICATIONS
COMPUTERS AND LOGIC DEVICES
Semiconducting - Superconducting Hybrids ie. superconducting bus connectors § 77K save space, reduce power loss, increase switching speed
Semiconducting memory with Superconducting Logic
SQUIDS - SUPERCONDUCTING QUANTUM INTERFERENCE DEVICES
Very sensitive magnetic field and voltage measurement Medical diagnostics, geophysics, submarine detection
RADIATION DETECTORS: Microwave and far infra-red
ANALOGUE SIGNAL PROCESSORS MAGNETIC SHIELDING
VOLTAGE STANDARD

-115-
The low temperature superconductors have been used in electronics and in high power or magnet applications (see Table 1). However this paper concentrates on the high current and magnet applications. Some of the highlights in such applications throughout the years are listed in Table 2. thus illustrating the long history of technological advance in applied superconductivity. Development of the technology has been a continuing world-wide effort, with free and open communication at the many national and international conferences devoted to this topic.
TABUS 2 - SOME HIGHLIGHTS; JIU V M rtMJilLH« \*J\ and APPLICATIONS
1960-61 THE NEW HIGH FIELD, SUPERCONDUCTORS
1963-65 SMALL BORE 10T COILS: WESTINGHOUSE, GE, RCA THE BROOKHAVEN 14T SIGMA MAGNET
1964 - THE ARGONNE HELIUM BUBBLE CHAMBER MAGNET SYSTEM
1966 - THE AVCO DEMO MHD STABLE, SADDLE COIL
1966-74 DEMONSTRATION MOTORS AND GENERATORS
1968 - THE ARGONNE 3.7m BUBBLE CHAMBER MAGNET
1973-74 MAGLEV TRAIN DEMONSTRATIONS IN GERMANY & JAPAN
1976 - US/ MHD COIL INSTALLED IN THE U-25 CHANNEL, MOSCOW
1978 - SC TOKAMAK T-7 OPERATIONAL IN MOSCOW
1983 - FERMILAB SC ENERGY DOUBLER OPERATES AT 512 GeV
BNL DEMONSTRATION SC TRANSMISSION LINE OPERATES
1984 - FERMILAB DOUBLER OPERATES AT 800 GeV
1985 - FIRST TESTS OF THE FERMILAB COLLIDER AT 1.6 TeV 1986 - ANL/ATLAS HEAVY ION, SC LINAC OPERATES;
SC FUSION SYSTEMS - MFTF-B & LCT IN US; TORE SUPRA, FRANCE; TRIAM-1M, JAPAN; OPERATED
1986 - HIGH TEMPERATURE SUPERCONDUCTIVITY (HTSC) HT 37 KM
1987 - HIGH TEMPERATURE SUPERCONDUCTIVITY AT 90 K & ABOVE
1988 - MORE HTSC's at 125 K+ & at 30 K (isotropic).

-116-
Many factors contributed to the development of superconductor technology following the 1961 advances. By this time a whole infra-structure was in place and there was a need for this advanced technology. Kamerlingh Onnes could not have carried out such developments in his time because the infra-structure did not exist and there was little perceived need for such high technology.
Among the factors necessary for superconductor development was the growth of big science during and after World War II and the development of a large scientifically literate sub-group in the general population. In addition, the peace was followed very soon afterwards by an arms race, the establishment of the large National Laboratories and the development of the H-bomb, rockets. Sputnik and later satellites beginning in 1957. These developments required a large scale liquid hydrogen technology and large quantities of helium. Thus large scale cryogenics and liquid hydrogen technology dominated the 1950's and the advent of the high field superconductors coincided with the beginning of the age of plentiful helium, an established cryogenic technology and the need for very large physics machines. All the factors were in place at the right time.
The successful reduction to practice which followed led to applied superconductivity as a new engineering technology in all the advanced industrial countries in less than a decade. However its fields of application in everyday life were severely limited, being principally in physics and research.
BRIEF HISTORY
Early Conductors and Magnet Problems
The first niobium tin conductors were prepared by winding a tube of niobium containing a mixture of niobium and tin powders around the coil form and creating the niobium tin 'in situ' by reacting the mixture at high temperature for several hours. The insulation between turns and layers had to withstand this heat treatment. By comparison, the niobium zirconium and niobium titanium were extruded wires which only needed to be cooled below their critical temperatures to become superconducting. Niobium titanium quickly became the work horse of the field because of its superior ductility in spite of its low upper critical temperature and an upper critical field well below that of niobium tin. Later niobium tin conductors were in the form of tapes formed from the vapor deposition of the niobium and tin from their chlorides and these quickly found a niche in the market for the highest field research magnets: a position they still occupy today.

-117-
It was soon found that it was not so easy to make superconducting magnets as it had first appeared. Many problems appeared when coils were wound and energised. They were labelled as coil 'effects'. Typical was the 20 amp. catastrophe: it seemed that no matter what was tried the limit of coil current appeared to be 20A. As coils were made larger, the maximum attainable coil currents appeared to drop: this was the large coil effect. One published theory concluded that at a limiting size, the coil current would be zero. Again, there was the proximity effect: when two or more coils were placed near each other, the operating currents were lower than those attainable by either coil at the same field level. It was also found that the wire operating currents were drastically reduced and erratic if there was the slightest motion of the wire. All these effects had to be overcome if reliable engineered magnets were to be constructed.
A further set of problems involved operating coils. Well below the short sample characteristics of the wires themselves, the coils would switch quickly to the normally conducting state, discharging so violently that they were frequently damaged beyond repair. This phenomenon was, and still is, known as quenching. Techniques for removing this stored energy in a harmless way were devised and are used in many installations today.
In 1962 and 1963 I was able to duplicate all these coil effects in simple hairpins of wire energized in a magnetic field and to extend the work to large numbers of small coils fabricated in different ways and wound with different conductors. The upshot of this work was a set of simple rules for making reliable coils. These were; hold the conductor securely, cool it well, and shunt it with as much good normally conducting material as the application permits. In order to gain mechanical strength, improve the amount of shunting provided for each wire and use operating currents of adequate intensity for larger magnet systems, the superconductors were cabled and it was found that even in large coils the inhibiting earlier coil effects could be eliminated.
Using these techniques, a helium bubble chamber magnet was constructed and operated in Argonne National Laboratory in late 1964, following a series of successful tests of component parts of the system. Constraints imposed by the bubble chamber enclosure prohibited the use of large volumes of copper shunting, but the outer coils could be operated with stable normally conducting regions in the windings.
Shortly afterwards, in late 1964, Stekly and Kantrowitz operated a small coil wound with a strip conductor containing nine 0.25mm diameter, parallel NbZr wires rolled in a 12xlmm cross-section copper strip (19/1 Cu/SC ratio) and this was fully stable. While

-118-
thcse developments continued, the early rn—rrcial organizations were not idle and in 1963 and 1964 a series of snail, technologically significant coils operating at or slightly in excess of 10T vere built by RCA, 6E and Westinghouse, using their respective commercially developed, in-house superconductors and by W. Sampson of Brookhaven National Laboratory who used niobium-tin tape. The path to very high field technology was opened and there were several technological options available.
Bubble chamber developaent for this first superconducting detector had paralleled the magnet development and by early 1966 the bubble chamber was installed on the experimental floor of the Argonne 12.5 Gev proton synchrotron. A successful series of experiments was carried out, during which the magnet was completely trouble free and this success was followed immediately by plans to build a series of very large bubble chambers in Argonne, Brookhaven and CERN laboratories. The age of the superconducting magnet had arrived.
All these very large coils used the fully stable conductor concept, although the first three, at Argonne, Brookhaven and CERN (The European Center for Nuclear Research) used the parallel conductor configuration in copper, as opposed to the cables which had been so successful in the first small, high field chamber. This had the disadvantage that eddy currents induced in the conductor by magnetic field gradients take days or even months to die down, resulting in gradual field changes in the magnet after a change in current or a charge or discharge. Argonne was lucky in this respect because the use of a 1600 ton iron yoke eliminated the field gradients in the coils.
In all, four such large magnets were built, and all were successful. Three were used in bubble chambers and one in a CERN experiment known as the Omega experiment. This latter magnet was unique because it was the first use of a conductor in which the helium flowed through the windings, thus simulating the construction of a conventional water cooled coil. This allowed for a rigid winding structure with good insulation.
Finally a fifth magnet was commissioned for the Fermi National Accelerator Laboratory and also operated successfully. In this latter case there was a return to the cable concept developed by C. Laverick, the cable being soldered in a groove in the stabilizing strip, so overcoming the eddy current effects during field change which hampered the operation of the earlier magnets without iron yokes. Each coil was an improvement on its predecessor both in design and operating field and each was wound with stablized conductor with large amounts of copper.

-119-
The succes« of these physics coils stimulated develop««nt in fusion and mtgnetonydrodynamic development programs and in the development of very high current density, relatively high field coils for use in high energy particle bean transport systems for the large accelerator installations. Host recently, these efforts have resulted in a series of successes in magnet design and demonstration for a large range of projects.
Throughout the years folloving this earlier work, techniques in conductor manufacture improved. Cables were supplanted by twisted multistrand conductors consisting of fine superconducting filaments co-extruded in matrixes of copper or aluminum. In some cases these multistrand conductors were cabled for higher strength and current carrying capacity. On this foundation a small, but mature world wide superconductor industry has grown and there is hope for a bright future for the further application of this technology.

-120-
HIGH TEMPERATURE SUPERCONDUCTORS
Over two years have passed since the discovery of the high temperature perovskite superconductors. As with the early low temperature materials, there are now several families of the new materials with large numbers in each group and often, many variations of each compound. Almost all the early materials have found no practical use, and for the present, this is true of the new materials. The properties of the new materials and their various classifications have been exhaustively discussed in the present school.
We have the lanthanum series with Tc around 35 K, the 1-2-3 series, of which Yttrium Barium Copper Oxide with a Tc around 95 K can be considered the model compound of the class, the Bismuth or Thallium Strontium Calcium Copper Oxide series, with Tc's up to 130 K and, even more recently, Barium Potassium Bismuth Oxide at a Tc of 30 K, which some claim to be istropic. Thus we have the possibility of operating superconductors in liquid nitrogen at 77K instead of in helium at around 4.2K, with the subsequent promise of ease of use, lower cost and simplification in magnet system design - if practical conductors can be produced. It remains to be seen if this promise can be fulfilled. A more important by-product of the discovery may turn out to be our enhanced understanding of the solid state and applications as yet unforseen today.
In the past two years, much has been learned about the new materials and techniques for processing them. However they retain the disadvantage of being anisotropic in current carrying capacity. Even organic superconductivity has received a recent boost with the announcement by K. Oshima et al. (U of Tokyo) of superconductivity in a deuterated organic salt at 10.4K, the highest so far for an organic system.
There have been many unsubstantiated claims for even higher temperature superconductors approaching or exceeding room temperature. These could be the first glimpses of a new electrical phenomena or type of metal, rather than superconductivity: other possibilities include misinterpretations of the phenomena or errors in measurement. However all these advances within two years testify to the dynamic state of a new physics and materials science which may have profound technological significance in the years ahead. Adding to the excitement are rapid advances in materials processing and in the understanding of the structure of many of these new materials.
Unlike the alloy superconductors, the transitions for the new ceramics are broad. In this rapidly evolving new field there is enough broad similarity in characteristics between the various ceramic families to justify considering the older materials (of last year!) for the purpose of examing the problems involved in their practical application: the mechanical and electrical problems are similar. Some of these characteristics are

-121-
As is well known, the current carrying capacity and operating field limit for superconductors falls rapidly as the critical temperature is approached. The model 1-2-3 material has the formula YBa2Cu307. It is possible to replace the Yttrium with almost every member of the rare earth series without affecting Tc. The normal state resistivity just above the onset of superconductivity for these materials is over 500 micro-ohm cm: a factor of about fifty times that for niobium tin.
Wu>0/ S I N C l t X T A l IARGONNC) CERAMIC < W t S T W C I K X J S t l
(CERAMIC SPECIMEN. WESTINGHOUSEI
I I I IxJ ! I 10 I ! I I I I L 0 20 40 60 SO 100 0 ', ? } .1 ', 6
Temperature. K r , . v |m- t i i >!••»! i !.••.!>>
Figure la. Figure lb.
Figure 1: a) Variation of Jc A/cm2 with temperature for single crystal and bulk Y/Ba/CuO specimens. b) Variation of Jc with magnetic field for a bulk specimen at various temperatures.
In figure la, the critical current densities for bulk ceramic and single crystal specimens are compared and those for the bulk material are orders of magnitude lower. The single crystal measurements also reveal a large anisotropy in Jc. This is of the order of 106 A/cm2 in the a-b plane at 4.2 K and a factor of 30 lower in the c-a and c-b planes. Even for the favorable a-b direction of current flow, Jc falls off very steeply with increasing temperature, falling by two orders of magnitude between 4 K and 77 K. The same behavior is observed in the bulk ceramic specimen of figure la and is very different from that of the low temperature materials where the dependence upon T/Tc is commonly linear.

-122-
The model compound has a very high, upper critical field near Tc, and is much superior in this respect to earlier lanthanum type (40 K) compounds and to Nb3Sn. This gives ample field margin for application to magnet and power equipment. However, critical current density (Jc) is another matter. The measured Jc is reasonably high at 4 K but falls off steeply with increasing temperature and is unacceptably low (about 100 A/cm2) at liquid nitrogen temperature; the desired goal for operation (fig.lb). The low temperature superconductors in current use are operated at or near the temperature of boiling liquid helium at atmospheric pressure (4.2 K). Their critical current densities are orders of magnitude higher than the bulk ceramics, but not so different from the values observed by measurement cf single crystals.
Fig. 2a Fig. 2b Anisotropy in 1-2-3 bulk Weak links limit current
specimens as field is applied
The probable connection of the crystalline anisotropy to the low critical current density in bulk ceramic material is illustrated in Figure 2a, in which we show that grains oriented close to the worst (c-plane) direction of current flow will dominate the electrical behavior of the material. We consider this to be a basic materials problem which is a make or break factor for applications. A possible solution might be to develop a grain orientation process as has been done with transformer cores for -years. More unlikely, would be the attempt to produce single crystal conductors.
A further problem is highlighted in Figure 2b, where superconducting weak links between grains are illustrated. These intergranular regions are superconducting in zero field but'are driven normal in very low fields of the order of 100 gauss, producing a low average resistivity in what otherwise would be a

-123-
perfect superconductor. These regions cannot be tolerated in Most applications and it remains questionable if they can be eliminated by suitable processing.
BARRIERS TO APPLICATION
It can be seen from the preceding discussion that the nev ceramic materials are not yet suited for applications requiring high magnetic fields and current densities in large conductors: much work lies ahead! Anisotropic effects have to be mitigated or overcome. The weak links reducing Jc in high magnetic fields have to be reduced or eliminated. Techniques to reduce deterioration in the materials in various ambient atmospheres have to be developed. Radiation sensitivity has to be improved for applications such as fusion magnets and possibly accelerator magnets. High quality electrical contacts are necessary to transfer current to the conductors at minimum heat input. Information on AC characteristics is needed.
Present day conductors are composites containing hundreds to thousands of fine superconducting filaments embedded in normal metal. This improves performance in varying magnetic fields, reduces hysteresis and magnetization effects, and enhances strain tolerance, flexibility and thermal characteristics. A typical example is the inner cabled conductor of the two layer Superconducting Supercollider dipole windings, which contains 23 transposed, compacted strands of mult i filamentary niobium titanium in a copper matrix. In many applications, it will be necessary to produce similar conductor types using the new ceramics. Practical conductor manufacturing techniques need to be developed and proven.
Operation at liquid nitrogen temperature offers the possibility of simpler and cheaper refrigeration systems. However, composite conductors capa. e of operating safely at these temperatures are needed. Advantages of higher temperature operation are the increased enthalpy of materials such as copper compared with 4.2 K operation. Disadvantages are the increased resistivity and decreased thermal conductivity at the higher temperature. However the specifications for reinforcing materials are less stringent at the higher temperature. Careful engineering is needed to develop optimum conductors for each application.
We next consider the progress that has been made in the last twenty five years or more in applying the low temperature superconductors.

- 1 2 4 -
COMHERCIAL APPLICATIONS: and
PROSPECTS FOR BOTH HIGH & DOW TEMPERATURE SUPERCONDUCTORS
Magnetic Resonance
Magnetic Resonance Imaging (MRI), which began to reach the market in 1982 is the most important commercial application of superconductors to date. It is an offshoot of Nuclear Magnetic Resonance (NMR) which was first discovered in 1946 and developed into the most important tool for studying the structure and dynamics of molecules. The availability of superconducting magnets at reasonable prices, together with advances in computer techniques, has led to the expanded use of this technique in spectroscopy.
Most major manufacturers of NMR equipment now offer a wide range of systems of differing bore sizes and magnetic field intensities to meet a wide range of applications. Larger sizes were later used for whole body spin imaging of small animals and, with this success, were extended to human beings, thus necessitating increases in bore size. In industry, NMR equipment is used for fast, non-destructive studies of materials in all states of aggregation, without mechanical or electrical contact with the sample.
About 1300 MRI systems are in use world-wide for medical diagnostics. The medical community removed the "nuclear" description of the technique to make it more attractive to patients. The market distribution is estimated to be: USA - 60%; Europe - 20%; Japan - 15% and the rest of the world - 5%. By the year 1998 about 6000 systems may be needed world wide, if the present rate of increase is maintained. Most cf these systems operate in the region of 0.5T but many installations operate at both higher and lower magnetic fields. At magnetic fields of 1.5T and above, the systems can be used for non-invasive spectroscopy (MRS) and used for in-vivo study and treatment of disease. Together, these two techniques are in the forefront of the ongoing revolution in medicine.
Potential Impact of the Mew Superconductors
System cost depends upon magnetic field intensity, increasing with increasing field because more ampere turns are needed at the higher fields and hence more superconductor is needed. In a 2T system, manufacturers magnet cost is about 45% of system cost of which 27% is the superconducting coil, and 18% is the cryogenic enclosure. Eliminating the cryostat completely would thus save about 18% and this would be the target saving at present if room temperature superconductors were available at a competitive price. Operation at liquid nitrogen temperatures would require a cheapei cryostat and the savings would be around 10%. Cryogen operating costs account for 3% of total operating costs where

- 1 2 5 -
• • t v A -
5UP£«CCN-JCT:%0
-J ' I I • • • !
Figure 3. Magnetic Resonance Imaging (MR) is Revolutionizing Medical Diagnostics.a) An MRI Magnet System in a Clinical Setting, b) MRI Magnet Schematic showing the Coil, Support Structure and Cryogenic Enclosure.c) Cost Comparisons for Superconducting, Resistive and Permanent Magnet Systems.

-126-
helium liquifiers are not used and thus for nitrogen cooling maybe these costs would drop to 1% of total operating costs. It is estimated that halving magnet cost would reduce cost/scan by about 12%, so that elimination of the cxyostat would be a 10% reduction and use of a liquid nitrogen system about half this. The use of nitrogen cooling could thus result in some saving in cost which may or may not be passed on to the patient and to some simplifying of cryostat design. He can expect cost reductions as manufacturing techniques improve. Thus the differential costs between low temperature and hypothetical high temperature systems may decrease with time.
Other Commercial Uses
Compared with the market for MRI systems, the other commercial uses are very small. Even MRS is principally in the clinical experimental stage at present, in spite of its promise. It will take time to develop the expertise to analyse its output on a routine basis and pass this expertise to the medical community at large.
Gyrotrons
Gyrotrons are devices for producing high power microwaves at millimeter wavelengths. A gyrotron is a microwave source that derives its power output from the interaction of a relativistic electron beam with the microwave field. The frequency is determined by the relativistic electron frequency of the electron rather than by the resonant cavity as in a klystron. A gyrotron operating at 120 GHz (2.5 mm) requires a field of 4.8T and this field is produced using superconducting magnets. The slope of the magnetic field at the cathode has to be controlled as well as producing the central field and one split pair coil system is used for each purpose, making four coils in all. Typical sizes are 50mm internal diameter and 18mm length for main coils. These devices are being produced in many countries for use in high power millimeter rf systems such as radar or for plasma heating in fusion experiments
R&D Magnets
R&D magnets are of all types, from those used in the fusion test facilities of various countries to test large Tokamak and mirror coils, to the smaller versions used to generate very high or moderate fields. Superconducting magnets are to be found in all types of laboratory around the world as essential investigative tools. Until recently, the record was held by the Institute of Metals in Japan with the Tachikawa 18T system, which they hope to operate at 20T. This composite system has an inner bore of 30mm, an od of 630mm and length of 680mm. The three concentric coils use different winding materials, the outer uses niobium tin, the intermediate uses niobium titanium tin and the inner uses two different types of vanadium gallium conductor, surface diffusion and 'in situ' processed tapes.

-127-
More recently a 24 n bore, cryogenically stabe 19.3T system was operated at KfK Karlsruhe. As with the Japanese, the aim is 20 T. The system consists of 5 nested coils operating in liquid helium at 1.8 K. An NbTi magnet generates a background field of 11T and insert magnets of Nb3Sn multifilamentary wire which was first layer wound and then reacted to form the Nb3Sn to develop the incremental field. The innermost coil was wound from a ternary conductor of (NbTi)3Sn and operated at a average current density of 96 A/mm2 and a current density in the superconductor of 314 A/mm2.
Magnetic Separators
Developmental magnetic separators have been operated for years but it has taken time to develop industrial interest in their possibilities. This now seems to be taking place and test units have been installed and operated in industrial settings in several countries. In addition to the advantages of very high fields and field gradients for many separation problems, even the more routine separations where conventional magnets would suffice, are being considered. The argument has to do with cost, rather than technical merit and very high field operation. In some ongoing clay processing plants it is contended that superconducting coils would save as much as $100,000/year in operating costs over their conventional counterparts
In all these commercial applications, the idea of nitrogen cooled (77 K) superconductors or room temperature superconductors is appealing but each application must be studied separately if, and when, the practical conductors become available. Until that time, low temperature technology will continue to be used and improved.

-128-
Figure 4 The world's first superconducting proton synchrotron and colliding accelerator: The Fermi National Accelerator Laboratory Tevatron. Above - the 6 km main ring accelerates protons to 900 GeV prior to collision with 900 GeV anti-protons. Below: A view of the superconducting 3.8T dipole magnet of the main ring

-129-
PHYSICS MACHINES
High energy physicists were quick to take advantage of the technical superiority of superconducting magnets over conventional water cooled copper electromagnets in large accelerator installations and to estimate the large cost savings involved in their use. The best example of this to date, is the Fermilab Tevatron in which contra-rotating beams of protons and anti-protons are accelerated to almost 1 TeV each before being interleaved so that their interactions may be studied as some of the particles in each beam collide with each other. The 6 km circumference main superconducting ring of the machine contains about one thousand bending and focussing magnets and an equal number of shim coils to adjust the magnetic field profile as needed for the main coils. First operated as a fixed target machine in 1983 and as a collider in 1986, the machine has demonstrated that superconducting magnet technology is reliable and economic. As a consequence, several other large machines are in design or construction at this time, all relying on superconducting magnet technology as an essential ingredient.
The largest of the big machines so far proposed, and possibly the last using this technology, is the Superconducting Super Collider whose 80 km circumference main ring will contain about ten thousand dipoles and quadrupoles and an equal number of trim coils. The 40mm bore, 17 meter long, 6.6T dipole magnets operate at a current of 6500 amperes and a temperature of 4.35K and have an equivalent magnetic length of 16.6m. The windings consist of two layers of multifilamentary, keystoned, transposed, niobium titanium cable containing 23 strands in the inner layer and 30 strands in the outer layer. Each strand contains about 6900 6micron diameter filaments. The copper to superconductor ratio for the inner layer is 1.3:1 and for the outer layer, is 1.8:1 although these ratios, filament numbers and diameters, and wire diameters may change as the design progresses. The 33mm internal diameter beam pipe is snugly cradled in the magnet assembly.
The cryogenic system for the SSC consists of 10 units for the collider ring and one for the injector, interconnected for redundancy. Each unit services a cryogenic sector of 8.06km and consists of a refrigeration plant, helium storage and four loops of cryostats. Each refrigerator is sized to operate at 1.5 times the design heat load. The heat loads for each arc cryogenic sector are 12g/s of liquid helium, 3160 watts at 4.15K, 4800 watts at 20K and 38800 watts at 84K. The total helium refrigeration load for the system is 378200watts at 4.15K and the nitrogen load is 106700 watts. The total cryogenic system power is 33.6MW. Approximately 2 million liters of liquid helium storage and 6 million standard cubic feet of helium gas storage at 16 atmospheres is needed, together with a 200 ton/day air separation plant and 380000 gallons of liquid nitrogen storage.

Figure 5. The circumference of the proposed SSC superimposed on a map of the Washington, D.C. Beltway to indicate it£ proposed size. Also shown are the outlines for LEP,— the 16 km circumference Large Electron Proton Collider at CERN, Geneva and the Fe_milab Tevatron. The Tevatron is the size of the High Energy Booster of the SSC which will inject 1 TeV protons in opposite directions into the two magnet rings in the main ring for acceleration to 20 TeV in opposite directions before they are induced to interact in the collision halls of the machine.
The machine has not yet had the approval of the US Congress but funding at about $20M/yr has been allocated for the last four years for conceptual design and prototype magnet construction. The current conductor specification calls for a superconductor current density of 2750A/mm2 at 5T measured at an effective conductor resistivity of 10~14 ohm-m with a strain tolerance of 0.5%. The peak operating field at the conductor is around 7T. This performance level has been reached after an intensive R&D program of conductor improvement over the past few years involving industry, Wisconsin University and the SSC team at the Lawrence Berkeley and Brookhaven National Laboratories.

- 1 3 1 -
vttÆ*^'
// V--Cutaway perspective of the high-field superconducting dipole chosen for the SSC. Two superconducting coils si« rounding the beam pipe are held in position by metal collars and surrounded by an iron yoke. -— -
VACUUM VESSEL
coif »•.«* ccMScrr;« snoc
•OK l * 2
\_ SUPPO»T foti Mtcmir
Figure 6 SSC Dipole Magnet Details: Clockwise from upper left, a) cross section of collared coil assembly showing superconducting cabled two layer windings and restraining collar; b) a cutaway perspective of the 6.6T magnet; c) schematics showing details of magnet and cryostat assembly.

- 1 3 2 -
» • •
iss«
1 1 t
D ise
^ ffl « T ( F I T R i *Mf MTC)
^k SUtfJKOa
A SWCBCOM |FHC nLAOMTS)
i x a m > n w n a •vaat
i m i m
' a*
0
SSC rmlmmmU SpaciftcsM* • * r m i
a O
mSSMn"r"
•
•
•
ff
^ d .
A .
»t»t 1«(1 I tC l U I 4 ISIS tlsc T»«7
NbTi Superconductor for Oépote urners
Figure 7 Characteristics of recent production lengths of NbTi •ul i filamentary wire for the SSC, showing the change in SSC wire specification with time and the improvements in wire current carrying capacity over the last few years.
The machine, if approved, could be in operation by the mid 1990's and may be expected to be operational for as much as twenty years. Even if some primitive ceramic superconducting wires were produced now with promising current densities at the necessary fields and strain, it would take many years of development to give the degree of confidence and engineering sophistication to make them candidates for such a project, hence it is not likely that they will be used for the SSC. Even after twenty years of application with NbTi conductor an aggressive development program beginning in 1984 to improve conductor performance for the .SSC has resulted in spectacular gains and it may be that even further increases may be possible. The idea was to reduce the amount of

-133
Figure 8. a). SSC »agnet multifilamentary wire and transposed, keystoned cable. The Kapton allows slippage with low friction as the coils are energized, hence reducing thermal transients in the conductor and enhancing •agnet performance.
b). A 16.6a long SSC inner coil on an assembly work station in Brookhaven Laboratory. The prototype magnets are assembled in Brookhaven and transported the 1600 km by road to Fermi lab for assembly in the cryostats and testing.

-134-
aaterial needed for the magnets and hence, the cost for the project. All these factors must be taken into account in developing competing ceramic conductors. Again, it is certain that the use of liquid nitrogen cooling would make it necessary to develop a satisfactory vacuum technology to replace the helium cryopumping used to maintain the ultra high vacuum necessary for such a machine. Assuming all problems were satisfactorily solved, it is not clear that cost competitive, technologically equal, ceramic superconductors would result in a cost competitive accelerator complex.
The magnet and materials details for the SSC have been treated at length because they represent some of the most advanced technology to date. Many of the ideas in magnet construction and advances in materials are already being utilized in other devices and systems. The information is also of value to those hoping to develop conductors and devices incorporating the new ceramic materials.
The current crop of large high energy colliders is likely to be the last using this technology. The machines will come on line in the later 1990' s and they can probably be expected to operate for as iuch as twenty years. Linear machines offer promise for future advances in the highest energy accelerators. Experimentalists and machine designers look forward to higher energy machines searching for ever more effects, but many theorists assert that the next interesting energy level is the Grand Unification Energy at which the electromagnetic, electroweak ana strong forces coalesce into one force. This is around 1012TeV - a far cry from the 40 TeV cent re-of -mass collisions of the SSC. At still higher energies, in the Planck domain there is the further possibility of the unification of this force with gravity.
Smaller machines
Smaller superconducting accelerators for medical anc industrial use are also either in operation or under construction, although in many instances, designers are still favoring conventional electromagnets in some recent designs. Compact superconducting synchrotrons for X-ray light sources are in construction in Japan and Europe and under development in the United States: this is a comparatively recent field with widespread applications in science and industry. In particular, a highly competitive area is that using intense monochromatic X-ray beams for lithography in computer chip manufacture. It is anticipated that almost two hundred machines for this purpose alone may be needed in industrial settings by the mid 1990's.

-135-
NUCLEAR COLLIDERS
RHIC - THE REIATIVTSTIC HEAVY ION COLLIDER
FUTURE MAJOR FAOLITY HALL
Figure 9. Layout of the BNL/RHIC facility: a complex of accelerators to accelerate and collide beams of heavy ions over the range 7-100 GeV/nucleon for gold and — 28.5-250 GeV for protons. The complex will produce and investigate a new form of matter, the quark-gluon plasma, thought to have existed during the first instants of the expansion of the universe.

-136-
TABLE 3 . General Parameters for the Relativistic Heavy Ion Collider
(RHIC)
Number of magnet rings
Circumference
Energy range (each beam)
Gold
Protons
Average luminosity
Au-Au, 100 Gev/nucleon, 10 hrs
Number of bunches/ring
Number of gold ions/bunch
Number of crossing points
Interaction diamond length
Free space at crossing point
Filling time
Acceleration time
2
3833.87 m
7-100 Gev/nucl«:o«:
28.5-250 Gev
4.4 x 1026 c m - 2 s e c
57
1.1 x 10⁹
6
± 27 cm RMS
± 9 m
1 min
1 min
RHIC is being constructed in Brookhaven Laboratory, USA for nuclear physics studies in the high energy boundary area between past nuclear studies and particle physics. The first such experiments with high energy nuclear beams have already been carried out at CERN and Brookhaven using fixed targets using light ions (32 AMU). These experiments have provided the first glimpse of what is expected to be an entirely new regime of physical phemomena: the formation of a new state of matter, the quark-gluon plasma. RHIC is intended to explore this regime at much higher energies and with heavier ions.
Fixed target experiments up to 28(z/A) GeV/amu began at the AGS (the Brookhaven 33 GeV Alternating Gradient Synchrotron) in 1986. A Booster Synchrotron is under construction for completion in 1990 to increase the proton intensity for the high energy physics

-137-
program and extend the heavy ion Bass range to gold nuclei. Given permission to proceed with the final stage of construction, RHIC collider experiments could begin in 1993 with a beam energy of 250 GeV(z/A)/amu per beam in the collider mode.
Ions are produced in the Tandem Van de Graf (see Fig. 9), transported to the Booster Synchrotron pre-injector and then injected into the AGS, which serves as the injector for the main rings of collider magnets. The RHIC system will provide c-m collision energies for gold beams ranging from 1.5-1-1.5 GeV/nucleon to 100+100 GeV/nucleon (see Table 3). Cryogenic cooling is provided by the refrigerator system originally procured and installed for the colliding beam accelerator (CBA) project which was cancelled some years ago. The system has been modified for use with RHIC. The final collider ring stage for RHIC would be the CBA tunnel which provides for six crossing regions in the main ring for collision experiments. Pour experimental halls are already in place.
The principal dipole and superconducting cable parameters are given in Tables 4 and 5 respectively and the cable structure is portrayed in the schematic of figure 10. The single layer, cos theta dipole coils have an i.d. of 8 cm and a yoke length of 9.7 meters and will operate at 3.5T at a design current of 4.56JcA. The magnet uses cable of the same type as that developed for the outer layer of the SSC coil. This is a flat, keystoned 30 strand cable of the Rutherford type. The bare cable width is 9.73mm and its average thickness is 1.17mm with a keystone angle of 1.2 degrees. Each wire is 0.65mm in diameter, containing high homogeneity NbTi filaments 5-8 microns in diameter. The copper to superconductor ratio is specified to be 2.25:1 with a superconductor current density at 5T and 4.2K of over 2600 A/mm2. Pre-stress is applied to the coil directly through the iron yoke through a 5mm thick molded glass-phenolic insulator-spacer surrounding the coil and keyed into the yoke laminations rather than with a non-magnetic collar as in the SSC. A stainless steel shell which is split and welded at the mid-plane takes over compression of the yoke when it is at cryogenic temperature.
The cryostat housing the cold mass consists of a carbon steel vacuum vessel (610mm o.d.), an aluminum heat shield maintained at 55K, blankets of multilayer, aluminumized Mylar, cryogenic headers and the magnet support system. The 24.8kW helium refrigerator for RHIC supplies helium at 2.59K which is returned at 4.19K. A supply pressure of 5,35 atmospheres produces an input helium flow rate of 4154 g/sec at a density of 0.154 g/cm and enthalpy of 7.32 J/g.
Four coils were successfully tested to 4.6T in early 1987 with virtually no training. The arrangement of the cold mass in the cryostat is similar to that used for the SSC design.

-138 -
Dipole Parameters
Se, minimum operation 0.24 T
Bo, 100 G e V / a m u 3.45 T
Current, 100 GeV/amu 4.56 kA
Inductance 43 mH
Stored energy 490 kJ
Length, effective 9.46 m
Sagitta 47.2 mm
Coil, number of turns 33
Coil, inner radius 40 mm
Iron, outer radius 133.3 nun
Superconducting Cable Parameters
Cu:SC ratio 2.25:1
Wire diameter 0.648 mm
Critical current density
@5 T, 4.2 K
Number of wires in cable
Width of cable
Mid-thickness of cable (bare) 1.17 mm
Keystone angle 1.2°
Filament diameter 5/jrn
NbTi COMPOSITE WIRE DIAMETER 0.648 mm; - 6 0 0 0 FILAMENTS ~5 M m 0IAMETER EACH; Cu SC: 1.8-1
INSULATION:
o)KAPT0N; DOUBLE LAYER. EFFECTIVELY 0.05 mm THICK
bl FIBERGLASS-EPOXY EFFECTIVELY 0.10 mm THICK
MEAN THICKNESS 1.3 mm
>2400 A/mm-
30
9.73 mm
10.0 mm
KEYSTONE ANGLE - 1 . 2 *
Table 4. Principal Wire and Cable Characteristics for RHIC.
Figure 10. RHIC keystoned cable schematic showing construction detais.

-139-
Radio Frequency Cavities
A further developing field of intense importance is that of superconducting radio frequency (rf) cavities where accelerating voltages approaching 10 MeV/meter have been achieved in recent prototypes. In contrast to copper cavities which are usually pulsed to conserve power, these cavities can operate continuously at very low power consumption levels. A superconducting neavy ion linac incorporating superconducting cavities has been in routine operation in Argonne National Laboratory for two years.
Prior to the operation of RHIC, the first priority in the U.S. nuclear physics program is the construction of a 100% duty factor, electron facility to investigate the behavior of the nucleus at higher energies. This can be accomplished by using beams of electrons to penetrate the nucleus to the very short distances where the nucleus can best be described in terms of its fundamental quark and gluon constituents. This research frontier can be reached by accelerators with higher duty factors and higher energies than existing machines. 4 GeV electrons will penetrate this region and be sufficient for studying the production of baryon resonances (excited states of nucleons), heavy mesons and "strange" particles in the nuclear medium. A superconducting electron accelerator known as CEBAF, for Continuous Electron Beam Facility is under construction in Newport News, Virginia, USA to accomplish this goal.
Figure 11. The CEBAF 4 GeV recirulating linac concept- in construction at Newport News, USA for nuclear physics research'.

-140-
CBBAF will provide three separate simultaneous 0.5 to 4 GeV, -2t)0 microamp, continuous electron beams for experiments. The machine has a racetrack configuration with two anti-parallel, 500 MeV, superconducting linac segments connected by beaa lines to allow four passes of recirculation. The accelerating structure consists of 1500 MHz, 5-ce.ll superconducting niobi.ua cavities developed at Cornell University. A liquid heliua cryogenic system cools the cavities to an operating teaperature of 2K. Beaa extraction after any three of four passes allows siaultaneous delivery of up to three beaas of independenty variable currents and different, but correlated energies, to the three experiaental areas. Physics operation is scheduled to begin in 1993. Project cost is estimated to be $225 million.
The accelerating structure is arranged in two separate 235a long linac segaents comprising the straight sections of the racetrack configuration. Each segment is aade up of 25 cryoaodules containing 8 cavities per module for a total of 200 cavities per linac segment. Each cavity has an electric length of 0.5m with a design gradient of 5 MeV/a and operates at a temperature of 2K (see Fig. 11). The cavities are five-cell, 1497 MHz elliptical cavities of Cornell design: a shape which yields low peak surface electric fields, a good chemical rinsing geometry and good mechanical rigidity (see Fig 12). A prototype cavity was successfully tested to 6.5 HeV/m and a Q r e s of 5xl0
9. The linac and rf cavity parameters are listed in Table 5.
Figure 12. C0RNELL/CEBAF 1497 MHz, twin 5 cell, 5 MeV/m rf cavity module.

-141-
Table 5: PRINCIPAL CBBAF UNAC AND CAVITY PARAMETERS
LINAC
No. of Passes 4 Ho. of linac segments 2 Segment length 235m Max. energy gain/pass 1 GeV Recirculation time/pass 4.2 microsec Half cell length 9.4m No. of cavities/half cell 8 No. of half cells/segment 25
CAVITY
Frequency 1497 MHz Electric length 0.5m Design gradient 5 MeV/m
The cryogenic system consists of a 5 kW central helium refrigerator and a transfer line to supply 2.2K, 2.8 atm. helium to the cavity cryostats, 45K helium at 4 atm. to the radiation shields and 4.5K helium at 2.8 atm. to the superconducting magnetic spectrometers in the experimental halls. Total rf load at 2K is 2510W and total 2K heat load is 3310W. The system capacity at 2K is 4800W and the heat load at 45K is 8000W.
Upgrades to superconducting rf cavities are also planned for KEK (TRISTAN), DESY (HER.*), and CERN (LEP). Similar cavities are also planned for nuclear physics and free electron laser facilities world wide.
The new ceramic superconductors may have the necessary properties to make them acceptable for the next generation of these machines. Before a judgement can be made, we need to know more about the AC losses in these materials at the frequencies involved. Present cavities use lead or niobium, the latter being superior. A promising candidate is niobium tin which has a much higher upper critical field; however it has yet even to find favor for developmental cavity investigations. The upper critical fields of the new ceramics are even higher and therefore show even more promise from this point of view. However, it remains to be seen what can be accomplished in this area and when. The operating fields in the cavities are low and the supercurrents flow in thin surface layers so the situation favors present day materials where the need for magnet type high field conductors is not present.

-142-
The material properties crucial to good performance in rf cavities are rf critical field and minimum achievable surface resistance. High field cavities for application in physics collider machines need to operate at the lowest possible fraction of the transition temperature to achieve lowest loss: hence the benefits of increased transition temperature of the base material are more significant for cavities than for magnets. Cavity accelerating fields are ultimately limited by surface conductor fields alone so the potential benefits of higher field operation offered by the application of the new ceramic superconductors could be spectacular.
The maximum possible accelerating field is, in principle, limited to the %superheating critical field' which is related to and not very different from, the thermodyamic critical field. Thus niobium has a thermodynamic critical field of 2000 Oersted and has been used to achieve the highest accelerating fields obtained with superconducting rf cavities, about 25 MV/m. The new materials may have thermodynamic critical fields of 10,000 Oe or more, which would increase the accelerating fields by a factor of 5. This would make linear colliders based on such materials leading competitors for collider technology beyond the Superconducting Supercollider. Significant R&D would be needed to examine the preceding possibility and if the potential is verified, many years of R&D would be needed to exploit it. Superior potential may not be enough! Niobium tin has a higher thermodynamic critical field than niobium, but in spite of being available for over 25 years, it has not so far found use in rf cavities.
In a large superconducting cavity array, the cryogenics represent a much larger fraction of capital and operating costs than in a magnet dominated machine such as a collider. No thorough cost estimates for a state-of-the-art collider based on superconducting rf cavities have yet been made, but it may be that savings of from 5 to 15% of total facility cost may be possible, depending on the operating electric field gradient, at the higher operating temperature.

-143-
ELECTRIC UTILITIES
The generation, distribution and use of electric power in a country is an expensive and gigantic undertaking involving the total society. Interruptions in supply are viewed seriously. Superconductors can be used for generation, transmission, storage, transformers, current limiting devices and for potential new energy conversion technologies. All these possibilities have been pursued during the last twenty five years. Some examples are given below for each category.
Studies and development projects on all types of superconducting electric utility equipment have been carried out since the first announcement of the high field, high current superconductors in 1961. In the early years, a limitation was the fact that AC loss in the superconductors was too high for most AC applications. Thus machines with DC rotors were first considered. AC transmission was pioneered by Brookhaven National Laboratory (Forsyth et al.)
Techological advances in the late I960's included the manufacture of multifilamentary conductors and their application to pulsed magnets. Fast ramp times were demanded for high energy physics devices and energy discharge and storage systems in Controlled Thermonuclear Projects. Studies in the 1970*s indicated that very fine superconducting filaments in the matrix, suitably decoupled, may be satisfactory for AC use since the AC losses would be reduced conssiderably. Under the impetus of the accelerator programs, the manufacturing technology continued to improve.
Beginning around 1983 ultra-fine filaments with the desirable diameters (< 1 micrometer) decoupled from each other through the use of cupro-r.ickel coatings began to be manufactured (Sabrie et al, Alsthom Atlantique). These conductors combine low AC loss, high overall critical current densities and high values of conductor resistivity when the superconductor is driven into the normally conducting state. These properties, if optimally utilized offer the potential for radical improvements in AC equipment design and performance.
TRANSMISSION LINES
Overhead transmission lines are the principal means of moving bulk electrical power from the power plant to the distribution centers because of convenience and cost. In some urban areas this is not possible and the higher priced underground transmission systems are mandated. Usually these underground runs are no more than 25 miles in length at most. At the highest conceivable power levels, superconductors have something to offer and the possibility has been investigated in the world's industrial countries for decades.

-144-
In 1973 there were 14 different power cryorestive "and superconducting power transmission projects in the United States alone and similar projects in the other industrialized countries. Apart from design studies, all these were abandoned in a few years with the exception of a DOE study for an AC line at Brookhaven National Laboratory which continued through the R&D and test site construction phase in the years 1972-1982 when demonstration tests began and continued through the years 1982-1986 when the project was abandoned after 8 successful runs, the longest of which was 27 days, after it was agreed that technical feasibility had been established.
The 100m long line had a 3 phase rating of 1000MVA, 138kV and an emergency rating of 1500 MVA for 1 hr. It was kept cold for a total time of 2752 hrs during tests and operated at rated voltage or current for 441 hrs., operating up to 330 MVA equivalent, the voltage and current being applied simultaneously but out of phase because no load was available for these high powers.— The emergency rating and overvoltage tests were also satisfactory. However, there was no interest in proceeding to the next phase of utility demonstration in the US cable test facility.
Figure 13. The Brookhaven Laboratory 1000 MVA, 138 kV, 100m long Superconducting Transmission Line and Test Site.

-145-
In a study for a 60 mile AC transmission line across eastern Pennsylvania in 1976, 16 different tranmission technologies were compared and the superconducting line was among the leading three contenders, but more expensive than an overhead system.
Schematic of cable construction, c, flexible bronze core; a, aluminum stabilizer layers; s, super- ___ conductor layers; d, plastic tape insulation; d', dielectric screen
k, compression layer
Figure 14. Construction details of the 4100 A flexible conductor used in the BNL superconducting AC transmission line.
Because this line used niobium tin tape operating at 7K for the conductor, and the magnetic fields are low, there is the possibility of developing some type of ceramic type tape conductor for this application if the AC losses can be established as satisfactory. Again the cryogenics are a very small fraction of system cost, other factors being of greater consideration, so the potential saving, if any, would be small.
Energy Storage (SMES)
SMES magnets for utility use would be massive. They must be compared with other installations for electrical energy storage, such as pumped hydro storage from reservoirs, which are land intensive and environmentally insulting, or the use of additional generating capacity as stand by equipment. Base load 1000 MH plants cost as much as $6 billion at present in the U.S.
Superconducting Magnetic Energy Storage Studies have been carried out for over two decades and were first considered in Japan in 1967 because of the high cost of land and the need to use large areas for hydro storage. The chief US proponent has been Prof. Boom of the U. of Wisconsin who has also collaborated in the Japanese studies. The original idea was to compete with other forms of storage such as reservoirs and hydropumping and various other schemes. Clean, relatively compact, efficient storage coils which can be installed underground and which can deliver the stored power to the grid are attractive because they reduce the need for overcapacity in installed base unit power.

-146-
The optiaua size for such a storage systea is around 1 GWhr, based on the idea that about 22 Metropolitan regions in the US aight have average loads of around 2 GW varying froa 1.5 to 2.5 GW through a 24 hr period and that this load could be aet with 2 GW of base load plants and 6 GW of storage. While the »agnet technology is established, systea studies need to be carried out on a relatively large scale. Full size units would cost as auch as a power plant and would be very large.
Most recently, due to the political iapact of the HTSC publicity and the perceived need for new storage technologies in connection with Star Wars ideas, a design study has been coaaissioned froa two US teaas for a 10-30 MWhr systea to be installed in the Madison Electric Coapany Systea. It is hoped that the study can be coapleted in two years and that it can be followed by a four year construction period, thus anticipating trial operation around 1997-1995 followed by soae years of reliability and performance studies. It is too early in the project for-the design details to be fixed.
Figure 15. The Wisconsin SMES 10-30 MWhr Storage Study Concept

-147-
One of the study concepts envisages a 500 turn, solenoidal •agnet, buried in the ground, and supported at its circumference by bedrock. The 50 kA aluminum stabilized conductor would operate at a superconductor current density of 600A/ss*2 a t 5T-The 10m high coil stack would be cooled by liquid helium and use a shrouded liquid neon cooled (27K) intermediate heat shield surrounded by a nitrogen cooled shield. The support structure would transmit the coil loads through the various heat intercepts direct to bedrock at the strata temperature. Energy from the utility system would be converted from AC to DC current by means of a Graetz Bridge system. In spite of its apparent large size, the amount of NbTi superconductor needed for this system is only around 10 tonnes, ie. about 1% of that needed by the SSC.
In considering the possible benefits of high temperature superconductors, we consider the helium related costs of SUES coils. These include helium inventory, helium dump system and thermal shields. Assuming a 1 Gwnr unit, the helium related cost would be around 18% of the total. Very small units in the 10 HHhr range would have helium related costs around 50%. Nitrogen cooled superconductors would replace the helium related costs at cost savings approaching the preceding figures. Thus small SUES systems could become feasible at 77K: the question is whether or not these very small units would be of interest to the electric utility companies.
ROTATIMG HACHINERT
Successful motors and generators have been built for various purposes over the years. Between 1965 and 1986, eighteen superconducting generator models were built and tested in the industrial countries with some success to give evidence of feasibility and to develop basic technology. These included the Federal Republic of Germany, USA, USSR, China, France, Czechoslovakia and Austria. In 1980 Alsthom logged over 5000 hours of testing with a In diameter superconducting rotor. 20 MVA machines were tested in Leningrad (1981), and GE USA (1982). A 30 MVA machine was tested by Fuji/Mitsubishi, a 50 MVA machine by Hitachi in 1983 and a 10 MVA machine in KIT in 1985.
Large model rotor projects in Switzerland and Italy were started then discontinued and an EPRI/westinghouse 300 MVA machine construction project was discontinued when EPRI withdrew the funding. Many large projects have now been discontinued, but some are continuing in the Federal Republic of Germany and the USSR. Siemens, through KF0, continues its development of a superconducting generator and pre-testing of a 300 MVA SC test rotor was scheduled to begin in 1988 with the hope of using this experience to construct an 850MVA SC generator suitable for power plant operation in 1995. Also, Japan has recently announced that a project to develop a large machine to be operational in the mid 1990's will soon begin. In collaboration with Electrosilia, in Leningrad, USSR the USSR Scientific Institute for Electrical Machines will (hopefully !) begin testing a 300 MVA machine this year.

- 1 4 8 -
GENERATOR COST VS. RATING
• Superconducting - High Voltage
Conventional
Superconducting - Low Voltage
500 1000 1500 2000 2500 3000
Qarventor Rittng in MVA it MOO RPM
Figure 16 Comparison of estimated costs versus rating for superconducting high voltage, low voltage and conventional generators. Above 1000 MVA the superconducting machines have the advantage but when are they likely to be needed? Can the new ceramic superconductors lower this margin, and if so, when?
Figure 17 Superconducting machines offer advantages in size and weight over conventional machines at the high power ratings. What can we expect from the new ceramic superconductors?

- 1 4 9 -
1200 MVA GENERATOR LOSS COMPARISON ExCflSDOfl
Rotor m ConvøntJoniJ
Lad ton
BtforPR
Cor« Low
Superconducting Generator
Figure 18 Superconducting 1200 MVA generators are estimated to be more efficient than conventional machines. It can be seen that helium refrigeration is a small component in the comparison.
Transformer Ettntoattm
narstor
ECONOMIC BENEFITS HIGH VOLTAGE VS LOW VOLTAGE """ "CONDUCTING TURBINE GENERATOR
Qanarator Co«
MUrmmno
Plw* Capital Coat
Figure 19 The estimated advantage of a high voltage electric power station superconducting generator is that the transformer is eliminated, thus reducing overall cost.

-150-
SC generators offer outstanding technical and economic advantages over conventional machines and the potential for future improvements in SC technology is great. Prototypes of high rating must be built and tested before a mature design and guaranteed reliability can be achieved: these requisites are essential before a machine can be incorporated into the power system. The development costs for such a program far exceed anything committed to date. Gains in efficiency and size over these machines if high temperature superconductors are used are likely to be marginal, but there may be some simplification in refrigeration with improvements in reliability and design.
Transformers
Superconducting transformers were studied in the early I960's but all concepts seemed to result in excessive AC loss. Conventional transformers are very efficient and a savings of only about 0.2% in efficiency is possible if the AC losses are eliminated. This requires the use of conductors in which the individual superconducting strands in the matrix are fully decoupled and not more than about 0.5 microns in diameter. This was beyond the capability of the technology of the time. In a Westinghouse 1979 study it was also concluded that fault currents would damage the conductor, and hence the transformer, at these filament sizes, because the heat could not be removed quickly enough if the superconductor was driven into the normally conducting state.
In a superconductor with a critical current density of 106 A/cm2, filament size would have to approach 1 micron at liquid neon temperature (27K) and 0.1 micron at liquid nitrogen temperature (77K) before efficiency improvements could be realized. At ten times this current density (107 A/cm2), the filament size could be increased by a factor of ten for the same efficiency improvement. Hence, it is possible that neon cooled transformers would precede nitrogen cooled transformers in development because of the difficulty in obtaining this filament size and also maintaining the necessary decoupling between the filaments in the matrix.
High Tc superconducting transformers may have the additional advantage of acting like fault current limiters, hence improving power system stability. This capability reduces the difficulty of mechanical design and may make such transformers more reliable than conventional transformers. However, power system stability for every type of fault may not be improved and further design studies are necessary.
Current Limiters (Utility Systems)
Fault current limiters were pioneered by the International Research and Development Company Ltd., (IRD), UK in the late 1970's as a concept for utilizing variable inductors with superconducting windings to limit transient surges on transmission grids and a 5 MVA test unit was constructed. The

-151-
concept has to conpete with technologies already in place and well proven, but the units offered simplicity and lowered economics as an attraction with the perceived disadvantage of low temperature helium refrigeration. Conseqently, the concept has not, as yet, found favor.
Recent developments
Long lengths of ultra-fine multifilamentary composite conductors with diameters as low as 0.08mm containing over fifty thousand 0.15 micrometer, niobium titanium filaments are now being routinely manufactured. The application of such conductors to 50/60 Hz equipment has the potential of revolutionizing the technology because of the low AC loss. Measurements in Brookhaven National Laboratory indicate that magnetization is still significant, but that these materials are an improvement over earlier multifilamentary types. Thus the inter-filamentary decoupling is not complete and there is room for further improvement.
More recently, various components have been designed and tested by Alsthorn Atlantique using these new conductors. These include a three phase stator winding, an 80 kVA power transformer and a superconducting electric valve. In all cases, promising results were reported. Work is continuing on the development of a fully superconducting AC machine with both armature and field windings wound with superconducting wires and without electromagnetic shields. Theoretically, this concept offers many advantages for classical cryoalternators.
The tests of the single phase power transformer have demonstrated that considerable weight reduction is possible and that for power values above about 1 MVA, the efficiency of such a machine is better than one with conventional windings. The tests also demonstrated that the current in fault condition is strongly limited by the high value of the conductor matrix resistivity.
A final conclusion is that more complex machines are feasible, with resultant savings in efficiency, cost and safety. Such a machine would include an alternator, regulator and transformer in one unit for transferring mechanical to electrical power. Thus the design of electrical machines must be reconsidered from the beginning, taking into account all aspects of system design, including the cryogenics.

-152-
MAGNETOHYDRØDYHAHTC POWER GENERATION (MHD)
MHD R&D has been conducted in several countries for many years. These include the USA, USSR, UK, Japan, the Federal Republic of Germany, Hungary, Italy, the Netherlands and Rumania. However, at the present time, apart from the USSR, the programs have either been severely curtailed or abandoned. Funding continues at a low level in the USA, but the use of superconducting magnets in the facilities has been suspended; at least for the present, in civil programs. There are competing technologies for MHD and this may account for the curtailment of the US program.
STEAM TURBO-GENERATOR MHD GENERATOR
Figure 20: Principle of MHD Power Generation
In an MHD system, an electrically conducting fluid is forced at high velocity through a duct in which a dipole magnetic field is applied: this results in the generation of an electrical potential mutually perpendicular to the direction of the field * and the fluid flow. The effluent gas stream can then be vented to atmosphere as might be the case in some military applications, or it can be used as input to a conventional thermal power station. An essential part of the MHD system is the magnet, which should be superconducting if the output is to be more than that needed for the magnet.

-153-
Figure 21: Simplified Schematic of a Coal Fired MHD/steam plant with Directly Fired Air Pre-heater.
The major components of an MHD system are shown in figure 21. The combustor utilizes the fuel to heat the gas to temperatures of approximately 3000 K thus forming a plasma. In order to achieve these temperatures, the incoming air is preheated to temperatures of around 2000 K. The alkali metal seed is added to the plasma in the combustor to increase the electrical-conductivity. If the coal is as a fuel, some slag may be removed from the combustor. The conducting plasma is driven through the dipole magnetic field at very high velocity, thus developing an electrical potential at right angles to the direction of flow and of the magnetic field. Many types of MHD system are feasible, both open ended and closed cycle, and many types of working fluid may be used, including even sea water as in the case of proposed ship drives.
The feasibility of MHD power generation was first recognized by Michael Faraday in 1831 and the principle first appeared in the patent literature in the early 1890's. The first recorded attempt to develop an MHD generator was in the early 1940' s. During the last forty years or so, significant steps have been taken on the road to commercial MHD power, but its adoption seems to be many years away. An open cycle MHD generator (Mark V) was operated at the Avco Everett Research Laboratory in 1963 at a peak output power of 30 MW. The first model power plant complex, the uo 2 facility at the High Temperature Institute in Moscow was built in 1964 and was used to gain information for the design of the larger U-25 facility, a 20MW pilot plant with interconnections to the Moscow, USSR power system. The U-25

-154-
attained its design output in 1975, by which time it had logged more than 4000 hours of operation, including 200 hours on the Moscow grid, to which it supplied energy.
„_—i . . •""" Ovarail Schematic View o» Circular Saddla g,;0j Winning
a) MHD DUCT OPERATION b) COMMON WINDING LAYOUTS
Figure 22. Schematics showing a) duct arrangement and b) directions of forces for circular and rectangular MHD saddle windings.
Engineering feasibility of a coal burning MHD facility was established in the US in 1966; the same year in which Avco operated the first demonstration model superconducting MHD type dipole saddle magnet. Operated in the cryogenically stable mode to 3.7T and stored energy of 3.9MJ, it was the largest magnet of its time, but it was not designed for horizontal operation and could not be adapted to an MHD channel. The first MHD generator tests were carried out in the Electrotechnical Laboratory Mark V facility in Japan in 1972. Meanwhile in the US, a generator at the University of Tennessee Space Institute (UTSI) demonstrated that coal could be used as a fuel in an MHD plant in 1973.

-155-
Table 6: Recent U.S. Experimental MHD Magnet Designs
CDIF CFFF
Inlet: Bore(m) Outlet Bore(m) Active Length(m) Peak Field Tesla
0.85x1. 1.05X1. 3 6
(on axis) Stored Energy (MJ) 240 Contractor General
Electric
.05
.05 0.8 diameter 1.0 diameter 3 6
216 Argonne Natl. Lab.
CDIF - Component Design and Integration Facility, Montana; Magnet neither completed nor tested.
CFFF - Coal Fired Flow Facility (UTSI) University of Tennessee Space Institute
Typical successful magnets are those which were developed in Argonne National Laboratory for operation in the U-25 facility, experimental by-pass channel in 1977 as part of a US-USSR collaboration and the circular saddle UTSI magnet which was successfully tested in Argonne At this time, the US MHD development funding was cut and therefore the magnet was not delivered and was never used in the Tennessee facility. The windings and structural components for a superconducting rectangular saddle magnet to be tested in the US Component and Integration Test Facility (CDIF) in Montana were fabricated but the magnet was never completed and tested due to lack of funds to correct construction faults during the same funding cut.
Construction of a large superconducting magnet for the U-500 facility, a 250MW MHD and 250MW thermal plant is under way in the USSR. Design of a 1000MW space based MHD system with a 6T magnet is under consideration in the US for use as a.IMA, 100 second duration fast response power supply.
These successful demonstration magnets, combined with that gained in other large scale applications of superconducting magnets during the past decade have clearly established both the technology and its credibility. The design problems and the techniques to solve them are well understood. The design and construction of a large superconducting magnet does however represent a formidable engineering challenge and because of the very large cost, the number of years needed for design and construction, and the devastating time and cost for repair in the event of failure, these projects must be undertaken with extreme care, caution and a recognition of the need for competent and, most significantly experienced management. The total cost of an

-156-
Figure 23. A view of the ANL winding facility used in the construction of the CFFF coil. In this view, a layer of the coil is being wound.
Figure 24. Force containment structure in place on the CFFF/MHD coil. The structure has then to be enclosed in its cryostat for low temperature operation.

-157-
Figure 25. Artists concept of an MHD magnet for a Central Electricity Power Station (note the standard 6 ft. man in the lower right). A commercial scale generator would be between 15-25m long and a few meters in diameter with a field intensity of 6T.
Figure 26. The ANL/CFFF MHD magnet (Artist's rendition). The system was successfully built and tested and was the largest to date

-158-
early commercial scale superconducting MHD magnet will be in the range of $50-100M. Pre-production costs are about 25% of production costs. They involve design and integration with the MHD system, magnet system design, verification and simulated service testing, manufacturing engineering and technology development.
Table 7: MHD MAGNET PRODUCTION COSTS. * " " (Estimated $50-100 Million)
Percentage
Pre-Production: Design, Testing, 25
Engineering and Manufacturing development
Copper stabilized 6-7T, NbTi conductor 11
Cryostat 15
Refrigeration 2.5
Vacuum System 1.5
Support structure 19
Manufacturing, Installation, Test 23
Power supply, Instrumentation, Control 3
Magnet system costs include cryostat and associated helium refrigeration, the heavily stabilized conductor operating at a peak field of around 6-7 T, and items of manufacturing, installation and test. Of these items, 11% represents conductor cost and 19% is support structure. Helium refrigeration represents only 2.5%, with a further 1.5% for the thermally insulating vacuum system.
The magnet system cost is probably around 10% to 20% of MHD system installation cost, and 5% or less of total combined MHD and thermal plant cost. Thus helium system related costs are around 2% of total initial MHD system cost and less than 1% of total plant cost. This is the differential saving attainable with room temperature superconductors of equal cost and performance: the saving at 77K would be less (see Table 7),
1. Table 7 and many of the figures in this section were provided by my friend Peter 6. Marston of the MIT Plasma Physics Division, Massachussets Institute of Technology.

-159-CONTROLLED THERMONUCLEAR FUSION RESEARCH (CTR)
CTR development programs were initiated in the developed countries 1951. Eight gallons of water contain about one gram of deuterium, with a cost of extraction of less than one dollar and an energy content equivalent to 2500 gallons of gasoline. This is the attraction of CTR. It offers the dream of unlimited energy from the oceans, at low cost, for the use of mankind.
The controlled fusion reaction is not self sustaining and is therefore inherently safe. Fusion plants could conceivably be placed in cities and urban population centers because of this safety feature and the fact that they would produce much less radioactive contamination than fission reactors. However, parts of the plant would become radioactive because of the production of the neutrons which heat the energy absorbing blanket: this, in turn heats the primary water circuit which transfers heat to the steam plant.
Two principal avenues of investigation are Inertial Fusion and Magnetic Fusion: the latter needs superconducting magnets if it is to generate net power. Most experimental magnetic fusion systems are very large and to date, have used conventional, water cooled, copper conductors in their magnet systems. Both toroidal and magnetic mirror systems are under development. The front runner is the toroidal configuration known as the Tokamak(from the Russian words - Tok a magnet Kamera - meaning current and magnet chamber); an invention of the late Professor Lev Artsimovich, Kurchatov Institute, Moscow, USSR. Tokamak experiments incorporating superconducting magnets are in operation in the USSR, Japan, and France.
Figure 27. The Tokamak Principle. A pulsed current in the transformer primary induces a current in the plasma contained in the torus which in turn gives rise to a poloidal field around the plasma. This field combines with the toroidal field produced by the field coils to produce a spiral field which stabilizes the plasma.

-160-
T O M 1=1 l\/I f=» K — ^
Figure 28: Tokamak T-7: The first superconducting tokamak - 1968
A low field Tokanak system at the Kurchatov Institute has been in operation since 1978. Using niobium titanium conductors in the field windings, the system has proved the convenience and cost saving advantages of superconducting systems, because the toroidal field magnets can be operated continuously rather than as pulsed systems, as is necessary with coils wound from water cooled copper. A larger, higher field, Tokamak system, T-15 is being constructed with toroidal field windings, using the technically superior but brittle niobium tin, and is expected to begin operation in 1989.

-161-
FRO
"i\M<-i. >i* uKj^.'i
' " ' U ^
rans rat HBDCIKS
ruaH rat K O S ID WCUMIESSa
Figure 29. Important Tokaaak Coaponents
- TORORML REACTOR
TRITIUM REMOVAL
ELECTRICITY
- J 1 r-F R T A S M M | J V«*OR
TVRME
ELECTRICITY
L
n mm : Cf R(MTO« f
SHAM TtfRlWE
LITHIUM BLANKET
LKMIO POTASSIUM
MAGNETIC F i l LO COILS
fl" WASTE M A T
WATER
THERMAL AND NEUTRON SHlELO
Figure 30. Toroidal Fusion Power Station Concept

162-
Figure 31. The International Large Coil Test: The General Dynamics coil being installed in the vacuum tank
Figure 32. International Large Coil Task: View of the vacuum tank with all six coils installed (Oct. 1985) prior to cool down which began on January 13, 1986.

-163-
In 1978 the Large Coil Task agreement was signed between Eur a torn, Japan, Switzerland and the United States to construct and test six D-shaped coils in Oak Ridge National Laboratory to a design field of 8T and half toroidal reactor scale in order to gain information useful in the design of commercial toroidal reactors. The coils were constructed using different conductor designs and cooling systems, but common mechanical configurations so that they could all be interconnected and tested either separately or together in the test tank.
Industrial experience in large superconductor coil design and construction was gained by having the coils manufactured in industry- The individual coils were built by six different manufacturers: Siemens, Brown Boveri, Hitachi, General Dynamics, Hestinghouse and General Electric/ORNL. Five of the coils used composite conductors containing niobium titanium. Westinghouse was chosen to design and construct a niobium tin coil since the superior characteristic of niobium tin beyond 10 T are more suited to the requirements of the fusion community which has consistently expressed a need for magnets of the highest field possible - hopefully 20T or beyond!
All coils: performed to design specification and beyond. These coils are the largest ever built to operate at 8T and beyond, weighing 45 tonnes each and with 100 MJ of stored energy at 8T. The Swiss and Euratom coils are the largest adiabatically stablized coils ever built and operated to such fields. In total, the system stored energy when the symmetric torus was energized to design field was 860 MJ (approx 220 kWhr).
The international large coil task has demonstrated the following that D-Shaped Tokamak Coils of size 2.5 x 3m can be successfully operated to approximately 10 kA and 8T. All these coils could be ramped up to full field in about 40 minutes.
The peak fields and currents were as follows:
a). Coils cooled by pool boiling Current Field (kAmp) (Tesla)
General Dynamics (GD) - 10, 9 Japan (JA) - 10.9 9.1 General Electric/Oak Ridge (GE/ORNL) 11.4 9.2
b). Coils cooled by forced flow systems.
The Euratom coil (EU) - 13 9.1 The Swiss coil ( CH) - 14.3 9 The Westinghouse coil (WH) - 19.8 8.9

-164-
It can be seen from these results that a wide range of techniques can be used to make prototype, half reactor scale coils. While fusion systems may not be needed before 2030, proposals for the next step in large, engineered, fusion coils have been made in several countries. However, there is no agreement as yet on a common design or an international project.
The international fusion committee has suggested that the next generation device should be designed to operate at 14T. As a consequence, some work is in hand to develop large magnet systems to operate at these field levels. The US has a 14T coil development project at Livermore for the proposed TIBER Tokamak. (Dr. J.R. Miller).
In JAPAN a 16T development plan is under way at JAERI. The coil will have a lm inner winding i.d. and an Al stabilized, stainless steel reinforced Nb3Sn conductor has been developed for this project. The coil conductor will be mounted _a a CuNi conduit and wound in grooves in a high strength stainless steel disk structure.
Since Tokamaks work on the transformer principle, a pulsed poloidal field is necessary. Field changes of 10T/sec for several seconds are needed and slower changes of around lT/sec for times of the order of minuts. The Japanese are also building a Demonstration P.aloidal Field Coil (DPC) test facility to facilitate development of poloidal field coils. A 10T, lm bore 10T/sec coil is expected to be ready for test in this facility in 1989.
The US is hoping to have a similar coil ready for test at the same time in the JAERI facility using a rope-in-pipe conductor based on that developed for the Westinghouse LCT coil. Dr. Hoenig of the Francis Bitter National Magnet Laboratory, MIT, USA, who instigated the rope-in-pipe idea used for the Westinghouse Nb3Sn coil is overseeing the project.
Figure 33. Mirror Concept: a) & b) Solenoid; c) Minimum B or Baseball

-166 -
A-caltcoii --<
Yin-Y»«9 e o i ' • - Transition coil
(North) "•
Figure 34. MFTF-B TANDEN MIRROR CONCEPT: A Yin-Yang coil and one central solenoid pair is pictured and an early coil arrangement is shown. In the final design, the A-cell coils were replaced by 12 T multifilamentary Nb^Sn axicell coils as end plugs, four transition magnets replaced the two larger ones shown, two solenoids were removed and the remaining 12 were moved closer together to produce a 1.6 T central field.
Tht mirror fusion test facility (MFTF-B) in the Lawrence Livermore Laboratory, USA was completed and tested successfully to design field in 1986 and is the largest superconducting magnet facility of its kind. Unfortunately, the facility was shut down before it could be used for experiments.
MFTF-B is a 53m long system containing 42 superconducting magnets weighing over 1200 tonnes in total, with a stored energy of 1200 MJ (approx 330 kWhr) at full field. The concept had its beginning in 1965 In Livermore Laboratory. In 1965 a small model was wound and tested in Argonne Laboratory in a collaboration between C. Laverick and C.E. Taylor of Livermore using cable Laverick developed for the outer sections of the helium bubble chamber magnet. It was then taken to Livermore where it was later rewound and became known as Baseball 1 because the windings followed the contour of the seam of a baseball around a spherical winding form. Two such windings rotated 90 degrees with respect to each other became known as Yin-Yang coils. Design of the large system began in 1974 and testing began in 1986* Containing 2 sets of Yin-Yang coil pairs at each end of the system, separated by six pairs of 3.5 T, 5m bore solenoids and a 12.5T plug coil behind each Yin-Yang to reverse the leakage plasma from the Yin-Yangs, as well as several other coils, this was the largest superconducting system ever built and tested.

-1W>-
HIGH SPEED GROUND TRANSPORTATION
FIGURE 35: SIEMENS- ERLANGEN, TEST CARRIER: OPERATION 1976-1979
aiiiiii!,:- .^.C^WI
LSM Prototype Magnet Requirements, Design
TASK
REQUIREM
thrust
operation
Cooling
DESIGN
conductor
winding
Magnet for Exptrimtntal Proof of tht Linear Synchronous Motor Schtmt with tht EET in Rolling Mode
ENTS
energy
I He
• i20kN(1.43mpolep>rcM
• banking 0... 4$*; normal/ lateral acceleration 20/iSm/j3
• dynamics: see EET lift magnets
• IHe bath. GHe shield • rtservoir good for > 3 hours
• Cu:NbTi»5 • 1000 A rated. 2080 A critical current at 4.2 K; 4.5 T
• 2 circular pole coils; 1.2 mø • LHe transparent • 2<1.05MAMMF • S3 A/mm3 overall current density
• two coils in series persistent mode
• mechanical switch
• 2-I.IMWsstored
• 2201 total inventory. 901 reservoir
• 3380 kg total • 1400 kg cold
/ upplytomr « EET-freme
1 body, coil« i circular tree*
.1 anoraion anchors 6 LSM winding frame
MEtOT: Shape, dimensions, suspension und position in the EET
I
Energiting of MELOT: circuit, rite lime, short sample characteristic of s.c, load fine (fm,irithrriMElOTMndfne,tfMS„,<ii'atksvrface. mare el MELOT)

-167-
Figure 36 Japanese National Railways Test Vehicle ML-500: 1979
In 1979, both the Japanese test vehicle above and the Siemens vehicle on the previous page operated successfully at high speed after some years of operation at lower speed with earlier models. The ML-500 above ran at over 500 km/hr on the test track. The 7 km long test track was modified to allow thrust to be developed at each side of the carriage instead of in the center as with the ML 500 and a new 44 seat train was first tested in March 1987 to over 400 km/hr at which speed it had to be slowed down because of the short length of track.
The German vehicle developed a thrust of 20 kN up to 120 km/hr. Operating characteristics and magnet sizes are given in the preceding page (Courtesy of Carl Albrecht, Siemens Erlangen Research Center). These parameters are typical of such devices. Following these successful demonstrations, the Siemens work was stopped in favor of a competing scheme using conventional coils and attractive rather than repulsive levitation. This latter work has reached a successful conclusion and a demonstration train has operated.

-168-
Figure 37. The 22m long, 34 kgm, 44 seat Demonstration Carriage of Japanese National Railways. Its first test run was in March 1987. It has been run at over 400 km/hr on the 7 km long track, but could attain higher speeds on a longer track. The levitation and propulsion coils are shown in the cross-sectional view. The principle of the linear synchronous propulsion system is shown at lower right.

-169-
The development of both superconducting repulsive and conventional magnetic systems in Germany and Japan resulted in full scale, successful demonstrations which both countries are continuing. The repulsive systems are intended for very high speed inter-city transport and the attractive systems for lower speed inter-urban or city to airport application. Most recently, several other possibilities have been mentioned, such as utilizing some form of Haglev for increasing the take off speed and reducing runway length for commercial aircraft and for using maglev runways for space vehicle launch. The inter-city systems, if built, would reduce airport crowding and air saturation by commuter planes on short haul routes but the concept faces competition from the established air transport system.
Maglev possibilities were also studied in other countries, such as the USA, Britain, France and the USSR but not reduced to practice. In the U.S. a laboratory scale model, *the Magneplane' was demonstrated by H. Kolm of HIT's National Magnet Laboratory as part of a consortium involving Raytheon and United Engineers and Constructors Inc. supported by the NSF-RANN (Research Applied to National Needs) program. Studies were carried out by Ford and the Stanford Research Institute. Originally, the U.S., France and Britain placed emphasis on TACV (Tracked Air Cushion Vehicles). The U.S. studies, funded at nominal levels by the Department of Transportation (about $78 million between 1966-1973 on TACV) were eventually discontinued; Britain and France opted for high speed trains on wheels on the grounds that their speeds were adequate for their relatively short inter-city runs.
Sea borne systems are based on the concept of electric drives to ease problems in ship design; the Normandie was such a ship, or on the application of MHD, using sea water as the driving fluid and the ship's hull as the MHD duct. In the former case, the drive motors would use superconducting windings. First investigated by IRD (International Research and Development Company) in England, the work was abandoned, when Government funding was withdrawn In the U.S., studies continued and a small, US Navy experimental ship has undergone successful trials for some years.
Thus superconducting applications to transportation have received attention over the years but, in spite of demonstrated success for both land and sea technologies, they have not been adopted by society. The replacement of the low temperature superconductor by the ceramic conductors, if and when feasible, will have little impact on whether or not such systems are adopted on a societal scale. However, the excitement caused by the advent of the new superconductors and the attention they have received from those responsible for funding military and space programs may help to accelerate demonstration and adoption at some time in the future.

-170-
NIOBTUM AMD HELIUM MEEDS FOR THE NEXT DECADE
NIOBIUM DEMAND TO 1998
In spite of all the efforts, achievements and publicity over the years, the world superconductor industry is very small and likely to remain so to the turn of the century. Until the advent of MRI in 1982 the activity was supported mainly by long term R&D in Government laboratories. The first need was in high energy physics and successes here led to use in fusion and MHD development programs. The current and projected distribution of effort can be understood by considering the need for niobium in superconductor application over the next few years.
Apart from the proposed SSC, even large superconductor projects need relatively small amounts of niobium and hence, superconductor. Thus, the proposed demonstration energy storage project for Wisconsin now under study would have a stored energy of 100 to 200 times the stored energy of MFTF-B, the largest system so far built (exclusive of the 2,000 magnet Tevatron system), but would need only about 10 tonnes of niobium. This quantity can be considered to be covered in the uncertainty of the scenarios presented here. Developments in high temperature superconductivity are not likely to have sigificant impact on this demand in the next few years.
The probable weight of niobium contained in alloys used for superconducting applications over the next ten years is likely to be around 500 to 1100 tonnes. The lower demand total assumes that around 150 tonnes each will be needed for diagnostic imaging and rf cavities, about 100 tonnes for physics machines and devices, and the remainder for all other applications. The higher total demand assumes that the proposed colliders will be approved and need about an additional 500 - 600 tonnes.
The weights of niobium given here, are for niobium contained in the alloys actually installed in equipment. No attempt was made to extrapolate demand for high purity niobium sheet in rf cavities beyond five or six years. No allowance is made here for wastage at various stages of production, either of the pure niobium, the alloy or final sheet or conductor. Amounts needed for electronics are comparatively small (grams/device): if the new high temperature superconductors replaced the low temperature material in all projected electronic applications foreseen today, the impact on niobium demand would be negligible.
The world-wide superconducting industry seems insignificant compare with steel or even niobium. Niobium consumption in the steel industry, where it is used in small percentages as an additive, is around 15 to 17 thousand tonnes/yr world wide as opposed to the averages of 50-110 t/yr of our scenarios for superconducting applications.

-171-
Niobiun DeHand/yp: AH technologies No SSC etc.
Years 1988-1998 AD
138-121-111-m-
91-I (I-51-41-31' 21' II
e
Niobiun DeMand/yp: AH technologies Includes SSC,LHC etc
MPT
»Physics
• R f
•Industry
88 89 98 91 92 93 94 95 96 97 98
Years 1988-1998 AD
Figure 38 Annual Niobium Demand for Superconductor Application: with and without the proposed Physics Colliders.

- 1 7 2 -HISTORY OF THE U . S . HELIUM CONSERVATION PROGRAM
< • • • • • • • • • » • <*t% • • • • • • *» • • • •
vtAn
U.S. He'.iun Supply-Denand Balance
& u
o
o u z o •J
B1L
48-1
38-
28-
18"
8"
-18-
-28-1988 199B 1992 1994 1998 1998 2666 2882
Figure 39 a) History of the U.S. HELIUM CONSERVATION PROGRAM b) Projected U.S. Helium Supply - Demand Balance
to 2002 AD without Policy Changes
HELIUM DEMAND
Over the last few years, helium demand has escalated at 10%/yr, and supply to meet this demand has been possible only because of withdrawals from the helium storage reservoirs of the US helium conservation program. By the turn of the century, demand will exceed supply unless an enlightened management approach is taken to this problem. Availability of helium is no problem, but the richest sources (from natural gas with a helium content of 0.3% or more) are almost completely used. Helium extraction from less rich sources will be increasingly expensive. This could be one incentive to develop and apply the new superconducting materials.
iDemnd
iSupply-Demawf

-173-
COHDDCTOR HEEDS: SOPERCOWDOCTOR APPLICATIONS
The question of conductor availability and fabrication arises in connection with the quest to reduce the new superconducting high temperature materials to practicality. One question is, what can be learned from the low temperature superconductor experience? Niobium titanium, the present workhorse of the industry is a ductile metal, easily bonded to copper or aluminum to provide shunt current protection if the superconductor is driven into the normal state. It can be coextruded with copper, assembled into billets containing thousands of fine niobium rods, drawn into long lengths to produce uniform filaments in diameter ranges from less than one micron to any diameter above that and twisted to reduce coupling between the filaments..
The very finest filaments are needed for ac applications where the ac losses must be kept to the lowest possible value. In physics colliders, filament diameters of around 5 microns are desirable to reduce magnetization at low injection fields which produces slight, but unacceptable field errors in the small bore magnet which guide and focus the particles in their orbits. Because of the high fields which are needed (6.6T in the SSC and possibly as high as 10T in the proposed CERN-LHC), very high current densities are essential to reach such high fields in small bores and intense stresses are induced in the conductor at these field intensities. In the larger, smaller field(0.5-2T), whole body MRI coils, the need is for very long lengths of conductor with precise control of wire diameter to obtain very high field uniformity over relatively large volumes in the •agnet bore: the individual multifilaments can be larger and very much smaller in number.
In the large MHD and fusion coils, the need is for conductors of high strength, cryogenic stability, and current carrying capacities in the range of 10,000 to 20,000 A or more at peak fields around 7 T for MHD and 10 to 20 T in fusion. In these large coils, and in the very highest field small coils, the windings may be stress limited rather than field or current limited.
At p.isent, Nb3Sn and V3Ga are being explored as candidates for the highest field coils. Vanadium gallium has been used in only very small quantities above 16 T in small bore coils. These materials resemble the new ceramics in being brittle. However the starting materials are metals: thus fabrication processes common to handling metals can be used before firing to produce the final superconducting wire or tape. This is not the case with the new ceramics. Fabrication techniques for producing practical ceramic superconductors represent a new and different discipline.!

-174-
COST CONSIDERATIONS
One of the great incentives for the applying the new superconductors is said to be that of great savings in refrigeration and hence, of cost. Until we have some practical ceramic conductors of acceptable specification and proven performance for a specific application this remains to be seen. Operating cost is only one element of total cost and in large systems, the cost of capital may be one of the greatest factors. In the previous text some comments on cost have been included (eg. Table 7,p 46 gives some estimated MHD Magnet Production Costs).
Even total elimination or the refrigeration, implying room temperature superconductivity, is scarcely a significant factor. However, in nest instances, the reason for using superconductors in the first place was the actual significant savings in cost, sometimes translated as making something technically and economically feasible which would have been out of the question if conventional technology were the only possibility. Such was the case with the bubble chambers, the Tevatron, the higher field (>0.3 T) whole body MRI systems and high field laboratory magnets. By comparison, the change to liquid nitrogen refrigeration is marginal.
It is too early to compare raw material or superconductor costs because no practical high field/high current/high temperature superconductors have been fabricated. Niobium prices have remained constant for some years, in terms of Swiss francs. Raw material prices for the new ceramics vary by about two orders of magnitude in this early discovery and production stage.
Table 8 - Proposed SSC COSTS
$BILLION
TOTAL (LAND DONATED) 5.4 COLLIDER 3 MAIN RING DIPOLES 0.7 DIPOLE + QUADRUPOLE CONDUCTOR 0.3 ie. 10% collider t 6% total cost CRYOGENICS (2% total cost) 0.12
Contingency costs
TECHNICAL COMPONENTS 0.3 COLLIDER RING 0.25 MAGNETS 0.2 THUS cryogenics and magnets are less than contingency costs: HTSC's would make little difference to cost.

- 1 7 5 -
Tablc 9 - magnetic Basonanc* Imagingt Cost and naiiwrl Scenario; 19M-199S
M 09 90 91 92 93 94 95 9C 97 90
ttic Kesoaaac« Systaasl0%/yr 275 302 333 3CC 403 443 407 S3C 509 C40 713
K* Sys Caamlati'V* 1275 1577 1910 227C 2C79 3122 3C09 4145 4734 5303 C09C •b/yrftoaaes) 0 9 9 10 11 13 14 15 17 10 20 TOtal Mb ftl 0 17 2C 3C 40 CO 74 90 IOC 125 145
Kb/yr,SKillioa i Coil aalaa/yr SK 57 aaamets/yr 95 Syetoa salas/yr,SV 212
•T cavities(Mi-parity a Wb «t t/yr 20 Ci—ilatjye rf ab 20
Zadastry/mtD Ob/yr 2 cnaalatiTc 2
l C2 104 233
CCS
haati 30 50
3 S
1 C9 114 257
732
30 00
3 0
1 75 12C 202
•OS
30 110
3 12
1 03 139 310
M C
30 140
4 15
1 91 152 341
974
2 142
4 19
1 100 IC« 37«
1072
2 144
4 23
2 110 104 413
1179
2 14C
5 2«
2 121 203 454
1297
2 14«
5 33
2 134 223 500
1427
2 150
5 30
2 147 245 550
15C9
3 153
C 44
10%/yr growth rata c 20.4kgm ab/arerage m x «ait
Makers costs: Nb - $128/kilo; 2T coil - $206K; Magnet - $344K, Systea - $771K; End user systea cost - $2.2M
This tabulation (to the nearest whole nuaber 4 averaging niobiua weight for a wide range of aagnet systea) assuaes only 2T aagnets. Since aany systeas use 0.5T at present, the table is optiaistic in tens of niobiua weights and expenditures. However, 2T and even higher systeas aay coae into use if MRS is widely adopted. The table explains soae of the ayths of estiaates for superconductor application totaling $Bil lions. Exaaing 1998 we see that Mb sales could be $2 million for 147 systea sales, with an installed aarket of 6100 systeas. The coils sales cost would be $147 million, aagnets $245 ail lion, systeas $550 aillion, end user expenditures $1.6 billion.
At 2000 scans/yr/installation 12 »ill ion scans/yr would be perforaed at a cost to patients of $6-12 billion assuaing costs/scan to average $500-1000. Hospital and physicians fees at say $300/scan would be in the range of $3 billion.
Thus in estimating the aarket for superconductor technology it is important to distinguish between the various levels in the supply chain. $2 aillion for the niobiua contrasts aarkedly with a societal cost of up to $12 billion.

-176-
POWER TRANSMISSION
In their papers on power transmission, E. Forsyth and R. Thomas have made the following observations.
Lord Kelvin was the first to point out that the choice of conductor size for a transmission system is determined by the minimum annual operating cost obtained by summing the annual cost of losses in the conductor and the annual cost of capital. This is never the condition of minimum energy loss!
The sources of loss in AC superconducting power transmission lines are:-
1. Conductor: hysteretic, eddy current, resistive. 2. Insulation: ac dielectric loss 3. Heat leak.
These losses are removed as heat by the refrigerator. In the case of large efficient refrigerators, the amount of electrical energy to remove 1 watt «-»f heat at low temperature is:-
300Watts/watt at 4.2 K; 200W/W @ 7 K & 10W/W @ 77 K.
Note that the Brookhaven Demonstration SC line operated at 7 K.
A serious study of Bulk Power Transmission comparing 16 different technologies was that by the Philadelphia Electric Company in 1977 for the US DOE. This system was required to carry 10,000 MVA over a distance of 66 miles through Pennsylvania to Philadelphia. BNL chose a 3 circuit 230kVA system in which each circuit has a contingency rating of 5,000 MVA *:o guarantee reliability. This SC system was rated in top three preferred designs. However it was not competitive with overhead lines. The final transmission cost comparisons for transmission losses were:-
230 kV Superconducting - 0.346 cents/kWhr 500 kV HPOPT cellulose - 0.605 cents/kWhr 500 kV Aerial/Underground - 0.208 cents/kWhr
Superconducting Power Transmission is technically feasible. Many problems must be overcome before the new ceramics can be considered for this purpose. The most economic system may not be that with lowest loss. Superconducting power transmission is not lossless. The costs of a new demonstration system would be less than those used in these studies because of the experience gained in its development. Helium cost was about 3% of total system cost for the BNL line Using cost figures from the previous line, a line with ceramic superconductors of equivalent performance and co.3t might reduce overall system costs by 23%. Much more information is needed for a true comparison.

-177-
CONCUUSIONS
A sophisticated superconducting electrotechnology has been developed over the last 25 years. The high temperature superconductors of today represent an evolution, not a revolution. Room temperature superconductors are *Pie in the Sky' at present. The technology has not received widespread societal use for reasons that have nothing to do with the need for liquid helium.
The high temperature superconducting materials of today have adequate properties for use in low power, low magnetic field electronic applications: critical temperatures and magnetic fields far surpass anything we have had previously, but the critical currents are orders of magnitude too low for most magnet and power applications so far conceived. Nitrogen cooled operation (ie. around 77 K) offers the prospect of cheaper, simpler and more reliable systems. However, cryopumping is lost at liquid nitrogen temperatures and some systems such as power transmission lines would need some system to provide the needed thermal isolation for low heat leak.
In MRI, low temperature superconductivity extended the possibilities of the new technology: the new materials may simplify refrigeration and reduce cost/scan by about 6%. Machines such as the Supercollider would not have been contemplated without superconductivity; however the low temperature helium provides cryopumping for the high vacuum system: this would be lost with high temperature superconductors. A similar situation exists in magnetic fusion where the cryopumping helium removes the helium ash of the reaction.
The prospects for magnetic fusion or commercial MHD power plants are not dependent upon superconducting electrotechnology and higher temperature operation would have marginal impact on life cycle cost. Similar reasoning applies to bulk electrical power transmission.
Many problem areas in the development and processing of high temperature superconductors need resolution. The search for new materials which extend the high temperature range to room temperature operation should continue. A thorough theoretical and experimental understanding of the new materials is needed. Many processing problems remain to be solved, both for thin films and the bulk conductors needed in magnet and power applications.
Given suitable conductors, possibilities for application should be explored as quickly as possible. Nitrogen is plentiful and cheap, helium will become increasingly expensive by the turn of the century when there will be a need to develop new sources of supply. This is an added incentive to pursue high temperature superconductor application with vigor and determination.

-178-
Thus - in summary:-
Superconducting coils permit continuous DC operation at zero energy loss: with superconducting interconnections they operate as permanent magnets. They offer large cheap high intensity fields in large volumes, if needed.
High temperature superconducting materials cost as much as low temperature materials at present; in fact, the spread in price is at least one order of magnitude for the high temperature materials. High temperature conductors do not yet exist and hence no estimate of cost can be made.
MRI:- Room temperature operation would save 12%/scan; all other factors being equal. Liquid nitrogen temperature operation would save an intermediate amount.
RF cavities are a good bet for high temperature superconductor use if the problems can be solved..
MHD & FUSION:- Refrigeration is about 1.8% of system cost. They might never come to be used in Utility systems.
SSC:- Refrigeration is 2% of total cost; less than magnet contingency. It could be the last big collider.
Transmission:- Savings with high temperature superconductors indeterminate at present: needs time and study.
AC uses are promising for the low temperature materials. It is not known what the new high temperature materials have to offer as yet.
FUTURE WORK
CONTINUE LTSC DEVELOPMENT AND APPLICATION
CONTINUE HTSC MATERIALS DEVELOPMENT
CONTINUE THEORETICAL STUDIES OF HTSC
CONTINUE EXPERIMENTAL STUDIES OF HTSC
APPLY PRESENT HTSC'S IN ELECTRONICS WHEN POSSIBLE
HTSC RF CAVITY DEVELOPMENT COULD BE PROMISING
FABRICATE HTSC MAGNET CONDUCTORS

-179-
GENERAIi REFERENCES
The literature on superconductivity is voluminous. Applications are treated extensively in the proceedings of various topical conferences. These include:
1. The Cryogenic Engineering Conference Series published by Plenum Press.
2. The Applied Superconductivity Series: published as IEEE Transactions on Magnetics since the 1974 conference.
3. The Proceedings of the International Conferences on Magnet Technology series. These have been published in various ways depending on the host institution. MT-9 (1985) was published by SIN - The Swiss Institute for Nuclear Research.
4. The Proceedings of the International Cryogenic Engineering Conferences , beginning in 1967, now published by Butterworths.
5. The Proceedings of the Particle Accelerator Conferences, published as IEEE Nuclear and Plasma Sciences volumes.
6. The Proceedings of the Symposia on Engineering Problems of Fusion Research, published by the IEEE.
Note: A complete listing would take a separate volume!
ACKNOWLEDGEMENTS
The information presented in this paper has been derived from a large number of friends over the 'ears. We have also drawn on material provided by members oi the Hulm Panel on High Temperature Superconductivity whose report was published by the U.S. Academy of Sciences in September 1987. Staff members of Westinghouse Research, Brookhaven Laboratory, the SSC Central Design Group and associated organizations and many others contributed papers and photographs as needed. We thank them all for their generous help.

- 1 8 0 -
0 - "
CHAPTER7
SQUID CONCEPTS AND SYSTEMS
John Clarke
Department of Physics, University of California and
Materials and Chemical Sciences Division, Lawrence Berkeley Laboratory Berkeley, California 94720
L INTRODUCTION
Superconducting QUantum Interference Devices (SQUIDs) are the most sensitive detectors of magnetic flux currently available. They are amazingly versatile, being able to measure any physical quantity that can be converted to a flux, for example, magnetic field, magnetic field gradient, current, voltage, displacement, and magnetic susceptibility. As a result, the applications of SQUIDs are wide ranging, from the detection of tiny magnetic fields produced by the human brain and the measurement of fluctuating geomagnetic fields in remote areas to the detection of gravity waves and the observation of spin noise in an ensemble of magnetic nuclei.

- 1 8 1 -
SQUIDs combine two physical phenomena, flux quantization, the fact that the flux O in a closed superconducting loop is quantized1 in units of the flux quantum O0 = h/2e = 2.07 x 10¹⁵ Wb, and Josephson tunneling2. There are two kinds of SQUIDs. The first3, the dc SQUID, consists of two Josephson junctions connected in parallel in a superconducting loop, and is so named because it can be operated with a steady current bias. The second4,5, the rf SQUID, involves a single Josephson junction interrupting the current flow around a superconducting loop, and is operated with a radiofrcquency flux bias. In both cases, the output from the SQUID is periodic with period 4>0 in the magnetic flux applied to the loop. One generally is able to detect an output signal corresponding to a flux change of much less than one flux quantum.
In this chapter I try to give an overview of the current state of the SQUID art I cannot hope to describe all of the SQUIDs that have been made or, even less, all of the applications in which they have been successfully used. I begin, in Sec. n, with a brief review of the resistively-shunted Josephsoii junction, with particular emphasis on the effects of noise. Section 1H contains a description of the dc SQUID: how these devices are made and operated, and the limitations imposed by noise. Section IV contains a fimilar description of the properties of if SQUIDs, but because there has been little development of these devices in the 1980*s, I shall keep this section relatively brief. In Sec.V, I describe a selection of instruments based on SQUIDs and mention some of their applications. Section VI contains a discussion of the impact of high temperature superconductivity on SQUIDs, and of future prospects in this area, while Sec.VII contains a few concluding remarks.
H. THE RESISTWELY SHUNTED JUNCTION
A Josephson junction2 consists of two superconductors separated by a thin insulating barrier. Cooper pairs of electrons (or holes) are able to tunnel through the barrier, maintaining phase coherence in the process. The applied current, I, controls the difference 8 = <(>,- fo between the phases of the two superconductors according to the current-phase relation
I = I0sin5, (2.D
where Iøis the critical current, that is, the maximum supercurrent the junction can sustain. When the current is increased from zero, initially there is no voltage

-182-
across the junction, but for I > IQ a voltage V appears, and 5 evolves with time according to die voltage frequency relation
6 = 2eVm = 2*VM>0. (2.2)
A high quality Josephson tunnel junction has a hysteretic current-voltage (I - V) characteristic. As the current is increased from zero, the voltage switches abruptly to a nonzero value when I exceeds IQ, but returns to zero only when I is reduced to a value much less than IQ. This hysteresis must be eliminated for SQUIDs operated in die conventional manner, and one does so by shunting die junction with an external shunt resistance. The "resistively shunted junction" (RSJ) model6J is shown in Fig.l(a). The junction has a critical current Io and is in parallel with its self-capacitance C and with its shunt resistance R, which has a current noise source IN (t) associated with it The equation of motion is
CV + I0sin5 + V/R = I + IN(t). (2.3)
Neglecting the noise term for die moment and setting V = fiS /2e, we obtain
2 e d + 2eR* i i • x 2 £ d u
(2.4)
(a)
U
18 R< k T C Y
U(«)
ZU
(c)
I < « 0 !>>o
< 6 > > 0
Fig. 1(a) The resistively shunted Josephson junction; (b) and (c) show the tilted washboard model for I < Io and I > IQ.

- 1 8 3 -
where
U = -^a6>Iocos5) . (2.5)
One obtains considerable insight into die dynamics of the junction by realizing that Eq. (2.4) also describes the motion of a ball moving on the "tilted washboard" potential U. The term involving C represents the mass of the particle, the 1/R term represents the damping of the motion, and die average "tilf of the w Jiboard is proportional to -I. For values of I < I©, the particle is confined to one of the potential wells [Fig. 1(b)], where it oscillates back and forth at the plasma frequency1 ©p = ( 2jd0/O0C)1/2 [1- ( l /y 2 ] 1 ' 4 . In this state <é> and hence the average voltage across the junction are zero (< > represents a time average). When the current is increased to I©, the tilt increases, and when I exceeds Io, the particle rolls down the washboard; in this state <&> is nonzero, and a voltage appears across the junction [Fig. 1(c)]. As the current is increased further, <5> increases, as does V. For die nonhysteretic case, as soon as I is reduced below IQ the particle becomes trapped in one of die wells, and V returns to zero. In this, the overdamped case, we require6«7
pc s (2xIoR/<l\>)RC = aftRC S 1; (2.6)
©j / 2K is the Josephson frequency corresponding to the voltage IQ R. We introduce the effects of noise by restoring die noise term to Eq. (2.4)
to obtain die Langevin equation
^ 5 + ^ é + Iosin6 = I + lN(t). (2.7)
In the thermal noise limit, die spectral density of I^t) is given by the Nyquist formula
S,(f) = 4kBT/R, (2.8)
where f is die frequency. It is evident that I^t) causes die tilt in die washboard to fluctuate with time. This fluctuation has two effects on the junction. First, when I is less than IQ , from time to time fluctuations cause the total current I + IN(t) to exceed I©, enabling the particle to roll out of one potential minimum into die

-184-
next For the underdamped junction, this process produces a series of voltage pulses randomly spaced in time. Thus, the time average of the voltage is nonzero even though I < I0, and the I - V characteristic is "noise-rounded" at low voltages.8 Because this thermal activation process reduces the observed value of the critical current, there is a minimum value of Io for which the two sides of the junction remain coupled together. This condition may be written as
IØGOÆK * 5keT, (2.9)
where IQQ0/2]C is me coupling energy of the junction2 and the factor of 5 is the result of a computer simulation9. For T = 4.2K, we find 1Q>0.9UA.
The second consequence of thermal fluctuations is voltage noise. In the limit pc « 1 and for I > IQ, the spectral density of this noise at a measurement frequency fm that we assume to be much less than the Josephson frequency f, is given by10«11
S#J -Mffi^tf « 1 >Io « f jJ
(2.10)
The first term on the right-hand side of Eq. (2.10) represents the Nyquist noise current generated at the measurement frequency fa flowing through the dynamic resistance Rj = dV/dl to produce a voltage noise - see Fig. 2. The
%(!)*
4keT
1 " » f= - f - -f, + i • j T -m
m
r"
21, f
Fig. 2 Schematic representation for the noise terms in Eq.(2.10). The Nyquist noise generated in the resistor at frequency fm contributes directly at fm; that generated at fj ± fm is mixed down to fm.

- 1 8 5 -
second term, (1/2X1« / I)2(4kBT/R) R^ represents Nyquist noise generated at frequencies fj± fa mixed down to the measurement frequency by the Jbsephson osciUatkittsandteinbeicttnoiilinearityofQ^ The factor (1/2X1*/I)2
is the mixing coefficient, and it vanishes for sufficiently large bias currents. The mixing coefficients for the Nyquist noise generated near harmonics of die Josephson frequencies, 2f„3f„—, are negligible in the limit f a / f j « l .
At sufficiently high bias current, the Josephson frequency f, exceeds k»T/h, and quantum corrections12 to Eq. (2.10) become important, provided die term (1/2X1« /1)2 is not too small. The requirement for observing significant quaiitum corrections is eI«R / ksT >> 1. The spectral density of the voltage noise becomes
P c « l l I > lo \ (2.11)
f- « f J
where we have assumed that hfa/k|T « 1, so that die first term on the right-hand side of Eq. (2.11) remains in die ihcimal hunt. In die limit T —> 0, die second term, (2eV/R) (L/I^R*, represents noise mixed down from zero point fluctuations near the Josephson frequency.
This concludes our review of the RSJ, and we now turn our attention to the dc SQUID.
m. THE DC SQUID
A. A First Look The essence of die dc SQUID3 is shown in Hg. 3(a). Two junctions are
conriectedmpaialklonasupeiconouctingloopoi^ Each junction is resistively shunted to eliminate hysteresis on the I -V characteristics, which are shown in Fig. 3(b) for O = n$9 and (n +1/2)4,, where O is the external flux applied to the loop and n is an integer. If we bias die SQUID with a constant current (> 2 IQ ), the voltage across die SQUID oscillates with period <t>0as we steadily increase Q, as indicated in Fig. 3(c). The SQUID is generally operated on the steep part of the V - 4> curve where the transfer
Sv(U = [ ^ +2 ^ M å K

-186-
Fig. 3(a) The dc SQUID; (b) I-V characteristics; (c) V vs. 4>/4>b at constant bias current IB-
coefficient, V*= |(dV/d 4>)i|, is a maximum Thus, the SQUID produces an output voltage in response to a small input flux $ $ ( « $ • ) , and is effectively a flux-to-voltage transducer.
Before we give a detailed description of the signal and noise properties of the SQUID, it may be helpful to give a simplified description that, although not rigorous, gives some insight into the operation of the device. We assume the two junctions are identical and arranged symmetrically on the loop. We further assume, for simplicity, that the bias current is swept from zero to a value above the critical current of the two junctions at a frequency much higher than d4>/4>odL In the absence of any applied flux (or with 4> = n O0 ) , there is no current circulating around die loop and the bias current divides equally between the two junctions. The measured critical current is 21* (if we ignore noise rounding). If we apply a magnetic flux, <J>, the flux in the loop will be quantized and will generate a current J = -<I> / L, where we have neglected the effects of the two junctions [Figs. 4(a) and (b)]. The circulating current adds to the bias current flowing through junction 1 in Fig. 4(a) and subtracts from that flowing through 2. In this naive picture, the critical current of junction 1 is reached when 1/2 + J = I0, at which point the current flowing through junction 2 is I0 - 2J. Thus, the SQUID switches to the voltage state when I = 2I0 - 2J. As 4> is increased to 4>0/ 2 , J increases to 4>0/2L [Fig. 4(b)], and the critical current falls to 2IQ - 4>, / L [Fig. 4(c)). As the flux is increased beyond <t>0 / 2, however, the SQUID makes a transition from the flux state n = 0 to n = 1, and J changes sign [Fig. 4(b)]. As we increase <X> to 4>0, J is reduced to zero and the critical current

-187-
(a) (b) (c)
Fig. 4 Simplistic view of the de SQUID: (a) a magnetic flux Q genernes a circulating current J that is periodic in • as shown in (b); as a result (c), the maTimnrn mpeicuiient ! • is also periodic in • .
is restored to its maximum value I« = 21« [Hg. 4(c)]. In this way die critical cmrent oscillates as a function of • .
Continuing with our simplified model, we see that the voltage change acioss die SQUID (at the peak of the current sweep) as we change O from 0 to 4* / 2 is AV « (Gb / L )R/2, where R/2 is die pamDel resistance of die two shunts. Hence, V*=AV/ («W2) = R/L.
We also can estimate the equivalent flux noise of die SQUID. If the noise voltage across die SQUID is VN(t) with a spectral density Sv(f). the conespondmg flux noise referred to die SQUID loop is just
S4(f) = Sv(iyvi . (3.1)
A convenient way of characterizing the flux noise is in terms of die noise energy per unit bandwidth,
e(f) = S«(f)/2L. (3.2)
If we assume that the noise in the SQUTD is just die Nyquist noise in the shunt resistor with spectial density 41CBT (R/2), we find etøsksTL/R. Although these results are not quantitatively correct, they do give the correct scaling with the various parameters. For example, we see that to lower e(f) we should reduce T

-188 -
and L while using the largest possible value of R subject to me I - V characteristic remaining nonhysteretic.
Exact results fix the signal and noise can be obtained only from computer shnulation The results show that the plots of me cticulating superament and the critical current vs. Q become smoothed. Furthermore, the noise voltage is higber than Nyquist noise because of mixed-down noise; unfortunately the magnitude of this noise cannot be obtained analytically.
One final remark is appropriate at this point. To observe quantum interference effects, we require the modulation depth of the critical current, o / U to be much greater than the root mean square noise cunent in theloop,<r^>uz = (kBT/L)1A. This coalition can be written L < <fcJ/5k,T, where die factor of 1/5 is the result of a computer analysis9. ForT = 4.2K,we fmdL< 15 nH.
B. Thermal Noise in die SQUID: Theory A model for noise calculations is shown in Rg. 5. This figure shows two
independent Nyquist noise currents, ^ ( t ) and 1^(0, associated with the two shunt resistors. The phase differences across the junctions, Sfi) and 52(t)t obey die following equations:13-"
v=£(é1+é2), 0.3)
Fig.5 Model of dc SQUID showing noise sources associated with the shunt resistors.

-189-
2icL i ' ~ «i»o J = ^ - f 5 , - 6 2 - 2 ^ ) (3.4)
2e~ 81+2^ 61 = 2 " J ~ I o s m 5 i + INi» <3-5>
and
2e ^2 + 2éR ^2 = 2 + J - I n S m 5 2 + IN2- (3.6)
Equation (3.3) relates the voltage to the average rate of change of phase; Eq. (3.4) relates the current in the loop, J, to 8j - $2 an^t0 ^ an(^ ^ s - @.5) and (3.6) are Langevin equations coupled via J. These equations have been solved numerically for a limited range of values of the noise parameter r = 2ftkBT/I0O0, reduced inductance p = 2 Lin / 4>0 and hysteresis parameter Pc For typical SQUIDs in uV 4He temperature range, r = 0.05. One computes die time-averaged voltage V vs. O, and hence finds V 0 , which, for a given value of <&, peaks smoothly as a function of bias current The transfer function exhibits a shallow maximum around (2n +1) 4>0 / 4. One computes the noise voltage for a given value of $ as a function of I, and finds that the spectral density is white at frequencies much less than die Josephson frequency. For each value of 4>, the noise voltage peaks smoothly at the value of I where V$ is a maximum. From these simulations, one finds that the nois-5 energy has a minimum when (3 * 1. For P - 1, T = 0.05, <D = (2n + 1) O 0 / 4 and for the value of I at which V* is a maximum, the results can be summarized as follows:
V*»R/L, (3.7)
Sv(f)»16kBTR, (3.8)
and
e(0 * 9kBTL/R. (3.9)

- 1 9 0 -
We see that our rough estimate of V^ in Sec. IEA was rather accurate, but that the assumption mat the noise spectral density was given by the Nyquist result underestimated the computed value by a factor of about 8.
It is often convenient to eliminate R from Eq. (3.9) using the expression R=s(PcO0/2id0C)1>2. We find
e(f)*16kBT(LC/pc)»/2. (pc<l) (3.10)
Equation (3.10) gives a clear prescription for improving the resolution: one should reduce T, L and C. A large number of SQUIDs with a wide range of parameters have been tested and found to have white noise energies generally in good agreement with the predicted values. It is common practice to quote the noise energy of SQUIDs in units of li (= 10**} sec = lO^JHr1).
In closing this discussion, we emphasize that although e(f) is a useful parameter for characterizing the resolution of SQUIDs with different inductances, it is not a complete specification because it does not account fully for the effects of current noise in the SQUID loop. We defer a discussion of this point to Sec. V.D.
C Practical dc SQUIDs Modem dc SQUIDs are invariably made from thin films with the aid of
either photolithography or electron beam lithography. A major concern in the design is the need to couple an input coil inductively to the SQUID with rather high efficiency. This problem was elegantly solved by Ketchen and Jaycox,16,17
who introduced the idea o« depositing a spiral input coil on a SQUID in a square washer configuration. The coil is separated from the SQUID with an insulating layer. The version18 of this design made at UC Berkeley is shown in Fig. 6. These devices are made in batches of 36 on 50mm diameter oxidized silicon wafers in the following way. First, a 30nm thick Au (25 wt % Cu) film is deposited and patterned to form the resistive shunts. Next, we sputter a lOOnm thick Nb film and etch it to form the SQUID loop and a strip that eventually contacts the inner end of the spiral coil Hie third film is a 200 nm SiO layer with 2 ujn diameter windows for the junctions, a larger window to give access to the CuAu shunt, and a window at each end of the Nb strip to provide connections to the spiral coil. The next step is to deposit and lift off the 300 nm thick Nb spiral coil, which has 4, 20 or 50 turns. At this point, we usually dice the wafer into

- 1 9 1 -
Nb-»
tOO/i>.-\
\Oftm
Windows — { ? mS.O g
^5fø
CuAu Shunts
/
/
Nb
Pb
(a) (b)
Fig .6 (a) Configuration of planar dc SQUID with overlaid spiral input coil; (b) expanded view of junctions and shunts.
chips, each with a single SQUID which is completed individually. The device is ion milled to clean the exposed areas of Nb and CuAu. We have two procedures for forming the oxide barrier. In one, we oxidize the Nb in a rf discharge in Ar containing 5 vol % 02 , and deposit the 300 nm Pb (5wt % In) counterelectrode which completes the junctions and makes contact with the shunts. In the other process, we deposit approximately 6 nm of Al and form A1203 by exposing19 it to O2. A photograph of the completed SQUID and a scanning electron micrograph of the junctions is shown in Fig. 7. The shunt resistance R is typically 8 fi, and the estimated capacitance C about 0.5 pF.
Jaycox and Ketchen17 showed that a square washer (with no slit) with inner and outer edges d and w has an inductance L (loop) = 1.25^(1 in the limit w » d. They gave the following expressions for the inductances of the SQUID, L, and of the spiral coil, Li, and for the mutual inductance, Mi, and coupling coefficient, a2, between the spiral coil and the SQUID:
L = L (loop) + Lj,
Li = n2 (L-Lj) + Ls,
(3.11)
(3.12)

- 1 9 2 -
Fig.7(a) Photograph of planar dc SQUID made at UC Berkeley, with 4-tum input coil; the square washer is about 1mm across, (b) Electron micrograph of junctions prior to deposition of counterelectrode; each junction is about 3um across.
Mj = n(L-Lj) (3.13)
and
o* = (1-L,/L)/ [HLjaPQAj]. (3.14)

- 1 9 3 -
Here, Lj is me parasitic inductance associated with the junctions, nis the number of Dims oftheinputcoflandl^isthestr^hMiiiductanceof this coil. For the SQUID just described with a 50-turn input coil, one measures Li= 800 nH, Mi s 16 nH and a2 = 0.7S. These results are in good agreement with die predictions of die above expressions if one takes die predicted value Lfloop) = 0.31 nH and assumes Lj •» 0.09 nH to give L = 0.4 nH. The stripline inductance (~10 nH) is insignificant for a 50-tum coil.
References 20-25 are z selection of papers describing SQUIDs fabricated on the basis of the Ketchen-Jaycox design. Some of die devices involve edge junctions in which the counteretectrode is a strip making a tunneling contact to the base electrode only at the edge. This technique enables one to make junctions with a small area and thus a small self-capacitance without resorting to electron-beam lithography. However, stray capacitances are often critically important. As has been emphasized by a number of authors, parasitic capacitance between die square washer and the input coil can produce resonances that, in turn, induce structure on die I-V characteristics and give rise to excess noise. One way to reduce these effects is to lower the shunt resistance in order to increase die damping. A different approach is to couple die SQUID to the signal via an intermediary superconducting transformer24, so that die number of turns on die SQUID washer and die parasitic capacitance are reduced. Knuutila elai.25
successfully damped die resonances in die input coil by terminating die stripline with a matched resistor. An alternate coupling scheme has been adopted by Carelli and Foglietti26, who fabricated thin-film SQUIDs with many loops in parallel. The loops are coupled to a thin-film input coil surrounding diem.
D. Flux-locked Loop In most, although not all, practical applications one uses die SQUID in a
feedback circuit as a null detector of magnetic flux27. One applies a modulating flux to die SQUID with a peak-to-peak amplitude <D</2 and a frequency fm usually between 100 and 500 kHz, as indicated in Fig. 8. If the quasistatic flux in die SQUID is exacdy n<D0 die resulting voltage is a rectified version of the input signal, diat is, it contains only die frequency 2fm [Fig. 8(a)]. If this voltage is sent through a lock-in detector referenced to die fundamental frequency fm, die output will be zero. On die other hand, if die quasistatic flux is (n + i/4)4>0> the voltage across die SQUID is at frequency fm [Fig. 8(b)], and die output from die lock-in will be a maximum. Thus, as one increases the flux from nOo to (n + i/4)<J>0, die output from die lock-in will increase steadily; if one reduces die flux from n<Do to (n - i/4)4>o, die output will increase in die negative direction [Fig. 8(c)].

m\.
$-"fo $ « * • ! & > $ ,
Fig. 8 Flux modulation scheme showing voltage across the SQUID for (a) <D = nOo and (b) <& = (n+l/4)Oo. The output VL from the lock-in detector vs. ø is shown in (c).
Lock-in Detector Integrator
Fig. 9 Modulation and feedback circuit for the dc SQUID.
The alternating voltage across the SQUID is coupled to a low-noise preamplifier, usually at room temperature, via either a cooled transformer28 or a cooled LC series-resonant circuit27. The first presents an impedance N2Rdto the preamplifier, and the second, an impedance Q2Rd, where Rd is the dynamic resistance of the SQUID at the bias point, N is the turns ratio of the transformer, and Q is the quality factor of the tank circuit. The value of N or Q is chosen to optimize the noise temperature of the preamplifier, with careful design, the noise from the amplifier can be appreciably less than that from the SQUID at 4.2 K.
Figure 9 shows a typical flux-locked loop in which the SQUID is coupled to the preamplifier via a cooled transformer. An oscillator applies a modulating flux to the SQUID. After amplification, the signal from the SQUID is lock-in detected and sent through an integrating circuit. The smoothed output is connected to the modulation and feedback coil via a large series resistor Rf. Thus, if one applies a flux SO to the SQUID, the feedback circuit will generate an

- 1 9 6 -
opposing flux - 5$ , and a voltage proportional to $<!> appears across Rf. This technique enables one to measure changes in fhix ranging from much less than a single flux quantum to many flux quanta. TheuseofanKxfalatmgfhixeliniinaies 1/f noise and drift in the bias current and preamplifier. Using * modulation frequency of 500 kHz, a double transformer between the SQUID and the preamplifier, and a two-pole integrator, Wellstood eial.1* achieved a dynamic range o f±2x 10⁷Hz^ for signal frequencies up to 6 kHz, a frequency response from 0 to 70 kHz (±3 dB), and a maximum slew rate of 3 x l O 6 ^ sec-'.
E. Thermal Noise in the dc SQUID: Experiment One determines the spectnu density of the equivalent flux noise in the
SQUID by connecting a spectrum analyzer to the output of the flux-locked loop. A representative power spectrum29 is shown in Fig. 10: above a 1/f noise region, the iK)ise is wmte at firequeix^ up to trie roU^ff of tte feedback circuit In this particular example, with L = 200pH and R = 80, the measured flux noise was S^2
s (1.9 ± 0.1) x IO^ODHZ"172, in reasonable agreement with the predictions of Eqs. (3.7) and (3.8). The corresponding flux-noise energy was 4 x 10"32
JHz'1« 400 ft. Many groups have achieved noise energies that are comparable or, with lower values of L or C, somewhat better.
-9 10
~ 10-1°L N X
t io-11
CO io-12h
10 -13
10
—
—
I
I
I I I I
I I I I
—
-
r1 101 102 103
Frequency (Hz) 10< 105
Fig. 10 Spectral density of equivalent flux noise for dc SQUID with a Pb body: L = 0.2nH, R x 8 a and T = 4.2K (courtesy F.C. Wellstood).

- 1 9 6 -
Rather recently, Wellstood eHl 3 0 have operated SQUIDs in a dilation refrigerator at temperatures T below IK , using a second dc SQUID as a preamplifier. They found that the noise energy scaled accurately with T at temperatures down to about ISO mK, below which the noise energy became nearly constant This saturation was traced to heating in the resistive shunts, winch prevented them from cooling nuich below lSQmK. This heating is actually a hot-electron effect31,32 the bottleneck in the cooling process is the rate at winch the electrons can transfer energy to the phonons which^ in turn, transfer energy to the substrate. The temperature of the shunts was lowered by connecting each ofthemt^aCuAu"coolirigfmnoflargevohnne. The hot electrons diffuse into the fins where they rapidly transfer energy to other electrons. Since the "reaction volume" is now greatly increased, the numbers of electrons and phonons interacting are also increased, and die electron gas is cooled more effectively. In this way, the effective electron teinpeiatme was reduced to about 50mK when the SQUID was at a bath temperature of 20mK, with a concomitant reduction in £ to about 5ft. Very recently Ketchen el a].33 have achieved a noise energy of about 26 at 0.3 K in a SQUID with L= 100 pH and C = 0.14 pF.
F. 1/f Noise in dc SQUIDs The white noise in dc SQUIDs is well understood. However, some
applications of SQUIDs, for example neuromagnetism, require good resolution at frequencies down to 0.1 Hz or less, and the level of the 1/f or "flicker" noise becomes very important.
There are at least two separate sources of 1/f noise in the dc SQUID34. The first arises from 1/f fluctuations in the critical current of the Josephson junctions, and the mechanism for this process is reasonably well understood33. In the process of tunneling through the barrier, an electron becomes trapped on a defect in the barrier and is subsequently released. While the trap is occupied, there is a local change in the height of the tunnel barrier and hence in the critical current density of that region. As a result, the presence of a single trap causes the critical current of the junction to switch randomly back and forth between two values, producing a random telegraph signal. If the mean time between pulses is x, the spectral density of this process is a Lorentzian,
S ( f ) ~ * — . l+(2rcfr)2
(3.15)

-197-
namely white at low frequencies and tailing off as V!2 at frequencies above l/2*t m many cases, the trapping process is thermally activated, and x is of die form
x = x0exp(E/k0T), (3.16)
where x^ is a constant and E is the barrier height
In general, there may be several traps in the junction, each with its own characteristic time Tj. One can superimpose the trapping processes, assuming them to be statistically independent, to obtain a spectral density36
S(f) « J dE , + J C f f S f a T j . (317)
where D(E) is the distribution of activation energies. The term in square brackets is a strongly peaked function of E, centered at E s kBTln(l H-Kix^ with a width ~ kBT. Thus, at a given temperature, only traps with energies within ? range kBT of E contribute significantly to the noise. If one now assumes D(E) is broad with respect to kBT, one can take D(E) outside the integral, and carry out the integral to obtain
S(f,T) ~ ^ D ( E ) . (3.18)
In fact, one obtains a 1/f-like spectrum from just a few traps. The magnitude of the 1/f noise in the critical current depends strongly on
the quality of the junction as measured by the current leakage at voltages below (At + A2)/e, where A\ and A2 are the energy gaps of the two superconductors. Traps in the barrier enable electrons to tunnel in this voltage range, a process producing both leakage current and 1/f noise. Thus, for a given technology, junctions with low subgap leakage currents will have low 1/f noise. Figure 11 shows an example of a Nb-AtøOs-Nb junction with a single trap37. The junction was resistively shunted and voltage biased at typically 1.5 uV; the noise currents were measured with a SQUID. At 4.2 K [Fig. 11(a)], the noise is approximately Lorentzian; the switching process producing the noise is shown in the inset. Figure 11(b) shows that at 1.5 K the noise is substantially reduced as the trap freezes out. By measuring the temperature dependence of the random telegraph signal, Savo eial.37 found that x obeyed Eq. (3.16) with x0 = 10 s and

- 1 9 8 -
l 0 - 1 9
10"20
1 0 2 1
Vi 10 - 2 0
|
^ . 10"21
10 -1 10° 101 102 103 104
Frequency (Hz)
Fig.l 1 Spectral density of fluctuations in the critical current of a single Nb-Al203-Nb tunnel junction at (a) 4.2K and (b) 1.SK. Inset in (a) shows fluctuations vs. time (from ref.37).
E s 1.8 meV. Furthermore, t was exponentially distributed, as expected, with an average value of 107 ms at 4.2 K.
The second source of 1/f noise in SQUIDs appears to arise from the motion of flux lines trapped in the body of the SQUID34, and is less well understood than the critical current noise. This mechanism manifests itself as a flux noise; for all practical purposes the noise source behaves as if an external flux noise were applied to the SQUID. Thus, the spectral density of the 1/f flux noise scales as V*, and, in particular, vanishes at O = (n ± 1/2)0,) where V* = 0. By contrast, critical current noise is still present when V^ = 0, although its magnitude does depend on the applied flux.
The level of 1/f flux noise appears to depend strongly on the microstructure of the thin films. For example, SQUIDs fabricated at Berkeley with Nb loops sputtered under a particular set of conditions show 1/f flux noise levels of typically34 1010 4>JHZ ! at 1 Hz. On the other hand, SQUIDs with Pb loops in exactly the same geometry exhibit a 1/f noise level of about 2 X 1 0 , 2 < J > J H Z 1 at 1 Hz, arising from critical current fluctuations. Tesche eial.

- 1 9 9 -
leported a l/T noise level in Nb-based SQUIDs of about 3xlO'n^Uz\ while Foglietti s u l . * found a critical anient 1/f noise conrxponding to 2x10 1 2 * 0
Hz'1, also in Nb based devices. This,wecoiicludetfiattheqoal«yoftfieNbfitas plays a significant role in the level of 1/f flux noise. It is of considerable fundamental and practical interest to understand te mechanism in detail.
There is an important practical difference between the two sources of 1/f noise: critic J current noise can be reduced by a suitable modulation scheme, whereas flux noise cannot To understand how to reduce critical current 1/f noise, we first note that at constant current bias the spectral density of the 1/f voltage noise across the SQUID can be written in the approximate form
Sy(f) - \ [ Ø V Æ l o ^ v i ] S^(f). (3.19)
In Eq. (3.19), we have assumed that each junction has the same level of critical current noise, with a spectral density S^(f). The first term on the right is the "in-phase mode", in which each of the two junctions produces a fluctuation of the same polarity. Ibis noise is eliminated (ideally) by the conventional flux modulation scheme described in Sec. HI D, provided the modulation frequency is much higher than the 1/f noise frequency. The second term on the right of Eq. (3.19) is the "out-of phase" mode in which the two fluctuations are of opposite polarity and, roughly speaking, result in a current around the SQUID loop. This term appears, therefore, as a flux noise, vanishing for V«= 0, but is not reduced by the usual flux modulation scheme. Fortunately, there are schemes by which this second term, as well as the first, can be reduced.
One such scheme was described by Koch eja!.34and is also available on the dc SQUID manufactured by BTi40. An alternate scheme, second harmonic detection (SHAD), has recently been developed by Foglietti g a].39, and we shall briefly describe it In Fig. 12(a) wc see that both I and O sre switched among the three states A: (+1, <J>+4V4), B: (0,4>+4>o/2) and C: (-!,<m-3<V4). If the static flux is n$o [dashed curve and pulses in Fig. 12(a)], the positive and negative voltage pulses across the SQUID are of equal magnitude, and if one detects this signal at twice the modulation frequency, the output is zero. If we apply an additional flux 64>, however, the V-4> curve is shifted along the <l>-axis [solid curve and pulses in Fig. 12(a)], and the pulse heights become unequal. Lock-in detection at twice the modulation frequency produces an output proportional to 54>. The output from the lock-in detector is integrated and fedback to flux-lock

Rg.12 SHAD modulation scheme for a dc SQUID to reduce 1/F noise due to critical current finernations: (a) shows die response to an external flux 8*\ and (b) die response to a critical current fluctuation (re-dnwn from ref. 39).
die SQUID in die usual way. We inle that in-phase fliictiiatkns n c r i t ^ increase or decrease die magnitude of the vokage across die SQUID, but do not shift the V^D curve along the 4> axis. The magnitudes ofrhe voltage pulses grow or shrink in a symmetric way, and still contain no second harmonic component Thus, the in-phase fluctuations in critical current produce no response. Similarly, the out-of-phase fluctuations produce no response, as we see in Hg. 12(b). These fluctuations produce an effective fliix in die SQUID, wim a polarity tfiat depends on the direction of I. Thus, die V-ø curve shifts to die left for positive bias currents and to die right for negative bias currents. The resulting voltage pulses shrink in a symmetric way, producing iw coinpoiiem at the second harmonic of die modulation frequency. Finally, wc emphasize tfiat any 1/f flux noise produces an output from die lock-in detector in precisely die same way as die applied flux in Fig. 12(a).
Figure 13 shows an example of the reduction in 1/f noise achieved by Fbgtietti g gl.34 Figure 13(a) shows die noise as measured widi a rf SQUID, and Fig. 13(b), with the conventional flux modulation scheme. The reduction in 1/f noise indicates that in-phase critical current fluctuations have been removed.

- 2 0 1 -
1 10 100
Frequency (Hz)
Fig.13 Flux noise spectral density for dc SQUID measured (a) with an rf SQUID small-signal readout scheme, (b) with the flux modulation scheme of Figs.8 and 9 and (c) with SHAD (Fig.12) (re-drawn from ref. 39).
Figure 13(c) shows the considerable reduction in the 1/f noise resulting from SHAD: the measured 1/f noise was lO^OjHz1 at 0.1 Hz. We note that SHAD increases the spectral density of the white noise by a factor of 2: V% is reduced by a factor of 4, while the noise is measured only during the 50% of the modulation cycle in which the SQUID is biased.
For measurements at low frequencies, it is clearly advantageous to use a 1/f noise reduction scheme for SQUIDs in which the 1/f noise is dominated by critical current fluctuations. As stressed repeatedly, however, nothing can be done to reduce 1/f flux noise. As we shall see in Sec. VI, 1/f flux noise is a particularly serious problem for high-Tc SQUIDs.
0. Alternate Read-Out Schemes Although the flux modulation method described in Sec. m.D has been used
successfully for many years, alternate schemes recently have been developed. Thew- efforts have been motivated, at least in part, by the need to simplify the electronics required for the multichannel systems used in neuromagnetism - see Sec. V.A. Fujimaki and co-workers41 and Drung and co-workers42 have devised schemes in which the output from the SQUID is sensed digitally and fed back as

-202-
an analog signal to the SQUID to flux-lock the loop. Fujimaki stal. used Josephson digital circuitry to integrate their feedback system on the same chip as the SQUID so that the flux-locked signal was available directly from the cryostat. The system of Drung and co-workers, however, is currently the more sensitive, with a flux resolution of about 10"6 OQHZ~1/2 in a 50 pH SQUID. These workers also were able to reduce the 1/f noise in the system using a modified version of the modulation scheme of Foglietti si al.39 Although they need further development, cryogenic digital feedback schemes offer several advantages: they are compact, produce a digitized output for transmission to room temperature, offer wide flux-locked bandwidths, and need not add any noise to the intrinsic noise of the SQUID.
In yet another system, Miick and Heiden43 have operated a dc SQUID with hysteretic junctions in a relaxation oscillator. The oscillation frequency depends on the flux in the SQUID, reaching a maximum at (n+i/2)4>o and a minimum at nO0. A typical frequency modulation is 100 kHz at an operating frequency of 10 MHz. This technique produces large voltages across the SQUID so that no matching network to the room temperature electronics is required. The room temperature electronics is simple and compact, and the resolution at 4.2 K is about 10'5<DøHz'1/z with an inductance estimated to be about 80 pH.
IV. THE RF SQUID
A. Principles of Operation Although the rf SQUID is still the more widely used device because of its
long-standing commercial availability, it has seen very little development in recent years. For this reason I will give a rather brief account of its principles and noise limitations, following rather closely descriptions in earlier reviews.44,45
The rf SQUID4,5 shown in Fig. 14 consists of a superconducting loop of inductance L interrupted by a single Josephson junction with critical current Io and a nonhysteretic current-voltage characteristic. Flux quantization1 imposes the constraint
6 + 2K$T/ØO • 2JDI (4.1)

- 2 0 3 -
O" Fig.l41Tierf SQUID.
on the total flux OT threading the loop. The phase difference 5 across the junction determines the supercurrent
Is = -I0sin(2itOI/<I>o) (4.2)
flowing in the ring. A quasistatic external flux O thus gives rise to a total flux
Or = O - LIo sin (2JCO/O0). (4.3)
The variation of OT with O is sketched in Fig. 15(a) for the typical value LIo = 1.25 Oo. The regions with positive slope are stable, whereas those with negative slope are not. A "linearized" version of Fig. 15(a) showing the path traced out by O and Or is shown in Fig. 15(b). Suppose we slowly increase O from zero. The total flux Or increases less rapidly than O because the response flux -Lis opposes O. When Is reaches Io, at an applied flux Oc and a total flux Ore. the junction switches momentarily into a nonzero voltage state and the SQUID jumps from the k = 0 to the k = 1 quantum state. If we subsequently reduce O from a value just above Oc, the SQUID remains in the k = 1 state until O = Oo- Oc, at which point Is again exceeds the critical current and the SQUID returns to the k = 0 state. In the same way, if we lower O to below -Oc and then increase it, a second hysteresis loop will be traced. We note mat this hysteresis occurs provided LIo> Oo/2ft; most practical SQUIDs are operated in this regime. For LIo« $o» the energy AS dissipated when one takes the flux around a single hysteresis loop is its area divided by L:
AE * IoOo. (4.4)

(o)
i. Ti i
i2$ c-i0>—1
ty'V^c1
Mo/*e
§b $c $
(t>>
Fig .15 The rf S Q U I D : (a) total flux <h v s . <D for LIo = 1.25 <f>0; (b) values o f 4>r as O is quasistatically increased and then decreased.
W e n o w consider the radio frequency (if) operation o f the device . The S Q U I D is inductively coupled to the coil of an LC-resonant circuit with a quality factor Q = RxAorfLr via a mutual inductance M = K ( L L T ) 1 / 2 - see Fig. 16. Here,

- 2 0 5 -
Fig.16 The rf SQUID inductively coupled to a resonant tank circuit
LT, CT, and RT are the inductance, capacitance and (effective) parallel resistance of the tank circuit, and aW2ft is its resonant frequency, typically 20 or 30 MHz. The tank circuit is excited at its resonant frequency by a current Irf sincOrft, which generates a current of amplitude IT = Qlrf in the inductor. The voltage VT across the tank circuit is amplified with a preamplifier having a high input impedance. First, consider the case 0 = 0. As we increase Irf from zero, the peak rf flux applied to the loop is MIT = QMIrf, and VT increases linearly with Irf. Hie peak flux becomes equal to 4>c when IT - <&c/M or Irf =* Q>cl MQ, at A in Fig. 17. The corresponding peak rf voltage across the tank circuit is
v£n) = (OrfLr<I>c/M, (4.5)
where the superscript (n) indicates O = nO0, in this case with n=0. At this point the SQUID makes a transition to either the k = +1 state or the k = -1 state. As the SQUID traverses the hysteresis loop, energy AE is extracted from the tank circuit Because of this loss, the peak flux on the next half cycle is less than 4>c and no transition occurs. The tank circuit takes many cycles to recover sufficient energy to induce a further transition, which may be into either the k = +1 or -1 states. If we now increase Irf, transitions are induced at the same values of IT and VT but, because energy is supplied at a higher rate, the stored energy builds up more rapidly after each energy loss AE, and transitions occur more frequently. In the absence of thermal fluctuations (Sec. IV.B), the "step" AB in Fig. 17 is at constant voltage. At B, a transition is induced on each positive and negative rf

- 2 0 6 -
(n+l/fc)
t i7f § C /MQ
Fig. 17 VT vs. Iff in the absence of thermal noise for 4> = nOo, (n+l/2)Oo.
peak, and a further increase in Irf produces the "riser" BC. At C, transitions from the k = ±1 to the k = ±2 states occur, and a second step begins. As we continue to increase Irf we observe a series of steps and risers.
If we now apply an external flux <D = 4>o/2, the hysteresis loops in Fig. 15(b) are shifted by <J>o/2. Thus, a transition occurs on the positive peak of the rf cycle at a flux (4>c - 4>o/2), whereas on the negative peak the required flux is -(4>c + <t>o/2). As a result, as we increase Irf from zero, we observe the first step at Din Fig. 17 at
yfm = <Orfl 0c-<I>o/2)/M. <4-6>
As we increase Irf from D to F, the SQUID traverses only one hysteresis loop, corresponding to the k = 0 to k = +1 transition at (<J>C - <t>o/2). A further increase in Irf produces the riser FG, and at G, transitions begin at a peak rf flux -(4>c + 4>a/2). In this way, we observe a series of steps and risers for O = 4>o/2, interlocking those for <t> = 0 (Fig. 17). As we increase 4> from zero, the voltage at
*--n%z
G 7 /

- 2 0 7 -
which the first step appears will d. op to a minimum (D) at Oo/2 and rise to its maximum value (A) at 0 = <l>o- The change in VT as we increase 4> from 0 to <D</2, found by subtracting Eq. (4.6) from Eq.(4.5), is (OrfLq oÆM. Thus, for a small change in flux near <D = <Db/4 we find the transfer function
V* = <urfLT/M. (4.7)
At first sight, Eq.(4.7) suggests that we can make V« arbitrarily large by reducing K sufficiently. However, we obviously cannot make K so small that the SQUID has no influence on the tank circuit, and we need to establish a lower bound on K. To operate the SQUID, we must be able to choose a value of Irf that intercepts the first step for all values of O : mis requirement is satisfied if the point F in Fig. 17 lies to the right of E, that is, if DF exceeds DE. We can calculate DF by noting that the power dissipation in the SQUID is zero at D and AE(cDrf/2it)«Io<I>oflW 2JC at F. Thus, ( f f - l fbvf* w / 2 = h^d^f/ 2K (Irf and VT
are peak, rattier man rms values). Furthermore, we easily can see that I^ -1 rf = O«/ 2MQ. Assuming LIo = 4>o and using Eq.(4.5), we find that the requirement Irf> Irf can be written in the form
K*Q>n/4. (4.8)
If we set K « Q m, Eq.(4.7) becomes
V* - (Qrf(QLr/L)i/2. (4.9)
To operate the SQUID, one adjusts Irf so that the SQUID remains biased on the first step - see Fig. 17 - for all values of O. The rf voltage across the tank circuit is amplified and demodulated to produce a signal that is periodic inO. A modulating flux, typically at 100kHz and with a peak-to-peak amplitude of 4>o/2, also is applied to the SQUID, just as in the case of the dc SQUID. The voltage produced by this modulation is lock-in detected, integrated, and fed back as a current into the modulation coil to flux-lock the SQUID.
B. Theory of Noise in the if SQUID A detailed theory has been developed for noise in the rf SQUID;46'54 in
contrast to the case for the dc SQUID, noise contributions from the tank circuit and preamplifier also are important. We begin by discussing the intrinsic noise

-208-
Fig.18 VT VS. Irf showing the effects of thermal noise.
in the SQUE). In the previous section we assumed that transitions from the k = 0 to the k = 1 state occurred precisely at 0 = <t>c- hi fact, thermal activation causes the transition to occur stochastically, at lower values of flux. Kurkijårvi46
calculated the distribution of values of 4> at which the transitions occur; experimental results53 are in good agreement with his predictions. When the SQUID is driven with an rf flux, the fluctuations in the value of flux at which transitions occur have two consequences. First, noise is introduced on the peak voltage VT, giving an equivalent intrinsic flux noise spectral density47,51
Second, the noise causes the steps to tilt (Fig. 18), as we easily can see by considering the case for <I> = 0. In the presence of thermal fluctuations the transition from the k = 0 to the k = 1 state (for example) has a certain probability of occurring at any given value of the total flux O + <t>rf. Just to the right of A in Fig. 17 this transition occurs at the peak of the rf flux once in many rf cycles. Thus, the probability of the transition occurring in any one cycle is small. On the

- 2 0 9 -
other hand, at B a transition must occur at each positive and negative peak of the rf flux, with unity probability. To increase the transition probability, the peak value of the rf flux and hence VT must increase as Irf is increased from A to B. Jackel and Buhrman48, introduced the slope parameter T) defined in Fig. 18, and showed that it was related to S* by the relation
T^SJjWw&J, (4.11)
provided T| was not too large. This relation is verified experimentally. The noise temperature Ta of typical rf amplifiers operated at room
temperature is substantially higher than that of amplifiers operated at a few hundred kilohertz, and is therefore not negligible for rf SQUIDs operated at liquid 4He temperatures. Furthermore, part of the coaxial line connecting the tank circuit to the preamplifier is at room temperature. Since the capacitances of the line and the amplifier are a substantial fraction of the capacitance of the tank circuit, part of the resistance damping the tank circuit is well above the bath temperature. As a result, there is an additional contribution to the noise which we combine with the preamplifier noise to produce an effective noise temperature T^ . Hie noise energy contributed by these extrinsic sources can be shown to be4**52 2icn.kBT fr/a>ff. Combining this contribution with the intrinsic noise, one finds
e a ! ^("2L" + 2 r c n k B T ^j - (4-12)
Equation (4.12) shows that e scales as 1/cørf, but one should bear in mind that Ta tends to increase with (Orf. Nonetheless, improvements in performance have been achieved by operating the SQUID at frequencies5647 much higher than the usual 20 or 30 MHz. One also can reduce the T6, oy cooling the preamplifier,56,59 thereby reducing Ta and reducing the temperature of the tank circuit to that of the bath. However, the best noise energies achieved for the rf SQUID are substantially higher59 than those routinely obtained with thin-film dc SQUIDs, and for this reason workers requiring the highest possible resolution almost invariably use the latter device.

- 2 1 0 -
Fig.19 Cut-away drawing of toroidal SQUID (courtesy BTi, inc.).
C. Practical rfSQUIDs Although less sensitive than the dc SQUID, the rf SQUID is entirely
adequate for a wide range of applications. It is therefore more widely used than the dc SQUID, for the simple reason that reliable, easy-to-operate devices have been commercially available since the early 1970's, notably from BTi (formerly SHE). We therefore shall confine ourselves to a brief description of the device available from this company.
Figure 19 shows a cut-away drawing of the BTi rf SQUID40, which has a toroidal configuration machined from Nb. One way to understand this geometry is to imagine rotating the SQUID in Fig. 14 through 360* about a line running through the junction from top to bottom of the page. This procedure produces a toroidal cavity connected at its center by me junction. If one places a toroidal coil in this cavity, a current in the coil produces a flux that is tightly coupled to the SQUID. In Fig.19, mere are actually two such cavities, one containing the tank circuit-modulation-feedback coil and the other the input coil. This separation eliminates cross-talk between the two coils. Leads to the two coils are brought out via screw-terminals. The junction is made from thin films of Nb. This device is self-shielding against external magnetic field fluctuations, and has

- 2 1 1 -
proven to be reliable and convenient to use. In particular, the Nb input terminals enable one to connect different input circuits in a straightforward way. A typical device has a white noise energy of SxlO'29 JHz1. with a 1/f noise energy of perhaps lO' JHz-1 at 0.1 Hz.
V. SQUID-BASED INSTRUMENTS
Both dc and rf SQUTDs are used as sensors in a far-ranging assortment of instruments. I here briefly discuss some of them: my selection is far from exhaustive, but does include the more commonly used instruments.
Each instrument involves a circuit attached to the input coil of the SQUID. We should recognize from the outset that, in general, the presence of the input circuit influences both the signal and noise properties of the SQUID while the SQUID, in rum, reflects a complex impedance into the input. Because the SQUID is a nonlinear device a full description of the interactions is complicated, and we shall not go into the details here. However, one aspect of this interaction, first pointed out by Zimmerman60, is easy to understand. Suppose we connect a superconducting pick-up loop of inductance Lp to the input coil of inductance Li to form a magnetometer, as shown in Fig.20(a). It is easy to show that the SQUID inductance L is reduced to the value
L' = L[l-a2Li/(Li+LP)], (5.1)
where a2 is the coupling coefficient between L and U. We have neglected any stray inductance in the leads connecting Li and Lp, and any stray capacitance. The reduction in L tends to increase the transfer coefficient of both the dc SQUID [Eq.(3.7)] and the rf SQUID [Eq.(4.9)]. In most cases, the reduction of L and the change in the noise properties will be detectable, but they will not have a major effect on the results presented here.
A. Magnetometers and Gradiometers One of the simplest instruments is the magnetometer [Fig.20(a)]. A pick
up loop is connected across the input coil to make a superconducting flux transformer. The SQUID and input coil are generally enclosed in a superconducting shield. If one applies a magnetic flux, 84> , to the pick-up loop, flux quantization requires that

- 2 1 2 -
o
<h
4
FLUX-LOCKED SQUD
lo)
éCX FLUX-LOCKED SOU©
(b)
FLUX-LOCKED SQUI0
(O
Fig.20 Superconducting flux transformers:(a) magnetometer, (b) first-derivative gradiometer, (c) second-derivative gradiometer.
» 6M>w + (Li + Lp)Js = 0, (5.2)
where Js is the supercurrent induced in the transformer. We have neglected the effects of the SQUID on the input circuit. The flux coupled into the SQUID, which we assume to be in a flux-locked loop, is 50 = MJ Js I = Mj60 /(Li + Lp). We find the minimum detectable value of SO p by equating 5 $ with the equivalent flux noise of the SQUID. Defining S* as the spectral density of the equivalent flux noise referred to the pick-up loop, we find

-213-
S f - f i « ^ (5.3)
Introducing the equivalent noise energy referred to the pick-up loop, we obtain
2Lp Lj Lp 2a*L * p * 4 j
We observe that Eq.(5.4) has the minimum value
S?/2Lp= 4e(iYa* (5.5)
when Li = Lp. Thus, a fraction a2/4 of the energy in the pick-up loop is transferred to the SQUID. In this derivation we have neglected noise currents in the input circuit arising from noise in the SQUID, the fact the the input circuit reduces the SQUID inductance, and any possible coinriiiig between the feedback coil of the SQUID and the input circuit
Having obtained the flux resolution for L* = Lp, we can immediately write down the corresponding magnetic field resolution BJ«* = (Sj*) / m>, where rp is the radius of the pick-up loop:
BST^^LiV^MrJo. (5.6)
For a loop made from wire of radius r^one finds61 Lp = Hofp[ln(8rp/ro) - 2], where \u> - 4* x 10*7 henries/meter; for a reasonable range of values of rp/r0 we cansetLp*Sutfp. Thus, we obtain BJ? * Tfy&ynlaåf1. This indicates that one can, in principle, improve the magnetic field resolution indefinitely by increasing rp, keeping Lj = Lp. Of course, in practice, the size of the cryottat wiU impose an upper limit on rp. If we take e = lO^JHz*1 (a somewhat conservative value for an rf SQUID), a = 1, and rp = 25 mm, we find BJP * 5 x 1(T15 tesla Hz i n = 5 x 10*" gauss Hz'I/2. Thuusamudihigfhersemitrvitytl^ nonsuperconducting magnetometer.
Magnetometers have usually involved flux transformers made of Nb wire. For example, one can make the if SQUID in Fig.19 into a magnetometer merely by connecting a loop of Nbwire to its input tenninals. In the case of the thin-film

- 2 1 4 -
dc SQUID, one can make an integrated magndomtttr by fabricating a Nb locp across die spiral input coiL In dus way, Wdlstoodenj.1* achieved a magnetic field while noise of 5 x 1(T15 lesla Hz""2 using a pick-up loop with a diameter of a few millimeters.
Magnetometers wim *ypical sensitivities of 0.01 pT Hz'"2 have been used in geophysics in a variety of application V 2 for example, magnetotelluric^ active electromagnetic, soundmg, pwjir.niagnftmn, acctononiagnriinn, and the location of hydrofractures. Although SQUID-based magnetometers are substantially more sensitive than any other type, the need to irplenim the liquid helium in die field has restricted die extent tfdieir applications. Fortius reason, die advent of high-temperature superccAducsors may have considerable impact on this field -see Sec VL
An important variation of die fiux tiansfbnner B die gradiometer. Figure 20(b) shows an axial gradjometer that measures d&Jdz. The two pick-up loops are wound in opposition and balanced so that a uniform field Bx lmks zero net flux to die transformer. Agradiett^^z,ondieonWhand,doesinduceanet flux and thus generates an output from the flux-locked SQUID. Figure 20(c) shows a second-order gradiometer that measures cPBz/dz2; Fig.21(a) is a photograph of a practical version.
Thin-film gradiorneters based on dc SQUIDs were made as long ago2* as 1978, and a variety of devices25-***7 have been reported since then. To my lmowlcdge,aUofthedmfnnigradiom therefore measure an off-diagonal gradient, for example, dbVdx or (^tVdxdy. A representaH-e device is shown in Rg21(bHd).
The most important application of the gradiometer thus far is in neuromagnetism6*, notably to detect weak magnetic signals emanating from the human brain. The gradiometer discriminates strongly against distant noise sources, which have a small gradient, in favor of locally generated signals. One can thus use a second-order gradaometer in an unshielded environment, although the present trend is toward using first-order gradiometers in a shielded room of ahimrrmm and mo-metal diat greatly attenuates fhe ambient magnetic noise. In dus application, axial gradiometers of die type shown in Rg.20(a) actually sense magnetic field, rather than the gradient, because the distance from the signal source to tbt pick-up loop is less than the baseline of the gradiometer. The magnetic field sensitivity referred to one pick-up loop is typically 10 fT Hz'l/Z. Although great progress in this field has been made in recent years, it is generally

- 2 1 5 -
PtekupCoH
-6 mm— 2 •—6 mm—
m (b)
To Pickup Coils
Modulation Co« i L J L ^ s P W n Film
<0
— PWn Film Junctions
.Biasing: Resistor
"Biasing" Lead
(d)
'Shunt Resistor
Fig.21 (a) Photograph of wire-wound second-derivative gradiometer for biomedical applications (courtesy BTi, inc.); thin-film first-derivative gradiometer: (b) pick-up loops, (c) two-hole SQUID with spiral input coils, and (d) expanded view of the dotted circle in (c) showing junctions and resistive shunts (from ref. 66).
agreed that one needs an array of 50 to 100 gradiometers to make a clinically viable system. This requirement has greatly spurred the development of

- 2 1 6 -
integrated, thin-film devices. For example, Knuutila has reported that a 24-channel first-derivative array is under construction.
There are two basic kinds of measurements made on the human brain. In the first, one detects spontaneous activity: a classic example is the generation of magnetic pulses by subjects suffering from focal epilepsy70. The second kind involves evoked response: for example, Romani eial.71 detected the magnetic signal from the auditory cortex generated by tones of different frequencies. Romani has given a extensive review of this work elsewhere in these proceedings.
There are several other applications of gradiometers. One kind of magnetic monopole detector72 consists of a gradiometer: the passage of a monopole would link a flux h/e in the pick-up loop and produce a step-function response from the SQUID. Gradiometers have recently been of interest in studies of corrosion and in the location of fractures in pipelmes and other structures.
B. Susceptometers In principle, one easily can use the first-derivative gradiometer of
Fig.20(b) to measure magnetic susceptibility %. One establishes a static field along the z-axis and lowers the sample into one of the pick-up loops. Provided % is nonzero, the sample introduces an additional flux into the pick-up loop and generates an output from the flux-locked SQUID. A very sophisticated susceptometer is available commercially73. Room temperature access enables one to cycle samples rapidly, and one can measure % as a function of temperature between 1.8 K and 400 K in fields up to 5.5 tesla. The system is capable of resolving a change in magnetic moment as small as 10"* emu.
Novel miniature susceptometers have been developed by Ketchen and coworkers33-74'75. One version is shown schematically in Fig.22. The SQUID loop incorporates two pick-up loops wound in the opposite sense and connected in series. The two square pick-up loops, 17.5 (im on a side and with an inductance of about 30 pH, are deposited over a hole in the ground plane that minimizes the inductance of the rest of the device. The SQUID is flux biased at the maximum of V<x> by means of a control current Ic in one of the pick-up loops. One can apply a magnetic field to the two loops by means of the current IF; by passing a fraction of this current into the center tap Ic, one can achieve a high degree of electronic balance between the two loops. Hie sample to be studied is placed over one of the loops, and the output from the SQUID when the field is applied is directly proportional to the magnetization. At 4.2 K, the susceptometer is capable of detecting the magnetization due to as few as 3000 electron spins.

- 2 1 7 -
SQUID
GROUND-
PLANE
HOLE
Fig.22 Thin-film miniature susceptometer (from ref. 74).
Awschalom and co-workers33,75, have used a miniature susceptometer to perform magnetic spectroscopy of semiconductors with picosecond time-resolution. Linearly polarized pulses 4 ps in length are generated with a dye laser and split into a pump train and a weaker probe train. The time delay between the two trains can be varied, and each train is converted to circular polarization by a quarter-wave plate. The beams are chopped at 197 Hz and passed down an optical fiber to the sample in the cryostat. The pump pulses induce a magneto-optical susceptibility Xop which is subsequently measured by means of the much weaker probe pulses of intensity SI that induce a magnetization XopSI. The magnetization is detected by the SQUID at the chopping frequency, and its output is lock-in detected. By varying the time delay between the pump and probe pulses, one can investigate the dynamics of the induced magnetization. One also can vary the dye laser frequency through the red region of the visible spectrum to study the energy dependence of the magnetization. This technique recently has been extended to temperatures down to 0.3K75.

- 2 1 8 -
C Voltmeters Probably the first practical application of a SQUID was to measure tiny,
quasistatic voltages.76 One simply connects the signal source - for example a low resistance through which a current can be passed ~ in series with a known resistance and the input coil of the SQUID. The output from the flux-locked loop is connected across the known resistance to obtain a null-balancing measurement of the voltage. The resolution is generally limited by Nyquist noise in the input circuit, which at 4.2 K varies from about 10"15 V Hz"1/2 for a resistance of 10"8 Q to about 101 0 V Hz-1/2 for a resistance of 100 Q.
Applications of these voltmeters range from the measurement of thermoelectric voltages and of quasiparticle charge imbalance in nonequilibrium superconductors to noise thermometry and the high precision comparison of the Josephson voltage-frequency relation in different superconductors.
D. The dc SQUID as a Radiofrequency Amplifier Over recent years, the dc SQUID has been developed as a low noise
amplifier for frequencies up to 100 MHz or more77. To understand the theory for the performance of this amplifier, we need to extend the theory of S e e m by taking into account the noise associated with the current J(t) in the SQUID loop. For a bare SQUID with 0 = 1, T = 0.05 and O = (2n+l)4>o/4, one finds the spectral density of the current to be78
Sj(f)*llkBT/R. (5.7)
Furthermore, the current noise is partial)" correlated with the voltage noise across the SQUID, the cross-spectral density ueing78
SVj(f)«12kBT. (5.8)
The correlation arises, roughly speaking, because the current noise generates a flux noise which, in turn, contributes to the total voltage noise across the junction, provided V<& * 0.
If one imagines coupling a coil to the SQUID, the cpil will "see" an impedance Z in the SQUID loop that can be written in the form79
1 L. 1 /<ox Z "jtoL + R • p *}

- 2 1 9 -
The dynamic inductance L and dynamic resistance R are not simply related to L and R, but vary with bias current and flux; for example, 1/L is zero for certain values of O.
One can make a tuned amplifier, for example, by connecting an input circuit to the SQUID, as shown in Fig.23. In general, the presence of this circuit modifies all of the SQUID parameters and the magnitude of the noise spectral densities.80 Furthermore, the SQUID reflects an impedance (0 MjZ into the input circuit Fortunately, however, one can neglect the mutual influence of the SQUID and input circuit, provided the coupling coefficient a 2 is sufficiently small, as it is under certain circumstances. For the purpose of illustration, we shall derive the noise temperature of the amplifier in Fig.23.
Li the weak coupling limit, the noise current Jn(t) in' ices a voltage -MjJ N
into the input circuit, and hence a current -MjJ N / Zj, where
Zj « Ri+jwLj + l/j(oQ (5.10)
Here, Zj is the impedance of the input circuit and Li and Q are the series inductance and capacitance. The noise current in the input circuit, in turn, induces a flux -M; JN/ZJ in the SQUID loop and finally a voltage -M; JNV(t»/Zj across the SQUID. Thus, the noise voltage across the SQUID in the presence of the input circuit is77
VN(t) = VN<T)-M?JNV«/Zi, (5.11)
O——/ww Iffy Cj, 1
Fig.23 Tuned radiofrequency amplifier based on dc SQUID (from ref.77).

-220-
where VN(t) is the noise voltage of the bare SQUID, which we assume to be unchanged by the input circuit in the limit a2 -* 0. The spectral density of VN(t) is easily found to be
^ 0 = S v ( 0 ^ 2 M ^ ^ f > - 2 m M ^ ( < B L ' ; 1 / ' a ^ S v ' < f > . (5.12)
We no w suppose that we apply a sinusoidal input signal at frequency aV2rc, with a mean-square amplitude <vf>. The mean-square signal at the output of the SQUID is
<vj> = M? \£<V?>/| Zi | 2. (5.13)
The signal-to-noise ratio is
S/N = <v£>/S^(f)B (5.14)
in a bandwidth B. It is convenient to introduce a noise temperature TN for the amplifier by setting S/N = 1 with <V~> = 4kBTNRjB. This procedure implies that the output noise power generated by the SQUID is equal to the output noise power generated by the resistor R, when it is at a temperature TN. We then can optimize TN with respect to Rj and Q for a given value of L» and find
jw.jfi^v*^.^« (515)
aÆf0 " T Sy J (5.16)
and
Tir'-j^-GvS.-sS,)"2. (5.17)

- 2 2 1 -
We note from Eq.(5.16) that the optimum noise temperature occurs off-resonance. It often is more convenient in practice to use the amplifier at the resonant frequency of the tank circuit, given by (O^Q = 1 (neglecting reflected components from the SQUID). In mat case, one finds optimum values77
RSra) = cøoaULV^Sj/Sv)1* (5.18)
and
"** = k f c (SvS,)W2- (519)
Using the results of Eqs.(3.7), (3.8), (5.7) and (5.8), we can write Eq.(5.18) in the form
oAoWRf^ = a2Q * 1. (5.20)
This result shows that high-Q input circuits imply that a2 is small, thereby justifying the assumption made at the beginning of this section. One also finds
TN(f) * 18fi7V„ * 2fe(f)/kB. (5.21)
Thus, although e(f) does not fully characterize an amplifier, as noted earlier, within the framework of the model, it does enable one to predict TN.
One can easily calculate the gain on resonance. For a 2 « 1, an input signal Vj produces an output voltage V0 «(V/Rf^MiV*. The power gain is thus G = (VQ/RD)/(VJ /RJ), where Rd is the dynamic output resistance (dV/dl)«, of the SQUID. If we take Rd = R, we find
G~V*/a>. (5.22)
Hilbert and Clarke77 made several radiofrequency amplifiers with both tuned and untuned inputs, flux biasing the SQUID near O = (2n + 1 )<V4. There was no flux-locked loop. The measured parameters were in good agreement with predictions. For example, for an amplifier with R * 8 ft, L * 0.4 nH, Li * 5.6

- 2 2 2 -
nH, Mi« 1 nH and V<> « 3 x 10¹⁰ sec! at 4.2 K, they found G = 18.6 ± 0.5 dB and TN = 1.7 ± 0.5 K at 93 MHz. The predicted values were 17 dB and 1.1 K, respectively.
We emphasize that in this theory and these measurements one is concerned only with the noise temperature of the amplifier itself. Nyquist noise from the resistor adds a contribution which, in the example just given, exceeds the amplifier noise. Thus, the optimization procedure just outlined does not necessarily give the lowest system noise, and one would use a different procedure when the value of TN in Eq.(5.17) or Eq.(5.19) is well below T.
In concluding this section, we comment briefly on the quantum limit for the dc SQUID amplifier. At T = 0, Nyquist noise in the shunt resistors should be replaced with zero point fluctuations [Eq.(2.11]. Koch sial.81 performed a simulation in this limit and concluded that, within the limits of error, the noise temperature of a tuned amplifier in the quantum limit should be given by
TN«hf/kBln2. (5.23)
This is the result for any quantum-limited amplifier. The corresponding value for e was approximately ft, but it should be emphasized that quantum mechanics does not impose any precise lower limit on e.82 A number of SQUIDs have obtained noise energies of 3ft or less, but there is no evidence as yet that a SQUID has attained quantum-limited performance as an amplifier.
E. Magnetic Resonance SQUIDs have been used for two decades to detect magnetic resonance.83
Most of the experiments involved the detection of magnetic resonance at low frequencies or the change in the static susceptibility of a sample induced by a resonance at high frequency. However, the development of the radiofrequency amplifier described in the previous section enables one to detect pulsed magnetic resonance directly at frequencies up to -300 MHz.
Clarke, Hahn and co-workers have used the radiofrequency amplifier to perform nuclear quadrupole resonance83 (NQR) and nuclear magnetic resonance84 (NMR) experiments. They observed NQR in 35C1, which, in zero magnetic field, has two doubly-degenerate nuclear levels with a splitting of 30.6856 MHz. The experimental configuration is shown in Fig.24. The sample is placed in a superconducting pick-up coil, in series with which is an identical, counterwound coil. These coils are in series with an adjustable tuning capacitor

- 2 2 3 -
Fig.24 Circuit for NQR with dc SQUID amplifier (from ref. 83).
Ci, the 4-turn input coil of a planar dc SQUID and 20 unshunted Josephson junctions. The resistor R} represents contact resistance and losses in the capacitor. Radiofrequency pulses applied to the transmitter coil cause the nuclear spins to precess; after each pulse is turned off, the amplifier detects the processing magnetization. The amplified signal is mixed down with a reference provided by the if generator, and the mixed-down signal is passed through a low-pass filter, observed on an oscilloscope, and recorded digitally for further analysis.
The major difficulty with this technique, and indeed with other pulsed methods, is the saturation of the amplifier by the very large rf pulse. In the present experiments, the effects of this pulse are reduced in two ways. First, the gradiometer-like configuration gives a common-mode rejection that can be as high as 3X10⁴. Second, the series of junctions in the input circuit acts as a Q-spoiler83. As the current begins to build in the tuned circuit, the junctions switch to the resistive state with a total resistance of about 1 kQ, thereby reducing the Q to ~ 1. When the pulse is turned off, the transients die out very quickly and the junctions revert to their zero voltage state, rapidly restoring Q to its full value,

- 2 2 4 -
usually several thousand. In this way, one can combine the benefits of a high-Q tuned circuit and a sensitive amplifier while retaining a relatively short dead-time after each pulse. In their initial experiments, Hilbert el al-83 achieved a resolution for a single pulse of ~2 x 10¹⁶ spins (~2 x 10¹⁶ nuclear Bohr magnetons) in a bandwidth of 10 kHz.
Subsequently, the Q-spoiler and SQUID amplifier were used to detect atomic polarization induced by processing nuclear electric quadruples.85 In this experiment, the NaClfy sample was placed in a capacitor that formed part of the tuned input circuit, and NQR induced in the usual way by radiofrequency pulses. The preceding electric quadruple moments induce a net electric dipole moment in the neighboring atoms, provided the crystal is non-centrosymmetric. These dipole moments, in turn, produce an oscillating electric polarization in the crystal and hence a voltage on the capacitor that is amplified in the usual way. This technique yields information on the location and polarization of atoms near nuclear quadruple moments.
The Q-spoiler and amplifier also have been used to detect nuclear magnetic resonance84. In these experiments one applies a magnetic field with an amplitude of several tesla to the crystal, and places the superconducting circuitry some distance away in a relatively low field. In yet another experiment, Sleator si aj.86
observed "spin noise" in 3SC1. An if signal at the NQR frequency equalized the populations of the two nuclear spin levels, and then was turned off to leave a zero-spin state. A SQUID amplifier (without a Q-spoiler) was able to detect the photons emitted spontaneously as the upper state decayed, even though the lifetime per nucleus for this process was ~ 106 centuries. The detected power was about5xlO"21W in a bandwidth of about 1.3 kHz.
F. Gravity Wave Antennas A quite different application of SQUIDs is the detection of minute
displacements, such as those of the bar in a gravity wave antenna.87,88 About a dozen groups worldwide are using these antennas to search for the pulse of gravitational radiation that is expected to be emitted when a star collapses. The radiation induces longitudinal oscillations in the large, freely suspended bar, but because the amplitude is very tiny, one requires the sensitivity pf a dc SQUID to detect it. As an example, we briefly describe the antenna at Stanford University, which consists of an aluminum bar 3 meters long (and weighing 4800 kg) suspended in a vacuum chamber at 4.2 K. The fundamental longitudinal mode is at <OJ2K * 842 Hz, and the Q is 5 x 10⁶. The transducer is shown schematically in

- 2 2 5 -
Fig.25. A circular niobium diaphragm is clamped at its perimeter to one end of the bar, with a flat spiral coil made of niobium wire mounted on each side. The two coils are connected in parallel with each other and with the input coil of a SQUID; this entire circuit is superconducting. A persistent supercurrent circulates in the closed loop formed by the two spiral coils. The associated magnetic fields exert a restoring force on the diaphragm so that by adjusting the current, one can set the resonant frequency of the diaphragm equal to that of the bar. A longitudinal oscillation of the bar induces an oscillation in the position of the diaphragm relative to the two coils, thereby modulating their inductances. As a result of flux quantization, a fraction of the stored supercurrent is diverted into the input coil of the SQUID, which detects it in the usual way.
The present Stanford antenna has a root-mean-square strain sensitivity <(5l)2>iy2/l of 10", where I is the length of the bar, and Sft is its longitudinal displacement. This very impressive sensitivity, which is limited by thermal noise in the bar, is nonetheless adequate to detect events only in our own galaxy. Because such events are rare, there is very strong motivation to make major improvements in the sensitivity.
If the bar could be cooled sufficiently, the strain resolution would be limited only by the bar's zero-point motion and would have a value of about 3 x 10~21. At first sight one might expect mat the bar would have to be cooled to
Fig.25 Transducer for gravity wave antenna (courtesy P.F. Michelsen).

- 2 2 6 -
an absurdly tow temperature to achieve mis quantum limit, because a frequency of 842 Hz corresponds to a temperature fioaJkB of about 40 nK. However, it turns out that one can make the effective noise temperature Teff of the antenna much lower than the temperature T of the bar. If a gravitational signal in the form of a pulse of length xs interacts with an antenna that has a decay time QAu«, then the effective noise temperature is given approximately by the product of the bar temperature and the pulse length divided by the decay time: T^ = x^TfQ. Thus, one can make the effective noise temperature much less than the temperature of the bar by increasing the bar's resonant quality factor sufficiently. To achieve the quantum limit, in which the bar energy no), is greater than the effective thermal energy kBTeff, one would have to lower the temperature T below Qh/kBxs, which is about 40 mK for a quality factor Q of 5 x 10⁶ and a pulse length TS of 1 msec. One can cool the antenna to this temperature with the aid of a large dilution refrigerator.
Needless to say, to detect the motion of a quantum-limited antenna, one needs a quantum-limited transducer, a requirement that has been the major driving force in the development of ultra-low-noise dc SQUIDs. As we have seen, however, existing dc SQUIDs at low temperatures are now within striking distance of the quantum limit, and mere is every reason to believe mat one will be able to operate an antenna quite close to the quantum limit within a few years.
G. Gravity Gradiometers The gravity gradiometer, which also makes use of a transducer to detect
minute displacements, has been pioneered by Paik89 and Mapoles90. The gradiometer consists of two niobium proof masses, each constrained by springs to move along a common axis (Fig.26). A single-layer spiral coil of niobium wire is attached to the surface of one of the masses so that the surface of the wire is very close to the opposing surface of the other mass. Thus, the inductance of the coil depends on the separation of the two proof masses, which, in turn, depends on the gravity gradient. The coil is connected to a second superconducting coil which is coupled to a SQUID via a superconducting transformer. A persistent supercurrent, I, maintains a constant flux in the detector circuit Thus, a change in the inductance of the pick-up coil produces a change in I, and hence, a flux in the SQUID that is related to the gravity gradient More sophisticated versions of this design enable one to balance the restoring forces of the two springs electronically,90 thereby eliminating the response to an

- 2 2 7 -
SQUD
Fig.26 Gravity gradiometer showing two proof masses (M) on cither side of a planar spiral coil (from ief. 90).
acceleration (as opposed to an acceleration gradient). Sensitivities of a few Eotvos HZ-H* have been achieved at frequencies above 2 Hz.
Instruments of this kind could be used to map the earth's gravity gradient, and may be used to test the inverse gravitational square law and in inertial navigation.
VI. THE IMPACT OF HIGH TEMPERATURE SUPERCONDUCTIVITY
The advent of the high-traraitkm-temperature (Tc) superconductors91 has stimulated great interest in the prospects for superconducting devices operating at liquid (LN) temperature (77 K). Indeed, a number of groups have already successfully operated such SQUIDs. In mis section I shall give a brief overview of this work.
A. Predictions for White Noise In designing a SQUID for operation at LN temperature, one must bear in
mind the constraints imposed by thermal noise on the critical current and inductance, I0> 10xkBT/ø0and L < 4>J/5kBT. For T =77 K, we find Io £ 16 uA and L 5 0.8 nH. If we take as arbitrary but reasonable values, L = 0.2 nH and Io = 20 uA, we obtain 2Uo/00 = 4 for the dc SQUID and LIo^o • 2 for the rf SQUID. These values are not too far removed from optimum, and

-228-
lo a l im approximation, we can use the equations for die noise energy given in Sees, in and IV.
For die case of die dc SQUID, die noise energy is predicted by eidier Eq.(3.9) or Eq.(3.10). However, since nobody has yet made a Josephson tunnel junction with high-Tc materials, it is somewhat umnlistic to use Eq.(3.10), winch involves the junction capacitance, and instead we use Eq.(3.9). The value of R is an open question, and we rather arbitrarily adopt 5 Q, which is not too different from values achieved experimentally for high-Tc grain boundary junctions.92 WidiL=0.2iiH,T = 77KaDdR = 5aE^(3.9)ixedicts e«4xlO"31JHz"1. This value is only abort one onkr of magnitude higher that duttbof)dat4:2Kfortypic^Nr>bas^ and is somewhat
better than that found in commercially available toroidal SQUIDs. These various values are summarized in Fig.27. If one could actually achieve the predicted resolution in a SQUID at 77 K at frequencies down to 1 Hz or less, it would be adrqnatf for most oftteapplicatiomdiscwwdm Sec. V.
10-25
KT26
itr27
7 KT2* N X
£ 1 ( r »
itr30
10-31
10"1 1 10 102 103
Frequency (Hz)
Fig.27 Noise energy e(f) vs. frequency for several SQUIDs and for a YBCO film.
YBCOT7K> Fans
RF8u*77K
LonvnerosJ +.a\
f y . . . J u l « ,<
RF77K
DC Commercial 4.2K Predcted OC77K
DC TNn Rbn 4.2K

- 2 2 9 -
For the rf SQUID, Eq.(4.10) predicts an intrinsic noise energy of about 6xlO"29JHz-iforI0 = 20nA,LIo = 2«>o,«W2jc = 20MH2andT = 77K. This value is comparable with the overall value obtained experimentally with 4.2 K devices where the effective noise temperature T a of the preamplifier and tank circuit is much higher than the bath temperature for the case in which the preamplifier is at room temperature - see Sec.IV. B. However, when one operates a SQUID at 77 K, there is no reason for T a to increase and the system noise energy should be comparable with that at 4.2K.
With regard to 1/f noise, in general, one might expect both critical current noise and flux noise to contribute. However, it seems impractical to make any a priori predictions of the magnitude of these contributions.
B. Practical Devices
Although a number of dc and rf SQUIDs have been made from YBCO, I shall describe just one of each type. It appears mat the first dc SQUID was made by Koch ej gi.92 In their devices, they patterned the films by covering the regions of YBCO destined to remain superconducting with a gold film, and ion implanted the unprotected regions so that they became insulators at low temperatures. The configuration is shown in Fig.28. The estimated inductance is 80 pH. The two microbridges exhibited Josephson-like behavior, which actually arose from junctions formed by grain boundaries between randomly oriented grains of YBCO. As the quality of the films has improved, conventional patterning techniques such as lift off and ion etching have become possible. The I-V characteristics of these devices are modulated by an applied flux, although the
Fig.28 Planar thin-film dc SQUID fabricated from YBCO (re-drawn from ref. 92).

- 2 3 0 -
V-<D curves are often hysteretic and nonperiodic, probably because of flux trapped in the YBCO films. The noise energy scaled approximately as 1/f over the frequency range investigated, usually 1 to K^Hz. The lowest noise energies achieved to date at 1 Hz are 4 x 10"27 J Hz"1 at 41 K and, in a different device, 2 x 10MJ/Hz at 77 K. These values are plotted in Fig.27.
The best characterized rf SQUID reported so far is that of Zimmerman el ål.93 They drilled a hole along the axis of a cylindrical pellet of YBCO, and cut a slot part way along a radius (Fig.29). The pellet was glued into an aluminum holder, also with a slot, and the assembly was immersed in LN. A taper pin forced into the slot in the mount caused the YBCO to break in the region of the cut; when the pin was withdrawn slightly, the YBCO surfaces on the two sides of the crack were brought together, forming a "break junction". The rf SQUID so formed was coupled to a resonant circuit and operated in the usual way. The best flux resolution was 4.5 x 10"4O0Hz"1/2 at 50 Hz, corresponding to a noise energy of 1.6 x 10"27 J HzA for L = 0.25 nH - see Fig.27.
icn
spring
Al holder
YBCO pellet
saw cut in pellet
center hole 0.95 mm dia.
Fig. 29 Break-junction rf SQUID (from ref. 93).

- 2 3 1 -
C. Fhix Noise in YBCO films It is evident that the 1/f noise level in YBCO SQUIDs is very high
compared with that in Nb or Pb devices at 4.2K. Ferrari eial*have investigated the source of this noise by measuring the flux noise in YBCO films. Each film, deposited on a SrTiCb chip, was patterned into a loop and mounted parallel and very close to a Nb-based SQUID (with no input coil) so that any flux noise in the YBCO loop could be detected by the SQUID. The assembly was enclosed in a vacuum can immersed in liquid helium. The SQUID was maintained at 4.2 K, while the temperature of the YBCO film could be increased by means of a resistive heater. Below Tc, the spectral density of the flux noise scaled as 1/f over the frequency range 1 to 103 Hz, and increased markedly with temperature. Three films were studied, with microstructure improving progressively with respect to the fraction of grains oriented with the c-axis perpendicular to the substrate. The critical current density correspondingly increased, to a value of 2 x 10⁶ Acm2 at 4.2 K in the best film. The spectral density of the noise measured at 1Hz is shown vs. temperature in Fig.30. We see that in each case the noise increases rapidly as the temperature approaches Tc, and that, at a given
47K 85K
50 100 Temperature (K)
Fig.30 Spectral density of flux noise at 1Hz vs. temperature for three YBCO films: polycrystalline (squares), mixed a- and c-axis (triangles) and >90% c-axis (circles). Solid symbols indicate the noise is 1/f at 1Hz, open that it is white or nearly white (from ref. 94).

-232 -
temperature, the noise decreases dramatically as the quality of the films is improved. The noise energy estimated at 28 K and 77 K with an assumed inductance of 400 pH is shown in Fig.27.
These results demonstrate that YBCO films are intrinsically noisy. The noise presumably arises from the motion of flux quanta trapped in the films, possibly at grain boundaries. This mechanism is almost certainly the origin of the 1/f noise observed in YBCO SQUIDs, and, in general terms, is similar to the origin of 1/f flux noise in Nb SQUIDs. It is encouraging that the noise is reduced as the microstructure of the films is improved, and it should be emphasized that there is no reason to believe the lowest noise measured so far represents a lower bound. The implications arc that SQUIDs and flux transformers coupled to them should be made of very high quality films.
D. Future Prospects for High-Tc SQUIDs One rather obvious application of a high-Tc SQUID is as a geophysical
magnetometer - see Sec.V.A. At the moment, however, it is not entirely straightforward to predict the performance, since the devices are still evolving, and it is evident from the noise measurements on YBCO films that thin-film flux transformers may introduce considerable levels of low frequency noise. To make an estimate, we assume that we can optimally couple the 77 K dc SQUID with the noise energy shown in Fig.27 to a noiseless flux transformer with a thin-film pick-up loop with a diameter of 50 mm. The estimated loop inductance is about 150 nH. Using Eq.(5.6), we find a magnetic field resolution of roughly 0.1 pT Hz 1/2 at 1 Hz, improving to 0.01 pT Hz"1/2 at 100 Hz. Although this performance is quite good, one should realize that commercially available coils operated at room temperature offer a resolution of about 0.03 pT Hz'1/2 over this frequency range. Furthermore, our assumption of a noise-free flux transformer is rather optimistic. Nonetheless, given the short time over which the high-Tc materials have been available, one should be rather encouraged: a relatively modest reduction in the 1/f noise that might be gained from improving the quality of YBCO films or even from using alternate materials might yield a useful geophysical device.
One might note here that the real advantage in using liquid nitrogen as opposed to liquid helium for field applications, is not really the reduction in cost, a savings which is negligible compared with the cost of mounting a field operation, but rather is the very much slower boil-off rate of liquid nitrogen. The latent heat of vaporization of liquid N2 is about 60 times that of liquid 4He, so

-233-
that one should be able to design cryostats of modest size with hold-times of up to a year. It also is noteworthy that liquid Ne, which boils at 27 K, has a latent heat roughly 40 times that of liquid He, and its use also would greatly extend die running time over that of liquid He, for roughly the same cost per day. We see from Fig.30 that the I/f noise in YBCO films can be considerably lower at 27 K than at 77 K, so that the lower temperature operation could be a considerable advantage.
The likely impact of high-Tc SQUIDs on the more demanding neuromagnetic applications is much smaller, at least for the near future. Here, one needs very high sensitivity at frequencies down to 0.1 Hz or less, but is not particularly concerned with the cost of liquid 4He or the need to replenish it every day or two. Furthermore, low-noise, closed-cycle refrigerators are just becoming available that obviate the need to supply liquid cryogens in environments where electrical power is readily available. Thus, it is difficult to imagine that high-Tc SQUIDs will have a significant impact in this area unless there is a major reduction in the 1/f noise.
In concluding mis section, we note that two key problems must be solved before high-Tc SQUIDs are likely to become technologically important. The first is the development of a reproducible and reliable Josephson junction. Although great progress has been made with grain boundary junctions, it is not clear that one can base a technology on this technique. Shiota el ai-95 have reported YBCO-insulator-YBCO junctions formed by fluorination of the base electrode, but the I-V characteristics revealed that one of the surfaces was normal. It is hoped that it will be possible to produce all-YBCO junctions exhibiting Josephson tunneling in the near future. An alternative might be a superconductor-normal metal-superconductor junction.96 The second problem is concerned with the reduction of hysteresis and noise in thin films of high-Tc material. The motion of magnetic flux in the films is responsible for both effects, and one has to learn to produce films with lower densities of flux lines or higher pinning energies. Given the world-wide effort on the new superconductors, there is every reason to be optimistic about the long-term future of SQUIDs based on these materials.

- 2 3 4 -
VIL CONCLUDING REMARKS
In mis chapter I have tried to give an overview of the current status of dc and rf SQUIDs. I make no pretence mat mis account is comprehensive. There are many SQUID designs and applications that I have not mentioned, but I hope that I have given some flavor of the amazing versatility of these devices. I find it remarkable mat SQUIDs are the basis of bom the most sensitive magnetometer available at 10"* Hz and die lowest noise radio frequency amplifier at 10* Hz.
It is somewhat ironic that the best developed devices, thin-film dc SQUIDs, are still not commercially available. This seemingly lamentable state of affairs s" nply reflects supply and demand. If thin-film SQUIDs were cheaper, people would buy them, and if people would buy them thin-film SQUIDs would be cheaper. The basic problem is that the demand for these devices has not yet been sufficient to convince a company to produce them on a large enough scale to bring the price down to an affordable level. However, some 14 years after low noise dc SQUIDs were first demonstrated, I believe that the situation is finally about to change. After all, one needs only a single major application to make reasonably-priced SQUIDs available for any number of applications, and there now seem to be two such major applications on the horizon. The first is in neuromagnetism: if mis application is to become a clinical reality, one will need systems with as many as 100 channels, and the need for 100 channels will inevitably lead to the production of thin-film SQUIDs on a large scale. The second is the advent of high-Tc thin-film SQUIDs. If these devices attain sufficient sensitivity and reliability for geophysical applications, not to mention laboratory-based applications such as voltmeters, they will be in sufficient demand to justify production on a commercial basis.
Either way, I think the next few years are going to be particularly interesting.
ACKNOWLEDGMENTS
I am indebted to D. Cram for supplying Fig. 21(a), P.F. Michelson Fig. 25, D. Paulsen Fig. 19, F. C. Wellstood Fig. 10, and J. E. Zimmerman Fig. 29. For that part of the work carried out at Berkeley, I wish to thank the following for their hard work and dedication: Gordon Donaldson, Wolf Goubau, Mike Heaney, Claude Hilbert, Cristof Heiden, Mark Ketchen, Roger Koch, John Martinis, Bonaventura Savo, Claudia Tesche, Cristian Urbina,

- 2 3 5 -
Dale Van Harlingen and Fred Wellstood. I thank in particular Roger Koch and Fred Wellstood for helpful conversations during the preparation of this manuscript I am also grateful to Marty Nisenoff and Harold Weinstock for their careful editing. This work was supported by the Director, Office of Energy Research, Office of Basic Energy Sciences, Materials Sciences Division of the U.S. Department of Energy under contract number W-7405-ENG-48.
REFERENCES
1. London. F.: Superfluids. Wiley, New York 1950 2. Josephson. B.D.: Possible new effects in superconductive tunneling.
Phys. Lett 1. 251-253 (1962); Supercurrents through barriers. Adv. Phys. 14.419-451 (1965)
3. Jaklevic. R.C., Lambe. J., Silver. A.H., and Mercereau. J.E.: Quantum interference effects in Josephson tunneling. Phys. Rev Lett 12.159-160 (1964)
4. Zimmerman. J.E., Thiene. P., Harding. J.T.: Design and operation of stable rf-biased superconducting point-contact quantum devices, and a note on the properties of perfectly clean metal contacts. J. Appl. Phys. 41.1572-1580 (1970)
5. Mercereau, J.E.: Superconducting magnetometers. Rev. Phys. Appl. 5. 13-20 (1970); Nisenoff. M.: Superconducting magnetometers with sensitivities approaching 10'10 gauss. Rev. Phys. Appl. 5. 21-24 (1970)
6. Stewart. W.C.: Current-voltage characteristics of Josephson junctions. Appl. Phys. Lett 12.277-280(1968)
7. McCumber. D.E.: Effect of ac impedance on dc voltage-current characteristics of Josephson junctions. J. Appl. Phys. 39. 3113-3118 (1968).
8. Ambegaokar. V. and Halperin. B. I.: Voltage due to thermal noise in the dc Josephson effect Phys. Rev. Lett. 22.1364-1366 (1969)
9. Clarke. J. and Koch. R. H.: The impact of high-temperature superconductivity on SQUIDs. Science 242. 217-223(1988)
10. Likharev. K. K. and Semenov. V. K.: Fluctuation spectrum in superconducting point junctions. Pis'ma Zh. Eksp. Teor. Fiz. 15. 625-629 (1972). [JETP Lett. 15.442-445 (1972)]
11. Vystavkin. A. N., Gubankov. V.N., Kuzmin. L.S., Likharev. K.K., Migulin. V.V. and Semenov. V.K.: S-c-s junctions as nonlinear elements of microwave receiving devices. Phys. Rev. Appl. 9.79-109 (1974)
12. Koch. R.H., Van Harlingen. D.J. and Clarke. J.: Quantum noise theory for the resistively shunted Josephson junction. Phys. Rev Lett. 45. 2132-2135 (1980)
13. Tesche. CD. and Clarke. J.: dc SQUID: Noise and Optimization. J. Low. Temp. Phys. 27. 301-331 (1977)

- 2 3 6 -
14. Brumes. JJ.P., de Waal. VJ. and Mooij. J.E.: Comment on "dc SQUID noise and optimization" by Tesche and Clarice. J. Low. Temp. Phys. 46. 383-386 (1982)
15. De Waal. VJ., Schrijner. P. and Llurba. R. Simulation and optimization of a dc SQUID with finite capacitance. J. Low. Temp. Phys. 54.215-232 (1984)
16. Ketchen. M.B. and Jaycox. J.M.: Ultra-low noise tunnel junction dc SQUID with a tightly coupled planar input coil. Appl. Phys. Lett. 40. 736-738 (1982)
17. Jaycox J.M. and Ketchen M.B.: Planar coupling scheme for ultra low noise dc SQUIDs. IEEE Trans. Magn., MAG-17.400-403 (1981)
18. Wellstood. F.C., Heiden. C. and Clarke. J.: Integrated dc SQUID magnetometer with high slew rate. Rev. Sci. Inst. 55.952-957 (1984)
19. Gurvitch. M., Washington. M.A. and Huggins. H.A.: High quality refactory Josephson tunnel junction utilizing thin aluminum layers. Appl. Phys. Len. 42.472-474 (1983)
20. De Waal. VJ., Klapwijk. T.M. and Van den Hamer. P.: High performance dc SQUIDs with submicrometer niobium Josephson junctions. J. Low. Temp. Phys. 53.287-312 (1983)
21. Tesche. CD., Brown. K.H., Callegari. A.C., Chen. M.M., Greiner. J.H., Jones. H.C., Ketchen. M.B., Kim. K.K., Kleinsasser. A.W., Notarys. H.A., Proto. G., Wang. R.H. and Yogi. T.: Practical dc SQUIDs with extremely low 1/f noise. IEEE Trans. Magn. MAG-21. 1032-1035 (1985)
22. Pegrum. CM., Hutson. D., Donaldson. G.B. and Tugwell. A.: DC SQUIDs with planar input coils, ibid. 1036-1039 (1985)
23. Noguchi. T., Ohkawa. N. and Hamanaka. K.: Tunnel junction dc SQUID with a planar input coil. SQUID 85 Superconducting Quantum Interference Devices and their Applications. Ed. Hahlbohm. H. D. and Lubbig. H. (Walter de Gruyter, Berlin, 1985) 761-766
24. Muhlfelder. B., Beall. J.A., Cromar. M.W. and Ono. R.H.: Very low noise tightly coupled dc SQUID amplifiers. Appl. Phys. Lett. 49. 1118-1120(1986)
25. Knuutila. J., Kajola. N., Seppa. H., Mutikainen. R. and Salmi. J.: Design, optimization and construction of a dc SQUID with complete flux transformer circuits. J. Low. Temp. Phys. 71. 369-392 (1988)
26. Carelli. P. and Foglietti. V.: Behavior of a multiloop dc superconducting quantum interference device. J. Appl. Phys. 53.7592-7598 (1982)
27. Clarke. J., Goubau. W.M. and Ketchen. M.B.: J. Low. Temp. Phys. 25. 99-144 (1976)
28. Ketchen. M.B., Goubau. W.M., Clarke. J. and Donaldson. G.B.: Superconducting thin-film gradiometer. J. Appl. Phys. 44. 4111-4116 (1978)
29. Wellstood. F.C, and Clarke. J.: unpublished.

-237-
30. Wellstood. F.C, Urfoina. C. and Clarke. J.: Low-frequency noise in dc superconducting quantum interference devices below IK. Appl. Phys. Lett 50.772-774 (1987)
31. Roukes. M. L., Freeman. M. R., Germain. R. S., Richardson. R. C. and Ketchen. M. B.: Hot electrons and energy transport in metals at millikelvin temperatures. Phys. Rev. Lett. 55.422-425 (1985)
32. Wellstood. F.C, Urbina. C. and Clarke. J.: Hot electron effect in the dc SQUID. Proceedings of the Applied Superconductivity Conference August 21-25 1988 (to be published).
33. Ketchen. M.B., Awschalom. D.D., Gallagher. WJ., Kleinsasser. A.W., Sandstrom. RL., Rozen. J.R. and Bumble. B.: Design, fabrication and performance of integrated miniature SQUID susceptometers. Proceedings of the Superconductivity Conference August 21-25 1988 (to be published).
34. Koch. R.H., Clarke. J., Goubau. W.M., Martinis. J.M., Pegrum. C.M. and Van Harlingen. D J.: Flicker (1/0 noise in tunnel junction dc SQUIDs. J. Low. Temp. Phys. 51.207-224 (1983)
35. Rogers. C.T. and Buhrman. R.A.: Composition of 1/f noise in metal-insulator-metal tunnel junctions. Phys. Rev. Lett 53.1272-1275 (1984)
36. Dutta. P. and Horn. P.M.: Low-frequency fluctuations in solids: 1/f noise. Rev. Mod. Phys. 53.497-516 (1981)
37. Savo. B., Wellstood. F.C. and Clarke. J.: Low-frequency excess noise in Nb-Al203-Nb Josephson tunnel junction. Appl. Phys. Lett. 50. 1757-1759(1987)
38. Tesche. CD., Brown. R. H., Callegari. A. C, Chen. M. M., Greiner. J. H., Jones. H. C, Ketchen. M. B., Kim. K. K., Kleinsasser. A. W., Notarys. H. A., Proto. G., Wang. R. H. and Yogi. T.: Well-coupled dc SQUID with extremely low 1/f noise. Proc. 17th International Conference on low temperature physics LT-17. (North Holland, Amsterdam 1984) 263-264
39. Foglietti. V, Gallagher. W. J., Ketchen. M. B., Kleinsasser. A. W., Koch. R. H., Raider. S. I. and Sandstrom. R. L.: Low-frequency noise in low 1/f noise dc SQUIDs. Appl. Phys. Lett. 49.1393-1395 (1986).
40. Biomagnetic Technologies Inc. 4174 Sorrento Valley Blvd., San Diego, CA 92121.
41. Fujimaki. N., Tamura. H., Imamura. T. and Hasuo. S.: A single-chip SQUID magnetometer. Digest of Tech. papers of 1988 International Solid-state conference. (ISSCC) San Francisco, pp. 40-41. A longer version with the same title is to be published.
42. Drung. D.: Digital Feedback loops for dc SQUIDs. Cryogenics 26.623-627 (1986). Drung. D., Crocoll. E., Herwig. R., Neuhaus. M. and Jutzi. W.: Measured performance parameters of gradiometers with digital output. Proceedings of the Applied Superconductivity Conference, August 21-25 1988 (to be published).

- 2 3 8 -
43. Miick. M. and Heiden. C: Simple dc SQUID system based on a frequency modulated relaxation oscillator. Proceedings of the Applied Superconductivity Conference, August 21-25 1988 (to be published).
44. Clarke. J.: Superconducting QUantum Interference Devices for Low Frequency Measurements. Superconductor Applications : SQUIDs and Machines, Ed. Schwartz. B. B.and Foner. S. (Plenum New York 1977). pp 67-124.
45. Giffard. R. P., Webb. R.A. and Wheatley. J.C.: Principles and methods of low-frequency electric and magnetic measurements using rf-biased point-contact superconducting device. J. Low. Temp. Phys. 6.533-610 (1972)
46. Kurkijarvi. J.: Intrinsic fluctuations in a superconducting ring closed with a Josephson junction. Phys. Rev. B 6.832-835 (1972)
47. Kurkijarvi. J. and Webb. W.W.: Thermal noise in a superconducting flux detector. Proc. Applied Superconductivity Conf. (Annapolis, MD.) 581-587(1972)
48. Jackel. L.D. and Buhrman. R.A.: Noise in the rf SQUID. J. Low. Temp. Phys. 19. 201-246 (1975)
49. Ehnholm. G.J.: Complete linear equivalent circuit for the SQUID. SQUID Superconducting Quantum Interference Devices and their Applications. Ed. Hahlbohm. H.D. and Lubbig. H. (Walter de Gruyter, Berlin, 1977) 485-499; Theory of the signal transfer and noise properties of the rf SQUID. J. Low. Temp. Phys. 29.1-27(1977)
50. Hollenhorst. H.N. and Giffard. R.P.: Input noise in the hysteretic rf SQUID: theory and experiment J. Appl. Phys. 51.1719-1725 (1980)
51. Kurkijarvi. J.: Noise in the superconducting flux detector. J. Appl. Phys. 44. 3729-3733 (1973)
52. Giffard. R.P., Gallop. J.C. and Pe'ley. B.N.: Applications of the Josephson effects. Prog. Quant. Electron 4. 301-402 (1976)
53. Ehnholm. GJ„ Islander. ST., Ostman. P. and Rantala. B.: Measurements of SQUID equivalent circuit parameters. J. de Physique 39. colloque C6. 1206-1207 (1978)
54. Giffard. R.P. and Hollenhorst. J.N.: Measurement of forward and reverse signal transfer coefficients for an rf-biased SQUID. Appl. Phys. Lett. 32. 767-769(1978)
55. Jackel. L. D., Webb. W. W., Lukens. J. E. and Pei. S. S.: Measurement of the probability distribution of thermally excited fluxoid quantum transitions in a superconducting ring closed by a Josephson junction. Phys. Rev. B9.115-118 (1974)
56. Long. A., Clark. T. D„ Prance. R. J. and Richards. M. G.: High performance UHF SQUID magnetometer. Rev. Sci. Instrum. 50. 1376-1381 (1979)
57. Hollenhorst. J. N. and Giffard. R. P.: High sensitivity microwave SQUID. IEEE Trans. Magn.MAG-15. 474-477(1979)

- 2 3 9 -
58. Ahola. H., Ehnholm. G. H., Rantala. B. and Ostman. P.: Cryogenic GaAs-FET amplifiers for SQUIDs. J. de Physique 39. colloque C6. 1184-1185 (1978); J. Low Temp. Phys. 35.313-328 (1979)
59. For a review, see Clarke. J.: Advances in SQUID Magnetometers. IEEE Trans. Election Devices. ED-27.1896-1908 (1980)
60. Zimmerman. J. E.: Sensitivity enhancement of Superconducting Quantum Interference Devices through the use of fractional-turn loops. J. Appl. Phys. 42.4483-4487 (1971)
61. Shoenberg. D.: Superconductivity (Cambridge University Press 1962) 30.
62. For a review, see Clarke. J.: Geophysical Applications of SQUIDs. IEEE Trans. Magn. MAG-19. 288-294 (1983)
63. De Waal. V. J. and Klapwijk. T. M.: Compact Integrated dc SQUID gradiometer. Appl. Phys. Lett 41.669-671 (1982)
64. Van Nieuwenhuyzen G. J. and de Waal. V. J.: Second order gradiometer and dc SQUID integrated on a planar substrate. Appl. Phy. Lett. 46.439-441 (1985)
65. Carelli. P. and Foglietti. V.: A second derivative gradiometer integrated with a dc superconducting interferometer. J. Appl. Phys. 54.6065-6067 (1983)
66. Koyangi. M, Kasai. N., Chinore. K., Nakanishi. M. and Kosaka. S.: An integrated dc SQUID gradiometer for biomagnetic application. Proceedings of the Applied Superconductivity Conference August 21-25, 1988 (to be published)
67. Knuutila. J., Kajola. M., Mutikainen. R., Salmi. J.: Integrated planar dc SQUID magnetometers for multichannel neuromagnetic measurements. Proc. ISEC '87 p. 261
68. For reviews, see Romani. G. L., Williamson. S. J. and Kaufman. L.: Biomagnetic instrumentation. Rev. Sci. Instnim. 53.1815-1845 (1982); Buchanan. D. S., Paulson. D. and Williamson. S. J.: Instrumentation for clinical applications of neuromagnetism. Adv. Cryo. Eng. (to be published)
69. Knuutila. J.: European Physical Society Workshop "SQUID: State of Art, Perspectives and Applications". Rome, Italy June 22-24, 1988 (unpublished)
70. Barth. D. S., Sutherling. W., Engel. J. Jr. and Beatty J.: Neuromagnetic evidence of spatially distributed sources underlying epileptiform spikes in the human brain. Science 223.293-296 (1984)
71. Romani. G. L., Williamson. S. J. and Kaufman. L.: Tonotopic organization of the human auditory cortex. Science 216. 1339-1340 (1982)
72. Cabrera. B.: First results from a superconductive detector for moving magnetic monopoles. Phys. Rev. Lett. 48.1378-1381 (1982)
73. Quantum Design, 11568 Sorrento Valley Road, San Diego, CA 92121.

-240-74. Ketchen. M. B., Kopley. T. and Ling. H.: Minature SQUID
susceptomcter. Appl Phys. Lett 44.1008-1010(1984) 75. Awschalom. D. D. and Wamock. J.: Picosecond magnetic spectroscopy
with integrated dc SQUIDs. Proceedings of the Applied Superconductivity Conference August 21-25,1988 (to be published)
76. Clarke. J.: A superconducting galvanometer employing Josephson tunneling. Phil. Mag. 13.115-127 (1966)
77. Hilbert. C and Clarke. J.: DC SQUIDs as radiofrequency amplifiers. J. Low Temp.-Phys. 61.263-280 (1985)
78. Tesche. C. D. and Clarke. J.: DC SQUID: current noise. J. Low Temp. Phys. 37. 397-403 (1979)
79. Hilbert C and Clarke. J.: Measurement of the dynamic input impedance of a dc SQUID. J. Low Temp. Phys. 61.237-262 (1985)
80. Martinis. J. M. and Clarke. J.: Signal and noise theory for the dc SQUID. J. Low Temp. Phys. 61.227-236 (1985), and references therein.
81. Koch. R.H., Van Harlingen. D. J. and Clarke. J.: Quantum noise theory for the dc SQUID. Appl. Phys. Lett 38.380-382 (1981)
82. Danilov. V. V., Likharev. K. K. and Zorin. A. B.: Quantum noise in SQUIDs. IEEE Trans. Magn. MAG-19.572-575 (1983)
83. Hilbert. G, Clarke. J., Sleator. T. and Hahn. E. L.: Nuclear quadruple resonance detected at 30MHz with a dc superconducting quantum interference device. Appl. Phys. Lett. 47. 637-639 (1985). (See references therein for earlier work on NMR with SQUIDS).
84. Fan. N. Q., Heaney. M.B., Claike. J., Newitt. D., Wald. L. L., Hahn. E. L., Bielecke. A. and Pines. A.: Nuclear magnetic resonance with dc SQUID preamplifiers. Proceedings of the Applied Superconductivity Conference August 21-25 (1988)
85. Sleator. T., Hahn. E. L., Heaney, M.B., Hilbert. C. and Clarke. J.: Nuclear electric quadrupole induction of atomic polarization. Phys. Rev. Lett. 57.2756-2759 (1986)
86. Sleator. T., Hahn. E. L., Hilbert, C. and Clarke. J.: Nuclear-spin noise and spontaneous emission. Phys. Rev. B. 36.1969-1980 (1987)
87. For an elementary review on gravity waves, see Shapiro. S. L, Stark. R.F. and Teukolsky. S. J.: The search for gravitational waves. Am. Sci. 73. 248-257 (1985)
88. For a review on gravity-wave antennae, see Michelson. P. F., Price. J. C. and Taber. R. G: Resonant-mass detectors of gravitational radiation. Science 237.150-157 (1987)
89. Paik. H. J.: Superconducting tensor gravity gradiometer with SQUID readout. SQUID Applications to Geophysics. Ed. Weinstock H. and Overton. W. G, Jr. (Soc. of Exploration Geophysicists, Tulsa, Oklahoma, 1981)3-12
90. Mapoles. E.: A superconducting gravity gradiometer. ibid. 153-157 91. Bednorz. J. G. and Muller. K. A.: Possible high Tc superconductivity in
the Ba-La-Cu-0 system. Z Phys. B64.189-193 (1986)

- 2 4 1 -
92. Koch.R.H.,Umbach.CP.,aariLG.J,aiaudhari.P.andLailK)witz.R^ B.: Quantum interference devices made from superconducting oxide thin films. AppLPhys.Lett51.200-202(1987)
93. Zimmerman. J. E.v Beall. J. A., Cromar. M. W. and Ono. R. H.: Operation of a Y-Ba-Cu-O rf SQUID at 81K. AppL Phys. Lett 51.617-618(1987)
94. Ferrari. M. J., Johnson. M., Wellstood. F. C , Clarke. J-, Rosenthal. P. A., Hammond. R. H. and Beasley. M. R.: Magnetic flux noise in thin film rings of YBazOi^. fi. Appl. Phys. Lett 53.695-697 (1988)
95. Shkxa. T., Takechi. K., Takai. Y and Hayakawa. H.: An observation of quasiparticle tunneling characteristics in all Y-Ba-Cu-0 thin film tunnel junctions (unpublished)
96. Mankiewich. P. M., Schwartz. D. B., Howard. R. E., Jackel. L. D., Straughn. B. L., Burkhardt E. G. and Dayem. A. H.: Fabrication and characterization of an YBå^Cu^j/AuTfBz^Cu^j S-N-S mkrobridge. Fifth International Workshop on Future Electron Devices-High Temperature Superconducting Devices. June 2-4, 1988, Miyaki-Zao, Japan. 157-160

Rise National Laboratory Rise _ M - 2756
THte U)
suPERCONDUcnvrry
Lecture notes of basic courses presented at 1* Topsøe Summer School on Superconductivity
Editors: NJH. Andersen and K. Mortensen
oat* December 1988
W i p i i l a w t ar
Physics
Gra. rcgniratia« W
Ptajact/caatract a*.
241 10 itral 128 219 isaM 87-550-14771
clwrJ
This report contains lecture notes of the basic lectures presented at the 1st Topsøe Summer School on Superconductivity held at Risø National Laboratory, June 20-24, 1968. The following lecture notes are included: L.M. Falicov: "Superconductivity: Phenomenology, A. Bohr and O. UUbeck: "Quantal structure of superconductivity. Gauge angle", G. Aeppli: "Moons, neutrons and superconductivity", N.F. Pedersen: "The Josephson junction", C. Michel: "Physicochemistry of bigfa-Tc superconductors", C. Laverick and JJK. Hulm: "Manufacturing and application of superconducting wires", J. Clarke: "SQUID concepts and systems".
Daacrrptars
RRKnonr.ft

Available on exchange from: Risø Library, Risø National Laboratory, P.O. Box 49, DK-4000 Roskilde, Denmark ISBN 87-550-1477-1 Phone (02) 37 12 12 ext. 2262 ISSN 0418-6435