Embed Size (px)
Citation preview

Superannuation account balances by age and gender
October 2017Ross Clare, Director of ResearchASFA Research and Resource Centre

The Association of Superannuation Funds of Australia Limited (ASFA)PO Box 1485, Sydney NSW 2001T +61 2 9264 9300 or 1800 812 798 (outside Sydney)F 1300 926 484
ABN 29 002 786 290ACN 002 786 290
This material is copyright. Apart from any fair dealing for the purpose of private study, research, criticism or review as permitted under the Copyright Act, no part of this publication may be reproduced, stored in a retrieval system, or transmitted in any form or by any means, electronic, mechanical, photocopying, recording or otherwise without prior written permission.
Enquiries are to be made to The Association of Superannuation Funds of Australia Limited.
www.superannuation.asn.au
© ASFA 2017
October 2017 Version 01

Superannuation account balances by age and gender | 3 of 22
Executive summary 4
Average account balances 4
Superannuation balances of younger Australians 4
Superannuation balances at retirement 5
The distribution of superannuation balances 5
Shares of total superannuation by age and gender 5
Difference in superannuation balances of men and women 6
Section 1: How are retirement savings tracking? 7
Background 7
Introduction 7
The impact of recent investment returns 8
Average account balances 8
Superannuation balances of younger Australians 12
Superannuation balances at retirement 13
Section 2: Distribution of super balances by household and by state or territory 14
Section 3: The distribution of superannuation balances 16
Section 4: Distribution of super balances by household and by state or territory 19
Section 5: Shares of total superannuation by age and gender 20
Contents

4 of 22 | Superannuation account balances by age and gender
Executive summary
Data on both average superannuation account balances and the distribution of balances across the population has recently become available with release of data from the Australian Bureau of Statistics Survey of Income and Housing.
The data indicate that the superannuation system is strongly delivering in the form of increasing superannuation account balances across the community. In addition to the overall pie getting bigger, groups such as women are getting a bigger slice of the benefits as a result of policy changes and other factors.
While some retirees will continue to rely substantially on the Age Pension, increasing superannuation balances at the time of retirement are substantially boosting the living standards of retirees.
Average account balances
Account balances grew strongly over the two years to 2015-16.
Average balances achieved in 2015-16 for all persons aged 15 and over were $111,853 for men and $68,499 for women.
These figures are well up on the equivalent figures for two years’ earlier, particularly for women. Average balances achieved in 2013-14 for all persons aged 15 and over were $98,535 for men and $54,916 for women. Averages in 2011-12 were even lower at $82,615 for men and $44,866 for women.
The disparity between the average balances of men and women decreased over the two years to 2015-16.
Balances grew because of continued contributions and positive investment earnings.For only those with superannuation (excluding persons with a nil balance), the average balance for males was around $153,000 while for females it was around $102,000.
Superannuation balances of younger Australians
• For individuals aged 30 to 34 in 2015-16 average balances were around $43,580 for men and $33,750 for women.
• These averages are well up on the averages in 2013-14 of around $36,400 for men and $25,550 for women. The average increase over the two years for this age group was nearly 20 per cent for men 32 per cent for women.

Superannuation account balances by age and gender | 5 of 22
Superannuation balances at retirement
• Average superannuation balances at the time of retirement (assumed to be age 60 to 64) in 2015-16 were $270,710 for men and $157,050 for women.
• These averages show mixed developments in superannuation balances at the time of retirement. In 2013-14 there were averages of $292,500 for men and $138,150 for women. Further contributions and investment earnings would have added to balances, but tighter contribution caps also would have had an effect over the period, which would explain at least part of the fall in the average figure for men.
• Many recent retirees will need to substantially rely on the Age Pension in their retirement.
• Medians (the amount at which 50 per cent of the population surveyed have less than the amount) are somewhat lower for those aged 60-64, with a median of $110,000 for men and $36,000 for women.
• These various figures are well up on even just two years earlier, reflecting the growing maturity of the system. However, they fall well short of the $545,000 needed for a comfortable retirement (according to the ASFA Retirement Standard) for a single person.
• Both average balances and the proportion of retirees with superannuation will rise in the future as the compulsory superannuation system matures and as the rate of compulsory contributions rises to 12 per cent of wages. In particular, generations of women with more time in the paid labour force than their mothers and grandmothers will move through the system.
• The average total superannuation balance in 2015-16 for a household headed by a person aged 60 to 64 was around $337,100 with a median value of $154,950.
The distribution of superannuation balances
• Between 2005-06 and 2015-16 there were substantial improvements in the coverage of superannuation in the community with a smaller proportion of persons with no superannuation and an increase in the incidence of more substantial superannuation balances.
• Around 27.0 per cent of males reported nil superannuation in 2015-16, and 32.7 per cent of women with no superannuation. The figure for males is not much changed from two years earlier with the figure for females down slightly. Around 45 per cent of females aged 65 to 69 reported having no superannuation.
• The percentage of males with more than $100,000 in superannuation increased from 21.5 per cent two years earlier to 25.8 per cent, while for females the percentage increased from 12.8 per cent to 16.4 per cent.
Shares of total superannuation by age and gender
Given that the incidence of superannuation is higher for men and their account balances are on average higher, men held 61.2 per cent of total account balances in 2015-16 compared to around 38.7 per cent for women. The share held by women increased by a substantial two percentage points compared to two years earlier. While on the face of it this still remains a very substantial disparity, it amounts to a very substantial improvement on the estimated share for women in 1994 of 23 per cent.
The percentage share figures also clearly demonstrate both the build-up of superannuation assets with increasing age but also cohort effects with older Australians (those aged over 75) having relatively little superannuation on average. The age group 60 to 64 appears to be the one where holdings of superannuation peak.
While the 9.1 per cent of the population aged 25 to 29 have just 2 per cent of total superannuation assets, the 7.6 per cent of the population aged 55 to 59 hold around 15.5 per cent of superannuation assets. Around 58 per cent of total superannuation assets are held by those aged between 50 and 69.

6 of 22 | Superannuation account balances by age and gender
Difference in superannuation balances of men and women
The various data indicate that on average men are more likely both to have superannuation and to have a higher account balance. There are a number of reasons for this, including women having more time out of the paid labour force for family and other reasons and women more likely to be employed in part-time and/or lower paid occupations.
The data appear to indicate that the share of superannuation assets held by women has grown significantly over the two years to 2015-16 after a pause in the growth of the share over the preceding four years.
ASFA has also recommended a number of policy changes that would further improve superannuation outcomes for both for women and men. These include:
• Abolition of the $450 a month threshold for payment of Superannuation Guarantee contributions.
• Payment of superannuation contributions linked to paid parental leave.
• Providing an ability for individuals to make catchup contributions when their account balance is low.
• Increasing the rate of the Superannuation Guarantee to 12 per cent as soon as possible.

Superannuation account balances by age and gender | 7 of 22
1 How are retirement savings tracking?
Background
A perennial question for individuals and policymakers is whether retirement savings are on track.
If superannuation balances at the time of retirement and in the years prior to retirement are still at modest, albeit growing, levels the case of moving the Superannuation Guarantee to 12 per cent is all the stronger.
Data from the ABS Survey of Household Income and Wealth which have been specially compiled for ASFA by the ABS allow for an updating of information on the incidence of superannuation in the community and on the distribution of superannuation assets between individuals.
Wealth information (including for superannuation) is available from the 2003-04, 2005-06, 2009-10, 2011-12 and 2013-14 releases and is now available for 2015-16. A paper on the superannuation data from the 2013-14 survey, dated December 2015, is available from the ASFA website.
Introduction
Many people will still retire with inadequate superannuation savings to fund the lifestyle they want in retirement. However, average superannuation balances in Australia can be expected to continue to grow for many years as the private retirement income system matures.
The Australian compulsory superannuation system is still relatively immature in the sense that many individuals have had superannuation coverage only since the commencement of industrial award based superannuation in the late 1980s and the introduction of the Superannuation Guarantee in 1992. The Superannuation Guarantee (SG) reached the rate of 9 per cent in only 2002. A phased increase in the rate to 12 per cent has commenced and in 2015-16 the rate was 9.5 per cent. It is currently legislated to increase to 12 per cent but it is paused at 9.5 per cent until 2021.
Given that the system is still maturing in terms of reaching the proposed long term rate of contributions and many Australians having received compulsory contributions for not much more than 20 years, the majority of adult Australians still have relatively modest levels of superannuation:
• The gender gap is closing, but women still lag substantially when it comes to average account balances at all ages.
• Even young people entering the workforce today, many of whom will receive the full benefit of the increase in the Superannuation Guarantee to 12 per cent, still need to contribute over and above compulsory contributions to their superannuation to ensure they have adequate retirement savings.
• Most people retiring in the next few years will rely partially or substantially on the Age Pension for some or all of their retirement as they have inadequate super savings.
• There is still a significant proportion of the population who do not have any superannuation, with around 1 in 4 men and 1 in 3 women reporting they have no superannuation savings.
It will be another 30 years or more before most individuals will have the full benefit of a mature SG system. Even then, a small but significant minority of retirees, principally those who have had little or no paid labour force experience since 1992 or who have cashed out their super benefit, will have no superannuation at all.

8 of 22 | Superannuation account balances by age and gender
The impact of recent investment returns
While there has been volatility from year to year in investment returns for the average superannuation accounts, the investment return over a number of years has been substantial. This has contributed to the increase in balances.
There were positive investment returns on average in the two years from 2013-14 when the previous balances were recorded by the ABS. According to estimates prepared for Superfunds magazine by Morningstar, average returns were 9.9 per cent in 2014-15 and 3.1 per cent in 2015-16. While not reflected in the balance figures in this paper, average investment returns were 10.4 per cent in 2016-17.
Over the five years to 30 June 2016 the average investment return for typical default investment options was 8.4 per cent and 7.1 per cent over the twenty years to 30 June 2016. As many superannuation fund members may still remember, the Global Financial Crisis (GFC) had an impact on the retirement savings of many Australians, at least for a time. The GFC is generally regarded as having run its course by the end of 2008 or the first half of 2009. The negative investment returns on average in 2007-08 and 2008-09 now no longer impact on the 5 year average figures.
Average account balances
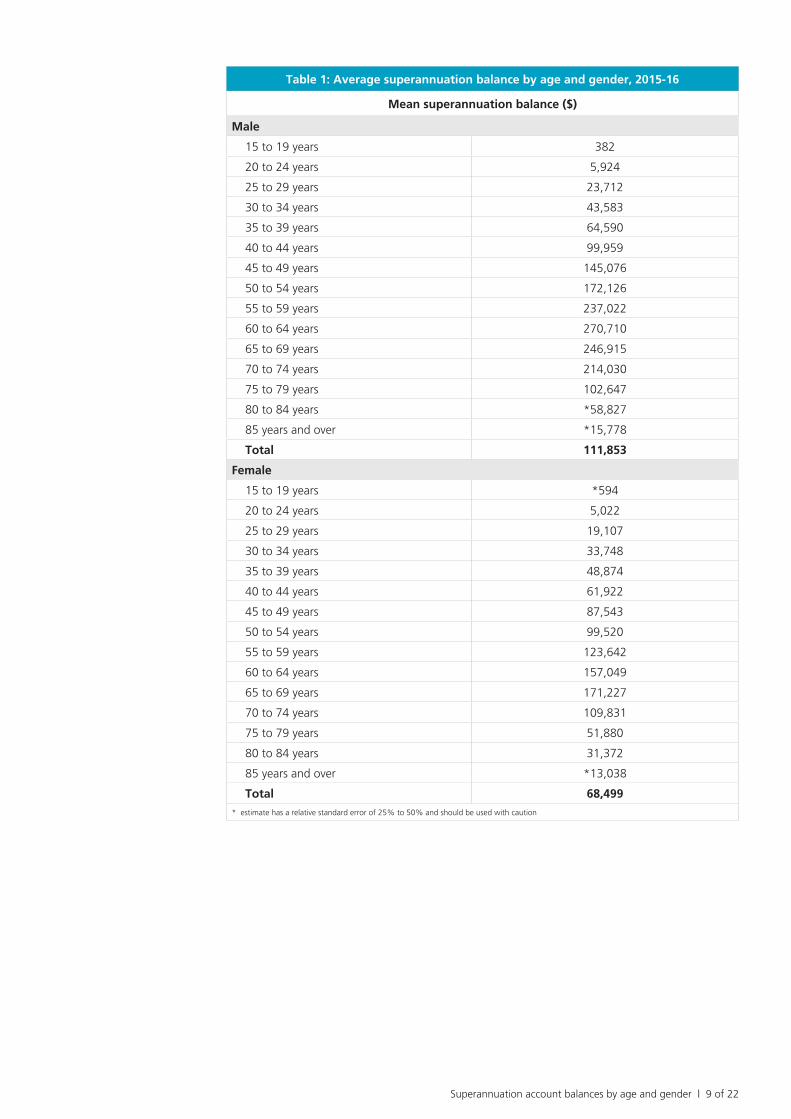
Account balances grew strongly over the two years to 2015-16, particularly for women. Balances grew largely because of continued contributions and positive investment earnings.
Average balances in 2015-16 for all persons aged 15 and over were $111,853 for men and $68,499 for women. These compare to average balances in 2013-14 of $98,535 for men and $54,916 for women. Averages in 2011-12 were even lower at $82,615 for men and $44,866 for women.
For only those with superannuation (excluding persons with a nil balance), the average balance for males was around $153,000 while for females it was around $102,000.
Table 1 provides further details of average balances in 2015-16 by age and gender.
Superannuation account balances by age and gender | 9 of 22
Table 1: Average superannuation balance by age and gender, 2015-16
Mean superannuation balance ($)
Male
15 to 19 years 382
20 to 24 years 5,924
25 to 29 years 23,712
30 to 34 years 43,583
35 to 39 years 64,590
40 to 44 years 99,959
45 to 49 years 145,076
50 to 54 years 172,126
55 to 59 years 237,022
60 to 64 years 270,710
65 to 69 years 246,915
70 to 74 years 214,030
75 to 79 years 102,647
80 to 84 years *58,827
85 years and over *15,778
Total 111,853
Female
15 to 19 years *594
20 to 24 years 5,022
25 to 29 years 19,107
30 to 34 years 33,748
35 to 39 years 48,874
40 to 44 years 61,922
45 to 49 years 87,543
50 to 54 years 99,520
55 to 59 years 123,642
60 to 64 years 157,049
65 to 69 years 171,227
70 to 74 years 109,831
75 to 79 years 51,880
80 to 84 years 31,372
85 years and over *13,038
Total 68,499
* estimate has a relative standard error of 25% to 50% and should be used with caution

10 of 22 | Superannuation account balances by age and gender
Table 1: Average superannuation balance by age and gender, 2015-16
Mean superannuation balance ($)
Persons
15 to 19 years 485
20 to 24 years 5,501
25 to 29 years 21,372
30 to 34 years 38,386
35 to 39 years 56,715
40 to 44 years 80,899
45 to 49 years 114,616
50 to 54 years 135,290
55 to 59 years 180,689
60 to 64 years 214,897
65 to 69 years 207,105
70 to 74 years 161,974
75 to 79 years 76,049
80 to 84 years 42,912
85 years and over *14,374
Total 89,927
* estimate has a relative standard error of 25% to 50% and should be used with caution
For both men and women the average balance increases steadily by age group up until about age 60 when average balances start to decrease. The decrease is due to both individuals starting to draw down on their superannuation and larger proportions of older age cohorts, particularly women, not ever having had superannuation.
The figures in the table are averages and distributions for all persons in the various age groups. Medians (the point where 50 per cent of those surveyed have a balance above the amount and 50 per cent below) are considerably below the average figures given that a significant proportion of each age group has nil or little superannuation (Table 2). For instance, the median for all males is $25,000 compared to an average (mean) of $111,853 as indicated in Table 1.
Source: Survey of Income and Housing, Australia, 2015–16, Australian Bureau of Statistics

Superannuation account balances by age and gender | 11 of 22
Table 2: Median balance by age and gender, 2015-16
Male
15 to 19 years 0
20 to 24 years 2,000
25 to 29 years 15,000
30 to 34 years 30,000
35 to 39 years 50,000
40 to 44 years 70,000
45 to 49 years 90,000
50 to 54 years 99,000
55 to 59 years 115,000
60 to 64 years 110,000
65 to 69 years *32,284
70 to 74 years 0
75 to 79 years 0
80 to 84 years 0
85 years and over 0
Total 25,000
Female
15 to 19 years 0
20 to 24 years 2,000
25 to 29 years 11,000
30 to 34 years 23,396
35 to 39 years 32,792
40 to 44 years 35,000
45 to 49 years 41,898
50 to 54 years 45,000
55 to 59 years 50,000
60 to 64 years 36,003
65 to 69 years **9,923
70 to 74 years 0
75 to 79 years 0
80 to 84 years 0
85 years and over 0
Total 10,700
* estimate has a relative standard error of 25% to 50% and should be used with caution
** estimate has a relative standard error greater than 50% and is considered too unreliable for general use

12 of 22 | Superannuation account balances by age and gender
Table 2: Median balance by age and gender, 2015-16
Persons
15 to 19 years 0
20 to 24 years 2,000
25 to 29 years 13,799
30 to 34 years 27,000
35 to 39 years 40,000
40 to 44 years 50,000
45 to 49 years 63,997
50 to 54 years 66,677
55 to 59 years 77,795
60 to 64 years 68,000
65 to 69 years *20,000
70 to 74 years 0
75 to 79 years 0
80 to 84 years 0
85 years and over 0
Total 17,000
* estimate has a relative standard error of 25% to 50% and should be used with caution
** estimate has a relative standard error greater than 50% and is considered too unreliable for general use
These median figures are strongly affected by the percentage of the population with no superannuation.
Around 27.0 per cent of males reported nil superannuation in 2015-16, and 32.7 per cent of women with no superannuation. The figure for males is not much changed from two years earlier with the figure for females down slightly.
Around 45 per cent of females aged 65 to 69 reported having no superannuation. The fact that a very substantial minority of that group had no superannuation would be a result of some in the age group never having had super, while others would have had superannuation at some stage but had taken their benefit from the superannuation system.
Superannuation balances of younger Australians
There is a clear relationship between age and average superannuation balance, at least up until retirement. The more years an individual has of contributions and investment earnings the higher their account balance.
Disparities between men and women in average balances begin to emerge at relatively early ages. For instance, for those aged 30 to 34 in 2015-16 average balances were around $43,580 for men and $33,750 for women.
A lower wage and/or career breaks will lead to a lower balance at retirement. For instance, 5 years out of the paid labour force for a person on average earnings during their early 30s will reduce the eventual retirement account balance by over $80,000 in today’s dollars.
Source: Survey of Income and Housing, Australia, 2015–16, Australian Bureau of Statistics
Superannuation account balances by age and gender | 13 of 22
Superannuation balances at retirement
The average balance for those aged 60 to 64 is a reasonable proxy for average retirement payouts given that most individuals retire at or around their early 60s. Average superannuation balances at the time of retirement (assumed to be age 60 to 64) in 2015-16 were $270,710 for men and $157,050 for women. In 2013-14 average balances for this age group were $292,510 for men and $138,154 for women. Further contributions and investment earnings would have added to balances, but tighter contribution caps also would have had an effect over the period, which would explain at least part of the fall in the average figure for men.
However, these average figures for 2015-16 are considerably higher than those which applied in 2011-12 of the order of $197,000 for men and only $105,000 for women.
Median figures (where 50 per cent have more than the figure and 50 per cent have less) are considerably lower than the average (mean) figures. In 2015-16 the median figure for men aged 60 to 64 was $110,000 while for women it was only $36,000. For households, the equivalent figures are $200,000 for households where the reference person is a man, and $95,000 where the reference person is a woman.
These figures are well up on even just two years earlier, reflecting the growing maturity of the system. However, they fall well short of the $545,000 needed for a comfortable retirement (according to the ASFA Retirement Standard) for a single person.
It is clear that most recent retirees will need to substantially rely on the Age Pension in their retirement. That said, superannuation account balances already are sufficient to deliver a significant increase in living standards in retirement for most recent retirees.
Average balances will rise even more in the future as the compulsory superannuation system matures. In particular, cohorts of women with more paid labour force experience than their mothers and grandmothers will move through the system. These effects are already starting to show up in the data. However, early retirement, retrenchment and withdrawal from the paid labour force for family and other reasons also will have an impact.

14 of 22 | Superannuation account balances by age and gender
Distribution of super balances by household and by state or territory
Most retirees are in households made up of more than one person, but a significant minority of retirees are single, divorced or widowed persons. However, around two-thirds of those aged 65 and over are in a couple household. While the rate of divorce has increased, many people who divorce remarry and with men living longer on average there are fewer widows.
As indicated by Table 3, average balances per household are less than the total of the average superannuation held by both a male and a female in the same age group as the reference person for a household. Very often there will be a secondary income earner in a couple who has a lower income and lower superannuation balance than their partner or their age group more generally.
The average total superannuation balance for a household headed by a person aged 60 to 64 was $337,100. The balance at age 60 to 64 generally can be taken as a proxy for what the average amount of superannuation for a household is at retirement but it should also be noted that many households have a mixture of generations, with the superannuation of a 30 year old child not available to their 62 year old parent.
The differences between the various States and Territories in average balances per household reflect a range of demographic and economic factors. In the Australian Capital Territory the impact of more generous public sector superannuation schemes can be seen. Average wages in the Australian Capital Territory are higher than elsewhere, which also boosts superannuation entitlements. The lowest average balances for households are in Tasmania and South Australia.
Table 3: Average balance for households, 2015-16
State or territory
NSW VIC QLD SA WA TAS NT(a) ACT Australia
Mean superannuation balance ($)
Male15 to 19 years **4,057 **9,669 **6,802 *707 0 **777 0 0 *5,738
20 to 24 years 35441 *10,827 33,727 *13,978 19,011 19,743 **17,023 *11,092 *24,800
25 to 29 years 64268 40,139 58,346 38,528 38,055 40,081 59,637 *80,989 50,693
30 to 34 years 89367 53,444 87,986 75,279 81,751 63,123 74,588 116,498 78,287
35 to 39 years 91295 100,743 133,969 88,046 144,462 114,849 *102,502 191,803 110,154
40 to 44 years 155113 146,635 168,652 150,679 148,101 149,071 *120,776 204,712 156,913
45 to 49 years 243888 212,892 227,897 256,561 198,510 176,585 176,694 306,785 227,773
50 to 54 years 225542 263,209 228,418 232,291 236,796 229,771 *227,057 487,215 239,819
55 to 59 years 368949 339,448 288,738 270,905 353,743 198,898 *281,872 569,758 340,675
60 to 64 years 433144 436,588 373,168 342,401 340,030 197,934 370,349 487,985 403,287
65 to 69 years 397298 463,733 526,492 279,858 *543,052 258,065 **180,988 517,060 441,620
70 to 74 years 371963 475,961 *461,478 265,517 188,197 132,469 *1,152,055 *321,168 367,604
75 to 79 years 167609 *224,729 212,064 *206,832 *163,411 **40,226 **25,697 *507,546 197,099
80 to 84 years 127652 **67,949 *123,199 *73,191 **63,748 **10,694 **20,029 **100,668 *102,280
85 years and over 18743 *74,758 **8,644 **123,042 *96,771 **17,361 0 **21,738 *45,563
Total 225,813 223,321 220,273 188,360 208,490 144,784 195,025 300,639 *217,871
* estimate has a relative standard error of 25% to 50% and should be used with caution
** estimate has a relative standard error greater than 50% and is considered too unreliable for general use
(a) Households in SA1s defined as Very Remote were excluded, accounting for about 23% of the population of NT
2

Superannuation account balances by age and gender | 15 of 22
Table 3: Average balance for households, 2015-16
State or territory
NSW VIC QLD SA WA TAS NT(a) ACT Australia
Mean superannuation balance ($)
Female
15 to 19 years 0 **14 **2,895 **2,131 0 0 0 0 **1,945
20 to 24 years *12,953 *9,875 33,321 *9,683 *13,901 *9,076 **28,512 **12,330 15,825
25 to 29 years 40,859 37,708 44,016 *53,959 42,694 47,073 *79,758 48,625 41,613
30 to 34 years 79,495 59,290 84,313 55,848 52,641 54,050 *64,244 104,284 70,213
35 to 39 years 91,197 102,957 98,059 73,182 72,862 77,469 *99,755 205,097 92,692
40 to 44 years 141,542 117,149 129,787 135,845 80,944 84,653 **60,355 150,153 124,540
45 to 49 years 213,650 129,056 178,534 117,152 148,685 142,190 *137,771 439,719 169,371
50 to 54 years 198,212 200,391 200,215 *193,440 126,058 163,959 *187,341 *307,193 196,068
55 to 59 years 282,346 272,665 250,054 145,863 *388,394 219,280 *252,023 *529,487 275,405
60 to 64 years 200,470 278,488 *246,050 212,927 *272,878 194,548 *315,951 *240,919 245,301
65 to 69 years 274,804 270,729 208,094 *194,111 *163,765 148,290 **241,405 *207,101 238,392
70 to 74 years *183,467 146,540 *185,348 *81,984 *196,635 *65,327 **43,337 *153,646 169,203
75 to 79 years *101,341 **43,200 *65,170 *44,196 *86,654 *19,609 **6,201 **289,508 73,424
80 to 84 years *25,987 *29,250 *57,635 *42,586 **38,133 *47,017 **92,416 **12,160 33,955
85 years and over **50,518 **19,251 **7,387 **33,734 *27,347 **7,129 **67,045 **6,660 *33,904
Total 155,324 141,441 144,762 113,911 137,069 110,026 149,148 219,426 144,954
Persons
15 to 19 years **2,401 **4,794 *5,613 **1,719 0 **294 0 0 *3,981
20 to 24 years **22,244 *10,745 34,053 12,809 15,614 14,183 **18,616 *12,434 22,452
25 to 29 years 52,537 39,520 52,123 42,000 40,251 42,166 67,617 69,596 47,127
30 to 34 years 87,450 55,574 87,312 69,589 73,260 59,697 74,152 108,232 75,548
35 to 39 years 91,795 101,024 118,519 82,506 122,755 97,663 100,111 192,548 104,182
40 to 44 years 148,319 136,163 156,935 143,345 128,265 123,894 *103,572 184,009 146,044
45 to 49 years 224,451 181,634 207,357 197,787 179,246 158,920 157,883 372,883 204,114
50 to 54 years 217,662 232,701 224,396 215,453 202,766 211,531 211,735 432,117 223,871
55 to 59 years 331,954 317,611 275,813 221,358 367,704 204,267 272,799 527,662 315,365
60 to 64 years 343,163 364,576 327,782 280,799 319,647 193,639 338,160 376,317 337,122
65 to 69 years 349,388 363,447 389,432 251,226 396,125 206,178 *209,910 407,518 357,114
70 to 74 years 304,057 329,711 *355,753 199,310 201,156 99,728 *667,167 258,917 282,582
75 to 79 years *127,324 *147,549 137,402 *124,318 119,590 *30,275 **10,366 *368,966 137,180
80 to 84 years *72,728 **41,415 *88,310 *51,584 **58,115 *32,759 **50,776 **48,440 65,075
85 years and over *37,115 *45,067 **8,236 **61,826 *62,471 **10,849 **44,223 **10,570 38,633
Total 197,704 188,507 191,609 158,558 181,486 129,291 178,177 263,606 188,351
* estimate has a relative standard error of 25% to 50% and should be used with caution
** estimate has a relative standard error greater than 50% and is considered too unreliable for general use
(a) Households in SA1s defined as Very Remote were excluded, accounting for about 23% of the population of NT
Source: Survey of Income and Housing, Australia, 2015–16, Australian Bureau of Statistics

16 of 22 | Superannuation account balances by age and gender
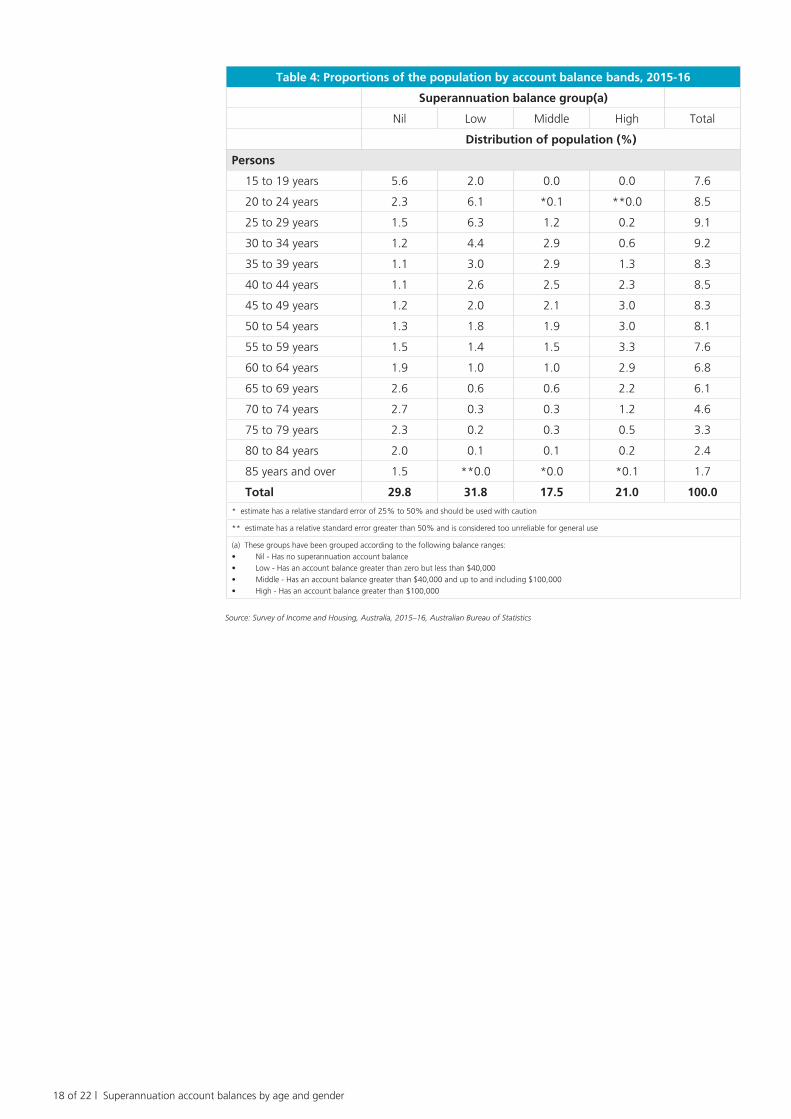
The distribution of superannuation balances
Between 2005-06 and 2011-12 there were substantial improvements in the coverage of superannuation in the community, and in the incidence of more substantial superannuation balances. This has continued into 2015-16.
For instance, the percentage of males with more than $100,000 in superannuation increased from 8.4 per cent in 2005-06 to 18.2 per cent in 2011-12 to 21.5 per cent in 2013-14 to 25.8 per cent in 2015-16, while for females the percentage increased from 2.8 per cent to 10.3 per cent to 12.8 per cent top 16.4 per cent. However, considerable disparities between individuals remain. While the average balance for men aged 60 to 64 was $270,700 around 50 per cent of men in that age group had balances of less than $100,000. Around 65 per cent of women aged 60 to 64 had superannuation balances less than $100,000, with around 50 per cent of women having nil or less than $40,000 (Table 4)
There also are differences in the average balance between men and women even amongst those who had more than $100,000 in superannuation. More specifically, for males in the 60 to 64 age group with more than $100,000 in super, the average balance was around $505,000 while for the women in that age group with more than $100,000 in super the average was $426,000. It is the significant minority of men with large superannuation balances that is a major contributor to the average for men overall being larger than that for women. However, going forward the lower contribution caps introduced in recent years are likely to constrain the achievement of relatively large superannuation balances.
3

Superannuation account balances by age and gender | 17 of 22
Table 4: Proportions of the population by account balance bands, 2015-16
Superannuation balance group(a)
Nil Low Middle High Total
Distribution of population (%)
Male
15 to 19 years 3.0 1.0 0.0 0.0 3.9
20 to 24 years 1.2 3.1 *0.1 **0.0 4.3
25 to 29 years 0.7 3.1 0.7 0.1 4.5
30 to 34 years 0.5 2.1 1.6 0.4 4.5
35 to 39 years 0.4 1.3 1.6 0.8 4.1
40 to 44 years 0.4 1.0 1.3 1.5 4.2
45 to 49 years 0.4 0.8 1.0 1.9 4.1
50 to 54 years 0.6 0.7 0.8 1.9 4.0
55 to 59 years 0.6 0.6 0.6 2.0 3.7
60 to 64 years 0.7 0.5 0.5 1.7 3.3
65 to 69 years 1.2 0.3 0.3 1.2 3.0
70 to 74 years 1.2 0.1 0.2 0.7 2.2
75 to 79 years 1.0 0.1 0.1 0.4 1.6
80 to 84 years 0.8 0.1 *0.1 0.1 1.1
85 years and over 0.6 **0.0 **0.0 **0.0 0.7
Total 13.3 14.6 8.8 12.7 49.2
Female
15 to 19 years 2.7 1.0 0.0 0.0 3.7
20 to 24 years 1.1 3.0 **0.0 0.0 4.2
25 to 29 years 0.8 3.2 0.5 *0.1 4.6
30 to 34 years 0.8 2.3 1.3 0.2 4.6
35 to 39 years 0.7 1.7 1.3 0.6 4.2
40 to 44 years 0.7 1.6 1.3 0.8 4.3
45 to 49 years 0.8 1.3 1.1 1.1 4.2
50 to 54 years 0.8 1.1 1.1 1.2 4.1
55 to 59 years 0.9 0.9 0.9 1.4 3.9
60 to 64 years 1.2 0.6 0.5 1.2 3.5
65 to 69 years 1.4 0.3 0.4 1.0 3.1
70 to 74 years 1.5 0.2 0.2 0.5 2.3
75 to 79 years 1.3 0.1 0.1 0.2 1.7
80 to 84 years 1.2 *0.0 *0.1 0.1 1.4
85 years and over 0.9 **0.0 **0.0 **0.0 1.0
Total 16.6 17.2 8.7 8.3 50.8
* estimate has a relative standard error of 25% to 50% and should be used with caution
** estimate has a relative standard error greater than 50% and is considered too unreliable for general use
(a) These groups have been grouped according to the following balance ranges:
• Nil - Has no superannuation account balance
• Low - Has an account balance greater than zero but less than $40,000
• Middle - Has an account balance greater than $40,000 and up to and including $100,000
• High - Has an account balance greater than $100,000
18 of 22 | Superannuation account balances by age and gender
Table 4: Proportions of the population by account balance bands, 2015-16
Superannuation balance group(a)
Nil Low Middle High Total
Distribution of population (%)
Persons
15 to 19 years 5.6 2.0 0.0 0.0 7.6
20 to 24 years 2.3 6.1 *0.1 **0.0 8.5
25 to 29 years 1.5 6.3 1.2 0.2 9.1
30 to 34 years 1.2 4.4 2.9 0.6 9.2
35 to 39 years 1.1 3.0 2.9 1.3 8.3
40 to 44 years 1.1 2.6 2.5 2.3 8.5
45 to 49 years 1.2 2.0 2.1 3.0 8.3
50 to 54 years 1.3 1.8 1.9 3.0 8.1
55 to 59 years 1.5 1.4 1.5 3.3 7.6
60 to 64 years 1.9 1.0 1.0 2.9 6.8
65 to 69 years 2.6 0.6 0.6 2.2 6.1
70 to 74 years 2.7 0.3 0.3 1.2 4.6
75 to 79 years 2.3 0.2 0.3 0.5 3.3
80 to 84 years 2.0 0.1 0.1 0.2 2.4
85 years and over 1.5 **0.0 *0.0 *0.1 1.7
Total 29.8 31.8 17.5 21.0 100.0
* estimate has a relative standard error of 25% to 50% and should be used with caution
** estimate has a relative standard error greater than 50% and is considered too unreliable for general use
(a) These groups have been grouped according to the following balance ranges:
• Nil - Has no superannuation account balance
• Low - Has an account balance greater than zero but less than $40,000
• Middle - Has an account balance greater than $40,000 and up to and including $100,000
• High - Has an account balance greater than $100,000
Source: Survey of Income and Housing, Australia, 2015–16, Australian Bureau of Statistics

Superannuation account balances by age and gender | 19 of 22
Shares of superannuation by taxable income band
The ABS does not provide data on superannuation by income tax band, but this is separately published by the Australian Taxation Office. The latest data are for 2014-15 (Table 5).
The ATO data are broadly consistent with the ABS data but are for a year earlier and the averages are for those who have a superannuation account, not the population more generally. The ATO also has a higher number of individuals with a superannuation account than the ABS data but the overall assets in superannuation figures are quite similar. It is likely that the respondents to the ABS survey do not report small account balances that they have forgotten about or have lost contact with. This does not have a material impact on the overall average balance figures from the ABS survey.
Not surprisingly, average balance tends to rise with income level, reaching a peak of nearly $520,000 for the $180,000 plus taxable income group.
There are significant amounts of superannuation held by those with low or no taxable income. This includes individuals who are temporarily out of the paid labour force or who have retired.Superannuation clearly is not the preserve of those on high taxable incomes. As shown by the Table, around 36 per cent of superannuation assets in 2014-15 were held in accounts of individuals on taxable incomes of less than $37,000 a year or who were not required to lodge a return because they had a low taxable income.
Around 11 per cent of superannuation assets were held by the 2.3 per cent of individuals on taxable incomes of more than $180,000 a year. However, it should be noted that such individuals are responsible for around 30 per cent of the net income tax paid in Australia.
Table 5: Average superannuation balance by income tax band, 2014-15
Taxable incomeIndividuals with
superNet income tax paid
Average super
balance
Share of total super balances
no. % $m % $
$18,200 or less 1,938,506 12.0% 79 0.0% 100,758 10.9%
$18,201 – $37,000 2,784,607 17.3% 4,475 2.5% 77,182 12.0%
$37,001 – $80,000 4,757,215 29.5% 50,427 28.4% 101,739 27.1%
$80,001 – $180,000 2,209,799 13.7% 69,359 39.1% 211,331 26.1%
$180,001 or more 377,034 2.3% 53,247 30.0% 519,597 11.0%
No income tax return 4,038,118 25.1% 0 0.0% 57,908 13.0%
Total 16,105,279 100.0% 177,587 100.0% 111,205 100%
4
Source: Taxation statistics 2014-15, Australian Taxation Office

20 of 22 | Superannuation account balances by age and gender
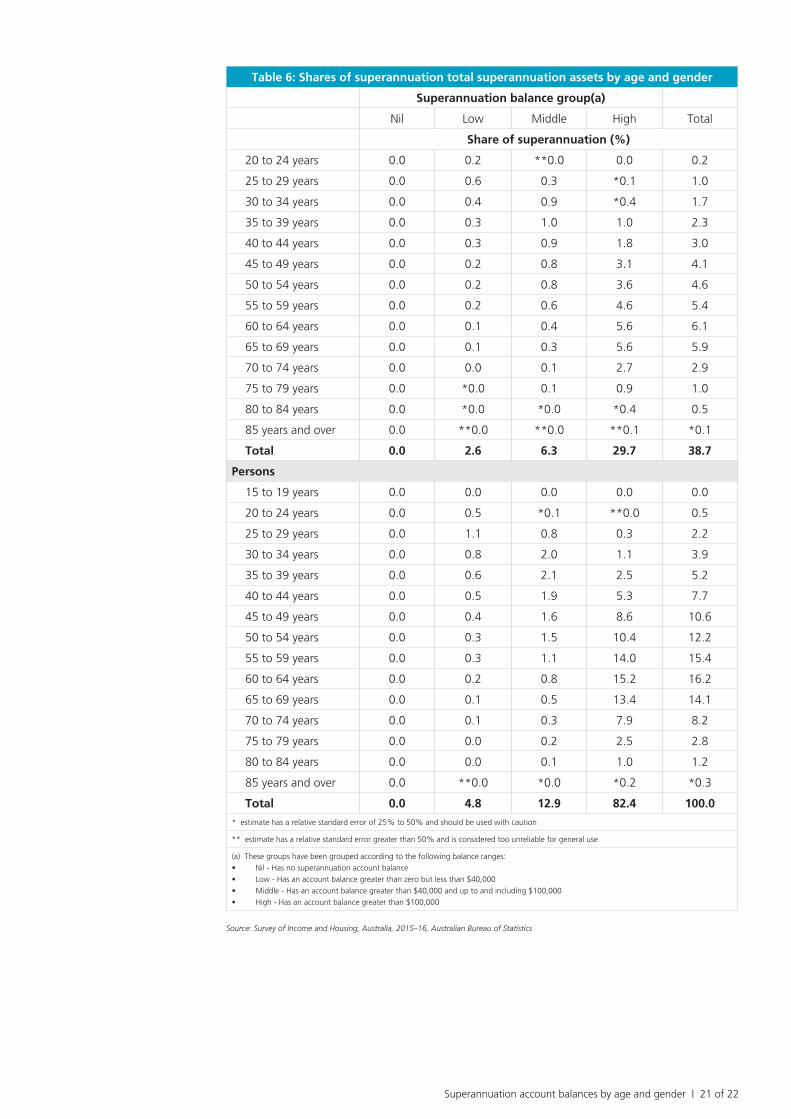
Shares of total superannuation by age and gender
The data clearly indicate that, not surprisingly given the impact of continuing contributions and investment returns, the relative shares of superannuation rise markedly with age. While the 9.1 per cent of the population aged 25 to 29 have just 2 per cent of total superannuation assets, the 7.6 per cent of the population aged 55 to 59 hold around 15.5 per cent of superannuation assets. Around 58 per cent of total superannuation assets are held by those aged between 50 and 69.
Given that the incidence of superannuation is higher for men and their account balances are on average higher, men held 61.2 per cent of total account balances in 2015-16 compared to around 38.7 per cent for women (Table 6). The share held by women increased by a substantial two percentage points compared to two years earlier.
Table 6: Shares of superannuation total superannuation assets by age and gender
Superannuation balance group(a)
Nil Low Middle High Total
Share of superannuation (%)
Male
15 to 19 years 0.0 0.0 0.0 0.0 0.0
20 to 24 years 0.0 0.3 *0.0 **0.0 0.3
25 to 29 years 0.0 0.6 0.4 0.2 1.2
30 to 34 years 0.0 0.4 1.1 0.8 2.2
35 to 39 years 0.0 0.3 1.2 1.5 2.9
40 to 44 years 0.0 0.2 1.0 3.5 4.7
45 to 49 years 0.0 0.2 0.8 5.6 6.6
50 to 54 years 0.0 0.1 0.7 6.8 7.6
55 to 59 years 0.0 0.1 0.5 9.3 9.9
60 to 64 years 0.0 0.1 0.4 9.5 10.0
65 to 69 years 0.0 0.1 0.2 7.9 8.3
70 to 74 years 0.0 0.0 0.2 5.2 5.3
75 to 79 years 0.0 0.0 0.1 1.7 1.8
80 to 84 years 0.0 *0.0 *0.1 *0.6 *0.7
85 years and over 0.0 **0.0 **0.0 **0.1 *0.1
Total 0.0 2.2 6.5 52.5 61.2
Female
15 to 19 years 0.0 0.0 0.0 0.0 *0.0
* estimate has a relative standard error of 25% to 50% and should be used with caution
** estimate has a relative standard error greater than 50% and is considered too unreliable for general use
(a) These groups have been grouped according to the following balance ranges:
• Nil - Has no superannuation account balance
• Low - Has an account balance greater than zero but less than $40,000
• Middle - Has an account balance greater than $40,000 and up to and including $100,000
• High - Has an account balance greater than $100,000
5
Superannuation account balances by age and gender | 21 of 22
Table 6: Shares of superannuation total superannuation assets by age and gender
Superannuation balance group(a)
Nil Low Middle High Total
Share of superannuation (%)
20 to 24 years 0.0 0.2 **0.0 0.0 0.2
25 to 29 years 0.0 0.6 0.3 *0.1 1.0
30 to 34 years 0.0 0.4 0.9 *0.4 1.7
35 to 39 years 0.0 0.3 1.0 1.0 2.3
40 to 44 years 0.0 0.3 0.9 1.8 3.0
45 to 49 years 0.0 0.2 0.8 3.1 4.1
50 to 54 years 0.0 0.2 0.8 3.6 4.6
55 to 59 years 0.0 0.2 0.6 4.6 5.4
60 to 64 years 0.0 0.1 0.4 5.6 6.1
65 to 69 years 0.0 0.1 0.3 5.6 5.9
70 to 74 years 0.0 0.0 0.1 2.7 2.9
75 to 79 years 0.0 *0.0 0.1 0.9 1.0
80 to 84 years 0.0 *0.0 *0.0 *0.4 0.5
85 years and over 0.0 **0.0 **0.0 **0.1 *0.1
Total 0.0 2.6 6.3 29.7 38.7
Persons
15 to 19 years 0.0 0.0 0.0 0.0 0.0
20 to 24 years 0.0 0.5 *0.1 **0.0 0.5
25 to 29 years 0.0 1.1 0.8 0.3 2.2
30 to 34 years 0.0 0.8 2.0 1.1 3.9
35 to 39 years 0.0 0.6 2.1 2.5 5.2
40 to 44 years 0.0 0.5 1.9 5.3 7.7
45 to 49 years 0.0 0.4 1.6 8.6 10.6
50 to 54 years 0.0 0.3 1.5 10.4 12.2
55 to 59 years 0.0 0.3 1.1 14.0 15.4
60 to 64 years 0.0 0.2 0.8 15.2 16.2
65 to 69 years 0.0 0.1 0.5 13.4 14.1
70 to 74 years 0.0 0.1 0.3 7.9 8.2
75 to 79 years 0.0 0.0 0.2 2.5 2.8
80 to 84 years 0.0 0.0 0.1 1.0 1.2
85 years and over 0.0 **0.0 *0.0 *0.2 *0.3
Total 0.0 4.8 12.9 82.4 100.0
* estimate has a relative standard error of 25% to 50% and should be used with caution
** estimate has a relative standard error greater than 50% and is considered too unreliable for general use
(a) These groups have been grouped according to the following balance ranges:
• Nil - Has no superannuation account balance
• Low - Has an account balance greater than zero but less than $40,000
• Middle - Has an account balance greater than $40,000 and up to and including $100,000
• High - Has an account balance greater than $100,000
Source: Survey of Income and Housing, Australia, 2015–16, Australian Bureau of Statistics
22 of 22 | Superannuation account balances by age and gender
The various data indicate that on average men are more likely both to have superannuation and to have a higher account balance. There are a number of reasons for this, including women having more time out of the paid labour force for family and other reasons and women more likely to be employed in part-time and/or lower paid occupations.
While on the face of it there remains a very substantial disparity in shares of superannuation between men and women, there has been a very substantial improvement on the estimated share for women in 1994 of 23 per cent.
While improvements for women in superannuation coverage and average balance were recorded across the range of age groups, the most significant increases recorded were for older women.
Compulsory superannuation together with increased labour force participation rates for older women are likely to have been significant factors in the increasing shares of superannuation held by women.
The percentage share figures also clearly demonstrate both the build-up of superannuation assets with increasing age but also cohort effects with some older Australians having relatively little superannuation. The age group 60 to 64 appears to be the one where holdings of superannuation peak.
ASFA has also recommended a number of policy changes that would further improve superannuation outcomes for both for women and men. These include:
• Abolition of the $450 a month threshold for payment of Superannuation Guarantee contributions.
• Payment of superannuation contributions linked to paid parental leave.
• Providing an ability for individuals to make catchup contributions when their account balance is low.
• Increasing the rate of the Superannuation Guarantee to 12 per cent as soon as possible.