Embed Size (px)
Citation preview
1SunOpta Inc. Investor Presentation
May 2021© SunOpta Inc. 2021

Fueling the Future of Food SunOpta Inc. Investor PresentationMay 2021
Forward Looking Statements
This presentation may include forward-looking statements and therefore is subject to important risks and uncertainties. Actual results could differ materially from the conclusions, forecasts and projections as certain material factors and assumptions were applied in drawing conclusions and in making the forecasts or projections upon which the forward-looking statements are premised.
Additional information about these material factors and assumptions, as well as other risks, uncertainties and/or relevant factors, are set forth under “Forward Looking Statements,” and “Risk Factors” in the Company’s Annual Report on filed Form 10-K for the fiscal year ended January 2, 2021 (available at www.sec.gov), Form 10-Q for the quarter ended April 3, 2021, as well as the Company’s earnings press release issued on May 12, 2021.
© SunOpta Inc. 20212

Fueling the Future of Food SunOpta Inc. Investor PresentationMay 2021
$415.2
$374.0
Revenue$ millions
Retail/Private Label
Foodservice
Co-manufacturing
Industrial & Other
SunOpta is a Global, Healthy Food & Beverage Company with a Strong Focus on Sustainability
We operate 2 Business Segments
We go to market with Multi-Channel consumer products offerings
We are focused on healthy, sustainability-oriented beverages and foods.
We manufacture plant-based milks and bases, and process frozen fruit and fruit-based snacks and ingredients.
We are focused on organic and we go to market through private label, co-manufacturing and our own brands.
$789 Million Fiscal 2020 Revenues
$28.6
$80.5
Gross Profit$ millions
Plant-Based Foods & Beverages
Fruit-Based Foods & Beverages
© SunOpta Inc. 20213
Fueling the Future of Food SunOpta Inc. Investor PresentationMay 2021
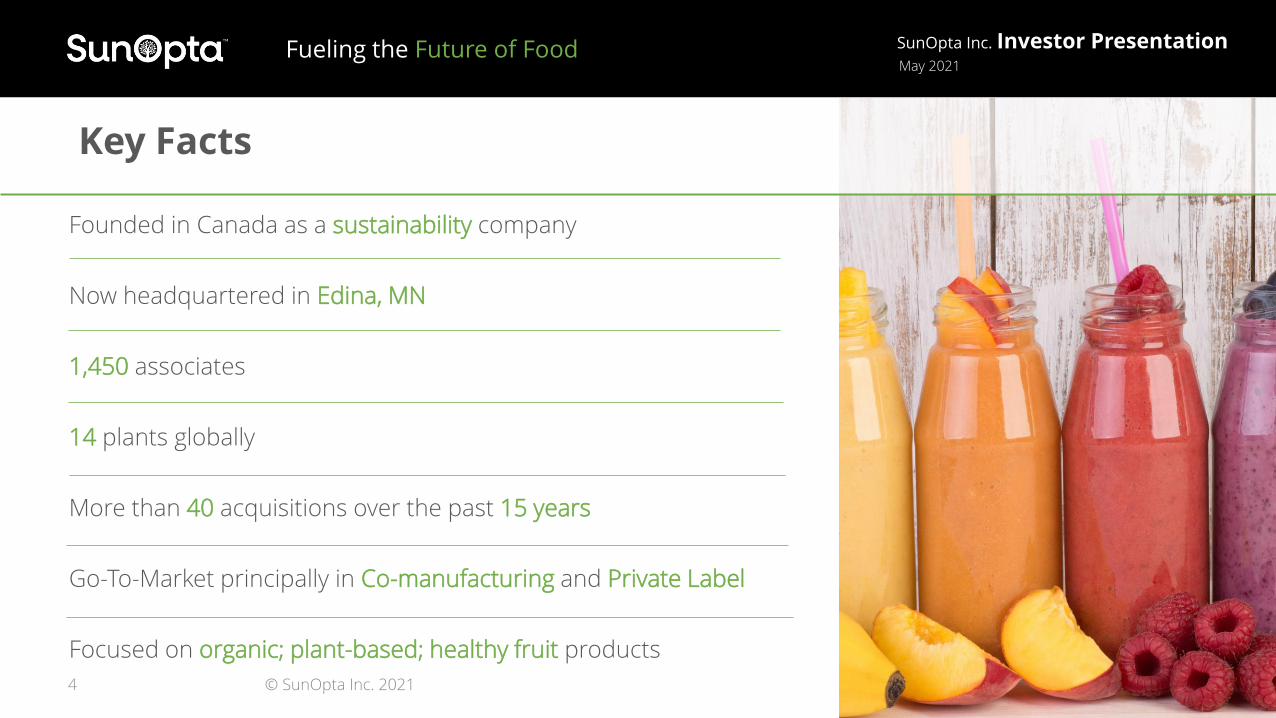
Key Facts
Founded in Canada as a sustainability company
Now headquartered in Edina, MN
1,450 associates
14 plants globally
More than 40 acquisitions over the past 15 years
Go-To-Market principally in Co-manufacturing and Private Label
Focused on organic; plant-based; healthy fruit products
© SunOpta Inc. 20214
Fueling the Future of Food SunOpta Inc. Investor PresentationMay 2021
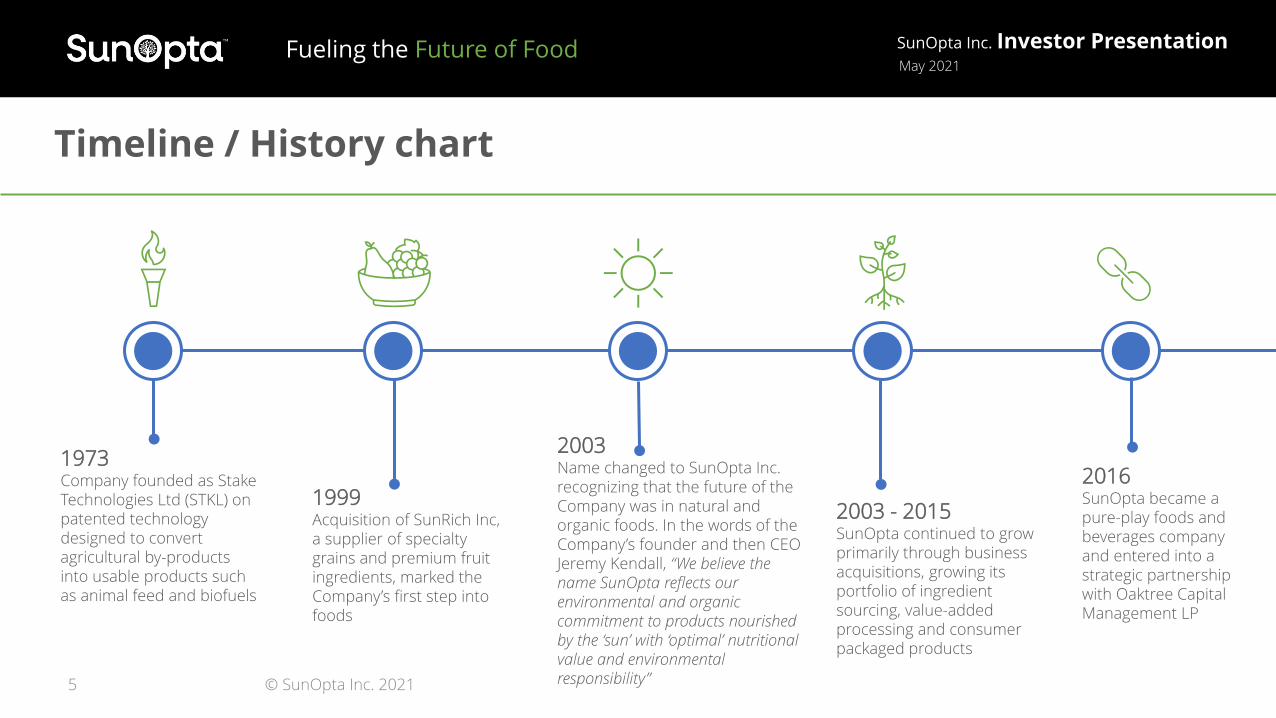
1973Company founded as Stake Technologies Ltd (STKL) on patented technology designed to convert agricultural by-products into usable products such as animal feed and biofuels
1999Acquisition of SunRich Inc, a supplier of specialty grains and premium fruit ingredients, marked the Company’s first step into foods
2003Name changed to SunOpta Inc. recognizing that the future of the Company was in natural and organic foods. In the words of the Company’s founder and then CEO Jeremy Kendall, “We believe the name SunOpta reflects our environmental and organic commitment to products nourished by the ‘sun’ with ‘optimal’ nutritional value and environmental responsibility”
2003 - 2015SunOpta continued to grow primarily through business acquisitions, growing its portfolio of ingredient sourcing, value-added processing and consumer packaged products
2016SunOpta became a pure-play foods and beverages company and entered into a strategic partnership with Oaktree Capital Management LP
Timeline / History chart
© SunOpta Inc. 20215
Fueling the Future of Food SunOpta Inc. Investor PresentationMay 2021
© SunOpta Inc. 20216
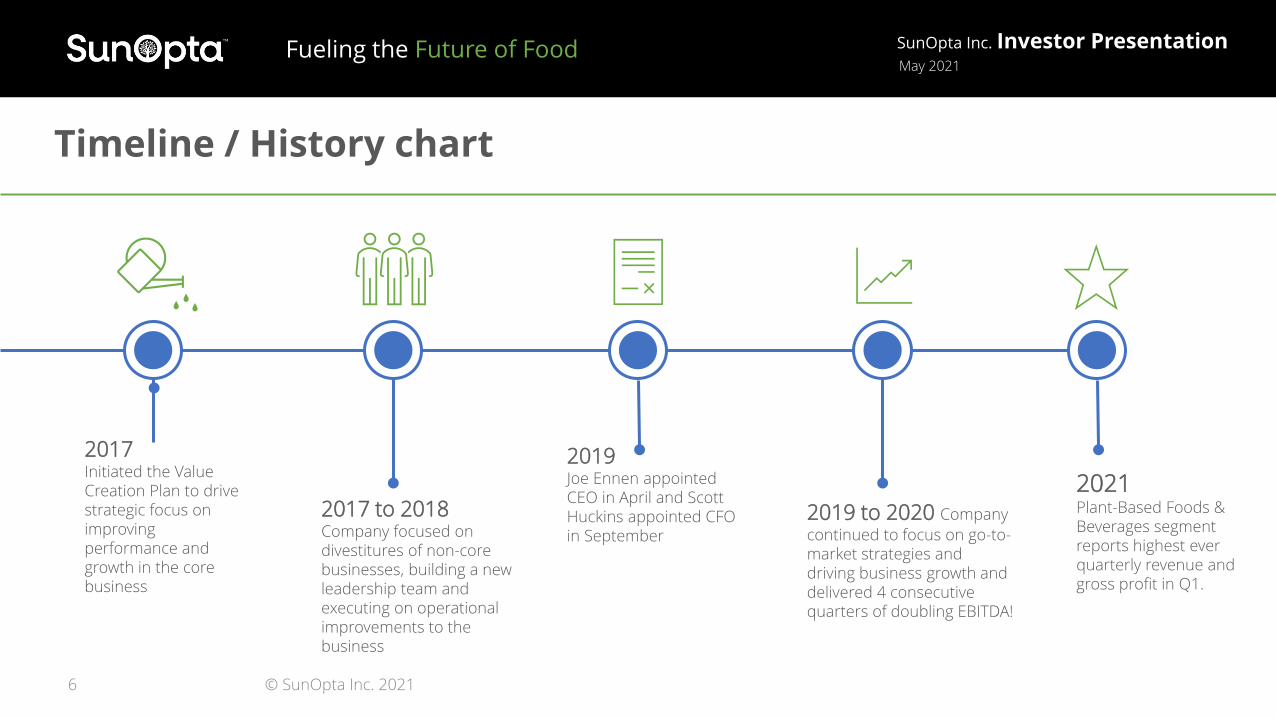
2017 Initiated the Value Creation Plan to drive strategic focus on improving performance and growth in the core business
2017 to 2018 Company focused on divestitures of non-core businesses, building a new leadership team and executing on operational improvements to the business
2019Joe Ennen appointed CEO in April and Scott Huckins appointed CFO in September
2019 to 2020 Company
continued to focus on go-to-market strategies and driving business growth and delivered 4 consecutive quarters of doubling EBITDA!
2021Plant-Based Foods & Beverages segment reports highest ever quarterly revenue and gross profit in Q1.
Timeline / History chart
Fueling the Future of Food SunOpta Inc. Investor PresentationMay 2021
7
Growth Plan
(1) Adjusted EBITDA is a non-GAAP measure. Refer to slides 23-24 for a reconciliation
to the most comparable GAAP measure.
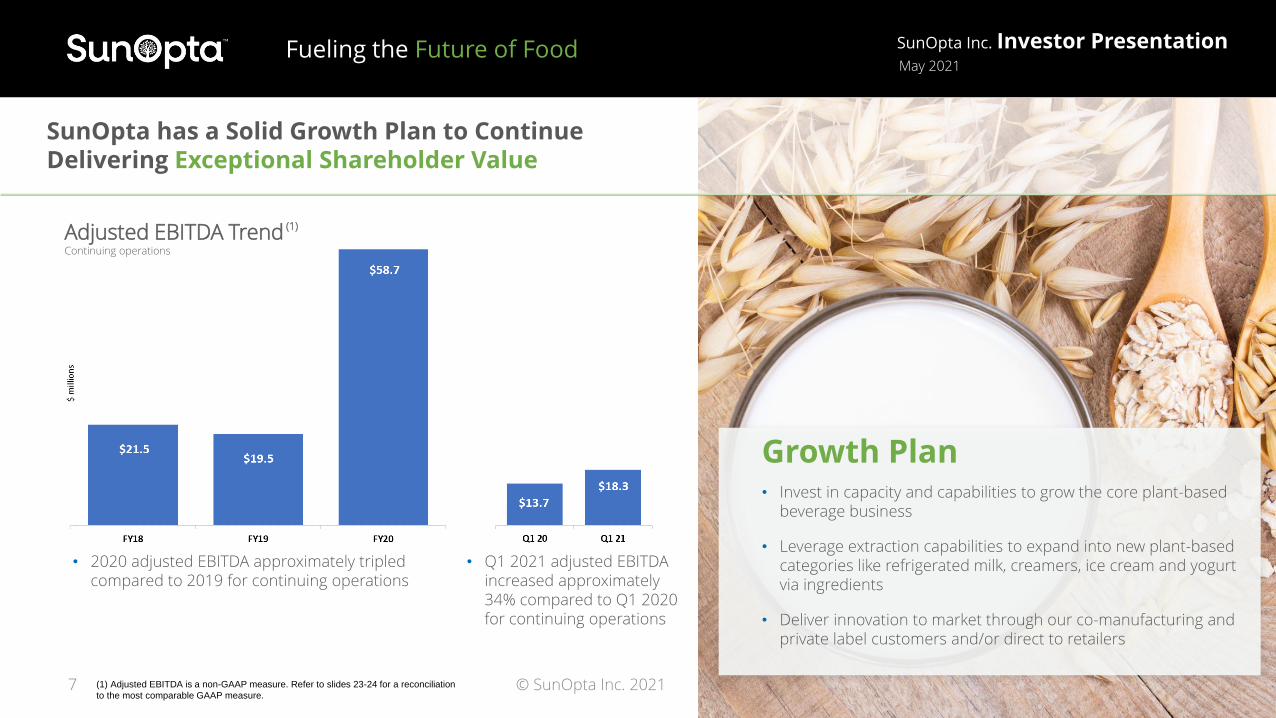
Adjusted EBITDA Trend (1)
• Invest in capacity and capabilities to grow the core plant-based beverage business
• Leverage extraction capabilities to expand into new plant-based categories like refrigerated milk, creamers, ice cream and yogurt via ingredients
• Deliver innovation to market through our co-manufacturing and private label customers and/or direct to retailers
SunOpta has a Solid Growth Plan to ContinueDelivering Exceptional Shareholder Value
© SunOpta Inc. 2021
• 2020 adjusted EBITDA approximately tripled compared to 2019 for continuing operations
• Q1 2021 adjusted EBITDA increased approximately 34% compared to Q1 2020 for continuing operations
Continuing operations
Fueling the Future of Food SunOpta Inc. Investor PresentationMay 2021
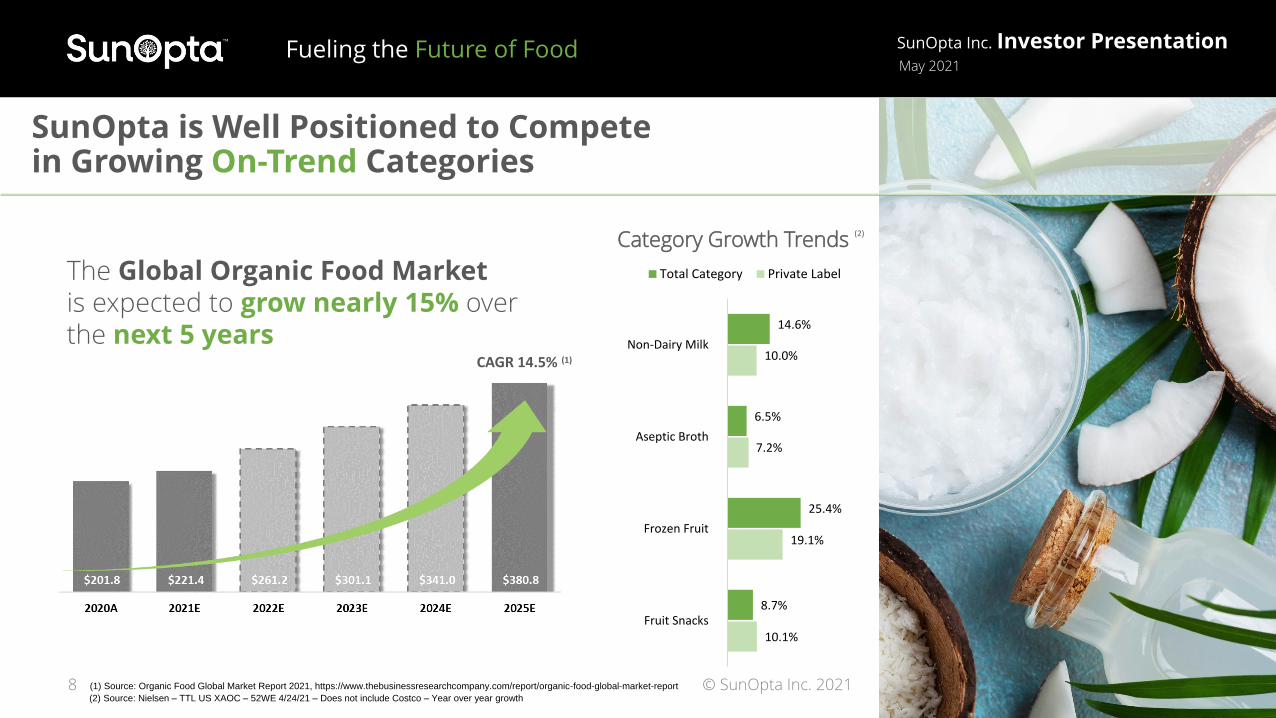
14.6%
6.5%
25.4%
8.7%
10.0%
7.2%
19.1%
10.1%
Non-Dairy Milk
Aseptic Broth
Frozen Fruit
Fruit Snacks
Total Category Private Label
SunOpta is Well Positioned to Compete in Growing On-Trend Categories
The Global Organic Food Market is expected to grow nearly 15% over the next 5 years
Category Growth Trends (2)
CAGR 14.5% (1)
(2) Source: Nielsen – TTL US XAOC – 52WE 4/24/21 – Does not include Costco – Year over year growth
(1) Source: Organic Food Global Market Report 2021, https://www.thebusinessresearchcompany.com/report/organic-food-global-market-report8 © SunOpta Inc. 2021

Fueling the Future of Food SunOpta Inc. Investor PresentationMay 2021
9
SunOpta Firmly Believes that Plant-Based is the Future of Food
“U.S. retail sales of plant-based foods continued to increase by double digits in 2020, growing 27% and bringing the total plant-based market value to $7 billion. This growth in dollar sales (“sales”) was consistent across the nation, with more than 25% growth in every U.S. census region. The plant-based food market grew almost twice as fast as the total U.S. retail food market, which increased 15% in 2020 as Covid-19 shuttered restaurants and consumers stocked up on food amid lockdowns.”
(1)
“Plant-based milk – the largest plant-based category – has reached $2.5 billion and accounts for 35% of the total plant-based food market. Even as the most developed category, plant-based milk grew 20% in dollar sales, up from 5% in 2019.” (1)
(1) Source: 2020 Retail Sales Data Insights, Plant Based Foods Association (PBFA), https://www.plantbasedfoods.org/retail-sales-data/© SunOpta Inc. 2021
Fueling the Future of Food SunOpta Inc. Investor PresentationMay 2021
10
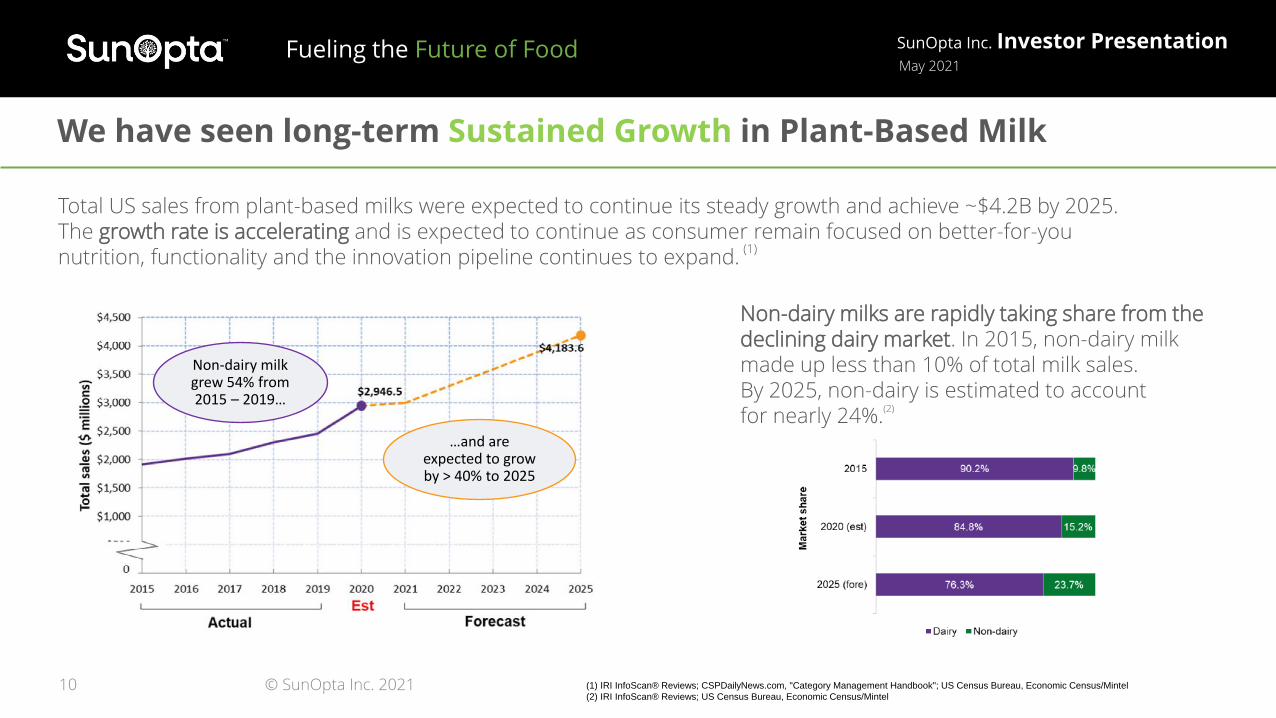
We have seen long-term Sustained Growth in Plant-Based Milk
© SunOpta Inc. 2021
Total US sales from plant-based milks were expected to continue its steady growth and achieve ~$4.2B by 2025.The growth rate is accelerating and is expected to continue as consumer remain focused on better-for-you nutrition, functionality and the innovation pipeline continues to expand.
(1)
Non-dairy milks are rapidly taking share from the declining dairy market. In 2015, non-dairy milkmade up less than 10% of total milk sales.By 2025, non-dairy is estimated to accountfor nearly 24%.
(2)
(1) IRI InfoScan® Reviews; CSPDailyNews.com, "Category Management Handbook"; US Census Bureau, Economic Census/Mintel
(2) IRI InfoScan® Reviews; US Census Bureau, Economic Census/Mintel
Non-dairy milk grew 54% from 2015 – 2019…
…and are expected to grow by > 40% to 2025
Fueling the Future of Food SunOpta Inc. Investor PresentationMay 2021
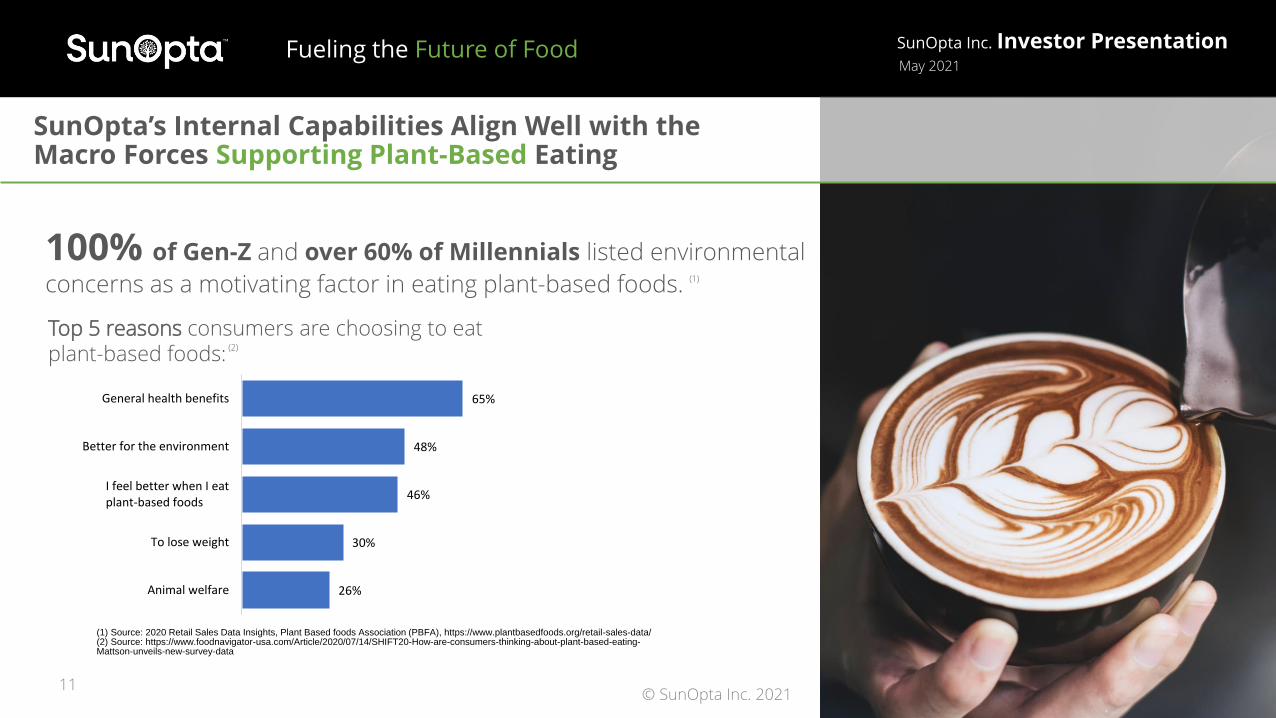
SunOpta’s Internal Capabilities Align Well with the Macro Forces Supporting Plant-Based Eating
26%
30%
46%
48%
65%
Animal welfare
To lose weight
I feel better when I eatplant-based foods
Better for the environment
General health benefits
Top 5 reasons consumers are choosing to eat plant-based foods: (2)
100% of Gen-Z and over 60% of Millennials listed environmental
concerns as a motivating factor in eating plant-based foods. (1)
(1) Source: 2020 Retail Sales Data Insights, Plant Based foods Association (PBFA), https://www.plantbasedfoods.org/retail-sales-data/(2) Source: https://www.foodnavigator-usa.com/Article/2020/07/14/SHIFT20-How-are-consumers-thinking-about-plant-based-eating-Mattson-unveils-new-survey-data
11© SunOpta Inc. 2021
Fueling the Future of Food SunOpta Inc. Investor PresentationMay 2021
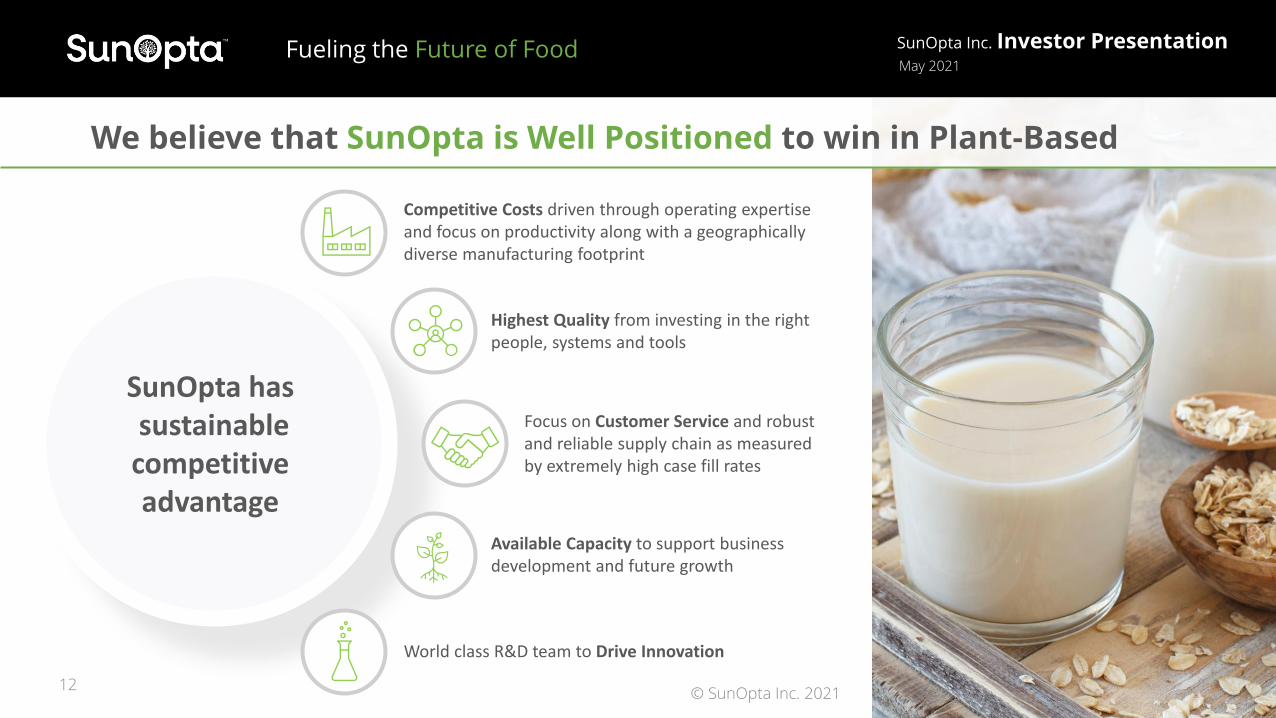
SunOpta has sustainable
competitive advantage
Available Capacity to support business development and future growth
We believe that SunOpta is Well Positioned to win in Plant-Based
Focus on Customer Service and robust and reliable supply chain as measured by extremely high case fill rates
© SunOpta Inc. 202112
Highest Quality from investing in the right people, systems and tools
World class R&D team to Drive Innovation
Competitive Costs driven through operating expertise and focus on productivity along with a geographically diverse manufacturing footprint
Fueling the Future of Food SunOpta Inc. Investor PresentationMay 2021
13
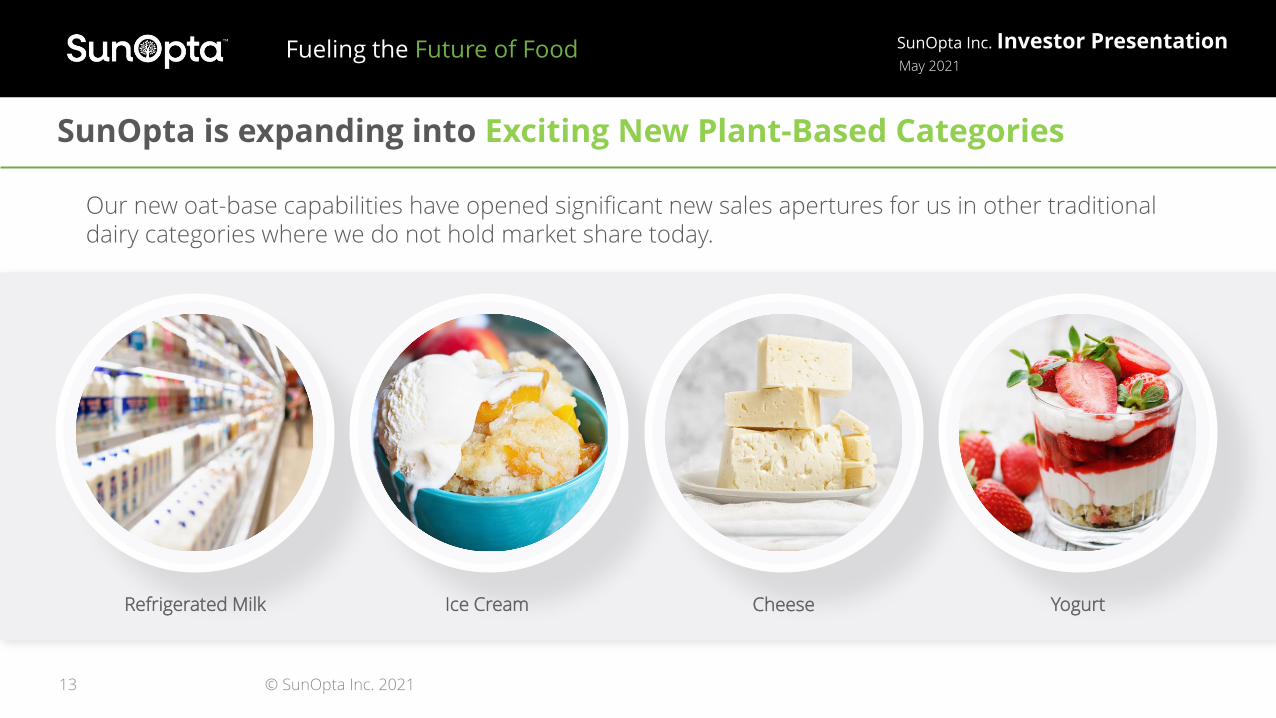
SunOpta is expanding into Exciting New Plant-Based Categories
© SunOpta Inc. 2021
Our new oat-base capabilities have opened significant new sales apertures for us in other traditional dairy categories where we do not hold market share today.
Refrigerated Milk Ice Cream Cheese Yogurt
Fueling the Future of Food SunOpta Inc. Investor PresentationMay 2021
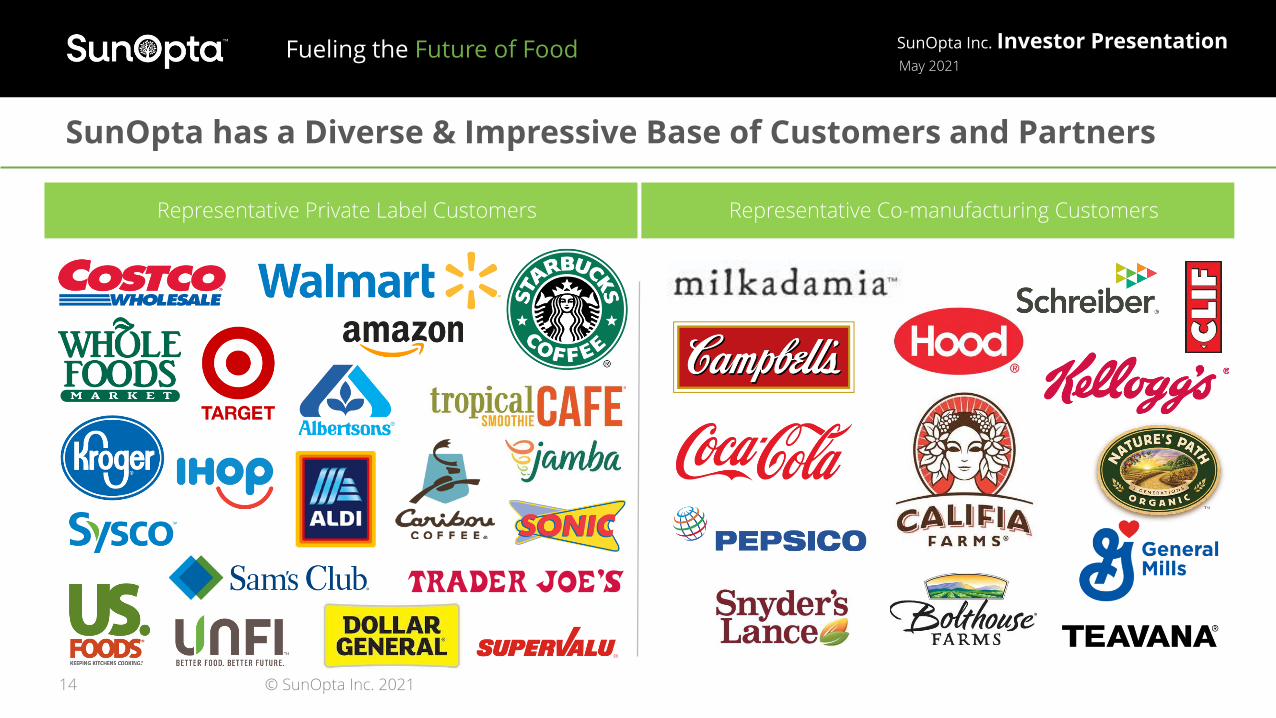
Representative Retail and Foodservice Customer Base
Representative Private Label Customers Representative Co-manufacturing Customers
SunOpta has a Diverse & Impressive Base of Customers and Partners
© SunOpta Inc. 202114

Fueling the Future of Food SunOpta Inc. Investor PresentationMay 2021
© SunOpta Inc. 202115
SunOpta has a Clear Set of Strategic Priorities
We are focused on delivering sustained profitable growth by creating a culture that is:
✓ Faster and more agile;
✓ Focused on the biggest priorities; and
✓ Fanatical about the customer and saying “yes” to opportunities.
✓ Recognize and resource
plant-based beverage as
our top priority to drive
revenue and EBITDA growth
✓ Prioritize assets and
capabilities that are
structurally advantaged and
invest to build long-term
points of differentiation
✓ Critically evaluate and exit
lines of business that aren’t
positioned for long-term
success
✓ Bring value to customers
brands through innovative
plant-based and fruit-based
solutions
✓ Leverage our R&D
capabilities, multi-channel
category insights, and
ability to bring the latest
trends in organic
ingredients to market to
bring value enhancing
innovation to our customers
Portfolio Prioritization
Speed of Customer
Centric Innovation
✓ Expand our extraction
capacity 4X to support the
strong growth of oat milk and
the growing demand for
plant-based ingredients
✓ Invest into increased
capacity and capabilities
across our national plant-
based beverage network to
capitalize on consumer trends
Double Plant-Based
Foods & Beverages
Business
Fueling the Future of Food SunOpta Inc. Investor PresentationMay 2021
© SunOpta Inc. 202116
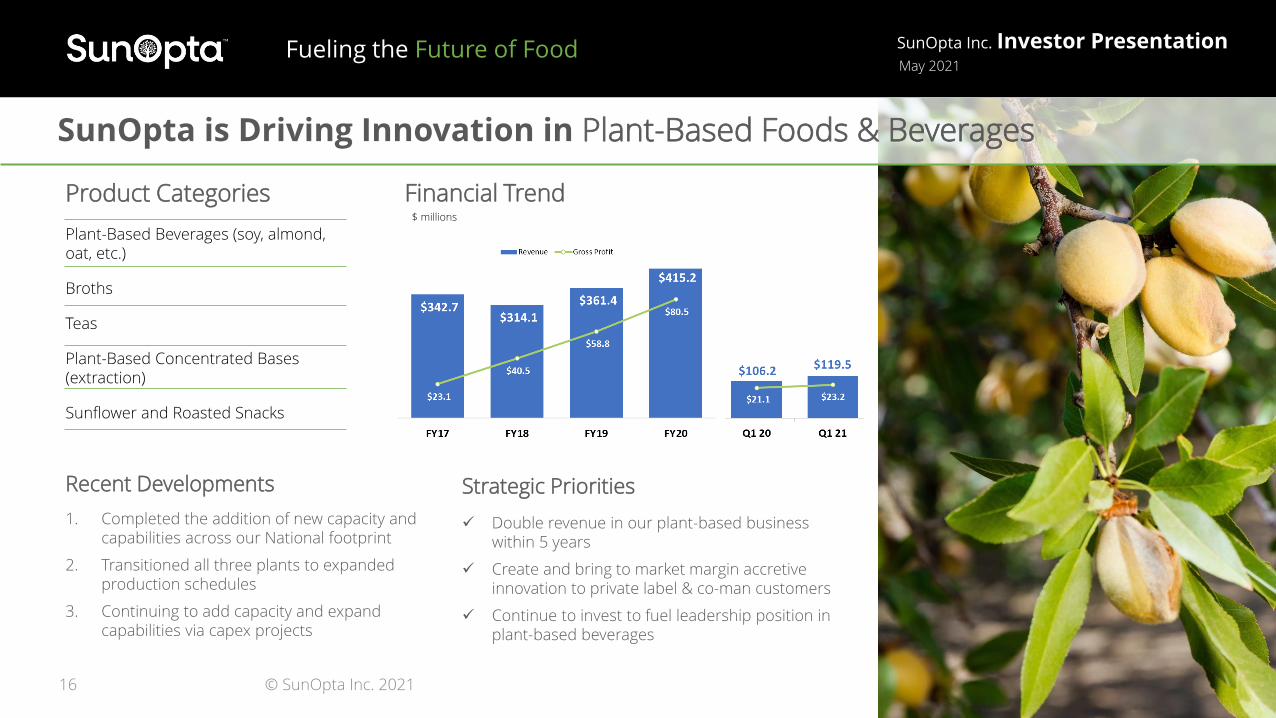
SunOpta is Driving Innovation in Plant-Based Foods & Beverages
Product Categories
Plant-Based Beverages (soy, almond, oat, etc.)
Broths
Teas
Plant-Based Concentrated Bases (extraction)
Sunflower and Roasted Snacks
Recent Developments
1. Completed the addition of new capacity and capabilities across our National footprint
2. Transitioned all three plants to expanded production schedules
3. Continuing to add capacity and expand capabilities via capex projects
Strategic Priorities
✓ Double revenue in our plant-based business within 5 years
✓ Create and bring to market margin accretive innovation to private label & co-man customers
✓ Continue to invest to fuel leadership position in plant-based beverages
Financial Trend$ millions
Fueling the Future of Food SunOpta Inc. Investor PresentationMay 2021
© SunOpta Inc. 202117
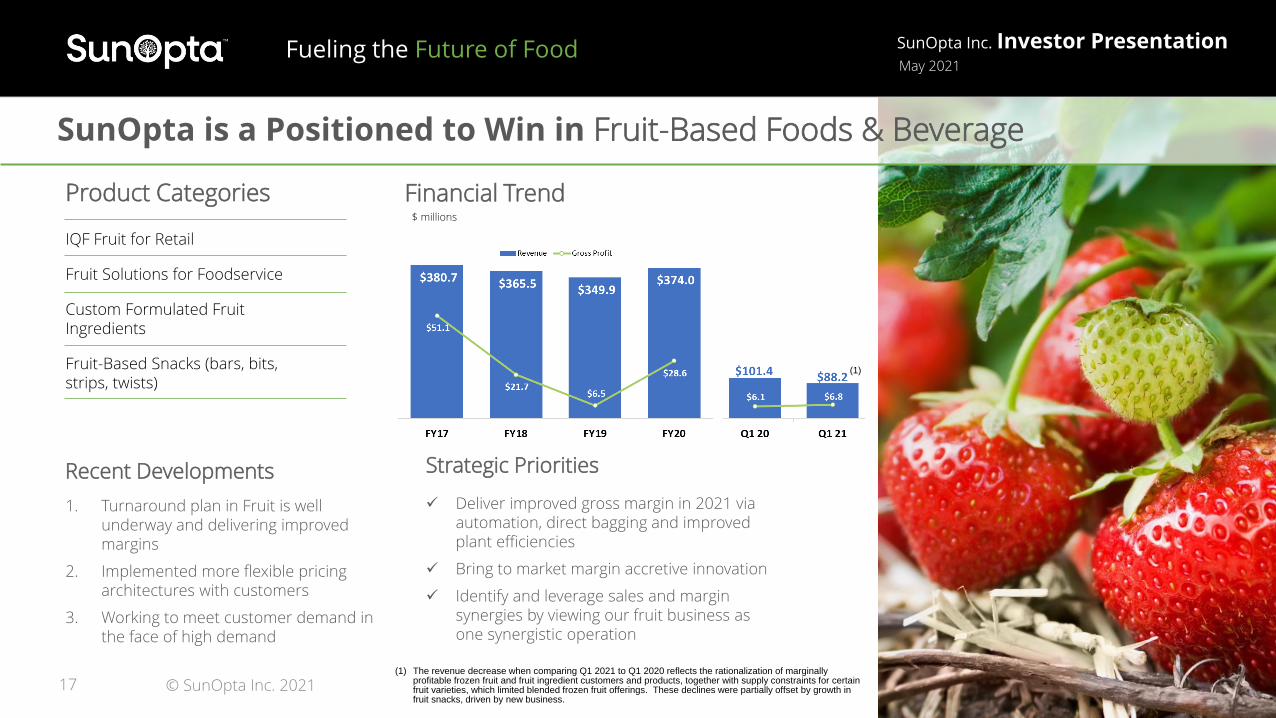
Product Categories
IQF Fruit for Retail
Fruit Solutions for Foodservice
Custom Formulated Fruit Ingredients
Fruit-Based Snacks (bars, bits, strips, twists)
Recent Developments
1. Turnaround plan in Fruit is well underway and delivering improved margins
2. Implemented more flexible pricing architectures with customers
3. Working to meet customer demand in the face of high demand
Strategic Priorities
✓ Deliver improved gross margin in 2021 via automation, direct bagging and improved plant efficiencies
✓ Bring to market margin accretive innovation
✓ Identify and leverage sales and margin synergies by viewing our fruit business as one synergistic operation
SunOpta is a Positioned to Win in Fruit-Based Foods & Beverage
(1) The revenue decrease when comparing Q1 2021 to Q1 2020 reflects the rationalization of marginally profitable frozen fruit and fruit ingredient customers and products, together with supply constraints for certain fruit varieties, which limited blended frozen fruit offerings. These declines were partially offset by growth in fruit snacks, driven by new business.
(1)
Financial Trend$ millions
Fueling the Future of Food SunOpta Inc. Investor PresentationMay 2021
© SunOpta Inc. 202118
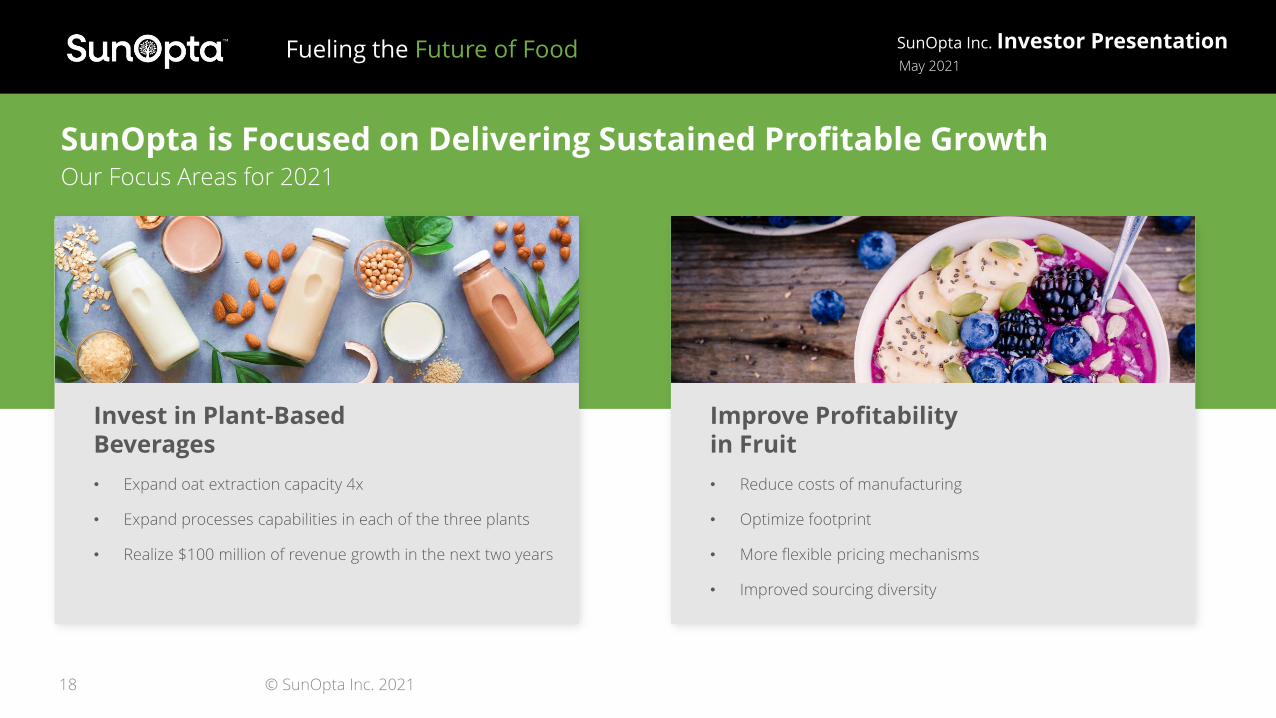
SunOpta is Focused on Delivering Sustained Profitable GrowthOur Focus Areas for 2021
Invest in Plant-Based Beverages
• Expand oat extraction capacity 4x
• Expand processes capabilities in each of the three plants
• Realize $100 million of revenue growth in the next two years
Improve Profitability in Fruit
• Reduce costs of manufacturing
• Optimize footprint
• More flexible pricing mechanisms
• Improved sourcing diversity
Appendix
Key Financial Metrics
Reconciliation of Non-GAAP MeasuresThis presentation includes certain measures not derived in accordance with generally accepted accounting principles in the United States of America (“U.S. GAAP”). Such
measures should not be considered substitutes for any measures derived in accordance with U.S. GAAP and may also be inconsistent with similar measures presented by
other companies. Reconciliation of these non-GAAP financial measures to the most nearly comparable U.S. GAAP measures, if applicable, is presented on the slides that
follow. The Company believes that these non-GAAP financial measures provide useful information to investors as the measures emphasize core on-going operations and are
helpful in comparing past and present operating results. The Company uses these measures to evaluate past performance and prospects for future performance. The
presentation of non-GAAP financial measures by the Company should not be considered in isolation or as a substitute for the Company’s financial results prepared in
accordance with U.S. GAAP.
19 © SunOpta Inc. 2021
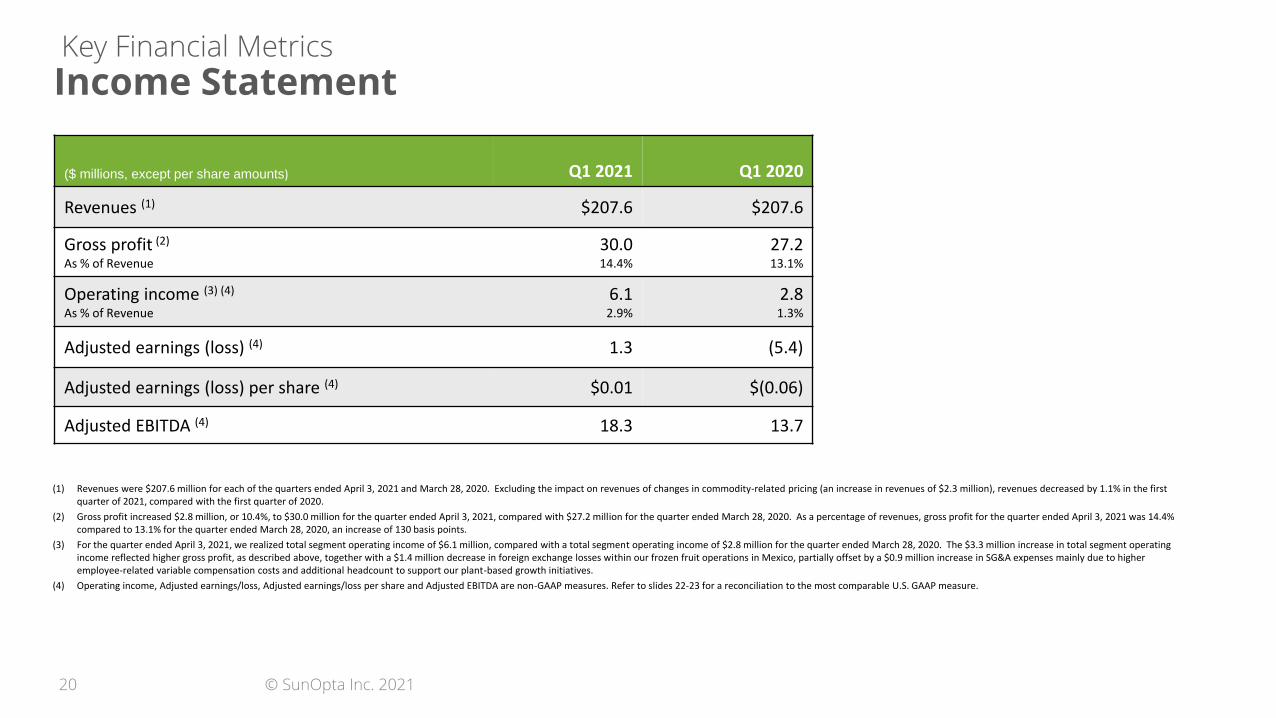
Key Financial Metrics
Income Statement
($ millions, except per share amounts) Q1 2021 Q1 2020
Revenues (1) $207.6 $207.6
Gross profit (2)
As % of Revenue
30.014.4%
27.213.1%
Operating income (3) (4)
As % of Revenue
6.12.9%
2.81.3%
Adjusted earnings (loss) (4) 1.3 (5.4)
Adjusted earnings (loss) per share (4) $0.01 $(0.06)
Adjusted EBITDA (4) 18.3 13.7
(1) Revenues were $207.6 million for each of the quarters ended April 3, 2021 and March 28, 2020. Excluding the impact on revenues of changes in commodity-related pricing (an increase in revenues of $2.3 million), revenues decreased by 1.1% in the first quarter of 2021, compared with the first quarter of 2020.
(2) Gross profit increased $2.8 million, or 10.4%, to $30.0 million for the quarter ended April 3, 2021, compared with $27.2 million for the quarter ended March 28, 2020. As a percentage of revenues, gross profit for the quarter ended April 3, 2021 was 14.4% compared to 13.1% for the quarter ended March 28, 2020, an increase of 130 basis points.
(3) For the quarter ended April 3, 2021, we realized total segment operating income of $6.1 million, compared with a total segment operating income of $2.8 million for the quarter ended March 28, 2020. The $3.3 million increase in total segment operating income reflected higher gross profit, as described above, together with a $1.4 million decrease in foreign exchange losses within our frozen fruit operations in Mexico, partially offset by a $0.9 million increase in SG&A expenses mainly due to higher employee-related variable compensation costs and additional headcount to support our plant-based growth initiatives.
(4) Operating income, Adjusted earnings/loss, Adjusted earnings/loss per share and Adjusted EBITDA are non-GAAP measures. Refer to slides 22-23 for a reconciliation to the most comparable U.S. GAAP measure.
20 © SunOpta Inc. 2021
Key Financial Metrics
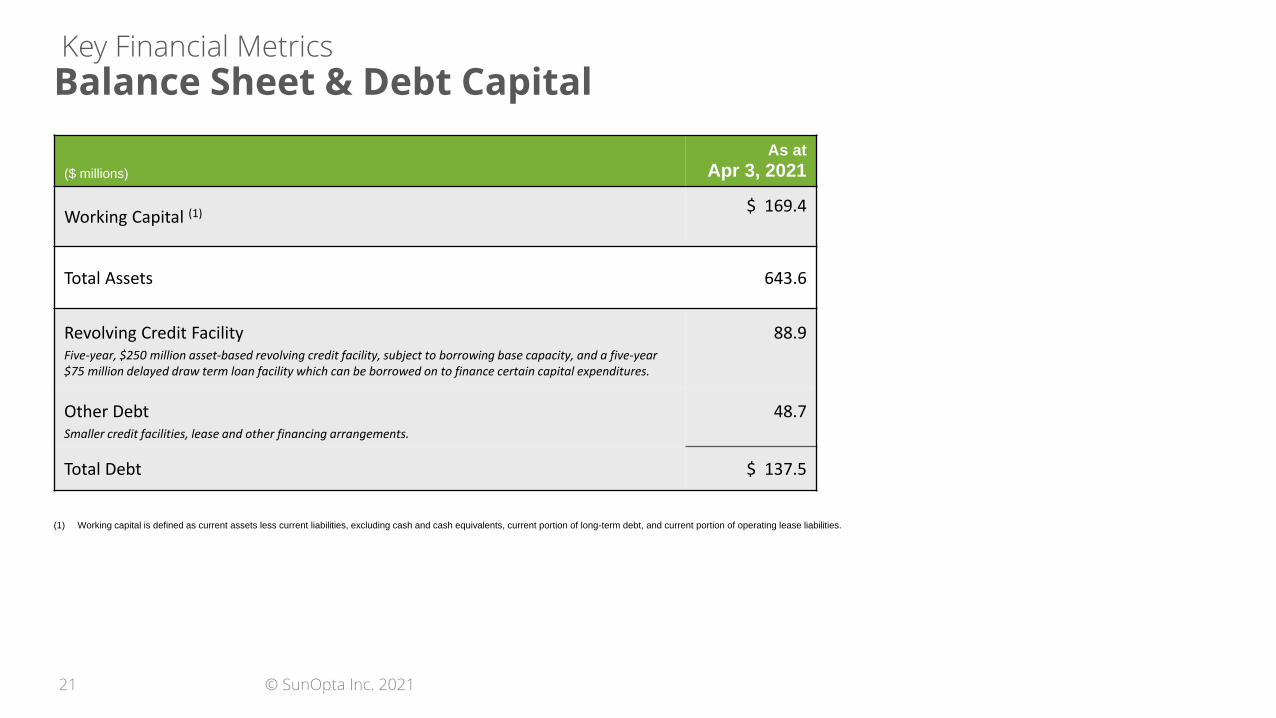
Balance Sheet & Debt Capital
($ millions)
As at
Apr 3, 2021
Working Capital (1) $ 169.4
Total Assets 643.6
Revolving Credit FacilityFive-year, $250 million asset-based revolving credit facility, subject to borrowing base capacity, and a five-year $75 million delayed draw term loan facility which can be borrowed on to finance certain capital expenditures.
88.9
Other DebtSmaller credit facilities, lease and other financing arrangements.
48.7
Total Debt $ 137.5
(1) Working capital is defined as current assets less current liabilities, excluding cash and cash equivalents, current portion of long-term debt, and current portion of operating lease liabilities.
21 © SunOpta Inc. 2021

($ millions, except per share amounts)
Per Share Per Share
Earnings (loss) from continuing operations 1.7$ (4.0)$
Dividends and accretion on preferred stock (2.0) (2.0)
Loss from continuing operations attributable to common shareholders (0.3) ($0.00) (6.0) ($0.07)
Adjusted for:
Costs related to Value Creation Plan(a) 1.4 1.1
Acquisition, divestiture, and related costs (b) 0.4 -
Other - (0.0)
Net income tax effect(c) (0.2) (0.5)
Adjusted earnings (loss) 1.3 $0.01 (5.4) ($0.06)
Q1 2021 Q1 2020
Reconciliation of U.S. GAAP Results to Adjusted Earnings/Loss and Adjusted EPS
(a) For the first quarter of 2021, reflects costs to complete the exit from our Santa Maria, California, frozen fruit processing facility, which were recorded in other expense. For the first quarter of 2020, reflects professional fees of $0.3 million and employee retention costs of $0.2 million recorded in SG&A expenses; and employee termination costs of $0.5 million recorded in other expense.
(b) Represents costs associated with completed or potential acquisitions and divestitures, including costs related to the evaluation, execution, and integration of acquisitions or completion of divestitures, which were recorded in SG&A expenses ($0.2 million) and other expense ($0.2 million).
(c) Reflects the tax effect of the preceding adjustments to earnings calculated based on our estimated annual effective tax rate.
The following table presents a reconciliation of adjusted earnings/loss from earnings/loss from continuing operations, which we consider to be the most directly comparable U.S. GAAP financial measure.
22 © SunOpta Inc. 2021
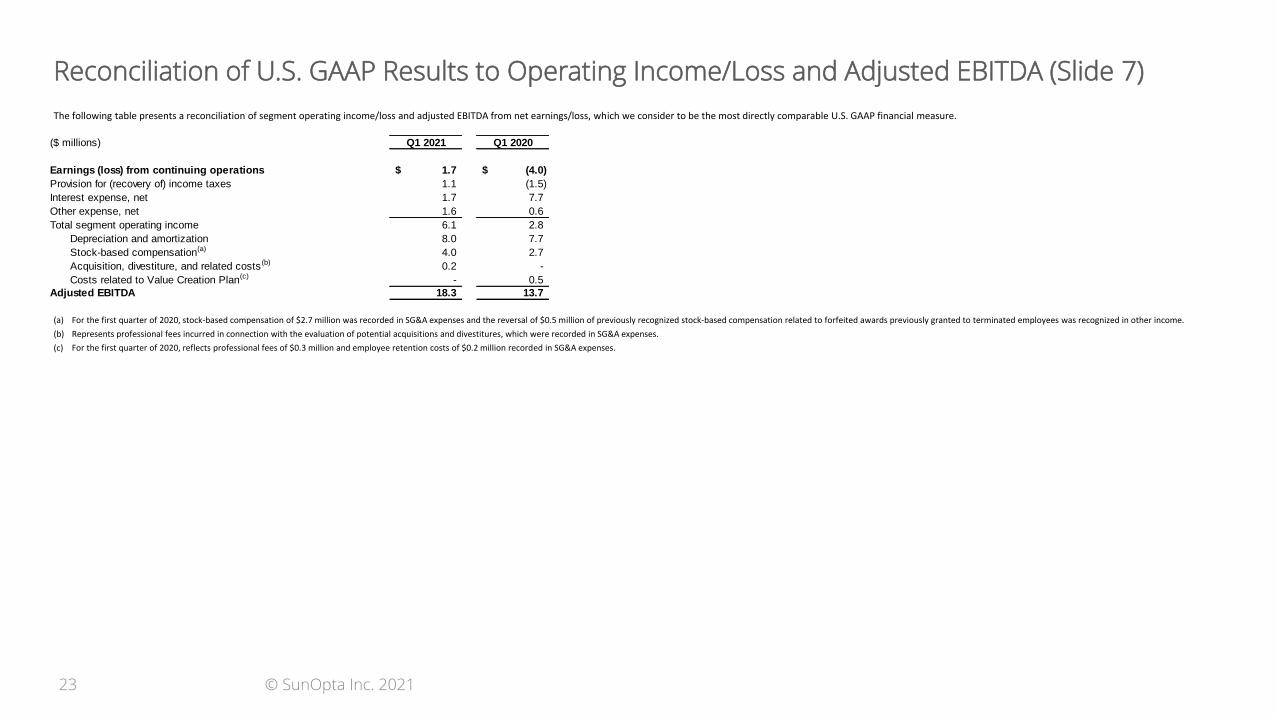
($ millions) Q1 2021 Q1 2020
Earnings (loss) from continuing operations 1.7$ (4.0)$
Provision for (recovery of) income taxes 1.1 (1.5)
Interest expense, net 1.7 7.7
Other expense, net 1.6 0.6
Total segment operating income 6.1 2.8
Depreciation and amortization 8.0 7.7
Stock-based compensation(a) 4.0 2.7
Acquisition, divestiture, and related costs (b) 0.2 -
Costs related to Value Creation Plan(c) - 0.5
Adjusted EBITDA 18.3 13.7
Reconciliation of U.S. GAAP Results to Operating Income/Loss and Adjusted EBITDA (Slide 7)
(a) For the first quarter of 2020, stock-based compensation of $2.7 million was recorded in SG&A expenses and the reversal of $0.5 million of previously recognized stock-based compensation related to forfeited awards previously granted to terminated employees was recognized in other income.
(b) Represents professional fees incurred in connection with the evaluation of potential acquisitions and divestitures, which were recorded in SG&A expenses.
(c) For the first quarter of 2020, reflects professional fees of $0.3 million and employee retention costs of $0.2 million recorded in SG&A expenses.
The following table presents a reconciliation of segment operating income/loss and adjusted EBITDA from net earnings/loss, which we consider to be the most directly comparable U.S. GAAP financial measure.
23 © SunOpta Inc. 2021

($ millions) 2018 2019 2020 2018 2019 2020
Net earnings (loss) $ (127.5) $ (13.1) $ (47.3) $ (109.2) $ (0.8) $ 77.5
Earnings (loss) attributable to non-controlling interests - - - 0.1 0.2 (0.3)
Gain on sale of discontinued operations (a) - - - - - (111.8)
Provision for (recovery of) income taxes (13.6) (3.1) (2.7) (5.4) 3.2 13.1
Loss on retirement of debt(b) - - 8.9 - - 8.9
Interest expense, net 33.1 32.8 30.0 34.4 34.7 32.5
Other expense (income), net 5.2 (40.6) 23.4 2.8 (40.0) 22.6
Goodwill impairment 81.2 - - 81.2 - -
Total segment operating income (loss) (21.5) (24.1) 12.3 3.9 (2.8) 42.5
Deprecation and amortization 28.2 29.3 30.3 32.8 34.0 35.0
Stock-based compensation(c) 6.8 10.5 12.6 7.9 11.6 13.1
Costs related to Value Creation Plan(d) 0.7 3.6 1.6 0.7 3.6 1.6
Plant expansion costs(e) - 0.3 1.9 - 0.6 1.9
Contract manufacturer transition costs (f ) - - - - 0.3 -
Inventory write-downs(g) 3.1 - - 3.1 - -
New product commercialization costs (h) 2.6 - - 2.7 - -
Equipment start-up costs(i) 2.7 - - 2.9 - -
Product withdrawl and recall costs(j) (1.2) - - (1.2) - -
Adjusted EBITDA 21.5 19.5 58.7 52.9 47.3 94.1
ConsolidatedContinuing Operations
Reconciliation of U.S. GAAP Results to Adjusted EBITDA Trend (Slide 7)
(a) Reflects the pre-tax gain on sale of Tradin Organic recorded in earnings from discontinued operations.
(b) Reflects the premium paid ($5.3 million) and write-off of unamortized debt issuance costs ($3.6 million) on the redemption and retirement of our second lien notes, which is recorded in non-operating expenses.
(c) For 2020, stock-based compensation of $13.1 million was recorded in SG&A expenses and earnings from discontinued operations, and the reversal of $0.9 million of previously recognized stock-based compensation related to forfeited awards previously granted to terminated employees was recognized in other income. For 2019, stock-based compensation of $11.6 million was recorded in SG&A expenses and earnings from discontinued operations, and the reversal of $4.1 million of previously recognized stock-based compensation related to forfeited awards previously granted to terminated employees was recognized in other income. For 2018, stock-based compensation of $7.9 million was recorded in SG&A expenses and earnings from discontinued operations.
(d) For 2020, reflects professional fees of $1.0 million and employee retention costs of $0.6 million recorded in SG&A expenses. For 2019, reflects employee retention and relocation costs of $2.2 million, and professional fees of $1.4 million recorded in SG&A expenses. For 2018, reflects the write-down of remaining flexible resealable pouch and nutrition bar inventories of $0.1 million recorded in cost of goods sold; and professional and consulting fees, and employee recruitment and relocation costs of $0.6 million recorded in SG&A expenses.
(e) For 2020, reflects start-up costs related to expansion projects within our plant-based ingredient extraction and beverage operations, which were recorded in cost of goods sold. For 2019, reflects costs related to the expansion of our Allentown, Pennsylvania, plant-based beverage facility and start-up of Tradin Organic’s avocado oil facility in Ethiopia, which were recorded in cost of goods sold and earnings from discontinued operations.
(f) Reflects costs related to the transition of premium juice production activities to new contract manufacturers, which were recorded in earnings from discontinued operations.
(g) Reflects the write-down of certain frozen fruit inventory items in the fourth quarter of 2018, due to a change in expected use of aged stocks, and reduced sales pricing and high production costs, which was recorded in cost of goods sold.
(h) Reflects costs for development, production trials and start-up costs, incremental freight charges, and employee training related to the commercialization of new consumer products, which were recorded in cost of goods sold, SG&A expenses and earnings from discontinued operations.
(i) Reflects costs related to the start-up of new roasting equipment for grains, seeds and legumes at our Crookston, Minnesota, facility, as well as the start-up of a second processing line at our cocoa facility in the Netherlands, which were recorded in cost of goods sold and earnings from discontinued operations.
(j) For 2018, reflects the recovery from a third-party supplier of $1.2 million of costs incurred relating to the withdrawal of certain consumer-packaged products due to quality-related issues, which was recorded in cost of goods sold. Costs incurred related to this withdrawal were recognized in cost of goods sold in 2016.
The following table presents a reconciliation of adjusted EBITDA from net earnings/loss, which we consider to be the most directly comparable U.S. GAAP financial measure. We believe this presentation assists investors in assessing the results of the operations we have disposed of and the effect of those operations on our financial performance.
24 © SunOpta Inc. 2021
7301 Ohms Lane, Suite 600Edina, Minnesota 55439
www.sunopta.com