Embed Size (px)
Citation preview
S U M M I T A C A D E M Y Y O U N G S T O W N E L E M E N T A R Y
1 4 4 N . S H E N L E Y A V E . | Y O U N G S T O W N , O H I O 4 4 5 0 9
S U M M I T A C A D E M I E S . O R G | p : 3 3 0 - 2 5 9 - 0 4 2 1 | f : 3 3 0 - 2 5 9 - 0 4 2 4
Summit Academy Schools 2015-2016 Annual Report Summit Academy Youngstown Elementary School
PRINCIPAL’S MESSAGE Dear Friends, It’s hard to believe another year has come and gone. As we look back at all that was accomplished, we are filled with a sense of gratitude and fulfillment knowing our staff was so dedicated to the Summit Academy vision and mission. Student academic progress and teacher professional growth continues to be the area of focus this year. In both areas significant gains were made due to the hard work of the great people who work with our students. The teachers took part in multiple professional development opportunities, embraced the chance to work collaboratively in teacher based teams and utilized a new data tracking system in order to better respond to student needs. We discovered coming into the school year we had passed 29 out of our 32 3rd graders when it came to our 3rd Grade Reading Guarantee. We continued to fulfill the requirements of the School Improvement Grant as we were in the third year of our school carryover. The grant gave us opportunities for professional development that enhanced our student curriculum and strengthened the interventions we utilize in the classroom. We also had many opportunities to strengthen our relationship with community partners such as Youngstown State University, Mooney High School, and our fast growing PTST. ODE and out State Support Team continued to complement our school on how well it’s being ran and how we should be a model school for the state. We are looking forward to the coming year and continuing our growth as students, professionals, and leaders. Preparations are already under way for exciting new programs for the upcoming school year and our team is poised to facilitate even greater student growth for the future. Sincerely, Mike Majzun School Director

S U M M I T A C A D E M Y Y O U N G S T O W N E L E M E N T A R Y
1 4 4 N . S H E N L E Y A V E . | Y O U N G S T O W N , O H I O 4 4 5 0 9
S U M M I T A C A D E M I E S . O R G | p : 3 3 0 - 2 5 9 - 0 4 2 1 | f : 3 3 0 - 2 5 9 - 0 4 2 4
Summit Academy Schools 2015-2016 Annual Report Summit Academy Youngstown Elementary School
SCHOOL DATA: IRN: 000623 AGE LEVELS SERVED: K - 7 HOURS OF INSTRUCTION: 9:30 – 3:55 SCHOOL TYPE: Existing/Upgraded STUDENT POPULATION: 218 STUDENT DEMOGRAPHICS: All of our students are considered “at-risk” of academic failure, due to the condition ADHD and /or Asperger’s Disorder, which describes our target population. SPECIFIC DEMOGRAPHIC INFO: (By percentage) CAUCASIAN 39% AFRICAN AMERICAN 42% HISPANIC 6% MIXED / OTHER 13% MALE / FEMALE 58%/42% LOW INCOME: YES / NO 100% Yes STAFFING BY FUNCTION: ADMINISTRATIVE 11 TEACHERS 28 TEACHER/INSTRUCTIONAL AIDES 5 SUPPORT STAFF 1 ATTENDANCE RATE: 91.7% SCHOOL MISSION STATEMENT: Summit Academy Schools build hope, success, and well-being through advocacy and education for children with special needs.

S U M M I T A C A D E M Y Y O U N G S T O W N E L E M E N T A R Y
1 4 4 N . S H E N L E Y A V E . | Y O U N G S T O W N , O H I O 4 4 5 0 9
S U M M I T A C A D E M I E S . O R G | p : 3 3 0 - 2 5 9 - 0 4 2 1 | f : 3 3 0 - 2 5 9 - 0 4 2 4
Summit Academy Schools 2015-2016 Annual Report Summit Academy Youngstown Elementary School
BOARD MEMBERS: President: Eric Jones Youngstown, Oh 44511 330-881-4919
Vice President: - - -
Director: Amber Brodrick Youngstown, Oh 44515 330-770-5597
Director: Patrick Slabaugh Akron, Oh 44333 330-418-5457
Director: Joseph Gagliano Brecksville, Oh 44141 330-727-6091
Director: Jordan Shaver Boardman, Oh 44512 330-506-4283 SCHOOL STAFF: Mike Majzun Director Nicole Storey Teacher Adrienne Achenbach Assistant Director Celina Wolfe Teacher Dawn Puryear Secretary Jennifer Munholand Teacher Becky Phillips Secretary Angela Chill IA Vilmary Placares IEP Coordinator Jessica Davis Teacher Jamie Martin IEP Coordinator Patricia Stewart Teacher Gina McAllister Lead IS Karen Burkett Teacher Mike Burkett Behavior Specialist Nicole Bellas IA Marisa Wiery Behavior Specialist Nicole Storey Teacher Nicole McGrath Math Coach Kylie Luca Teacher Natasha Walski Literacy Coach Jamie Ficorelli Teacher Jennifer Cika Teacher Tyler Hile Gym Teacher Christine Frenzel Teacher Megan Gruver Art Teacher Peter Phillips Teacher Allyson Pollice Music Teacher Maria Neely Teacher David Janacone Martial Arts Instructor Regis Chill IA Sean Gordon Martial Arts Instructor Laurie Lamancusa Teacher Shirley Young Title One Tutor Cynthia Cline Teacher Sarah Colangelo Title One Tutor Rebecca Dando Teacher Doreen Duganne Title One Tutor Mary Maxin Teacher Nicole Johnston Title One Tutor Cathy Jugenheimer Teacher Melissa Anzalone Teacher Regina Bernard Teacher Kimberly Walker Teacher Deborah Reed Teacher Eric Martin Teacher Deborah Collins Teacher
S U M M I T A C A D E M Y Y O U N G S T O W N E L E M E N T A R Y
1 4 4 N . S H E N L E Y A V E . | Y O U N G S T O W N , O H I O 4 4 5 0 9
S U M M I T A C A D E M I E S . O R G | p : 3 3 0 - 2 5 9 - 0 4 2 1 | f : 3 3 0 - 2 5 9 - 0 4 2 4
Summit Academy Schools 2015-2016 Annual Report Summit Academy Youngstown Elementary School
SCHOOL HIGHLIGHTS: Over the summer we learned that our 3rd graders scored very well on their state achievement tests. Out of the 32 3rd graders that we had in our building, 29 of those students were able to move on to the 4th grade. Over 60% of those students scored proficient on their ELA test scores. For a population that has over 90% with an IEP, this is exceptional to have the type of scores we did. This is reflection not only of our 3rd grade teachers from last year, but the foundation skills these students are being taught in grades K-2. We honored these students at the beginning of the school year with certificates and school incentives.
Our annual Math Night was held in November during Parent-Teacher Conferences and once again our parents and community came out to support the school. The theme of the night was sports, teamwork, and working together. This year we have adopted the concept of sports and teamwork and used that as a focus for our Math Night. Our math and literacy coaches, Mrs. Walski and Mrs. McGrath did an exceptional job of putting the event together. We were able to feed over 80 different families as we provided “stadium” food for everyone who attended. We had 5 different math stations parents and students were able to participate in which worked on skills such as fractions, geometry, and basic math fluency. We also had face painting that was done by our own art and music teachers. To close the night we raffled off 6 themed baskets to parents that attended the night. Everything in the baskets was donated by staff prior to the event. Overall, the night was a huge success and kudos to the staff for working extremely hard to make it happen.
PTST kicked off their fundraising campaign in November hosting the 2nd Annual Chili Cook-off in our local gym this month. Once again, we had staff competing against the parents in quest to earn the title, The Best Chili in Youngstown. This year we were up in participants as we had over 15 different kinds of chili to taste. In addition to the chili tasting, those who attended were provided with cornbread, water, and pop. In addition to the 20 staff volunteers, we had our entire PTST committee members (9 total) attend with also many other friends and families of the school. In only its second year of existence, we were able to raise close to $300 which will go to future activities and fund-raising events for the school.
Below are the activities we did for School Choice Week:

S U M M I T A C A D E M Y Y O U N G S T O W N E L E M E N T A R Y
1 4 4 N . S H E N L E Y A V E . | Y O U N G S T O W N , O H I O 4 4 5 0 9
S U M M I T A C A D E M I E S . O R G | p : 3 3 0 - 2 5 9 - 0 4 2 1 | f : 3 3 0 - 2 5 9 - 0 4 2 4
Summit Academy Schools 2015-2016 Annual Report Summit Academy Youngstown Elementary School
Monday: Hat Day: Show your school choice by choosing your favorite hat with your school uniform. Tuesday: Color Wars: Each group will be competing for the most color worn. Kindergarten/First/Second: Blue Cross Cats 1-2-3: Red Third/Four Split/Fourth: Yellow Fifth/Sixth/Seventh: Black Administration: Green Special and Title Teachers: Orange Wednesday: Biggest Fan Day: Show your school choice by wearing your favorite sports team jersey, favorite band shirt, or favorite “thing” shirt. Thursday: Dress to Impress for your Future Career Choice: Summit Academy is your school and we want you to show everyone how impressive you really can be with the smart choices you make for your future. You and your family choose Summit for your quality education, so choose to impress by wearing your best! Friday: School Spirit Day and Success Assemblies: We want you to show your school pride by wearing jeans, your yellow scarf, and Summit shirt. AIR 3rd Grade Literacy Results Let us start by saying……WE ARE SO PROUD OF OUR STUDENTS AND TEACHERS!!!!!!!!!!!! We received our Fall 3rd grade scores and WOW. We want to congratulate all of the K-1-2-3-CC1-Title teachers for laying a great foundation in reading. The cut score for fall 2015 was 42. This score (42 or higher) tells us that the student will not be retained, but passed to 4th grade. The proficient score was 50.
65% passing to 4th Grade Our 5th Grade classroom, led by Mrs. Dando and Mrs. Cline, created a Living Black History Museum. Students were asked to pick an African-American figure that has made a significant impact on American culture and history. They created tri-folds with information on which figure they were and created speeches to present. Students and parents filtered through the classroom and “activated” each of our 5th grade students. They then gave a speech on their

S U M M I T A C A D E M Y Y O U N G S T O W N E L E M E N T A R Y
1 4 4 N . S H E N L E Y A V E . | Y O U N G S T O W N , O H I O 4 4 5 0 9
S U M M I T A C A D E M I E S . O R G | p : 3 3 0 - 2 5 9 - 0 4 2 1 | f : 3 3 0 - 2 5 9 - 0 4 2 4
Summit Academy Schools 2015-2016 Annual Report Summit Academy Youngstown Elementary School
important figure. It was cool to see all of our students and parents be actively engaged in the history of our country. On February 22nd we celebrated our 100th Day of School. Students and staff were asked to dress up like they were 100 years old. We also had an Oldies Dance at the end of the day for the entire school. We play oldies songs from the 50’s, 60’s, and 70’s. We also provided snacks and treats to our students. It was a fun day to celebrate being in school for 100 days and just a day to relax and enjoy being at Summit Academy. We held our Annual Literacy Night on Thursday, April 28th. The theme for the night was Legos and Literacy. It was a great turnout as we had over 200 people show up in support of the school. Some of the things we had available to the families included:
• Student performances from our High School Destination Imagination Team, the High School Drum Line, and our Martial Arts Demo Team. We also had performances from a few of our 6th and 7th graders who did some poetry reading and performed a song with our music teacher, Ms. Pollice.
• Free Spaghetti Dinner • PTST Bake Sale and Chinese Action Fundraiser • Scholastic Book Fair • Celebrity Guest Storyteller Jim Loboy from WYTV Channel 33. • Children’s Museum of Pittsburgh – The Saturday Light Brigade Sound Spectacular • Read to Some Bunny – Therapeutic reading to bunnies • A Horse of a Tale – Equine Therapy
I want to give a special shout out to Natasha Walski who is my Literacy Coach who put together a wonderful night and planned the entire event. On June 1st we took over 20 students to the shores of Lake Erie to Camp Fitch. Students spent 3 days doing numerous activities such as horse-back riding, archery, canoeing, and sports. For some of our students this was their first time away from home for a long period of time. The majority of our students have never even seen a beach before. This was a great experience to get our students out of their comfort zone and experience something they may never get to do again. In addition to all the activities, we were able to share the camp with Painesville and Warren Summit students. It was awesome getting to see all three schools interact with one another. I would like to thank all the chaperones and teachers for taking

S U M M I T A C A D E M Y Y O U N G S T O W N E L E M E N T A R Y
1 4 4 N . S H E N L E Y A V E . | Y O U N G S T O W N , O H I O 4 4 5 0 9
S U M M I T A C A D E M I E S . O R G | p : 3 3 0 - 2 5 9 - 0 4 2 1 | f : 3 3 0 - 2 5 9 - 0 4 2 4
Summit Academy Schools 2015-2016 Annual Report Summit Academy Youngstown Elementary School
time out of their busy schedule to spend those three days with us. It will be an experience our students will never forget. June 6th, we celebrated both our Kindergarten and 7th Grade graduations. We had a packed gymnasium for both ceremonies. Teachers gave out individual awards and tears were shed as our 7th graders spent their last days here before moving on to the high school for the next school year. Administration held a breakfast for our families in the morning and we sent the students over to the high school for a brief meet and greet with teachers and other students. Special thanks for Mr. Kevin Sheely over at the high school as he gave our students a tour and set up meetings with his staff. Huge thanks to the Youngstown Elementary administration as they planned both events and made it very special for all our students.

S U M M I T A C A D E M Y Y O U N G S T O W N E L E M E N T A R Y
1 4 4 N . S H E N L E Y A V E . | Y O U N G S T O W N , O H I O 4 4 5 0 9
S U M M I T A C A D E M I E S . O R G | p : 3 3 0 - 2 5 9 - 0 4 2 1 | f : 3 3 0 - 2 5 9 - 0 4 2 4
Summit Academy Schools 2015-2016 Annual Report Summit Academy Youngstown Elementary School
SUMMIT ACADEMY YOUNGSTOWN MAHONING COUNTY
Selected Financial Information For the Fiscal Years Ended June 30, 2016 and 2015
(Unaudited)
2016
2015
Operating Revenues: State Foundation
$3,145,692
$2,884,947 State and Federal Grants
607,106
610,889
Medicaid Revenue
6,716
253,033 Classroom Materials and Supplies
3,738
4,266
Food Service
-
- Other Revenue
10,568
5,042
Total Operating Revenues
3,773,820
3,758,177
Operating Expenses: Management Fee Expense
3,729,252
3,675,886 Other Expense
122
131
Total Expenses
3,729,374
3,676,017
Net Profit (Loss)
$44,446
$82,160
Net Assets Total Assets
2,470,432
941,242 Total Liabilities
8,541,218
7,056,474
Total Net Assets*
$(6,070,786)
$(6,115,232)
* The Ohio Auditor of State audited the financial statements of the school as of, and for the year ended, June 30, 2015. The Auditor's report dated December 21, 2015 indicated that the financial statements were fairly presented in conformity with accounting principles generally accepted in the United States of America. The report is available at the Auditor's website or through Summit Academy Management. The audit as of, and for the year ended, June 30, 2016 is in progress. Due to the implementation of GASB 68, the school shows a negative Net Asset amount at
fiscal year end.

IRN
: 0
0062
3Pa
ge 1
of
25Pr
inte
d on
Sep
tem
ber
28, 2
016
2015
- 2
016
Rep
ort
Car
d fo
r
Sum
mit
Aca
dem
y-Y
oung
stow
n
DIS
TRIC
T G
RA
DE
2018
Com
ing
in
SCH
OO
L G
RA
DE
Ach
ieve
men
t
Per
form
ance
Ind
ex
Indi
cato
rs M
etF
FC
OM
PO
NEN
T G
RA
DE
Pro
gres
s
Val
ue A
dded
Stud
ents
with
Dis
abili
ties.
......
......
......
......
......
......
......
......
......
......
......
......
......
......
Low
est
20%
in A
chie
vem
ent.
......
......
......
......
......
......
......
......
......
......
......
......
.....
FC
OM
PO
NEN
T G
RA
DE
The
Achi
evem
ent
com
pone
nt r
epre
sent
s th
e nu
mbe
rof
stu
dent
s w
ho p
asse
d th
e st
ate
test
s an
d ho
w w
ell
they
per
form
ed o
n th
em.
The
Prog
ress
com
pone
nt lo
oks
clos
ely
at t
hegr
owth
tha
t al
l stu
dent
s ar
e m
akin
g ba
sed
onth
eir
past
per
form
ance
s.
F
0.0%
......
......
......
......
......
......
......
......
......
......
......
......
......
......
......
......
....
......
...
41.6
%...
......
......
......
......
......
......
......
......
......
......
......
......
......
......
......
.O
vera
ll....
......
......
......
......
......
......
......
......
......
......
......
......
......
......
......
......
......
......
...
Gift
ed...
......
......
......
......
......
......
......
......
......
......
......
......
......
......
......
......
......
......
....
F NR
F F
Gap
Clo
sing
Ann
ual M
easu
rabl
e O
bjec
tive
s0.
9%...
......
......
......
......
......
......
......
......
......
......
......
......
......
......
......
......
....
......
......
......
.F
FC
OM
PO
NEN
T G
RA
DE
Gra
duat
ion
Rat
e
Gra
duat
ion
Rat
esof
stu
dent
s gr
adua
ted
in 4
yea
rs...
......
......
......
......
......
......
......
......
......
......
......
......
......
..N
Rof
stu
dent
s gr
adua
ted
in 5
yea
rs...
......
......
......
......
......
......
......
......
......
......
......
......
......
NR
Not
Rat
ed
CO
MP
ON
ENT
GR
AD
ETh
e G
ap C
losi
ng c
ompo
nent
sho
ws
how
wel
l sch
ools
are
mee
ting
the
perf
orm
ance
exp
ecta
tions
for
our
mos
t vu
lner
able
pop
ulat
ions
of
stud
ents
in E
nglis
hla
ngua
ge a
rts,
mat
h an
d gr
adua
tion.
The
Gra
duat
ion
Rate
com
pone
nt lo
oks
at t
hepe
rcen
t of
stu
dent
s w
ho a
re s
ucce
ssfu
lly f
inis
hing
high
sch
ool w
ith a
dip
lom
a in
fou
r or
fiv
e ye
ars. NR
NR
This
sch
ool i
s no
t ev
alua
ted
for
grad
uatio
n ra
te b
ecau
se t
here
are
not
enou
gh s
tude
nts
in t
he g
radu
atin
g cl
ass.
K-3
Lit
erac
y
FC
OM
PO
NEN
T G
RA
DE
Pre
pare
d fo
r Su
cces
s
Not
Rat
ed
CO
MP
ON
ENT
GR
AD
ETh
e K-
3 Li
tera
cy c
ompo
nent
look
s at
how
suc
cess
ful
the
scho
ol is
at
gett
ing
stru
gglin
g re
ader
s on
tra
ck t
opr
ofic
ienc
y in
thi
rd g
rade
and
bey
ond.
Whe
ther
tra
inin
g in
a t
echn
ical
fie
ld o
r pr
epar
ing
for
wor
k or
col
lege
, the
Pre
pare
d fo
r Su
cces
sco
mpo
nent
look
s at
how
wel
l pre
pare
d O
hio’
sst
uden
ts a
re f
or a
ll fu
ture
opp
ortu
nitie
s.
K-3
Lit
erac
y Im
prov
emen
t8.
2%...
......
......
......
......
......
......
......
......
......
......
......
......
......
......
......
......
....
......
......
......
..F

IRN
: 0
0062
3Pa
ge 2
of
25Pr
inte
d on
Sep
tem
ber
28, 2
016
2015
- 2
016
Rep
ort
Car
d fo
r Su
mm
it A
cade
my-
You
ngst
own
Ach
ieve
men
tTh
e Ac
hiev
emen
t co
mpo
nent
rep
rese
nts
the
num
ber
of s
tude
nts
who
pas
sed
the
stat
e te
sts
and
how
wel
l the
y pe
rfor
med
on
them
.
FC
OM
PO
NEN
T G
RA
DE
020406080100
120
0.0
0.0
0.0
13.6
10.2
10.6
11.0
19.3
18.0
15.7
16.7
19.9
8.6
17.5
29.3
22.6
16.8
10.4
4.6
6.7
6.1
8.5
8.0
3.5
5.2
5.4
3.7
57.2
67.2
56.1
61.7
50.0
2012
2013
2014
2015
2016
Unt
este
dLi
mit
edB
asic
Pro
fici
ent
Acc
eler
ated
Adv
ance
d
= = =
0.0
1.3
x x x
Adva
nced
Plu
sAd
vanc
edAc
cele
rate
dPr
ofic
ient
Basi
cLi
mite
dU
ntes
ted
1.2
1.1
1.0
0.6
0.3
0.0
3.1
7.3
10.4
14.3
64.4
0.6
3.7
8.0
10.4
8.6
19.3
0.0
50.0
xxxx
====
0.0
020
4060
80
100
FG
RA
DE
Per
form
ance
Ind
exTh
e Pe
rfor
man
ce I
ndex
mea
sure
s th
e te
st r
esul
ts o
f ev
ery
stud
ent,
not
just
tho
se w
hosc
ore
prof
icie
nt o
r hi
gher
. The
re a
re s
ix le
vels
on
the
inde
x an
d di
stric
ts r
ecei
ve p
oint
sfo
r ev
ery
stud
ent
in e
ach
of t
hese
leve
ls. T
he h
ighe
r th
e ac
hiev
emen
t le
vel t
he m
ore
the
poin
ts a
war
ded
in t
he d
istr
ict's
inde
x. T
his
rew
ards
sch
ools
and
dis
tric
ts f
orim
prov
ing
the
perf
orm
ance
of
all s
tude
nts,
reg
ardl
ess
of a
chie
vem
ent
leve
l.
41.6
%
Perf
orm
ance
Ind
ex
50.0
of
a po
ssib
le 1
20.0
A =
90.0
- 1
00.0
%B
=80
.0 -
89.
9%C
=70
.0 -
79.
9%D
=50
.0 -
69.
9%F
=0.
0 -
49.9
%3.
17.
3
10.4
64.4
14.3
0.6
Adva
nced
Plu
sAd
vanc
edAc
cele
rate
dPr
ofic
ient
Lim
ited
Basi
cU
ntes
ted
Ach
ieve
men
tLe
vel
Pct
of
Stud
ents
Poi
nts
for
this
Lev
elP
oint
sR
ecei
ved
Perf
orm
ance
Ind
ex T
rend

IRN
: 0
0062
3Pa
ge 3
of
25Pr
inte
d on
Sep
tem
ber
28, 2
016
2015
- 2
016
Rep
ort
Car
d fo
r Su
mm
it A
cade
my-
You
ngst
own
FG
RA
DE
Indi
cato
rs M
etIn
dica
tors
Met
mea
sure
s th
e pe
rcen
t of
stu
dent
s w
ho h
ave
pass
ed s
tate
tes
ts.
It a
lso
incl
udes
the
gift
ed in
dica
tor.
Te
st r
esul
ts a
re r
epor
ted
for
each
stu
dent
in a
gra
de a
nd s
ubje
ct.
Indi
cato
rs M
et %
020
4060
80
100
0.0%
0 ou
t of
13
A =
B =
C =
D =
F =
90.0
- 1
00.0
%80
.0 -
89.
9%70
.0 -
79.
9%50
.0 -
69.
9%0.
0 -
49.9
%
6th
Gra
de
7th
Gra
de
Eng
lish
Lang
uage
Arts
Mat
hem
atic
s
Soc
ial S
tudi
es
Eng
lish
Lang
uage
Arts
Mat
hem
atic
s
16.0
%
16.0
%
20.0
%
26.9
%
23.1
%
No
data
retu
rned
for t
his
view
. Thi
s m
ight
be
beca
use
the
appl
ied
filte
rex
clud
es a
ll da
ta.
3rd
Gra
de
4th
Gra
de
5th
Gra
de
Eng
lish
Lang
uage
Arts
Mat
hem
atic
s
Eng
lish
Lang
uage
Arts
Mat
hem
atic
s
Soc
ial S
tudi
es
Eng
lish
Lang
uage
Arts
Mat
hem
atic
s
Sci
ence
6.5%
14.8
%
19.4
%
27.5
%
25.0
%
27.8
%
27.8
%
22.2
%
This
sch
ool d
oes
not
have
enou
gh O
hio
Gra
duat
ion
Test
res
ults
to
disp
lay
this
tabl
e.
Gra
des
3-5
Gra
des
6-8
Hig
h Sc
hool
GIF
TED
IN
DIC
ATO
R N
C

IRN
: 0
0062
3Pa
ge 4
of
25Pr
inte
d on
Sep
tem
ber
28, 2
016
2015
- 2
016
Rep
ort
Car
d fo
r Su
mm
it A
cade
my-
You
ngst
own
Ach
ieve
men
t Le
vels
by
Gra
deP
rofi
cien
t P
erce
nt T
rend
by
Gra
de
3rd
Gra
de
0%10%
20%
30%
40%
50%
60%
70%
6.5%
14.8
%
0.0%
0.0%
54.9
%
65.8
%
Read
ing
Mat
hem
atic
s
Scho
olD
istr
ict
Stat
e Av
erag
e
0%20%
40%
60%
80%
100%
2012
2013
2014
2015
2016
Read
ing
Mat
hem
atic
s
3rd
Gra
de
4th
Gra
de
0%10%
20%
30%
40%
50%
60%
70%
80%
19.4
%27
.5%
25.0
%
0.0%
0.0%
0.0%
57.5
%69
.2%
75.8
%
Read
ing
Mat
hem
atic
sSo
cial
Stu
dies
Scho
olD
istr
ict
Stat
e Av
erag
e
0%20%
40%
60%
80%
100%
2012
2013
2014
2015
2016
Read
ing
Mat
hem
atic
sSo
cial
Stu
dies
4th
Gra
de
5th
Gra
de
0%10%
20%
30%
40%
50%
60%
70%
80%
27.8
%27
.8%
22.2
%
0.0%
0.0%
0.0%
60.2
%62
.4%
67.5
%
Read
ing
Mat
hem
atic
sSc
ienc
e
Scho
olD
istr
ict
Stat
e Av
erag
e
0%20%
40%
60%
80%
100%
2012
2013
2014
2015
2016
Read
ing
Mat
hem
atic
sSc
ienc
e
5th
Gra
de
6th
Gra
de6t
h G
rade
IRN
: 0
0062
3Pa
ge 5
of
25Pr
inte
d on
Sep
tem
ber
28, 2
016
2015
- 2
016
Rep
ort
Car
d fo
r Su
mm
it A
cade
my-
You
ngst
own
0%10%
20%
30%
40%
50%
60%
70%
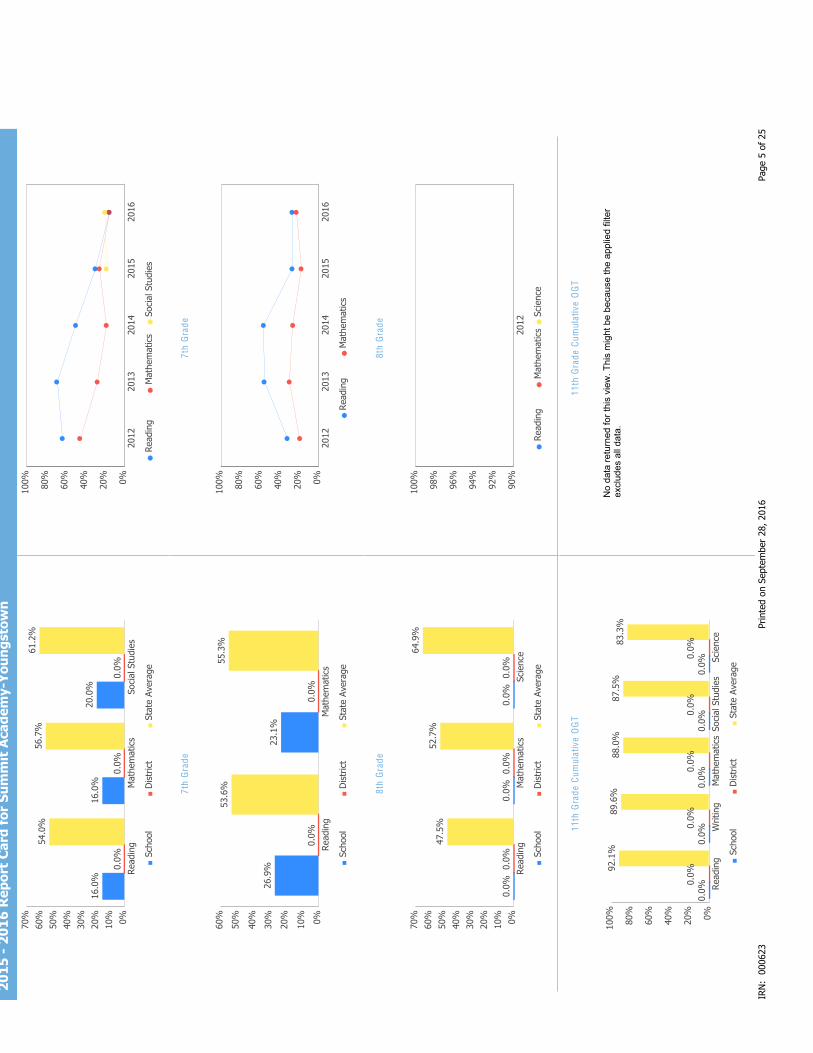
16.0
%16
.0%
20.0
%
0.0%
0.0%
0.0%
54.0
%56
.7%
61.2
%
Read
ing
Mat
hem
atic
sSo
cial
Stu
dies
Scho
olD
istr
ict
Stat
e Av
erag
e
0%20%
40%
60%
80%
100%
2012
2013
2014
2015
2016
Read
ing
Mat
hem
atic
sSo
cial
Stu
dies
7th
Gra
de
0%10%
20%
30%
40%
50%
60%
26.9
%23
.1%
0.0%
0.0%
53.6
%55
.3%
Read
ing
Mat
hem
atic
s
Scho
olD
istr
ict
Stat
e Av
erag
e
0%20%
40%
60%
80%
100%
2012
2013
2014
2015
2016
Read
ing
Mat
hem
atic
s
7th
Gra
de
8th
Gra
de
0%10%
20%
30%
40%
50%
60%
70%
0.0%
0.0%
0.0%
0.0%
0.0%
0.0%
47.5
%52
.7%
64.9
%
Read
ing
Mat
hem
atic
sSc
ienc
e
Scho
olD
istr
ict
Stat
e Av
erag
e
90%
92%
94%
96%
98%
100%
2012
Read
ing
Mat
hem
atic
sSc
ienc
e
8th
Gra
de
11th
Gra
de C
umul
ativ
e O
GT
0%20%
40%
60%
80%
100%
0.0%
0.0%
0.0%
0.0%
0.0%
0.0%
0.0%
0.0%
0.0%
0.0%
92.1
%89
.6%
88.0
%87
.5%
83.3
%
Read
ing
Writ
ing
Mat
hem
atic
sSo
cial
Stu
dies
Scie
nce
Scho
olD
istr
ict
Stat
e Av
erag
e
No
data
retu
rned
for t
his
view
. Thi
s m
ight
be
beca
use
the
appl
ied
filte
rex
clud
es a
ll da
ta.
11th
Gra
de C
umul
ativ
e O
GT

IRN
: 0
0062
3Pa
ge 6
of
25Pr
inte
d on
Sep
tem
ber
28, 2
016
2015
- 2
016
Rep
ort
Car
d fo
r Su
mm
it A
cade
my-
You
ngst
own

IRN
: 0
0062
3Pa
ge 7
of
25Pr
inte
d on
Sep
tem
ber
28, 2
016
2015
- 2
016
Rep
ort
Car
d fo
r Su
mm
it A
cade
my-
You
ngst
own
Gif
ted
Stud
ents
The
Gift
ed S
tude
nts
data
and
Ind
icat
or h
ighl
ight
the
opp
ortu
nitie
s fo
ran
d pe
rfor
man
ce o
f gi
fted
stu
dent
s. T
he d
ashb
oard
ans
wer
s se
vera
lqu
estio
ns:
How
man
y st
uden
ts a
re id
entif
ied
as g
ifted
and
in w
hat
cate
gorie
s? H
ow m
any
of t
hose
stu
dent
s ar
e re
ceiv
ing
gift
ed s
ervi
ces?
How
wel
l are
tho
se g
ifted
stu
dent
s pe
rfor
min
g? Th
e G
ifted
Ind
icat
orm
easu
res
whe
ther
opp
ortu
nity
and
per
form
ance
exp
ecta
tions
are
bei
ngm
et f
or g
ifted
stu
dent
s.
IND
ICA
TOR
NC
The
Gift
ed I
ndic
ator
is d
eriv
ed f
rom
thr
ee c
ompo
nent
s: G
ifted
Val
ue A
dded
gra
de, t
hePe
rfor
man
ce I
ndex
for
gift
ed s
tude
nts,
and
a G
ifted
Inp
uts
scor
e.
Gif
ted
Val
ue A
dded
Scho
ols
mus
t ea
rn a
Gift
ed V
alue
Add
ed g
rade
of
Cor
bet
ter
to m
eet
the
Gift
ed V
alue
Add
edco
mpo
nent
.
Gif
ted
Per
form
ance
Ind
ex
Scho
ols
with
at
leas
t 10
uni
que
stud
ents
in t
heG
ifted
Per
form
ance
Ind
ex c
alcu
latio
n m
ust
scor
e11
6.0
or b
ette
r to
mee
t th
e G
ifted
Per
form
ance
Inde
x co
mpo
nent
.
Gif
ted
Inpu
ts
Poin
ts a
re e
arne
d ba
sed
on id
entif
icat
ion
and
serv
ices
pro
vide
d to
gift
ed s
tude
nts.
Sch
ools
mus
tea
rn 6
0 or
mor
e po
ints
out
of
a po
ssib
le 1
00 t
om
eet
the
Gift
ed I
nput
s co
mpo
nent
.
Gif
ted
Indi
cato
r Fi
nal R
esul
t
The
Gift
ed I
ndic
ator
is M
et if
non
e of
the
thr
eeco
mpo
nent
s ar
e N
ot M
et.
Gift
ed I
nput
s al
one
cann
ot d
eter
min
e th
e G
ifted
Ind
icat
or, h
owev
er;
ifbo
th t
he V
alue
Add
ed a
nd P
erfo
rman
ce I
ndex
com
pone
nts
are
NC,
the
n th
e G
ifted
Ind
icat
or is
als
oN
C.
IND
ICA
TOR
NC
Tota
l Poi
nts:
Gif
ted
Inpu
ts M
et?:
0.0
Not
Met
Per
form
ance
Ind
ex:
0.00
0
NC
Per
form
ance
Ind
ex M
et?:
Val
ue A
dded
Gra
de:
Val
ue A
dded
Met
?:N
RN
C
Ove
rvie
wP
erfo
rman
ce I
ndex
0.0%
0.00
0 of
a p
ossi
ble
120.
0
A =
90.0
- 1
00.0
%B
=80
.0 -
89.
9%C
=70
.0 -
79.
9%D
=50
.0 -
69.
9%F
=0.
0 -
49.9
%
Ach
ieve
men
tLe
vel
Pct
of
Stud
ents
Poi
nts
for
this
Lev
elP
oint
sR
ecei
ved
Adva
nced
Plu
s0.
0x
1.3
=0.
0Ad
vanc
ed0.
0x
1.2
=0.
0Ac
cele
rate
d0.
0x
1.1
=0.
0Pr
ofic
ient
0.0
x1.
0=
0.0
Basi
c0.
0x
0.6
=0.
0Li
mite
d0.
00.
0x
0.3
=U
ntes
ted
0.0
x0.
0=
0.0
0.00
0
The
Perf
orm
ance
Ind
ex c
alcu
latio
n fo
r gi
fted
stu
dent
s. O
nly
test
sta
ken
by s
tude
nts
iden
tifie
d as
gift
ed in
tha
t su
bjec
t (e
.g. g
ifted
inM
ath
and
taki
ng t
he M
ath
test
), o
r ta
ken
by s
tude
nts
iden
tifie
d w
ithSu
per
Cogn
itive
abi
litie
s re
gard
less
of
test
sub
ject
are
incl
uded
.020
4060
80
100
Adva
nced
Plu
sAd
vanc
edAc
cela
rate
dPr
ofic
ient
Lim
ited
Basi
cU
ntes
ted

IRN
: 0
0062
3Pa
ge 8
of
25Pr
inte
d on
Sep
tem
ber
28, 2
016
2015
- 2
016
Rep
ort
Car
d fo
r Su
mm
it A
cade
my-
You
ngst
own
Gif
ted
Indi
cato
rTh
e G
ifted
Inp
uts
calc
ulat
ion
assi
gns
poin
ts b
ased
on
the
perc
enta
ge o
f st
uden
ts id
entif
ied
and
serv
ed in
eig
ht c
ateg
orie
s (f
acto
rs).
Th
e po
ints
ear
ned
for
each
cat
egor
y ar
e to
tale
d to
det
erm
ine
the
final
Met
/Not
Met
dete
rmin
atio
n fo
r th
e G
ifted
Inp
ut c
ompo
nent
.
Rea
ding
, Mat
h, S
cien
ce, S
ocia
l Stu
dies
, and
Sup
erio
r C
ogni
tive
Abi
litie
sV
isua
l/P
erfo
rmin
g A
rts
and
Cre
ativ
e Th
inki
ng
100.
0%10
0.0%
Dis
adva
ntag
ed S
tude
nts
Min
orit
y St
uden
ts
100.
0%10
0.0%
Rece
ivin
g G
ifted
Ser
vice
sId
entif
ied
as G
ifted
, but
not
rece
ivin
g se
rvic
esN
ot I
dent
ified
as
Gift
ed

IRN
: 0
0062
3Pa
ge 9
of
25Pr
inte
d on
Sep
tem
ber
28, 2
016
2015
- 2
016
Rep
ort
Car
d fo
r Su
mm
it A
cade
my-
You
ngst
own
Pro
gres
sTh
e Pr
ogre
ss c
ompo
nent
look
s cl
osel
y at
the
gro
wth
tha
t al
l stu
dent
sar
e m
akin
g ba
sed
on t
heir
past
per
form
ance
s.
FC
OM
PO
NEN
T G
RA
DE
FG
RA
DE
Ove
rall
NR
GR
AD
EG
ifte
d St
uden
ts
FG
RA
DE
Stud
ents
wit
h D
isab
iliti
es
FG
RA
DE
Stud
ents
in t
he L
owes
t 20
% in
Ach
ieve
men
t
This
mea
sure
s th
e pr
ogre
ss f
or a
ll st
uden
ts in
mat
h, E
LA, s
cien
ce a
ndso
cial
stu
dies
usi
ng t
ests
in g
rade
s 4-
8 an
d so
me
end-
of-c
ours
e ex
ams.
This
mea
sure
s th
e pr
ogre
ss f
or s
tude
nts
iden
tifie
d as
gift
ed in
rea
ding
,m
ath,
sci
ence
, soc
ial s
tudi
es a
nd/o
r su
perio
r co
gniti
ve a
bilit
y.
This
mea
sure
s th
e pr
ogre
ss f
or s
tude
nts
with
dis
abili
ties.
This
mea
sure
s th
e pr
ogre
ss f
or s
tude
nts
iden
tifie
d as
the
low
est
20%
stat
ewid
e in
rea
ding
, mat
h, s
cien
ce o
r so
cial
stu
dies
ach
ieve
men
t.
Test
Gra
dePr
ogre
ss S
core
Engl
ish
Lang
uage
Art
sM
athe
mat
ics
Soci
al S
tudi
esSc
ienc
eA
ll Te
sts
All
Gra
des
4th
Gra
de
5th
Gra
de
6th
Gra
de
7th
Gra
de
-1.5
3-4
.51
-2.7
1-4
.11
-4.5
9
-2.8
5-3
.09
-3.9
0
-0.5
7-0
.38
-4.1
1-2
.31
-0.1
2-3
.25
-2.7
1-2
.96
1.14
-1.8
5-0
.31
Thes
e ta
bles
sho
w t
he P
rogr
ess
scor
es b
y te
st g
rade
and
sub
ject
for
stu
dent
s in
gra
des
4-8
and
som
e en
d-of
-cou
rse
test
s, a
nd in
clud
es u
p to
thr
ee y
ears
of
data
as
avai
labl
e.
No
data
retu
rned
for t
his
view
. Thi
s m
ight
be
beca
use
the
appl
ied
filte
r exc
lude
s al
l dat
a.N
o da
ta re
turn
ed fo
r thi
s vi
ew. T
his
mig
ht b
e be
caus
eth
e ap
plie
d fil
ter e
xclu
des
all d
ata.
Alth
ough
Pro
gres
s sc
ores
are
not
assi
gned
lett
er g
rade
s at
thi
s le
vel o
fde
tail,
the
gra
ding
sca
le a
pplie
d at
the
Ove
rall
(All
Stud
ents
, All
Test
s) le
vel i
s:
A =
2.00
and
up
B =
1.00
to
1.99
C =
-1.0
0 to
0.9
9D
=-2
.00
to -
1.01
F =
belo
w -
2.00
Hig
h Sc
hool
Mat
h Va
lue
Adde
dda
ta is
not
ava
ilabl
e fo
r th
issc
hool
Hig
h Sc
hool
Eng
lish
Lang
uage
Art
s Va
lue
Adde
dda
ta is
not
ava
ilabl
e fo
r th
issc
hool
Pro
gres
s D
etai
ls
FG
RA
DE
Hig
h M
obili
tyFo
r di
stric
ts a
nd s
choo
ls w
ith a
mob
ility
rat
e of
25%
or
high
er, t
his
mea
sure
s th
e pr
ogre
ss o
f a
subs
et o
f st
uden
ts t
hat
have
bee
n in
the
dist
rict
for
at le
ast
two
year
s. T
his
mea
sure
will
not
be
incl
uded
in t
hePr
ogre
ss c
ompo
nent
gra
de.

IRN
: 0
0062
3Pa
ge 1
0 of
25
Prin
ted
on S
epte
mbe
r 28
, 201
6
2015
- 2
016
Rep
ort
Car
d fo
r Su
mm
it A
cade
my-
You
ngst
own
Pro
gres
s vs
. Per
form
ance
Ind
ex
This
bub
ble
char
t sh
ows
the
rela
tions
hip
betw
een
each
sub
grou
p's
Perf
orm
ance
Ind
ex r
esul
ts (
horiz
onta
lax
is)
to t
he V
alue
-Add
ed le
tter
gra
de (
vert
ical
axi
s).
The
size
of
the
bubb
le r
epre
sent
s th
e si
ze o
f th
est
uden
t su
bgro
up.
020
4060
8010
012
0
Ove
rall
Stud
ents
w/
Dis
abili
ties
Low
est
20%
Gift
edH
igh
Scho
olH
ighl
y M
obile
A B C D F
Per
form
ance
Ind
ex
Grade

IRN
: 0
0062
3Pa
ge 1
1 of
25
Prin
ted
on S
epte
mbe
r 28
, 201
6
2015
- 2
016
Rep
ort
Car
d fo
r Su
mm
it A
cade
my-
You
ngst
own
Gap
Clo
sing
The
Gap
Clo
sing
com
pone
nt s
how
s ho
w w
ell s
choo
ls a
re m
eetin
g th
epe
rfor
man
ce e
xpec
tatio
ns f
or o
ur m
ost
vuln
erab
le p
opul
atio
ns o
fst
uden
ts in
Eng
lish
lang
uage
art
s, m
ath
and
grad
uatio
n.
FC
OM
PO
NEN
T G
RA
DE
FG
RA
DE
Ann
ual M
easu
rabl
e O
bjec
tive
sAn
nual
Mea
sura
ble
Obj
ectiv
es (
AMO
s) c
ompa
re t
he p
erfo
rman
ce o
f st
uden
t gr
oups
to
a st
ate
goal
whi
ch is
dis
play
ed a
s th
e re
d lin
e in
the
fol
low
ing
char
ts. T
hese
cha
rts
show
how
wel
l eac
h gr
oup
achi
eves
that
goa
l in
read
ing,
mat
h an
d gr
adua
tion
– an
d em
phas
ize
any
achi
evem
ent
gaps
tha
t ex
ist
betw
een
grou
ps. T
he u
ltim
ate
goal
is f
or a
ll gr
oups
to
achi
eve
at h
igh
leve
ls.
The
red
line
on e
ach
grap
h id
entif
ies
the
Annu
al M
easu
rabl
e O
bjec
tive.
Th
e 20
16 A
MO
for
ELA
is 7
4.2%
, for
Mat
h is
68.
5%, a
nd f
or G
radu
atio
n Ra
te is
82.
8%.
020
4060
8010
0
20.3
19.6
19.4
18.4
14.8
Afric
an A
mer
ican
Whi
teEc
on D
isad
vant
age
All S
tude
nts
Stud
ents
w/
Dis
ab...
AMO
Poi
nts
0.9%
020
4060
80
100
1
A =
90.0
- 1
00.0
%B
=80
.0 -
89.
9%C
=70
.0 -
79.
9%D
=60
.0 -
69.
9%F
=0.
0 -
59.9
%
020
4060
8010
0
29.4
23.4
22.1
20.3
18.0
Whi
teEc
on D
isad
vant
age
All S
tude
nts
Afric
an A
mer
ican
Stud
ents
w/
Dis
a...
No
data
retu
rned
for t
his
view
. Thi
s m
ight
be
beca
use
the
appl
ied
filte
r exc
lude
s al
l dat
a.
Subg
roup
s w
ith f
ewer
tha
n 30
stu
dent
s ar
e no
t ra
ted
and
do n
ot a
ppea
r on
the
gra
phs.
This
sch
ool d
oes
not
have
an
Annu
al M
easu
rabl
eO
bjec
tive
for
Gra
duat
ion
Rat
e be
caus
e th
ere
wer
e no
ten
ough
stu
dent
s to
eva
luat
e.
Gra
duat
ion
Rat
eM
ath
Engl
ish
Lang
uage
Art
s

IRN
: 0
0062
3Pa
ge 1
2 of
25
Prin
ted
on S
epte
mbe
r 28
, 201
6
2015
- 2
016
Rep
ort
Car
d fo
r Su
mm
it A
cade
my-
You
ngst
own
Gra
duat
ion
Rat
eTh
e G
radu
atio
n Ra
te c
ompo
nent
look
s at
the
per
cent
of
stud
ents
who
are
succ
essf
ully
fin
ishi
ng h
igh
scho
ol w
ith a
dip
lom
a in
fou
r or
fiv
eye
ars.
Not
Rat
ed
CO
MP
ON
ENT
GR
AD
E
D =
B =
020406080100
0.0
0.0
83.0
Scho
olD
istr
ict
Stat
e Av
erag
e
4-Y
ear
Rat
e
020406080100
0.0
0.0
84.9
Scho
olD
istr
ict
Stat
e Av
erag
e
5-Y
ear
Rat
e
NR
GR
AD
E
4-Y
ear
Gra
duat
ion
Rat
eTh
e 4-
year
gra
duat
ion
rate
app
lies
to t
he C
lass
of
2015
who
gra
duat
ed w
ithin
fou
r ye
ars,
i.e.
stu
dent
s w
hoen
tere
d th
e 9t
h gr
ade
in 2
012
and
grad
uate
d by
201
5.
NR
GR
AD
E
5-Y
ear
Gra
duat
ion
Rat
eTh
e 5-
year
gra
duat
ion
rate
app
lies
to t
he C
lass
of
2014
who
gra
duat
ed w
ithin
fiv
e ye
ars,
i.e.
stu
dent
s w
hoen
tere
d th
e 9t
h gr
ade
in 2
011
and
grad
uate
d by
201
5.
NR
NR
A =
93.0
- 1
00.0
%89
.0 -
92.
9%C
=84
.0 -
88.
9%79
.0 -
83.
9%F
=0.
0 -
78.9
%
A =
95.0
- 1
00.0
%B
=90
.0 -
94.
9%C
=85
.0 -
89.
9%D
=80
.0 -
84.
9%F
=0.
0 -
79.9
%
020
4060
80
100
020
4060
80
100
This
sch
ool h
as n
ot b
een
assi
gned
a gr
ade
for
Gra
duat
ion
Rat
ebe
caus
e th
ere
wer
e no
t en
ough
stud
ents
to
eval
uate
.

IRN
: 0
0062
3Pa
ge 1
3 of
25
Prin
ted
on S
epte
mbe
r 28
, 201
6
2015
- 2
016
Rep
ort
Car
d fo
r Su
mm
it A
cade
my-
You
ngst
own
Gra
duat
ion
Rat
e Tr
end
No
data
retu
rned
for t
his
view
. Thi
s m
ight
be
beca
use
the
appl
ied
filte
r exc
lude
s al
l dat
a.
Not
e: T
he 5
-yea
r gr
adua
tion
rate
doe
s no
t ap
pear
in t
he fi
nal y
ear
of t
his
grap
h be
caus
e th
ene
cess
ary
data
is n
ot y
et a
vaila
ble
to c
alcu
late
the
5-y
ear
rate
for
tha
t sc
hool
yea
r.
The
Gra
duat
ion
Rat
e gr
aph
that
wou
ld a
ppea
r in
thi
s sp
ace
cann
otbe
dis
play
ed b
ecau
se t
here
wer
eno
t en
ough
stu
dent
s to
eva
luat
e.

IRN
: 0
0062
3Pa
ge 1
4 of
25
Prin
ted
on S
epte
mbe
r 28
, 201
6
2015
- 2
016
Rep
ort
Car
d fo
r Su
mm
it A
cade
my-
You
ngst
own
K-3
Lit
erac
y The
K-3
Lite
racy
com
pone
nt lo
oks
at h
ow s
ucce
ssfu
l the
sch
ool i
s at
gett
ing
stru
gglin
g re
ader
s on
tra
ck t
o pr
ofic
ienc
y in
thi
rd g
rade
and
beyo
nd.
FC
OM
PO
NEN
T G
RA
DE
020
4060
80
100
FG
RA
DE
8.2%
K-3
Lite
racy
Impr
ovem
ent
4 ou
t of
49
Not
On-
Trac
k at
Poi
nt A
Impr
ovin
g to
On-
Trac
kat
Poi
nt B
Kind
erga
rten
Rea
ding
Dia
gnos
tic, S
choo
lYe
ar 2
014
- 20
15<
10
to1s
t G
rade
Rea
ding
Dia
gnos
tic, S
choo
lYe
ar 2
015
- 20
16<
10
1st
Gra
de R
eadi
ngD
iagn
ostic
, Sch
ool
Year
201
4 -
2015
< 1
0to
2nd
Gra
de R
eadi
ngD
iagn
ostic
, Sch
ool
Year
201
5 -
2016
< 1
0
2nd
Gra
de R
eadi
ngD
iagn
ostic
, Sch
ool
Year
201
4 -
2015
< 1
0to
3rd
Gra
de R
eadi
ngD
iagn
ostic
, Sch
ool
Year
201
5 -
2016
< 1
0
3rd
Gra
de R
eadi
ngD
iagn
ostic
, Sch
ool
Year
201
5 -
2016
< 1
0to
3rd
Gra
de R
eadi
ngO
ST, S
choo
l Yea
r20
15 -
201
6<
10
Ded
uctio
n fo
r 3r
d gr
ader
s w
ho d
id n
ot p
ass
OST
and
wer
eno
t on
a R
eadi
ng I
mpr
ovem
ent
and
Mon
itorin
g Pl
an<
10
Tota
ls49
4
Det
ails
of
Mea
sure
< 1
0
NC
kind
erga
rten
stu
dent
s w
ere
not
on-
trac
k la
st y
ear.
of t
hose
stu
dent
s im
prov
ed t
o on
-tr
ack
in 1
st g
rade
.
< 1
0
NC
first
gra
de s
tude
nts
wer
e no
t on
-tr
ack
last
yea
r.
of t
hose
stu
dent
s im
prov
ed t
o on
-tr
ack
in 2
nd g
rade
.
< 1
0
NC
seco
nd g
rade
stu
dent
s w
ere
not
on-t
rack
last
yea
r.
of t
hose
stu
dent
s im
prov
ed t
o on
-tr
ack
in 3
rd g
rade
.
< 1
0
NC
third
gra
de s
tude
nts
wer
e no
t on
-tr
ack
this
yea
r.
of t
hose
stu
dent
s re
ache
dpr
ofic
ienc
y on
the
3rd
gra
de O
AA.
In Y
our
Scho
ol...
A =
81.4
- 1
00.0
%B
=62
.6 -
81.
3%C
=43
.8 -
62.
5%D
=25
.0 -
43.
7%F
=0.
0 -
24.9
%

IRN
: 0
0062
3Pa
ge 1
5 of
25
Prin
ted
on S
epte
mbe
r 28
, 201
6
2015
- 2
016
Rep
ort
Car
d fo
r Su
mm
it A
cade
my-
You
ngst
own
Per
cent
age
On-
Trac
k in
Rea
ding
Dia
gnos
tic
0%20
%40
%60
%80
%10
0%
30.8
%
40.0
%
26.7
%
13.0
%
69.2
%
60.0
%
73.3
%
87.0
%
Kind
erga
rten
Dia
gnos
tic
Firs
t G
rade
Dia
gnos
tic
Seco
nd G
rade
Dia
gnos
tic
Third
Gra
deD
iagn
ostic
On-
Trac
kN
otO
n-Tr
ack
Thir
d G
rade
Rea
ding
Gua
rant
ee
Ohi
o's
Third
Gra
de R
eadi
ng G
uara
ntee
ens
ures
tha
t st
uden
ts a
re s
ucce
ssfu
l in
read
ing
befo
re m
ovin
g on
to
four
th g
rade
. Sch
ools
mus
t pr
ovid
e su
ppor
ts f
orst
rugg
ling
read
ers
in e
arly
gra
des.
If
a ch
ild a
ppea
rs t
o be
fal
ling
behi
nd in
rea
ding
,th
e sc
hool
will
imm
edia
tely
sta
rt a
Rea
ding
Im
prov
emen
t an
d M
onito
ring
Plan
. The
prog
ram
ens
ures
tha
t ev
ery
stru
gglin
g re
ader
get
s th
e su
ppor
t he
or
she
need
s to
lear
n an
d ac
hiev
e.
Stud
ents
hav
e m
ultip
le o
ppor
tuni
ties
to m
eet
prom
otio
n re
quire
men
ts in
clud
ing
mee
ting
a m
inim
um p
rom
otio
n sc
ore
on t
he t
hird
gra
de s
tate
rea
ding
tes
ts g
iven
inth
e fa
ll an
d sp
ring.
Stu
dent
s ha
ve a
n ad
ditio
nal o
ppor
tuni
ty t
o ta
ke t
he s
tate
asse
ssm
ent
in t
he s
umm
er, a
s w
ell a
s a
dist
rict-
dete
rmin
ed a
ltern
ativ
e as
sess
men
t.
The
Pare
nt R
oadm
ap is
ava
ilabl
e to
hel
p pa
rent
s un
ders
tand
how
the
Thi
rd G
rade
Read
ing
Gua
rant
ee a
pplie
s to
you
r ch
ild.
How
man
y th
ird g
rade
rs m
et t
he T
hird
Gra
de R
eadi
ngG
uara
ntee
req
uire
men
ts f
or p
rom
otio
n to
4th
gra
de?
73.7
%
How
man
y th
ird g
rade
rs s
core
d pr
ofic
ient
on
the
stat
e Re
adin
gte
st?
6.5%
This
cha
rt s
how
s th
e ov
eral
l per
cent
age
of s
tude
nts
that
wer
e on
-tra
ck/n
ot-o
n-tr
ack
for
each
grad
e le
vel r
eadi
ng d
iagn
ostic
in 2
015-
2016
.

IRN
: 0
0062
3Pa
ge 1
6 of
25
Prin
ted
on S
epte
mbe
r 28
, 201
6
2015
- 2
016
Rep
ort
Car
d fo
r Su
mm
it A
cade
my-
You
ngst
own
Pre
pare
d fo
r Su
cces
sW
heth
er t
rain
ing
in a
tec
hnic
al f
ield
or
prep
arin
g fo
r w
ork
or c
olle
ge,
the
Prep
ared
for
Suc
cess
com
pone
nt lo
oks
at h
ow w
ell p
repa
red
Ohi
o’s
stud
ents
are
for
all
futu
re o
ppor
tuni
ties.
Not
Rat
ed
CO
MP
ON
ENT
GR
AD
E
How
Pre
pare
d w
ere
You
r 20
14 a
nd 2
015
Gra
duat
ing
Cla
sses
?
0.0%
0.0%
0.0%
0.0%
0.0%
0.0%
0.0%
0.0%
0.0%
AC
T: P
arti
cipa
tion
AC
T: R
emed
iati
on F
ree
SAT:
Par
tici
pati
on
SAT:
Rem
edia
tion
Fre
e
Hon
ors
Dip
lom
a
Indu
stry
-Rec
ogni
zed
Cre
dent
ial
Adv
ance
d P
lace
men
t:P
arti
cipa
tion
AP
: Ex
am S
core
of
3 or
Bet
ter
Dua
l Enr
ollm
ent
Cre
dit
Inte
rnat
iona
lB
acca
laur
eate
IB:
Exam
Sco
re o
f 4
orB
ette
r
0.0% 0%
20%
40%
60%
80%
100%
0.0%
This
dat
a ca
nnot
be
show
n be
caus
eth
ere
are
not
enou
gh s
tude
nts
in t
hegr
adua
ting
clas
s of
201
5 to
eva
luat
e.
Not
e: T
hese
dat
a re
pres
ent
stud
ents
in t
he 4
-yea
r an
d 5-
year
gra
duat
ion
rate
s, i.
e. s
tude
nts
who
ent
ered
9th
gra
de in
201
1 an
d 20
12.
Num
ber
of s
tude
nts
that
ear
ned
are
med
iati
on f
ree
scor
e on
all
part
s of
the
AC
T or
SA
T, e
arne
d an
hon
ors
dipl
oma,
and
/or
earn
ed a
n in
dust
ry-
reco
gniz
ed c
rede
ntia
l
The
num
ber
of "
bonu
s" s
tude
nts
that
coun
t an
add
itio
nal 0
.3 b
onus
poi
nts
each
, bec
ause
the
y di
d th
e ab
ove
and
also
ear
ned
a 3
or h
ighe
r on
at
leas
t on
e A
P e
xam
; ea
rned
a 4
or
high
er o
n at
leas
t on
e IB
exa
m;
and/
or e
arne
d at
leas
t th
ree
colle
gecr
edit
s be
fore
leav
ing
high
sch
ool
Num
ber
ofSt
uden
tsP
oint
Val
ueP
oint
sEa
rne
d
00.
0
00.
0
1 0.3
Tota
l Poi
nts:
Gra
duat
ion
Coh
ort:
Per
cent
age:
0.0 0
Not
Rat
ed
CO
MP
ON
ENT
GR
AD
E
85.0
% -
100
.0%
65.0
% -
84.
9%34
.0%
- 6
4.9%
15.0
% -
33.
9%
A =
B =
C =
D =
0.0%
- 1
4.9%
F =
0%20%
40%
60%
80%
100%
This
dat
a ca
nnot
be
show
n be
caus
e th
ere
are
not
enou
ghst
uden
ts in
the
gra
duat
ing
clas
s of
201
5 to
eva
luat
e.
IRN
: 0
0062
3Pa
ge 1
7 of
25
Prin
ted
on S
epte
mbe
r 28
, 201
6
2015
- 2
016
Rep
ort
Car
d fo
r Su
mm
it A
cade
my-
You
ngst
own
100.
0%
100.
0%
Not
e: T
hese
dat
a re
pres
ent
stud
ents
in t
he 4
-yea
r an
d 5-
year
gra
duat
ion
rate
s, i.
e. s
tude
nts
who
ent
ered
9th
gra
de in
201
1 an
d 20
12.
Dis
tric
ts a
nd s
choo
ls h
ave
long
-ter
m im
pact
s on
stu
dent
out
com
es. T
he P
repa
red
for
Succ
ess
com
pone
nt p
rovi
des
info
rmat
ion
on h
ow s
choo
ls p
repa
re s
tude
nts
for
diff
eren
tpa
thw
ays
of c
olle
ge a
nd c
aree
r su
cces
s. I
t al
so p
rovi
des
insi
ghts
on
how
tho
se s
tude
nts
do o
nce
they
leav
e hi
gh s
choo
l. W
hat
happ
ens
beyo
nd t
he d
iplo
ma
is a
n im
port
ant
indi
cato
r of
how
wel
l sch
ools
are
pre
parin
g st
uden
ts.
The
Uni
vers
ity S
yste
m o
f O
hio
prov
ides
dist
rict
repo
rts
on e
nrol
lmen
t an
d re
med
iatio
n of
high
sch
ool g
radu
ates
att
endi
ng in
-sta
te, p
ublic
col
lege
s an
d un
iver
sitie
s.
Wha
t Pe
rcen
tage
of
the
2013
Gra
duat
ing
Clas
s En
tere
d Co
llege
with
in T
wo
Year
s?N
C
Wha
t Pe
rcen
tage
of
the
2009
Gra
duat
ing
Clas
s G
radu
ated
fro
m C
olle
ge w
ithin
Six
Year
s of
Lea
ving
Hig
h Sc
hool
?N
C
Out
com
es a
fter
Hig
h Sc
hool
Gra
duat
ion
This
gra
ph is
not
dis
play
edbe
caus
e th
e re
sult
is N
otC
alcu
late
d.
This
gra
ph is
not
dis
play
edbe
caus
e th
e re
sult
is N
otC
alcu
late
d.

IRN
: 0
0062
3Pa
ge 1
8 of
25
Prin
ted
on S
epte
mbe
r 28
, 201
6
2015
- 2
016
Rep
ort
Car
d fo
r Su
mm
it A
cade
my-
You
ngst
own
Pri
ncip
al:
Add
ress
:M
icha
el J
. Maj
zun
144
N S
chen
ley
Ave
Youn
gsto
wn
OH
44
509-
2041
Dire
ctor
y in
form
atio
n cu
rren
t as
of
the
2015
-201
6 R
epor
t C
ard
publ
icat
ion
date
.
Pho
ne:
(330
) 25
9-04
21
Youn
gsto
wn
City
CTP
DC
aree
r Te
chni
cal
Pla
nnin
g D
istr
ict:
You
r Sc
hool
's S
tude
nts
Ave
rage
Dai
lyEn
rollm
ent:
208
Enro
llmen
t by
Sub
grou
p
Am
. Ind
ian
/ A
lask
an N
ativ
e
Asi
an o
r P
acif
ic I
slan
der
Bla
ck, N
on-H
ispa
nic
His
pani
c
Mul
tira
cial
Whi
te, N
on-H
ispa
nic
Stud
ents
wit
h D
isab
iliti
es
Econ
omic
ally
Dis
adva
ntag
ed
Lim
ited
Eng
lish
Pro
fici
ency
Mig
rant
Enro
llmen
t #
Enro
llmen
t %
NC
NC
43.7
%91
4.9%
10
9.9%
21
41.5
%86
83.7
%17
4
86.6
%18
0
NC
NC
NC
= N
ot C
alcu
late
d be
caus
e th
ere
are
few
er t
han
10 in
the
gro
up
Num
ber
ofLi
mit
ed E
nglis
hP
rofi
cien
cySt
uden
tsEx
clud
ed f
rom
Acc
ount
abili
tyC
alcu
lati
ons:
--0%20%
40%
60%
80%
100%
43.7
%
4.9%
9.9%
41.5
%
83.7
%86
.6%
Amer
ican
Ind
ian
orAl
aska
...As
ian
or P
acifi
c Is
land
erBl
ack,
Non
-His
pani
c
His
pani
cM
ultir
acia
lW
hite
, Non
-His
pani
c
Stud
ents
with
Dis
abili
ties
Econ
omic
Dis
adva
ntag
eLi
mite
d En
glis
hPr
ofic
ienc
y
Mig
rant
Stat
e an
d fe
dera
l law
req
uire
an
annu
al a
sses
smen
t of
Lim
ited
Engl
ish
Prof
icie
nt (
LEP)
stu
dent
s to
mea
sure
thei
r En
glis
h la
ngua
ge p
rofic
ienc
y. T
he O
hio
Eng
lish
Lang
uage
Pro
ficie
ncy
Asse
ssm
ent
(OEL
PA)
is t
heas
sess
men
t us
ed in
Ohi
o to
gau
ge L
EP s
tude
nts'
gro
wth
in le
arni
ng E
nglis
h.
For
info
rmat
ion
abou
t yo
urdi
stric
t's O
ELPA
res
ults
, see
the
Dep
artm
ent
of E
duca
tion'
s w
eb s
ite a
t ht
tp:/
/edu
catio
n.oh
io.g
ov.

IRN
: 0
0062
3Pa
ge 1
9 of
25
Prin
ted
on S
epte
mbe
r 28
, 201
6
2015
- 2
016
Rep
ort
Car
d fo
r Su
mm
it A
cade
my-
You
ngst
own Att
enda
nce
Rat
e
0.0%
20.0
%
40.0
%
60.0
%
80.0
%
100.
0%91
.5%
92.2
%92.8
% 91.6
%90.3
% 91.6
%91.1
%91
.5%91
.4%
All S
tude
nts
Amer
ican
Ind
ian
orAl
aska
...As
ian
or P
acifi
c Is
land
er
Blac
k, N
on-H
ispa
nic
His
pani
cM
ultir
acia
l
Whi
te, N
on-H
ispa
nic
Stud
ents
with
Dis
abili
ties
Econ
omic
Dis
adva
ntag
e
Lim
ited
Engl
ish
Prof
icie
ncy
Mig
rant
Mal
e
Fem
ale
Atte
ndan
ce R
ate
is n
ot s
how
n if
enro
llmen
t is
less
tha
n 10
.
Chr
onic
Abs
ente
eism
Rat
e:
37.6
%
NC
= N
ot C
alcu
late
d be
caus
e th
ere
are
few
er t
han
10 in
the
gro
up
Fem
ale
Mal
e
Mig
rant
Lim
ited
Eng
lish
Pro
fici
ency
Econ
omic
Dis
adva
ntag
e
Stud
ents
wit
h D
isab
iliti
es
Whi
te, N
on-H
ispa
nic
Mul
tira
cial
His
pani
c
Bla
ck, N
on-H
ispa
nic
Asi
an o
r P
acif
ic I
slan
der
Am
. Ind
ian
/ A
lask
an N
ativ
e
All
Stud
ents
91.5
%
NC
NC
92.2
%
92.8
%
91.6
%
90.3
%
91.6
%
91.1
%
NC
NC
91.5
%
91.4
%

IRN
: 0
0062
3Pa
ge 2
0 of
25
Prin
ted
on S
epte
mbe
r 28
, 201
6
2015
- 2
016
Rep
ort
Car
d fo
r Su
mm
it A
cade
my-
You
ngst
own
All
Stud
ents
Am
. Ind
ian
/ A
lask
an N
ativ
e
Asi
an o
r P
acif
ic I
slan
der
Bla
ck, N
on-H
ispa
nic
His
pani
c
Mul
tira
cial
Whi
te, N
on-H
ispa
nic
Stud
ents
wit
h D
isab
iliti
es
Econ
omic
ally
Dis
adva
ntag
ed
Lim
ited
Eng
lish
Pro
fici
ency
Mig
rant
NC
= N
ot C
alcu
late
d be
caus
e th
ere
are
few
er t
han
10 in
the
gro
up
Stud
ent
Mob
ility
%
0.0% NC
NC
0.0%
0.0%
0.0%
0.0%
0.0%
0.0% NC
NC
Mob
ility
Rat
es b
y Su
bgro
up
-600
%
-400
%
-200
%0%
200%
400%
600%
0.0%
0.0%
0.0%
0.0%
0.0%
0.0%
0.0%
All S
tude
nts
Amer
ican
Ind
ian
orAl
aska
...As
ian
or P
acifi
c Is
land
er
Blac
k, N
on-H
ispa
nic
Econ
omic
Dis
adva
ntag
eH
ispa
nic
Lim
ited
Engl
ish
Prof
icie
ncy
Mig
rant
Mul
tirac
ial
Stud
ents
with
Dis
abili
ties
Whi
te, N
on-H
ispa
nic
A m
obili
ty r
ate
char
t ca
nnot
be
disp
laye
d fo
r th
is s
choo
l bec
ause
eith
er t
here
are
not
eno
ugh
stud
ents
to
eval
uate
in a
nysu
bgro
up o
r al
l cal
cula
ted
resu
ltsar
e 0.
0%.

IRN
: 0
0062
3Pa
ge 2
1 of
25
Prin
ted
on S
epte
mbe
r 28
, 201
6
2015
- 2
016
Rep
ort
Car
d fo
r Su
mm
it A
cade
my-
You
ngst
own
You
r Sc
hool
's T
each
ers
Per
cent
age
of t
each
ers
wit
h at
leas
t a
Bac
helo
r's
Deg
ree
Per
cent
age
of t
each
ers
wit
h at
leas
t a
Mas
ter'
s D
egre
eP
erce
ntag
e of
cor
e ac
adem
ic s
ubje
ct a
nd e
lem
enta
rycl
asse
s no
t ta
ught
by
Hig
hly
Qua
lifie
d Te
ache
rs
Per
cent
age
of c
ore
acad
emic
sub
ject
and
ele
men
tary
clas
ses
taug
ht b
y pr
oper
ly c
erti
fied
tea
cher
sP
erce
ntag
e of
cor
e ac
adem
ic s
ubje
ct e
lem
enta
ry a
ndse
cond
ary
clas
ses
taug
ht b
y te
ache
rs w
ith
tem
pora
ry,
cond
itio
nal o
r lo
ng-t
erm
sub
stit
ute
cert
ific
atio
n/lic
ensu
re
You
r Sc
hool
You
r D
istr
ict
29.6
35.2
-- -- -- -- --
A di
stric
t's h
igh-
pove
rty
scho
ols
are
thos
e ra
nked
in t
he t
op q
uart
ile b
ased
on
the
perc
enta
ge o
f ec
onom
ical
ly d
isad
vant
aged
stu
dent
s. L
ow-p
over
ty s
choo
ls a
re t
hose
ran
ked
in t
he b
otto
m q
uart
ile b
ased
on t
he p
erce
ntag
e of
eco
nom
ical
ly d
isad
vant
aged
stu
dent
s. A
dis
tric
t m
ay h
ave
build
ings
in b
oth
quar
tiles
, in
just
one
qua
rtile
or
in n
eith
er q
uart
ile.
NC
= N
ot C
alcu
late
d be
caus
e th
ere
are
few
er t
han
10 in
the
gro
up
You
r Sc
hool
's P
over
ty S
tatu
s: H
igh
100.
0
64.8 0
Lead
or
Seni
or T
each
ers:
0.0
Num
ber
of T
each
ers
by P
rogr
am A
rea
0.0
Spec
ial E
duca
tion
Tea
cher
s10
.3
Gen
eral
Edu
cati
on T
each
ers
17.0
Gif
ted
Inte
rven
tion
Spe
cial
ists
0.0
Car
eer-
Tech
nica
l Tea
cher
s0.
0
Fine
Art
s Te
ache
rs0.
5
Mus
ic T
each
ers
1.0
Phy
sica
l Edu
cati
on T
each
ers
1.0
ELL
Spec
ialis
ts0.
0
Teac
her
Aid
es12
.57.
0
#
Stat
e A
vgpe
r 10
00St
uden
ts
46.4
2.3
10.6
0.6
3.0
2.5
2.9
0.3

IRN
: 0
0062
3Pa
ge 2
2 of
25
Prin
ted
on S
epte
mbe
r 28
, 201
6
2015
- 2
016
Rep
ort
Car
d fo
r Su
mm
it A
cade
my-
You
ngst
own
Fine
Art
s C
ours
es O
ffer
edN
o da
ta re
turn
ed fo
r thi
s vi
ew. T
his
mig
ht b
e be
caus
e th
e ap
plie
d fil
ter
excl
udes
all
data
.
No
Fine
Art
sco
urse
s of
fere
d by
this
sch
ool.
Wel
lnes
s an
d P
hysi
cal E
duca
tion
The
exte
nt t
o w
hich
stu
dent
s ar
e su
cces
sful
inm
eeti
ng t
he b
ench
mar
ks c
onta
ined
in O
hio'
sph
ysic
al e
duca
tion
sta
ndar
ds
Mod
erat
e Su
cces
s15.4
%50
.0%
30.8
%
3.8%
Acco
mpl
ishe
dSk
illed
Dev
elop
ing
Inef
fect
ive
Not
Com
plet
e
Teac
her
Eval
uati
ons

IRN
: 0
0062
3Pa
ge 2
3 of
25
Prin
ted
on S
epte
mbe
r 28
, 201
6
2015
- 2
016
Rep
ort
Car
d fo
r Su
mm
it A
cade
my-
You
ngst
own
Fina
ncia
l Dat
a
Thes
e m
easu
res
answ
er s
ever
al q
uest
ions
abo
ut s
pend
ing
and
perf
orm
ance
. How
muc
h is
spe
nt o
n Cl
assr
oom
inst
ruct
ion?
How
muc
h, o
n av
erag
e, is
spe
nt o
n ea
ch s
tude
nt?
Wha
t is
the
sou
rce
of t
he r
even
ue?
How
do
thes
em
easu
res
com
pare
to
othe
r di
stric
ts a
nd s
choo
ls?
Com
pari
son
Gro
up:
Com
mun
ity S
choo
ls w
ith E
nrol
lmen
t be
twee
n 15
0 an
d 49
9
Cla
ssro
om S
pend
ing
Dat
a
57.2
%42.8
%
Wha
t pe
rcen
t of
fun
ds a
resp
ent
on c
lass
room
inst
ruct
ion?
90.7
%
How
doe
s th
is s
choo
l ran
kin
com
pari
son
to o
ther
scho
ols
of s
imila
r si
ze?
16 o
ut o
f 1
75
Per
cent
age
Spen
t fo
r N
on-
Cla
ssro
om I
nstr
ucti
on9.
3%
Ran
k in
com
pari
son
grou
pfo
r hi
ghes
t %
spe
nt
159
out
of 1
75
Com
pari
son
Gro
upSt
ate
90.7
%
9.3%
67.1
%
32.9
%
Scho
ol
020406080
100
Clas
sroo
m I
nstr
uctio
nN
on-C
lass
room
Ins
truc
tion
A ra
nk o
f 1
indi
cate
s th
e hi
ghes
t pe
rcen
t sp
ent
on c
lass
room
inst
ruct
ion.
Ran
king
s su
bjec
t to
cha
nge
due
to d
ata
appe
als.
Spen
ding
per
Pup
il D
ata
Scho
olSt
ate
Ope
ratin
g Sp
endi
ng p
er P
upil
$6,7
79$8
,711
Clas
sroo
m I
nstr
uctio
n$6
,152
$5,8
45
Non
-Cla
ssro
om S
pend
ing
$2,8
66$6
27
$0$4
,000
$8,0
00$1
2,00
0
$6,1
52
$5,8
45
$627
$2,8
66
Scho
ol
Stat
e
Sum
mit
Acad
emy-
Youn
gsto
wn
IS N
OT
amon
g th
e 20
% o
f tr
aditi
onal
com
mun
ity s
choo
lsw
ith t
he lo
wes
t op
erat
ing
expe
nditu
res
per
pupi
l.
Sum
mit
Acad
emy-
Youn
gsto
wn
IS N
OT
amon
g th
e 20
% o
f tr
aditi
onal
com
mun
ity s
choo
lsw
ith t
he h
ighe
st a
cade
mic
per
form
ance
inde
x sc
ores
.

IRN
: 0
0062
3Pa
ge 2
4 of
25
Prin
ted
on S
epte
mbe
r 28
, 201
6
2015
- 2
016
Rep
ort
Car
d fo
r Su
mm
it A
cade
my-
You
ngst
own
Spen
ding
and
Per
form
ance
This
mea
sure
ans
wer
s th
e qu
estio
n –
wha
t is
the
rel
atio
nshi
p of
ave
rage
spe
ndin
g pe
r st
uden
t to
perf
orm
ance
, and
how
doe
s th
at c
ompa
re t
o si
mila
r di
stric
ts a
nd s
choo
ls?
Com
pari
son
Gro
up
60.0
70.0
80.0
90.0
100.
0
110.
0
120.
0 $0$4
,000
$8,0
00$1
2,00
0$1
6,00
0$2
0,00
0$2
4,00
0$2
8,00
0$3
2,00
0
PerformanceIndex
Spen
ding
per
Pup
il
All
Com
mun
ity
& S
TEM
Sch
ools
60.0
70.0
80.0
90.0
100.
0
110.
0
120.
0 $0$4
,000
$8,0
00$1
2,00
0$1
6,00
0$2
0,00
0$2
4,00
0$2
8,00
0$3
2,00
0
PerformanceIndex
Spen
ding
per
Pup
ilTh
e qu
adra
nt li
nes
on t
hese
gra
phs
repr
esen
t th
e st
atew
ide
aver
age
perf
orm
ance
inde
x sc
ore
and
the
stat
ewid
e av
erag
e sp
endi
ng p
er p
upil
for
all C
omm
unity
and
STE
M s
choo
ls.

IRN
: 0
0062
3Pa
ge 2
5 of
25
Prin
ted
on S
epte
mbe
r 28
, 201
6
2015
- 2
016
Rep
ort
Car
d fo
r Su
mm
it A
cade
my-
You
ngst
own
Sour
ce o
f R
even
ue
Sour
ce o
f Fu
nds
Scho
olSt
ate
Tota
l
Loca
l
Stat
e
Fede
ral
0.0%
84.0
%
15.9
%
39.6
%
45.8
%
7.6%
84.0
%
15.9
%
0.1%
Loca
lSt
ate
Fede
ral
Oth
er N
on-T
ax
Scho
ol
39.6
%
7.6%
45.8
%
7.1%
Loca
lFe
dera
lSt
ate
Oth
er N
on-T
ax
Stat
e
Oth
er N
on-T
ax
Tota
l
0.1%
100.
0%
7.1%
100.
0%
$0
$3,2
56,7
82
$616
,118
$3,7
38
$3,8
76,6
38
$8,6
36,0
50,0
30
$1,5
46,6
39,7
12
$1,6
56,4
88,6
20
$9,9
88,1
18,7
91
$21,
827,
297,
153

Sponsor’s Legal Compliance Assessment Ohio Revised Code (ORC) 3314.03(D)(2) specifies that the sponsor of the school must “monitor and evaluate the academic and fiscal performance and the organization and operation of the community school on at least an annual basis.” In addition, under ORC 3314.03(D)(3), the sponsor must “report on an annual basis the results of the evaluation conducted under division (D)(2) of this section to the department of education and to the parents of students enrolled in the community school.” The Educational Service Center of Lake Erie West (ESCLEW) served as the sponsor during the 2015-2016 school year, monitoring the performance of Summit Academy - Youngstown. ESCLEW determined that the school was overall compliant in the areas of academic and fiscal performance and in the areas of organization and operation of the school.