Embed Size (px)
DESCRIPTION
mohali
Citation preview
1
SIX MONTHS INDUSTRIAL TRAINING REPORT
At
MAHINDRA AND MAHINDRA- SWARAJ DIVISION, MOHALI, PUNJAB, INDIA.
REPORT
SUBMITTED IN PARTIAL FULFILLMENT OF THE REQUIREMENT FOR
THE AWARD OF THE DEGREE OF
BACHELOR OF TECHNOLOGY
In
Mechanical Engineering
SUBMITTED BY
HARMANDEEP SINGH
BRANCH- MECHANICAL ENGG.
UNIV. ROLL NO. - 7021112663
Submitted to:
Mechanical Engineering Department
BHAI GURDAS INSTITUTE OF ENGINEERING & TECHNOLOGY
SANGRUR, INDIA

2
CONTENTS
ACKNOWLEDGEMENT………………………………………………………………………...3
ABSTRACT…………………………………………………………………………………….…4
1.1 INTRODUCTION………………………….…………………………………………...........5
2.1 INDUSTRY STRUCTURE………..……………………………………………………...….7
3.1 COMPANY‘s OUTLOOK……………………………………………………………...……7
4.1 PTL‘s BIRTH……………………………………………………………………………..…..8
5.1 PRODUCTS MANUFACTURED……………………………………………………….…10
6.1 UNITS OF SWARAJ GROUP………………………..…………………………………….12
7.1 MANUFACTURING SYSTEM…………………………………………………….………15
8.1 LIGHT MACHINE SHOP (LMS)………………………………………………….…….…16
9.1 HEAVY MACHINE SHOP (HMS)...………………………………………………...……..18
10.1 ASSEMBLY SHOP ………………………………………………………………………..19
11.1 HEAT TREATMENT………………………………………………………………………23
12.1 PAINT SHOP………………………………………………………………..……………..24
13.1 MAINTENANCE DEPARTMENT…………………………………..……………………26
14.1 ABOUT CNC……………………………………………………...……………………….28
15.1 DESCRIPTION OF CONTROL PANEL(CNC)……………………………………..……31
16.1 STANDARD ROOM…………………….......………………………………………...…..34
17.1 STATISTICAL PROCESS CONTROL……………………………………………………38
18.1 PROCEDURE FOR DOING SPC………………………………………………………….39
19.1 STEPS INVOLVED IN USING SPC………………………………………………………47
3
20.1 PRIORITIZING…………………………………………………………………………….49
21.1 DATA GATHERING & INITIAL CHARTING…………………………………………...53
22.1 CONTROL CHARTS……………………………………………………………………....55
23.1 CONCLUSION……………………………………………………………………………..71
24.1 APPENDIX: STATISTICAL QUALITY CONTROL STANDARDS…………………….72
25.1 BIBLIOGRAPHY…………………………………………………………………………..74

4
ACKNOWLEDGEMENT
The authors are highly grateful to the Dr.Tanuja Shrivastava, Director, Bhai Gurdas Institute of
Engineering & Technology, Sangrur, for providing this opportunity to carry out the six month
industrial training at MAHINDRA AND MAHINDRA- SWARAJ DIVISION, MOHALI,
PUNJAB, INDIA.
The constant guidance and encouragement received from Er. Rajwinder Singh Incharge
T&P, BGIET, Sangrur has been of great help in carrying out the project work and is
acknowledged with reverential thanks. It was a matter of immense pride for me to take my
industrial training at MAHINDRA AND MAHINDRA- SWARAJ DIVISION, MOHALI,
PUNJAB, INDIA.
During my training I have gained a lot. I have been considered as an associate of this plant. I
would like to thank all the employees of this plant for their kind and invaluable support. I am
highly obliged to, Mr. Kamaljeet Grover and all the project engineers who guided me through
my training. It is along with them, towards the skill of using our theoretical knowledge for
practical purpose. It is with deepest sense gratitude that I wish acknowledge in valuable guidance
rendered to me during training time.
I would like to thank all the supervisors and technicians who helped me in completing the
projects given to me. I also give my sincere thanks to Mr. Anil Wadhawan and Mr. Neelkanth
who always helps me in solving my problems and who arranged such a nice training schedule
for me and then took special pains to keep me well informed and guided throughout the training
period.
Harmandeep Singh

5
ABSTRACT
This training report reprints the opportunity that I got to be in professional environment for the
Six Month Training program in the eighth semester of fourth year B.Tech in Mechanical
Engineering. This effort is made that this report gives a clear picture of the technical and
commercial aspects of power plants which may be practical guide for energy management
engineering.
Experience, no doubt, is a great teacher and a valuable asset. However the supreme
importance of sound working knowledge of principles should not be over locked with it mere
experience cannot go a long way. I have endeavored in this training report to explain basic
principles can be applied in practical zone.

6
1.1 INDIAN TRACTOR INDUSTRY:
Introduction –
India being a predominantly agricultural country, where agriculture is the life and blood of the
economy, has been a traditional manufacturer of different types of farm machinery and
implements. However, the use of advanced agricultural techniques in India started only in early
sixties. Modernization and tractor-ization in Indian agriculture is only post independence
phenomenon. One of the achievements of green revolution has been that the farmers increasingly
realized the advantage of tractor-ization for obtaining the timeliness of operations. This would
happen only because of awareness of new farm technology among the farmers, rise in the level
of their income and education. The biological source of energy especially bullocks, could not
cope with the requirements of the changed situation. Therefore, introduction of tractors got
accelerated in several agriculturally advanced states of country like Punjab, Haryana,
Maharashtra, etc. Tractors were introduced to Indian agriculture in early twenties. Sh. Joginder
Singh was the first farmer to use a tractor, called a steam plough then, on the 12000 acres estate
he had inherited in the remote Kheri district of Uttar Pradesh. The demand of tractors rose
sharply in last two decades. However, the rate of adaptation of tractors is different in different
parts of the country. Punjab occupies number one rank in this regard. Punjab possesses only
1.5% of the geographical area of the country; the density of 85 tractors per hectare in Punjab is
the highest as compared to national average of 10.5 tractors per hectare.
India is primarily an agrarian nation,
with more than 50 per cent of our GDP being contributed directly or indirectly by agriculture. No
wonder, India is considered the largest tractor market in the world. If that sounds great, let us
face hard facts. In terms of total tractors in use in the country, we are ranked a distant eighth. In
terms of penetration, India has a tractor density of 10.5 tractors per thousand hectares of Gross
Cropped Area (GCA) as compared to the international average of close to 30 tractors per
thousand GCA.
Figuratively speaking, India‘s large gross cropped area (GCA) is next only to the big two —
USA and Russia. That and the highly fragmented land holdings in India have helped our country
to become the largest tractor market in the world. Thus the Indian tractor market, per Se, has to
be viewed only after considering its position in the world.

7
Despite a phenomenal increase in tractor population in the country, the tractor density is very
low at about 10.5 tractors per thousand hectares of GCA in comparison to the international
average of about 28 tractors. Also, the small size of land holding in India, have led to low
average power of tractors at 35 Horse Power (HP), which is far lower than the global average of
above 80 HP.
The Beginning of Indian Tractor Industry:
The decade of 60‘s India saw green revolution resulting in increase in both production and
productivity. With the parallel emphasis on industrialization, the birth of Indian Tractor Industry
took place in 1959-60 when the imports were restricted and 5 tractor manufacturing units set up
in the private sector, all with foreign collaboration. Date of commencement of commercial
production and collaboration are given in following table. Total indigenous production of
tractors by 1965 was just 6000.
With the successful introduction and acceptance of the high yielding seeds, however, there was a
sudden upsurge in the demand for tractors after 1967 and the demand started multiplying at an
annual rate of approximately 50% (1967:18,000; 1970: 33,000). A natural consequence of this
sharp upsurge and consequent shortage was a heavy premium on the price of tractors.
Recognizing the situation, import of tractors into the country was liberalized and over and above
the domestic production of 20,000. In 1970, 13,000 tractors were imported.
The Government‘s decision to freely invite new entrepreneurs to manufacture tractor in 1968 and
sudden upsurge in demand, with the green revolution, led to a scramble of new entrepreneurs for
new collaborators. 6 units eventually, established the actual manufacturing facilities.
With the entry of new units in 1970 and increasing Government pressure towards indigenization
picked up substantially after 1970 and by 1978 almost all the tractors manufactured were nearly
indigenous. A fillip to indigenization was also given by the overall industrialization of the
country, when a large number of ancillary manufactures had also established them and were in a
position to supply a wide variety of components to the tractor industry. The sharp liberalization
of imports in 1970 had given the nascent Indian Tractor Industry a substantial setback in 1970-
73, when low cost import particularly from East European countries had become far more
attractive. In India, the variety in land conditions makes it necessary to diversify the availability
8
of tractors. Today tractors with HP ranging from 12 to 75 are available in India. At present 44
models tractors are available in India, listed category-wise as follows:
Range of Tractors available in India -
2.1 Industry Structure:
The tractor industry is segmented on the power / size of the tractor engine, expressed in terms of
horse power (HP). The HP-wise composition of tractor industry sales (as shown in the table 6
and the graph showing Indian HP Range Trends) reveals that 31-40 HP tractors still constitute
the largest segment with 57% of the total tractor sales in Financial Year (FY) 2002 - 2003. It can
also be seen that demand for less than the 30 HP segments, which used to be 35% in FY 1990—
1991 has been pushed to the back seat by the 31 —40 HP segment.
This shows an interesting shift in tractor demand from lower HP to higher HP tractors in recent
times. The shift could be categorized as two — fold. One, the drastic shift from less than 30 HP
to 31 — 40 HP levels and two, the meager shift from 41 — 50 HP to 50 HP levels. The general
change in the farmers‘ preference for higher HP tractors is significant in more ways than one.
Firstly, it seems to belie the notion that as the average farm sizes dwindle, it would render the use
of tractor uneconomical. Then, there is the running costs angle to it as well. While the higher HP
tractors are more costly in terms of maintenance and running costs, still the fact of the matter is
that the sale of the higher HP tractors are increasing.
3.1 Company’s Outlook:
It has been established that there is a close relationship between the growth rate in food grain
production and intensity of tractor-ization. Increasing benefits of mechanization have resulted in
an increase in the tractor demand and thereby tractor population over the years. The density of
tractors varies from state to state with Punjab taking the lead at 65 tractors per 1000 hectares of
irrigated land. With the total land currently under irrigation being a small fraction of the total
irrigation potential of 1134 lac hectares, a steady demand for tractors in the near future can be
anticipated.

9
4.1 P.T.L.’s Birth:
Keeping in mind Punjab‘s agrarian economy it was decided by the Punjab government to
encourage the growth of industries, which complement Punjab‘s agriculture growth. This task
was entrusted to Punjab State Industrial Development Corporation (PSIDC), which has played a
major role in bringing Punjab to the threshold of the industrial revolution. With the dual
objective of industrial and agriculture growth, PUNJAB TRACTORS LIMITED was established
on 27 June 1970.
Introduction to the Company -
Punjab Tractors Limited, a public limited company, is India‘s first large- scale project based
company with a totally indigenous design, know-how and technology. Punjab State Industrial
Development Corporation (PSIDC), which was a major player, prompted it; the government of
India and financial institutes like Punjab Financial Corporation (PFC) provided significant
support. The public subscribed the remainder. The Shareholding Pattern chart displays the
shareholders in Punjab Tractors Limited and their share proportions.
The factory is located at the Sahibzada Ajit Singh Nagar, which is an important township of
Punjab. A Board of Directors manages the company with the Secretary, industrial department,
Punjab being the ex-officio chairman. The Vice —Chairman and Managing Directors manage
the day-to- day affairs.
10
Growth of PTL:
Punjab Tractors Limited started with an annual capacity of 5000 tractors and with a capital of Rs.
3.7 crores. It went into commercial production in the year 1974; its first production of 26.6 BHP
tractors was given the name SWARAJ— 720. Ever since then P.T.L. has not looked back. In the
first twenty year of its existence its capacity has been increased to 24000 per annum, which is a
considerable achievement by any standards. PTL is considered as a highly reputated and
impressive company in India. It manufactures many products and is helping in to develop India
and improving its farming techniques.
In all, SWARAJ provides with a host of varied products, which includes:
• TRACTORS
• HARVESTING COMBINE
• FORK LIFTERS
• AGRICULTURE IMPLEMENTS
• AUTOMOTIVE CASTINGS
• LIGHT COMMERCIAL VEHICLES
• SHELTER
• ENGINES
• CASTINGS
• ROUGH TERRAIN
11
Origin of the word “SWARAJ” :
The word SWARAJ‖, in Hindi, means ―freedom from bondage‖. Since, P.T.L. was the first
largest tractor project in India, moreover fully based upon Indian technology. So ―SWARAJ‖
was appropriately chosen as its brand name. SWARAJ GROUP sells its product under this brand
name. Position of SWARAJ products in market With more than 2 Lac tractors and harvester
combines operating in Indian farms, SWARAJ are now a well-established brand name in
country. SWARAJ is also an internationally recognized name in the developing world. The
products of SWARAJ are not only restricted to Indian market but, they had entered in
international market. SAWRAJ tractors find an important place in developing countries like
Ghana, Tanzania, Zambia, Kenya, Sudan, Uganda, Indonesia, Malaysia, etc. They are also
sending their Harvesting Combines to South Korea having first AC cabin Harvesting Combine in
India. Earlier, they had also transported the machined rims to Japan, a project worth millions of
dollars. SALES SCENARIO OF VARIOUS TRACTOR COMPANIES Nowadays, the markets
are flooded with tractors of various companies. Most of the companies provide a range (in terms
of power) of tractors to capture the market.
5.1 PRODUCTS MANUFACTURED:
Following is the list of the components manufactured by them:
• TRACTOR
• HARVESTOR COMBINES
• FORK LIFTRES
• LIGHT COMMERCIAL VEHICLES
• SHELTERS
• ENGINES
• CASTINGS
12
1. TRACTOR:
Following is the list of models of tractors that have been
manufactured by this company:
1.SWARAJ 722: a 25 bhp tractor introduced in 2003
2. SWARAJ 724: a 26.5 bhp tractor introduced in 1974
3. SWARAJ 735: a 39 bhp tractor introduced in 1975
4. SWARAJ 720: a 19.5 bhp tractor introduced in 1978
5. SWARAJ 834: a 55 bhp tractor introduced in 2004
2. HARVESTER COMBINE:
It was India‘s first indigenous built Harvester Combine called H 8100. Its engine is supplied by
ASHOK LEYLAND LIMITED. It is a six-cylinder engine developing a power of 105 bhp. It
was basically designed to harvest wheat and paddy.
3. FORK LIFT TRUCKS:
These are also called fork lifters. They are used for loading and unloading of heavy equipment
and various articles in an industry. It has very short turning radius so that it can move easily in
limited spaces. The heart of the FD is a 48 bhp engine supplied by KIRLOSKAR OILS INDIA
LIMITED. The fork lifter is manufactured by SWARAJ in collaboration with a Japanese firm
KOMATSU. These can be either battery operated or diesel operated.
Following is the list of fork lifters manufactured
a. FD—15 FB—15
b. FD—20 FB—20
c. FD—25 FB—25
d. FD—30 FB—30
4.LIGHT COMMERCIAL VEHICLES:
SWARAJ MAZDA manufactures light vehicles, which are, used as loading vehicles, mini buses,
and special order vans.
13
5. SHELTER:
SCD manufacturers shelters on order basis, which are made for defence purposes. Some work of
the shelter is done in PUNWIRE also.
6. ENGINES:
The engines are required for various models of tractors are supplied by SWARAJ ENGINE
LIMITED.
7. CASTINGS:
Castings of differential, gearbox, rear cover; trumpet SWARAJ FOUNDARY DIVISION
produces housing required for the production of tractors. Also, castings of various pulleys,
reduction gearbox and gearbox of Harvester Combine are also supplied by Foundry Division.
6.1 Units of SWARAJ Group –
Originally, SWARAJ had set up its plant for the production of tractors. But with the passage of
time, to fulfill the requirements of Indian market, it diversified into other fields, with the
collaboration of foreign companies like Komatsu, Mazda etc. it opened its new Division near
Chandigarh. Following are the five divisions of SWARAJ GROUP:
• SWARAJ COMBINE DIVISION
• SWARAJ FOUNDARY DIVISION
• SWARAJ ENGINE DIVISION
• SWARAJ TRACTOR DIVISION
•SWARAJ COMBINE DIVISION
It was set up in 1980 in village Chappercheri, on Landran road near Kharar in Distt. Ropar. It
was started with a capital layout of Rs. 2.6 crores to manufacture self-propelled harvester
combines modeled SWARAJ-8100. It was India‘s first indigenously produced self-propelled
harvester combine. In 1985, indigenous diesel fork FD-20 and FD-25 with a lifting capacity of 2
tonnes, 2.5 tonnes respectively were brought out. Later in the year, company also entered in
collaboration with KOMATSU FORKLIFT CO. of Japan for manufacturing both diesel and

14
electric fork lifters up to 10 tonnes capacity. In year 1990, the production of tractor was also
started here. Presently this division is manufacturing around 75 tractors (FE-855, FE-939).
This year target has been set to 30000 tractors annually. Additionally, SCD is manufacturing
some components for SWARAJ MAZDA DIVISION. SWARAJ COMBINE DIVISION (SOD)
is also producing FIBRE RE ENFORCED PLASTIC (FRP) shelters for Indian army. Shelters are
used for various purposes like housing electronic data, handling systems, refrigerated vans,
mobile radio stations and other similar defense applications.
SWARAJ FOUNDARY DIVISION:
This plant is located in village Majri near Kurali in Ropar Distt. It is situated at a distance of
around 22 km from Chandigarh. This plant was set up in the year 1980 with an initial investment
of Rs. 15 crores. This division supplies the casting to all other units of SWARAJ GROUP. It
includes supply of input shafts, hub, gear main drive and many other components used in L.M.S.
In H.M.S. shop it supply gearbox, differential rear cover, trumpet housing. The current capacity
of this plant is 800 tonnes of gray iron casting per annum on single shift basis.
SWARAJ ENGINE DIVISION:
This plant is located in Mohali. It was setup in technical and financial collaboration with
KIRLOSKAR OIL ENGINE LIMITED. It was setup in the year 1987 for the manufacture of
diesel engines. This plant manufactures engines for SWARAJ TRACTORS. It also supplies
connecting rods to SWARAJ MAZDA DIVISION.
The installed capacity of this plant was 1500 engines per annum. Engine production in this
company has reached level of 15921, a volume growth of 27% as compared to previous year.
Total revenue of this plant has reached up to Rs.72.6 crores. It uses about 99.4% indigenous
components.
15
SWARAJ TRACTORS DIVISION (MOHALI ):
Introduction:
Swaraj Tractor Division is situated at phase-IV, S.A.S. Nagar, an important industrial town, 5
Km from Chandigarh, in Ropar District, in Punjab. It was set up on May 27, 1970 with the dual
objective of industrial and agriculture growth. It was the first SWARAJ DIVISION to be set up.
This was India‘s first large-scale project totally based upon indigenous design and technology of
India itself. It manufactures different models of tractors i.e., of different HPs. Presently around
90— 100 tractors are produced in a day in two shifts.
Rated capacity : 40100 tractors per year.
Employee strength: Around 3000
Annual turnover:Rs. 1300 crores
Hierarchy of the Organization –
The Board of Directors with the Secretary Industries, Department, Govt. of Punjab as its Ex-
officio Chairman, manages the company. The Vice-Chairman and the Managing Director
manage the day-to-day operations.
Level 1 : Chairman Ex-officio (Secretary Industries, Govt.of Punjab)
Level 2 : Working Director Vice-Chairman and Managing Director
Level 3 : Executive Directors
• Finance
• Human Resource and Development
• International Business Division
• Manufacturing
• Material Services
• Swaraj Automotive Limited
• Swaraj Motors Limited
• Senior Vice President (Marketing)
16
7.1 Manufacturing System:
STD operates through a series of departments, which can be broadly
classified into:
1. Production:
Light machine shop (LMS)
Heavy machine shop (HMS)
Assembly shop
Heat treatment shop
Paint shop
2. Product services:
• Tool room
• Tool control cell (TOO)
• Industrial engineering
• Research & Development
• Production planning & control (PPO)
• Material Management & control (Stores)
• Quality Engineering
• Maintenance
• Construction
3. Support Services:
• Management systems
• Finances
• Purchase
17
8.1 LIGHT MACHINE SHOP (LMS)
INDRODUCTION:
LMS is the largest section in the factory. All transmission components viz. shafts and gears used
in Tractors are manufactured here. It has more than 120 machines; Facilities of this shop include
Equipment for blank operation, boring, drilling etc. Except the bevel gear generator & gear
shaver, which have been imported from WIv1W & Churchill of West Germany respectively, all
other machines are from HMT Ltd. The rupees thirty one million plant and machinery of this
shop installed in an area of 33,000 sq. ft. and casting, forging and high standard of quality.
TYPES OF MACHINES:
Cylindrical grinder, internal grinder, copying lathe, gear hobber, Radial drilling machine, drum
turret lathe, turret lathe, Honing machine, Centre lathe, Capstan lathe, Capstan lathe, Vertical
pull broaching machine, Chuckmatic, Fay Auto, Centering & facing machine, Vertical Milling
machine, Horizontal Milling Machine. Deburring machine, D/E boring machine Gear Shaver
GTR machine, Bevel Gear Generator, Gear shaper, CNC machine, Power Hacksaw Special
purpose drilling machine, twin chucker, Centre Hole grinding machine.
Function of the department:
Gear manufacture and grinding, machining of bull gears, bevel gear cutting of all rounds on
power hacksaws, facing and centering, all type of grinding inner and outer gears, hobbing and
broaching machine. Gear shaving gear deburring machine, drilling of all gears reporting system,
number of workmen shifts operations.
Inter relations with other departments:
• Tool room : jigs, fixtures and cutting tools
• Maintenance: attending breakdowns and carrying out preventive maintenance of machine tools
etc.
• Industrial engineering: provision of process charts for machining operations.
• Assembly: ensuring proper fitment of components.
• Production planning and co-ordination: Micro loading of components on a daily basis.

18
• Quality control and inspection, storage and inspection R & D
• Heat treatment- shot blasting operations lab testing, inspection etc.
Different Manufacturing Operations In LMS:
Facing: It is the operations of finishing the ends of the work, to make the ends flat and smooth&
to make the piece of required length. Under Cutting: It is similar to grooving operation but is
performed inside a hole.
Chamfering: It is the operation of beveling the extreme end of the work piece. Chamfer is
provided for better look/to rough turning: in this operations max. Metal is removed &very little
oversize dimensions is left for further machining.
Finish Turning: Here min. metal is removed &very fine finish is obtained on the work surface.
Grooving: It is the operation of turning the groove or neck in order to terminate a thread or to
provide adequate clearance enable nut to pass freely on threaded work piece, to remove burs &to
protect the work piece from being damaged.
Knurling: It is a process of embossing a diamond shaped regular pattern on the surface of the
work piece using a special knurling tool.
Broaching: It is a method of metal removal by a tool that has successively higher cutting edges
in a fixed path. Each tooth removes a fixed amount of material.
Drilling: It is a process of making hole in an object by forcing a rotating tool called drill.
Boring: It is a process of enlarging a hole that has already been drilled.
19
Grinding: To grind means to ‗abrade‘ to wear away by friction or to ‗sharpen‘ .In grinding, the
material is removed by a means of a rotating abrasive wheel. It is generally used for sharpening
the cutting tool, for grinding threads, better surface finish etc.
Hobbing: It is the process of cutting teeth on gear &shafts & is performed by a rotating tool
called hob on the hobbing machine.
Shaping: The process of cutting gears on the shaper is known as shaping. The tool used in
shaping for teeth cutting is a multipoint cutting tool.
9.1 HEAVY MACHINE SHOP
INTRODUCTION:
All heavy castings of tractors are machined in this shop with the help of variety of special
machines (SPM). These machines are tailor made by HMT to suit component requirements.
About 20 SPM and 30 GPM are installed in a covered area of 47,000 sq. ft. at a cost of 20
million, 2600 tonnes of castings are machined every year on a two-shift basis. In addition to the
machining of castings for the tractor, some jobs are also performed for Swaraj Mazda Limited.
COMPONENTS MACHINED IN THE SHOP:
• Gearbox housing (Material—R-33, Casting, 180-230 BHN, 76-kg wt.)
• Differential Housing
• Rear Cover
• Trumpet Housing
FUNCTIONS OF THE DEPARTMENT:
Machining of heavy castings like differential housing, gear box housing, rear cover, trumpet
housing, steering housing of tractors, machining of tractors parts, machining of some
components for Mazda.
20
INTER-RELATION WITH OTHER DEPARTMENTS:
• Tool room - Requirement of jigs, fixtures and cutting tools.
• Maintenance - Attending breakdown and carrying out preventive maintenance of machine
tools.
• Industrial engineering - Provide process charts for machining operations.
• Assembly - Ensuring proper fitment of components, production planning and control, micro
loading of components on day-to-day basis.
• Quality control & inspection — Storage and inspection.
• R&D
• Paint shop
10.1 ASSEMBLY SHOP:
Function:
Assembly of all finished components and bought out components for Swaraj-
722, 724, 733, 735, 744, 834,855,844
Sections in Assembly:
1. Cage Assembly.
2. PTO Shaft Assembly.
3. BPS L/R Assembly.
4. Differential Assembly and Testing.
5. Trumpet Hsg. and Assembly.
6. Differential Hsg. and Trumpet Hsg. Assembly.
7. Gear Box Assembly. and testing.
8. Rear Cover Assembly and testing.
9. Steering Assembly.
10. Brake Hsg. Assembly.
11. Coupling Gear Box Assembly with Differential Hsg. Assembly.
12. Steering assembly. to be assembled with 11.
21
13. Brake Hsg. Assembly. to be assembled with 12.
14. Front Axle Beam Assembly.
15. King Pin Assembly.
16. Engine assembly.
17. Coupling Engine Assembly with 13.
18. Assembly. 13, 14 with 16.
19. Tie Rod assembly. with 17.
20. Assembly other main link items like Levelling Rod, Trailor Hook, Front
and Rear Frame, Battery Mtg. Frame, Stay Bars, Brake Pedal, Clutch Pedal
Assembly., Foot Board Assembly.
21. Greasing all points.
22. Invasion into painting chamber.
23. Mounting of front and rear tire.
24. Fender Assembly. with lights and other electrical fitments.
25. Radiator Assembly.
26. Dash Board Assembly and Seat assembly.
27. Fuel Tank Assembly.
28. Side panel, Bonnet, Front Shield, Rear Shield, Front Grill etc Assembly.
29. Air Cleaner and Exhaust Assembly.
30. Battery fitment.
31. Oil Filling, Battery filling etc.
32. Testing.
The Assembly Shop is the production shop where assembly and sub-assembly
I of all the parts take place. The final processed parts from the various parts of production shop
such as HMS, LMS and Heat Treatment reach the assembly Shop. The various parts reach the
assembly. shop only after being washed, cleansed and dried, which takes place when the
different parts are on their way to assembly shop. The above washing process takes place
automatically i.e. the machinist has to drop the final Part on the roller conveyor, and the parts
reach the assembly shop after being automatically washed and dried.
The assembly shop can be divided into various groups depending upon sub-
22
parts being assembled.
These groups are:
1. Differential assembly and sub-assembly.
2. Differential Cover assembly.
3. Gear Box assembly and sub-assembly
4. Steering Gear Box Assembly. + Gear Shifting Mechanism Assembly. + Brake assembly.
5. Assembly of various links, Foot Board and other accessories.
6. Assembly. of engine with Clutch mechanism.
7. Assembly. of 5 and 6 assemblies.
Differential Assembly:
Before the various differential parts such as BP shaft, differential cage etc. are assembled, the
various sub-assembly. of parts listed above are performed in the sub units. In the first unit, both
the BP shafts are fitted with various components such as circular clips, needle bearings etc. to be
able to be assembled to the differential Cage. This constitutes the assembly of Cross Bar,
Planetary Gear, Planetary Gear Cover, and Crown Wheel etc. The various bolts required making
the assembly. of about parts and integral one are bolted using a pneumatic bolter gun.
After this, the differential cage is collected from the conveyor firstly fitted with the necessary
bearing races. Then the differential Cage unit and the BP shaft are assembled, making up a
complete one unit. The Trumpet Hsg. and the Axles are assembled in a different assembly shop
and there on the whole unit along with the Bull Gears is assembled to the differential Cage. The
Assembly of Differential Hsg. is complete with the assembly of lay shaft ext., the oil filter and
the brake mechanism.
23
Differential Cover Assembly:
The second stage of Assembly shop is the differential cover assembly shop which incorporates
the gear pump assembly. And the direction control valve. The DI cover is collected from the
conveyor and the various attachments such as Power Cylinder, Piston Assembly., Oil Pump,
DCV Valve etc. is made, and the cover is tested for its efficiency on the testing jig. After which
it is sent to the first stage where the whole unit is assembled to the Dc assembly. And further sent
to the 5 stages of the assembly.
Gear Box Assembly:
The Gear Box Assembly is the third stage of the assembly unit in which the gear box is
assembled. Firstly, the gearbox cage is collected from the conveyor roller and successively parts
such as the counter shafts, clutch shafts, main shaft along with the ball bearings are assembled to
the unit. There is separate sub unit assembling the planetary cage and gears, which is then
attached to the Gear Box output shaft to obtain the duplex speed ratios of the tractor. The box
after being tested for its efficiency is sent to the 5 stages. Steering Gear Box + Gear Shifting +
Brake Assembly: This unit consists of 4 stages of the assembly unit. In this unit the sub assembly
of the steering gear box, gear shift mechanism on gear cover + the brake mechanism is
assembled of these mentioned sub assemblies, the brake assembly is sent to the 1 stage of
assembly and the steering gear box and gear box cover assembly is sent to the 3 stage of
assembly. Apart from these sub assembly unit also produces the KPS assembly.
Assembly of Gear Box Differential Hsg. and other accessories:
In the 5 stage of assembly, the Gear Box is mantled to the differential Apart from this; various
other accessories such as Foot Board, Battery Clamp and other links such as Accelerator Pedal
Link, Clutch link, Brake Link etc are mantled in this section. Assembly of Engine + Clutch
Mechanism. This unit is separate 6 stage of assembly in which the engines are received from the
stores and fitted with the clutch mechanism and lay beam along with the counter weights.
Assembly of Engine with the rest transmission section. The assembly of the engine and rest of
24
the transmission is done within the 7 stage. In this stage the whole of the chassis is formed as an
integral unit. The various links and mechanism between the engine and the gear box or diff is
fastened together and the whole integral unit is checked for its complete accessories etc. In all
the above stages of assembly, the skilled workers are used to accomplish all the stages of
assembly. But they are also held by the pneumatic bolt guns and the over head automatic
conveyors and the alarm conveyor etc to make their job easy. Also the whole of the assembly is
done on the assembly jigs or stands which is kept moving at a speed of about 7cm/mm. Also it is
to be made in mind that any spill of the sub parts such as bolts, nuts etc. by mistake is not going
to spoil the working space as all these spills gets underneath the working space and as a result the
working space remains clean and tidy.
11.1 HEAT TREATMENT
INTRODUCTION:
Heat treatment shop plays a very important role in every industry. In automobile industry the
important components are gears, shafts etc. these need to be heat treated to impart desired
strength and increase the life of components. The heat treatment shop at PTL is equipped with
several gas carburising furnaces, quenching tanks, induction hardening machines and shot
blasting furnaces. The shop is manned by a highly skilled work force.
List of components heat-treated in this shop
• All gears produced in LMS
• All shafts produced in LMS
List of machines in heat treatment shop:
Following are the machines, which are used in the heat treatment shop:
• Gas carbursing furnace
• Induction hardening machine
• Quenching tank
• Shot blasting machine
• Tempering machine
25
• Lapping machine
• Hydraulic press
12.1 PAINT SHOP:
Operations performed in paint shop are:
• Surface Preparation (Pre Treatment Cell)-carried out for sheets and rims.
• Painting
• Inspection
• Rejection (Reprocessing)-for sheets and rims.
• Pre Treatment Cell Various procedures followed here are:
• Degreasing
• Water Rinsing (part which is degreased is alkaline in nature so rinsed with water due to its
being good solvent).
• De Rusting
• Surface oxidation
• Phosphating (done so as to form a thin layer of coating on part so that no surface remains
unpainted).
• Passination (done so as to avoid paint penetrating through certain
section of part body‘s surface).
Painting:
Chasis paint line:operation carried out here are:
• Washing: Here chassis is first washed with a chemical cleaner, concentration of which is 5%
and auto sprayed in a chamber.
• Drying: The chassis is then dried by hot air whose temperature is up to 60 to 70°C.
• Primer Painting: A thin layer of primer paint is sprayed on the chassis so that the final paint is
strongly fixed on.
• Flash Off: This is the distance given so as to allow paint to dry.
• Final Painting

26
• Flash off.
• Baking: Chassis is allowed to bake for around 30 minutes.
• Sheet and rims Painting: After surface preparation in PTC, sheets and rims are first of all
cleaned with ordinary cloth. There after following operations are carried out:
• Primer painting (full primer in addition to single coating of paint)
• Flash off.
• Baking (at temperature of around 120-130°C)
• Wet Rubbing and cleaning with tack rag. Quality Control Inspection If painting in both sheets
and rims is satisfactory the piece is selected otherwise rejected.
Various parameters checked are-:
• Depth of penetration of paint.
• Thickness of paint coating
• Smoothness
• Uniformity
Rejection
If piece is rejected it is either again processed whereby is again send to PTC or discarded. A
MORE ABOUT SWARAJ TRACTOR DIVISION IN VERY BRIEF LAYOUT: Layout in the
plant is the combination of the line and the batch layouts.
MATERIAL HANDLING EQUIPMENTS:
• Trucks of different types.
• Trolleys .
• Cranes of different types .
• Belt conveyors, overhead conveyors.
• Roller conveyors- most common in use.
• Chain conveyors .
• Hoists .

27
13.1 MAINTENANCE DEPARTMENT
INTRODUCTION:
Many changes have taken place in the maintenance system and practice used in the industries
with the progress made by technology. Along with production, maintenance plays vital role. In
fact production and maintenance go side by side If a machine is under breakdown, it can not be
subjected to the production process with the advent of new and modern technology, the entire
concept of maintenance has changed. Earlier maintenance practices were only confined to the
breakdown maintenance, but now different types of maintenance practices are followed like:
1. Scheduled maintenance .
2. Break down maintenance.
3. Preventive maintenance.
4. Predictive maintenance.
The following are the main objectives of maintenance:
• To achieve the minimum break down level and to achieve the production target at low cost.
• To keep the plant in proper working condition.
• Machine and other facilities should be arranged so that they can be used to their max. capacity.
• The Maintenance division of the factory ensures the availability of all the facilities necessary
for the performance of functions at optimum return of investment.
IMPORTANCE OF MAINTENANCE :
1. Equipment breakdown leads to inevitable loss of production time, which is prevented by
maintenance department.
2. Plant maintenance plays an important role in production management by preventing
breakdowns which caves inevitable shortfall of target, needs of sub-contracting work,
rescheduling of production, need of over time etc.
3. Routine check-up of facilities ensure safe and efficient operation of machinery.
4. Maintains optimum production efficiency of machinery
5. Helps in maintaining the operational accuracy and reduces the work content.
28
6. Reduce breakdowns and concerned downtimes thus achieving the target of max. production at
min.cost.
7. Ensure safety of life and limbs of workers and machine operators. With rise in the technology,
not only predictive and preventive action bus the concept of cost cutting, proper utilization of
resources ,better spare parts planning, training have also become important now. This can be
made possible to cent percent by systematic maintenance. In Punjab tractors limited systematic
maintenance operations are practiced to improve the plant availability and to achieve the goal at
a reasonable cost. i.e. to achieve availability performance at the lowest cost and within the
safety constants.
At present the maintenance deptt. of PTL have five subsections:
1. Electrical maintenance cell.
2. Engineering machine maintenance cell.
3. Material handling equipment maintenance cell.
4. Spare part planning and control cell.
5. Engineering utility maintenance.
Kelley defines maintenance as the operation of a pool of resources like men, spares and tools
directed towards controlling the level of availability and the condition of the plant. The function
of maintenance is to use these re3 sources to repair, replace and adjust or modify the parts of
plant to be enabling it to operate the specified availability and performance over a specified time
for the specified life.
29
14.1 ABOUT CNC: -
CNC stands for Computer Numerical Control. A CNC is a mini-computer which is used to
control the machine tool functions and slide motion from stored information. The instructions are
stored in the memory of the mini computer. The instructions are written in the form of program.
A CNC system is the heart and brain of a CNC machine which enables the operation of the
various machine members such as slides, spindles etc. as per the sequence programmed into it,
depending on the machining operations. The main advantage of a CNC system lies in the fact
that the skills of the operator hitherto required in the operation of conventional machine are
removed and the part production is made automatic.A CNC machine tool is different from
conventional machine tools in a number of respects. The basic design for conventional machine
tool is not suitable for CNC machine. Many design changes are required for CNC machines as
compared to conventional machines tools due to addition al requirements of CNC machines such
as automatic drive system, high rigidity feed drives, ball screw, automatic tool changer (ATC),
chip conveyor, tool magazine.A CNC machine tool responds directly to the program that is in
operation. The accuracy to be achieved depends to a great extent on the various elements of CNC
machine. Also the CNC machines have high accuracy and productivity as the machine is
operated 24 hours, so need special design for its elements.
ADVANTAGES OF CNC MACHINES: -
1. Availability: - CNC machine can be available for work continuously 24 hours a day, 365 days
a year and only need to be switched off for maintenance.
2. User friendly: - CNC machines are user friendly. Less skilled/trained people can operate
CNCs unlike manual lathes/milling machines etc. which need skilled engineers.
3. Conversion of units: - If the takes is prepared in the units of inches then the same system of
units can be converted into SI units within the computer memory.
4. Updated: - CNC machines can be updated by improving the software used to drive the
machines.
30
5. Diagnostic: - It can diagnose program and can detect the machine malfunctioning even before
the part is produced.
6. Easy supervision: - One person can supervise many CNC machines as once these are
programmed they can usually be left to work by themselves.
7. Easy training: - Training in the use of CNCs is available through the use Ëœvirtual
softwareâ„¢. This is software that allows the operator to practise using the CNC machine on the
screen of a computer like a computer game.
8. Similar quality: - CNC machines are programmed with a design which can then be
manufactured hundreds or even thousands of items. Each manufactured product will be exactly
the same.
9. Reduce inspection: - The time spent on inspection and in waiting for inspection to begin is
greatly reduced. Normally it is necessary to inspect the first component only. If there is any
difference in the dimensions of the machined component, the program is checked and corrected,
if needed.
DISADVANTAGE OF CNC MACHINES: -
1. High initial cost: - CNC machines are more expensive than manually operated machines.
2. Higher maintenance cost: - Persons trained in electronics along with mechanical and
electrical are required to service and maintain these complex machines.
3. Skilled CNC personnel: - It is very difficult to find a programmer and operator for a CNC,
hence existing personnel must be trained in the programming and operation.
31
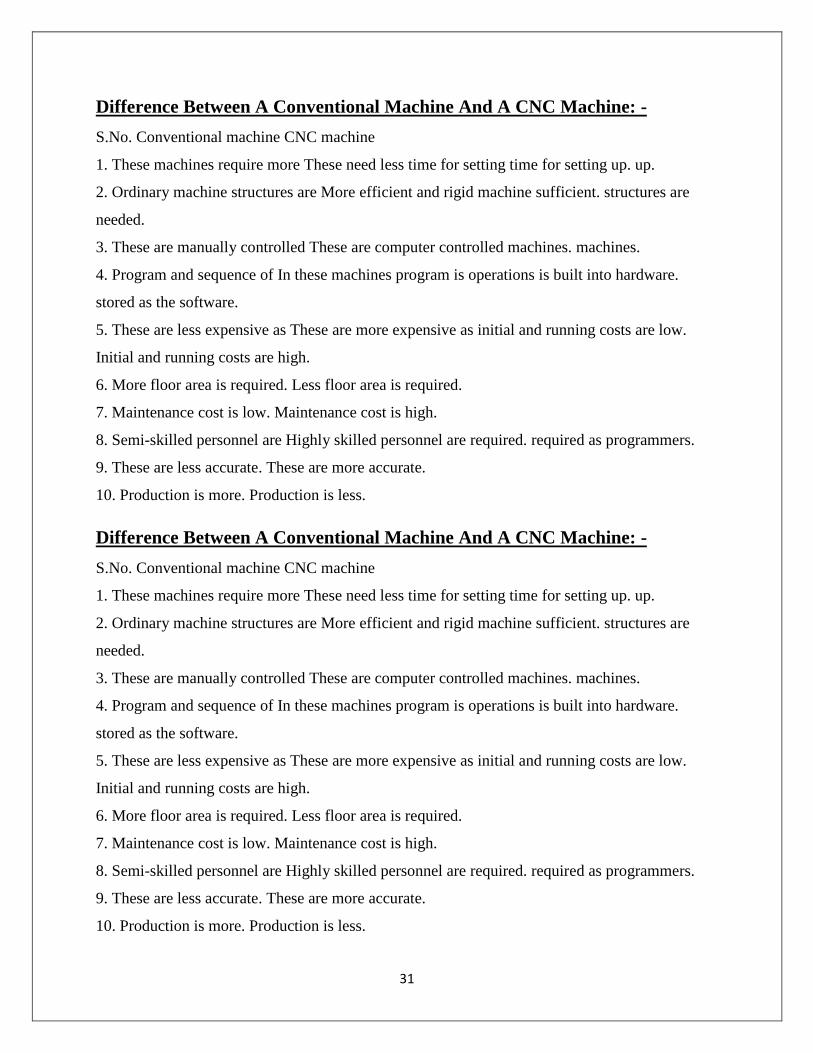
Difference Between A Conventional Machine And A CNC Machine: -
S.No. Conventional machine CNC machine
1. These machines require more These need less time for setting time for setting up. up.
2. Ordinary machine structures are More efficient and rigid machine sufficient. structures are
needed.
3. These are manually controlled These are computer controlled machines. machines.
4. Program and sequence of In these machines program is operations is built into hardware.
stored as the software.
5. These are less expensive as These are more expensive as initial and running costs are low.
Initial and running costs are high.
6. More floor area is required. Less floor area is required.
7. Maintenance cost is low. Maintenance cost is high.
8. Semi-skilled personnel are Highly skilled personnel are required. required as programmers.
9. These are less accurate. These are more accurate.
10. Production is more. Production is less.

32
15.1 Description Of The Control Panel Of CNC Turning Machine:-
1. EMERGENCY STOP: - immediately stops all machine movements in emergency.
Remove power from all serves & erases all active command. The stop button locks in the
depressed position. To release it, turns the button clockwise it stops & then releases it. This will
restore the machine power & ON the control system.While starting the machine, emergency
button is kept pressed to save the machine from varying current like a U.P.S. is used in a
computer system.
2. POWER ON: - Activates the machine control system. Keep the emergency stop button in
pressed condition while switching power ON.
3. MODE SELECT SWITCH: - This switch is one of the main controls available & is
used intensively for all mode selection of the machine. Before all machining processes begin,
there are certain preparatory operations to be completed. During these preparations, the control
must put in specific modes. These modes are selected switch on the machine control panel.
4. FEED HOLD: - Controlled hold of axis movement without spindle stop.
5. FEED RATE OVERRIDE: - Provides limited variation of programmed feed data. This
selection is useful to modify the feed rate programmed during the actual machine operation. This
can be varied from 0-120 % of the programmed feed rate.
6. CYCLE START: - Start of block or program.
7. BLOCK DELETE SWITCH: - Its purpose is the optional skip of blocks programmed
with oblique (/) when it is in ON position. This is a very useful programming feature, where
same program can be used for different materials.
8. EDIT: - Preparation, alteration or punching of a program.
9. AUTOMATIC: - In this mode the automatic processing of a part program takes place.
This indicates the actual position & the distance to be moved.
10. MACHINE READY: - Cabinet & machine ready after & switch power ON.

33
11. REFERENCE POINT APPROACH: - This mode is used to send the axis to the
reference point. This is used in conjunction with axis push buttons. It is advisable to move the X-
axis to the reference position before the Z-axis is moved to the reference position.
12. SINGLE BLOCK SWITCH: - This switch allows only the block-by block operation
from the part program each time cycle start is pressed. This is useful while trying out a part
program for the first instance.
13. DRY RUN SWITCH: - This switch in the ON position places the control in the dry run
mode. The programmed feeds are suppressed by the control & the dry run feed rare is active.
14. RAPID TRAVERSE OVERRIDE SWITCH: - This switch in the ON position
activates the rapid traverse override.
15. SPINDLE SPEED OVERRIDE: - This is used by the operator to adjust the spindle
from 50-120 % of the programmed speed in increments of 10 %. For example: - we entered the
spindle speed 1000 rpm. At 100 %, the speed of spindle is 1000 rpm & at 90% & 120%, its
speed is 900 rpm & 1200 rpm respectively.
16. MANUAL SPEED: - To increase or decrease the speed of spindle manually. At zero the
spindle will not rotate.
17. DIRECTION PUSH BUTTON: - The push buttons specify the direction of
movement in each of the axis. This is to be pressed for any movement of the axis in the specified
direction.
18. TURRET 1 OR 2 PUSH BUTTONS: - If there are two turrets in the machine, then
turret 1 or 2 push buttons are used to rotate or index the two turrets.
19. CONVEYOR CW OR CCW: - These push buttons are used to rotate the conveyor in
clockwise or anti-clockwise direction. The direction of rotation depends on which side of
machine conveyor is installed. If conveyor is installed on the right side of the machine, it will
rotate in clockwise direction & when conveyor is installed on the left side of the machine, it will
rotate in anti-clockwise direction.

34
20. CHUCK AIR BLOW: - Air is blown through chuck to remove the chips.
21. PARTS CATCHER: - It is an addition accessories attached in the CNC lathe machine,
whose purpose is to move with the tool and to check the dimension of the job continuously.
22. STEADY REST: - To lock/unlock the steady rest, which is used to hold the long jobs
from the middle so that the job does not vibrate during rotating at high speeds.
23. DOOR SWITCH: - To open or close the door of the machine for changing the tools or
jobs.
24. DRY RUN: - This is for the verification of the program weather the program is correct or
incorrect. But there is no movement of tool. If any error occurs an alarm will be activated.
25. OPTIONAL STOP: - When we have to check the job after the completion of a block,
we press the optional push button. To restart the program, press cycle start push button.
26. OVERTRAVEL RELEASE: - Its function is to bring the chuck in the safe position
by rotating it in opposite direction. We can select in which direction the turret moves by pressing
handle X or Z push button.
27. SPINDLE ON/OFF PUSH BUTTON: - There are three push buttons provided on
the control panel to start/stop the spindle.
(A). Forward “ for the clockwise rotation of spindle.
(B). Stop “ to stop the spindle.
() Reverse “ for the anti-clockwise rotation of the spindle.

35
16.1 STANDARD ROOM:
INTRODUCTION: Standard room is an integral part of Quality Engineering in Mahindra
& Mahindra Ltd.( Swaraj Division). It is a dust proof, controlled temperature room housing all
sophisticated instruments and related equipments requireuring aidg used in different
manufacturing shops.
Activities undertaken by Standard Room:
1. Storage of gauges
2. Inspection of bought out gauges
3. In-house calibration
4. Precision inspection of components
1.Storage of gauges: All new gauges and instruments require a constant temperature of 20
deg C are thus, stored in the standard room. Atleast one new gauge and instrument of each type
used in Swaraj is always available for quick replacement against write off in the shop.
2. Inspection of bought out gauges: All types of bought out gauges like plug gauges,
snap gauges, ring gauges, special gauges etc. are checked as per specifications.
3. In-house calibration: All standard gauges, inspection mandrels, receiver gauges etc.used
for different components on different machines are calibrated as per the pre-determined
schedule.
4.Precision inspection of components: All jig boring operations of tool room jobs,
component under development stage and precision measurements of typical components are
inspected on co-ordinate measuring machine(CMM), microhite, profile projector and other
special instruments.
36
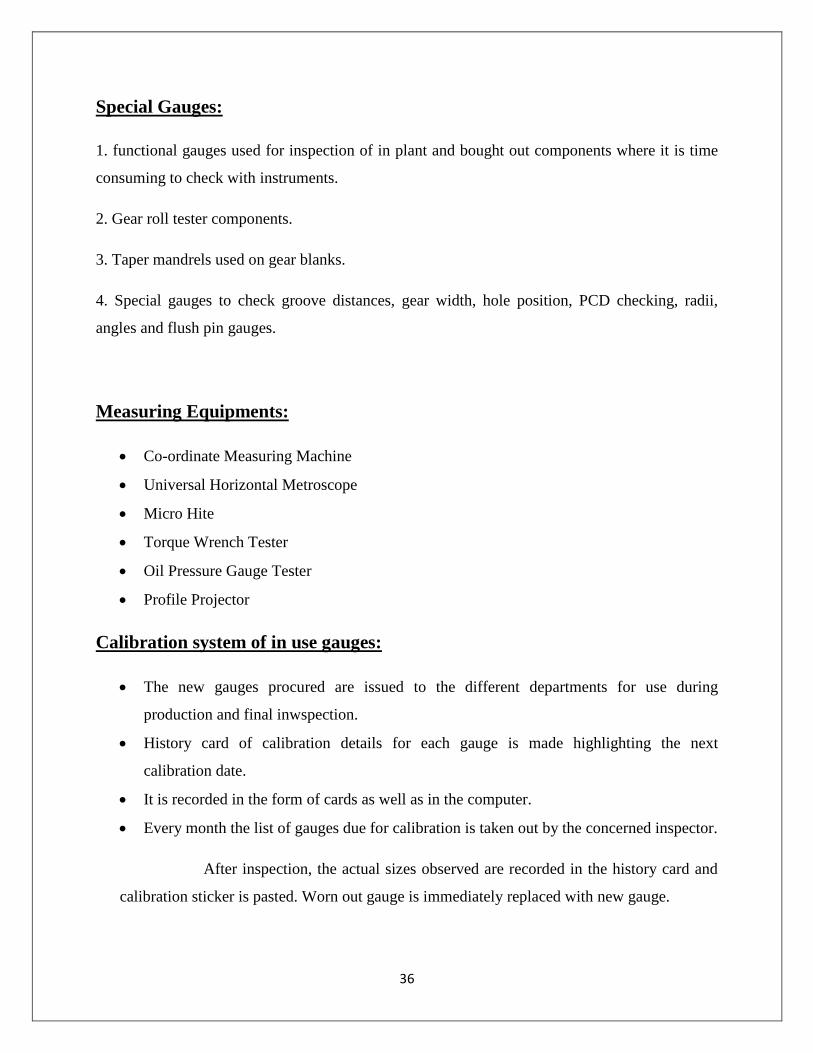
Special Gauges:
1. functional gauges used for inspection of in plant and bought out components where it is time
consuming to check with instruments.
2. Gear roll tester components.
3. Taper mandrels used on gear blanks.
4. Special gauges to check groove distances, gear width, hole position, PCD checking, radii,
angles and flush pin gauges.
Measuring Equipments:
Co-ordinate Measuring Machine
Universal Horizontal Metroscope
Micro Hite
Torque Wrench Tester
Oil Pressure Gauge Tester
Profile Projector
Calibration system of in use gauges:
The new gauges procured are issued to the different departments for use during
production and final inwspection.
History card of calibration details for each gauge is made highlighting the next
calibration date.
It is recorded in the form of cards as well as in the computer.
Every month the list of gauges due for calibration is taken out by the concerned inspector.
After inspection, the actual sizes observed are recorded in the history card and
calibration sticker is pasted. Worn out gauge is immediately replaced with new gauge.
37
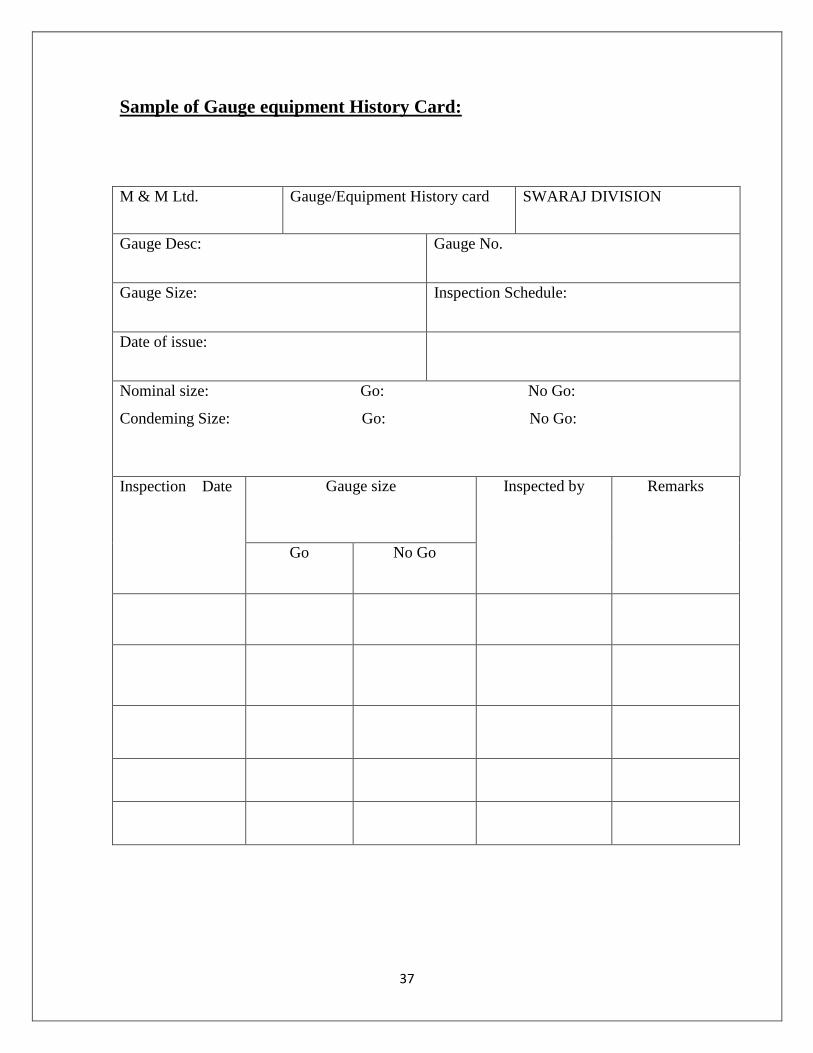
Sample of Gauge equipment History Card:
M & M Ltd. Gauge/Equipment History card SWARAJ DIVISION
Gauge Desc: Gauge No.
Gauge Size: Inspection Schedule:
Date of issue:
Nominal size: Go: No Go:
Condeming Size: Go: No Go:
Inspection Date
Gauge size Inspected by Remarks
Go No Go
38
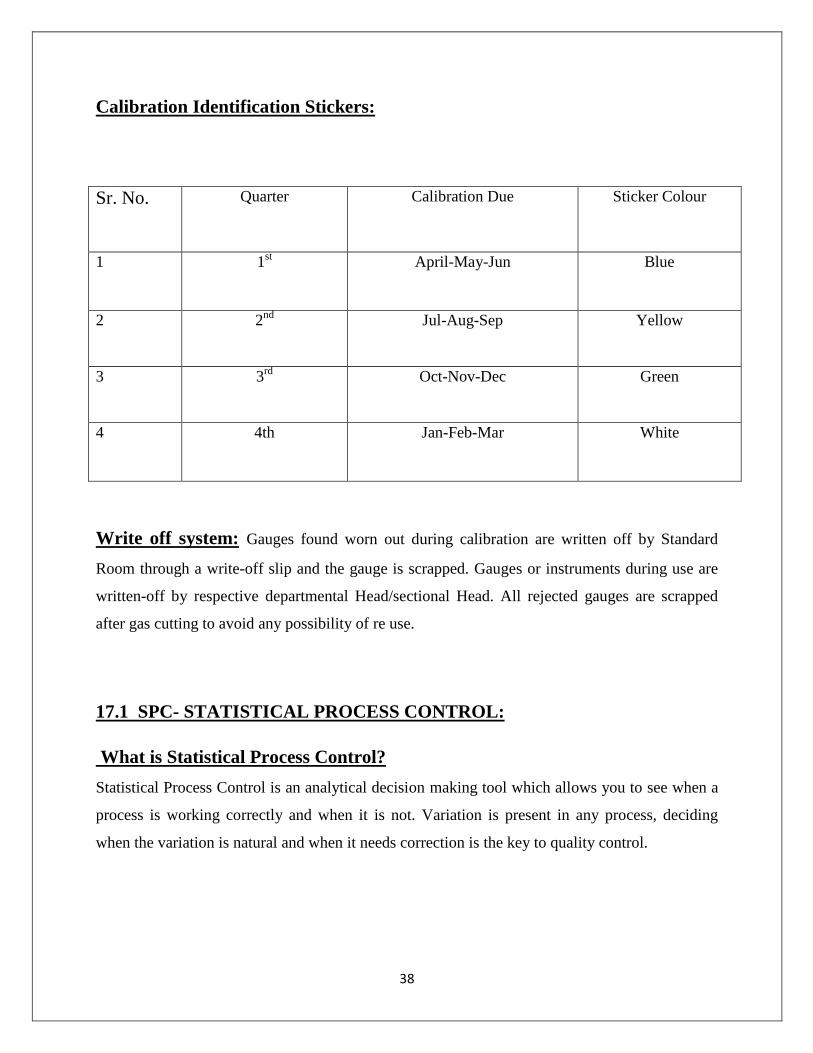
Calibration Identification Stickers:
Sr. No. Quarter Calibration Due Sticker Colour
1 1st April-May-Jun Blue
2 2nd
Jul-Aug-Sep Yellow
3 3rd
Oct-Nov-Dec Green
4 4th Jan-Feb-Mar White
Write off system: Gauges found worn out during calibration are written off by Standard
Room through a write-off slip and the gauge is scrapped. Gauges or instruments during use are
written-off by respective departmental Head/sectional Head. All rejected gauges are scrapped
after gas cutting to avoid any possibility of re use.
17.1 SPC- STATISTICAL PROCESS CONTROL:
What is Statistical Process Control?
Statistical Process Control is an analytical decision making tool which allows you to see when a
process is working correctly and when it is not. Variation is present in any process, deciding
when the variation is natural and when it needs correction is the key to quality control.

39
Where did this idea originate?
The foundation for Statistical Process Control was laid by Dr. Walter Shewart working in the
Bell Telephone Laboratories in the 1920s conducting research on methods to improve quality
and lower costs. He developed the concept of control with regard to variation, and came up with
Statistical Process Control Charts which provide a simple way to determine if the process is in
control or not. Dr. W. Edwards Deming built upon Shewart‘s work and took the concepts to
Japan following WWII. There, Japanese industry adopted the concepts whole-heartedly. The
resulting high quality of Japanese products is world-renowned. Dr. Deming is famous throughout
Japan as a "God of quality". Today, SPC is used in manufacturing facilities around the world.
18.1 Procedure for doing SPC:
STEP1. The first step will be to prepare the process control manual (before conducting CM
studies):
a) Responsibility- shop incharges
b) For preparing Procees Control Manual, the actions taken to remove the assignable causes to
bring the histogram under normalcy and to improve Cm to a value greater than 2 are documented
and a plan for monitoring the concerned parameters is made. This is called Process Control
Manual.
c) The parameters/checkocumented for the following elements:
By manufacturing support manager(Process Control Manual)
d) The acceptable values required for these parameters, procedures to check these parameters,ch
frequency and responsibility will be documented in the manual.
e) The records of checks will be maintained by module manager/Manufacturing support
manager.
f) For new machines, the rough draft of Process Control Manual will be prepared at supplier‘s
end and revised after the machine is installed at TD.

40
STEP2. The second step will be to calculate the machine capability(Cm) of the concerned
machine as from PGL-Manufacturing Engineering.
a) Responsibility- Shop in charges.
b) General:
Cm will be calculated initially for all machines where SPC technique for variables is
applicable.
For new machines, Cm will be established at machine manufacturer‘s end and also after
machine is installed at TD.(For new machines, where it is not possible to achieve Cm>2
& Ppk>1.33, decision to accept the machine under deviation will be documented.)
c) The Cm study will be carried out jointly by manufacturing support engineer and process
engineer, cell members, consistent raw material (e.g. same bar, from same heat of castings or
forgings etc.)
d) The procedure for working out Cm will be as follows-
10 sets(min) of readings, each set consisting of 4 readings(X1 to X4) of consecutive
decided frequency.
Cm is calculated and Histogram will be plotted for the readings as follows:
Cm=T/6sigma
Where T=Tolerance as per drawing
Sigma =sqrt(.(Summation(Xi-X bar)2/(n-1))
R bar will be worked out as mean of ranges of 10 sets referred above.
e) If the Cm is found to be less than 2, the concerned shop in charges will bring such machines to
the notice of plant head and the MR and maintain a list of such machines along with the action
plans. In the mean time, readings will be taken as per SOP and plotted to ensure that they lie
within specification limits. The SPC procedure documented below will no be applicable for such
operations.
41
f) The exercise of calculating Cm and improving the current value of Cm for the given machine
will be repeated every 3 months, for all machines. The efforts will be made to continuously
improve the Cm value, even if Cm is found to be greater than 2.
g) The records of Cm and related calculations along with quarterly studies will be maintaines as
quality records by shop in charges.
STEP3. The third step will be the initial study.
a) Responsibility- To be done by shop in charges.
After achieving Cm>2,the initial study for conducted by module manager as follows:
b) One shift production or 100 components continous readings(whichever is less-But minimum
60) (X1 to Xn) will be taken and Histogram for the same will be drawn.
c) If the Histogram is found to be normal i.e. bell shaped then the process will be assumed to be
under statistical control. In such case , Pp & Ppk will be calculated manually or using a software.
Pp = USL – LSL/6 sigma
Where USL= upper specification limit
LSL= lower specification limit
Sigma = square root of (Xbar-X1)2
+(Xbar-X2)2+……………..(Xbar-Xn)
2/ n-1
Xbar= Mean of X1 toXn.
Ppk= Min.(PPU,PPL)
PPU=USL-Xbar/3sigma and , PPL=Xbar-LSL/3sigma
d)Adjustments like tool adjustment, tool change, coolant flow etc., done during the study will be
recorded and further actions will be taken as per following flow diagram.

42
e) The adjustments done as per(d) above will be documented as procedures in SOP‘s.
What exactly are process control charts?
Control charts show the variation in a measurement during the time period that the process is
observed. In contrast, bell-curve type charts, such as histograms or process capability charts,
show a summary or snapshot of the results. Process control charts are fairly simple-looking
connected-point charts. The points are plotted on an x/y axis with the x-axis usually representing
time. The plotted points are usually averages of subgroups or ranges of variation between
subgroups, and they can also be individual measurements. Some additional horizontal lines
representing the average measurement and control limits are drawn across the chart. Notes about
the data points and any limit violations can also be displayed on the chart.
43
What is the purpose of control charts?
Control charts are an essential tool of continuous quality control. Control charts monitor
processes to show how the process is performing and how the process and capabilities are
affected by changes to the process. This information is then used to make quality improvements.
Control charts are also used to determine the capability of the process. They can help identify
special or assignable causes for factors that impede peak performance.
How do they work?
Control charts show if a process is in control or out of control. They show the variance of the
output of a process over time, such as a measurement of width, length or temperature. Control
charts compare this variance against upper and lower limits to see if it fits within the expected,
specific, predictable and normal variation levels. If so, the process is considered in control and
the variance between measurements is considered normal random variation that is inherent in the
process. If, however, the variance falls outside the limits, or has a run of non-natural points, the
process is considered out of control.
What’s this relationship between variation and assignable causes?
Variation is the key to statistical process control charts. The extent of variation in a process
indicates whether a process is working as it should. When the variation between the points is
large enough for the process to be out of control, the variation is determined to be due to non-
natural or assignable (special) causes.
How are these normal-predictable variance levels determined?
One of the beauties of control charts is that the process itself determines the control limits. The
process itself shows what can and can not be expected. The control limits are automatically
calculated from the data produced by the process. These calculations are done painlessly by
Statit QC software, no need to calculate them by hand. By definition control limits cannot be pre-
assigned, they are a result of the process or the ―voice of the process". Control limits are NOT
44
specifications, corporate goals, or the ―voice of the customer". These two concepts must never be
confused. ―Get real‖ might be a nice way of putting the concept of control limits vs. specification
lines.
What about these rules violations for determining if a series of points within
the control limits is unnatural?
The work done by Shewart and his colleagues gave them a base of empirical knowledge on
which to base Rules Violations. For example, six points in a row steadily increasing or
decreasing. These have been codified and are contained in the AT&T Statistical Quality Control
Handbook. Statit Software uses these time-tested and industry proven standards to automatically
check for rules violations. Full details of these rules are provided in Appendix 1: AT&T‘s
Statistical Quality Control Standards . They can also be found in the on-line help in Statit QC.
In control? Out of control? What’s the point?
If a process is in control, the outcomes of the process can be accurately predicted. In an out of
control process, there is no way of predicting whether the results will meet the target. An out of
control process is like driving a bus in which the brakes may or may not work and you have no
way of knowing! If a process is out of control, the next step is to look for the assignable causes
for the process output, to look for the out-of-controlness. If this out-of-controlness is considered
negative, such as multiple defects per part, the reasons for it are investigated and attempts are
made to eliminate it. The process is continuously analyzed to see if the changes work to get the
process back in control. On the other hand, sometimes the out-of-control outcomes are positive,
such as no defects per part Then the assignable cause is sought and attempts are made to
implement it at all times. If successful, the averages are lowered and a new phase of the process
is begun. A new set of capabilities and control limits is then calculated for this phase.

45
What’s this about capabilities?
A control chart shows the capabilities of a process that is in control. The outcomes of the process
can be accurately predicted, you know what to expect from the process. Sometimes an
organization‘s requirements, specifications or goals are beyond what the process is actually
capable of producing. In this case, either the process must be changed to bring the specifications
within the control limits, or the specifications must be changed to match the capabilities of the
process. Other activities are a waste of time, effort and money.
Can any type of process data be judged using Control Charts?
Processes that produce data that exhibits natural or common-cause variation will form a
distribution that looks like a bell-curve. For these types of processes, control charts should
provide useful information. If the data is not normally distributed, does not form a bell-curve, the
process is already out of control so it is not predictable. In this case we must look for ways to
bring the process into control. For example, the data may be too broad, using measurements from
different work shifts that have different process outcomes. Every process, by definition, should
display some regularity. Organizing the data collection into rational subgroups, each of which
could be in control, is the first step to using control charts.
46
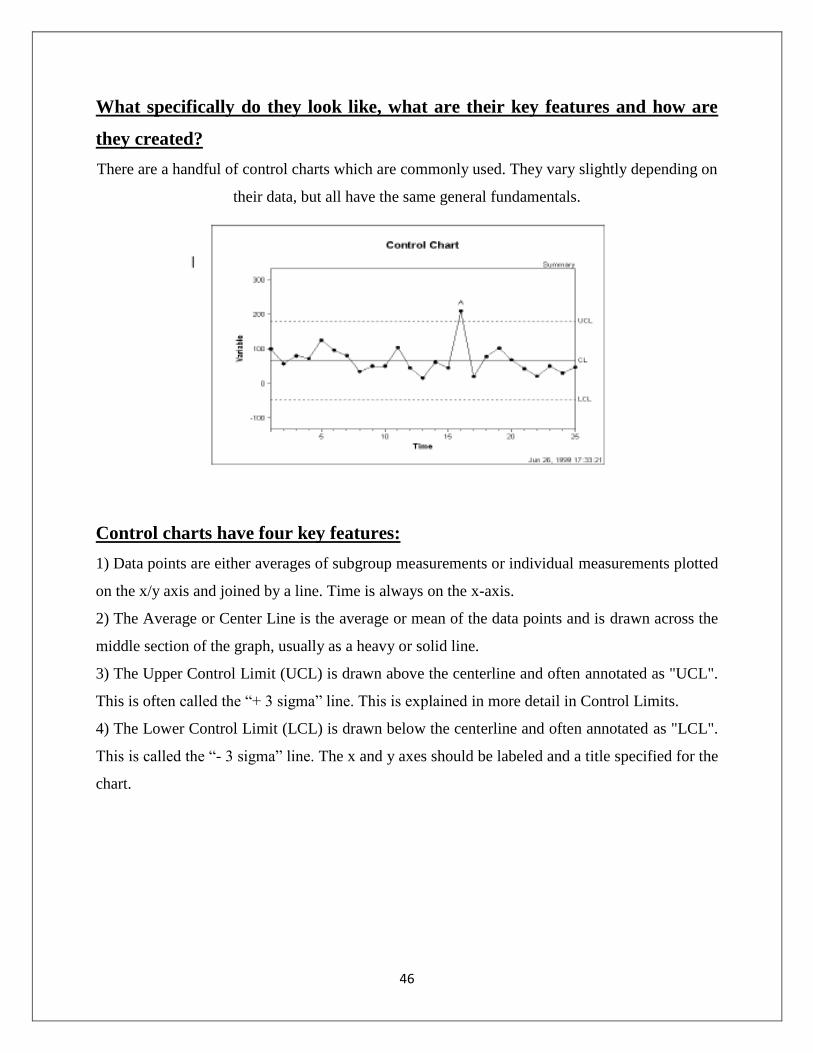
What specifically do they look like, what are their key features and how are
they created?
There are a handful of control charts which are commonly used. They vary slightly depending on
their data, but all have the same general fundamentals.
Control charts have four key features:
1) Data points are either averages of subgroup measurements or individual measurements plotted
on the x/y axis and joined by a line. Time is always on the x-axis.
2) The Average or Center Line is the average or mean of the data points and is drawn across the
middle section of the graph, usually as a heavy or solid line.
3) The Upper Control Limit (UCL) is drawn above the centerline and often annotated as "UCL".
This is often called the ―+ 3 sigma‖ line. This is explained in more detail in Control Limits.
4) The Lower Control Limit (LCL) is drawn below the centerline and often annotated as "LCL".
This is called the ―- 3 sigma‖ line. The x and y axes should be labeled and a title specified for the
chart.
47
How do I go about making these control charts?
In the past, creating control charts was a difficult process requiring statisticians and
mathematicians to remember the formulas and actually calculate the various data points and
control limits. Today, using Statit QC software and computers, the complicated part of the task is
done quickly and accurately. We can concentrate instead on the problems, solutions and
increasing levels of quality, rather than poring over formulas. The time saved allows us to get
immediate feedback on a process and take corrective actions when necessary. Our march toward
Continuous Quality Improvement has never been less complicated. Assuming measurements
have been made and the data gathered, the next step is to open the data file, select the appropriate
type of chart from the Statit menus, click the mouse and the chart is ready for inspection. Any
out-of-control points have a letter over them. Click on the rule violation letter and a box is
displayed describing the violation.
When is the best time to start?
NOW! The key to SPC is action! Rather than trying to discover the perfect methodology or data
set, it is best to get started, to begin to truly effect quality immediately! Adjustments will be
needed as you go along, this is a big part of the cycle of quality. The cost of poor quality and
non-conformance is great, in service industries it is estimated at 35%+ of gross revenue. Time, of
course, is invaluable. Today, with the Statit, you can begin working immediately on quality
improvement.
19.1 Steps Involved In Using Statistical Process Control:
Proper Statistical Process Control starts with planning and data collection. Statistical analysis on
the wrong or incorrect data is rubbish, the analysis must be appropriate for the data collected. Be
sure to PLAN, then constantly re-evaluate your situation to make sure the plan is correct. The
key to any process improvement program is the PDSA cycle described by Walter Shewart.

48
.
Plan:
Identify the problem and the possible causes. The QC tools described in this manual can help
organizations identify problems and possible causes, and to prioritize corrective actions.
Do:
Make changes designed to correct or improve the situation.
Study:
Study the effect of these changes on the situation. This is where control charts are used – they
show the effects of changes on a process over time. Evaluate the results and then replicate the
change or abandon it and try something different.
Act:
If the result is successful, standardize the changes and then work on further improvements or the
next prioritized problem. If the outcome is not yet successful, look for other ways to change the
process or identify different causes for the problem. Control charting is one of a number of steps
involved in Statistical Process Control. The steps include discovery, analysis, prioritization,
clarification, and then charting. Before using Statit QC software, appropriate data must be
collected for analysis. Then, you need to begin again and do it over and over and over.
Remember, quality is a CYCLE of continuous improvement.
49
Specific SPC Tools And Procedures:
The preparatory phases of SPC involve several steps using a number of different tools. These
tools are described below and most are available in Statit QC. Eight quality tools are available to
help organizations to better understand and improve their processes.
The essential tools for the discovery process are:
Check Sheet
Cause-and-Effect Sheet
Flow Chart
Pareto Chart
Scatter Diagram
Probability Plot
Histogram
Control Charts
Brainstorming
Identification and Data gathering:
When you set out to improve quality, the first thing to do is identify the processes that need
improvement. This can be done using a number of methods such as surveys, focus groups or
simply asking clients about their experiences. Once the problem areas are identified, a
brainstorming session should occur with a variety of people who are involved with the processes.
The target problems are decidedupon and a list of possible causes is identified.
20.1 Prioritizing:
After a number of possible problems are noted, the next step is to prioritize. The problems that
are having the greatest effect are the highest priority items. It has been ―discovered‖ time and
again that a great percentage of the trouble in nearly all processes is caused by a small
percentage of the total factors involved. Service departments routinely find that 5% of the
problems are taking over 80% of their time. Therefore, in order to maximize effectiveness,

50
identify the key opportunities for improvement, those items that will provide the most benefit to
your organization.
Analysis Of Selected Problem:
Once a major problem has been selected, it needs to be analyzed for possible causes. Cause-and-
effect diagrams, scatter plots and flow charts can be used in this part of the process.
Cause-and-Effect or Fishbone Diagram:
One analysis tool is the Cause-and-Effect or Fishbone diagram. These are also called Ishikawa
diagrams because Kaoru Ishikawa developed them in 1943. They are called fishbone diagrams
since they resemble one with the long spine and various connecting branches. The fishbone chart
organizes and displays the relationships between different causes for the effect that is being
examined. This chart helps organize the brainstorming process. The major categories of causes
are put on major branches connecting to the backbone, and various sub-causes are attached to the
branches. A tree-like structure results, showing the many facets of the problem. The method for
using this chart is to put the problem to be solved at the head, then fill in the major branches.
People, procedures, equipment and materials are commonly identified causes. This is another
tool that can be used in focused brainstorming sessions to determine possible reasons for the
target problem. The brainstorming team should be diverse and have experience in the problem
area. A lot of good information can be discovered and displayed using this tool.
To create a Fishbone diagram:
• In Statit Custom QC, use the menu selection:
The dialogs lead you through the creation of the chart. If you have any difficulties, open the Help
file using the Help button on the Fishbone Diagram dialog, or select Help Contents and find
―Fishbone Diagram‖ in the Index.

51
Flowcharting:
After a process has been identified for improvement and given high priority, it should then be
broken down into specific steps and put on paper in a flowchart. This procedure alone can
uncover some of the reasons a process is not working correctly. Other problems and hidden traps
are often uncovered when working through this process. Flowcharting also breaks the process
down into its many sub-processes. Analyzing each of these separately minimizes the number of
factors that contribute to the variation in the process.

52
After creating the flowchart, you may want to take another look at the fishbone diagram and see
if any other factors have been uncovered. If so, you may need to do another Pareto diagram as
well. Quality Control is a continual process, in which factors and causes are constantly reviewed
and changes made as required. Flowcharts use a set of standard symbols to represent different
actions:
Circle / Oval
Beginning or end
Square
A process, something
being done
Diamond
Yes / No decision
Scatter Plots:
The Scatter plot is another problem analysis tool. Scatter plots are also called correlation charts.
A Scatter plot is used to uncover possible cause-and-effect relationships. It is constructed by
plotting two variables against one another on a pair of axes. A Scatter plot cannot prove that one
variable causes another, but it does show how a pair of variables is related and the strength of
that relationship. Statistical tests quantify the degree of correlation between the variables. In this
example, there appears to be a relationship between height and weight. As the student gets taller,
generally speaking they get heavier.
To create a Scatter plot:
• In Statit Express QC, use the menu selection:
• In Statit Custom QC, use the menu selection:
The dialogs lead you through the creation of the chart. If you have any difficulties, open the Help
file using the Help button on the Scatter Plot dialog, or select Help � Contents and find ―Scatter
Plot‖ in the Index.

53
21.1 Data Gathering And Initial Charting:
This is the time to begin gathering data related to the problem. The following tools will help with
this task.
Check Sheets:
Check sheets are simply charts for gathering data. When check sheets are designed clearly and
cleanly, they assist in gathering accurate and pertinent data, and allow the data to be easily read
and used. The design should make use of input from those who will actually be using the check
sheets. This input can help make sure accurate data is collected and invites positive involvement
from those who will be recording the data. Check sheets can be kept electronically, simplifying
the eventual input of the data into Statit QC. Statit QC can use data from all major spreadsheets,
including Excel and Lotus 123, all major database programs and some other SPC software
programs. Since most people have a spreadsheet program on their desktop PC, it might be easiest
to design a check sheet in a spreadsheet format. Check sheets should be easy to understand. The
requirements for getting the data into an electronic format from paper should be clear and easy to
implement.
Histograms:
Now you can put the data from the check sheets into a histogram. A histogram is a snapshot of
the variation of a product or the results of a process. It often forms the bellshaped curve which is
characteristic of a normal process. The histogram helps you analyze what is going on in the
process and helps show the capability of a process, whether the data is falling inside the bell-
shaped curve and within specifications. See Process Capability Chart – cp on page 27 for more
information. A histogram displays a frequency distribution of the occurrence of the various
measurements. The variable being measured is along the horizontal x-axis, and is grouped into a
range of measurements. The frequency of occurrence of each measurement is charted along the
vertical y-axis. Histograms depict the central tendency or mean of the data, and its variation or
spread. A histogram also shows the range of measurements, which defines the process capability.
A histogram can show characteristics of the process being measured, such as:
• Do the results show a normal distribution, a bell curve? If not, why not?
• Does the range of the data indicate that the process is capable of producing what is required by
the customer or the specifications?

54
• How much improvement is necessary to meet specifications? Is this level of improvement
possible in the current process?
To create a Histogram:
• In Statit Express QC, use the menu selection:
• In Statit Custom QC, use the menu selection: The dialogs lead you through the creation of the
chart. If you have any difficulties, open the Help file using the Help button on the Histogram
dialog, or select Help � Contents and find ―Histogram‖ in the Index.
Probability Plot:
In order to use Control Charts, the data needs to approximate a normal distribution, to generally
form the familiar bell-shaped curve. The probability plot is a graph of the cumulative relative
frequencies of the data, plotted on a normal probability scale. If the data is normal it forms a line
that is fairly straight. The purpose of this plot is to show whether the data approximates a normal
distribution. This can be an important assumption in many statistical analyses.
Although a probability plot is useful in analyzing data for normality, it is particularly useful for
determining how capable a process is when the data is not normally distributed. That is, we are
interested in finding the limits within which most of the data fall. Since the probability plot

55
shows the percent of the data that falls below a given value, we can sketch the curve that best fits
the data. We can then read the value that corresponds to 0.001 (0.1%) of the data. This is
generally considered the lower natural limit. The value corresponding to 0.999 (99.9%) is
generally considered the upper natural limit.
Note: To be more consistent with the natural limits for a normal distribution, some people choose
0.00135 and 0.99865 for the natural limits. To create a Probability plot:
• In Statit Express QC, use the menu selection:
• In Statit Custom QC, use the menu selection:
The dialogs lead you through the creation of the chart. If you have any difficulties, open the Help
file using the Help button on the Probability Plot dialog, or select Help � Contents and find
―Probability Plot‖ in the Index. The next section discusses control charts, which are considered
the heart and soul of Statistical Process Control, and the main reason to use Statit QC. The
different types of control charts are explained in the next section, along with a discussion of
control chart fundamentals.
22.1 Control Charts:
Fundamental Concepts And Key Terms:
Whether making mom‘s recipe for spaghetti sauce or admitting patients to an emergency room,
the outcome of a process is never exactly the same every time. Fluctuation or variability is an
inevitable component of all systems and is expected, arising naturally from the effects of
miscellaneous chance events. However, variation outside a stable pattern may be an indication
that the process is not acting in a consistent manner. Events which fall beyond expected
variability or events forming a pattern that is not random, indicate that the process is out of
control. From a quality control perspective, an out-of-control service or production system is
trouble! It is probably not be meeting customer specifications or achieving business goals, and
there is no way of predicting if it will or can. There are two general ways of detecting that a
process is out of control. The first test for an out-of-control process asks, "Is any point falling
above or below the control limits on its control chart?" This particular test is very easy to
perform by viewing the control chart. The second form of rule violations is based upon patterns
of points on the control chart and can be difficult to detect. For example, 4 of 5 successive points
in zone B or above, or 8 points on both sides of center with none in Zone C. Statit QC quickly

56
and accurately performs these out-ofcontrol tests, using predefined standard rule sets from
AT&T‘s Statistical Quality Control Handbook, the definitive source for rule violation standards..
Statistical Process Control charts graphically represent the variability in a process over time.
When used to monitor the process, control charts can uncover inconsistencies and unnatural
fluctuations. Consequently, SPC charts are used in many industries to improve quality and
reduce costs. Control charts typically display the limits that statistical variability can explain as
normal. If your process is performing within these limits, it is said to be in control; if not, it is out
of control. It is important to remember what you can conclude about a system that is in control:
Control does not necessarily mean that a product or service is meeting your needs, it only means
that the process is behaving consistently.
Rules Testing:
How do you judge when a process is out of control? By plotting a control chart of the output of a
process, it is possible to spot special or unnatural causes of variability and indications that the
process is drifting. Drifting is defined by the mean or range of the variation changing as the
process is running. The most common indication of change is a point falling outside of the
control limits, but other tests for process instability are also valuable. The rules used by Statit QC
for control charts are based on rules described in AT&T's Statistical Quality Control Handbook.
Different rules are appropriate for variable data and attribute data. Consequently, the default
rules used by Statit QC vary with the type of chart being produced. These rules can be found in
Appendix 1: AT&T‘s Statistical Quality Control Standards on page 34, as well as in Statit QC‘s
on-line help.
Zones In Control Charts:
Many of the standard rules examine points based on Zones. The area between each control limit
and the centerline is divided into thirds. The third closest to the centerline is referred to as Zone
A, the next third is Zone B, and the third closest to the control limits is Zone C. Note that there
are two of each of the Zones, one upper and one lower. See Control Limits on page 16 for more
information. Zone A is also referred to as the "3-sigma zone", Zone B is the "2-sigma zone", and

57
Zone C is the "1-sigma zone". These sigma zone terms are appropriate only when 3-sigma is
used for the control limits, as it is in Express QC.
Sigma is the Greek letter for s and is used in this context to denote the spread of data. Standard
control limits are located 3 sigma away from the average or centerline of the chart. The
centerline is also called the control line. These are called 3 sigma limits or 3 sigma zones. The
distance from the centerline to the control limits can be divided into 3 equal parts of one sigma
each. Statistics tell us that in normal data dispersion, we can expect the following percentages of
data to be included within the sigma:
1 sigma – 68.3%
2 sigma – 95.5%
3 sigma – 99.7%
We can expect 99.7% of the process outcomes to be within the 3-sigma control limits.
Control Limits:
Control limits are calculated statistically from your data. They are referred to as the Lower
Control Limit (LCL) and the Upper Control Limit (UCL) on a control chart. These are set at 3-
sigma by default since this is the most commonly used limit. Control limits define the zone
where the observed data for a stable and consistent process occurs virtually all of the time
(99.7%). Any fluctuations within these limits come from common causes inherent to the system,
such as choice of equipment, scheduled maintenance or the precision of the operation that results
from the design. These normal fluctuations are attributed to statistical variability. An outcome
beyond the control limits results from a special cause. Special causes are events external to the

58
ordinary operation of a production or service. Special causes indicate that there have been one or
more fundamental changes to the process and the process is out of control. Special causes need
to be investigated and eliminated before a control chart can be used as a quality-monitoring tool.
The automatic control limits for Express QC have been set at 3-sigma limits. Warning limits are
set at 2-sigma by default, and they can also be displayed.
Subgroups:
An important factor in preparing for SPC charting is determining if you will measure every
product of the process, such as measuring every part, or if you will use subgroups. Subgroups are
a sample of data from the total possible data. Subgroups are used when it is impractical or too
expensive to collect data on every single product or service in the process. Decisions to use
subgroups or not needs to be carefully thought out to ensure they accurately represent the data.
Subgroups need to be homogenous within themselves so that special causes can be recognized,
so problem areas stand out from the normal variation in the subgroup. For example, if you are in
charge of analyzing processes in a number of facilities, a separate group should represent each
facility, since each facility has different processes for doing the same tasks. Each facility
subgroup should probably be broken down even further, for example by work shifts.
59
Subgroups in Variable Control Charts:
All data in a subgroup has something in common, such as a common time of collection, all data
for a particular date, a single shift, or a time of day. Subgroup data can have other factors in
common, such as data associated with a operator, or data associated with a particular volume of
liquid. In Express QC, this is referred to as a Grouped subgroup and there is a categorical
variable that holds the grouping category, for example, Operator_ID or Volume.
Subgroups in Attribute Control Charts:
A subgroup is the group of units that were inspected to obtain the number of defects or the
number of rejects. The number of defects is displayed using c charts and u charts. The number of
rejects, also called defective items, is displayed using p charts and np charts.
Phases:
In Express QC, phases can be used in a variable control chart to display how a process behaves
in response to a change in a particular characteristic of the system. For example, outside factors
can cause disruptions in the normal process, such as a construction project in a plant that could
cause additional defects. Phase analysis can be helpful in identifying special causes of variation
or trends. It is also useful when studying the impact of changes you make to your process,
changes which you hope will be improvements. Here is an example of a phase chart showing the
changes that came about after new guidelines were established for shortening. You can see how
the horizontal lines representing the upper control limit, centerline and lower control limit
change with the new guidelines.
Sample Size:
This is the number of cases making up the sample. The sample is a collection of observations
used to analyze a system. In SPC applications, ―Sample‖ is a synonym for ―Subgroup‖.
60
Rejects - Nonconforming Items Data:
Nonconforming items are rejects. A reject is tallied when an entire unit fails to meet acceptance
standards, regardless of the number of defects in the unit. This includes defective products or
unacceptable outcomes.
Defects - Nonconformities Data:
Nonconformities are defects. A non-conformity is any characteristic, which should not be present
but is, or a characteristic which needs to be present but is not. A defective item can have multiple
non-conformities, for example, errors on insurance forms, incorrect medication, or service
complaints.
Using Process Control Charts:
OK, enough talk. Let's do some actual control charting. First you need to determine what data
you have and select the correct chart for that data. Then make the chart and analyze it to see if
the process is in control.
Data Definitions For Proper Chart Selection:
Choosing the correct chart for a given a situation is the first step in every analysis. There are
actually just a few charts to choose from, and determining the appropriate one requires following
some fairly simple rules based on the underlying data. These rules are described in the flowchart
below:
Control charts are divided into two groups:
Variable Data:
Variable charts are based on variable data that can be measured on a continuous scale. For
example, weight, volume, temperature or length of stay. These can be measured to as many
decimal places as necessary. Individual, average and range charts are used for variable data.
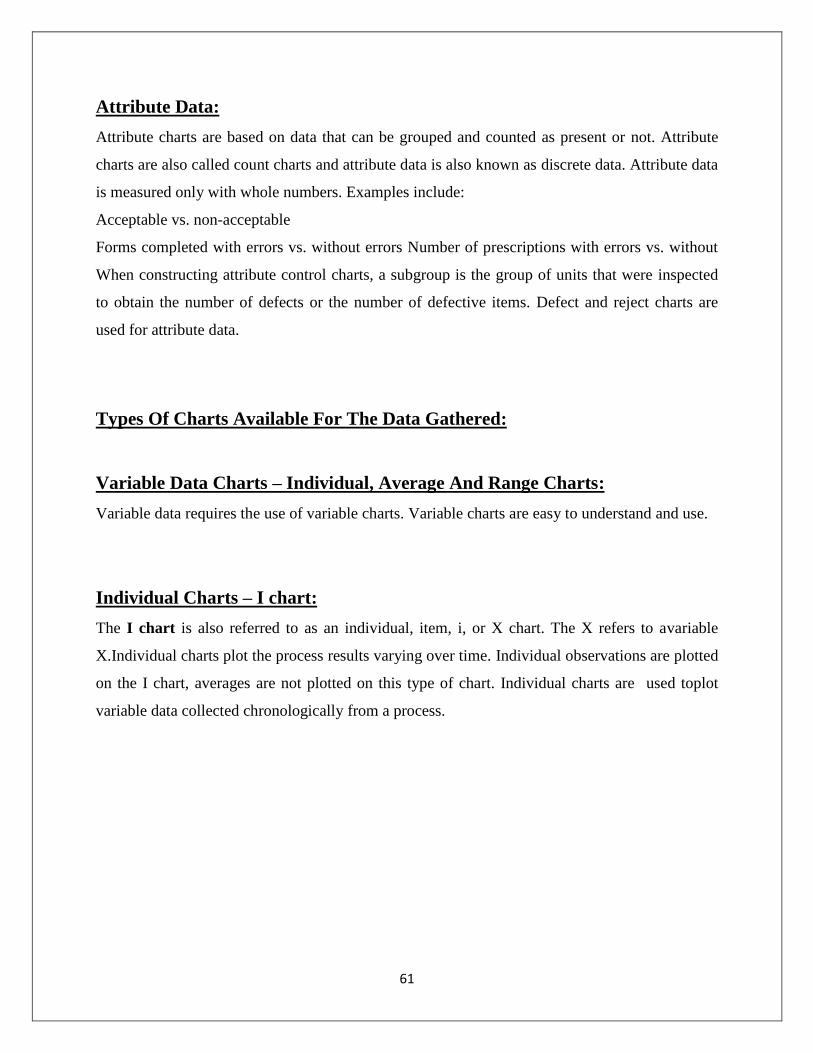
61
Attribute Data:
Attribute charts are based on data that can be grouped and counted as present or not. Attribute
charts are also called count charts and attribute data is also known as discrete data. Attribute data
is measured only with whole numbers. Examples include:
Acceptable vs. non-acceptable
Forms completed with errors vs. without errors Number of prescriptions with errors vs. without
When constructing attribute control charts, a subgroup is the group of units that were inspected
to obtain the number of defects or the number of defective items. Defect and reject charts are
used for attribute data.
Types Of Charts Available For The Data Gathered:
Variable Data Charts – Individual, Average And Range Charts:
Variable data requires the use of variable charts. Variable charts are easy to understand and use.
Individual Charts – I chart:
The I chart is also referred to as an individual, item, i, or X chart. The X refers to avariable
X.Individual charts plot the process results varying over time. Individual observations are plotted
on the I chart, averages are not plotted on this type of chart. Individual charts are used toplot
variable data collected chronologically from a process.
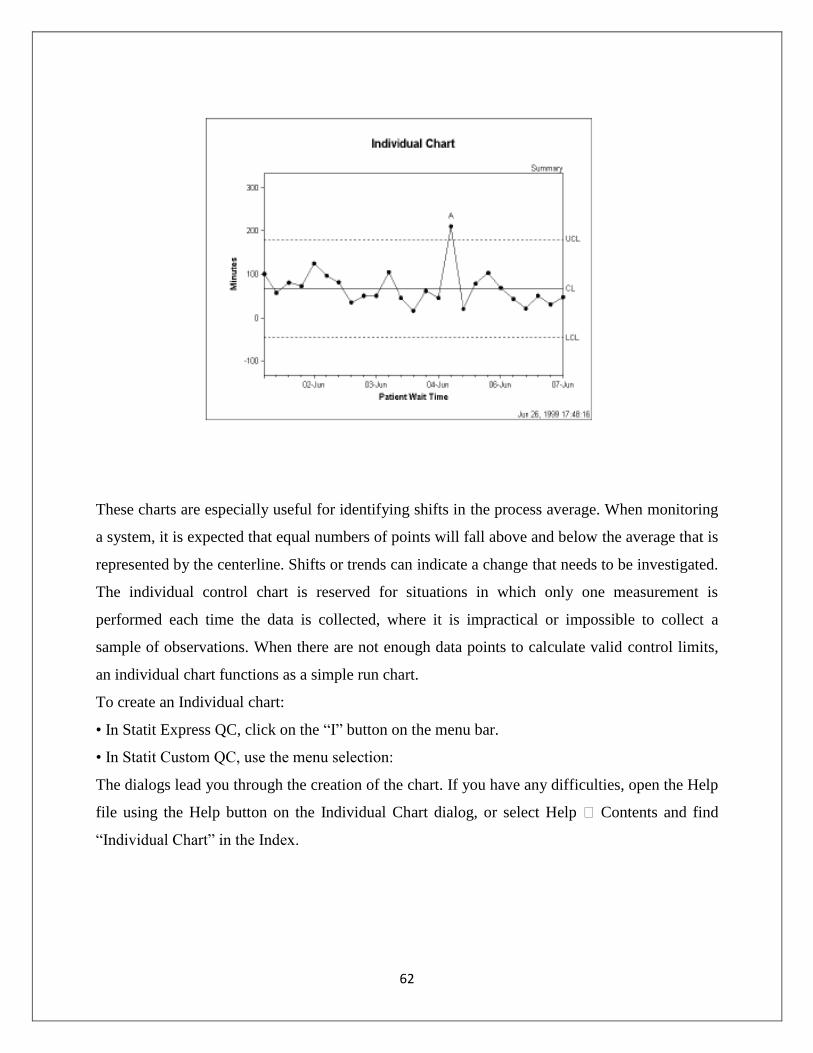
62
These charts are especially useful for identifying shifts in the process average. When monitoring
a system, it is expected that equal numbers of points will fall above and below the average that is
represented by the centerline. Shifts or trends can indicate a change that needs to be investigated.
The individual control chart is reserved for situations in which only one measurement is
performed each time the data is collected, where it is impractical or impossible to collect a
sample of observations. When there are not enough data points to calculate valid control limits,
an individual chart functions as a simple run chart.
To create an Individual chart:
• In Statit Express QC, click on the ―I‖ button on the menu bar.
• In Statit Custom QC, use the menu selection:
The dialogs lead you through the creation of the chart. If you have any difficulties, open the Help
file using the Help button on the Individual Chart dialog, or select Help � Contents and find
―Individual Chart‖ in the Index.
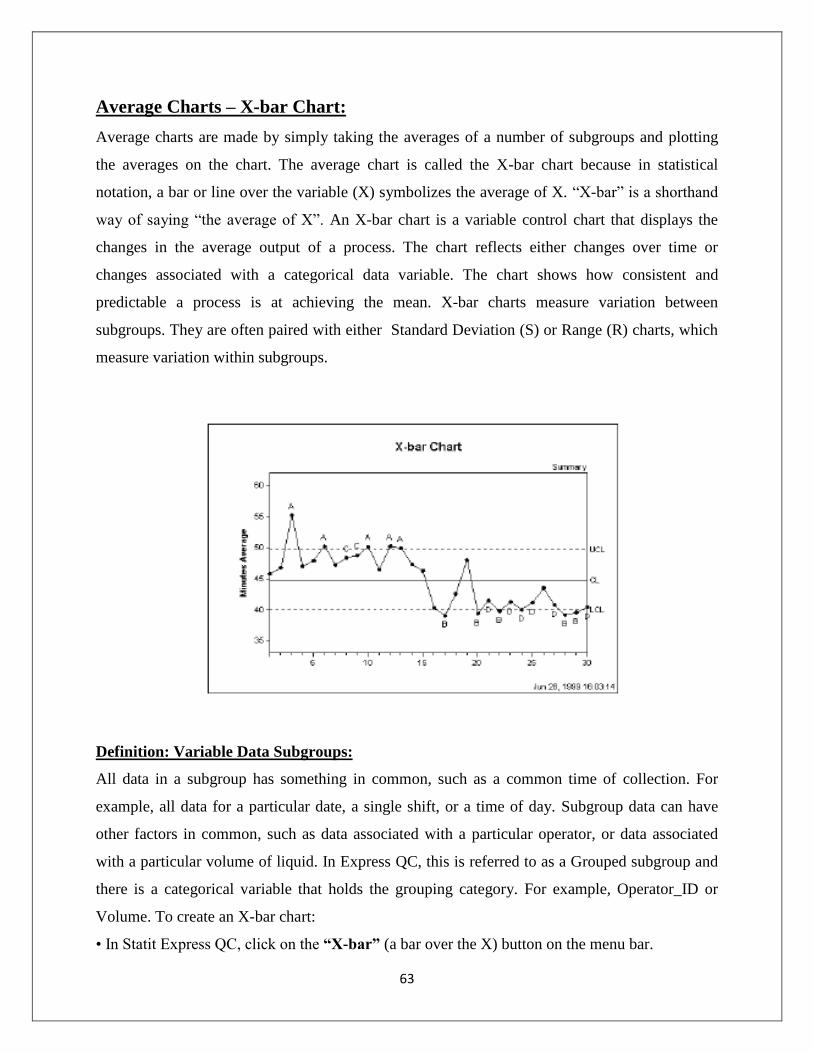
63
Average Charts – X-bar Chart:
Average charts are made by simply taking the averages of a number of subgroups and plotting
the averages on the chart. The average chart is called the X-bar chart because in statistical
notation, a bar or line over the variable (X) symbolizes the average of X. ―X-bar‖ is a shorthand
way of saying ―the average of X‖. An X-bar chart is a variable control chart that displays the
changes in the average output of a process. The chart reflects either changes over time or
changes associated with a categorical data variable. The chart shows how consistent and
predictable a process is at achieving the mean. X-bar charts measure variation between
subgroups. They are often paired with either Standard Deviation (S) or Range (R) charts, which
measure variation within subgroups.
Definition: Variable Data Subgroups:
All data in a subgroup has something in common, such as a common time of collection. For
example, all data for a particular date, a single shift, or a time of day. Subgroup data can have
other factors in common, such as data associated with a particular operator, or data associated
with a particular volume of liquid. In Express QC, this is referred to as a Grouped subgroup and
there is a categorical variable that holds the grouping category. For example, Operator_ID or
Volume. To create an X-bar chart:
• In Statit Express QC, click on the “X-bar” (a bar over the X) button on the menu bar.

64
• n Statit Custom QC, use the menu selection:
The dialogs lead you through the creation of the chart. If you have any difficulties, open the Help
file using the Help button on the X-bar Chart dialog, or select Help � Contents and find ―X-bar
Chart‖ in the Index.
Range Chart – R-Chart:
The Range chart can be combined with I charts and X-bar charts. The chart names combine the
corresponding chart initials. Range charts measure the variation in the data. An example is the
weather report in the newspaper that gives the high and low temperatures each day. The
difference between the high and the low is the range for that day.
To create a Range chart:
• In Statit Express QC, this is always combined with the X-bar or I chart.
• In Statit Custom QC.
:
Select: QC Variable charts R Chart The dialogs lead you through the creation of the charts. If
you have any difficulties, open the Help file using the Help button on the R Chart dialog, or
select Help Contents and find "R Chart" in the Index.
Moving Range Chart – MR Chart:
This type of chart displays the moving range of successive observations. A moving range chart
can be used when it is impossible or impractical to collect more than a single data point for each
subgroup. This chart can be paired with an individual chart, which is then called an Individual

65
Moving Range (IR) chart. An individual chart is used to highlight the changes in a variable from
a central value, the mean. The moving range chart displays variability among measurements
based on the difference between one data point and the next.
To create a Moving Range chart:
• In Statit Express QC, click on the “MR” button on the menu bar.
• In Statit Custom QC, use the menu selection:
The dialogs lead you through the creation of the chart. If you have any difficulties, open the Help
file using the Help button on the Moving Range Chart dialog, or select Help Contents and find
―Moving Range Chart‖ in the Index.
Combination Charts:
Individual And Range Charts – IR Charts:
This pair of variable control charts is often offered together for quality control analysis. The
Individual chart, the upper chart in the figure below, displays changes to the process output over
time in relation to the center line which represents the mean. The Moving Range chart, the lower
chart in the figure below, analyzes the variation between consecutive observations, which is a
measure of process variability.
To create an Individual/Moving Range chart:
• In Statit Express QC click on the “IR” button on the menu bar.
• In Statit Custom QC:
66
Average & Range Charts – X-Bar And R Charts:
Variable and Range control charts are often displayed together for quality control analysis. The
X-bar chart, the upper chart in the figure below, is a graphic representation of the variation
among the subgroup averages, the R chart, the lower chart in the figure below, looks at
variability within these subgroups. The variation within subgroups is represented by the range
(R). The range of values for each subgroup is plotted on the Y-axis of the R chart. The centerline
is the average or mean of the range.
To create an X-bar/Range chart:
• In Statit Express QC click on the “X-bar R” button on the menu bar.
• In Statit Custom QC:
The dialogs lead you through the creation of the charts. If you have any difficulties, open the
Help file using the Help button on the X-bar Chart or R Chart dialog, or select Help � Contents
and find ―X-bar Chart‖ or "R Chart" in the Index.

67
X-Bar Standard Deviation Charts – X-Bar And S Charts:
This pair of variable control charts is often displayed together for quality control analysis. The
X-bar chart, the upper chart in the figure below, displays the variation in the means between the
subgroups. The s chart, the lower chart in the figure below, looks at variability within these
subgroups. In this pair of charts, the variation within subgroups is represented by the standard
deviation. The standard deviation is plotted on the y-axis, and is a measure of the spread of
values for each subgroup. The centerline is the average or mean of these sub-group standard
deviations.
To create an X-bar/s chart:
• In Statit Express QC click on the “X-bar S” button on the menu bar.
• In Statit Custom QC:
The dialogs lead you through the creation of the charts. If you have any difficulties, open the
Help file using the Help button on the X-bar Chart or s Chart dialog, or select Help � Contents
and find ―X-bar Chart‖ or "s Chart" in the Index.

68
Range vs. Standard Deviation:
In Statit QC you can choose to use a standard deviation chart, the s-chart, instead of the Moving
Range chart. The Range chart is often used because the standard deviation is a more accurate and
therefore more difficult measurement. Now that computers are automatically calculating the
standard deviation, the s-chart can be used in all situations. This is called the X-bar S chart. A
standard deviation formula is used to calculate the differences in the data. This calculation can be
used in cases where the sub-group sample size is large and sampling methods support the
modeling of the data as normal distribution.
Process Capability Chart – cp Chart:
Process capability analysis is used to adjust the process until virtually all of the product output
meets the specifications. Once the process is operating in control, capability analysis attempts to
answer the question: Is the output meeting specifications, or is the process capable? If it is not,
can the process be adjusted to make it capable? The process capability chart contains a normal
curve superimposed over a histogram of the data, followed by several statistics. A process is said
to be capable if its output falls within the specifications virtually 100% of the time.
Note: Specification Limits are the boundaries, or tolerances, set by management, engineers or
customers which are based on product requirements or serviceobjectives. Specification Limits
are NOT established by the process itself, and may not even be possible within the given process.
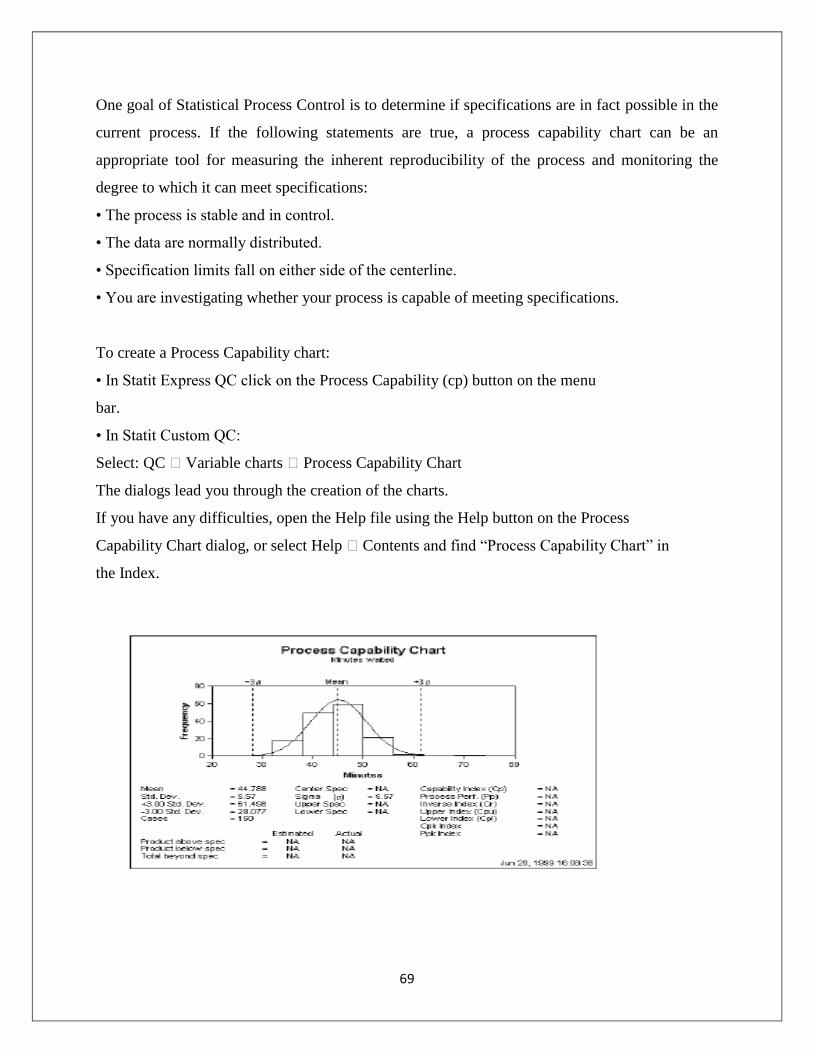
69
One goal of Statistical Process Control is to determine if specifications are in fact possible in the
current process. If the following statements are true, a process capability chart can be an
appropriate tool for measuring the inherent reproducibility of the process and monitoring the
degree to which it can meet specifications:
• The process is stable and in control.
• The data are normally distributed.
• Specification limits fall on either side of the centerline.
• You are investigating whether your process is capable of meeting specifications.
To create a Process Capability chart:
• In Statit Express QC click on the Process Capability (cp) button on the menu
bar.
• In Statit Custom QC:
Select: QC � Variable charts � Process Capability Chart
The dialogs lead you through the creation of the charts.
If you have any difficulties, open the Help file using the Help button on the Process
Capability Chart dialog, or select Help � Contents and find ―Process Capability Chart‖ in
the Index.

70
Attribute Data Charts:
Defects Data vs. Rejects Data:
Again, attribute data represents particular characteristics of a product or system that can be
counted, not product measurements. They are characteristics that are present or not present. This
is known as discrete data, and is measured only with whole numbers. Examples include:
Acceptable vs. non-acceptable Forms completed with errors vs. without errors Number of
prescriptions with errors vs. without Attribute data has another distinctive characteristic. In
quality control analysis, this countable data falls into one of two categories:
• Defects data is the number of non-conformities within an item. There is no limit to the number
of possible defects. Defects charts count the number of defects in the inspection unit.
• Rejects data where the entire item is judged to conform to product specifications or not. The
count for each item is limited to 1or 0. Rejects charts count the number of rejects in a subgroup.
One way to determine what type of data you have is to ask, ―Can I count both the occurrences
AND non-occurrences of the defective data?‖ For example, you can count how many forms have
errors and how many do not, however you cannot count how many errors were NOT made on the
form. If you can count both occurrences and nonoccurrences, you have rejects data. If the non-
occurrences cannot be determined, then you have defects data.
For example:
If you are counting the number of errors made on an insurance form, you have an example of the
defects per form. There is no limit to the number of defects that can be counted on each form. If
you are counting the total number of forms that had one or more errors, then you have a count of
the rejected units. This is either one or zero rejects per unit.

71
Summary Of Defects Vs. Rejects Data:
Defects charts:
Attribute charts for cases in which the possible occurrences are infinite or cannot be
counted.They count the number of non-conformities within an item.
Rejects charts:
Attribute Data charts for the cases in which rejected whole units are counted. These figures can
be described as ratios instead of just counts.
Subgroup Size – Constant or Changing?
Subgroup size is another important data characteristic to consider in selecting the right type of
chart. When constructing attribute control charts, a subgroup is the group of units that were
inspected to obtain the number of defects or the number of rejects. To choose the correct chart,
you need to determine if the subgroup size is constant or not. If constant, for example 300 forms
are processed every day, then you can look at a straight count of the defective occurrences. If the
subgroup size changes, you need to look at the percentage or fraction of defective occurrences.
For example: An organization may have a day in which 500 insurance forms are processed and
50 have errors vs. another day in which only 150 are processed and 20 have errors. If we only
look at the count of errors, 50 vs. 20, we would assume the 50 error day was worse. But when
considering the total size of the subgroup, 500 vs. 150, we determine that on the first day 10%
had errors while the other day 13.3% had errors. Now that we understand the different types of
attribute data, let‘s move on to the specific charts for analyzing them.
23.1 Conclusion – Time to put it all together…
You now have the basic fundamentals of statistical process control. You should understand that
it measures variance, and is used to determine if a process is in control. You should understand
the different steps necessary in performing SPC, including problem identification, data gathering,
prioritization and analysis. You should understand the key concepts and vocabulary for using
SPC charts. Finally you should understand the different types of data and be able to select which
control chart to use, depending on the data you have gathered. Now that you have read and
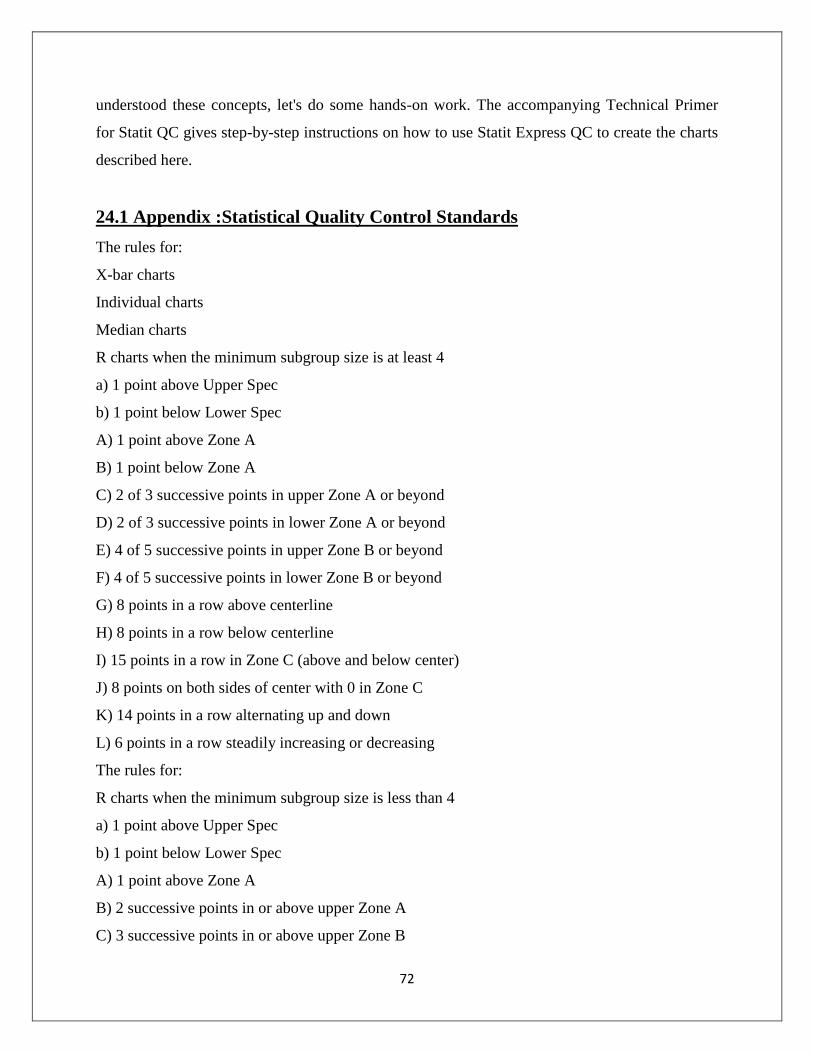
72
understood these concepts, let's do some hands-on work. The accompanying Technical Primer
for Statit QC gives step-by-step instructions on how to use Statit Express QC to create the charts
described here.
24.1 Appendix :Statistical Quality Control Standards
The rules for:
X-bar charts
Individual charts
Median charts
R charts when the minimum subgroup size is at least 4
a) 1 point above Upper Spec
b) 1 point below Lower Spec
A) 1 point above Zone A
B) 1 point below Zone A
C) 2 of 3 successive points in upper Zone A or beyond
D) 2 of 3 successive points in lower Zone A or beyond
E) 4 of 5 successive points in upper Zone B or beyond
F) 4 of 5 successive points in lower Zone B or beyond
G) 8 points in a row above centerline
H) 8 points in a row below centerline
I) 15 points in a row in Zone C (above and below center)
J) 8 points on both sides of center with 0 in Zone C
K) 14 points in a row alternating up and down
L) 6 points in a row steadily increasing or decreasing
The rules for:
R charts when the minimum subgroup size is less than 4
a) 1 point above Upper Spec
b) 1 point below Lower Spec
A) 1 point above Zone A
B) 2 successive points in or above upper Zone A
C) 3 successive points in or above upper Zone B
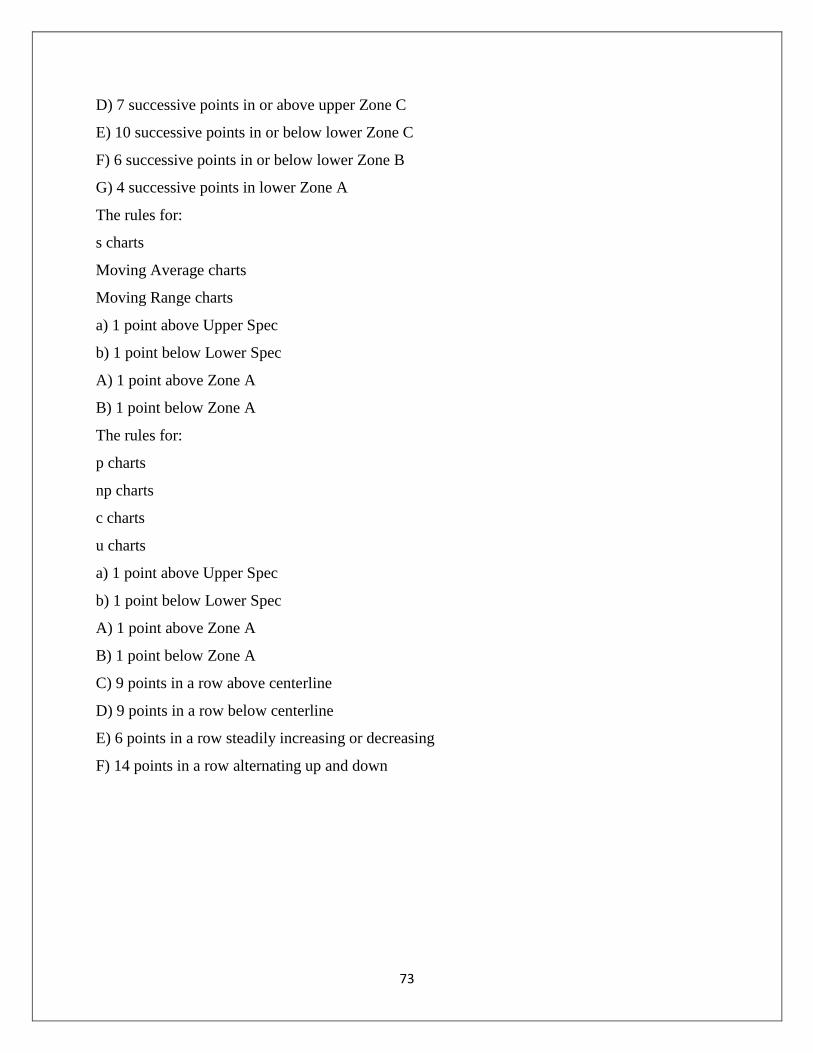
73
D) 7 successive points in or above upper Zone C
E) 10 successive points in or below lower Zone C
F) 6 successive points in or below lower Zone B
G) 4 successive points in lower Zone A
The rules for:
s charts
Moving Average charts
Moving Range charts
a) 1 point above Upper Spec
b) 1 point below Lower Spec
A) 1 point above Zone A
B) 1 point below Zone A
The rules for:
p charts
np charts
c charts
u charts
a) 1 point above Upper Spec
b) 1 point below Lower Spec
A) 1 point above Zone A
B) 1 point below Zone A
C) 9 points in a row above centerline
D) 9 points in a row below centerline
E) 6 points in a row steadily increasing or decreasing
F) 14 points in a row alternating up and down

74
25.1 Bibliography:
Nelson, Loyd S. (1985), "Interpreting Shewhart X Control Charts", Journal of Quality
Technology, 17:114-16. Steel, R. G. D. and J. H. Torrie (1980), Principles and Procedures of
Statistics. New York: McGraw-Hill. Western Electric Company (1956), Statistical Quality
Control Handbook, available from ATT Technologies, Commercial Sales Clerk, Select Code
700-444, P.O. Box 19901, SIndianapolis, IN 46219, 1-800-432-6600.
URLs
Statit Software
www.statit.com


