Embed Size (px)
Citation preview

Ž .Journal of Marine Systems 27 2000 267–276www.elsevier.nlrlocaterjmarsys
Summer at-sea distribution of seabirds and marine mammals inpolar ecosystems: a comparison between the European Arctic seas
and the Weddell Sea, Antarctica
Claude R. Joiris)
( )Laboratory for Polar Ecology, Free UniÕersity of Brussels VUB , Pleinlaan 2, B-1050 Brussels, Belgium
Received 16 November 1998; accepted 28 February 2000
Abstract
The summer at-sea distribution of seabirds and marine mammals was quantitatively established both in AntarcticaŽ .Weddell Sea and in the European Arctic: Greenland, Norwegian and Barents seas. Data can directly be compared, since thesame transect counts were applied by the same team from the same icebreaking ship in both regions. The main conclusion isthat densities of seabirds and marine mammals are similar in open water and at the ice edge from both polar regions, whilethe presence of Adelie penguins, minke whales and crabeater seals in densities more than one order of magnitude higher in´Antarctic pack-ice must reflect a major ecological difference between both polar systems. The ecological implications of
Ž .these observations are discussed, especially concerning important primary and secondary krill productions under theWeddell Sea pack-ice. q 2000 Elsevier Science B.V. All rights reserved.
Keywords: seabirds; cetaceans; pinnipeds; European Arctic; Antarctica
1. Introduction
The quantitative analysis of the at-sea distributionof seabirds and marine mammals provides usefulinformation on the ecological structure of the ecosys-tems they belong to, since they integrate and reflectthe availability of food, i.e. from primary productionto herbivores, carnivores, microbial loop and sedi-mentation, both qualitatively and quantitatively. Data
) Tel.: q32-2-629-3414; fax: q32-2-629-3438.Ž .E-mail address: [email protected] C.R. Joiris .
collected in the North Sea showed that seabird distri-bution is bound to the main water masses, as recog-nised by water temperature and salinity charac-
Ž .teristics Joiris, 1978 . Such differences are to beexplained by differences in the ecological structureof the water column, with a classical herbivorousfood chain leading to high zooplankton and pelagicfish production in Atlantic water, but a short-cut ofprimary production to microbial loop and sedimenta-
Ž .tion in North Sea water Joiris et al., 1982 .In the Antarctic, a known paradox concerns the
pelagic production by phytoplankton, namely thatactual primary production is lower than expected
0924-7963r00r$ - see front matter q 2000 Elsevier Science B.V. All rights reserved.Ž .PII: S0924-7963 00 00072-5
()
C.R
.JoirisrJournalof
Marine
Systems
272000
267–
276268
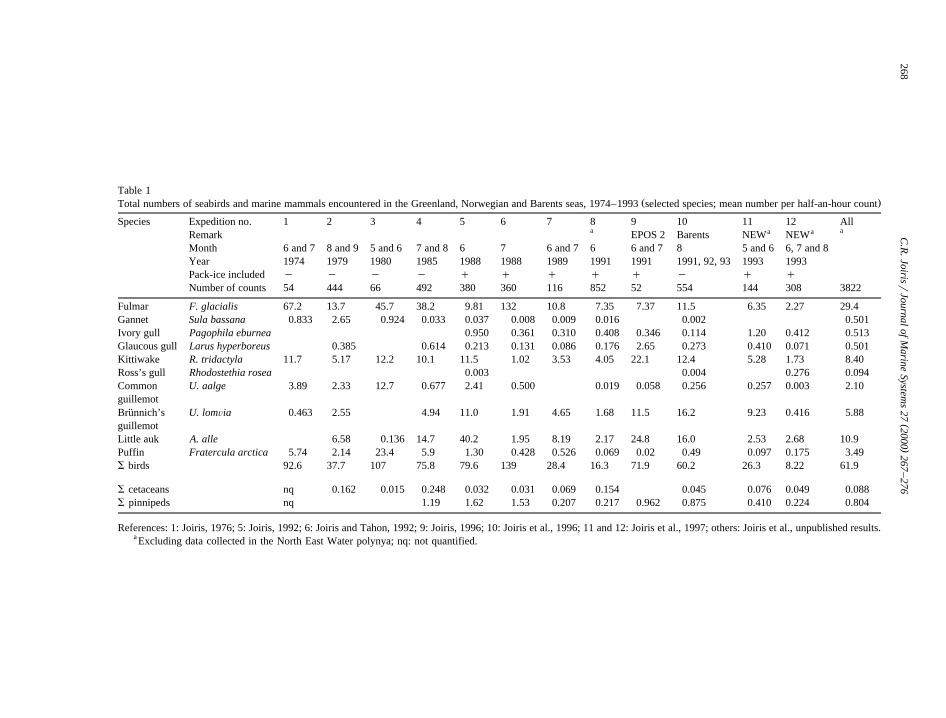
Table 1Ž .Total numbers of seabirds and marine mammals encountered in the Greenland, Norwegian and Barents seas, 1974–1993 selected species; mean number per half-an-hour count
Species Expedition no. 1 2 3 4 5 6 7 8 9 10 11 12 Alla aa aRemark EPOS 2 Barents NEW NEW
Month 6 and 7 8 and 9 5 and 6 7 and 8 6 7 6 and 7 6 6 and 7 8 5 and 6 6, 7 and 8Year 1974 1979 1980 1985 1988 1988 1989 1991 1991 1991, 92, 93 1993 1993Pack-ice included y y y y q q q q q y q qNumber of counts 54 444 66 492 380 360 116 852 52 554 144 308 3822
Fulmar F. glacialis 67.2 13.7 45.7 38.2 9.81 132 10.8 7.35 7.37 11.5 6.35 2.27 29.4Gannet Sula bassana 0.833 2.65 0.924 0.033 0.037 0.008 0.009 0.016 0.002 0.501Ivory gull Pagophila eburnea 0.950 0.361 0.310 0.408 0.346 0.114 1.20 0.412 0.513Glaucous gull Larus hyperboreus 0.385 0.614 0.213 0.131 0.086 0.176 2.65 0.273 0.410 0.071 0.501Kittiwake R. tridactyla 11.7 5.17 12.2 10.1 11.5 1.02 3.53 4.05 22.1 12.4 5.28 1.73 8.40Ross’s gull Rhodostethia rosea 0.003 0.004 0.276 0.094Common U. aalge 3.89 2.33 12.7 0.677 2.41 0.500 0.019 0.058 0.256 0.257 0.003 2.10guillemotBrunnich’s U. lomÕia 0.463 2.55 4.94 11.0 1.91 4.65 1.68 11.5 16.2 9.23 0.416 5.88¨guillemotLittle auk A. alle 6.58 0.136 14.7 40.2 1.95 8.19 2.17 24.8 16.0 2.53 2.68 10.9Puffin Fratercula arctica 5.74 2.14 23.4 5.9 1.30 0.428 0.526 0.069 0.02 0.49 0.097 0.175 3.49S birds 92.6 37.7 107 75.8 79.6 139 28.4 16.3 71.9 60.2 26.3 8.22 61.9
S cetaceans nq 0.162 0.015 0.248 0.032 0.031 0.069 0.154 0.045 0.076 0.049 0.088S pinnipeds nq 1.19 1.62 1.53 0.207 0.217 0.962 0.875 0.410 0.224 0.804
References: 1: Joiris, 1976; 5: Joiris, 1992; 6: Joiris and Tahon, 1992; 9: Joiris, 1996; 10: Joiris et al., 1996; 11 and 12: Joiris et al., 1997; others: Joiris et al., unpublished results.a Excluding data collected in the North East Water polynya; nq: not quantified.

( )C.R. JoirisrJournal of Marine Systems 27 2000 267–276 269
Table 2ŽNumbers of seabirds and marine mammals encountered in the Weddell Sea, Antarctica numbers per half-an-hour count; EPOS I, leg 1,
.October–November 1988; see legend Table 1; from Joiris, 1991
Species Zone Open water OMIZ IMIZ CPI TotalŽ .Ice cover tenths 0 -3 3 to 8 )8
Ž .Water temperature 8C 0.2 y1.4 y1.5 y1.7Number of counts 40 30 51 170 291
Chinstrap penguin P. antarctica 2.40 27.5 26.5 2.92 9.52aChinstrap penguin P. antarctica 238 258 23.9 63.5
Adelie penguin P. adeliae 1.03 18.8 109 67.2´Cape pigeon Daption capense 74.9 32.7 63.2 0.88 25.3S birds 344 336 155 120 179Crabeater seal L. carcinophagus 0.100 0.627 8.4 5.04Leopard seal Hydrurga leptonyx 0.067 0.235 0.341 0.247Fur seal Arctocephalus gazella 0.125 3.43 1.88 0.701S pinnipeds 0.125 3.63 2.75 8.78 6.00Minke whale Balaenoptera acurostrata 0.100 0.078 0.200 0.141S cetaceans 0.167 0.078 0.206 0.151
OMIZ: outer marginal ice zone; IMIZ: Intermediate marginal ice zone; CPI: closed pack-ice.aOn icebergs.
Žfrom light conditions and nutrients concentration e.g.Heywood and Whitaker in Laws, 1984; Treguer and´
.Jacques, 1992; Knox, 1994 . The second paradox is
that production of the higher trophic levels, on thecontrary, is higher than the one of northern polar
Ž .regions e.g. Knox, 1994 .
Table 3Calculated daily food intake by seabirds and marine mammals in polar regions: synopsis
A. European Arctic seas:
Polar open water Ice edge Closed pack-icen 6 3 3
Ž . Ž . Ž .Fulmar 0.53 0.36–0.88 0.21 0.13–0.28 0.32 0.10–0.53Ž . Ž . Ž .Kittiwake 0.34 0.12–0.84 0.06 0.04–0.07 0.03 0.01–0.05Ž . Ž . Ž .Brunnich’s guillemot 0.78 0.57–1.17 0.62 0.18–1.1 0.10 0.09–0.12¨Ž . Ž . Ž .Little auk 0.28 0.03–0.46 0.78 0.11–1.46 0.54 0.03–1.05
Ž . Ž . Ž .S birds 2.0 1.4–3.0 1.8 0.73–2.9 1.1 0.25–1.9Ž . Ž .S cetaceans 0.35 0–0.85 0.17 0.15–0.21 0Ž . Ž . Ž .S pinnipeds 0.24 0–0.51 1.45 0.55–2.5 0.25 0.10–0.42
Total 2.6 3.4 1.3
B. Weddell Sea, Antarctica
Polar open water Ice edge Closed pack-ice
Adelie penguin 0 0.05 23.6´S penguins 0.85 3.1 25.2S tubenoses 0.90 0.60 0.40
S birds 1.8 3.8 26.0S cetaceans 0 1.0 4.3S pinnipeds 0.01 0.70 12.0Total 1.8 5.5 42.3
y2 y1 Ž .Kg fw km .day ; mean; min.ymax. per expedition ; nsnumber of expeditions.

( )C.R. JoirisrJournal of Marine Systems 27 2000 267–276270
This paper deals with a quantitative comparisonof seabirds and marine mammals at-sea distributionin both polar regions, with emphasis on the impor-tance of the less studied ice-covered zones.
2. Methods
ŽSeabirds and marine mammals pinnipeds and.cetaceans at-sea distribution was determined by
Ž .Fig. 1. Distribution map for selected seabird species during RV Meteor expedition 71 partim , 30 June–16 August 1985; from C.R. Joirisand J. Tahon, unpublished results; numbers per half-an-hour count; each symbol corresponds to one count; dotted line: limit of the pack-ice.Ž . Ž .a Dark morph of the fulmar F. glacialis; four classes: nihil, 1–5, 6–25, 26–125. b Common guillemot U. aalge; four classes: nihil, 1–5,
Ž . Ž .6–25, 26–125. c Brunnich’s guillemot U. lomÕia; four classes: nihil, 1–10, 11–100, 101–1000. d Little auk A. alle; four classes: nihil,¨1–20, 21–400, 401–8000.

( )C.R. JoirisrJournal of Marine Systems 27 2000 267–276 271
Ž .Fig. 1 continued .
transect counts mainly carried out on board theGerman icebreaking RV Polarstern. Taking into ac-count the large size range of animals concerned:from very small petrels to albatrosses and whales, wedecided not to apply the AusualB method with atransect width limited to 300 m, as proposed by
Ž .Tasker et al. 1984 for the North Sea, but on thecontrary, without width limitation. In order to con-vert actual numbers counted into densities, the sur-
face covered during the count was calculated, takinginto account the transect length and a different widthfor each species, using specific conversion factorsdepending on the conspicuousness of the animalsŽsee description and discussion in Joiris, 1991; Joiris
.et al., 1997 . This conversion factor was determinedduring various exercises, where experienced ob-
Ž .servers CJ, J. Tahon and others evaluated the dis-tance at which seabirds and marine mammals were

( )C.R. JoirisrJournal of Marine Systems 27 2000 267–276272
Ž .Fig. 1 continued .
Ždetectable, separately and together see Joiris et al.,.1997 ; the density per square kilometer is obtained
by multiplying the number of birds per kilometer bythis factor. A comparison of data obtained by both
Žmethods shows that the results are similar Joiris et.al., 1997 . In order to make sure that results are
comparable, however, this paper will mainly involveour own data, being collected by the same team with
the same methodology and basically from the sameship.
The reproducibility of the counting method isillustrated by counts in the eastern Barents Sea col-lected during three similar transects in 1991, 1992
Ž .and 1993 Joiris et al., 1996 , during 75, 60 and 129half-an-hour counts, respectively. Median counts inthe polar water zone for the main species were: 1.50,

( )C.R. JoirisrJournal of Marine Systems 27 2000 267–276 273
Ž .Fig. 1 continued .
1.83 and 0.99, respectively for the fulmar Fulmarusglacialis; 1.26, 3.27 and 1.28 for the kittiwake Rissa
Žtridactyla; and 16.7, 28.1 and 24.5 for all birds S
.birds . For other species, differences registered in thesame type of water mass are much more important,and can be attributed to actual heterogeneitiesŽ .patchiness in the animals’ distribution; this is obvi-ously the case for little auk Alle alle, seals and
Ž .cetaceans see further, Table 3 .
The density data were expressed as daily foodintake by using allometric equations from the litera-
Žture, as described and discussed in Joiris 1991,. Ž .1992 and Joiris and Tahon 1992 , namely:
Is0.191=W 0.723 =N
where I is the daily ingestion in kg fw kmy2 , W theaverage individual biomass in kg and N the densityin numbers per km2.

( )C.R. JoirisrJournal of Marine Systems 27 2000 267–276274
3. Results and discussion
A summary of the data collected during differentspring and summer expeditions is presented in Table1 for the Greenland, Norwegian and Barents seas,and in Table 2 for the Weddell Sea, in order to showthe basic recorded data and the effort involved in thisstudy. In the Arctic, 27 seabird species were encoun-tered, of which four species represent 95% and moreof the total numbers: fulmar F. glacialis, little aukA. alle, kittiwake R. tridactyla, and Brunnich’s¨guillemot Uria lomÕia. In the Weddell Sea, thedensity of flying birds is of the same order ofmagnitude as in the Arctic, but they are represented
Ž .by a lower number of species 20, mainly tubenoses .They are however outnumbered by penguins, mainlyAdelies Pygoscelis adeliae, by more than one order´of magnitude. Marine mammals also are present in
Ž10 times higher densities mainly crabeater seal Lo-bodon carcinophagus among the pinnipeds, andminke whale Balaenoptera acutorostrata among the
.cetaceans . The presence of a lower number ofspecies, of which a few represented by very largenumbers of individuals, obviously reflects a lowerbiodiversity in the Weddell Sea than in EuropeanArctic seas. Our spring observations in the WeddellSea were confirmed during the following summer
Ž .expedition by van Franeker 1992 .The data, as presented, e.g. in Table 1, show
however a great heterogeneity leading to an apparentonreproducibility of the counts. This is in fact to beexplained by differences in the spatial distribution ofthe various species. In order to avoid the utilizationof somehow artificial geographical zones, the resultswere submitted to a cluster analysis aiming at anobjective identification of the main factors influenc-ing the at-sea distribution of seabirds and marinemammals. As an example of treatment of the results,data collected in the Norwegian and Greenland seas
Ž .in 1985 Joiris and Tahon, unpublished results arepresented and discussed here. Basic data, expressed
Ž .as numbers per count i.e. per half-hour , are pre-sented as distribution map for some species: darkmorph of the fulmar and alcids: common guillemot
ŽUria aalge, Brunnich’s guillemot and little auk Fig.¨. Ž1 . A cluster analysis was also performed SPSS, see
.Wildi and Orloci, 1980 . Results of the clustering ofthe stations on the base of all counts from this
expedition allow to recognise the existence of fourŽ .clusters Fig. 2 , to be explained by environmental
factors such as water temperature and salinity, i.e.corresponding to different water masses: cluster 1 toAtlantic water, cluster 4 to polar water, cluster 3 tocoastal Norwegian water, and cluster 2 to someunidentified characteristics, possibly some mixed wa-
Ž .ter areas between Atlantic and polar water Fig. 3 .Taking these environmental factors into account, this
Ž .separation into water masses sclusters allows toexplain up to 90% of the variability in the countingresults.
A synopsis of the results is presented in Table 3,expressed as calculated daily food intake, andgrouped as a function of the main hydrological fea-tures affecting the at-sea distribution of warm-blooded vertebrates: main water masses, ice edge,
Ž .type of pack-ice ice coverage in order to simplifyand facilitate discussion. The most obvious conclu-sion is that densities are of the same order of magni-tude in the Arctic and the Weddell Sea in polarwater, ice edge or marginal ice zone, while differ-ences in closed pack-ice reach one to two orders ofmagnitude: calculated daily food intake by seabirdsis 1 in Arctic closed pack-ice, and 25 in Antarcticclosed pack-ice; for cetaceans, the figures are 0Ž .-0.005 and 4; for pinnipeds, 0.2 and 11; for thesum of all warm-blooded predators, 1 and 40. Recent
Fig. 2. Cluster analysis of the seabirds and marine mammals datacollected in 1985: dendrogramme.

( )C.R. JoirisrJournal of Marine Systems 27 2000 267–276 275
Fig. 3. Cluster analysis of the seabird and marine mammal data collected in 1985: geographic distribution of the stations belonging to theŽ .four main clusters see text and Fig. 2 .
Žreview papers on seabird distribution Hunt et al.,. Ž1994 and on krill consumption by seabirds Cooper
.and Whoeler, 1994 in the Antarctic provide similarvalues for seabird density and food intake in openwater, i.e. mainly for flying birds.
Within a broader ecological interpretation, onecan consider that the at-sea distribution of seabirdsand marine mammals is mainly depending on the
availability of prey. In close pack-ice, the main preyof the most abundant Antarctic seabirds and marine
Ž .mammals is krill Euphausia spp., mainly superba ,in proportions varying for Adelie penguin between´
Ž30% Green and Johnstone, 1988; Puddicombe and.Johnstone, 1988, both in Cooper and Whoeler, 1994
Žand 100% Emison, 1968; Volkman et al., 1981,.both in Croxall, 1984 to ApredominantB prey for

( )C.R. JoirisrJournal of Marine Systems 27 2000 267–276276
Ž .crabeater seal Kooyman, 1981 and for minke whaleŽ .Stewart and Leatherwood, 1985 . For the baleenwhales, our data must be considered as underesti-mates, since daily food intake was calculated on ayear basis, while they are known to consume muchmore food during summer in polar regions thanduring winter in tropical waters. The same is true forthe crabeater seal, since no correction was appliedfor taking their daily hauling out rhythm into ac-count: our values obviously underestimate the actualseal populations in pack-ice. The high density onseabirds and marine mammals in close pack-ice mustreflect the abundance of krill, and thus its highproduction, under the pack-ice. The existence ofsignificant phytoplankton and krill biomasses underthe pack-ice was already detected, e.g. by underwater pictures, but remain very difficult to quantify,due to the difficulty of in situ determination ofbiomass, not to mention production. The data onwarm-blooded predators provide a minimum evalua-
Žtion of these productions obviously, predators can-not consume more that what is produced at the lower
.trophic levels , and thus reflect the existence ofmuch higher primary and secondary productions un-der the Antarctic pack-ice than under the Arctic one.
Acknowledgements
I am very grateful to Dirk Van Speybroeck,APNA, VUB, for support in applying the clusteranalysis.
References
Cooper, J., Whoeler, E.J., 1994. Consumption of Antarctic krillŽ .Euphausia superba by seabirds during summer in the Prydz
Ž .Bay region, Antarctica. In: El-Sayed, Z. Ed. , Southern OceanEcology: The Biomass Perspective. Cambridge Univ. Press,pp. 247–260.
Ž .Croxall, J.P., 1984. Seabirds. In: Laws, R.M. Ed. , AntarcticEcology vol. 2, pp. 533–620.
Hunt, G.L. Jr., Croxall, J.P., Trathan, P.N., 1994. Marine ornithol-ogy in the southern Drake Passage and Bransfield Starit during
Ž .the BIOMASS Programme. In: El-Sayed, Z. Ed. , SouthernOcean Ecology: The Biomass Perspective. Cambridge Univ.Press, pp. 231–246.
Joiris, C., 1976. Seabirds seen during a return voyage fromBelgium to Greenland in July. Gerfaut 66, 419–440.
Joiris, C., 1978. Seabirds recorded in the North Sea in July: theecological implications of their distribution. Gerfaut 68, 419–440.
Joiris, C.R., 1991. Spring distribution and ecological role ofseabirds and marine mammals in the Weddell Sea, Antarctica.Polar Biol. 11, 415–424.
Joiris, C.R., 1992. Summer distribution and ecological role ofseabirds and marine mammals in the Norwegian and Green-
Ž .land seas June 1988 . J. Mar. Syst. 3, 73–89.Joiris, C., 1996. At-sea distribution of seabirds and marine mam-
mals around Svalbard, summer 1991. Polar Biol. 16, 423–429.Joiris, C., Tahon, R., 1992. Distribution and food intake of
seabirds and marine mammals in the Norwegian and Green-Ž . Ž .land seas July 1988 . R. Acad. Overseas Sci. Brussels ,
113–133.Joiris, C., Billen, G., Lancelot, C., Daro, M.H., Mommaerts, J.P.,
Bertels, A., Bossicart, M., Nijs, J., Hecq, J.H., 1982. A budgetof carbon cycling in the Belgian coastal zone: relative roles ofzooplankton, bacterioplankton and benthos in the utilization ofprimary production. Neth. J. Sea Res. 16, 260–275.
Joiris, C.R., Tahon, J., Holsbeek, L., Vancauwenberghe, M.,1996. Seabirds and marine mammals in the eastern BarentsSea: late summer at-sea distribution and calculated food in-take. Polar Biol. 16, 245–256.
Joiris, C.R., Kampp, K., Tahon, J., Møbjerg Kristensen, R., 1997.Summer distribution of seabirds in the North–East Waterpolynya, Greenland. J. Mar. Syst. 13, 51–59.
Knox, G.A., 1994. The Biology of the Southern Ocean. Cam-bridge Univ. Press, 444 pp.
Kooyman, G.L., 1981. Crabeater seal. In: Ridgway, S.H., Harri-Ž .son, R. Eds. , Handbook of Marine Mammals, vol. 2, pp.
221–236.Ž .Laws, R.M. Ed. , Antarctic Ecology, vol. 2, Academic Press,
New York, 850 pp.Stewart, B.S., Leatherwood, S., 1985. Minke whale. In: Ridgway,
Ž .S.H., Harrison, R. Eds. , Handbook of Marine Mammals, vol.3, pp. 91–136.
Tasker, M.L., Jones, P.H., Dixon, T.J., Blake, B.F., 1984. Count-ing seabirds at sea from ships: a review of methods employedand a suggestion for a standardised approach. Auk 101, 567–577.
Treguer, P., Jacques, G., 1992. Dynamics of nutrients and phyto-´plankton, and fluxes of carbon, nitrogen and silicon in theAntarctic Ocean. Polar Biol. 12, 149–162.
van Franeker, J.A., 1992. Top predators as indicators for ecosys-tem events in the confluence zone and marginal ice zone ofthe Weddell and Scotia seas, Antarctica, November 1988 to
Ž .January 1989 EPOS Leg 2 . Polar Biol. 12, 93–102.Wildi, O., Orloci, L., 1980. Management and multivarite analysis
of vegetation data. Swiss Fed. Inst. of Forestry Res., ReportNo. 215, 68 pp.