Embed Size (px)
Citation preview

THE QUARTERLY JOURNAL OF THE GEMOLOGICAL INSTITUTE OF AMERICA
SU
MM
ER2006
PA
GES
95–204V
OLU
ME
42N
O.2
VOLUME XLII SUMMER 2006
GEM
S & G
EMO
LOG
Y
LA-ICP-MS in GemologyThe Cullinan Diamonds
Zircon in Heated SapphireFaceting Rhodonite

®
Carat Points
pg. 121
VOLUME 42, NO. 2Summer 2006
95
120
134
151
98
97
159
160
189
169
192
204
REGULAR FEATURES _____________________Thank You, Donors
Lab Notes
• Bone pendant • Diamonds with circular radiation stains • Diamond with intensegraining • Coated pink diamonds • Diamond with unusual etch channel • Diamondwith sapphire inclusions • Imitation Melo “pearls” • Moonstone imitations
Gem News International
• Alaskan amber • Iridescent andradite from Mexico • Star emeralds • Euclasefrom Colombia • Color-change fluorite • Herderite from Pakistan • Jeremejevitefrom Myanmar and Sri Lanka • Pink opal from Peru • Prehnite from Australiaand Mali • Unusual sapphire inclusions • Sillimanite resembling moonstone •Sphene from Afghanistan • Uvite-dravite tourmaline from Tanzania • Triploiditefrom China • Väyrynenite from Afghanistan • Diffusion-treated synthetic sap-phire • Lead glass–filled ruby bead necklace
Book Reviews
Gemological Abstracts
The Last Page: A Colored Diamonds Chronology
EDITORIAL _____________GIA Celebrates 75 Years . . . Alice S. Keller
LETTERS _______FEATURE ARTICLES _____________
Applications of Laser Ablation–Inductively Coupled Plasma–Mass Spectrometry (LA-ICP-MS) to GemologyAhmadjan Abduriyim and Hiroshi Kitawaki
Summarizes the principles of this powerful technique and examines its useful-ness for detecting Be-diffusion treatment and determining locality of origin.
The Cullinan Diamond Centennial: A History and Gemological Analysis of Cullinans I and II Kenneth Scarratt and Russell Shor
Offers previously undocumented details about the largest gem diamond everfound, as well as two of the famous diamonds that were cut from it.
The Effects of Heat Treatment on Zircon Inclusions In Madagascar SapphiresWuyi Wang, Kenneth Scarratt, John L. Emmett, Christopher M. Breeding, and Troy R. Douthit
Documents the alteration of zircon inclusions during heat treatment of sapphires at different temperatures.
NOTES & NEW TECHNIQUES _____________Faceting Transparent Rhodonite from Broken Hill, New South Wales, AustraliaPaul W. Millsteed
Presents a technique for faceting transparent rhodonite.
pg. 170
pg. 163
pg. 116

Editor-in-ChiefAlice S. [email protected]
Managing EditorThomas W. [email protected]
Technical EditorSally Magañ[email protected]
Consulting EditorCarol M. Stockton
Contributing EditorJames E. Shigley
EditorBrendan M. LaursThe Robert Mouawad Campus5345 Armada DriveCarlsbad, CA 92008(760) [email protected]
Associate EditorStuart [email protected]
Circulation CoordinatorDebbie Ortiz(760) 603-4000, ext. [email protected]
Editors, Lab NotesThomas M. Moses Shane F. McClure
Editor, Gem News InternationalBrendan M. Laurs
Editors, Book ReviewsSusan B. JohnsonJana E. Miyahira-SmithStuart Overlin
Editors, Gemological AbstractsBrendan M. LaursThomas W. Overton
EDITORIALSTAFF
SUBSCRIPTIONS
MANUSCRIPTSUBMISSIONS
COPYRIGHTAND REPRINTPERMISSIONS
Subscriptions to addresses in the U.S. are priced as follows: $74.95 for one year (4 issues), $194.95 for three years (12 issues).Subscriptions sent elsewhere are $85.00 for one year, $225.00 for three years. Canadian subscribers should add GST.Special rates are available for GIA alumni and current GIA students. One year: $64.95 to addresses in the U.S., $75.00 else-where; three years: $179.95 to addresses in the U.S., $210.00 elsewhere. Please have your student or Alumni number readywhen ordering. Go to www.gia.edu or contact the Circulation Coordinator.Single copies of this issue may be purchased for $19.00 in the U.S., $22.00 elsewhere. Discounts are given for bulk orders of 10or more of any one issue. A limited number of back issues are also available for purchase. Please address all inquiries regardingsubscriptions and single copy or back issue purchases to the Circulation Coordinator (see above) or visit www.gia.edu.To obtain a Japanese translation of Gems & Gemology, contact GIA Japan, Okachimachi Cy Bldg., 5-15-14 Ueno, Taitoku, Tokyo 110, Japan. Our Canadian goods and service registration number is 126142892RT.
Gems & Gemology welcomes the submission of articles on all aspects of the field. Please see the Guidelines for Authors on ourWebsite, or contact the Managing Editor. Letters on articles published in Gems & Gemology are also welcome.
Abstracting is permitted with credit to the source. Libraries are permitted to photocopy beyond the limits of U.S. copyright lawfor private use of patrons. Instructors are permitted to photocopy isolated articles for noncommercial classroom use without fee.Copying of the photographs by any means other than traditional photocopying techniques (Xerox, etc.) is prohibited without theexpress permission of the photographer (where listed) or author of the article in which the photo appears (where no photographeris listed). For other copying, reprint, or republication permission, please contact the Managing Editor.Gems & Gemology is published quarterly by the Gemological Institute of America, a nonprofit educational organizationfor the gem and jewelry industry, The Robert Mouawad Campus, 5345 Armada Drive, Carlsbad, CA 92008.Postmaster: Return undeliverable copies of Gems & Gemology to The Robert Mouawad Campus, 5345 Armada Drive,Carlsbad, CA 92008. Any opinions expressed in signed articles are understood to be the opinions of the authors and not of the publisher.
Shigeru AkamatsuTokyo, Japan
Alan T. CollinsLondon, United Kingdom
G. Robert CrowningshieldNew York, New York
John EmmettBrush Prairie, Washington
Emmanuel Fritsch Nantes, France
Henry A. HänniBasel, Switzerland
A. J. A. (Bram) JansePerth, Australia
Alan JobbinsCaterham, United Kingdom
Mary L. JohnsonSan Diego, California
Anthony R. KampfLos Angeles, California
Robert E. KaneHelena, Montana
Thomas M. MosesNew York, New York
George RossmanPasadena, California
Kenneth ScarrattBangkok, Thailand
James E. ShigleyCarlsbad, California
Christopher P. SmithNew York, New York
Christopher M. WelbournReading, United Kingdom
PRODUCTIONSTAFF
EDITORIALREVIEW BOARD
Art Director Production Assistant Website: Karen Myers Allison DeLong www.gia.edu
Locality of origin has long been a major element of colored stone valuation in some markets, but as the number of gem locali-ties expands, determining origin requires ever-more-advanced gemological expertise. The lead article in this issue reviews theapplications of laser ablation–inductively coupled plasma–mass spectrometry to gemology, among them locality determina-tion for emeralds.
Shown here is a magnificent Colombian emerald and diamond necklace with matching earrings, designed by JeanSchlumberger for Tiffany & Co. in the 1950s. The three large emeralds in the necklace are 6.65–7.41 ct; the emeralds in theearrings are 3.27 and 4.03 ct. Jewelry courtesy of a private collector; photo © Harold & Erica Van Pelt.
Color separations for Gems & Gemology are by Pacific PreMedia, Carlsbad, California. Printing is by Allen Press, Lawrence, Kansas.
© 2006 Gemological Institute of America All rights reserved. ISSN 0016-626X
ABOUTTHE COVER
®

• Diamond cut, the most complex of the 4 Cs, hasbeen the subject of extensive research at theInstitute. January 1 saw the introduction of the GIADiamond Cut Grading system for standard roundbrilliant cut diamonds in the D-to-Z color range.To familiarize the industry with the techniques andterminology of the new system, free seminars havebeen conducted in cities worldwide. The entire“GIA on Diamond Cut” series of research articles isavailable at www.gia.edu/research, and all threeG&G diamond cut articles can be downloaded freeat www.gia.edu/gemsandgemology.
• Several other research efforts continue, such as identi-fying the latest generation of synthetic diamonds anddetecting beryllium diffusion in a range of corundumcolors. These studies are aimed at protecting publicconfidence in the industry, and the Institute’sresearchers routinely present their results in journalsand at conferences throughout the world.
• In February, the GIA Laboratory expanded its identifi-cation services so that rubies, sapphires, and alexan-drites—in addition to emeralds—now receive theirown gem-specific reports. In response to increasingly
sophisticated techniques for enhancing colored stones,the updated reports contain detailed information onany treatments that have been applied.
• GIA Education is constantly updating its core dia-mond, colored stones, and jewelry manufacturingarts programs—most recently, a major revision ofits Gem Identification course. This October, theGIA School of Business will launch a college-leveldegree program, culminating in a Bachelor ofBusiness Administration (BBA) diploma, whichwill further raise the academic profile of gemologyand the jewelry industry.
• On the international front, the Institute now hascampuses in nine countries, with the Dubai campusscheduled to open in 2007.
• The Institute provides complimentary access tomany informative resources, including: The Loupe,the news magazine for the industry; the GIA Insider,the Institute’s biweekly electronic newsletter; and theonline tutorials “How to Buy a Diamond” and“How to Buy a Gemstone.” The G&G section of thewebsite (www.gia.edu) includes a data depository,
his year marks GIA’s 75th anniversary, an appropriate occasion to celebrate the Institute’s manyaccomplishments over the decades. The more than 300,000 students who have completed itseducational programs. The creation in 1953 of the International Diamond Grading System™,
the industry standard for analyzing polished diamonds. The gemological instruments and researchdiscoveries it has fostered.
Yet GIA’s diamond anniversary is also an appropriate time to take stock of its service mission and con-sider the age-old question, “What have you done for me lately?”
EDITORIAL GEMS & GEMOLOGY SUMMER 2006 95
T

several free article downloads, and the entire set ofback issues from 1934 through 1980.
• The Richard T. Liddicoat Gemological Library andInformation Center, located at GIA’s Carlsbad head-quarters, serves as the repository of gemologicalknowledge for the public and members of the trade.The Library’s growing collection of some 38,000books, 300 periodicals, and 1,000 videos are avail-able for on-site research. Just e-mail [email protected] assistance from the Library’s helpful staff.
• The constantly expanding GIA Museum in Carlsbadhouses an extensive collection of gems and jewelry,making it a valuable educational resource for theInstitute’s students and the public. Some samplesmay be loaned for nondestructive research.Scheduled tours of the museum’s galleries are avail-able on weekdays, and admission is free (to schedulea tour, call 760-603-4116).
• The Institute’s career services department supportsjobseekers and employers by maintaining a free
database of jobs available in the gem and jewelryindustry. In addition, GIA students and graduatesare eligible to receive free career preparation assis-tance. Two annual GIA Jewelry Career Fairs—inNew York in July and Carlsbad in October—matchjobseekers with companies and offer one-on-onecareer coaching, at no cost to attendees (e-mail [email protected]).
• Over the years, through the generous support of theindustry, GIA has awarded hundreds of scholarships todeserving students. In 2004 and 2005 alone, 54 schol-arships were awarded for a total of over $196,000.
• With more than 30 chapters worldwide, the GIAAlumni Association provides an important vehiclefor continuing education as well as communication.
• And, of course, Gems & Gemology, which now goesto subscribers in more than 100 countries world-wide, continues to receive most of its funding direct-ly from GIA, as part of the Institute’s mission toserve the industry and the gem-buying public.
96 EDITORIAL GEMS & GEMOLOGY SUMMER 2006
Alice S. KellerEditor-in-Chief
I do not normally use this forum to talk about GIA, as G&G is a technical journal for and about the entire gemologicalcommunity. But without GIA, there would be no Gems & Gemology, just as there would be no International DiamondGrading System, no Graduate Gemologist diploma, and no Richard T. Liddicoat Gemological Library. That’s animportant message to share as the Institute celebrates 75 years of service.
So, what have you done for us lately, GIA? More than we can say.
LETTERS GEMS & GEMOLOGY SUMMER 2006 97
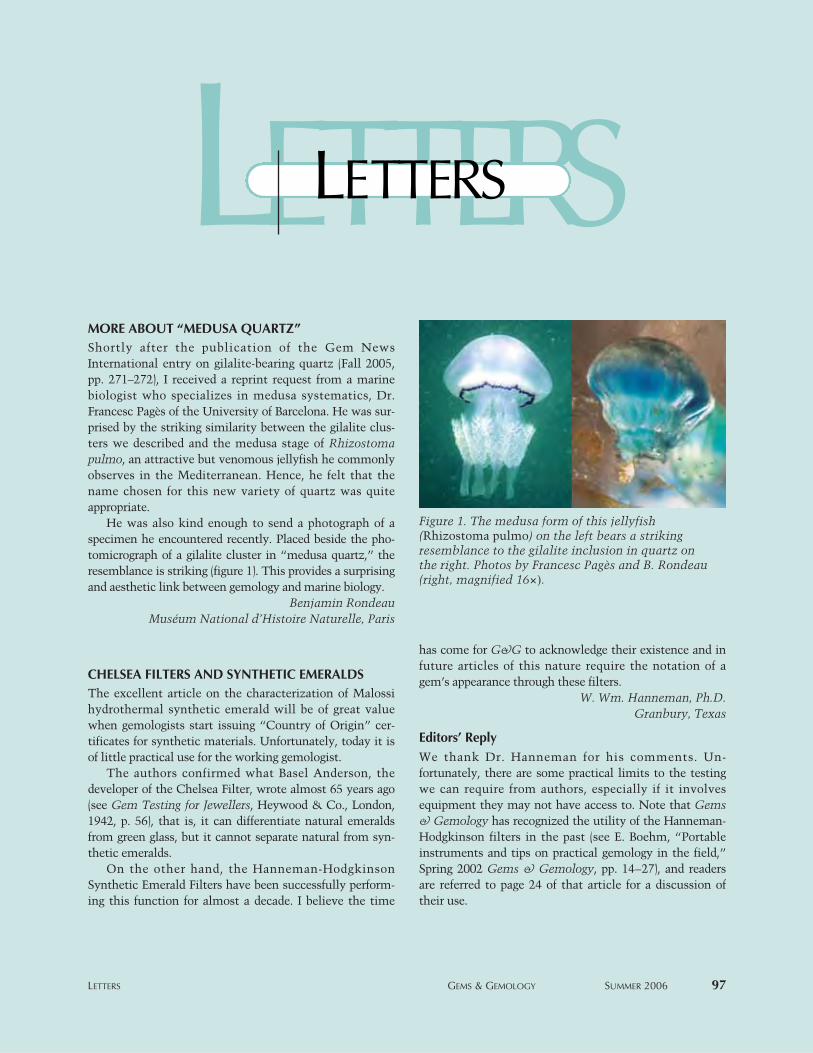
MORE ABOUT “MEDUSA QUARTZ”Shortly after the publication of the Gem NewsInternational entry on gilalite-bearing quartz (Fall 2005,pp. 271–272), I received a reprint request from a marinebiologist who specializes in medusa systematics, Dr.Francesc Pagès of the University of Barcelona. He was sur-prised by the striking similarity between the gilalite clus-ters we described and the medusa stage of Rhizostomapulmo, an attractive but venomous jellyfish he commonlyobserves in the Mediterranean. Hence, he felt that thename chosen for this new variety of quartz was quiteappropriate.
He was also kind enough to send a photograph of aspecimen he encountered recently. Placed beside the pho-tomicrograph of a gilalite cluster in “medusa quartz,” theresemblance is striking (figure 1). This provides a surprisingand aesthetic link between gemology and marine biology.
Benjamin RondeauMuséum National d’Histoire Naturelle, Paris
CHELSEA FILTERS AND SYNTHETIC EMERALDSThe excellent article on the characterization of Malossihydrothermal synthetic emerald will be of great valuewhen gemologists start issuing “Country of Origin” cer-tificates for synthetic materials. Unfortunately, today it isof little practical use for the working gemologist.
The authors confirmed what Basel Anderson, thedeveloper of the Chelsea Filter, wrote almost 65 years ago(see Gem Testing for Jewellers, Heywood & Co., London,1942, p. 56), that is, it can differentiate natural emeraldsfrom green glass, but it cannot separate natural from syn-thetic emeralds.
On the other hand, the Hanneman-HodgkinsonSynthetic Emerald Filters have been successfully perform-ing this function for almost a decade. I believe the time
has come for G&G to acknowledge their existence and infuture articles of this nature require the notation of agem’s appearance through these filters.
W. Wm. Hanneman, Ph.D.Granbury, Texas
Editors’ ReplyWe thank Dr. Hanneman for his comments. Un-fortunately, there are some practical limits to the testingwe can require from authors, especially if it involvesequipment they may not have access to. Note that Gems& Gemology has recognized the utility of the Hanneman-Hodgkinson filters in the past (see E. Boehm, “Portableinstruments and tips on practical gemology in the field,”Spring 2002 Gems & Gemology, pp. 14–27), and readersare referred to page 24 of that article for a discussion oftheir use.
LETTERSLETTERS
Figure 1. The medusa form of this jellyfish(Rhizostoma pulmo) on the left bears a strikingresemblance to the gilalite inclusion in quartz onthe right. Photos by Francesc Pagès and B. Rondeau(right, magnified 16×).

98 APPLICATIONS OF LA-ICP-MS TO GEMOLOGY GEMS & GEMOLOGY SUMMER 2006
n recent years, gemologists worldwide have faceda variety of new treatments, synthetics and simu-lants, and gem sources that have caused confusion
in the trade. Several techniques—including UV-visi-ble, infrared, and Raman spectral analysis—havebeen employed to solve some of these problems.However, each of these techniques has limitations,and even in combination they have not been entire-ly successful in addressing all of these challenges.Now, chemical analysis by laser ablation–inductivelycoupled plasma–mass spectrometry (LA-ICP-MS)has emerged as a powerful tool for gemologists.
ICP-MS has been used for decades to chemicallycharacterize materials, but historically this tech-nique has required dissolving solid samples in strongacids prior to analysis. The use of laser ablation withICP-MS was developed by Gray (1985) and becamecommercially available in the early- to mid-1990s.Combined with the development of extremely sen-sitive mass spectrometers, laser ablation allowedICP-MS to be used on gemstones with minimaldamage, since the laser vaporizes only a microscop-
ic amount of the sample for analysis. Additionaladvantages include a high spatial resolution (just afew micrometers), low detection limits, and highprecision and accuracy. This technique is also partic-ularly attractive to scientists who want to studymicro-spatial distributions of trace elements and iso-topic compositions, from light (helium) to heavy(uranium). In addition, the analysis is rapid and nosample preparation is required. As a result, LA-ICP-MS has become one of the most exciting instru-ments in gemology, geology, and materials science.
LA-ICP-MS analyses provide quantitative data formajor, minor, and trace elements in the analyzedsamples, from which variation diagrams and “chem-ical element fingerprints” can be established. Suchfingerprinting can reveal differences between sam-ples that may be attributed to the geographic origin of
I
APPLICATIONS OF LASERABLATION–INDUCTIVELY COUPLED
PLASMA–MASS SPECTROMETRY(LA-ICP-MS) TO GEMOLOGY
Ahmadjan Abduriyim and Hiroshi Kitawaki
See end of article for About the Authors and Acknowledgments.GEMS & GEMOLOGY, Vol. 42, No. 2, pp. 98–118.© 2006 Gemological Institute of America
Laser ablation–inductively coupled plasma–mass spectrometry (LA-ICP-MS) is an importanttechnique for quantitative chemical analysis. The authors have applied this minimallydestructive technique to gemology to take advantage of its high spatial resolution, rapid anddirect analysis of gemstones (whether loose or mounted), and precise measurement of a widerange of elements—even in ultra-trace amounts. This article summarizes LA-ICP-MS princi-ples and describes the successful application of this technique to detecting beryllium diffu-sion treatment in corundum and identifying the geographic origin of emeralds. LA-ICP-MS issignificantly less expensive than SIMS and more sensitive than LIBS, which is the least costlyof the three instruments.

the sample or subsequent treatment. An introduc-tion to the potential use of this method in gemologywas reported by Günther and Kane (1999a,b). Due tothe high cost of the instrumentation and the micro-destructive nature of the method, gemologists wereslow to explore its full range of applications. At thistime, however, the Gemmological Association of AllJapan (GAAJ, in Tokyo), Gemological Institute ofAmerica (GIA, in Carlsbad), Central Gem Laboratory(CGL, in Tokyo), and Tiffany & Co.’s Merchandiseand Testing Laboratory (in New Jersey) all have LA-ICP-MS systems for gemstone analysis (as well asother applications, such as metals testing). Othergemological labs use LA-ICP-MS systems at nearbyuniversities. For example, the Gübelin Gem Lab(Lucerne, Switzerland), the GRS GemresearchSwisslab (Lucerne), and the SSEF Swiss Gem-mological Institute (Basel) have access to the LA-ICP-MS facilities at the Swiss Federal Institute ofTechnology (ETH) Laboratory in Zurich.
LA-ICP-MS has been applied to a variety of topicsin earth sciences (see, e.g., Hirata and Nesbitt, 1995;Jeffries et al., 1995; Jackson et al., 2001; Norman,2001) and archeology (e.g., Pollard and Heron, 1996;Devos et al., 2000; Tykot, 2002). However, publica-tions on the application of LA-ICP-MS to gem materi-als were uncommon until relatively recently (Watlinget al., 1995; Günther and Kane, 1999a,b; Guillong andGünther, 2001; Rankin et al., 2003; Saminpanya et al.,2003; Wang et al., 2003; Abduriyim and Kitawaki,2006).
In this article, we will examine two areas inwhich LA-ICP-MS can be particularly useful: detect-ing new treatments and determining the geographicorigin of gemstones (using the specific example ofemeralds).
Detection of New Treatments. Toward the end of2001, unprecedented amounts of saturated orange-pink to pinkish orange sapphires (the so-called pad-paradscha colors), as well as yellow sapphires, becamewidely available on the worldwide jewelry market(Scarratt, 2002; Shida et al., 2002; see figure 1). Manystudies subsequently revealed that beryllium (Be) hadbeen diffused into the sapphires at high temperatures,with the Be originating from chrysoberyl (see, e.g.,Emmett et al., 2003, and references cited therein).Because beryllium is a “light” (i.e., low atomicweight) element, trace levels of Be cannot be detectedby most analytical techniques, including energy-dis-persive X-ray fluorescence (EDXRF), energy-dispersivespectroscopy with a scanning electron microscope(SEM-EDS), and, in some cases, electron-microprobeanalysis (EMPA). Secondary ion mass spectrometry(SIMS) has proved successful in detecting traceamounts of Be, but analyses are extraordinarily expen-sive (see, e.g., Emmett et al., 2003; Novak et al., 2004).For this reason, the present authors focused theirattention on LA-ICP-MS. Since May 2003, GAAJ hasoffered an identification service for Be-diffused heat-treated corundum, using LA-ICP-MS. Recently, aless expensive instrument, laser-induced breakdown
APPLICATIONS OF LA-ICP-MS TO GEMOLOGY GEMS & GEMOLOGY SUMMER 2006 99
Figure 1. In late 2001,substantial numbers ofberyllium diffusion–treated sapphires enteredthe gem trade, spurring aneed for proper identifi-cation. Shown here are acollection of loose andmounted beryllium-dif-fused sapphires (themounted stones includesome untreated sap-phires). The bracelet andearrings are courtesy ofMichael Couch &Assocs.; the loose sap-phires are courtesy ofDeepam Inc. and RobertE. Kane. Photo byHarold & Erica Van Pelt.

spectroscopy (LIBS), has been applied to this problem,but it has some limitations, as discussed below.
Geographic Origin Determination. Geographic ori-gin is an important consideration for many gemmaterials in some markets. Within Japan in particu-lar, geographic origin may be a critical factor in thesale of major gems such as corundum, emerald, tour-maline, alexandrite, and opal. However, withoutreliable and detailed analytical data, determinationof origin may be difficult, if not impossible. Even themost experienced laboratories regard origin determi-nations as opinions based largely on the experience,literature, and/or data collected by that laboratory.Thus, there is a need for origin determinations basedon a more rigorous scientific foundation.
BACKGROUNDChemical Analysis of Gem Materials. EDXRF andSEM-EDS are the standard methods used in gemolog-ical laboratories for the nondestructive qualitative(and possibly quantitative) chemical analysis of gemmaterials (see, e.g., Stockton and Manson, 1981; Sternand Hänni, 1982; Muhlmeister et al., 1998). EDXRF iscapable of measuring the chemical composition of agemstone in a matter of minutes, by detecting theenergy of emitted X-rays that are produced when thesample is exposed to an X-ray beam. With SEM-EDS,an electron beam scans across the specimen’s surface,producing signals from secondary or backscatteredelectrons that can be used to produce a high-resolutionimage. In addition, X-rays emitted from the samplecan reveal its chemical composition. Using an attach-ment for energy-dispersive spectroscopy, a more pre-cise chemical composition can be obtained with theSEM at high spatial resolution. Although both EDXRFand SEM-EDS are limited in their detection and meas-urement of light elements, when combined with otheranalytical methods such as UV-Vis spectroscopy, theycan identify some trace elements that provide usefulinformation on the geologic occurrence, geographicorigin, and causes of color in gem materials.
EMPA is another well-established method beingused in gemology (Dunn, 1977). This technique usesa high-energy focused beam of electrons to generateX-rays characteristic of the elements within a sam-ple. It can provide quantitative analyses of elementsranging from beryllium (in some cases) to uranium,at levels as low as 100 parts per million (ppm or µg/g,which are fractional weights). Thus far, this is theonly fully quantitative technique that is nondestruc-
tive. Unfortunately, EMPA is not useful for analyz-ing beryllium in diffused corundum, since Be is pres-ent in amounts that are below the detection limit ofthe instrument.
SIMS is a powerful micro-destructive techniquefor chemical analysis of a wide variety of solid mate-rials (Benninghoven et al., 1987). A beam of primaryions such as oxygen or argon is focused on the sam-ple, causing a very small amount of the surface to besputtered. A portion of the sputtered atoms are ion-ized and extracted using an electrical field. The ion-ized atoms are then filtered according to their ener-gy and mass by an electrostatic sector and a magnet-ic field, at which point they go to a mass spectrome-ter for isotopic analysis. This technique can providesensitivities near parts per billion (ppb or ng/g) for allelements from hydrogen to uranium. However, it isonly available in some universities and research lab-oratories due to its high cost and sophisticated oper-ating requirements.
LIBS can detect a full range of major, minor, andtrace elements simultaneously (see, e.g., García-Ayuso et al., 2002), and its low cost and easy opera-tion have attracted the interest of several gem labora-tories. A single-pulse high-energy Nd:YAG 1064 nmlaser is used to vaporize a microscopic area of a sam-ple at high temperature (i.e., >5000°C–10,000°C), andthe sputtered particles are broken down into a mix-ture of atoms, ions, and electrons. After the laserpulse has ended, excited electrons in the atoms dropdown to a low energy level and discharge light. Bydetecting the wavelength and strength of this emis-sion with a high-resolution fiber-optic spectrometer,optical emission spectra can be generated that maythen be converted to qualitative and semiquantita-tive chemical data. However, precise quantitativeanalyses cannot be obtained with this technique(Krzemnicki et al., 2004; Themelis, 2004).
LA-ICP-MS Instrumentation. The LA-ICP-MS analy-sis process can be thought of in two main parts: sam-pling (i.e., laser ablation and ionization in a plasma)and mass spectrometry. While mass spectrometryhas been well developed for many decades, the sam-pling techniques of laser ablation and inductivelycoupled plasma were developed more recently.
Mass Spectrometry. Following J. J. Thomson’s use ofelectromagnetic fields to separate ions for analysis(Thomson, 1911), scientists such as Dempster (1918),Aston (1919), and Stephens (1946) developed thistechnique into what it is today, a highly sensitive
100 APPLICATIONS OF LA-ICP-MS TO GEMOLOGY GEMS & GEMOLOGY SUMMER 2006

method capable of analyzing both chemical elementsand small organic molecules. Early mass spectrome-ters required that the sample be in a gaseous state,but developments over time have expanded the appli-cability of mass spectrometry to include solutionsand solids. A mass spectrometer is an instrumentthat measures the masses of elements or moleculesof chemical compounds by separating charged parti-cles according to their mass-to-charge ratio (m/z; inmost cases, the value of z = +1). The sample is ionizedand the ions are electrostatically directed into a massanalyzer, where they are separated according to theirm/z ratio and then sent to a detector (figure 2). Aspectrum is then generated that represents the mass-es of components of a sample.
The most popular mass spectrometer used inICP-MS is the quadrupole mass analyzer (figure 3),which consists of four parallel metal rods arranged ina square. Each pair of opposite rods has a combinedAC and DC electrical potential. When the DC andAC voltages are set to certain values, only ions witha specific m/z ratio are able to continue on a pathbetween the rods. By sequentially selecting manycombinations of voltages, the technician can detectan array of different ions. Semi-quantitative meas-urements of the mass spectrum or isotope ratios areobtained by measuring the intensities of the ionspassing through the quadrupole mass analyzer as thevoltages on the rods are varied.
Inductively Coupled Plasma. In the 1980s, inductive-ly coupled plasma at atmospheric pressure was devel-oped as a technique for ionizing samples. The sample(in solution or vaporized using a laser ablation system)is conveyed in a flow of argon gas into a torch that isinductively heated to approximately 10,000°C. At thistemperature almost all matter in the sample is atom-ized and ionized, forming a plasma that provides a richsource of both excited and ionized atoms (Jarvis et al.,1992). With the combination of ICP and MS technolo-gies, rapid quantitative elemental analysis with highaccuracy and low detection limits became possible.
Laser Ablation. The combination of laser ablationwith ICP-MS has been widely used for multi-ele-mental determination and in situ isotopic analysis ofsolid materials (Gray, 1985; Arrowsmith, 1987). Inthe laser ablation process, the sample is placed in theablation cell (which does not need to be under vacu-um), and a minute portion of its surface is vaporizedusing a pulsed high-energy laser beam that is direct-ed through the objective lens of a modified petro-graphic microscope. The surface of the sample isviewed with a charge-coupled device (CCD) cameramounted on the microscope, allowing for preciselocation of the laser spot. The laser pulses causeenergetic atoms, ions, molecules, and solid particlesto be ejected from the target, and these ablatedaerosols are transported in argon or helium gas to the
APPLICATIONS OF LA-ICP-MS TO GEMOLOGY GEMS & GEMOLOGY SUMMER 2006 101
Figure 2. This chart shows how a mass spectrum is obtained from a sample. Gaseous molecules of the sam-ple (A) are ionized to form gaseous ions (B). The ions are separated according to their mass-to-charge ratiowhen they pass through a mass analyzer (C) to the detector (D). A computer (E) transforms the signal fromeach element into a spectrum, which is displayed on the screen (F).

plasma of the ICP-MS. Helium is typically used asthe carrier gas in the sample cell, and is combinedwith Ar in the tubing that leads to the ICP. Duringthe ablation process, less material is left around thelaser spot crater when using He as compared to Ar,so more of the sample can be transferred to the ICP,leading to a higher-intensity, more stable signal(Günther and Heinrich, 1999). Two types of laserhave been widely used for ablating minerals or glassymaterials: (1) an argon fluoride (ArF) excimer laserwith a wavelength of 193 nm (Loucks et al., 1995;Günther et al., 1997; Horn et al., 2000), and (2) aNd:YAG 1064 nm (infrared) laser that is frequency-multiplied to UV wavelengths (fourth harmonic at266 nm and fifth harmonic at 213 nm; Jenner et al.,1993; Jeffries et al., 1998).
Data Quality Considerations. A mass spectrumconsists of a series of peaks representing the distri-bution of components (atoms or molecules) bymass-to-charge ratio. The relative intensities of thevarious isotopes in the spectrum provide a semi-quantitative chemical analysis (Tye et al., 2004). Toproduce quantitative data, the analysis of a samplemust be calibrated against an external standard ofknown composition, that is, by measuring the sig-nals for the elements of interest in the sample and
comparing them to the signals from a standard withknown concentrations of those elements. Severalcalibration strategies have been developed for quan-tification of LA-ICP-MS analyses, including thoseusing solid standards (glass, ceramic, cement, andmetals) and those using standard solutions (Kanickyand Mermet, 1999). In general, the use of matrix-matched standards (e.g., a corundum standard foranalyzing sapphires) is advantageous, because theablation behavior will be similar for both the stan-dard and the sample. However, in many cases thisapproach is limited by a lack of suitable materials.For example, NIST (National Institute of Standardsand Technology) glass is widely used as an externalstandard for successfully analyzing the trace-ele-ment contents of silicates and carbonates. However,the matrix of simple oxide minerals (e.g., corun-dum) is much different from the NIST glass.Variation in these matrices can give rise to inconsis-tencies in ionization efficiency, which will createdifferences in the signal of a given element in thosematerials (even if they contain identical concentra-tions of the element).
To obtain accurate quantitative chemical datafor gem corundum, the external standard shouldconsist of a well-characterized homogenous sampleof ultra-pure synthetic corundum that has been
102 APPLICATIONS OF LA-ICP-MS TO GEMOLOGY GEMS & GEMOLOGY SUMMER 2006
Figure 3. This schematic diagram shows the components of a 213 nm Nd:YAG laser ablation system combinedwith a quadrupole ICP-MS instrument. The sample is placed in the ablation cell and the laser beam is focusedonto the sample with the help of a CCD camera. The ablated material forms an aerosol, which is transportedby an argon or helium carrier gas to the plasma of the ICP-MS. At the ICP, laser-ablated particles are vaporizedand ionized. The ions are extracted by the vacuum interface and guided into the mass analyzer, where they areseparated by their mass-to-charge ratio and finally detected.

doped with the element(s) of interest. However, ifsuch a standard is not available, an internal elementstandard may be used to correct the analyzed sig-nals. In this procedure, the concentration of Al inthe sample is measured using another quantitativetechnique, such as EMPA. Calibration for other ele-ments in the sample can then be achieved by com-paring the LA-ICP-MS signal for Al obtained froman external NIST glass standard to that obtainedfrom the specimen.
MATERIALS AND METHODSFor our investigations of beryllium diffusion–treatedcorundum, we used LA-ICP-MS to analyze a total of121 faceted natural and synthetic rubies and sap-phires: 21 were unheated, 19 were subjected to tradi-tional heat treatment, and 81 were treated with Bediffusion and then repolished (table 1). Some of thestones treated by Be diffusion were analyzed beforeand after treatment to confirm that Be was diffusedby the process; these samples included four colorlesssapphires and four rubies, as well as eight colorlessVerneuil synthetic sapphires and two pink flux-grown synthetic sapphires. At the request of theauthors, treaters in Thailand heated the stones in acrucible together with powdered chrysoberyl to over1800°C in an oxidizing atmosphere (for 22 hours inBangkok and more than 10 hours in Chanthaburi).Samples SCL001, SCL003, VCS001, and VCS005were cut in half after Be-diffusion treatment andeight point analyses were performed by LA-ICP-MSon the cut cross-section of each sample. In addition,sample MPd-H1 was used for both LA-ICP-MS andSIMS analyses, with six point analyses across the cutcross-section.
The emeralds analyzed by LA-ICP-MS for geo-graphic origin investigations consisted of 29 facetedBrazilian stones and 82 parallel-polished slabs, cabo-chons, and faceted samples from Colombia, Nigeria,Zambia, Zimbabwe, Pakistan, and Afghanistan(table 2). Of the latter samples, 50 parallel-polishedslabs were supplied by Dr. Dietmar Schwarz; theseemeralds were purchased or collected directly fromthe mine areas. The authors acquired the other sam-ples at the Tokyo and Tucson gem fairs. The sam-ples covered the color range from light green to deepgreen. FTIR and Raman spectroscopic analysesshowed that, with only a few exceptions, the emer-alds were not filled with oil or resin. LA-ICP-MSdata for 26 elements were obtained from three dif-ferent areas on each sample. Averaged data were
used for the ranges that are reported in table 2.The LA-ICP-MS analyses were obtained with a
New Wave Research laser ablation system (using aMerchantek UP-213A/F laser) combined with aquadrupole ICP-MS instrument from Agilent(7500a series). The operating conditions of the LA-ICP-MS used for this study are indicated in table 3.Analytical sensitivity improves as the amount ofvaporized sample increases, and our researchshowed that it was advantageous to inscribe ourlogo “GAAJ” on the girdle of all specimens duringthe laser ablation process (figure 4). This allowedus to obtain good sensitivity for light elementswith the least “damage” to the sample. When test-ing for Be-diffused corundum, care was taken toavoid analyzing areas that might contain interfer-ing inclusions. This very small inscription provesthe analysis has been conducted and does notaffect the beauty of a gemstone. As with laserinscriptions that are currently performed on dia-monds, the LA-ICP-MS laser logo is barely visiblewith a 10× loupe.
Calibration was done using NIST SRM 612multi-element glass (Pearce et al., 1997), with Al asthe internal element standard (based on an averageAl2O3 concentration of 99.00%, determined byEMPA) for corundum analyses; the same NIST stan-dard was used for emerald calibration.
We monitored the signals of selected isotopes inthe corundum and emerald samples, and the concen-trations of some of these elements in the sampleswere calculated (see table 3). “Blank” samples of car-rier gas were repeatedly analyzed (10 times) at regu-lar intervals to determine the detection limit of eachelement (table 4). The higher background counts forNa, Si, Ca, and Fe were related to mass interferencefrom the sum of various elements in the air withinthe instrument—28Si (12C16O), 29Si (12C16O1H), 44Ca(12C16O2),
56Fe (40Ar16O), 57Fe (40Ar16O1H)—and/orcontamination of the system with debris from theNIST SRM 612 calcium silicate glass where, forexample, a silicon ion from the glass might bemisidentified as a corundum impurity—23Na (23Na),28Si (28Si), 43Ca (43Ca or 27Al16O), 44Ca (28Si16O), 56Fe(40Ca16O or 28Si28Si)—before the measurements weremade. Due to these possible interference problems,we monitored two isotopes each of Si, Ca, and Fe.Concentration levels in this article are described as trace elements (<10,000 ppm or <1 wt.%), minor elements (<10 wt.% or <100,000 ppm), and major elements. To facilitate comparison with the literature, some trace-element values have been
APPLICATIONS OF LA-ICP-MS TO GEMOLOGY GEMS & GEMOLOGY SUMMER 2006 103

converted to weight percent (wt.%) oxides from their simple elemental concentrations (ppm).
To compare the accuracy of our LA-ICP-MS
analyses to those obtained with SIMS, we analyzedsix points on corundum sample MPd-H1 by bothtechniques. Each point analyzed by LA-ICP-MS
TABLE 1. Corundum samples analyzed by LA-ICP-MS for Be-diffusion investigations.a
Be (ppm)
samples LA-ICP-MS LIBS SIMS
UnheatedSY001–002 2 Yellow Sri Lanka 0.23–0.76 bdl bdl naSP001–002 2 Padparadscha Sri Lanka 0.63–0.85 bdl na naEO001–002 2 Orange East Africa 0.30–1.32 bdl na naMB001–002 2 Blue Madagascar 1.23–2.12 bdl na naSCL001–003 3 Colorless Sri Lanka 0.57–0.68 bdl na naVCS001–010 10 Colorless Verneuil synthetic 0.85–1.03 bdl na na
Traditionally heatedSY003–004 2 Yellow Sri Lanka 1.56–3.87 bdl na naEO003–004 2 Orange East Africa 0.47–2.31 bdl na naMP001–004 4 Pink Madagascar 0.42–4.01 bdl na naTPL001–002 2 Purple Tanzania 0.59–2.50 bdl na naMB003–005 3 Blue Madagascar 1.56–3.52 bdl na naECC001–002 2 Color change East Africa 0.40–4.01 bdl na na
(dark purple)SCL004–005 2 Colorless Sri Lanka 0.50–0.71 bdl na naTR001–002 2 Ruby (dark red) Thailand 0.83–2.59 bdl na na
Be-diffusion treatedb
SY-H1–H8 8 Yellow Sri Lanka 0.63–2.96 1.8–8.1 Detected na(very low)c
MPd-H1–H12 12 Pinkish orange Madagascar 0.34–4.36 bdl–8.4d Detectede bdl–9.54d
EO001–003 3 Saturated orange East Africa 0.23–1.21 3.6–4.1 na naEO004–007 4 Orange East Africa 0.34–3.90 1.9–2.2 na naMP-H1–H4 4 Pink Madagascar 0.63–3.59 1.9–3.3 Detectedf naTPL-H1–H10 10 Purple Unknown 0.32–3.81 2.6–7.8 na naMB-H1–H10 10 Blue Madagascar 0.89–3.68 1.4–6.3 na naMB-H11–H16 6 Blue Australia 3.82–4.77 3.4–15 na naMB-H17–H20 4 Blue China 2.65–5.26 2.9–6.7 na naECC001 1 Dark green-purple East Africa 0.32 2.6 na naECC002 1 Dark purple East Africa 3.93 1.7 na naSCL001–002 2 Light yellow Sri Lanka 0.48–0.56 1.4–5.4 na naSCL003–004 2 Light yellow Sri Lanka 0.40–0.62 bdl–2.3 na naTR001–002 2 Ruby (bright red) Thailand 0.70–2.50 6.3–16 na naTR003–004 2 Ruby (bright red) Thailand 1.13–2.52 0.43–2.43 na naVCS001–004 4 Colorless Verneuil synthetic 0.72–0.81 1.1–5.0 na naVCS005–008 4 Colorless Verneuil synthetic 0.77–0.94 bdl–1.6 na naFPS001 1 Whitish pink Flux synthetic 0.54 4.7 na naFPS002 1 Pink Flux synthetic 0.66 0.3 na na
a All analyses were performed on the girdle of faceted stones (the Be-diffused samples were repolished after treatment). For LA-ICP-MS: External stan-dard = NIST SRM 612, internal standard = 99.00% Al2O3. For SIMS: Accuracy of Be is ±10%, detection limit is 0.01 ppm Be, external standard = Be-implanted synthetic corundum. The following samples were analyzed by LA-ICP-MS before and after Be-diffusion treatment: EO001–004,ECC001–002, SCL001–004, TR001–002, and VCS001–008. These data include one point analysis of the re-polished girdle and eight point analyses ofthe cross-sections of samples SCL001, SCL003, VCS001, and VCS005. Abbreviations: bdl=below detection limit, na=not analyzed. b Samples shown in blue were Be-diffused in Bangkok for 22 hours at 1800°C, whereas the samples shown in green were Be-diffused in Chanthaburifor approximately 10 hours. The exact conditions are not known for the Be-diffusion treatment of samples SY-H1–H8, MPd-H1–H12, MP-H1–H4, TPL-H1–H10, MB-H1–H10, MB-H11–H16, and MB-H17–H20.c Sample SY-H1 only.d Sample MPd-H1 only: six point analyses of the sample's cross-section using both LA-ICP-MS and SIMS.e Sample MPd-H10 only.f Sample MP-H4 only.
104 APPLICATIONS OF LA-ICP-MS TO GEMOLOGY GEMS & GEMOLOGY SUMMER 2006
Sample nos. No. of Description Origin Weight (ct)

consisted of a 30 µm round spot, and 10 seconds ofablation resulted in a crater about 2–3 µm deep.The SIMS data were obtained at the Foundation ofPromotion for Materials Science and Technologyof Japan in Tokyo using a Cameca IMS-6f instru-ment. A beam current of 150 nA and acceleratingvoltage of 14.5 kV was used. The beam was com-posed of O2+. The surface of the sample was ana-lyzed in a minute square pattern measuring 30 ×
30 µm, to a depth of about 150 nm. The sputteringrate was approximately 0.15 nm/s, under a vacuumof 3×10⁻⁷ Pascal (or about one-quadrillionth of
atmospheric pressure at sea level). For both theSIMS and LA-ICP-MS analyses of sample MPd-H1,beryllium concentrations were determined using aBe-ion-implanted external standard of pure syn-thetic corundum. (The Be-ion-implanted syntheticcorundum was not used for the other LA-ICP-MSanalyses of corundum in this article because its Becontent was homogeneous to only a shallow level[i.e., within several nanometers to several hundrednanometers of the surface].)
LIBS data were collected with an Ocean Optics2000+ instrument at the GAAJ Research Laboratory
APPLICATIONS OF LA-ICP-MS TO GEMOLOGY GEMS & GEMOLOGY SUMMER 2006 105
TABLE 2. Range of chemical compositions by LA-ICP-MS of emeralds from eight localities.a
Kaduna, Kafubu, Sandawana, Itabira- Santa Swat, Panjshir, CordilleraProperty Nigeria Zambia Zimbabwe Nova Era, Terezinha, Pakistan Afghanistan Oriental,
Brazil Brazil Columbia
Sample no. ENNIO1–10 ENZA01–10, ENZI01–10 EBI001–014 EBS001–015 ENPAI01–10 EAF001–012 ENCO01–10,EZ100–110 1EC001–010
No. of 10 20 10 14 15 10 12 20samplesColor Bluish green Bluish green Pale green Green to Green to Green to Pale green Pale green to
to light green to green to green deep green deep green deep green to green green to deep green
Weight 0.59–1.07 0.19–3.29 0.13–0.77 0.32–2.25 0.55–3.01 0.15–0.83 0.20–1.77 0.45–3.67Type Rough and Mixed cuts Parallel pol- Mixed cuts Mixed cuts Parallel pol- Mixed cuts Parallel pol-
parallel pol- and parallel ished plates ished plates ished plates,ished plates polished and cabo- and cabo- cabochons,
plates chons chons mixed cutsMinor elements (wt.% oxides )Na2O 0.22–0.64 0.93–1.87 1.97–2.30 1.33–2.18 1.61–2.43 1.11–2.01 0.79–1.55 0.33–0.82MgO 0.04–0.09 1.41–2.36 0.88–3.13 1.78–2.54 2.17–2.82 1.86–2.65 0.75–1.82 0.05–1.33FeOtot 0.48–0.96 1.23–2.17 0.34–1.13 1.13–1.42 1.42–2.34 0.30–1.29 0.28–0.76 bdl–0.23K2O 0.006–0.07 0.03–0.42 0.01–0.12 0.02–0.05 0.04–0.91 0.01–0.05 bdl–0.05 bdl–0.02CaO 0.03–0.07 bdl–0.06 0.05–0.28 bdl–0.02 0.10–0.26 0.01–0.06 bdl–0.02 bdl–0.001Sc2O3 0.003–0.03 0.006–0.04 0.01–0.09 bdl–0.01 bdl–0.02 0.01–0.49 0.001–0.27 bdl–0.001V2O3 0.01–0.06 0.01–0.04 0.02–0.10 0.03–0.07 0.001–0.10 bdl–0.06 0.16–0.50 0.11–1.21Cr2O3 0.01–0.55 0.10–0.80 0.41–1.41 0.09–1.10 0.25–2.66 0.10–0.84 0.30–0.41 0.01–0.64Cs2O 0.009–0.01 0.07–0.15 0.01–0.30 bdl–0.01 0.36–0.64 bdl–0.02 bdl–0.009 bdl–0.003Trace elements (ppm)Li 54–200 320–1,260 161–1,370 90.5–305 220–954 163–500 98–229 10–92B bdl–2.3 bdl–10 bdl–2.0 bdl bdl bdl–2.1 bdl bdlTi 5.0–63 8.2–30 3.1–61 5.2–15 2.6–55 3.5–53 bdl–30 bdl–51Mn 4.0–43 9.3–156 5.0–180 10–39 9.3–37 bdl–29 9.3–42 bdl–4.4Co bdl–1.3 1.9–10 1.2–7.5 bdl–4.9 bdl–3.0 bdl–3.2 bdl–5.4 bdlNi bdl–6.1 6.1–44 3.2–62 17–26 21–105 2.3–26 bdl–27 bdl–5.2Cu bdl bdl–297 bdl–9.7 bdl–1.4 bdl–7.1 bdl–27 bdl–1.6 bdl–4.9Zn 14–91 21–970 9.1–254 31–117 6.4–32 bdl–6.9 96–135 bdl–3.9Ga 10–86 8.1–55 6.0–67 12–33 8.7–25 2.3–14 16–57 3.1–70Rb 6.0–64 24–319 10–570 37–65 46–110 3.1–38 21–44 bdl–5.7Sr bdl bdl bdl–14 bdl 5.4–39 bdl bdl–1.1 bdl–1.4Sn bdl–3.4 bdl–4.2 bdl–10 bdl–1.5 bdl–5.8 bdl–3.3 bdl–1.3 bdl–5.1Ba bdl–2.0 bdl–20 bdl–5.4 bdl–2.0 bdl–3.5 bdl–6.5 bdl–20 bdlPb bdl–7.2 bdl–110 bdl–8.8 bdl bdl–7.6 bdl–1.1 bdl–1.4 0.1–180Bi bdl bdl–36 bdl–10 bdl–3.5 bdl–17 bdl–3.5 bdl–4.6 bdl–3.7Pt bdl bdl–8.7 bdl–2.1 bdl–1.0 bdl–4.3 bdl bdl bdl–3.1Au bdl bdl–4.5 bdl–1.7 bdl–1.4 bdl–5.1 bdl bdl bdl–9.6
a Be, Al, and Si were not calculated, and S, P, F, Cl, and H2O were not measured in this study. The following elements in table 5 were not detected inthis study: As, Br, Y, Zr, Ag, Cd, Cd, La, and Ce. Abbreviation: bdl = below detection limit.

in Tokyo. This instrument was developed recent-ly for gemological applications by the SSEF SwissGemmological Laboratory in cooperation withthe manufacturer (Krzemnicki et al., 2004;Hänni et al., 2004). To investigate the detectionlimit of Be, we selected seven samples of Be diffusion–treated corundum (SY001–002,SY003–004, SY-H1, MPd-H10, and MP-H4) forcomparison of the LIBS results with those fromLA-ICP-MS. The LIBS spectra were obtainedwith Ar gas in the sample chamber and a 1064nm Nd:YAG laser (from Big Sky Quantel). Thegirdle of each sample was subjected to 20 singlelaser shots with a laser energy of 30 mJ, resultingin a laser hole measuring 100 µm in diameter.Emission spectra of detectable elements wererecorded in the range of 200–980 nm.
PRACTICAL APPLICATIONS Be-diffused Corundum. Mass spectra for typical LA-ICP-MS analyses of corundum are shown in figure5, as obtained by ablating the GAAJ logo using theconditions summarized in table 3. A detectableberyllium signal is shown in figure 5 for a Be-dif-fused sapphire, whereas the samples that did notundergo Be diffusion treatment have only a back-ground signal for Be. As shown in table 1, Be wasbelow the detection limit (i.e., <0.1 ppm)1 in all theunheated and traditionally heated corundum sam-ples of various colors (40 pieces in total). However,Be (on the order of several parts per million) wasdetected in all corundum samples, natural and syn-thetic, that had been treated by Be diffusion (81pieces; see, e.g., figure 6). In the 20 samples analyzedbefore and after Be diffusion, no Be was detectedbefore treatment but significant amounts weremeasured in all samples after treatment, regardlessof whether any color alteration occurred. No signif-icant color alteration was seen in any of the samples
106 APPLICATIONS OF LA-ICP-MS TO GEMOLOGY GEMS & GEMOLOGY SUMMER 2006
Figure 4. During the laser ablation process, ourresearch showed that inscribing the GAAJ logo on thegirdle of a gemstone provided sufficient material foranalysis of one area; this inscription also proves thata sample has been analyzed by LA-ICP-MS. The tinymark measures 80 × 230 µm and penetrates the stoneto a depth of ~5–10 µm. Photomicrograph by A.Abduriyim; magnified 80×.
TABLE 3. LA-ICP-MS operating conditions.
ICP-MS parameters
Radio frequency (RF) power 1500 wattsCarrier gas flow rate Ar ~1.20–1.23 L/minute, He 0.50
L/minuteDistance from the ICP torch 7 mmto the samplerSampler and skimmer Ni; 1 and 0.4 mm diametersMass number (m/z) 2–260Integration time 0.1 seconds per point (corundum)
or 0.01 seconds per point (emerald)
Laser ablation parameters
Wavelength 213 nm Nd:YAG laserPulse duration 5–10 nanosecondsPulse frequency 10 HzOutput power 2.5 mJLaser line size 16 µm in width, logo size 8 × 230
µm, 4–7 µm in depthLaser point size 30 µm diameter, 2–3 µm deepPre-ablation time 5 secondsAblation time 25 secondsICP-MS data acquisition time 40 secondsIsotope signals selected
Be-diffused corundumIsotopes analyzed 9Be+
Signals monitored 27Al+, 47Ti+, 53Cr+, 56Fe+, 57Fe+, 69Ga+
EmeraldsIsotopes analyzed 7Li+, 11B+, 23Na+, 24Mg+, 39K+,
43Ca+, 44Ca+, 45Sc+, 47Ti+, 51V+, 53Cr+, 55Mn+, 56Fe+, 57Fe+, 59Co+, 60Ni+, 63Cu+, 66Zn+, 69Ga+, 85Rb+, 88Sr+, 118Sn+, 133Cs+, 137Ba+, 195Pt+, 197Au+, 208Pb+, +209Bi+
Signals monitored 9Be+, 27Al+, 28Si+, 29Si+
1 In this article, we use ppm to indicate the concentration of trace ele-ments. The concentration also can be written as ppmw (parts per mil-lion by weight), which is a fractional weight. The concentration ofions, as ion/cm3, is typically expressed as ppma (parts per millionatomic). The mutual relation between these units is approximated bythe following expression:
(molecular weight of Al2O3)5 × (atomic weight of element)][ppma = × ppmw
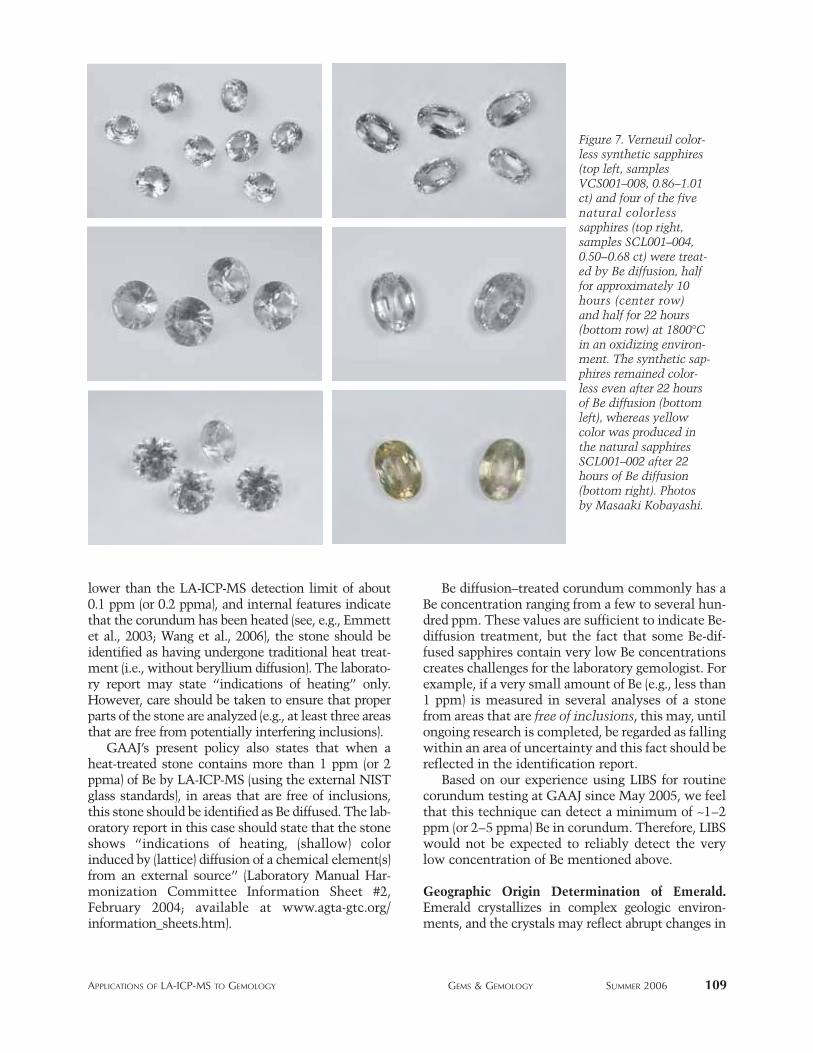
treated for approximately 10 hours (figure 7). Withthe 22-hour heating process, the synthetic sapphiresremained colorless, whereas the natural sapphiresbecame yellow.
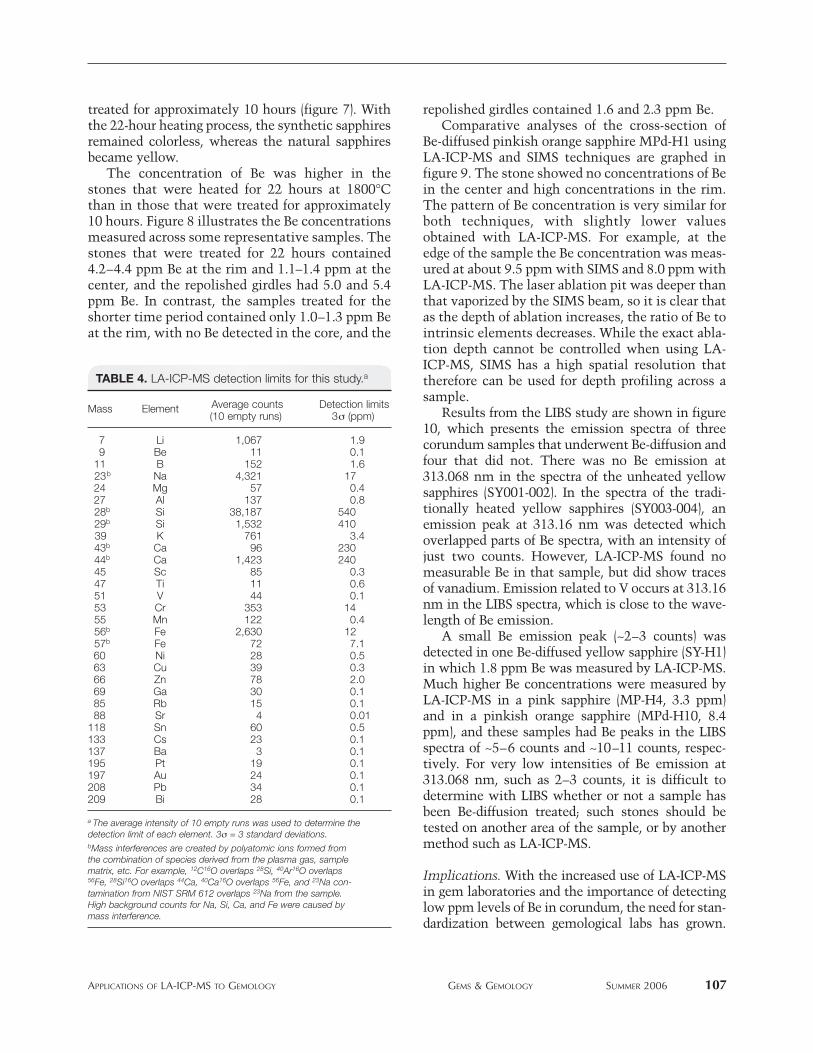
The concentration of Be was higher in thestones that were heated for 22 hours at 1800°Cthan in those that were treated for approximately10 hours. Figure 8 illustrates the Be concentrationsmeasured across some representative samples. Thestones that were treated for 22 hours contained4.2–4.4 ppm Be at the rim and 1.1–1.4 ppm at thecenter, and the repolished girdles had 5.0 and 5.4ppm Be. In contrast, the samples treated for theshorter time period contained only 1.0–1.3 ppm Beat the rim, with no Be detected in the core, and the
repolished girdles contained 1.6 and 2.3 ppm Be.Comparative analyses of the cross-section of
Be-diffused pinkish orange sapphire MPd-H1 usingLA-ICP-MS and SIMS techniques are graphed infigure 9. The stone showed no concentrations of Bein the center and high concentrations in the rim.The pattern of Be concentration is very similar forboth techniques, with slightly lower valuesobtained with LA-ICP-MS. For example, at theedge of the sample the Be concentration was meas-ured at about 9.5 ppm with SIMS and 8.0 ppm withLA-ICP-MS. The laser ablation pit was deeper thanthat vaporized by the SIMS beam, so it is clear thatas the depth of ablation increases, the ratio of Be tointrinsic elements decreases. While the exact abla-tion depth cannot be controlled when using LA-ICP-MS, SIMS has a high spatial resolution thattherefore can be used for depth profiling across asample.
Results from the LIBS study are shown in figure10, which presents the emission spectra of threecorundum samples that underwent Be-diffusion andfour that did not. There was no Be emission at313.068 nm in the spectra of the unheated yellowsapphires (SY001-002). In the spectra of the tradi-tionally heated yellow sapphires (SY003-004), anemission peak at 313.16 nm was detected whichoverlapped parts of Be spectra, with an intensity ofjust two counts. However, LA-ICP-MS found nomeasurable Be in that sample, but did show tracesof vanadium. Emission related to V occurs at 313.16nm in the LIBS spectra, which is close to the wave-length of Be emission.
A small Be emission peak (~2–3 counts) wasdetected in one Be-diffused yellow sapphire (SY-H1)in which 1.8 ppm Be was measured by LA-ICP-MS.Much higher Be concentrations were measured byLA-ICP-MS in a pink sapphire (MP-H4, 3.3 ppm)and in a pinkish orange sapphire (MPd-H10, 8.4ppm), and these samples had Be peaks in the LIBSspectra of ~5–6 counts and ~10–11 counts, respec-tively. For very low intensities of Be emission at313.068 nm, such as 2–3 counts, it is difficult todetermine with LIBS whether or not a sample hasbeen Be-diffusion treated; such stones should betested on another area of the sample, or by anothermethod such as LA-ICP-MS.
Implications. With the increased use of LA-ICP-MSin gem laboratories and the importance of detectinglow ppm levels of Be in corundum, the need for stan-dardization between gemological labs has grown.
APPLICATIONS OF LA-ICP-MS TO GEMOLOGY GEMS & GEMOLOGY SUMMER 2006 107
TABLE 4. LA-ICP-MS detection limits for this study.a
Average counts Detection limits (10 empty runs) 3σ (ppm)
7 Li 1,067 1.99 Be 11 0.1
11 B 152 1.623b Na 4,321 1724 Mg 57 0.427 Al 137 0.828b Si 38,187 54029b Si 1,532 41039 K 761 3.443b Ca 96 23044b Ca 1,423 24045 Sc 85 0.347 Ti 11 0.6 51 V 44 0.1 53 Cr 353 14 55 Mn 122 0.4 56b Fe 2,630 12 57b Fe 72 7.1 60 Ni 28 0.5 63 Cu 39 0.3 66 Zn 78 2.0 69 Ga 30 0.1 85 Rb 15 0.1 88 Sr 4 0.01
118 Sn 60 0.5 133 Cs 23 0.1 137 Ba 3 0.1 195 Pt 19 0.1197 Au 24 0.1208 Pb 34 0.1 209 Bi 28 0.1
a The average intensity of 10 empty runs was used to determine thedetection limit of each element. 3σ = 3 standard deviations.bMass interferences are created by polyatomic ions formed fromthe combination of species derived from the plasma gas, samplematrix, etc. For example, 12C16O overlaps 28Si, 40Ar16O overlaps56Fe, 28Si16O overlaps 44Ca, 40Ca16O overlaps 56Fe, and 23Na con-tamination from NIST SRM 612 overlaps 23Na from the sample.High background counts for Na, Si, Ca, and Fe were caused by mass interference.
Mass Element

Clearly, a high level of confidence is needed in suchanalyses and a similar level of consistency is desiredwhen comparing results between laboratories. Whilethe results presented here are valid for the conditionsof this study, the authors continue to work withother laboratories (particularly members of theLaboratory Manual Harmonization Committee) onan internationally agreed set of analytical parame-ters and standards.
Under normal geologic conditions, it is difficultfor Be atoms to enter the corundum lattice.However, natural corundum contains various typesof inclusions (crystals, clouds, silk, etc.) that mayhost small amounts of Be. Further investigationsinto the chemical composition of inclusions in nat-ural corundum are under way.
At present and notwithstanding ongoing research,GAAJ believes that when the concentration of Be is
108 APPLICATIONS OF LA-ICP-MS TO GEMOLOGY GEMS & GEMOLOGY SUMMER 2006
Figure 6. These Be-diffusedsapphires and rubies(0.45–3.98 ct) are typicalof the material that wasanalyzed by LA-ICP-MSfor this study. Photo byMasaaki Kobayashi.
Figure 5. Mass spectra forBe in corundum were gener-ated by laser ablating theGAAJ logo for a 25-secondperiod. The pre-ablationtime was 5 seconds, and 35seconds were used for ICP-MS data acquisition. Adetectable Be signal isshown for a Be-diffused sap-phire, whereas samples thatwere either not heated orhad been heated by tradi-tional methods do not showa Be signal above the back-ground level. Signals for Aland the common trace ele-ments in corundum (Ti, Cr,Fe, and Ga) were moni-tored, as shown here, butthe concentrations of theseelements were not calculat-ed for this study.
lower than the LA-ICP-MS detection limit of about0.1 ppm (or 0.2 ppma), and internal features indicatethat the corundum has been heated (see, e.g., Emmettet al., 2003; Wang et al., 2006), the stone should beidentified as having undergone traditional heat treat-ment (i.e., without beryllium diffusion). The laborato-ry report may state “indications of heating” only.However, care should be taken to ensure that properparts of the stone are analyzed (e.g., at least three areasthat are free from potentially interfering inclusions).
GAAJ’s present policy also states that when aheat-treated stone contains more than 1 ppm (or 2ppma) of Be by LA-ICP-MS (using the external NISTglass standards), in areas that are free of inclusions,this stone should be identified as Be diffused. The lab-oratory report in this case should state that the stoneshows “indications of heating, (shallow) colorinduced by (lattice) diffusion of a chemical element(s)from an external source” (Laboratory Manual Har-monization Committee Information Sheet #2,February 2004; available at www.agta-gtc.org/information_sheets.htm).
Be diffusion–treated corundum commonly has aBe concentration ranging from a few to several hun-dred ppm. These values are sufficient to indicate Be-diffusion treatment, but the fact that some Be-dif-fused sapphires contain very low Be concentrationscreates challenges for the laboratory gemologist. Forexample, if a very small amount of Be (e.g., less than1 ppm) is measured in several analyses of a stonefrom areas that are free of inclusions, this may, untilongoing research is completed, be regarded as fallingwithin an area of uncertainty and this fact should bereflected in the identification report.
Based on our experience using LIBS for routinecorundum testing at GAAJ since May 2005, we feelthat this technique can detect a minimum of ~1–2ppm (or 2–5 ppma) Be in corundum. Therefore, LIBSwould not be expected to reliably detect the verylow concentration of Be mentioned above.
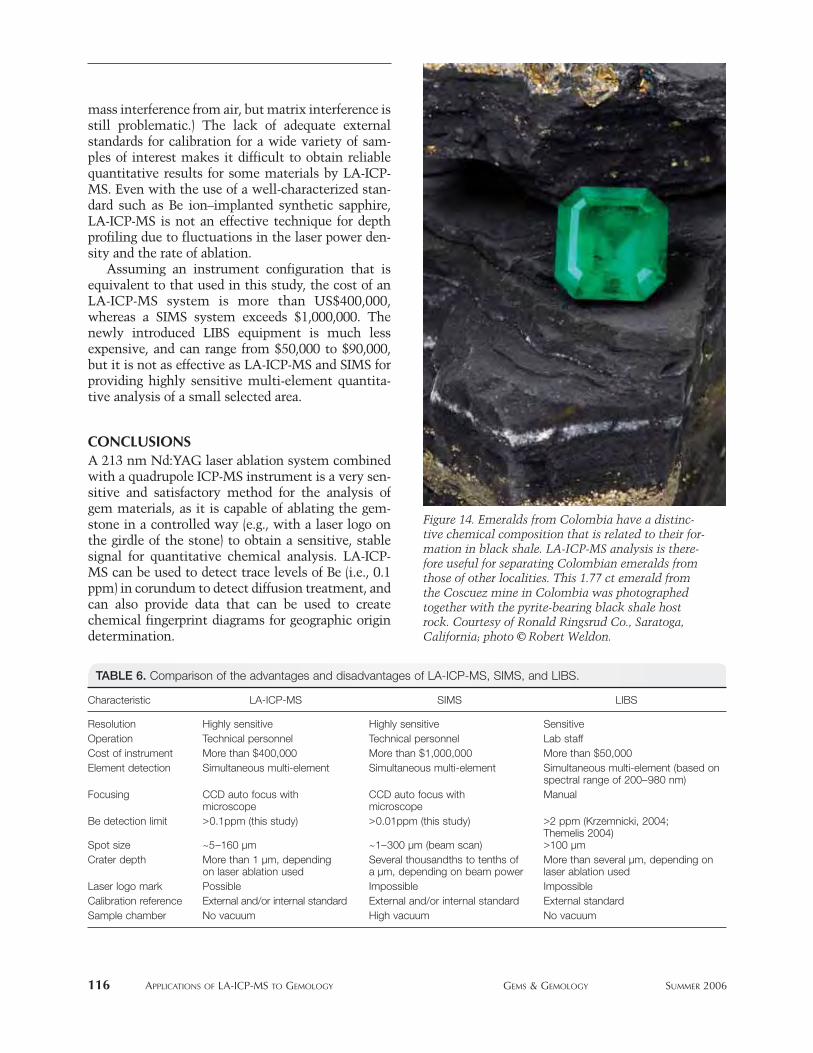
Geographic Origin Determination of Emerald.Emerald crystallizes in complex geologic environ-ments, and the crystals may reflect abrupt changes in
APPLICATIONS OF LA-ICP-MS TO GEMOLOGY GEMS & GEMOLOGY SUMMER 2006 109
Figure 7. Verneuil color-less synthetic sapphires(top left, samplesVCS001–008, 0.86–1.01ct) and four of the fivenatural colorless sapphires (top right,samples SCL001–004,0.50–0.68 ct) were treat-ed by Be diffusion, halffor approximately 10hours (center row)and half for 22 hours (bottom row) at 1800°Cin an oxidizing environ-ment. The synthetic sap-phires remained color-less even after 22 hoursof Be diffusion (bottomleft), whereas yellowcolor was produced inthe natural sapphiresSCL001–002 after 22hours of Be diffusion(bottom right). Photosby Masaaki Kobayashi.

the geologic environment and/or mechanical stress.In contrast, other gem beryls, such as aquamarine,develop in relatively stable environments (e.g., withincavities in granitic pegmatites). Emeralds have beenmined from the five major continents, with famouslocalities in South America (Colombia and Brazil),Asia (Russia, Pakistan, and Afghanistan), and Africa
(Zambia and Zimbabwe), as well as Madagascar. Thegeologic characteristics of emerald deposits have beenclassified into two groups (Schwarz and Giuliani,2000; Schwarz, 2004) as follows:
Group 1—Crystallization associated with pegmatites• Category A: Pegmatite without schist-related
110 APPLICATIONS OF LA-ICP-MS TO GEMOLOGY GEMS & GEMOLOGY SUMMER 2006
Figure 9. The cut cross-section of a Be-diffusedpinkish orange sapphire(sample MPd-H1) wasanalyzed for Be withboth LA-ICP-MS andSIMS, using an externalstandard of Be-implant-ed synthetic corundum.The (natural) pink coreof the sapphire is sur-rounded by orange andorangy pink outer zonesthat resulted from Bediffusion. Slightly high-er Be concentrationswere consistently meas-ured in the SIMS analy-ses, except in the pinkcore, which did notcontain any detectableBe by either technique.
Figure 8. These graphs show the distribution of Be concentrations across cut cross-sections of synthetic sapphiresVCS001 and VCS005 (left; 3.5 mm traverse) and natural sapphires SCL001 and SCL003 (right; 2.1 mm traverse)that underwent Be diffusion for different amounts of time. Considerably more Be was recorded in the samplesthat were diffused longer; both pairs showed Be enrichments near their edges. (The relative error in the analyses isestimated to be ±0.5 ppm Be.) No color modifications were seen in the synthetic sapphires, whereas the naturalsapphires changed from colorless to yellow, but only after the longer period of Be diffusion (see figure 7).

emerald (Kaduna, Nigeria)• Category B: Pegmatite and greisen with schist-
related emerald (Kafubu, Zambia; Sandawana,Zimbabwe; and Itabira–Nova Era, Brazil)
Group 2—Crystallization without the involvementof pegmatites• Category C: Metamorphic phlogopite schist–
related emerald (Santa Terezinha, Brazil)• Category D: Talc-carbonate schist–related emer-
ald (Swat, Pakistan)• Category E: Muscovite schist–related emerald
(Panjshir, Afghanistan)
• Category F: Black shale with vein- and breccia-related emerald (Cordillera Oriental, Colombia)
Representative emeralds from each of these geo-logic deposit types were selected for this study (seetable 2 and figure 11). LA-ICP-MS analyses of 111gem-quality emeralds from the eight localities aresummarized in table 2. The minor elements Na, Mg,and Fe and the trace elements K, Ca, Sc, V, Cr, and Cswere converted to oxide weight percent values forcomparison with data reported on emeralds from theliterature: Kaduna (Lind et al., 1986; Schwarz, 1996),Kafubu (Milisenda et al., 1999; Zwaan et al., 2005),
APPLICATIONS OF LA-ICP-MS TO GEMOLOGY GEMS & GEMOLOGY SUMMER 2006 111
Figure 10. LIBS spectraare shown in the rangeof 307–320 nm for non-
heated sapphires (SY001and SY002), traditionalheat-treated sapphires
(SY003 and SY004), andBe diffusion-treated sap-
phires (SY-H1, MP-H4,and MPd-H10). The Be
emission peak is locatedat 313.068 nm. The
large peaks around 308and 309 nm are due toAl. Be was only detect-ed in the samples that
underwent Be diffusiontreatment.
Figure 11. These emer-alds are from the eight
deposits that were ana-lyzed by LA-ICP-MS forthis study. From left toright, top row: Santa
Terezinha, Brazil (0.72 ct);Swat, Pakistan (0.83 ct);
Panjshir, Afghanistan(0.48 ct); and Cordillera
Oriental, Colombia (1.73ct). Bottom row: Kaduna,Nigeria (1.07 ct); Kafubu,Zambia (0.57 ct); Sanda-
wana, Zimbabwe (0.68ct); and Itabira–Nova
Era, Brazil (0.78 ct). Photoby Kohei Yamashita.

Sandawana (Zwaan et al., 1997), Itabira–Nova Era(Schrader, 1987; Schwarz, 1990b; Kanis, 2001; Zwaan,2001), Santa Terezinha (Hänni and Kerez, 1983;Schwarz, 1990a; Moroz et al., 1998; Pulz et al., 1998),Swat (Henn, 1988; Hammarstrom, 1989), Panjshir(Hammarstrom, 1989; Moroz et al., 1998) andCordillera Oriental (Moroz et al., 1998). In addition,the trace elements Li, Ti, Zn, Ga, and Rb were all pres-ent in detectable quantities. However, B, Mn, Co, Ni,Cu, Sr, Sn, Ba, Pb, Bi, Pt, and Au were near or belowthe detection limits of our instrument.
Average data for each of the 111 emeralds fromthe eight localities are plotted in two different chem-ical fingerprint diagrams (separate plots for minorand trace elements). The oxide weight percent ratiosof the minor elements Cs2O+K2O versus FeO+MgOare plotted in figure 12. Based on Cs2O+K2O content,the Santa Terezinha, Kafubu, and Sandawana emer-alds could be separated from the Kaduna, Panjshir,Itabira–Nova Era, and Colombian emeralds. TheCs2O+K2O concentrations were particularly high inthe Santa Terezinha emeralds. Moreover, theFeO+MgO contents were useful for separating theKaduna emeralds from the other localities, althoughthere was considerable overlap with Colombiansamples. However, a ternary diagram of Zn-Li-Ga
(figure 13) was quite effective at separating theColombian emeralds from the Kaduna specimens,and also the Swat emeralds from the Itabira–NovaEra and Panjshir specimens (which overlap in figure12). The Swat specimens occupied the Li-dominantfield, while emeralds from Sandawana, Kafubu,Itabira–Nova Era, Panjshir, and Santa Terezinhaoverlapped to various degrees in the Zn-Li region.
The alkali granite–related Kaduna emeralds ofCategory A were characterized by relatively low Na,Mg, Cs, and K contents. Generally, the elements thatare not intrinsic to beryl (i.e., Na, Mg, Fe, V, Cr, Cs,K, and Ca) were lower than 1.5 wt.% oxide, and theconcentration of Fe was greater than the sum of theother nonintrinsic elements. The trace elements Li,Ti, Mn, Zn, Ga, and Rb were usually present in con-centrations significantly above background.
The emeralds belonging to Category B (Kafubu,Sandawana, and Itabira–Nova Era) are associated withvarious metamorphic schist rocks containing phlogo-pite, biotite, talc, carbonate, and actinolite-tremolite(Schwarz et al., 1996). Their contents of Cr, as well assubordinate Na, Mg, and Fe, showed a wide variation.The Mg concentrations (generally between 1.41 and3.13 wt.% MgO) were higher than those of Na and Fe.Nevertheless, emeralds originating from these three
112 APPLICATIONS OF LA-ICP-MS TO GEMOLOGY GEMS & GEMOLOGY SUMMER 2006
Figure 12. This plot ofminor-element concen-trations (Cs2O+K2O vs.FeO+MgO, in wt.%) ofemeralds from the eightlocalities shows variousamounts of overlap.Samples from SantaTerezinha are notablefor their high Cs2O+K2Ocontents, whereas thosefrom Kaduna containthe lowest concentra-tions of all these minorelements.

deposits showed similar ranges of FeO+MgO, and theZambian samples had the highest sum of Cs2O+K2Oand relatively enriched trace elements Li, Zn, Rb, andPb. The Itabira–Nova Era emeralds showed the lowestconcentration of Cs2O+K2O and overlapped withsamples from Category D (Swat). Although the Swatemeralds showed considerable overlap with other cat-egories in figure 13, the trace elements Li, Sc, Mn, Ni,Zn, Ga, and Rb were particularly helpful in distin-guishing them.
Category C emeralds from Santa Terezinha arehosted in carbonate-talc-phlogopite schists thathad some metasomatic exchange between the Be-bearing fluid and the ultrabasic host rocks (Pulzet. al., 1998). Santa Terezinha emeralds had thehighest sum of Na2O+MgO+FeO+V2O3+Cr2O3 (upto 10 wt.%), and also had the highest Fe, Cr, andCs concentration measured in this study. In addi-tion, the Santa Terezinha emeralds contained themost Li (up to 950 ppm), with Na>Cs>Li. Theyalso contained the trace elements Ti, Mn, Zn, Ga,and Rb (with Ba and Pb near the detection limits),as well as high levels of Ni, Sr, and Sn.
Emeralds belonging to Category D (Swat,
Pakistan), originating from talc-carbonate schist, alsohad high contents of Na2O+MgO+FeO+V2O3+Cr2O3,up to 6.85 wt.%. The range of FeO+MgO was dis-tinctly larger than for the Panjshir emeralds ofCategory E. The different populations of these twodeposits are quite evident, especially in the trace ele-ments V, Ga, Rb, and Ba that are enriched in theAfghan emeralds.
Compared to emeralds from the other deposits,the black shale–hosted Colombian emeralds ofCategory F were rather pure, with only about 4 wt.%of Na2O+MgO+FeO+V2O3+Cr2O3. Generally Na, Mg,and Fe were low, but the two chromophores V and Crwere anomalously high, up to about 1.85 wt.% forV2O3+Cr2O3. The FeO+MgO content of Colombianemeralds was typically sufficient to distinguish themfrom neighboring populations of Nigerian andAfghan emeralds.
Implications. Many of the minor and trace elementsshowed a wider range of concentrations in our sam-ples than were reported previously in the literature(table 5). Mg, K, and V were consistent with theanalyses of emeralds reported in most localities, but
APPLICATIONS OF LA-ICP-MS TO GEMOLOGY GEMS & GEMOLOGY SUMMER 2006 113
Figure 13. The trace-ele-ment concentrations ofemeralds from the eightlocalities are plotted inthis Zn-Li-Ga ternarydiagram. The Swat andsome Santa Terezinhaemeralds are Li-domi-nant, while Colombianstones have intermedi-ate Li-Ga contents.Emeralds from Kafubu,Sandawana, Itabira–Nova Era, and Panjshirare Li-Zn dominant,whereas the Kadunaspecimens fall closer tothe center of the plot.

our Colombian and Panjshir samples did containsomewhat greater contents of V. In addition, wefound more Sc and Cs in emeralds from most of theeight localities; these elements were reported asbelow or near the detection limits in the literature.The highest amount of Cr found in this study was2.66 wt.% Cr2O3 in emeralds from Santa Terezinha.We measured the highest Fe contents in emeraldsfrom Santa Terezinha and Kafubu, but even greaterconcentrations of Fe were reported in samples fromSwat by Hammarstrom (1989).
Using proton-induced X-ray emission (PIXE), sev-eral trace elements that were not measured ordetected in our samples (i.e., P, S, Cl, As, Br, Y, Zr,Ag, Cd, La, and Ce) were reported in the literature foremeralds from Kafubu, Sandawana, Santa Terezinha,Swat, and Colombia (again, see table 5). Comparedto our LA-ICP-MS data, the PIXE analyses showedrelatively high Ti, Mn, Co, Cu, Zn, Ba, Pt, Au, and Biin emeralds from Kafubu, Sandawana, SantaTerezinha, Swat, and Colombia, but ICP-MS datafrom Pulz et al. (1998) showed a range similar to thatmeasured in our emeralds from the Santa Terezinha.Using elements such as Li, Zn, Rb, and Pb, it may bepossible to differentiate Colombian emeralds (figure14), arguably the world’s most important source,from those of other localities.
Our LA-ICP-MS analyses of emeralds from theeight localities provided no consistent way of clearlydistinguishing between pegmatite-related and non-pegmatite-related sources, but the various localitiescould be separated by a combination of chemical fin-gerprint diagrams (figures 12 and 13). In figure 12, theKaduna emeralds correspond to the lowest concentra-tions of Cs2O+K2O and FeO+MgO, although a fewdata points overlap with the Colombian emeralds.However, there is absolutely no overlap in these local-ities in figure 13, so Colombian emeralds can easily beseparated. Emeralds from Category B (Kafubu,Sandawana, and Itabira–Nova Era) plotted higher inthe FeO+MgO field, and can be separated from SantaTerezinha, and Colombian stones on this basis. Swatemeralds completely overlap those from Itabira–NovaEra in figure 12, but figure 13 can be used to make aclear distinction between them. Category B emeraldsoverlap to some extent in both diagrams, but othertrace elements can be used to separate them. Zambianstones showed the greatest sum of Cs2O+K2O and highvalues of Li, Zn, Rb, and Pb. Emeralds fromItabira–Nova Era had the least Cs2O+K2O values andlow values of Li, Mn, Zn, and Rb. Moderate contentsof Cs2O+K2O and the highest values of Li, Ti, Mn, and
Rb occurred in Sandawana emeralds. Notably, SantaTerezinha, which is one of the major sources of emer-ald in the market, had the highest concentrations ofFe, Cr, and Cs, with relatively high contents of Li, Ni,and Sr, enabling them be separated from Colombianemeralds. Therefore, chemical data obtained by LA-ICP-MS is effective for separating emeralds from eachof the eight geographic origins analyzed for this study.However, for added confidence, the chemical datashould be supported by optical properties and internalcharacteristics that would help substantiate the origindetermination. Note that the diagrams provided inthis article do not take into account all major emeraldsources (e.g., samples from Russia and Madagascarwere not included).
COMPARISON OF LA-ICP-MS TO SIMS AND LIBSThe advantages and disadvantages of using LA-ICP-MS, SIMS, and LIBS for analyzing gemstones are list-ed in table 6. LA-ICP-MS is qualitative to fully quan-titative, and can analyze a full range of major, minor,and trace elements, which makes it particularly use-ful for the geographic origin determination of gemmaterials. With further research, this technique mayprove useful (in certain situations) for determiningthe geographic origin of diamonds (Watling et al.,1995, Resano et al., 2003, Wang et al., 2003). Note,too, that LA-ICP-MS can be used to analyze solidmaterials with minimal damage; and because chem-ical dissolution of the sample is not necessary, thereis no solvent-induced spectral interference. Bothloose and mounted gem materials can be tested,without need for a conductive coating of carbon orgold and/or other charge balancing techniques, as arerequired for SIMS and EMPA techniques. For trace-element analysis using a well-characterized stan-dard, a larger number of elements can be accuratelyquantified with LA-ICP-MS than with SIMS or LIBS.Also, LA-ICP-MS can yield low detection limits,close to that of SIMS (Nenoyer et al., 1991). As withSIMS, the ablation area can be controlled from aminimum crater diameter of several micrometers toa maximum of several hundred micrometers (i.e.,greater than the beam diameter that is possible forelectron or ion microprobes; Reed, 1989). However,a pit diameter of at least 100 µm is required for LIBSanalysis, and there is a risk that the stone may bedamaged by the laser.
The disadvantages of LA-ICP-MS analysisinclude mass interference and element fractiona-
114 APPLICATIONS OF LA-ICP-MS TO GEMOLOGY GEMS & GEMOLOGY SUMMER 2006

TABLE 5. Chemical compositions of emeralds from the literature, for the eight localities in this study.a
Itabira- Santa Cordillera Nova Era Terezinha Oriental
Oxides Lind et al., Milisenda Zwaan et al., Schrader, 1987 Hänni et al., 1983 Henn, 1988 Hammar- Moroz et(wt.%)b 1986 (4); et al., 1999 1997 (4) (1); Schwarz, (4); Schwarz, (10); Hammar- strom, 1989 al.,1998
Schwarz et (5); Zwaan 1990b (48); 1990a (14); Moroz strom, 1989 (2) (3); Moroz (2)al., 1996 (16) et al., 2005 Kanis, 2001 et al., 1998 (2) et al., 1998
(27) (4); Zwaan, (3)2001 (23)
Na2O 0.04–0.33 0.74–1.99 2.07–2.41 0.79–1.93 1.46–2.18 1.08–2.11 0.01–1.61 ≤0.65MgO 0.01–0.20 1.26–2.90 2.52–2.75 1.39–2.64 1.27–3.36 2.21–3.10 0.22–1.89 ≤0.76FeOtot 0.11–1.13 0.34–1.31 0.45–0.82 0.41–1.30 0.48–1.82 0.20–2.51 0.21–1.16 ≤0.25K2O bdl–0.05 bdl–0.26 0.03–0.06 ≤0.08 ≤0.16 ≤0.02 ≤0.09 ≤0.03CaO bdl–0.01 bdl–0.07 ≤0.03 ≤0.10 ≤0.10 bdl ≤0.07 ≤0.23Sc2O3 bdl–0.03 bdl–0.03 bdl - - ≤0.19 - -V2O3 bdl–0.09 bdl–0.06 0.04–0.07 ≤0.08 ≤0.12 0.04–0.07 0.03–0.29 ≤0.21Cr2O3 bdl–0.08 bdl–0.63 0.61–1.33 0.06–1.42 0.06–1.54 0.61–1.33 0.10–0.54 ≤0.29Cs2O bdl–0.05 bdl–0.23 0.06–0.10 ≤0.01 ≤0.20 - ≤0.27 ≤0.23
Itabira- Santa Terezinha Cordillera Nova Era Oriental
Yu et al., Calligaro Calligaro Pulz et Calligaro Yu et al., Yu et al., Calligaro Yu et al.,2000 (25) et al., et al., al., 1998 et al., 2000 (5) 2000 (6) et al., 2000 (20)
2000 (11) 2000 (22) (5) 2000 (8) 2000 (4)
Li - - 580 800 - 24–30 580 - - 350 - -P - bdl–433 - - - - - bdl bdl–302 - - bdl–224S - bdl–10,707 - - - - - 175–916 90–422 - - 83–923Cl - 109–1,188 - - - - - 351–924 227–758 - - 356–1,864Ti - bdl–89 - - - <118d - bdl–355 bdl–219 - - bdl–115Mn - bdl–156 - - - <154d - bdl–189 bdl - - bdl–124Co - bdl–262 - - - - - bdl bdl–233 - - bdl–110Ni - - - - - 37–97 - - - - - -Cu - 44–329 - - - 2 - bdl–285 bdl–185 - - 42–1,070Zn - 22–212 - - - 2–8 - 50–187 20–93 - - bdl–203Ga - 19–273 - - - - - 53–261 17–35 - - 57–243As - bdl - - - - - bdl–44 bdl - - bdl–32Br - bdl - - - - - bdl–82 bdl–75 - - bdlRb - bdl–120 140 350 - <168d 140 bdl–30 bdl–122 6 - bdl–61Sr - bdl–29 - - - 2–38 - bdl–91 bdl - - bdlY - bdl–100 - - - <2 - bdl bdl - - bdl–145Zr - bdl–98 - - - <4 - bdl bdl - - 0Ag - - - - - <0.4 - - - - - -Cd - - - - - <0.5 - - - - - -Sn - - - - - - - - - 0 - -Ba - bdl–367 - - - <2 - bdl–233 282–978 - - bdl–1,265La - bdl–474 - - - - - 175–805 bdl–546 - - bdl–1,371Ce - bdl–509 - - - - - bdl–669 bdl–443 - - bdl–2,335Pt - bdl–392 - - - - - bdl–132 bdl–66 - - bdl–154Au - bdl–213 - - - - - bdl–123 bdl–96 - - bdl–260Pb - bdl–252 - - - <5 - bdl bdl–86 - - bdlBi - bdl–335 - - - <5 - bdl–174 bdl–58 - - bdl–90
a The number of analyzed samples is shown in parentheses after the corresponding reference. Abbreviation: bdl = below detection limit.b Analyzed by EMPA.c Analyzed by ICP-MS, except for Pulz et al. (1998), which used particle-induced x-ray emission (PIXE).d Calculated as ppm by weight.
tion. Element isotope determination with the ICP-MS may suffer a strong spectral interference from airentrainment, from the sample’s matrix, and from
polyatomic ions, resulting in mass spectral overlapand a high background. (With SIMS, the high vacu-um required in the sample chamber eliminates the
APPLICATIONS OF LA-ICP-MS TO GEMOLOGY GEMS & GEMOLOGY SUMMER 2006 115
Kaduna Kafubu Sandawana Swat Panjshir
Kaduna Kafubu Sandawana Swat PanjshirTraceelements(ppm)c
mass interference from air, but matrix interference isstill problematic.) The lack of adequate externalstandards for calibration for a wide variety of sam-ples of interest makes it difficult to obtain reliablequantitative results for some materials by LA-ICP-MS. Even with the use of a well-characterized stan-dard such as Be ion–implanted synthetic sapphire,LA-ICP-MS is not an effective technique for depthprofiling due to fluctuations in the laser power den-sity and the rate of ablation.
Assuming an instrument configuration that isequivalent to that used in this study, the cost of anLA-ICP-MS system is more than US$400,000,whereas a SIMS system exceeds $1,000,000. Thenewly introduced LIBS equipment is much lessexpensive, and can range from $50,000 to $90,000,but it is not as effective as LA-ICP-MS and SIMS forproviding highly sensitive multi-element quantita-tive analysis of a small selected area.
CONCLUSIONSA 213 nm Nd:YAG laser ablation system combinedwith a quadrupole ICP-MS instrument is a very sen-sitive and satisfactory method for the analysis ofgem materials, as it is capable of ablating the gem-stone in a controlled way (e.g., with a laser logo onthe girdle of the stone) to obtain a sensitive, stablesignal for quantitative chemical analysis. LA-ICP-MS can be used to detect trace levels of Be (i.e., 0.1ppm) in corundum to detect diffusion treatment, andcan also provide data that can be used to createchemical fingerprint diagrams for geographic origindetermination.
116 APPLICATIONS OF LA-ICP-MS TO GEMOLOGY GEMS & GEMOLOGY SUMMER 2006
Figure 14. Emeralds from Colombia have a distinc-tive chemical composition that is related to their for-mation in black shale. LA-ICP-MS analysis is there-fore useful for separating Colombian emeralds fromthose of other localities. This 1.77 ct emerald fromthe Coscuez mine in Colombia was photographedtogether with the pyrite-bearing black shale hostrock. Courtesy of Ronald Ringsrud Co., Saratoga,California; photo © Robert Weldon.
TABLE 6. Comparison of the advantages and disadvantages of LA-ICP-MS, SIMS, and LIBS.
Characteristic LA-ICP-MS SIMS LIBS
Resolution Highly sensitive Highly sensitive SensitiveOperation Technical personnel Technical personnel Lab staffCost of instrument More than $400,000 More than $1,000,000 More than $50,000Element detection Simultaneous multi-element Simultaneous multi-element Simultaneous multi-element (based on
spectral range of 200–980 nm)Focusing CCD auto focus with CCD auto focus with Manual
microscope microscopeBe detection limit >0.1ppm (this study) >0.01ppm (this study) >2 ppm (Krzemnicki, 2004;
Themelis 2004)Spot size ~5–160 µm ~1–300 µm (beam scan) >100 µmCrater depth More than 1 µm, depending Several thousandths to tenths of More than several µm, depending on
on laser ablation used a µm, depending on beam power laser ablation usedLaser logo mark Possible Impossible ImpossibleCalibration reference External and/or internal standard External and/or internal standard External standardSample chamber No vacuum High vacuum No vacuum

APPLICATIONS OF LA-ICP-MS TO GEMOLOGY GEMS & GEMOLOGY SUMMER 2006 117
ABOUT THE AUTHORSDr. Abduriyim ([email protected]) is manager,and Mr. Kitawaki is director, at the research laboratory of theGemmological Association of All Japan, Tokyo.
ACKNOWLEDGMENTSThe authors thank Dr. Dietmar Schwarz for supplying
detailed information on worldwide emerald deposits as wellas emerald samples for analysis. Katsuo Mizobuchi andMasahiko Endo at Agilent Technologies in Tokyo providedadvice and technical discussion regarding this work. Dr.Ichiro Sunagawa (Tokyo, Japan) and Kenneth Scarratt (GIAResearch, Bangkok, Thailand) kindly provided a criticalreading and helped revise an early draft of this manuscript.
REFERENCESAbduriyim A., Kitawaki H. (2006) Determination of the origin of
blue sapphire using laser ablation inductively coupled plasmamass spectrometry (LA-ICP-MS). Journal of Gemmology, Vol.30, No. 1–2, pp. 23–36.
Arrowsmith P. (1987) Laser ablation of solids for elemental analysisby inductively coupled plasma mass spectrometry. AnalyticalChemistry, Vol. 59, No. 10, pp. 1437–1444.
Aston F.W. (1919) A positive-ray spectrograph. PhilosophicalMagazine, Vol. 38, pp. 707–715.
Benninghoven A., Rüdenauer F.G., Werner H.W. (1987) SecondaryIon Mass Spectrometry: Basic Concepts, Instrumental Aspects,Applications, and Trends. Wiley, New York, 1227 pp.
Calligaro T., Dran J.C., Poirot J.P., Querré G., Salomon J., ZwaanJ.C. (2000) PIXE/PIGE characterization of emeralds using anexternal micro-beam. Nuclear Instruments and Methods inPhysics Research B, Vol. 161–163, pp. 769–774.
Dempster A.J. (1918) A new method of positive ray analysis.Physical Review, Vol. 11, No. 4, pp. 316–324.
Devos W., Senn-Luder M., Moor C., Salter C. (2000) Laser ablationinductively coupled plasma spectrometry (LA-ICP-MS) for spa-tially resolved trace analysis of early-Medieval archaeologicaliron finds. Fresenius’ Journal of Analytical Chemistry, Vol.366, No. 8, pp. 873–880.
Dunn P.J. (1977) The use of the electron microprobe in gemology.Journal of Gemmology, Vol. 15, No. 5, pp. 248–258.
Emmett J.L., Scarratt K., McClure S.F., Moses T., Douthit T.R.,Hughes R., Novak S., Shigley J.E., Wang W., Bordelon O., KaneR.E. (2003) Beryllium diffusion of ruby and sapphire. Gems &Gemology, Vol. 39, No. 2, pp. 84–135.
García-Ayuso L.E., Amador-Hernandez J., Fernandez-RomeroJ.M., Luque de Castro M.D. (2002) Characterization of jew-ellery products by laser-induced breakdown spectroscopy.Analytica Chimica Acta, Vol. 457, No. 2, pp. 247–256.
Gray A.L. (1985) Solid sample introduction by laser ablation forinductively coupled plasma source mass spectrometry.Analyst, Vol. 110, No. 5, pp. 551–556.
Günther D., Frischknecht R., Heinrich C.A., Kahlert H.J. (1997)Capabilities of an argon fluoride 193 nm excimer laser for laserablation inductively coupled plasma mass spectrometrymicroanalysis of geological materials. Journal of AnalyticalAtomic Spectrometry, Vol. 12, No. 9, pp. 939–944.
Günther D., Heinrich C.A. (1999) Enhanced sensitivity in laserablation–ICP mass spectrometry using helium-argon mixturesas aerosol carrier. Journal of Analytical Atomic Spectrometry,Vol. 14, No. 9, pp. 1363–1368.
Günther D., Kane R.E. (1999a) Laser ablation–inductively coupledplasma–mass spectrometry: A new way of analyzing gem-stones. Gems & Gemology, Vol. 35, No. 3, pp. 160–161.
Günther D., Kane R.E. (1999b) Laser ablation-inductively coupledplasma–mass spectrometry—A new way of analyzing gem-stones. In Gemmologist’s Handbook, XXXVII InternationalGemmological Conference, India 1999, Forum of Indian
Gemmologists for Scientific Studies, Bombay, p. 25.Guillong M., Günther D. (2001) Quasi “non-destructive” laser
ablation–inductively coupled plasma–mass spectrometry fin-gerprinting of sapphire. Spectrochimica Acta B, Vol. 56, No. 7,pp. 1219–1231.
Hänni H.A., Kezer C.J. (1983) Neues vom Smaragdvorkommemvon Santa Terezinha de Goiás, Brasilien. Gemmologie:Zeitschrift der Deutschen Gemmologischen Gesellschaft, Vol.32, No. 1, pp. 50–58.
Hänni H.A., Krzemnicki M.S., Kiefert L., Chalain, J.P. (2004) Einneues Instrument für die analytische Gemmologie: LIBS. Gem-mologie: Zeitschrift der Deutschen Gemmologischen Gesell-schaft, Vol. 53, No. 2–3, pp. 79–86.
Hammarstrom J.M. (1989) Mineral chemistry of emeralds andsome associated minerals from Pakistan and Afghanistan: Aelectron microprobe study. In A.H. Kazmi and L.W. Snee, Eds.,Emeralds of Pakistan: Geology, Gemology and Genesis, VanNostrand Reinhold, New York, pp. 125–150.
Henn U. (1988) Untersuchungen an Smaragden aus dem Swat-Tal, Pakistan. Zeitschrift der Deutschen GemmologischenGesellschaft, Vol. 37, No. 3/4, pp. 121–127.
Hirata T., Nesbitt R.W. (1995) U-Pb isotope geochronology of zir-con: Evaluation of the laser probe-inductively coupled plasmamass spectrometry technique. Geochimica et CosmochimicaActa, Vol. 59, No. 12, pp. 2491–2500.
Horn I., Rudnick R.L., McDonough W.F. (2000) Precise elementaland isotope ratio measurement by simultaneous solution neb-ulization and laser ablation-ICP-MS: Application to U-Pbgeochronology. Chemical Geology, Vol. 164, No. 3–4, pp.281–301.
Jackson S., Pearson N., Griffin W. (2001) In situ isotope ratio deter-mination using laser-ablation (LA)–magnetic sector–ICP-MS. InP. Sylvester, Ed., Laser-Ablation-ICPMS in the Earth Sciences:Principles and Applications, Short Course Series, Vol. 29,Mineralogical Association of Canada, St. Johns, Newfoundland,pp. 105–120.
Jarvis K.E., Gray A.L., Houk R.S. (1992) Handbook of InductivelyCoupled Plasma Mass Spectrometry. Chapman and Hall, NewYork.
Jeffries T.E., Perkins W.T., Pearce N.J.G. (1995) Comparison ofinfrared and ultraviolet-laser probe microanalysis inductive-ly–coupled plasma–mass spectrometry in mineral analysis.Analyst, Vol. 120, No. 5, pp. 1365–1371.
Jeffries T.E., Jackson, S.E., Longerich H.P. (1998) Application of afrequency quintupled Nd:YAG source (λ = 213 nm) for laserablation ICP-MS analysis of minerals. Journal of AnalyticalAtomic Spectrometry, Vol. 13, No. 9, pp. 935–940.
Jenner G.A., Foley S.F., Jackson S.E., Green T.H., Fryer B.J.,Longerich H.P. (1993) Determination of partition coefficientsfor trace elements in high pressure-temperature experimentalrun products by laser ablation microprobe-inductively coupledplasma-mass spectrometry (LAM-ICP-MS). Geochimica etCosmochimica Acta, Vol. 57, No. 23–24, pp. 5099–5103.

118 APPLICATIONS OF LA-ICP-MS TO GEMOLOGY GEMS & GEMOLOGY SUMMER 2006
Kanicky V., Mermet J.-M. (1999) Use of a single calibration graphfor the determination of major elements in geological materi-als by laser ablation inductively coupled plasma atomic emis-sion spectrometry with added internal standards. Fresenius’Journal of Analytical Chemistry, Vol. 363, No. 3, pp. 294–299.
Kanis J. (2001) The Itabira emerald field, MG, Brazil. 28thInternational Gemmological Conference, Madrid, Spain,October 8–11. pp. 49–52.
Krzemnicki M.S., Hänni H.A., Walters R.A. (2004) A new methodfor detecting Be diffusion-treated sapphires: Laser-inducedbreakdown spectroscopy (LIBS). Gems & Gemology, Vol. 40,No. 4, pp. 314–322.
Lind Th., Schmetzer K., Bank H. (1986) Blue and green beryls(aquamarine and emeralds) of gem quality from Nigeria.Journal of Gemmology, Vol. 20, No. 1, pp. 40–48.
Loucks R.R., Eggins S.M., Sheglley L.M.G., Kinsley L.P.J., WareN.G. (1995) Development of the inductively-coupled-plasmamass spectrometry ultraviolet laser trace-element micro-ana-lyzer (ICPMS-ULTEMA). In Research School of Earth SciencesAnnual Report, Australian National University, Canberra, pp.138–140.
Milisenda C.C., Malango V., Taupitz K.C. (1999) Edelsteine ausSambia-Teil 1: Smaragd. Gemmologie: Zeitschrift der DeutschenGemmologischen Gesellschaft, Vol. 48, No. 1, pp. 9–28.
Moroz I.I., Eliezri I.Z. (1998) Emerald chemistry from differentdeposits: An electron microprobe study. Australian Gem-mologist, Vol. 20, No. 2, pp. 64–69.
Muhlmeister S., Fritsch F., Shigley J.E., Devouard B., Laurs B.M.(1998) Separating natural and synthetic rubies on the basis oftrace-element chemistry. Gems & Gemology, Vol. 34, No. 2,pp. 80–101.
Nenoyer E.R., Fredeen K.J., Hager J.W. (1991) Laser solid samplingfor inductively coupled plasma mass spectrometry. AnalyticalChemistry, Vol. 63, No. 8, pp. 445A–475A.
Norman M. (2001) Applications of laser-ablation ICPMS to thetrace element geochemistry of basaltic magmas and mantleevolution. In P. Sylvester, Ed., Laser-Ablation-ICP-MS in theEarth Sciences: Principles and Applications, Short CourseSeries, Vol. 29, Mineralogical Association of Canada, St. Johns,Newfoundland, pp. 163–184.
Novak S.W., Magee C.W., Moses T., Wang W. (2004) Using SIMSto diagnose color changes in heated gem sapphires. AppliedSurface Science, Vol. 231–232, pp. 917–920.
Pearce N.J.G., Perkins W.T., Westgate J.A., Gorton M.P., JacksonS.E., Neal C.R., Chenery S.P. (1997) Application of new andpublished major and trace elements data for NIST SRM 610and NIST SRM 612 glass reference materials. GeostandardsNewsletter, Vol. 21, No. 1, pp. 115–144.
Pollard A.M., Heron H. (1996) Archaeological Chemistry. TheRoyal Society of Chemistry, London.
Pulz G.M., D’el-Rey Silva L.J.H., Barros Neto L.S., Brum T.M.M.,Juchem P.L., Santos C.A., Pereira V.P., Silva J.J. (1998) Thechemical signature of emeralds from the Campos Verdes-SantaTerezinha mining district, Goias, Brazil. Journal of Gem-mology, Vol. 26, No. 4, pp. 252–261.
Rankin A.H., Greenwood J., Hargreaves D. (2003) Chemical fingerprinting of some east African gem rubies by laser ablation ICP-MS. Journal of Gemmology, Vol. 28, No. 8, pp. 473–482.
Reed S.J.B. (1989) Ion microprobe analysis: A review of geologicalapplications. Mineralogical Magazine, Vol. 53, pp. 3–24.
Resano M., Vanhaecke F., Hutsebaut D., De Corte K., Moens L.(2003) Possibilities of laser ablation-inductively coupled plasma-mass spectrometry for diamond fingerprinting. Journal ofAnalytical Atomic Spectrometry, Vol. 18, No. 10, pp.1238–1242.
Saminpanya S., Manning D.A.C., Droop G.T.R., HendersonC.M.B. (2003) Trace elements in Thai gem corundums. Journalof Gemmology, Vol. 28, No. 7, pp. 399–415.
Scarratt K. (2002) Orange-pink sapphire alert. American Gem Trade
Association Gemological Testing Center, www.agta-gtc.org/2002-01-08_orangesapphirealert.htm, January 8.
Schrader H.W. (1987) Natürliche und synthetische Smaragde.Einbeitrag zur Kristallchemie der Berylle. Ph.D. dissertation,Fachbereich Geowissenschaften der Johannes GutenbergUniversität Mainz, Germany.
Schwarz D. (1990a) Die brasilianischen Smaragde und ihreVorkommen: Santa Terezinha de Goias/GO. Zeitschrift derDeutschen Gemmologischen Gesellschaft, Vol. 39, No. 1, pp.13–44.
Schwarz D. (1990b) Die chemische Eigenschaften der Smaragde I.Brasilien. Zeitschrift der Deutschen Gemmologischen Gesell-schaft, Vol. 39, No. 4, pp. 233–272.
Schwarz D. (2004) The world of emeralds. 30th GemmologicalConference of All Japan, Abstracts Volume, Kyoto, Japan, June12–13.
Schwarz D., Kanis J., Kinnaird J. (1996) Emerald and green berylfrom central Nigeria. Journal of Gemmology, Vol. 25, No. 2,pp. 117–141.
Schwarz D., Giuliani K. (2000) Emerald deposits: A review. InBrazil 2000: 31st International Geological Congress, AbstractsVolume, Aug. 6–17, Rio de Janeiro.
Shida J., Kitawaki H., Abduriyim A. (2002) Investigation of corun-dum heat-treated by a new technique. Journal of the Gem-mological Society of Japan, Vol. 24, No. 1–4, pp.13–23.
Stephens W.E. (1946) A pulsed mass spectrometer with time dis-persion. Physical Review, Vol. 69, No. 11–12, pp. 691.
Stern W.B., Hänni H.A. (1982) Energy-dispersive X-ray spectrom-etry: A non-destructive tool in gemmology. Journal of Gem-mology, Vol. 18, No. 4, pp. 285–296.
Stockton C.M., Manson D.V. (1981) Scanning electronmicroscopy in gemology. Gems & Gemology, Vol. 17, No. 2,pp. 72–79.
Themelis T. (2004) LIBS: A spark of inspiration in gemologicalanalytical instrumentation. Australian Gemmologist, Vol. 22,pp. 138–145.
Thomson J.J. (1911) Rays of positive electricity. PhilosophicalMagazine, Vol. 6, No. 20, pp. 752–767.
Tye C., Woods G., McCurdy E., Wilbur S. (2004) Semiquantitativeanalysis—7500 ORS as a powerful & rapid survey tool. AgilentICP-MS Journal, No. 20, pp. 2–3.
Tykot R.H. (2002) Chemical fingerprinting and source tracing ofobsidian: The central Mediterranean trade in black gold.Accounts of Chemical Research, Vol. 35, pp. 618–627.
Wang W., Hall M., Smith C.P., Shigley J.E. (2003) Applications todiamond testing: A new analytical technique: LA-ICP-MS.Rapaport Diamond Report, Vol. 26, No. 33, pp. 177–181.
Wang W., Scarratt K., Emmett J.L., Breeding C.M., Douthit T.R.(2006) The effects of heat treatment on zircon inclusions inMadagascar sapphires. Gems & Gemology, Vol. 42, No. 2, pp.134–150.
Watling R.J., Herbert H.K., Barrow I.S., Thomas A.G. (1995)Analysis of diamond and indicator minerals for diamondexploration by laser ablation–inductively coupled plasma massspectrometry. Analyst, Vol. 120, No. 5, pp. 1357–1364.
Yu N.K., Tang S.M., Tay T.S. (2000) PIXE studies of emeralds. X-Ray Spectrometry, Vol. 29, pp. 267–278.
Zwaan J.C., Kanis J., Petsch E.J. (1997) Update on emerald fromthe Sandawana mines, Zimbabwe. Gems & Gemology, Vol.33, No. 2, pp. 80–100.
Zwaan J.C. (2001) Preliminary study of emeralds from the Piteirasemerald mine, Minas Gerais, Brazil. XXVIII InternationalGemmological Conference, Spain 2001, Extended Abstracts,Oct. 8–11, Madrid, pp. 106–109.
Zwaan J.C., Seifert A.V., Vrana S., Laurs B.M., Anckar B.,Simmons W.B., Falster A.U., Lustenhouwer W.J., MuhlmeisterS., Koivula J.I., Garcia-Guillerminet H. (2005) Emeralds fromthe Kafubu area, Zambia. Gems & Gemology, Vol. 41, No. 2,pp. 116–148.

Last chance to register for the
THE SCIENCE OF GEMOLOGY is expanding in many exciting
directions that encompass not only mineralogy and geology, but
also fields such as physics, chemistry, and materials science. At
the GIA Gemological Research Conference, a multidisciplinary
approach will explore the challenges posed by new synthetic and
treated gem materials, as well as the characterization of natural
gems from traditional and new sources. Invited lectures, submitted
oral presentations, and a poster session will explore a diverse
range of contemporary topics in gemology and related sciences.
Geology of Gem Deposits• Dr. Jeff Harris, University of Glasgow, UK
Diamond occurrence and evolution• Dr. David London, University of Oklahoma, Norman Geochemical cycle of certain elements that form gems
Gem Characterization Techniques• Dr. George Rossman, California Institute of Technology,
Pasadena Characterization of nanofeatures in gem materials• Dr. Emmanuel Fritsch, IMN, University of Nantes, France Review and forecast of important techniques in gemology
New Gem Localities• Dr. Lawrence Snee, U.S. Geological Survey, Denver
Mapping of gem localities in Afghanistan and Pakistan• Dr. Federico Pezzotta, Museo Civico di Storia Naturale,
Milan Update on gem localities in Madagascar
Gem Synthesis• Dr. James Butler, Naval Research Laboratory,
Washington, DC Growth of CVD synthetic diamond• Dr. Ichiro Sunagawa, Tokyo Growth, morphology,
and perfection of single crystals: Basic concepts in discriminating natural from synthetic gemstones
General Gemology• Shane McClure, GIA Laboratory, Carlsbad Genetic source type classification of gem corundum
• Menahem Sevdermish, Advanced Quality A.C.C. Ltd., Ramat Gan, Israel Color communication: The analysis of color in gem materials
Diamond and Corundum Treatments• Ken Scarratt, GIA Research, BangkokCorundum treatments
• Dr. Mark Newton, University of Warwick, Coventry, UK Diamond treatments
Eight additional speakers for each session will beselected from submitted abstracts.
Keynote Speakers
The GIA Gemological Research Conference will be held in
conjunction with the 4th International Gemological Symposium,
which will take place August 27–29, 2006. For further informa-
tion on attending the GIA Gemological Research Conference,
contact the organizing committee at:
E-mail: [email protected]
Dr. James E. Shigley, Phone: 760-603-4019
Brendan M. Laurs, Phone: 760-603-4503
Fax: 760-603-4021
Web: www.gia.edu/gemsandgemology
or www.symposium.gia.edu
Manchester Grand Hyatt Hotel
San Diego, California
Sponsored by Charles & Colvard, Ltd.
The Gemological Research Conference costs only $295 ($395 after August 11),including breakfast and lunch both days, a cocktail reception on August 26, andGIA's 75th Anniversary Gala on August 27. To register for the GemologicalResearch Conference or the International Gemological Symposium, visitwww.symposium.gia.edu.
Register Now
Register Now!
The titles of confirmed presentations (both oral and poster) forthe Gemological Research Conference are now available on theconference website (www.gia.edu/gemsandgemology). The listwill be updated as additional presentations are confirmed, andattendees should check periodically for future updates as theconference approaches.
List of Confirmed Presentations Now Available
The August 25 and 30 field trips to the Pala pegmatite district have reached fullcapacity, and there are substantial waiting lists for each trip.
Pala Pegmatite Field Trips—Sold Out

120 CULLINAN I AND II DIAMONDS GEMS & GEMOLOGY SUMMER 2006
he huge rough diamond known as theCullinan was found a century ago, when theBritish Empire was at the apex of its power.
Its discovery, telegraphed around the world, alsobrought fame to the then newly opened Premiermine near Pretoria, South Africa. For many years,the great diamond was a symbol of the world’smightiest empire. At 3,106 ct, today it remains thelargest gem diamond ever discovered, and two of thediamonds cut from it lie at the heart of the CrownJewels of England (figure 1). Although much hasbeen written about the original piece of rough andthe diamonds fashioned from it, this article offerspreviously undocumented details about the famedCullinan diamond, including the first comprehen-sive report on the gemological examination of the530 ct Cullinan I and the 317 ct Cullinan II.
THE PREMIER/CULLINAN MINELocated on a former farm 25 km east of Pretoria, thePremier mine (figure 2; renamed the Cullinan minefor its centennial in 2003) began full operation in1903. The Cullinan was discovered less than twoyears later, the first extremely large diamond from a
mine that, in its 100+ years of operation, has yield-ed more rough diamonds over 100 ct (300+) than anyother single source, including more than 25% of allthe 400+ ct diamonds ever discovered (De BeersGroup, 2006).
Among the other legendary diamonds that havecome from the mine are (all weights are for therough): the Taylor-Burton (240.8 ct), Premier Rose(353.9 ct), Niarchos (426.5 ct), Centenary (599.1ct), and Golden Jubilee (755.5 ct). The Fancy Vividblue Heart of Eternity (27.64 ct polished—roughweight not disclosed) and the other 11 large bluediamonds that formed De Beers’s MillenniumCollection also came from this mine (L. Hori, pers.comm., 2005).
The Premier mine ceased operations severaltimes during the past century and weathered a crit-ical redevelopment project. It first closed in 1914 atthe outbreak of World War I and reopened two yearslater shortly before De Beers acquired a majority
T
THE CULLINAN DIAMOND CENTENNIAL: A HISTORY AND GEMOLOGICAL
ANALYSIS OF CULLINANS I AND II Kenneth Scarratt and Russell Shor
See end of article for About the Authors and Acknowledgments.GEMS & GEMOLOGY, Vol. 42, No. 2, pp. 120–132.© 2006 Gemological Institute of America
The year 2005 marked a century since the discovery of the largest gem diamond ever found: the3,106 ct Cullinan. Eight decades after it was mined, a team of gemologists conducted the firstmodern examinations of the two largest diamonds cut from the rough, the 530 ct Cullinan I andthe 317 ct Cullinan II, which have been part of the Crown Jewels of England since their presenta-tion to King Edward VII in 1908. This article traces the history of this famous piece of rough andits source, South Africa’s Cullinan (formerly Premier) mine, which has yielded more significantdiamonds than any other single locality. It also presents the full details of the examination andgrading of these two approximately D-color, potentially flawless historic diamonds.

stake. The Great Depression, which brought a pre-cipitous drop in world diamond sales, forced it toclose again in 1932. The mine did not reopen untilafter World War II. De Beers acquired full owner-ship of the Premier mine in 1977 (De Beers Group,2006). At the time, continued operation seemeddoubtful because excavations were nearing a 70-m-thick sill of volcanic rock that protruded throughthe entire kimberlite pipe at the 550 m mark.Because the mine remained so productive, De Beersultimately determined that the expense of driving
an underground shaft through the sill to excavatethe pipe from beneath would be economic. Whenopen, the mine has consistently produced well overa million carats yearly. In 2004, the renamedCullinan mine yielded 1.3 million carats (De BeersGroup, 2004).
Current mining is 763 m below the surface, andDe Beers is investigating the extension of miningbelow 1100 m. This would add 20–25 years to thelife of the mine (Fernandes, 2005).
BACKGROUND OF THE CULLINAN DIAMONDOn January 26, 1905, the manager of the Premiermine, Captain Frederick Wells, retrieved the largecrystal (figure 3) from near the rim of the shallow pit
CULLINAN I AND II DIAMONDS GEMS & GEMOLOGY SUMMER 2006 121
Figure 1. The Cullinan I and II diamonds are focalpoints in the Crown Jewels of England. The 530 ctCullinan I is set in the Sovereign’s Sceptre withCross (left), and the 317 ct Cullinan II is set in theImperial State Crown (above). Also shown in thecrown is the Black Prince’s “Ruby” (actually, a redspinel; 170 ct) and St. Edward’s Sapphire. Photo ofscepter by Alan Jobbins. Top photo, Crown ©/TheRoyal Collection © Her Majesty Queen Elizabeth II.
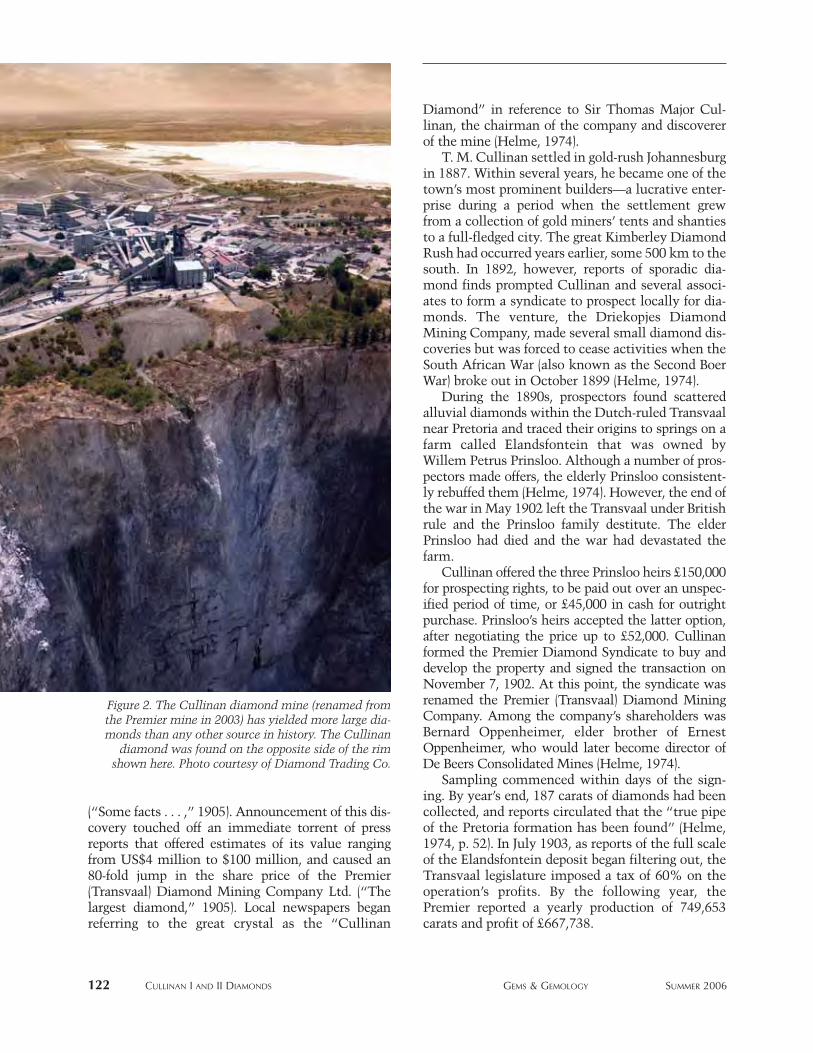
122 CULLINAN I AND II DIAMONDS GEMS & GEMOLOGY SUMMER 2006
(“Some facts . . . ,” 1905). Announcement of this dis-covery touched off an immediate torrent of pressreports that offered estimates of its value rangingfrom US$4 million to $100 million, and caused an80-fold jump in the share price of the Premier(Transvaal) Diamond Mining Company Ltd. (“Thelargest diamond,” 1905). Local newspapers beganreferring to the great crystal as the “Cullinan
Diamond” in reference to Sir Thomas Major Cul-linan, the chairman of the company and discovererof the mine (Helme, 1974).
T. M. Cullinan settled in gold-rush Johannesburgin 1887. Within several years, he became one of thetown’s most prominent builders—a lucrative enter-prise during a period when the settlement grewfrom a collection of gold miners’ tents and shantiesto a full-fledged city. The great Kimberley DiamondRush had occurred years earlier, some 500 km to thesouth. In 1892, however, reports of sporadic dia-mond finds prompted Cullinan and several associ-ates to form a syndicate to prospect locally for dia-monds. The venture, the Driekopjes DiamondMining Company, made several small diamond dis-coveries but was forced to cease activities when theSouth African War (also known as the Second BoerWar) broke out in October 1899 (Helme, 1974).
During the 1890s, prospectors found scatteredalluvial diamonds within the Dutch-ruled Transvaalnear Pretoria and traced their origins to springs on afarm called Elandsfontein that was owned byWillem Petrus Prinsloo. Although a number of pros-pectors made offers, the elderly Prinsloo consistent-ly rebuffed them (Helme, 1974). However, the end ofthe war in May 1902 left the Transvaal under Britishrule and the Prinsloo family destitute. The elderPrinsloo had died and the war had devastated thefarm.
Cullinan offered the three Prinsloo heirs £150,000for prospecting rights, to be paid out over an unspec-ified period of time, or £45,000 in cash for outrightpurchase. Prinsloo’s heirs accepted the latter option,after negotiating the price up to £52,000. Cullinanformed the Premier Diamond Syndicate to buy anddevelop the property and signed the transaction onNovember 7, 1902. At this point, the syndicate wasrenamed the Premier (Transvaal) Diamond MiningCompany. Among the company’s shareholders wasBernard Oppenheimer, elder brother of ErnestOppenheimer, who would later become director ofDe Beers Consolidated Mines (Helme, 1974).
Sampling commenced within days of the sign-ing. By year’s end, 187 carats of diamonds had beencollected, and reports circulated that the “true pipeof the Pretoria formation has been found” (Helme,1974, p. 52). In July 1903, as reports of the full scaleof the Elandsfontein deposit began filtering out, theTransvaal legislature imposed a tax of 60% on theoperation’s profits. By the following year, thePremier reported a yearly production of 749,653carats and profit of £667,738.
Figure 2. The Cullinan diamond mine (renamed fromthe Premier mine in 2003) has yielded more large dia-monds than any other source in history. The Cullinan
diamond was found on the opposite side of the rimshown here. Photo courtesy of Diamond Trading Co.

Following the Cullinan’s discovery, the compa-ny displayed the great diamond at the StandardBank in Johannesburg. An estimated 8,000–9,000onlookers crowded the building to view it, thoughthe company had issued only 3,000 visitor passes.The local newspaper, the Transvaal Leader,referred to the stone as the “Cullinan Diamond” ina February 2, 1905, report on the exhibition. Thearticle also proposed the idea of purchasing thelarge piece of rough for £500,000 for presentation toKing Edward VII of England who, because of theSouth African War, had extended his imperial ruleto the Transvaal.
The discovery also touched off a mystery thathas never been solved. An interview with Dr.Molengraaff of the South African Mines, Com-merce and Industries Commission shortly after thebig diamond was found noted that it was but a por-tion of a much larger stone, because only a relative-ly small section of the crystal had its “original nat-ural surface” (“More about . . . ,” 1905, p. 71). Headded that “four pieces of this original stone havebeen broken off along cleavage planes . . . each ofthese fragments must have been of considerablesize” (“More about . . . ,” 1905, p. 71). This conclu-sion was disputed later on, but most of those whodisagreed had not examined the rough stone. Noidentifiable pieces have ever been found (R. Walker,pers. comm., 2006).
In April 1905, the rough gem was dispatched tothe Premier (Transvaal) Diamond Mining Company’sLondon sales agent, S. Neumann & Co., where itremained for more than two years while theTransvaal Legislative Assembly debated whether ornot to buy it. By this time, Afrikaans leaders GeneralLouis Botha and Jan Smuts had pledged to supportBritish rule and thrown their influence behind thepurchase. After the intercession of then-ColonialUnder-Secretary Winston Churchill, the Transvaallegislature approved in August 1907 a resolution topurchase the diamond for £150,000 and made theoffer formal in October.
The monarch replied through the Secretary ofState for the Colonies, Lord Elgin, that he wouldaccept the diamond “as a token of the loyalty andattachment of the people of Transvaal, to his throneand person.” King Edward VII also promised thatthe diamond would be “preserved among the histor-ical jewels which form the heirlooms of the Crown”(Helme, 1974, p. 86). He received the rough dia-mond on November 9, 1907, the occasion of his66th birthday.
Following the Discovery, Controversy About theWeight. Although the Cullinan is perhaps the mostdocumented diamond in history, reports of its actu-al weight varied because of inaccurate scales andthe lack of standardization in carat weights. A“British carat” was equivalent to 0.2053 g while a“Dutch carat” equaled 0.2057 g; both differed fromthe metric carat, 0.2 g. The now-accepted weight of3,106 ct was based on the metric carat. The differ-ences prompted demands to create an internation-al carat weight standard (Spencer, 1910).
Initial press reports cited the weighing at the mineas 3,032 ct. The Premier Company’s Johannesburgoffice weighed the diamond at 3,0243⁄4 ct, while theLondon office gave a reading of 3,0253⁄4 ct. These dif-ferences, all in British carats, were attributed to thefact that the brass weights used to counterbalance thescales were not uniform (some having been wornafter a great deal of use) and to the variation in alti-tude between Johannesburg and London.
The man selected to cut the diamond was JosephAsscher of Amsterdam. His firm, I. J. Asscher andCompany of Amsterdam, had cut the 995 ctExcelsior diamond in 1903. Asscher weighed the dia-mond at 3,0193⁄4 Dutch carats.
The Cutting of the Cullinan. Even before theTransvaal legislature had enacted its resolution,Cullinan had engaged I. J. Asscher to polish theapproximately 10 × 6 × 5 cm diamond. Ian Balfour’sFamous Diamonds (2000) offers a vivid, detailed
CULLINAN I AND II DIAMONDS GEMS & GEMOLOGY SUMMER 2006 123
Figure 3. This model illustrates the Cullinan roughfrom two angles. Some geologists, based on the rela-tively small surface with naturals, had the opinionthat the Cullinan rough was only part of a muchlarger crystal that had been cleaved by naturalforces. Photo courtesy of the Diamond Trading Co.

124 CULLINAN I AND II DIAMONDS GEMS & GEMOLOGY SUMMER 2006
account of the cutting process, summarized here. On February 6, 1908, Asscher commenced exam-
ining the diamond, which had two visible inclusions(Helme, 1974). Four days later, he began the cleavingoperation (figure 4). The first blow broke the knifeand left the diamond intact. The second blow, usinga new cleaving knife (figure 5), split the stone intotwo sections; one weighing 1977.5 Dutch carats andthe other weighing 1040.5 Dutch carats (now givenas 2029.9 and 1068.8 ct, respectively). On February14, he cleaved the larger piece into two. The polish-ing fell to his staff, overseen by Henri Koe, a 20-yearveteran. Polishing of the Cullinan I began March 2,1908. Asscher’s staff started work on May 29 on thesection that would become the Cullinan II.
The Cullinan yielded a total of nine major stones(see text below and figure 6), 96 smaller gems, and9.5 carats of unpolished “fragments.” Work on the Cullinan I was completed
September 12, 1908, and with three polishers work-ing 14 hours a day, all of the gems were finished byearly November. On November 21, the two largestgems, Cullinan I (530.2 ct) and Cullinan II (317.4ct), were presented to King Edward VII at Windsor.The king named the large diamond the Great Starof Africa, though the Cullinan appellation hasremained (Balfour, 2000).
The Cullinans I and II (figure 7) were retained bythe monarch for the Crown Jewels. Most of the otherstones (with the exceptions noted below) were givento Asscher for his fee. King Edward purchased theCullinan VI for his consort, Queen Alexandra. Thepeople of South Africa purchased the other six majordiamonds and presented them to Edward’s daughter-in-law Queen Mary (consort of George V, and an avidjewelry collector) in 1910, the year her husbandacceded to the throne. These now belong to hergranddaughter, Queen Elizabeth II.
The major gems are:
• Cullinan I (also called the Great Star ofAfrica)—a 530.20 ct pear shape set in theSovereign’s (or Royal) Sceptre with Cross ondisplay in the Tower of London.
• Cullinan II (also known as the Lesser Star ofAfrica)—a 317.40 ct cushion-shaped brilliantset in the Imperial State Crown on display inthe Tower of London.
• Cullinan III—a 94.40 ct pear shape that is setwith the Cullinan IV (nicknamed “Granny’schips”) in a brooch currently in the private col-lection of Queen Elizabeth II. In 1911, they had
Figure 5. The hammer and knife used to cleavethe Cullinan diamond. The knife is seen herespanning two models of the rough Cullinan.Photo by Alan Jobbins.
Figure 4. Joseph Asscher reenacts the cleaving of the3,106 ct Cullinan rough. Photo courtesy of
the Diamond Trading Co.

been set in a detachable setting in QueenMary’s crown, but she removed them andreplaced them with replicas (Balfour, 2000).
• Cullinan IV—a 63.60 ct square-cut brilliantthat is set with the Cullinan III (see above).
• Cullinan V—an 18.80 ct heart shape set in abrooch for Queen Mary that is now owned byQueen Elizabeth II.
• Cullinan VI—an 11.50 ct marquise that wasoriginally presented to Queen Alexandra byKing Edward VII, and is now mounted in anemerald and diamond necklace owned byQueen Elizabeth II.
• Cullinan VII—an 8.80 ct marquise set withthe Cullinan VIII in a pendant now owned byQueen Elizabeth II.
• Cullinan VIII—a 6.80 ct modified cushionshape set with the Cullinan VII (see above).
• Cullinan IX—a 4.39 ct pear shape mountedinto a ring for Queen Mary that is now ownedby Queen Elizabeth II.
The remaining 96 polished diamonds with a totalweight of 7.55 ct were sold by Asscher to variousclients (Spencer, 1910). Two were purchased by Gen.Louis Botha, then prime minister of South Africa.Several small stones went to Arthur and AlexanderLevy, the London diamond merchants chosen tooversee the cutting operation.
GEMOLOGICAL EXAMINATIONS OF THE CULLINANS I AND IIEach February during the 1980s, a team fromGarrard & Co., The Crown Jewellers, visited theJewel House in the Tower of London to clean and, ifnecessary, repair the many crowns, scepters, andother items in the English Crown Jewels. Theseannual visits necessitated that the Jewel House,which is normally open for public viewing, beclosed for the duration of each visit.
When it was recognized that the descriptions ofthe Regalia (Holmes, 1937, 1959; Holmes, 1974;Mears, 1986) were outdated and needed to be
CULLINAN I AND II DIAMONDS GEMS & GEMOLOGY SUMMER 2006 125
Figure 7. The Cullinan II and I diamonds are shownhere with a 1 ct round brilliant-cut for scale. Photoby Alan Jobbins.
Figure 6. These arereplicas of the majorpolished stones cutfrom the 3,106 ctCullinan rough. Top(left to right): II, I, III.Bottom (left to right):VIII, VI, IV, V, VII, IX.Photo courtesy of theDiamond Trading Co.

126 CULLINAN I AND II DIAMONDS GEMS & GEMOLOGY SUMMER 2006
revised, the annual cleaning periods were also usedto conduct a thorough examination of the jewels,including a detailed gemological examination. Thesetook place each February from 1986 to 1989.
This effort originated when Alan Jobbins, curatorof minerals and gemstones at the Geological Museumof London from 1950 to 1983, was asked by ClaudeBlair, formerly keeper of metalwork at the Victoria &Albert Museum, to organize the gemological portionof the Regalia’s examination with a view toward theproduction of a book (catalogue) on the subject.Jobbins then approached the senior author (KS, at thetime head of the Gem Testing Laboratory of GreatBritain [GTLGB; now the Gem Testing Laboratory ofGem-A]) and Dr. Roger Harding of the GeologicalMuseum of London and asked that they join him inthis endeavor. Subsequently, other gemologists wereoccasionally asked to be present during these exami-nations, including Nigel Israel (gemologist andappraiser) and Eric Emms (GTLGB), as well as Dr.Chris Welbourn of DTC Research, Maidenhead. Thetwo-book set, The Crown Jewels: The History of theCoronation Regalia in the Jewel House of the Towerof London, was eventually published in 1998 (Blair etal., 1998). The work, of which only 650 were printedby the Stationery Office, London, at £1,000 per set, didnot include details of the spectra, images of the dia-monds in the spectrometers, or the color gradingimages, which are included in the following report.
With the exception of the George IV diadem,which was examined in 1989 on the premises of theGTLGB, all the gemological examinations of theCrown Jewels took place in the vault below theWaterloo Barracks in the Tower of London. Describedhere is the examination of the Cullinan I and II dia-monds. The smaller Cullinan diamonds, which are inthe Queen’s personal collection and not part of theCrown Jewels, were not examined.
MATERIALS AND METHODSThe Cullinan I and II diamonds were graded for colorand clarity in accordance with the normal CIBJOdiamond grading practices in place at the time of theexamination. First, both diamonds were thoroughlycleaned (figure 8), which was particularly importantsince both were still encased in their basket settings.Color grading was carried out within a standard lightbox, and the diamonds were compared against mas-terstones belonging to the GTLGB. Clarity gradingwas conducted using both a 10× loupe and a GIAGemoLite microscope set at 10× magnification. Due
Figure 8. The Cullinan II diamond is cleaned byAlan Jobbins prior to examination. Photo by K.Scarratt.
Figure 9. The Cullinan II diamond, still in its basketsetting, is positioned with Blu Tack in the beam ofthe Nicolet 510 FTIR to measure its infrared spec-trum. The inset provides a closer view of Cullinan IIin the sample chamber. Photos by K. Scarratt.

to security restrictions, a temporary laboratory hadto be set up within the vault housing the CrownJewels, providing an environment that was less thanideal for diamond grading.
For the other visual examinations, gemologicaland mineralogical microscopes with magnificationsranging from 10× to 70× were employed. Fluores-cence observations were made using a standard desk-top long-wave (365 nm)/short-wave (253.7 nm) ultra-violet (UV) lamp in the total darkness of the centralcore of the display units in the middle of the vault.
At the time of these examinations, UV-visibleand Fourier-transform infrared (FTIR) spectrometerswere not found in most gem laboratories, so it wascommon practice when documenting diamond datato take a short-wave UV transparency image of eachstone. These images were recorded by immersingphotographic paper in a dish of water (emulsion-sideup), placing the diamond table-down on the paper sothat the water covered the entire stone, and thenexposing the film to short-wave UV radiation byholding the same lamp used for the fluorescenceobservations about 30 cm directly above the paper.Once the paper was developed, if the center of thestone appeared dark (allowing for surface reflectionsfrom some facets), there was a good possibility thatit was a type II diamond (i.e., transparent to short-wave UV); if the center was white, it was probably atype I diamond (i.e., opaque to short-wave UV). Thisprocedure was performed on the Cullinans I and IIusing the underside of a workbench, a cardboard box,and a blackout curtain as a makeshift darkroom.
Note that this technique is only rarely practicedin gem laboratories today, as FTIR spectrometers arecommonly available and produce definitive data ona diamond’s type classification. Although infraredspectroscopy was also carried out on the Cullinans Iand II (see below), the decision was made to conductboth tests to accommodate those gemologists whowere not familiar with IR spectra.
Both OPL (diffraction grating) and Beck (disper-sion) handheld spectroscopes were used to examinethe visible-range spectra.
UV-visible spectra were recorded between 220and 900 nm at room temperature using a Pye-Unicam PU8800 spectrometer with a scan rate of 0.5nm/s and a bandwidth of 0.5 nm. Mid-infrared spec-tra were recorded between 7800 and 400 cm−1 usinga Nicolet 510 bench at a resolution of 4 cm−1. Thediamonds were too large for any of the standard sam-ple chamber accessories, such as a beam condenser,so none were used. To acquire the spectra, the dia-
monds were held with the aid of the putty-like adhe-sive Blu Tack (figure 9), and the stones were alignedso the beams entered the table and exited the culetor vice versa. Note that, with diamonds of this size,such “parallel windows” are likely to be largeenough to permit the collection of fairly good spec-tral data without the use of a beam condenser.
RESULTSCullinan I. General Description and Grading. TheCullinan I diamond is mounted in a yellow gold bas-ket setting that is held in the head of the Sovereign’sSceptre with Cross (also known as the Royal Sceptrewith Cross) by means of a series of screws (figure 10).
CULLINAN I AND II DIAMONDS GEMS & GEMOLOGY SUMMER 2006 127
Figure 10. This front view of the head of theSovereign’s Sceptre with Cross with Cullinan Iremoved shows the screws that hold the basket set-ting in place. The scepter, which dates to 1660–1661,had to be slightly reworked to accommodate theCullinan I diamond. Photo by Alan Jobbins.

128 CULLINAN I AND II DIAMONDS GEMS & GEMOLOGY SUMMER 2006
The scepter dates to 1660–1661, but it has had vari-ous alterations that culminated with the addition ofCullinan I by Garrard & Co. in 1910 (Blair et al.,1998). The basket setting designed for Cullinan I hasa hook attachment at its narrow end that connectsto a ring attachment on the basket setting of
Cullinan II, allowing both to be mounted in a pin fit-ting and worn as a single brooch (figures 7 and 11).
Cullinan I is cut as a pear-shaped brilliant with 41crown and 34 pavilion (including one extra) facets; itmeasures 58.9 × 45.4 × 27.7 mm and weighs 530.20ct. The girdle is faceted.
While it was possible to remove Cullinan I fromthe scepter, it was not possible to remove it from itsbasket setting. Therefore, grading for color and clar-ity was restricted by the presence of the yellow goldsetting. However, when the stone was placed nextto diamond color masterstones (in the ±1 ct range),Cullinan I compared well with the one of leastcolor, indicating that it approximated a D on theGIA color scale (again, see figure 11). Despite thereflections from the setting, the overall opinion ofthose examining the stone was that it is very prob-ably a D color.
Affecting the clarity of Cullinan I were a numberof surface imperfections: a small cleavage (“gletz”)on the pavilion and two further cleavages on thecrown, an extra facet, and an area of colorless grain-ing (figure 12). Cullinan I appeared to be free of anyother clarity features, indicating that it warranted aclarity description of “potentially flawless.” Giventhe historical significance of this very attractive dia-mond, though, it will likely never be recut.
Figure 11. Cullinan I and Cullinan II, both in theirbasket settings, are being compared with master-
stones and other diamonds of known color using astandard viewing environment. The pear-shaped dia-
mond in the foreground had previously been colorgraded as “D”. Photo by Alan Jobbins
Figure 12. In this plotting diagram of
Cullinan I, several clari-ty characteristics are
shown, including cleav-ages on the pavilionand crown (see also
inset) and some grain-ing within the stone.Photomicrograph by
K. Scarratt.

Fluorescence. Cullinan I was inert to long-wave UVradiation, but fluoresced a weak greenish gray toshort-wave UV. After the short-wave lamp wasturned off, the diamond showed a weak green phos-phorescence for at least 18 minutes.
UV-visible Spectroscopy. The UV-visible spectrumof Cullinan I (figure 13) revealed a featureless curvethat rose slightly toward the shorter wavelengths,with total absorption occurring at 236 nm. Thisspectrum is consistent with that of type II diamonds(Wilks and Wilks, 1991).
The dark center of the short-wave UV imageobtained on Cullinan I also indicated a strong possibil-ity that it was a type II diamond (again, see figure 13).
Infrared Spectroscopy. The infrared spectrum forCullinan I (figure 14) is normal for a diamond withan extremely low level of impurities and is consis-tent with that of type IIa diamonds (see, e.g., Fritschand Scarratt, 1992).
Cullinan II. General Description and Grading.Cullinan II also is set in a yellow gold basket setting(again, see figure 11) that is held in the center frontof the Imperial State Crown by screws (figure 15).Much of the content of the Imperial State Crowndates to 1838, with Cullinan II added in 1909, but
CULLINAN I AND II DIAMONDS GEMS & GEMOLOGY SUMMER 2006 129
Figure 13. The UV-visible spectra recordedfor the Cullinan I andCullinan II diamondsare consistent withtype II diamonds. Thiswas supported by thedark centers in theshort-wave UV trans-parency images alsoshown here.
Figure 14. The infrared spectrum of Cullinan I is quitesimilar to the spectra of other diamonds with lowquantities of impurities, which are designated type IIa.

130 CULLINAN I AND II DIAMONDS GEMS & GEMOLOGY SUMMER 2006
the crown in its present state (again, see figure 1) wasexecuted by Garrard & Co. for the Coronation ofGeorge VI in 1937; the arches were lowered forQueen Elizabeth II in 1953 (Blair et al., 1998). Aswith the Cullinan I diamond, the basket settingdesigned for Cullinan II has a ring attachment thatallows the two diamonds to be connected and wornas a single brooch (again, see figure 7).
Cullinan II is a cushion-shaped brilliant with 33crown and 33 pavilion facets (including the tableand culet, but excluding one very small extra faceton the pavilion). It measures 45.4 × 40.8 × 24.2 mmand weighs 317.40 ct. The girdle is faceted.
As with Cullinan I, grading for color and claritywas restricted because the diamond could not beremoved from its basket setting. However, whenthe stone was compared to the same diamond colormasterstones, Cullinan II compared well with the
one of least color, indicating that it approximated aD on the GIA color scale (again, see figure 11),despite the reflections from the gold-colored setting.
The examination for clarity revealed a number ofsurface imperfections: a small chip at the girdle, atiny pit with associated small “feathers” on thetable, and a similar feature at the edge of a star facet.There are two small parallel cleavages on a star facetand two more near the girdle on a pavilion facet, aswell as a small extra facet. A series of scratches runsdiagonally across the table facet (figure 16). CullinanII appeared to be free of any other imperfections.Like Cullinan I, the diamond is certainly potentiallyflawless, though, again, its historical significancewould likely prohibit recutting.
Fluorescence. Like Cullinan I, Cullinan II was inertto long-wave UV radiation (figure 17), but fluoresceda weak greenish gray to short-wave UV. After theshort-wave lamp was turned off, however, CullinanII displayed only short-lived phosphorescence, incontrast to that of Cullinan I. The reason for thisdiscrepancy in two diamonds from the same pieceof rough is still unknown.
UV-Visible Spectroscopy. As might be expected(again, given that the two stones were cut from
Figure 16. This plotting diagram of Cullinan II showsthe general locations of some imperfections, includingsmall pits with feathers, small cleavages, faintscratches, and a small chip and natural at the girdle.
Figure 15. The front of the Imperial State Crown withCullinan II and the large spinel known historically asthe Black Prince’s “Ruby” removed for this examina-tion. These settings are flanked by two emeralds andtwo sapphires. Photo by K. Scarratt.

the same rough), the spectrum produced was sim-ilar to that of Cullinan I (again, see figure 13). Itrevealed a curve that rose slightly toward theshorter wavelengths, a low absorbance band at265 nm (not present in the spectrum of CullinanI), and total absorption occurring at 236 nm. Aswith Cullinan I, the dark center of the short-waveUV image for Cullinan II indicated that it was UVtransparent. These results are consistent withtype II diamonds.
Infrared Spectroscopy. The infrared spectrum forCullinan II was recorded between 7800 and 400 cm−1
at room temperature. The spectrum is normal fora diamond with an extremely low level of impuri-ties, consistent with type IIa diamonds, and simi-lar to the infrared spectrum of Cullinan I (figure14). A slight hump centered near 1100 cm−1 pres-ent in the spectrum of Cullinan II was the only dif-ference detected in the spectra of the two dia-monds (figure 18).
CONCLUSIONTo date, the original Cullinan diamond is, at 3,106ct, the largest rough diamond on record. Last year,2005, marked the centennial of its discovery, and
2008 marks the centennial of the cutting of this his-toric piece of rough by Joseph Asscher. Although the530.20 ct Cullinan I has been surpassed in size bythe 545.67 ct Golden Jubilee—a brown diamond cutin 1990 from rough that was also found at SouthAfrica’s Premier mine—it remains the largest color-less cut diamond and one of the world’s most leg-endary gemstones, on view to millions of visitorseach year in the Tower of London. It is a cornerstoneof the Crown Jewels of England and, because of theperiod and circumstances of its discovery and acqui-sition, it remains a powerful symbol of the BritishEmpire at its zenith.
Despite its legendary status, a complete pub-lished gemological report on the diamond was notavailable until this article. These gemologicalexaminations, which found the polished diamondsto be D color, potentially flawless in clarity, andtype IIa, serve to enhance the Cullinan’s legendarystature.
CULLINAN I AND II DIAMONDS GEMS & GEMOLOGY SUMMER 2006 131
Figure 18. The infrared spectra of Cullinans I and IIare expanded here to show the “nitrogen region” at1300–800 cm−1. The slight hump in the spectrum forCullinan II occurs at ~1100 cm−1.
Figure 17. The Imperial State Crown with Cullinan IIin place is shown during exposure to long-wave UVradiation. Note that the Cullinan II is inert underthese conditions. A ruby inset in the red spinel (theBlack Prince’s “Ruby,” which had been pierced duringmedieval times to be worn as a pendant) locatedabove the Cullinan II and two rubies set in fleurs-de-lis show red fluorescence; several other diamondsshow blue fluorescence. Photo by Alan Jobbins.

132 CULLINAN I AND II DIAMONDS GEMS & GEMOLOGY SUMMER 2006
ABOUT THE AUTHORSMr. Scarratt ([email protected]) is director of GIAResearch (Thailand), in Bangkok, and Mr. Shor is seniorindustry analyst at GIA in Carlsbad, California; previously, heserved as diamonds editor for Jewelers’ Circular Keystoneand editor-in-chief of New York Diamonds and Gemkeymagazines.
ACKNOWLEDGMENTSThe authors are grateful to the following for providing infor-mation: Lynette Hori, Diamond Trading Company, London;Brig. Kenneth Mears, former keeper of the Crown Jewels,London; Robin Walker, former manager of technical informa-tion, De Beers, London; and E. Alan Jobbins, president ofGem-A, London.
REFERENCESBalfour I. (2000) Famous Diamonds. Christie, Manson & Woods
Ltd., London.Blair C., Bury S., Grimwade A., Harding R., Jobbins E.A., King D.,
Scarratt K. (1998) The Crown Jewels: The History of theCoronation Regalia in the Jewel House of the Tower of London,Stationery Office Books, London.
De Beers Group (2004) Annual Review 2004. http://www.debeersgroup.com/NR/rdonlyres/96870848-824D-495A-B273-135AC9657613/739/DeBeers_AR2004.pdf.
De Beers Group (2006) History. http://www.debeersgroup.com/ debeersweb/debeersweb/De+Beers+Home/Visit+a+Mine/Cullinan/History.htm.
Fernandes C. (2005) Cullinan diamond mine, Gauteng. http://www.miningweekly.co.za/min/sector/diamonds/?show=19865.
Fritsch E., Scarratt K. (1992) Natural-color nonconductive gray-to-blue diamonds. Gems & Gemology, Vol. 28, No. 1, pp. 35–42.
Helme N. (1974) Thomas Major Cullinan: A Biography. McGraw-Hill, Johannesburg.
Holmes M. (1974) The Crown Jewels at the Tower of London.
Reissued 1981. Dept. of Environment, HM StationeryOffice, London.
Holmes M.R. (1937) The crowns of England. Archaeologia, Vol.86, pp. 73–90.
Holmes M.R. (1959) New light on St. Edward’s crown. Archae-ologia, Vol. 97, pp. 213–223.
The largest diamond (1905) Jewelers’ Circular, Vol. 50, No. 1, pp.108–109.
Mears K. (1986) The Crown Jewels: Tower of London. HistoricRoyal Palaces Agency, London.
More about the great Cullinan diamond found in the Transvaal.(1905) Jewelers’ Circular, Vol. 50, No. 10, pp. 70–71.
Some facts about the colossal diamond found at the new Premiermine in the Transvaal (1905) Jewelers’ Circular, Vol. 50, No. 7,p. 86.
Spencer L. (1910) Notes on the weight of the Cullinan diamondand the value of the carat-weight. Mineralogical Magazine,Vol. 15, No. 71, pp. 318–326.
Wilks J., Wilks E. (1991) Properties and Applications of Diamond.Butterworth-Heinemann, Oxford.
GEMS & GEMOLOGY requires that all articles undergo a peer review process in which each manuscript is evaluated by atleast three experts in the field. This process is vital to the accuracy and readability of the published article, but it is also timeconsuming for the reviewer. Because members of our Editorial Review Board cannot have expertise in every area, wesometimes call on others in our community to share their intellect and insight. In addition to the members of our EditorialReview Board, we extend a heartfelt thanks to the following individuals who reviewed manuscripts for G&G in 2005:
Mr. William BoyajianMr. Charles Carmona
Mr. John ChapmanMr. Paul Cory
Dr. David FisherDr. Carl FrancisMr. Mike Gray
Dr. Lee GroatMr. Hertz Hasenfeld
Mr. John KingDr. Paul MartineauMr. Roland NaftuleDr. Mark Newton
Mr. Rory More O'Ferrall
Mr. Carl PearsonMr. Benjamin RondeauMr. Charles SchiffmanDr. Dietmar SchwarzMr. George Solario
Dr. Wuyi WangDr. Christopher Welbourn
2005 Manuscript Reviewers

Spring 1999The Identification of Zachery-Treated TurquoiseRussian Hydrothermal Synthetic Rubies and SapphiresThe Separation of Natural from Synthetic Colorless Sapphire
Summer 1999On the Identification of Emerald Filling SubstancesSapphire and Garnet from Kalalani, TanzaniaRussian Synthetic Ametrine
Fall 1999—Special IssueSpecial Symposium Proceedings Issue, including:
Observations on GE-Processed Diamonds,Abstracts of Featured Speakers, Panel Sessions, War Rooms, and Poster Sessions
Winter 1999Classifying Emerald Clarity Enhancement at the GIA
Gem Trade LaboratoryClues to the Process Used by General Electric to Enhance
the GE POL DiamondsDiopside Needles as Inclusions in Demantoid Garnet from RussiaGarnets from Madagascar with a Color Change of
Blue-Green to Purple
Spring 2000Burmese JadeLapis Lazuli from ChileSpectroscopic Evidence of GE POL DiamondsChromium-Bearing Taaffeites
Summer 2000Characteristics of Nuclei in Chinese Freshwater Cultured PearlsAfghan Ruby and SapphireYellow to Green HPHT-Treated DiamondsNew Lasering Technique for DiamondNew Oved Filling Material for Diamonds
Fall 2000GE POL Diamonds: Before and AfterSapphires from Northern MadagascarPre-Columbian Gems from AntiguaGem-Quality Haüyne from Germany
Winter 2000—Special IssueGem Localities of the 1990sEnhancement and Detection in the 1990sSynthetics in the 1990sTechnological Developments in the 1990sJewelry of the 1990s
Spring 2001Ammolite from Southern Alberta, CanadaDiscovery and Mining of the Argyle Diamond Deposit, AustraliaHydrothermal Synthetic Red Beryl
Summer 2001The Current Status of Chinese Freshwater Cultured PearlsCharacteristics of Natural-Color and Heat-Treated
“Golden” South Sea Cultured PearlsA New Method for Imitating Asterism
Fall 2001Modeling the Appearance of the Round Brilliant
Cut Diamond: FirePyrope from the Dora Maira Massif, ItalyJeremejevite: A Gemological Update
Winter 2001An Update on “Paraíba” Tourmaline from BrazilSpessartine Garnet from San Diego County, CaliforniaPink to Pinkish Orange Malaya Garnets from
Bekily, Madagascar“Voices of the Earth”: Transcending the Traditional in
Lapidary Arts
Spring 2002—Special IssueThe Ultimate Gemologist: Richard T. LiddicoatPortable Instruments and Tips on Practical Gemology in the FieldLiddicoatite Tourmaline from MadagascarStar of the South: A Historic 128 ct Diamond
Summer 2002Characterization and Grading of Natural-Color Pink DiamondsNew Chromium- and Vanadium-Bearing Garnets from
Tranoroa, MadagascarUpdate on the Identification of Treated “Golden” South
Sea Cultured Pearls
Fall 2002Diamonds in Canada“Diffusion Ruby” Proves to Be Synthetic Ruby Overgrowth
on Natural Corundum
Winter 2002Chart of Commercially Available Gem TreatmentsGemesis Laboratory-Created DiamondsLegal Protection for Proprietary Diamond CutsRhodizite-Londonite from the Antsongombato Pegmatite,
Central Madagascar
Spring 2003Photomicrography for GemologistsPoudretteite: A Rare Gem from Mogok Grandidierite from Sri Lanka
Summer 2003Beryllium Diffusion of Ruby and SapphireSeven Rare Gem Diamonds
Fall 2003G. Robert Crowningshield: A Legendary GemologistCause of Color in Black Diamonds from SiberiaObtaining U.S. Copyright Registration for the Elara Diamond
Winter 2003Gem-Quality CVD Synthetic DiamondsPezzottaite from Madagascar: A New Gem Red Beryl from Utah: Review and Update
Spring 2004Identification of CVD-Grown Synthetic DiamondsCultured Pearls from Gulf of California, Mexico X-Ray Fingerprinting Routine for Cut Diamonds
Summer 2004Gem Treatment Disclosure and U.S. LawLab-Grown Colored Diamonds from Chatham The 3543 cm-1 Band in Amethyst Identification
Fall 2004Grading Cut Quality of Round Brilliant DiamondsAmethyst from Four Peaks, Arizona
Winter 2004Creation of a Suite of Peridot Jewelry: From the Himalayas
to Fifth AvenueAn Updated Chart on HPHT-Grown Synthetic Diamonds A New Method for Detecting Beryllium Diffusion–
Treated Sapphires (LIBS)
Spring 2005Treated-Color Pink-to-Red Diamonds from Lucent Diamonds Inc.A Gemological Study of a Collection of Chameleon DiamondsCoated Pink Diamond: A Cautionary Tale
Summer 2005Characterization and Grading of Natural-Color Yellow DiamondsEmeralds from the Kafubu Area, Zambia Mt. Mica: A Renaissance in Maine’s Gem
Tourmaline Production
Fall 2005A Review of the Political and Economic Forces Shaping
Today’s Diamond Industry Experimental CVD Synthetic Diamonds from LIMHP-
CNRS, France Inclusions in Transparent Gem Rhodonite from
Broken Hill, New South Wales, Australia
Winter 2005A Gemological Pioneer: Dr. Edward J. GübelinCharacterization of the New Malossi Hydrothermal
Synthetic Emerald
Winter 2004Fall 2004
Spring 2005 Summer 2005
Summer 2004Spring 2004
E-Mail: [email protected] or visit www.gia.edu
Call Toll Free 800-421-7250 ext. 7142
or 760-603-4000 ext. 7142
Fax: 760-603-4595 or Write: G&G Subscriptions, P.O. Box 9022,
Carlsbad, CA 92018-9022 USA
E-Mail: [email protected] or visit www.gia.edu
Call Toll Free 800-421-7250 ext. 7142
or 760-603-4000 ext. 7142
Fax: 760-603-4595 or Write: G&G Subscriptions, P.O. Box 9022,
Carlsbad, CA 92018-9022 USA
U.S. Canada InternationalSingle Issues $ 12 ea. $ 15 ea. $ 18 ea.
Complete Volumes*1991–2005 $ 40 ea. $ 48 ea. $ 60 ea.
Three-year set $115 ea. $ 135 ea. $ 170 ea.Five-year set $190 ea. $ 220 ea. $ 280 ea.
*10% discount for GIA Alumni and active GIA students.
Some issues from 1981–1998 are also available. Please call orvisit our website for details on these and the 2006 issues as theyare published.
Limited Quantities Available.
Fall 2005 Winter 2005Fall 2003 Winter 2003
Spring 2003 Summer 2003
Fall 2002 Winter 2002
Spring 2002/Special Issue Summer 2002

134 ZIRCON INCLUSIONS IN HEATED SAPPHIRES GEMS & GEMOLOGY SUMMER 2006
Zircon inclusions in sapphires from Madagascar were studied to investigate the effects of heattreatment on their gemological and spectroscopic features. Progressive decomposition of zir-con and chemical reactions between zircon and the host sapphire occurred at temperaturesbetween 1400°C and 1850°C. In unheated sapphires, transparent zircon inclusions displayedeuhedral slightly elongated forms and clear interfaces with their corundum host. Most wereconfined within the host under relatively high pressures (up to 27 kbar), and showed evidenceof natural radiation-related damage (metamictization). Subsolidus reactions (i.e., the decom-position of zircon into its component oxides without melting) of some zircon inclusions start-ed at temperatures as low as 1400°C, as evidenced by the formation of baddeleyite (ZrO2)and a SiO2-rich phase. Differences in the degree of preexisting radiation damage are the mostlikely cause for the decomposition reactions at such relatively low temperatures. Melting ofzircon and dissolution of the surrounding sapphire occurred in all samples at 1600°C andabove. This resulted in the formation of both baddeleyite and a quenched glass rich in Al2O3and SiO2. From these data and observations, a systematic sequence of both modification anddestruction of zircon inclusions with increasing temperature was compiled. This zircon alter-ation sequence may be used (1) as a gemological aid in determining whether a zircon-bearingruby/sapphire has been heated, and (2) to provide an estimate of the heating temperature.
ecause of the high demand for attractive sap-phires and rubies, many different treatmentshave been applied to mid- and low-grade
corundum to enhance color and clarity. On anatomic level, by modifying trace-element concen-trations and defect configurations in the corundumcrystal structure, selective light absorption in thevisible spectrum can be changed to produce pleas-ant bodycolors and thus more valuable sapphires(see, e.g., Crowningshield, 1966; Beesley, 1982;Emmett and Douthit, 1993). Heating traditionallyhas been one of the most common treatments andremains so today.
As would be expected, temperature is one of themost critical factors in the heat treatment of sap-phire. Modern technology has allowed sapphires tobe exposed to higher temperatures, has producedmore dramatic color changes in shorter periods of
time, and has expanded the range of material suit-able for enhancement. With the recent developmentof the beryllium-diffusion process, treatment tem-peratures as high as 1850°C, near the melting pointof corundum (2030°C–2050°C), have become com-mon (Emmett et al., 2003).
Zircon (ZrSiO4) is a common inclusion inMadagascar sapphires, which are important becausethey span the color spectrum (figure 1); stones fromthis locality may also be sourced for Be diffusion.Zircon is prevalent in corundum from many othergeographic sources as well (see, e.g., Schwieger,1990; Guo et al., 1996; Hughes, 1997; Rankin, 2002;
B
THE EFFECTS OF HEAT TREATMENTON ZIRCON INCLUSIONS IN
MADAGASCAR SAPPHIRES
Wuyi Wang, Kenneth Scarratt, John L. Emmett, Christopher M. Breeding, and Troy R. Douthit
See end of article for About the Authors and Acknowledgments.GEMS & GEMOLOGY, Vol. 42, No. 2, pp. 134–150.© 2006 Gemological Institute of America

Rankin and Edwards, 2003). During heat treatment,included mineral crystals are subjected to the sameconditions as the corundum host, but since theyhave different thermodynamic and chemical prop-erties, they may expand, recrystallize, melt, orchemically react with the host corundum in verydifferent ways that are dependent on the heatingtemperature, time, and other factors. Observationof destroyed or modified mineral inclusions usingan optical microscope has long been used to identi-fy heat-treated sapphires (see, e.g., Gübelin, 1973;Scarratt, 1983; Gübelin and Koivula, 1986; Cozarand de Vincente-Mingarro, 1995; Hughes, 1997).However, systematic descriptions of morphologicalchanges in response to heating for specific mineralinclusions such as zircon are not widely available(Cozar and de Vincente-Mingarro, 1995; Rankinand Edwards, 2003).
Of particular concern in recent years, diffusion ofa trace amount of beryllium (from several up to tensof parts per million) into corundum can lead to a fun-damental change in bodycolor (Emmett et al., 2003).Although the diffusion coefficient of Be in corundumis higher than that of many other elements, diffusionof Be into corundum is still a very slow process. Avery high temperature (~1800°C) is often necessary toprocess the stone in a reasonable amount of time,although Be diffusion may occur at lower tempera-tures. Using the morphology of zircon inclusions toestimate the heating temperature could minimizethe number of samples that would have to be submit-ted for trace-element analysis.
MATERIALS AND METHODSA total of 41 rough sapphires from Madagascar, rang-ing from 0.21 to 4.34 ct, were selected for this studybased mainly on the possible occurrence of zirconinclusions. All of the samples were irregular inshape, and over half exhibited the flat morphologythat is common for Madagascar sapphires. Mostwere from GIA’s collection of specimens obtaineddirectly from the Ilakaka area of Madagascar; the rest(slightly less than one-third) were purchased fromreliable sources in the market. All were known to benatural and untreated by heat or any other method.
Twenty-five samples were heated to various tem-peratures so we could observe changes in their zirconinclusions; their properties and heating conditions aregiven in table 1. The remaining 16 were left unheatedfor comparison. After heating, most were pink or pur-plish pink of varying saturation, but some were nearcolorless or had slight blue or yellow hues. While wedid note overall color changes, since the focus of thisstudy was the zircon inclusions, we did not trackcolor changes with temperature or attempt to controlthe atmosphere to achieve optimal coloration.
Heating experiments were carried out using avertical furnace with an oxidizing atmosphere inthe facilities of Crystal Chemistry, Brush Prairie,Washington. Target annealing temperatures variedfrom 1400°C to 1850°C. For each experimental run,two to three samples were heated at the target tem-perature in a high-purity alumina crucible for 5hours; this time was considered adequate to reach
ZIRCON INCLUSIONS IN HEATED SAPPHIRES GEMS & GEMOLOGY SUMMER 2006 135
Figure 1. Natural sap-phires, such as these 45
princess cuts fromMadagascar, come in a
broad range of colors.Nevertheless, the highdemand for fine ruby
and sapphire has led toa wide variety of treat-ments, of which heat-
ing to improve colorand/or clarity is per-haps the most com-
mon. These sapphireshave a total weight of
23.08 ct. Courtesy ofPala International,
Fallbrook, California;photo © Jeff Scovil.

equilibrium conditions. To evaluate the effects ofdifferent heating durations, additional experimentsat 1600°C and 1730°C were performed for 25 and 12hours, respectively. During each run, the tempera-ture was raised from room temperature to 1000°C ata rate of 300°C/hour, and then to the target temper-ature at a rate of 600°C/hour. Temperatures meas-ured in this study are believed to be accurate toabout ±1%, and fluctuation in each experimentalrun was less than ±10°C. After annealing at the tar-
get temperature for 5 hours, in most cases the tem-perature was then decreased to room temperatureover a period of 4 hours. Following the heatingexperiments, all samples were ground on both sidesto at least 0.5 mm depth to remove possible surfacecontamination, and then polished for observationand analysis.
In two unheated and all the heated sapphires,the surface-reaching zircon inclusions were ana-lyzed using a high-resolution analytical scanningelectron microscope (LEO 1550 VP FESEM)equipped with an Oxford INCA Energy 300 energy-dispersive X-ray spectrometer (EDS) at theCalifornia Institute of Technology. A thin layer ofcarbon was coated over a polished surface of eachsapphire to improve electrical conductivity. Sincemost zircon inclusions are very small and thedecomposition products are even smaller, theresults of quantitative elemental analysis werenormalized. This way, a relative accuracy of betterthan 5% and a detection limit of better than 0.5wt.% could be obtained. The analyses were per-formed using an accelerating voltage of 20 kV, afocused electron beam with a a spot size of 1–2 µm,and a beam current of 10 nA. Backscattered elec-tron (BSE) images were obtained to provide ameans of mapping areas in a sample that containedelements of different atomic weights.
Infrared absorption spectra of the host sapphirewere recorded in the mid-infrared region (6000–400cm−1, 1.0 cm−1 resolution) at room temperature witha Thermo-Nicolet Nexus 670 Fourier-transforminfrared (FTIR) spectrometer equipped with a KBrbeam splitter and MCT-B detector. Prior to analysis,the samples were cleaned using an ultrasonic bathwith pure acetone to remove surface contamination.A 2-mm-diameter center portion of each sample wasselected for analysis, and the rest of the sample wasshielded using a clean metal mask. A 6× beam con-denser focused the incident beam through the sam-ple, and a total of 256 scans (per spectrum) were col-lected to improve the signal-to-noise ratio.
Raman spectra of the zircon inclusions and theirhost sapphires were recorded at room temperatureusing a Renishaw 1000 Raman microspectrometerwith a polarized Ar-ion laser at two different laserexcitations (488.0 and 514.5 nm). The two laserswere used to help clarify the identity of some emis-sion peaks (Raman scattering vs. luminescence).The instrument was calibrated against the first-order Raman shift of a type IIa diamond at 1332.5cm−1. Spectra were collected using a confocal
TABLE 1. Heated (with experimental conditions) and unheated Madagascar sapphires studied for this report.
Heating experiment
Temperature Duration Environment(˚C) (hours)
75965 0.65 1.07 575966 0.89 1.41 5 75967 1.29 1.73 5 65458 1.61 2.58 565459 1.12 2.06 5 65460 1.05 2.50 565461 1.10 1.62 5 65462 1.79 2.59 565463 0.96 2.16 556016 1.88 3.76 556017 3.32 4.25 575968 0.83 1.27 2575969 1.18 1.80 2575970 0.70 1.21 2556018 3.25 3.64 556019 2.82 nda 556020 2.03 2.23 556021 2.27 nd 575971 0.35 0.91 1275972 0.64 1.14 1275973 0.75 2.15 1256022 2.94 3.49 556023 1.90 3.32 556024 1.52 2.36 556025 4.34 nd 556536 0.65 nd75974 0.72 1.0875975 0.77 1.9975976 1.09 1.8176726 0.60 1.4176728 0.32 1.1576729 0.63 1.2976730 0.38 1.3076731 0.26 1.0776732 0.21 0.6276733 0.53 1.5676734 0.23 1.0776735 0.31 1.4276736 0.30 1.0776737 0.40 1.0976738 0.92 1.99
a nd = not determined.
Sample Weight Thicknessno. (ct) (mm)
136 ZIRCON INCLUSIONS IN HEATED SAPPHIRES GEMS & GEMOLOGY SUMMER 2006
Not treated
1400 Oxidizing
1450 Oxidizing
1500 Oxidizing
1550 Oxidizing
1600 Oxidizing
1680 Oxidizing
1780 Oxidizing
1850 Oxidizing
1730 Oxidizing

system with a grating of 1800 grooves per mm, slitwidth of 50 µm, objective lens of 50×, and initiallaser power of 20 mW. Up to 100 scans were accu-mulated to achieve a better signal-to-noise ratio.Raman spectra of the host sapphires were collectedin the same orientation used for the inclusions byslightly moving the sample stage horizontally.Raman spectra of the zircon inclusions in both theunheated and heated sapphires were obtained bysubtracting an appropriate percentage of the hostsapphire spectrum (i.e., when Raman peaks fromcorundum disappeared entirely) from that collecteddirectly from the inclusions.
In addition, to better evaluate the spectral fea-tures of the zircon inclusions, we analyzed twofaceted free-standing zircons (one blue and one color-less) in several random directions. We also analyzeda euhedral purple zircon crystal that had well-devel-oped prismatic morphology with the c-axis parallel,at 45°, and perpendicular to the laser polarization.The geographic sources of these single-crystal zir-cons are unknown.
RESULTSUnheated Samples. In the 16 unheated sapphires,minor amounts of monazite and apatite were pres-ent, but zircon was the most common inclusion.Thirteen of the samples showed pink-purple col-oration; the other three were colorless, blue, andgreenish yellow. Abundant zircon inclusions wereobserved in the colorless and 11 of the pink samples.
Microscopic Observation. Typically, the unheatedzircon inclusions were transparent with a slightlyelongate crystal habit and well-developed {110} form,although many were slightly rounded. They rangedfrom less than 10 µm to about 100 µm in the longestdimension, though most were smaller than 50 µm.A few samples contained mostly individual inclu-sions (figure 2), while others displayed clusters (fig-ure 3). The latter usually consisted of less than 10zircon crystals and no other minerals; in two sam-ples, they showed as many as 100 crystals.Generally, the inclusions were randomly distributedwithin the host sapphire, but three samples showedlinear orientation to some extent. Even whenviewed at up to 100× magnification, their interfaceswith the host sapphire were almost always clear andtransparent. The crystal faces of the zircons were flator slightly rounded, and reflective. Some of the larg-er zircons crystals and clusters were accompanied byradial fractures in the surrounding corundum (figure4); however, the depth of these fractures extendingfrom the inclusion surface into the sapphire hostswas limited, with most no larger than the inclusionitself. Some were very subtle and could only beobserved with carefully oriented lighting. Similar tothe interface between the zircon inclusions and thehost sapphire, these fractures were clean andsmooth. No foreign material or apparent frostingwas observed (again, see figure 4).
SEM-EDS Analysis. Seven pristine zircon inclu-sions in two unheated sapphires (nos. 75974 and
ZIRCON INCLUSIONS IN HEATED SAPPHIRES GEMS & GEMOLOGY SUMMER 2006 137
Figure 2. Discrete zircon inclusions were common inthe Madagascar sapphires. With magnification, theinterfaces between the zircon inclusions and theirhost sapphire were almost always clear and transpar-ent, showing no frostiness or turbidity. The crystalfaces were flat or somewhat rounded and shiny.Photomicrograph by W. Wang; magnified 90×.
Figure 3. Clusters of zircon inclusions were present inmany of the Madagascar sapphires. Aggregationsusually consisted of less than 10 crystals, and noother minerals were observed as part of these clus-ters. In rare cases, up to 100 crystals were seen in alarge cluster. Photomicrograph by W. Wang; magni-fied 90×.

75975) were chemically analyzed using SEM-EDS(representative data in table 2). BSE images of inclu-sions exposed at the surface showed uniform zirconcrystals with sharp planar or slightly roundedboundaries (figure 5) and no evidence of decomposi-tion; a few displayed growth zoning. Chemicalanalysis revealed that these inclusions were nearly
pure zircon (ZrSiO4) with only minor amounts ofHfO2 (from less than the instrument detection limitup to ~2 wt.%).
Infrared Absorption Spectroscopy. The unheatedhost sapphires displayed few features in the mid-IRregion other than a weak absorption at 3309 cm−1
138 ZIRCON INCLUSIONS IN HEATED SAPPHIRES GEMS & GEMOLOGY SUMMER 2006
TABLE 2. Representative element concentrations (wt.% oxide) of zircon inclusions and of their reaction products after the heating experiments.
Sample Heating tem-no. perature (°C)
Zircon –a – – 32.6 – – – – 65.8 – 1.6Zircon – – – 32.4 – – – – 65.7 – 1.9Zircon – – – 32.1 – – – – 66.4 – 1.5Zircon – – – 32.8 – – – – 67.2 – –Zircon – – – 32.4 – – – – 67.7 – –Zircon – – – 32.9 – – – – 67.1 – –Baddeleyite – – 1.7 9.4 – – – – 87.6 – 1.4Zircon – – – 33.0 – – – – 67.0 – –Baddeleyite – – 1.9 21.2 – – – – 76.9 – –Zircon – – – 34.1 – – – – 62.8 – 3.2Baddeleyite – – 1.0 – – – – – 96.0 – 3.1Baddeleyite – – – – – – – – 95.1 – 4.9Melt – 4.5 21.8 71.4 0.9 – – – 2.1 – –Baddeleyite – – 2.7 – – – – – 97.7 – –Melt 3.2 – 18.4 54.8 – 4.2 2.5 – 16.9 – –Baddeleyite – – – – – – – – 98.6 – 1.4Melt – – 73.7 26.3 – – – – – – –Baddeleyite – – 3.2 – – 1.4 – – 95.4 – –Melt 0.2 3.2 28.6 41.7 – 14.7 2.5 0.2 8.4 0.5 –Baddeleyite – – – – – – – – 100.0 – –Melt – – 29.3 66.4 – – – 2.0 4.6 – –
a – = not detected.
Unheated
Unheated
1400
1450
1600
1600
1680
1730
1780
1850
75974
75975
75967
65458
75968
75969
56018
56020
56023
56024
Figure 5. This backscattered electron image shows auniform zircon crystal that has a sharp planarboundary with the surrounding host sapphire. Dueto its high content of the heavy element zirconium,the zircon inclusion appears much brighter than thesurrounding host sapphire. Image width 70 µm.
Figure 4. Radial fractures were often present aroundlarger zircon inclusions. The depths of the fractureswere limited, and most were close to the size of theinclusions and only rarely reached the surface ofthe host sapphire. Photomicrograph by W. Wang;magnified 112×.
Na2O MgO Al2O3 SiO2 K2O CaO TiO2 FeO ZrO2 Ce2O3 HfO2Phase
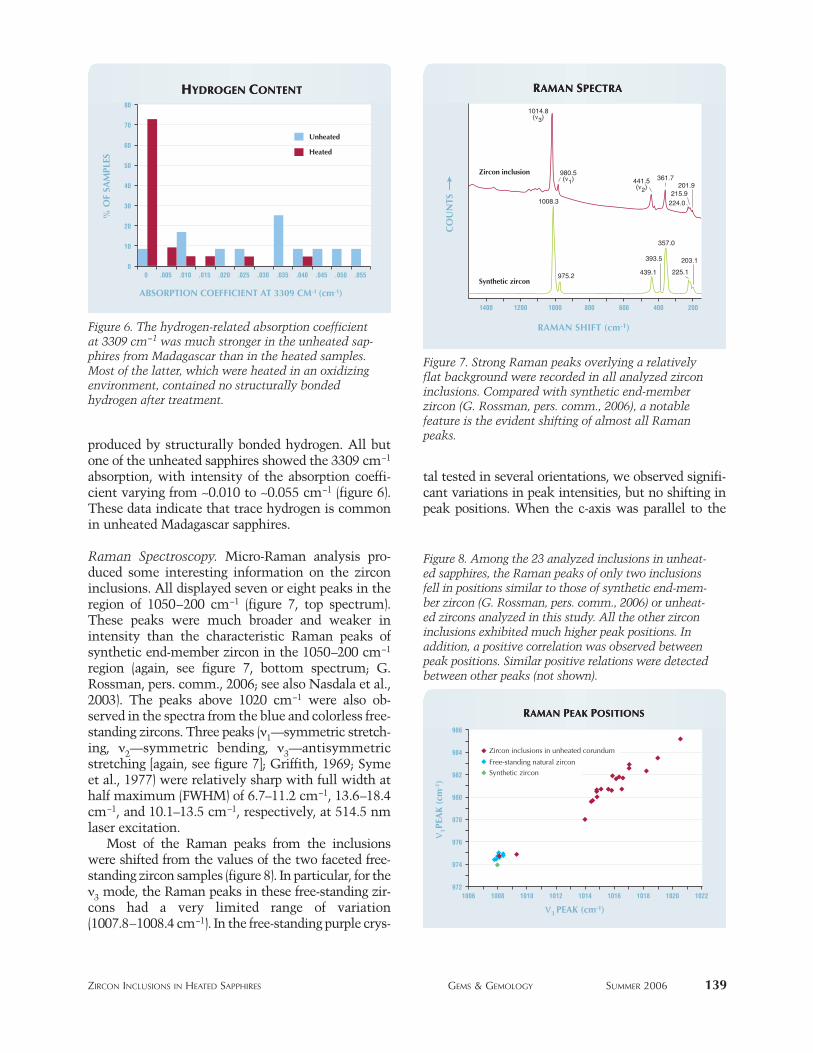
produced by structurally bonded hydrogen. All butone of the unheated sapphires showed the 3309 cm−1
absorption, with intensity of the absorption coeffi-cient varying from ~0.010 to ~0.055 cm−1 (figure 6).These data indicate that trace hydrogen is commonin unheated Madagascar sapphires.
Raman Spectroscopy. Micro-Raman analysis pro-duced some interesting information on the zirconinclusions. All displayed seven or eight peaks in theregion of 1050–200 cm−1 (figure 7, top spectrum).These peaks were much broader and weaker inintensity than the characteristic Raman peaks ofsynthetic end-member zircon in the 1050–200 cm−1
region (again, see figure 7, bottom spectrum; G.Rossman, pers. comm., 2006; see also Nasdala et al.,2003). The peaks above 1020 cm−1 were also ob-served in the spectra from the blue and colorless free-standing zircons. Three peaks (ν1—symmetric stretch-ing, ν2—symmetric bending, ν3—antisymmetricstretching [again, see figure 7]; Griffith, 1969; Symeet al., 1977) were relatively sharp with full width athalf maximum (FWHM) of 6.7–11.2 cm−1, 13.6–18.4cm−1, and 10.1–13.5 cm−1, respectively, at 514.5 nmlaser excitation.
Most of the Raman peaks from the inclusionswere shifted from the values of the two faceted free-standing zircon samples (figure 8). In particular, for theν3 mode, the Raman peaks in these free-standing zir-cons had a very limited range of variation(1007.8–1008.4 cm−1). In the free-standing purple crys-
tal tested in several orientations, we observed signifi-cant variations in peak intensities, but no shifting inpeak positions. When the c-axis was parallel to the
ZIRCON INCLUSIONS IN HEATED SAPPHIRES GEMS & GEMOLOGY SUMMER 2006 139
Figure 8. Among the 23 analyzed inclusions in unheat-ed sapphires, the Raman peaks of only two inclusionsfell in positions similar to those of synthetic end-mem-ber zircon (G. Rossman, pers. comm., 2006) or unheat-ed zircons analyzed in this study. All the other zirconinclusions exhibited much higher peak positions. Inaddition, a positive correlation was observed betweenpeak positions. Similar positive relations were detectedbetween other peaks (not shown).
Figure 6. The hydrogen-related absorption coefficientat 3309 cm−1 was much stronger in the unheated sap-phires from Madagascar than in the heated samples.Most of the latter, which were heated in an oxidizingenvironment, contained no structurally bondedhydrogen after treatment.
Figure 7. Strong Raman peaks overlying a relativelyflat background were recorded in all analyzed zirconinclusions. Compared with synthetic end-memberzircon (G. Rossman, pers. comm., 2006), a notablefeature is the evident shifting of almost all Ramanpeaks.

vibrational direction of the incident laser beam, the ν1and ν3 peaks almost disappeared entirely. Thestrongest intensities of ν1 and ν3 were observed whenthe c-axis was 45° to the vibrational direction. Thethree major peaks showed very limited positionalvariations when measured at different orientations(ν1: 974.4–975.0 cm−1; ν2: 438.7–438.9 cm−1; ν3:1007.8–1008.1 cm−1). These values are similar to thosefrom synthetic end-member zircon (again, see figure 7).
In contrast, of the 23 zircon inclusions in 12unheated sapphires that were measured, only twofell within the positional ranges observed in the free-standing zircon samples. All the other inclusionsyielded peaks that were shifted to much higher posi-tions (e.g., ν3: 1014–1021 cm−1; again, see figure 8).The largest shift from ideal position was nearly 13cm−1. Similar peak shifting occurred for other peaks(ν1, ν2, and another major peak at ~360 cm−1), and aclear positive correlation was observed among the
peaks (e.g., ν1 vs. ν3 in figure 8). Multiple inclusionswithin the same sapphire also showed large varia-tions in peak position. For example, in sample no.75975, ν3 of one zircon occurred at 1008.1 cm−1, buttwo other inclusions had positions ranging from1015.6 to 1017.7 cm−1. Similar large variations forthe position of ν3 were observed in sample no. 76732(1009.3 cm−1 and 1014.8–1015.1 cm−1). Five zirconinclusions were analyzed in sample no. 76726, butthe position of ν3 showed only a very limited rangeof variation (1014.4–1016.5 cm−1).
Heated Samples. Visual Observation. Color changeswere observed in these sapphires after heat treat-ment, with a deeper pink color in some stones andlighter pink in others. As noted earlier, we did nottrack systematic variations in color with tempera-ture. The zircon inclusions displayed distinctchanges in crystal morphology after heating to suffi-
140 ZIRCON INCLUSIONS IN HEATED SAPPHIRES GEMS & GEMOLOGY SUMMER 2006
Figure 9. At or below 1500°C, the morphology of the zircon inclusions did not change noticeably (left, 1400°C [sam-ple no. 75967]; center 1450°C [no. 65459]; right 1500°C [no. 65460]). However, in some zircons, portions of the inter-face between the inclusion and the host became slightly turbid or frosted, as did some fractures around the inclu-sions. Photomicrographs by W. Wang; magnified 100×.
Figure 10. As the temperature was increased to 1550°C (left [sample no. 65462]), the frosted/turbid regionsbecame larger and more noticeable. At 1600°C (center [no. 56017]), the surfaces of nearly all the zircon inclusionsbecame noticeably frosted, and only a few transparent regions remained. At 1680°C (right [no. 56018]), the zirconcrystals lost their original outlines, resulting in irregular shapes. Photomicrographs by W. Wang; magnified 100×.
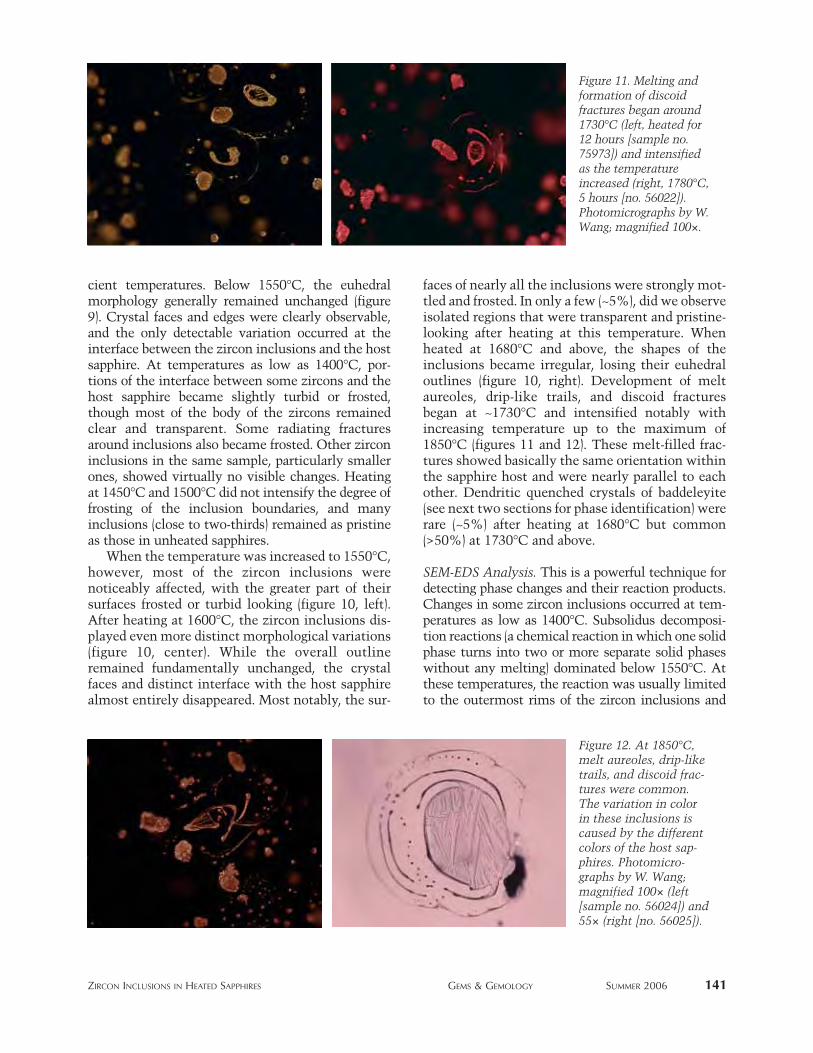
cient temperatures. Below 1550°C, the euhedralmorphology generally remained unchanged (figure9). Crystal faces and edges were clearly observable,and the only detectable variation occurred at theinterface between the zircon inclusions and the hostsapphire. At temperatures as low as 1400°C, por-tions of the interface between some zircons and thehost sapphire became slightly turbid or frosted,though most of the body of the zircons remainedclear and transparent. Some radiating fracturesaround inclusions also became frosted. Other zirconinclusions in the same sample, particularly smallerones, showed virtually no visible changes. Heatingat 1450°C and 1500°C did not intensify the degree offrosting of the inclusion boundaries, and manyinclusions (close to two-thirds) remained as pristineas those in unheated sapphires.
When the temperature was increased to 1550°C,however, most of the zircon inclusions werenoticeably affected, with the greater part of theirsurfaces frosted or turbid looking (figure 10, left).After heating at 1600°C, the zircon inclusions dis-played even more distinct morphological variations(figure 10, center). While the overall outlineremained fundamentally unchanged, the crystalfaces and distinct interface with the host sapphirealmost entirely disappeared. Most notably, the sur-
faces of nearly all the inclusions were strongly mot-tled and frosted. In only a few (~5%), did we observeisolated regions that were transparent and pristine-looking after heating at this temperature. Whenheated at 1680°C and above, the shapes of theinclusions became irregular, losing their euhedraloutlines (figure 10, right). Development of meltaureoles, drip-like trails, and discoid fracturesbegan at ~1730°C and intensified notably withincreasing temperature up to the maximum of1850°C (figures 11 and 12). These melt-filled frac-tures showed basically the same orientation withinthe sapphire host and were nearly parallel to eachother. Dendritic quenched crystals of baddeleyite(see next two sections for phase identification) wererare (~5%) after heating at 1680°C but common(>50%) at 1730°C and above.
SEM-EDS Analysis. This is a powerful technique fordetecting phase changes and their reaction products.Changes in some zircon inclusions occurred at tem-peratures as low as 1400°C. Subsolidus decomposi-tion reactions (a chemical reaction in which one solidphase turns into two or more separate solid phaseswithout any melting) dominated below 1550°C. Atthese temperatures, the reaction was usually limitedto the outermost rims of the zircon inclusions and
ZIRCON INCLUSIONS IN HEATED SAPPHIRES GEMS & GEMOLOGY SUMMER 2006 141
Figure 11. Melting andformation of discoidfractures began around1730°C (left, heated for12 hours [sample no.75973]) and intensifiedas the temperatureincreased (right, 1780°C,5 hours [no. 56022]).Photomicrographs by W.Wang; magnified 100×.
Figure 12. At 1850°C,melt aureoles, drip-liketrails, and discoid frac-tures were common.The variation in colorin these inclusions iscaused by the differentcolors of the host sap-phires. Photomicro-graphs by W. Wang;magnified 100× (left[sample no. 56024]) and55× (right [no. 56025]).

involved the formation of two phases with extreme-ly high contrast in the BSE images (figure 13). Oneinclusion showed no detectable reaction; in addition,it displayed clear growth zonation caused by varia-tions of HfO2 content in different regions (figure13A). However, another inclusion in this sample wasaltered entirely, with no zircon surviving (figure 13C).Instead, very bright euhedral grains of baddeleyite(ZrO2) were surrounded by a dark, irregular SiO2-richphase (refer to the Raman spectroscopy subsectionbelow for phase identification and table 2 for chemi-cal composition). The baddeleyite developed as smallelongated euhedral crystals up to several microme-ters in size. In contrast, the SiO2-rich phase occurredas an interstitial material phase among baddeleyitecrystals. The baddeleyite contained up to 3 wt.%HfO2. Because of the very small grain sizes and strong
overlap with surrounding minerals, we could notaccurately determine the chemistry of the SiO2-richphase. Most of the interiors of individual zircon crys-tals remained unchanged. In general, the overalleuhedral crystal outline of the inclusions was not dis-turbed. In a few cases, the reactions occurred inter-nally but were limited in area.
The progression of these subsolidus decomposi-tion reactions between 1400°C and 1550°C variedbetween samples and even between inclusions inthe same sapphire. In sample nos. 75966 and 65458,which were heated to 1400°C and 1450°C, respec-tively, decomposition reactions were observedamong a few isolated inclusions. Other zircons inthe same sapphires showed no reaction at all (no.75966), while one zircon inclusion in sample no.75967 (heated to 1400°C) decomposed entirely (fig-
142 ZIRCON INCLUSIONS IN HEATED SAPPHIRES GEMS & GEMOLOGY SUMMER 2006
Figure 13. From 1400°C(A, B, C) to 1450°C (D),subsolidus decomposi-tion reactions mainlyoccurred at the rims ofsome zircon inclusions,as seen in these back-scattered electronimages. The very brightareas are euhedralgrains of baddeleyite(ZrO2), which are sur-rounded by a dark,irregular SiO2-rich phasecontaining up to 3 wt.%HfO2. One zircon inclu-sion decomposed entire-ly (C). BSE imagewidths 180 µm (A); 80 µm (B); 160 µm (C);140 µm (D).
Figure 14. Some zirconinclusions heated to1500–1550°C showed noobservable changes(1500°C, left). Subsolidusreactions similar to thoseobserved at 1400–1450°C(figure 13) were observedafter heating at 1550°C(right). BSE image widths20 µm.
A B
C D

ure 13C). In contrast, none of the inclusions in sam-ple nos. 65459 and 65461, which were heated to1450°C and 1500°C, respectively, showed anyobservable changes (e.g., figure 14, left). A similarreaction to that occurring at 1400°C–1450°C wasobserved in one zircon inclusion after heating to1550°C (no. 65463, figure 14, right).
After heating to 1600°C, both subsolidus decom-position and melting reactions were observed (figure15). Sample no. 75968, which was heated for 25 hours,exhibited limited decomposition reactions along therim of a zircon crystal, but the baddeleyite crystalsthat formed were larger (about 10 µm) than those seenafter heating at lower temperatures and for shorterduration (2–3 µm; figure 15, left). Nevertheless, theeuhedral morphology and outline of the original zir-con were mostly preserved. Partial melting of a zirconinclusion occurred in sample no. 75969, which wasalso heated to 1600°C (figure 15, right). The meltedinclusions consisted of baddeleyite crystals andAl2O3- and SiO2-rich quenched melt. The originaleuhedral crystal outlines were indistinct.
Above 1680°C, partial melting occurred in near-ly all the zircon inclusions (figure 16). In addition,the baddeleyite crystals within the Al2O3- and SiO2-rich quenched glass matrix crystallized in a dendrit-ic structure that was very different from the individ-ual baddeleyite crystals that formed at lower tem-peratures. Reactions between the zircon inclusionsand the host sapphire were intensified at tempera-tures at or above 1730°C, and the outlines of theoriginal inclusions became difficult to discern (fig-ure 17). Up to 5 wt.% HfO2 was detected in badde-leyite in these melted inclusions. The melt (i.e., thequenched glass) was mainly composed of Al2O3 andSiO2 with some ZrO2 (up to 17 wt.%). The concen-trations of Al2O3 and SiO2 varied dramaticallybetween different analysis locations. Average com-positions of the melts are listed in table 2.Significant amounts of Na2O, MgO, CaO, TiO2,and/or K2O were also detected in the melted por-tions of a few inclusions.
Infrared Absorption Spectroscopy. No absorptionfrom either the zircon or the decomposition reactionproducts was detected by FTIR analysis after heatingat any temperature. In addition, after heating in anoxidizing environment at high temperatures, mostof the sapphire samples showed very little evidenceof hydrogen. Of the 22 heated sapphires analyzedwith FTIR, trace hydrogen was detected in only six.The intensity of the hydrogen absorption coefficientat 3309 cm−1 varied from 0 to 0.040 cm−1 (again, seefigure 6). A very weak absorption at 3309 cm−1 wasdetected in sample no. 56017 after heating at 1600°Cfor 5 hours, but in a similar sample (no. 75968) heat-ed at the same temperature for 25 hours, no hydro-gen-related absorption was present. Notably, ourheating experiments in oxidizing conditions did notresult in the complete removal of structurally bond-ed hydrous components.
Raman Spectroscopy. In each of the heated samples,two to four inclusions were randomly selected foranalysis. For sapphires heated at 1400°C and 1450°C,
ZIRCON INCLUSIONS IN HEATED SAPPHIRES GEMS & GEMOLOGY SUMMER 2006 143
Figure 15. When the zirconinclusions were heated to
1600°C, both subsolidus decom-position (left) and melting reac-
tions (right) were observed.Heating for longer periods
(25 hours, right) caused the formation of larger baddeleyite
crystals, the brighter grains (compare to 5 hours, left). BSE
image widths about 150 µm.
Figure 16. When heated above 1680°C, nearly all thezircon inclusions showed some degree of melting, inaddition to subsolidus reactions. In this inclusion, thequenched baddeleyite had a dendritic structure. BSEimage width 85 µm.

the inclusions displayed only the characteristic zirconRaman peaks, and no obvious differences fromunheated zircon inclusions were observed. In samplesheated to 1500°C and above, variations in Ramanspectra were apparent. In the four inclusions analyzedin sample no. 65461 (1500°C for 5 hours), two inclu-sions showed at least seven additional emission peaksin the scattering region of 1300–1050 cm−1, in addi-tion to the dominant peaks from zircon when excitedwith a 514.5 nm laser (figure 18, top spectrum).
The characteristic zircon Raman peaks frommost heated inclusions were shifted to higherwavenumbers (ν3 = 1012–1021 cm−1) compared tothose observed for the natural free-standing singlezircons, as was the case with the zircon inclusions inunheated sapphires. Raman peaks from zircon werethe dominant features until melting occurred at~1600°C. However, the FWHMs of the Raman peaksin the heated inclusions were significantly lowerthan those measured in the unheated zircon inclu-sions. For example, the average ν3 FWHM for zirconsthat remained intact after heating was 8.7 cm−1
(1400°C), 8.5 cm−1 (1450°C), 8.4 cm−1 (1500°C), 7.9cm−1 (1550°C), and 8.5 cm−1 (1600°C). In contrast,the average ν3 FWHM for unheated zircon inclusionswas 11.5 cm−1.
The seven additional Raman peaks observed at1500°C in sample no. 65461 were present in all inclu-sions heated at 1600°C and above. A secondary laserwith 488 nm excitation confirmed that these peakswere due to luminescence and not the Raman effect.
The zircon-specific Raman peaks disappearedentirely from inclusions that were heated above1680°C, and were replaced by several weak Ramanpeaks below 1050 cm−1 (figure 18, bottom spectrum).Of the more than 15 peaks that were recorded (notall of which are apparent in figure 18), several (645.5,476.4, 396.5, and 336.4 cm−1, and a characteristic
doublet at 182.1 cm−1 and 194.4 cm−1) were consis-tent with the Raman spectrum for baddeleyite(Stefanc et al., 1999; Fredericci and Morelli, 2000;McKeown et al., 2000), confirming its presence inthe heated inclusions.
144 ZIRCON INCLUSIONS IN HEATED SAPPHIRES GEMS & GEMOLOGY SUMMER 2006
Figure 17. For temperatures at or above 1730°C, the outlines of the original zircon inclusions were diffused, andreactions between the inclusions and the host sapphire intensified (1730°C, left; 1780°C, center; 1850°C, right).Tiny dendritic-like quenched crystals of baddeleyite also formed, and the melt often penetrated into surroundingdiscoid fractures. BSE image widths 130 µm (left); 250 µm (center); 80 µm (right).
Figure 18. At least seven additional emission peaks inthe 1300–1050 cm−1 scattering region due to lumines-cence were recorded for inclusions in a sample heatedto 1500°C when 514.5 nm laser excitation was used(top). Most of these luminescence peaks were muchstronger when the sample was heated at 1680°C orabove. At wavenumbers less than 1020 cm−1, there isa relatively weak spectrum for baddeleyite.

DISCUSSIONRaman Spectroscopy of Unheated Zircon Inclusionsand Metamictization. Details of the Raman spec-trum of zircon have been well known since the1970s. The three main peaks at 1008, 974, and 439cm−1 are related to internal SiO4 vibration modes. Itis generally agreed that the three other peaks at 225,214, and 202 cm−1 are lattice vibrational modesinvolving interactions between SiO4 tetrahedra andZr atoms (Griffith, 1969; Syme et al., 1977).
As shown in figure 8, the Raman spectra from thezircon inclusions in unheated Madagascar sapphireswere quite variable, particularly in the positions ofthe peaks. Shifting of peak ν3 was as high as 13 cm−1.The positions and relative intensities of Ramanpeaks are affected by many factors, including chem-ical composition, pressure, temperature, and crystal-lographic orientation. Analysis of the purple zirconcrystal in multiple directions using 514.5 nm laserexcitation demonstrated that relative peak intensityvaried greatly with sample orientation. When the c-axis was parallel to the vibrational direction of theincident laser beam, the peaks ν1 and ν3 became veryweak relative to other orientations, or they disap-peared entirely. However, the peak positions showedvirtually no change when the sample was in differ-ent orientations, as the largest shift was <0.5 cm−1.These observations indicate that differences in crys-tal orientation most likely were not responsible forthe shifting of Raman peaks observed in zirconinclusions from Madagascar sapphires.
We also considered whether these large peakshifts could be explained by HfO2 substitution, sinceHfO2 is a common minor oxide in zircon inclusionsin Madagascar sapphires. In a careful study of Ramanpeak positions in synthetic end-member zircon(ZrSiO4) and hafnon (HfSiO4), Nicola and Rutt (1974)found that both had very similar Raman spectra, butthe ν3 peak position in hafnon was about 10 cm−1
higher than that of zircon, and the ν1 and ν2 peakswere also shifted to higher positions (9–10 cm−1). Incontrast, the 356 cm−1 peak in zircon (ZrSiO4)occurred at 350 cm−1 in hafnon (HfSiO4). Based onprevious research (Hoskin et al., 1996), 3–5 wt.%HfO2 in zircon is insufficient to cause the observedpeak shift.
Thus, we do not believe that the large peak shiftsthat we observed (6–13 cm−1; again, see figure 8) canbe explained by either HfO2 substitution or crystalorientation. Instead, the most likely scenario is thatthe zircon inclusions in Madagascar sapphires are
confined under relatively high pressures. It has beenwell documented that Raman peaks for many min-erals shift to higher wavenumbers with increasingpressure. The relationship between pressure andpeak position is nearly linear, as observed from min-eral inclusions in natural diamonds (see, e.g., Liu etal., 1990; Izraeli et al., 1999; Sobolev et al., 2000).When a zircon crystal is originally trapped within anewly formed sapphire at moderate temperatures(250°C–1400°C; G. Rossman, pers. comm., 2003), itsvolume is the same as the space it occupies in thehost sapphire. However, the coefficient of thermalexpansion of zircon (3.2–5.4 × 10⁻⁶/°C; Bayer, 1972)is lower than that of corundum (7.6 × 10⁻⁶/°C; Whiteand Roberta, 1983). Consequently, when the sap-phire is brought to the earth’s surface, where temper-ature and pressure are lower, differential expansionoccurs between the inclusion and its host. The vol-ume of the host sapphire and the original space theinclusion occupied decreases more than that of thezircon inclusion itself, placing the zircon under pres-sure and creating stress in the host sapphire sur-rounding the inclusion. Where the stress exceeds thetensile strength of sapphire, fractures develop (again,see figure 4). Similar features are common in naturaldiamonds with mineral inclusions. Knittle andWilliams (1993) studied the Raman peak shifting ofzircon under pressure at room temperature andfound that the four major peaks (ν1, ν2, ν3, 357 cm−1
)
shifted positively and linearly. Based on their exper-imental results, the largest shift of the ν3 peak in ourdata (13 cm−1) corresponds to 27 kbar of pressure.Similar pressures were calculated from the shiftingof other peaks.
Natural zircons also usually contain measurableamounts of radioactive trace elements. Radioactivedecay of Th and U can damage zircon’s crystal lat-tice, a process referred to as metamictization, whichcauses expansion of the zircon; this expansion cancreate internal stress (e.g., Guo et al., 1996; Hughes,1997). Radiation damage also causes the Ramanpeaks of zircon to become less intense, broader, andto shift to lower wavenumber positions (Nasdala etal., 1995, 2003).
Raman peaks of pristine, unheated zircons inMadagascar sapphires were mostly strong and sharp,overlying a nearly flat background and shifted to high-er wavenumbers (figures 7 and 8) than in free-standingand synthetic zircons. The observed shift to higherwavenumbers likely is a reconciliation of the com-pressive and tensile stresses caused by the competingmechanisms of thermal expansion and metamictiza-
ZIRCON INCLUSIONS IN HEATED SAPPHIRES GEMS & GEMOLOGY SUMMER 2006 145
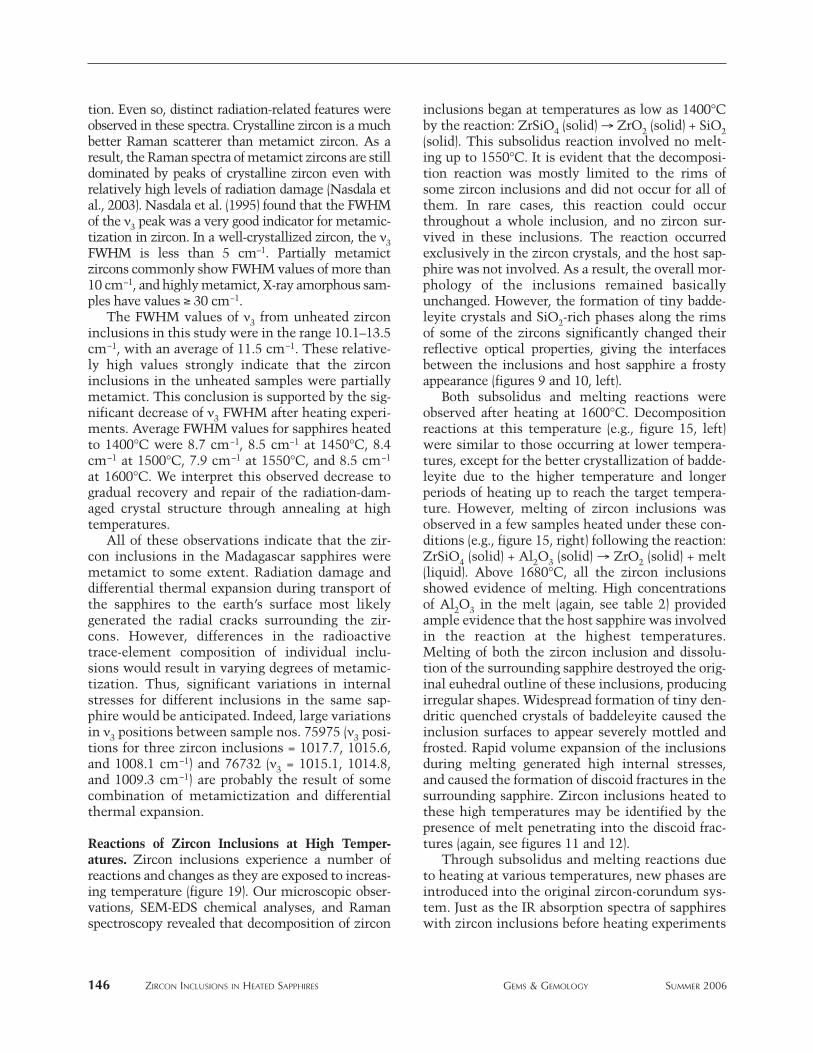
tion. Even so, distinct radiation-related features wereobserved in these spectra. Crystalline zircon is a muchbetter Raman scatterer than metamict zircon. As aresult, the Raman spectra of metamict zircons are stilldominated by peaks of crystalline zircon even withrelatively high levels of radiation damage (Nasdala etal., 2003). Nasdala et al. (1995) found that the FWHMof the ν3 peak was a very good indicator for metamic-tization in zircon. In a well-crystallized zircon, the ν3FWHM is less than 5 cm−1. Partially metamict zircons commonly show FWHM values of more than 10 cm−1, and highly metamict, X-ray amorphous sam-ples have values ≥ 30 cm−1.
The FWHM values of ν3 from unheated zirconinclusions in this study were in the range 10.1–13.5cm−1, with an average of 11.5 cm−1. These relative-ly high values strongly indicate that the zirconinclusions in the unheated samples were partiallymetamict. This conclusion is supported by the sig-nificant decrease of ν3 FWHM after heating experi-ments. Average FWHM values for sapphires heatedto 1400°C were 8.7 cm−1, 8.5 cm−1 at 1450°C, 8.4cm−1 at 1500°C, 7.9 cm−1 at 1550°C, and 8.5 cm−1
at 1600°C. We interpret this observed decrease togradual recovery and repair of the radiation-dam-aged crystal structure through annealing at hightemperatures.
All of these observations indicate that the zir-con inclusions in the Madagascar sapphires weremetamict to some extent. Radiation damage anddifferential thermal expansion during transport ofthe sapphires to the earth’s surface most likelygenerated the radial cracks surrounding the zir-cons. However, differences in the radioactivetrace-element composition of individual inclu-sions would result in varying degrees of metamic-tization. Thus, significant variations in internalstresses for different inclusions in the same sap-phire would be anticipated. Indeed, large variationsin ν3 positions between sample nos. 75975 (ν3 posi-tions for three zircon inclusions = 1017.7, 1015.6,and 1008.1 cm−1) and 76732 (ν3 = 1015.1, 1014.8,and 1009.3 cm−1) are probably the result of somecombination of metamictization and differentialthermal expansion.
Reactions of Zircon Inclusions at High Temper-atures. Zircon inclusions experience a number ofreactions and changes as they are exposed to increas-ing temperature (figure 19). Our microscopic obser-vations, SEM-EDS chemical analyses, and Ramanspectroscopy revealed that decomposition of zircon
inclusions began at temperatures as low as 1400°Cby the reaction: ZrSiO4 (solid) → ZrO2 (solid) + SiO2(solid). This subsolidus reaction involved no melt-ing up to 1550°C. It is evident that the decomposi-tion reaction was mostly limited to the rims ofsome zircon inclusions and did not occur for all ofthem. In rare cases, this reaction could occurthroughout a whole inclusion, and no zircon sur-vived in these inclusions. The reaction occurredexclusively in the zircon crystals, and the host sap-phire was not involved. As a result, the overall mor-phology of the inclusions remained basicallyunchanged. However, the formation of tiny badde-leyite crystals and SiO2-rich phases along the rimsof some of the zircons significantly changed theirreflective optical properties, giving the interfacesbetween the inclusions and host sapphire a frostyappearance (figures 9 and 10, left).
Both subsolidus and melting reactions wereobserved after heating at 1600°C. Decompositionreactions at this temperature (e.g., figure 15, left)were similar to those occurring at lower tempera-tures, except for the better crystallization of badde-leyite due to the higher temperature and longerperiods of heating up to reach the target tempera-ture. However, melting of zircon inclusions wasobserved in a few samples heated under these con-ditions (e.g., figure 15, right) following the reaction:ZrSiO4 (solid) + Al2O3 (solid) → ZrO2 (solid) + melt(liquid). Above 1680°C, all the zircon inclusionsshowed evidence of melting. High concentrationsof Al2O3 in the melt (again, see table 2) providedample evidence that the host sapphire was involvedin the reaction at the highest temperatures.Melting of both the zircon inclusion and dissolu-tion of the surrounding sapphire destroyed the orig-inal euhedral outline of these inclusions, producingirregular shapes. Widespread formation of tiny den-dritic quenched crystals of baddeleyite caused theinclusion surfaces to appear severely mottled andfrosted. Rapid volume expansion of the inclusionsduring melting generated high internal stresses,and caused the formation of discoid fractures in thesurrounding sapphire. Zircon inclusions heated tothese high temperatures may be identified by thepresence of melt penetrating into the discoid frac-tures (again, see figures 11 and 12).
Through subsolidus and melting reactions dueto heating at various temperatures, new phases areintroduced into the original zircon-corundum sys-tem. Just as the IR absorption spectra of sapphireswith zircon inclusions before heating experiments
146 ZIRCON INCLUSIONS IN HEATED SAPPHIRES GEMS & GEMOLOGY SUMMER 2006

showed no zircon-related absorption, the IRabsorption spectra of the heated samples did notshow any features that could be attributed to reac-tion products. The main reason is that corundumhas a strong absorption in the region below 1600cm−1, which masks any possible absorption in thisregion from reaction products. In addition, boththe inclusions and the reaction products have avery limited volume compared to that of the hostcorundum, so the absorptions would be too weakto be detected even if they occurred above 1600cm−1. These observations indicate that IR absorp-tion spectroscopy is not very sensitive in detectingthe presence of minor amounts of zircon inclu-sions in corundum or its decomposition productsafter heating.
Lowered Melting Point of Zircon. Well-crystallizedzircon is known to be stable up to 1690°C at ambi-ent pressure (Nasdala et al., 2003). Above this tem-perature, it decomposes into the constituent oxidesZrO2 and SiO2. Zircon inclusions in sapphire forma simple ZrSiO4–Al2O3 system, the lowest meltingtemperature of which should be 1700°C–1800°C
(Budinikov and Litvakovski, 1956). For the zirconinclusions in this study, both subsolidus and melt-ing reactions started at much lower temperatures.The main possible causes for this discrepancy areradiation-related metamictization and the coexis-tence of other minerals mentioned below.
Internal structural damage from radiation couldalso affect the thermodynamic stability of zirconwhen heated. In an annealing study of radiation-damaged zircons (Zhang et al., 2000), it was foundthat heavily damaged samples tend to decomposeinto ZrO2 and SiO2 at high temperatures. In thatstudy, tetragonal ZrO2 was observed after anneal-ing between 852°C and ~1327°C, while monoclin-ic ZrO2 (baddeleyite) appeared above 1327°C. Sucha decomposition temperature range is much lowerthan that for well-crystallized zircon. Zhang et al.(2000) also pointed out that ZrO2 and SiO2 fromthe decomposition could recrystallize to form newzircon around 1230°C.
All of these factors indicate that the final decom-position products of a zircon after heating woulddepend on the intensity of radiation damage, theannealing temperature, and the duration of heating.
ZIRCON INCLUSIONS IN HEATED SAPPHIRES GEMS & GEMOLOGY SUMMER 2006 147
Figure 19. The morphology of zircon inclusions in the sapphires changed systematically as a function of heatingtemperature. Also shown are the general temperature ranges of common heat treatments. (References: aHughes,1997; bMcClure et al., 2006; cEmmett et al., 2003.) Photomicrographs by W. Wang.

This could explain the large variations in subsolidusdecomposition for inclusions in individual sap-phires, as well as the zircon decomposition ob-served at temperatures as low as 1400°C. There aretwo possible explanations for the pristine appear-ance of some zircon inclusions after the heatingexperiments: Either no decomposition occurredbecause they had experienced minimal radiationdamage, or subsequent recrystallization occurredafter decomposition. As seen in the Raman spectra,a few zircon inclusions showed the same peak posi-tions as those of synthetic end-member zircon (fig-ure 8), indicating that decomposition may not occurin all inclusions.
Although metamictization causes a dramatic de-crease in the temperature at which subsolidusdecomposition reactions begin, it is less likely toaffect the melting temperature of this system.Melting of zircon inclusions in these Madagascarsapphires was first observed at 1600°C, more than100°C lower than has been reported for a pureZrSiO4–Al2O3 system (Budinikov and Litvakovski,1956). Significant concentrations of MgO, CaO, K2O,and TiO2 were detected in the melted parts of a fewinclusions (again, see table 2). Since all the sampleswere polished after heating to remove contamina-tion, the most likely explanation is that these otherminerals were originally present within or adjacentto the zircon inclusions. From the chemical compo-sition of the melt, possible minerals include calcite,dolomite, magnesite, and/or feldspar.
Decomposition of zircon inclusions has alsobeen reported in naturally heated corundum fromAustralian basalts (Guo et al., 1996). Similar tothe studied sapphires, both partially reacted zir-cons and pristine inclusions were described in thesame Australian corundum crystal. Guo et al. sug-gested that the presence of a SiO2 phase with zir-con inclusions would significantly decrease themelting point of the system. Unfortunately,extensive micro-Raman spectroscopic analysis ofthe unheated zircon inclusions failed to detectany signal from coexisting minerals. This is prob-ably due to the sampling scale (µm) of Ramananalysis and the uneven distribution of the coex-isting minerals. In addition, small amounts ofvolatiles such as water and fluorine (undetectablewith the spectroscopic and chemical techniquesapplied here), present as inclusions within or as arim around the zircons, may also have a markedeffect on decreasing the melting temperature ofthe ZrSiO4–Al2O3 system.
Luminescence in the 542–552 nm Range. Thepresence of zircon decomposition reaction prod-ucts was also detected through luminescence fea-tures in the 1300–1050 cm−1 (542–552 nm) rangein the Raman spectra. Rankin and Edwards (2003)discovered at least seven emission peaks (514.5nm laser excitation) in the 1300–1050 cm−1 regionin zircon inclusions in extensively heated corun-dum crystals from Chimwadzulu Hill, Malawi.These peaks were thought to be due to lumines-cence from zircon decomposition reaction prod-ucts, leading to speculation that they might beuseful for correlation to high-temperature treat-ment of sapphire. Our study confirmed that thesepeaks were luminescent. In addition, we foundthat these peaks first appeared in two of the fouranalyzed zircon inclusions at 1500°C, and theywere present in all of them after heating to>1600°C. The nature and source of the lumines-cence is unknown, but it is clearly not related toZrSiO4, because all of the zircon disappearedentirely after heating to >1680°C.
Applications for Gem Identification. Visual evi-dence of modification or destruction of solid inclu-sions in sapphire and ruby are powerful clues fordetermining if a stone has been heated. Experi-mental results from this study can be used to deter-mine not only the possibility of heat treatment ofsapphires with zircon inclusions, but also an esti-mate of the temperature applied (again, see figure19). When some zircon inclusions (but not all) dis-play limited frosted regions, well-preserved euhe-dral shapes, and only the characteristic zircon peaksin the Raman spectra, then the heating temperatureis very likely ≤1450°C. With similar features seenunder magnification but the occasional occurrenceof luminescence peaks in the 542–552 nm region,the heating temperature might have reached1500°C–1550°C. Heat treatment at ~1600°C mightbe identified by frosting of most of the zircon inclu-sion surfaces with the overall outline of the crystalremaining virtually unchanged; zircon features inthe Raman spectra may or may not be detectedwhen a stone has been treated at this temperature.If the zircon inclusions appear irregular and form-less, but there is no evidence of melt-filled discoidfractures, the heating temperature was very likelyaround 1680°C. Treatment at this temperature alsoresults in quenched dendritic crystals, a baddeleyiteRaman spectrum, and strong luminescence in the542–552 nm region. The presence of melt-filled
148 ZIRCON INCLUSIONS IN HEATED SAPPHIRES GEMS & GEMOLOGY SUMMER 2006

discoid fractures and halos with quenched dendriticcrystals indicates that the heating temperature was>1730°C.
Any estimates of heating temperature must bebased on careful observation of multiple zirconinclusions in a ruby or sapphire host. It is particu-larly important to examine multiple inclusionswith samples that were possibly heated at<1550°C. Below this temperature, reactions in-volving zircon inclusions are very limited, and notall inclusions within a single stone will display thesame features.
We feel this experiment could have particularapplication to the identification of Be diffusion insapphires. Usually, trace-element chemical analy-sis (e.g., SIMS, LIBS, or LA-ICP-MS) is required toconfirm if a stone is Be diffused. However, theseinstruments are expensive and not always avail-able. Since treatment of Be diffusion in manycases requires a very high temperature (around1800°C), the appearance of the zircon inclusionscould be useful in estimating the heating temper-ature, assessing the need for trace-element analy-sis, and determining the color origin of sapphiresand rubies.
CONCLUSIONSPristine zircon inclusions in Madagascar sapphiresusually exhibit a euhedral crystal form and trans-parent interfaces with the host sapphire; occasion-ally, they have small sets of surrounding fractures.
Most of the inclusions are under relatively highconfining pressures due to differential thermalexpansion and radiation damage related to theirgeologic history. Other minerals may coexist withzircon to form composite inclusions. The decom-position reaction and melting temperatures ofthese inclusions are apparently lower than theywould be for a pure, well-crystallized ZrSiO4–Al2O3system. Microscopic and spectroscopic documenta-tion of the systematic modification or destructionof zircon inclusions as a function of temperatureprovides a useful tool for determining whether azircon-bearing ruby or sapphire has been heated,and for estimating the heating temperature.
Similar experimental studies are needed for othercommon mineral inclusions in ruby and sapphire toevaluate a wider range of heat-treatment conditionsand to better constrain the temperature estimates.While these results may apply for the heat treatmentof sapphires with zircon inclusions from localitiesother than Madagascar, a slight variation in theresulting modification or destruction of zircon inclu-sions is likely because metamictization significantlycontributes to lowering the temperature of decom-position in these samples. Rubies and sapphires,including those from Madagascar, have historicallybeen treated at a wide variety of temperatures: fromvery high, as with Be diffusion (figure 20), to lowertemperatures than those examined in this study. Toextend the possible usefulness of observed variationsin zircon inclusions, similar heating experiments at800°C–1400°C are ongoing.
ZIRCON INCLUSIONS IN HEATED SAPPHIRES GEMS & GEMOLOGY SUMMER 2006 149
Figure 20. Many colorsof Be-diffused sap-phires (here, 0.5–2.0 ct)have been seen in themarketplace. The mor-phology of inclusionscan supply useful infor-mation in determiningif a sapphire should betested further for thepresence of Be. Photoby Elizabeth Schrader.
150 ZIRCON INCLUSIONS IN HEATED SAPPHIRES GEMS & GEMOLOGY SUMMER 2006
REFERENCESBayer G. (1972) Thermal expansion of ABO4 compounds with zir-
con and scheelite structures. Journal of the Less-CommonMetals, Vol. 26, pp. 255–262.
Beesley C.R. (1982) The alchemy of blue sapphire. JewelersCircular Keystone, Vol. 153, No. 8, pp. 102–103.
Budinikov P.P., Litvakovski A.A. (1956) [title unknown]. DokladyAkademia Nauk S.S.S.R., Vol. 106, p. 268.
Cozar J.S., de Vincente-Mingarro I. (1995) Alteración de las inclu-siones de zircón, apatito y vidrio en el tratamiento térmico derubíes y zafiros. Boletín del Instituto Gemológico Español.Vol. 36, pp. 47–54.
Crowningshield R. (1966) Developments and highlights at GIA’slab in New York: Unusual items encountered. Gems &Gemology, Vol. 12, No. 3, p. 73.
Emmett J.L., Douthit T.R. (1993) Heat treating the sapphires ofRock Creek, Montana. Gems & Gemology, Vol. 29, No. 4, pp.250–272.
Emmett J.L., Scarratt K., McClure S.F., Moses T., Douthit T.R.,Hughes R., Novak S., Shigley J.E., Wang W., Bordelon O., KaneR.E. (2003) Beryllium diffusion of ruby and sapphire. Gems &Gemology, Vol. 39, No. 2, pp. 84–135.
Fredericci C., Morelli M.R. (2000) Corrosion of AZS and AZ cru-cibles in contact with a blast-furnace slag-based glass. MaterialsResearch Bulletin, Vol. 35, pp. 2503–2514.
Griffith W.P. (1969) Raman studies on rock-forming minerals. PartI: Orthosilicates and cyclosilicates. Journal of Chemical Society(A), Vol. 1969, pp. 1372–1377.
Gübelin E.J. (1973) Internal World of Gemstones. ABC Verlag,Zurich.
Gübelin E.J., Koivula J.I. (1986) Photoatlas of Inclusions inGemstones. ABC Edition, Zurich.
Guo J.F., O’Reilly S.Y., Griffin W.L. (1996) Zircon inclusions incorundum megacrysts: I. Trace element geochemistry andclues to the origin of corundum megacrysts in alkali basalts.Geochimica et Cosmochimica Acta, Vol. 60, No. 13, pp.2347–2363.
Hoskin P.W.O., Rodgers K.A. (1996) Raman spectral shift in theisomorphous series (Zr1-xHfx)SiO4. European Journal of SolidState Inorganic Chemistry, Vol. 33, pp. 1111–1121.
Hughes R.W. (1997) Ruby & Sapphire. RWH Publishing, Boulder,Colorado.
Izraeli E.S., Harris J.W., Navon O. (1999) Raman barometry of dia-mond formation. Earth and Planetary Science Letters, Vol. 73,No. 3, pp. 351–360.
Knittle E., Williams Q. (1993) High-pressure Raman spec-troscopy of ZrSiO4: Observation of the zircon to scheelitetransition at 300K. American Mineralogist, Vol. 78, No. 1,pp. 245–252.
Liu L.G., Mernagh T.P., Jaques A.L. (1990) A mineralogical Raman-spectroscopy study on eclogitic garnet inclusions in diamondfrom Argyle. Contributions to Mineralogy and Petrology, Vol.105, No. 2, pp. 156–161.
McKeown D.A., Muller I.S., Buechele A.C., Pegg I.L., KendzioraC.A. (2000) Structural characterization of high-zirconiaborosilicate glasses using Raman spectroscopy. Journal of Non-Crystalline Solids, Vol. 262, pp. 126–134.
McClure S.F., Smith C.P., Wang W., Hall M. (2006) Identificationand durability of lead glass-filled rubies. Gems & Gemology,Vol. 42, No. 1, pp. 22–34.
Nasdala L., Wolf D., Irmer G. (1995) The degree of metamictiza-tion in zircon: A Raman spectroscopic study. European Journalof Mineralogy, Vol. 7, No. 3, pp. 471–478.
Nasdala L., Pidgeon R.T., Wolf D. (1996) Heterogeneous metamic-tization of zircon on a microscale. Geochimica et Cosmo-chimica Acta, Vol. 60, pp. 1091–1097.
Nasdala L., Zhang M., Kempe U., Panczer G., Gaft M., Andrut M.,Plotze M. (2003) Spectroscopic methods applied to zircon. InJ.M. Hanchar and P.W.O. Hoskin, Eds., Reviews in Mineralogyand Geochemistry, Vol. 53, Mineralogical Society of America,Washington DC, pp. 427–467.
Nicola J.H., Rutt H.N. (1974) A comparative study of zircon(ZrSiO4) and hafnon (HfSiO4) Raman spectra. Journal ofPhysics C: Solid State Physics, Vol. 7, pp. 1381–1386.
Rankin A.H. (2002) Natural and heat-treated corundum fromChimwadzulu Hill, Malawi: Genetic significance of zircon clus-ters and diaspore-bearing inclusions. Journal of Gemmology,Vol. 28, No. 2, pp. 65–75.
Rankin A.H., Edwards W. (2003) Some effects of extreme heattreatment on zircon inclusions in corundum. Journal of Gem-mology, Vol. 28, No. 5, pp. 257–264.
Roberts R.B. (1975) Absolute dilatometry using a polarizationinterferometer. Journal of Physics E, Vol. 8, pp. 600–602.
Scarratt K. (1983) Heat treated sapphires. Retail Jeweller, Vol. 22,No. 543, pp. 16–17.
Schwieger R. (1990) Diagnostic features and heat treatment ofKashmir sapphires. Gems & Gemology, Vol. 26, No. 4, pp.267–280.
Sobolev N.V., Fursenko B.A., Goryainov S.V., Shu J.F., HemleyR.J., Mao H.K., Boyd F.R. (2000) Fossilized high pressure fromthe earth's deep interior: The coesite-in-diamond barometer.Proceedings of the National Academy of Sciences of theUnited States of America, Vol. 97, No. 22, pp. 11875–11879.
Stefanc I.I., Music S., Stefanic G., Gajovic A. (1999) Thermalbehavior of ZrO2 precursors obtained by sol-gel processing.Journal of Molecular Structure, Vol. 480–481, pp. 621–625.
Syme R.W.G., Lockwood D.J., Kerr J. (1977) Raman spectrum ofsynthetic zircon (ZrSiO4) and thorite (ThSiO4). Journal ofPhysics C: Solid State Physics, Vol. 10, pp. 1335–1348.
White G.K., Roberts R.B. (1983) Thermal expansion of referencematerials: Tungsten and α-Al2O3. High Temperatures–HighPressures, Vol. 15, pp. 321–328.
Zhang M., Salje E.K.H., Capitani G.C., Leroux H., Clark A.M.,Schlüter J., Ewing R.C. (2000) Annealing of α-decay damage inzircon: A Raman spectroscopic study. Journal of Physics:Condensed Matter, Vol. 12, pp. 3131–3148.
ABOUT THE AUTHORSDr. Wang ([email protected]) is a research scientist at theGIA Laboratory, New York; Mr. Scarratt is director ofResearch at GIA Thailand, Bangkok; Dr. Emmett is a princi-pal of Crystal Chemistry, Brush Prairie, Washington; Dr.Breeding is a research scientist at the GIA Laboratory,Carlsbad; Mr. Douthit is a principal of Crystal Chemistry,Los Altos, California.
ACKNOWLEDGMENTSThe authors are grateful to Matthew Hall, Shane McClure,Thomas Moses, Dr. Andy Hsi-Tien Shen, Dr. James Shigley, andChristopher Smith at the GIA Laboratory, and to Richard Hughesand John Koivula at the America Gem Trade AssociationGemological Testing Center, for stimulating and helpful discus-sions. Dr. Chi Ma and Dr. George Rossman, of the CaliforniaInstitute of Technology, Pasadena, kindly provided assistancewith the SEM-EDS analysis. Special thanks to Dr. GeorgeRossman for the Raman spectrum of synthetic zircon.

NOTES AND NEW TECHNIQUES GEMS & GEMOLOGY SUMMER 2006 151
NOTES & NEW TECHNIQUES
amed from the Greek rose or rhodos, in allu-sion to its characteristic pink color (Jasche,1819; Gaines et al., 1997), gem rhodonite
commonly occurs as opaque or at best translucentmaterial that is cut in cabochon form or as tablets(Koivula et al., 1994). Transparent, faceted gems (see,e.g., figure 1) are extremely rare and are sourced pri-marily from crystals found at Broken Hill, NewSouth Wales, Australia, and Honshu, Japan (Bank etal., 1974; Gaines et al., 1997), with some facet-quali-ty material recently reported from Minas Gerais,Brazil (Quinn and Laurs, 2004). However, the pri-mary sulfide ore at Broken Hill has unquestionablybeen the richest source of gem rhodonite crystals inthe world (see, e.g., figure 2; for more information on
the geology and history of rhodonite mining atBroken Hill, see Millsteed et al., 2005).
Rhodonite has moderate hardness (51⁄2–61⁄2), andthe familiar massive (microcrystalline) ornamentalmaterial is quite tough. A large percentage of massiverhodonite is found in sedimentary geologic environ-ments, and this likely contributes to recorded differ-ences in its texture and properties. In contrast, trans-parent gem rhodonite, such as from the metamorphicBroken Hill deposit, occurs in granular textured ore.Unlike the ornamental material, the transparentvariety is very brittle and has gained a reputation asone of the most difficult gems to facet (Arem, 1977).
The largest faceted rhodonite ever recorded fromBroken Hill—currently on display at the RoyalOntario Museum in Toronto—weighs 10.91 ct andresembles a red spinel in color and clarity (see figure2 in Millsteed et al., 2005). Another stone, a 4.89 ctemerald cut, is part of the U.S. National Gem Col-lection at the Smithsonian Institution (figure 3, left;Post, 1997), while the Australian Museum recentlyacquired a 2.24 ct modified step cut (figure 3, right),also from Broken Hill (G. Webb, pers. comm., 2005).A 4.5 ct faceted gem rhodonite from Broken Hill wasrecorded by Arem (1977).
It must be recognized, however, that for everysuccessfully cut rhodonite there have undoubtedlybeen numerous catastrophic failures, which has lim-ited the economic value of the rough. It is the
N
FACETING TRANSPARENT RHODONITEFROM BROKEN HILL,
NEW SOUTH WALES, AUSTRALIAPaul W. Millsteed
See end of article for About the Author and Acknowledgments.GEMS & GEMOLOGY, Vol. 42, No. 2, pp. 151–158.© 2006 Gemological Institute of America
Transparent rhodonite is considered one of themost difficult of all gems to facet because of itsperfect cleavage and brittle, uneven fracture.This article describes a technique for success-fully faceting gem rhodonite that was devel-oped through experiments on eight crystalsfrom the North mine at Broken Hill, NewSouth Wales. This was accomplished througha systematic structural, crystallographic, andoptical analysis and the use of a nonconven-tional faceting approach—the “greasy lap”technique. This method uses a mixture ofpetroleum jelly and diamond grit to charge anon-embedded lap, allowing the diamond gritto “roll free” during the lapping process.

author’s intent with this article to offer a techniquefor successfully faceting gem rhodonite and therebyenhancing its value to the industry.
CRYSTALLOGRAPHIC ANDOPTICAL PROPERTIESThe successful fashioning of gem rhodonite requiresan understanding of some basic crystallographic, opti-cal, and structural features of the material. By way ofcomparison, in diamond, which has a Mohs hardnessof 10, each carbon atom is linked to four neighboringC atoms in a face-centered cubic unit cell. The closethree-dimensional covalent linking (which completesthe outer electron shell of each atom) is very strong,and this is manifested in diamond’s great hardness.Though perfect, its cleavage is quite difficult.
Rhodonite (MnSiO3), by contrast, is characterizedby chains of SiO3 that are arranged parallel to the c-axis, but bound together very weakly. The perfect,easy, splintery cleavages and the Mohs hardness of51⁄2–61⁄2 are expressions of this chain structure(Gaines et al., 1997). It is the extremely brittle natureof the cleavage planes—perfect along {11–0} and {110},which are 92.5° to one other, and good along {001}(figure 4)—and the conchoidal-to-uneven fracturethat make transparent rhodonite so difficult to facet.
The highly prized intense pinkish to brownishred color of Broken Hill rhodonite incorporates threemajor directions of light vibration (again, see figure4) within the crystal lattice, which are referred to asX, Y, and Z (or α, β, and γ):
X = the axis of greatest ease of vibration. Lightvibrating perpendicular to X travels with maxi-mum velocity; yellowish red pleochroic color.
Z = the axis of least ease of vibration. Light vibrat-ing perpendicular to Z travels with minimumvelocity; pale yellowish red pleochroic color.
Y = the intermediate axis, at right angles to theplane of X and Z. Light travels at a velocitybetween X and Z; pinkish red pleochroic color.
152 NOTES AND NEW TECHNIQUES GEMS & GEMOLOGY SUMMER 2006
Figure 1. Rhodonite is one of the most difficult gemmaterials to facet. However, with proper techniques,attractive faceted stones can be created. The 0.86 ctBarion cut rhodonite shown here, which was facetedas part of this article, is mounted with a 1.0 ct yellowsapphire in a palladium–white gold alloy. Photo byBen Klimpsch.
Figure 2. These two transparent rhodonite crystals(70.50 and 51.52 ct) are representative of the finestmaterial found at Broken Hill. Clean, well-formedcrystals such as these are considered most suitablefor faceting. Courtesy of George Stacey; photo by P. Millsteed.
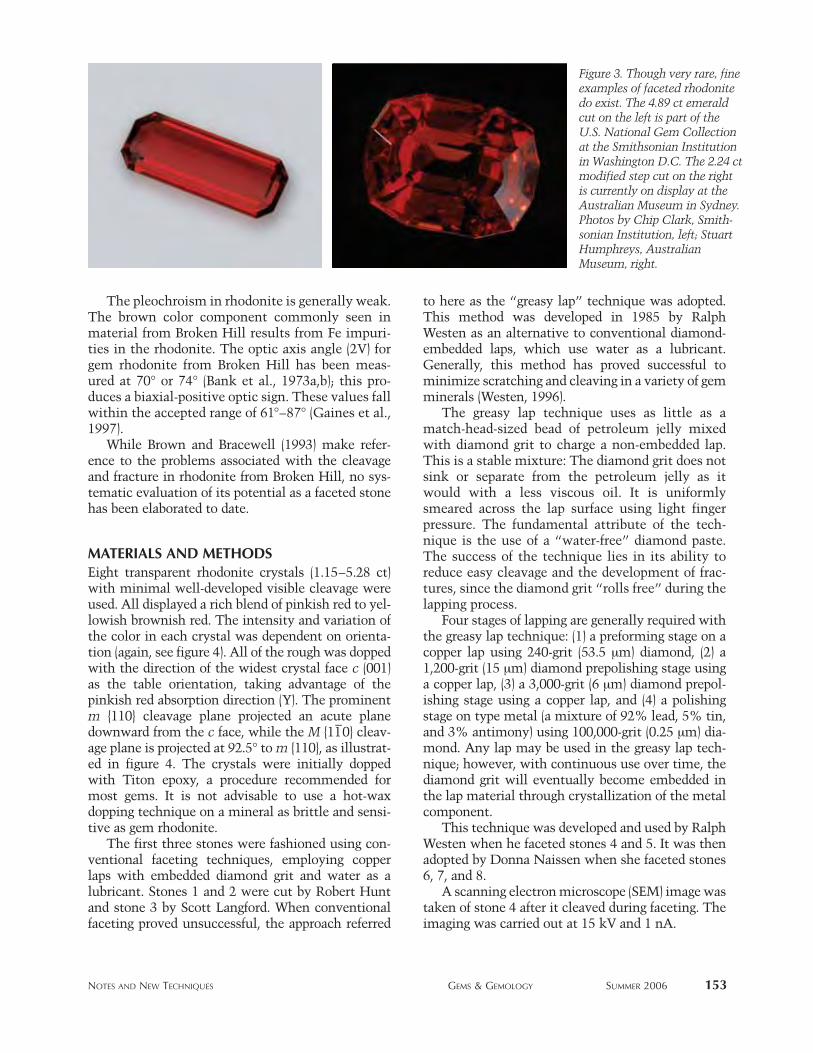
NOTES AND NEW TECHNIQUES GEMS & GEMOLOGY SUMMER 2006 153
The pleochroism in rhodonite is generally weak.The brown color component commonly seen inmaterial from Broken Hill results from Fe impuri-ties in the rhodonite. The optic axis angle (2V) forgem rhodonite from Broken Hill has been meas-ured at 70° or 74° (Bank et al., 1973a,b); this pro-duces a biaxial-positive optic sign. These values fallwithin the accepted range of 61°–87° (Gaines et al.,1997).
While Brown and Bracewell (1993) make refer-ence to the problems associated with the cleavageand fracture in rhodonite from Broken Hill, no sys-tematic evaluation of its potential as a faceted stonehas been elaborated to date.
MATERIALS AND METHODSEight transparent rhodonite crystals (1.15–5.28 ct)with minimal well-developed visible cleavage wereused. All displayed a rich blend of pinkish red to yel-lowish brownish red. The intensity and variation ofthe color in each crystal was dependent on orienta-tion (again, see figure 4). All of the rough was doppedwith the direction of the widest crystal face c (001)as the table orientation, taking advantage of thepinkish red absorption direction (Y). The prominentm {110} cleavage plane projected an acute planedownward from the c face, while the M {11–0} cleav-age plane is projected at 92.5° to m {110}, as illustrat-ed in figure 4. The crystals were initially doppedwith Titon epoxy, a procedure recommended formost gems. It is not advisable to use a hot-waxdopping technique on a mineral as brittle and sensi-tive as gem rhodonite.
The first three stones were fashioned using con-ventional faceting techniques, employing copperlaps with embedded diamond grit and water as alubricant. Stones 1 and 2 were cut by Robert Huntand stone 3 by Scott Langford. When conventionalfaceting proved unsuccessful, the approach referred
to here as the “greasy lap” technique was adopted.This method was developed in 1985 by RalphWesten as an alternative to conventional diamond-embedded laps, which use water as a lubricant.Generally, this method has proved successful tominimize scratching and cleaving in a variety of gemminerals (Westen, 1996).
The greasy lap technique uses as little as amatch-head-sized bead of petroleum jelly mixedwith diamond grit to charge a non-embedded lap.This is a stable mixture: The diamond grit does notsink or separate from the petroleum jelly as itwould with a less viscous oil. It is uniformlysmeared across the lap surface using light fingerpressure. The fundamental attribute of the tech-nique is the use of a “water-free” diamond paste.The success of the technique lies in its ability toreduce easy cleavage and the development of frac-tures, since the diamond grit “rolls free” during thelapping process.
Four stages of lapping are generally required withthe greasy lap technique: (1) a preforming stage on acopper lap using 240-grit (53.5 µm) diamond, (2) a1,200-grit (15 µm) diamond prepolishing stage usinga copper lap, (3) a 3,000-grit (6 µm) diamond prepol-ishing stage using a copper lap, and (4) a polishingstage on type metal (a mixture of 92% lead, 5% tin,and 3% antimony) using 100,000-grit (0.25 µm) dia-mond. Any lap may be used in the greasy lap tech-nique; however, with continuous use over time, thediamond grit will eventually become embedded inthe lap material through crystallization of the metalcomponent.
This technique was developed and used by RalphWesten when he faceted stones 4 and 5. It was thenadopted by Donna Naissen when she faceted stones6, 7, and 8.
A scanning electron microscope (SEM) image wastaken of stone 4 after it cleaved during faceting. Theimaging was carried out at 15 kV and 1 nA.
Figure 3. Though very rare, fineexamples of faceted rhodonitedo exist. The 4.89 ct emeraldcut on the left is part of theU.S. National Gem Collectionat the Smithsonian Institutionin Washington D.C. The 2.24 ctmodified step cut on the rightis currently on display at theAustralian Museum in Sydney.Photos by Chip Clark, Smith-sonian Institution, left; StuartHumphreys, AustralianMuseum, right.

RESULTS AND DISCUSSION The crystals were initially examined through abinocular microscope and then with a 10× loupeuntil the cleavage planes m {110} and M {11–0} wereidentified (again, see figure 4). For reasons of orienta-tion (which relate to optimum color and stoneshape), typically the longest dimension of the roughcrystal should be parallel to the M cleavage plane,and the shortest dimension should be parallel to them cleavage plane. Cleavage fragments are generallyregarded as unsuitable for faceting.
As noted above, the cutting of crystal 1 was
begun by Mr. Hunt using a conventional facetingtechnique. After the pavilion and crown facets werealmost completed, the stone suddenly cleaved inhalf along the M plane (figure 5). The crown wasunrecoverable.
Mr. Hunt’s cutting of crystal 2 appeared success-ful until the stone developed a major structural dis-location along a natural uneven internal fracture, asshown in figure 6. As Mr. Hunt cut the crown facets,cleaving became problematic. After severalattempts, he stopped work on the stone.
The polish on both stones was good; however,
154 NOTES AND NEW TECHNIQUES GEMS & GEMOLOGY SUMMER 2006
Figure 4. Crystallo-graphic axes a [100], b [010], c [001]; lightvibration directions X,Y, Z; and cleavageplanes M {11
–0}, m {110},
c {001} of rhodonite areshown from two per-spectives in these draw-ings (interpreted andcompiled from Diehland Berdesinski, 1970;Bank et al., 1973a, b,1974; Gaines et al.,1997). When facetingrhodonite, the c-axisshould be placed per-pendicular to the tablefacet to take advantageof the pinkish redabsorption direction.The blue lines representthe crystal faces ofrhodonite and serve as aguide to dopping thestone for faceting.

NOTES AND NEW TECHNIQUES GEMS & GEMOLOGY SUMMER 2006 155
none of the facets met very well due to repeatedattempts to recut some of them. Severe chipping alsooccurred. These problems were likely due to theembedded diamonds in the conventional laps tearingat the brittle structure of the crystal, particularly thecleavage planes.
Again using conventional faceting techniques,Mr. Langford attempted to cut crystal 3. He metwith relative success (figure 7, left), but significantchipping was observed on some of the pavilionfacets (figure 7, right). In addition, the girdle wasthicker than average (1 mm), which may havereduced further chipping, fracturing, and cleavingat the crown/pavilion interface. The final polishwas good. A freeform shape was used to minimizethe loss of material during the faceting process. Thefinished stone also contained two large inclusions,of galena and spessartine, seen at the bottom of fig-ure 7 (left).
After this initial trial, Mr. Westen concluded that
the fundamental limitations of gem rhodonite (thebrittle structure, perfect cleavage, and a profoundconchoidal-to-uneven fracture) required a newapproach, the greasy lap technique. Stone 4 was thencut by Mr. Westen using this method, but he ran intodifficulty when he cut the facets that were approxi-mately parallel to the m cleavage plane first insteadof last. After he cut the 45° corners across the mplane, internal stresses were released along theplane, resulting in a delayed cleaving. This relation-ship is illustrated by the SEM image in figure 8,which shows the critical intersection point of the45° facets, with the facet approximately parallel tothe m cleavage plane. A view of the m cleavage planeintersecting the table of the faceted rhodonite is alsoshown, along with the faint surface intersection ofthe M cleavage plane. Although this stone sufferedstructural failure, the final polish and facet meetwere excellent. To obtain consistent and repro-ducible results, it therefore appears critical that the
Figure 5. The first rhodonite crystal (2.50 ct) cleavedalong the M plane during faceting. Note the outline ofthe pavilion facets, which were almost completed. Thecrown was unrecoverable. Photo by P. Millsteed.
Figure 6. The stone produced from the secondrhodonite crystal (3.00 ct) suffered structural splinter-ing along internal fractures, in addition to minorchipping on the pavilion facets. Photo by P. Millsteed.
Splintery perfect basal cleavage of M {110}
Pavilion facets
Chipping on pavilion facets
Internal fractures
Figure 7. This free-form 3.96 ct rhodonite
was successfully cutusing conventionalfaceting techniques
(left). However, it stillsuffered chipping onthe pavilion facets,and the girdle was
unusually thick (right).Photo by P. Millsteed. Galena and spessartine inclusions
Chipping on the pavilion
1 mm thick girdle

facets approximately parallel to the m cleavage planedirection be cut last.
Mr. Westen revised his technique accordinglyand successfully faceted stone 5, a transparent 0.86ct Barion cut (figure 9), a significant turning point inthe study. The stone was cut with the c face as thetable orientation. Subsequent to the completion ofstone 5, Ms. Naissen faceted three more stonesusing the greasy lap technique (again, see figure 9).The largest of these was a 3.72 ct emerald cut.Although the stones were relatively clean, they didshow some small eye-visible fractures and inclu-sions. The rich pinkish to brownish red color anddispersive characteristics of gem rhodonite weresuccessfully displayed in all of the stones faceted. Instone 5, however, dispersion was noticeably en-hanced by the style of cut. Stone 5 was subsequent-ly mounted in a palladium–white gold alloy settingdesigned by jeweler Ben Klimpsch (again, see figure1). A yellow sapphire was incorporated into thepiece to compliment the yellowish red pleochroiccolor of the rhodonite. During the setting procedureof any stone, even diamond, there is some risk ofdamage; with faceted rhodonite, this risk certainlyis considerable. Mr. Klimpsch mounted the stonewith a modified bezel technique (using great careand minimal pressure) combined with strategicallyplaced resin mounts.
The prerequisites and stages for the successful
faceting of gem rhodonite, using the greasy lap tech-nique, were determined to be as follows:
The cutting angles are culet 42°, crown 40°. Thepavilion must be cut first and the crown second.
The pavilion:
• The longitudinal sections parallel to cleavageplane M must be cut first.
• The 45° corner facets (across the m cleavageplane) are cut next.
• The facets that are approximately parallel tothe m cleavage plane are cut last.
The crown:
• The table facet parallel to c must be cut first.
• The 45° corner facets (across the m cleavageplane) are cut next.
• The facets that are approximately parallel tothe m cleavage plane are cut last.
Characteristically, for all of the cutters, the pres-sure applied to the lap was “normal” and withoutvariation. Overriding the lap (applying too muchpressure) is wasteful and results in undercutting(incomplete polishing of a facet).
Although the original crystals chosen were pre-dominantly transparent, the presence of mineral
156 NOTES AND NEW TECHNIQUES GEMS & GEMOLOGY SUMMER 2006
Figure 8. This SEM image of the fourth rhodonite sample (left) shows the intersection of the cleavage plane mwith facets of the crown and pavilion. The stone cleaved after the 45° crown facets were cut across the mcleavage direction (indicated as the critical intersection point). On the right is an SEM view of the m cleavageintersecting the crown of the faceted rhodonite. Note also the faint surface intersection of the M cleavage.SEM images by P. Millsteed.
Table
Table
M {110}
Critical intersection point
m {110}
m {110}
100 µm2.00 mm
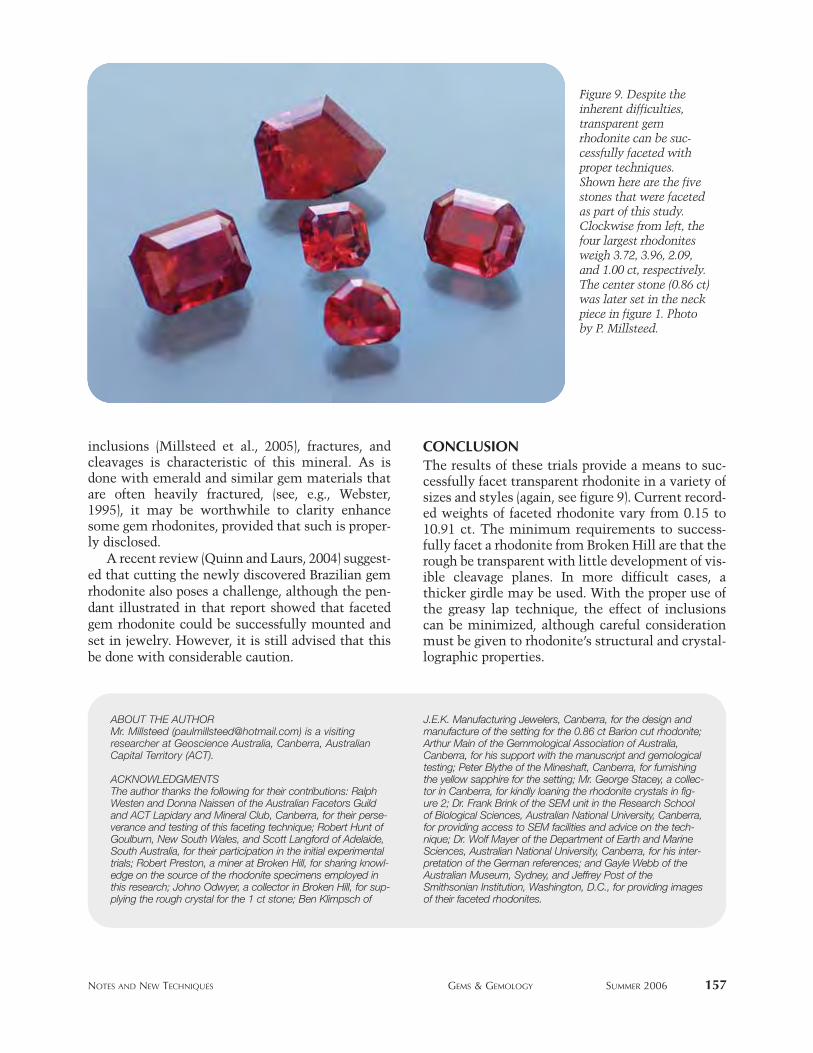
NOTES AND NEW TECHNIQUES GEMS & GEMOLOGY SUMMER 2006 157
inclusions (Millsteed et al., 2005), fractures, andcleavages is characteristic of this mineral. As isdone with emerald and similar gem materials thatare often heavily fractured, (see, e.g., Webster,1995), it may be worthwhile to clarity enhancesome gem rhodonites, provided that such is proper-ly disclosed.
A recent review (Quinn and Laurs, 2004) suggest-ed that cutting the newly discovered Brazilian gemrhodonite also poses a challenge, although the pen-dant illustrated in that report showed that facetedgem rhodonite could be successfully mounted andset in jewelry. However, it is still advised that thisbe done with considerable caution.
CONCLUSIONThe results of these trials provide a means to suc-cessfully facet transparent rhodonite in a variety ofsizes and styles (again, see figure 9). Current record-ed weights of faceted rhodonite vary from 0.15 to10.91 ct. The minimum requirements to success-fully facet a rhodonite from Broken Hill are that therough be transparent with little development of vis-ible cleavage planes. In more difficult cases, athicker girdle may be used. With the proper use ofthe greasy lap technique, the effect of inclusionscan be minimized, although careful considerationmust be given to rhodonite’s structural and crystal-lographic properties.
ABOUT THE AUTHORMr. Millsteed ([email protected]) is a visitingresearcher at Geoscience Australia, Canberra, AustralianCapital Territory (ACT).
ACKNOWLEDGMENTSThe author thanks the following for their contributions: RalphWesten and Donna Naissen of the Australian Facetors Guildand ACT Lapidary and Mineral Club, Canberra, for their perse-verance and testing of this faceting technique; Robert Hunt ofGoulburn, New South Wales, and Scott Langford of Adelaide,South Australia, for their participation in the initial experimentaltrials; Robert Preston, a miner at Broken Hill, for sharing knowl-edge on the source of the rhodonite specimens employed inthis research; Johno Odwyer, a collector in Broken Hill, for sup-plying the rough crystal for the 1 ct stone; Ben Klimpsch of
J.E.K. Manufacturing Jewelers, Canberra, for the design andmanufacture of the setting for the 0.86 ct Barion cut rhodonite;Arthur Main of the Gemmological Association of Australia,Canberra, for his support with the manuscript and gemologicaltesting; Peter Blythe of the Mineshaft, Canberra, for furnishingthe yellow sapphire for the setting; Mr. George Stacey, a collec-tor in Canberra, for kindly loaning the rhodonite crystals in fig-ure 2; Dr. Frank Brink of the SEM unit in the Research Schoolof Biological Sciences, Australian National University, Canberra,for providing access to SEM facilities and advice on the tech-nique; Dr. Wolf Mayer of the Department of Earth and MarineSciences, Australian National University, Canberra, for his inter-pretation of the German references; and Gayle Webb of theAustralian Museum, Sydney, and Jeffrey Post of theSmithsonian Institution, Washington, D.C., for providing imagesof their faceted rhodonites.
Figure 9. Despite theinherent difficulties,transparent gemrhodonite can be suc-cessfully faceted withproper techniques.Shown here are the fivestones that were facetedas part of this study.Clockwise from left, thefour largest rhodonitesweigh 3.72, 3.96, 2.09,and 1.00 ct, respectively.The center stone (0.86 ct)was later set in the neckpiece in figure 1. Photoby P. Millsteed.

158 NOTES AND NEW TECHNIQUES GEMS & GEMOLOGY SUMMER 2006
REFERENCESArem J.E. (1977) Color Encyclopedia of Gemstones. Van Nostrand
Reinhold Co., New York.Bank H., Berdesinski W., Diehl R. (1973a) Durchsichtiger Rhodonit
aus Broken Hill/Australien. Zeitschrift der Deutschen Gem-mologischen Gesellschaft, Vol. 22, No. 3, pp. 101–103.
Bank H., Berdesinki W., Diehl R. (1973b) Durchsichtiger rötlicherPyroxmangit aus Broken Hill/Australien und die Möglich-keiten seiner Unterscheidung von Rhodonit. Zeitschrift derDeutschen Gemmologischen Gesellschaft, Vol. 22, No. 3, pp.104–110.
Bank H., Berdesinki W., Ottermann J., Schmetzer K. (1974)Transparent red iron rich rhodonite from Australia. Zeitschriftder Deutschen Gemmologischen Gesellschaft, Vol. 23, No. 3,pp. 180–188.
Brown G., Bracewell H. (1993) Rhodonite from UpperCoomera–SE Queensland. Australian Gemmologist, Vol. 18,No. 6, pp. 197–199.
Diehl R., Berdesinski W. (1970) Twinning in pyroxmangite fromthe North mine in Broken Hill, New South Wales, Australia.
Neues Jahrbuch für Mineralogie Monatshefte, Vol. 1970, No.8, 348–362.
Gaines R.V., Skinner H.C.W., Foord E.E., Mason B., RosenzweigA., King V.T. (1997) Dana’s New Mineralogy. John Wiley &Sons, New York, pp. 1326–1328.
Koivula J. I., Kammerling R.C., Fritsch E., Eds. (1994) Gem News:Yukon rhodonite. Gems & Gemology, Vol. 30, No. 3, p. 196.
Millsteed P.W., Mernagh T.P., Otieno-Alego V., Creagh D.C. (2005)Inclusions in transparent gem rhodonite from Broken Hill,New South Wales, Australia. Gems & Gemology, Vol. 41, No.3, pp. 246–254.
Post J.E. (1997) The National Gem Collection. Harry N. Abrams,New York.
Quinn E.P., Laurs B.M. (2004) Gem News International:Rhodonite of facet and cabochon quality from Brazil. Gems &Gemology, Vol. 40, No. 3, pp. 260–261.
Webster R. (1995) Gems: Their Sources, Description, and Identi-fication, 5th ed. Revised by P.G. Read, Butterworth-Heinemann,Oxford, U.K.
Westen R. (1996) In the beginning. Facet Talk, September, p. 91.
• 340 pages of award-winning articles and beautiful, detailed color photography
• More than 70 years of cutting-edge research on the characterization and grading of colored diamonds
• Editorial commentary by colored diamond color-grading expert John King, technical director of the GIA Laboratory
• Insights on the past, present, and future of colored diamonds–in the marketplace and the laboratory
• The GIA Colored Diamond Color Reference Charts booklet explains and illustrates GIA fancy diamond color grades and descriptions for the most common diamond colors
To order your copy todayvisit GEMS & GEMOLOGY at
www.gia.eduor call
800-421-7250, ext. 7142(outside the U.S.:
760-603-4000, ext. 7142)This soft-cover 2-book set (complete with an attractive slipcase) is now available for $59.95
(plus shipping and handling). Additional copies of the GIA Colored Diamond Color Reference Chartsbooklet can be purchased separately for $19.95 (plus shipping and handling).
This volume of GEMS & GEMOLOGY IN REVIEW presents a selection of articles and notes that haveappeared in the journal since its inception in 1934. Some of the material is from issues long out of
print. That means you won't find this information collected anywhere else but here!

GIA appreciates gifts to its permanent collection, as well as gemstones, library materials, and other non-cash assets to be used in GIA’s educational and research activities. These contributions help GIA further its public service
mission while offering donors philanthropic benefits. We extend sincere thanks to all 2005 contributors.
CIRCLE OF HONOR
$100,000 AND HIGHER,CUMULATIVE
The Aaron GroupDr. Suman Agrawal
Almaza Jewelers(Ziad H. Noshie)
American Pearl CompanyAmsterdam Sauer
Aurafin Oro AmericaBanks International Gemology, Inc.
(Daniel and Bo Banks)The Bell Group/Rio Grande
Allan CaplanChatham Created Gems, Inc.
(Thomas H. Chatham)PierLuigi Dalla RovereThe DeBeers Group
Dallas R. HalesDr. Gary R. and Barbara E. Hansen
J.O. Crystal Company, Inc.(Judith Osmer)
JewelAmerica, Inc.(Zvi and Rachel Wertheimer)
Kazanjian Bros., Inc.KCB Natural Pearls
(K. C. Bell)William F. and Jeanne H. Larson
Stephen LentzSophie Leu
Marshall and Janella MartinRoz & Gene MeieranNancy B & CompanyKurt Nassau, Ph.D.
John and Laura RamseyR. Ed RomackArt Sexauer
Ambaji ShindeS.H. Silver Company
(Stephen and Eileen Silver)Dr. Geoffrey A. SmithD. Swarovski & Co.Shades of the Earth
(Laura and Wayne Thompson)Touraine Family TrustUnited States Pearl Co.
(James and Venetia Peach)Robert H. Vanderkay
Vicenza Fair
2005 DONORS
$50,000 to $99,999Debbie and Mark EbertTed and Corky GrussingMona Lee Nesseth, G.G.
$10,000 to $49,999Cos Altobelli
Dudley BlauwetGeorge Brooks
Teresa A. DeCrescenzoMr. and Mrs. Robert J. Flude, III
Fortunoff Fine Jewelry &Silverware, Inc.
Sandra Manin FriasThe Gemesis Corporation
Gorenstein FamilyRobert Grant
H. Stern Jewelers, BrazilJames Y. Hung, M.D.
JewelmerKorite International
Pascal LacroixLeslie Weinberg Designs
Dimitri K. MantheakisPala International, Inc.Michael J. Quinn, A.J.P.
Edward and Jane RosenzweigMuriel Roston
SAFDICO USA, INC.Sant Enterprises Co., Ltd.
SekikazuJoanne Stacher, G.G.
Star Ring, Inc.Joseph W. Tenhagen
$5,000 to $9,999Thomas P. Gübelin
Chris and Karen JohnstonTerry Ledford
Tom MunsteinerGerald StocktonWorld Sapphire
$2,500 to $4,999Cecilia J. AnnunziataArmatis Fine Design
(Mary T. Armatis)W. Ballreich
Maria Lucia BarbosaRose Carvalho
Maria José CavalcantiLinda Ching
Cathrine ClarkeGloria Corbetta
Carmen D’LamonicaHeinz DreierWillian Farias
FerjenniSyed Iftikhar Hussain
JCK MagazineRobert E. Kane
Ketterman’s JewelersGail Brett Levine, G.G.
Linda Potichke Jewelry Designs(Linda Potichke)Robert F. OfficerPerry Jewelers
(Edward N. Perry)Douglas Rountree
Thomas M. SchneiderSon T. Ta
Brenda VidalChristopher Wolfsberg
Tommy WuYael Sonia
$1,000 to $2,499Angeles Girl Scout Council
Antonio Bernardo HerrmannCapalion EnterpriseMarya Dabrowski
DenoirBialice Duarte
Fire Mountain Gems(Chris and Stuart Freedman)
FR HuebSi and Ann Frazier
Farooq HashmiJewelry by Gail, Inc.Bernardo KrengielKenneth Win Kyi
Liliane LimaHussain Rezayee
Laurenice SingulaniMark H. Smith
Prof. James P. SyvitskiBia Vasconcellos
Vianna, BrazilGeorge A. Williams, Ph.D.
$500 to $999John Bailey
Tom CushmanG. Scott Davies
Mary Johnson and Mark ParisiJ. & S.S. DeYoung, Inc.(Joseph H. Samuel, Jr.)
Pillar & Stone International, LLCMurray Schulman
Julia P. Solodova, G.G.Johann Viljoen
YAYO
Under $500Jeffery Lee BergmanB.G. & J. Co., Ltd.
Jim ClaninFai Dee Gems Co. Ltd.Fossheim Steinsenter
Gems TVAura M. Godoy, G.G.Rainer Schultz GuttlerChristina Harrington
Nancy K. HaysHrand Djevahirdjian SA
Jan David Design JewelersLalita R. Jaswal
K & K InternationalDr. A. J. Kissin, G.G.Hannes Kleynhans
Brendan LaursLittle Big StoneKishmish LodhaLynn's Jewelry
Marle's Gemstone ServiceJim Marquardt
DeAnna Lynn McDanielSeung-Hae MoonRaymond Naftule
National Jewellery QualitySupervision Inspection Center of
ChinaThomas W. Overton
Renato and Adriana PaganoDr. Jayshree Panjikar
C. D. Parsons/Dee ParsonsJenny Peterson
J. Dennis PetimezasPreciosa, a.s.
Radiance InternationalAnne Lajee Reynolds
Karen SchwabLea Seelig
The Shipley FamilyTibetan Sunstone Mine™
Thom S. UnderwoodUnique Pawn Brokers—San Diego
Vasconcelos Minerals—BrazilStuart and Donna WilenskyRichard and Joan Wilson
David E. WrightVictor E. Zagorsky
If you are interested in making a donation and receiving tax benefit information, please contact Patricia Syvrud at (800) 421-7250, ext. 4432. From outside the U.S., call (760) 603-4432, fax (760) 603-4199. Or e-mail [email protected]
If you are interested in making a donation and receiving tax benefit information, please contact Patricia Syvrud at (800) 421-7250, ext. 4432. From outside the U.S., call (760) 603-4432, fax (760) 603-4199. Or e-mail [email protected]

160 LAB NOTES GEMS & GEMOLOGY SUMMER 2006
BONE PendantAnimal bone may be one of the old-est jewelry materials in human socie-ty. Today, cow bone is most oftenseen, but camel bone is sometimes
used in Asia. In Africa, cattle are asymbol of wealth, and thus cow bonebeads and jewelry, especially largepieces, represent wealth and prosper-ity. Bone has also been used as a sub-stitute for ivory. However, thoughthe two may be similar in appear-ance, there are many differences.
The large pendant in figure 1(33.90 × 15.05 × 10.25 mm) was sub-mitted to the East Coast laboratory foridentification. With magnification, itshowed parallel banded structures insome areas and irregular structuresin others (figure 2). This was quite dis-tinct from the “engine-turned” ap-pearance of polished ivory. It alsoshowed yellow dye concentrations; itis a common practice to stain bone tomake it appear older than it actuallyis. The patterns of these dye concen-trations were apparent in the pen-dant’s moderate and very weak yellow
fluorescence to long- and short-waveultraviolet (UV) radiation, respective-ly. The spot R.I. was 1.56 (within thetypical range for organic gem materi-als). We could not determine the spe-cific gravity of the pendant because ofthe mounting, though this would havebeen a good test to distinguishbetween bone and ivory (ivory’s S.G. is1.7–2.0, while bone has a specific grav-ity of about 2.3).
The Raman spectrum of the pen-dant (figure 3) matched that of abovine (e.g., cow, buffalo, or bison)bone reference spectrum, so we con-cluded that this pendant was fashionedfrom stained bovine bone, probablycow bone. (Additional spectral data forthis sample are available in the Gems& Gemology Data Depository atwww.gia.edu/gemsandgemology.
Paul Johnson, Kyaw Soe Moe, and Carol Pearce
EDITORSThomas M. Moses and Shane F. McClureGIA Laboratory
CONTRIBUTING EDITORSG. Robert CrowningshieldGIA Laboratory, East Coast
Cheryl Y. WentzellGIA Laboratory, West Coast
Figure 1. This large pendant provedto be made from dyed yellowbovine bone. Most bone jewelry ismade from cow, sheep, or camelbone, since these are durableenough to wear yet soft enough towork with primitive tools.
Figure 2. With magnification, the bone pendant showed a parallel bandedstructure in some areas (left) and irregular structures elsewhere (right). Notethe dye concentrations in some of the cracks and fissures. Magnified 40×.

LAB NOTES GEMS & GEMOLOGY SUMMER 2006 161
DIAMONDWith Circular Brown or GreenRadiation Stains
Green and brown “stains” are occa-sionally seen on both rough andfaceted diamonds. These stains arebelieved to be the result of naturalirradiation, with the brown colorresulting when the green stains aresubsequently exposed to heat.Although such stains are an impor-tant gemological feature, little isknown about their physical proper-ties. Recently, the East Coast labora-tory examined two unusual naturaldiamonds, one with brown stains andthe other with green stains (figure 4).However, unlike previously seenradiation stains, which usually showirregular outlines, all of these stainsdisplayed nearly perfect circularshapes and each was centered on aclearly visible dark spot (figure 5).
In the first diamond, a 1.47 ct rec-tangular blocked stone, extensivebrown stains were present in the culetregion. This stone would have showna light yellow color without thesebrown stains. We observed brown
stains on areas that represented thepristine natural surface as well as onthe slightly polished facets (again, seefigure 5). For the most part, the browncircles were uniform in size, withdiameters of about 35 µm. All thestains had a dark center spot whenviewed with diffused light. Overlapamong the circles was common, and
the color in some intersecting regionswas dark brown. When viewed withfiber-optic illumination, the dark cen-ters showed very bright reflections,indicating that they were actuallymicro-fractures.
In the other diamond, a 1.60 ctsquare shape, we observed green andyellowish green stains with a similarappearance on naturals in the girdleregion, though with a much lowerdensity as most appeared to have beenpolished off (figure 6). This stone wascolor graded Fancy Vivid green-blue.These features were somewhat differ-ent from those observed in the firstdiamond, in that very fine, well-developed etch channels began at thecenters of the green circles; however,the diameters of the stains on the twostones were very similar.
Both diamonds were type Ia withvery high concentrations of nitrogen.Raman spectra were collected from
© 2006 Gemological Institute of America
GEMS & GEMOLOGY, Vol. 42, No. 2, pp. 160–168
Editor’s note: The initials at the end of each itemidentify the editor(s) or contributing editor(s)who provided that item. Full names are givenfor other GIA Laboratory contributors.
Figure 3. The Raman spectrum (with peaks from phosphate, carbonate [B-type], proteins [amide I and III], and CH2 bending) proves that the pen-dant in figure 1 was made from bovine bone.
Figure 4. Unusual radiation stains were observed in these two diamonds.Extensive brown stains were present in the culet region (and are reflectedin the face-up view) of the 1.47 ct rectangular blocked diamond on theleft, whereas a few green stains were seen in the girdle region of the 1.60ct Fancy Vivid green-blue diamond on the right.

162 LAB NOTES GEMS & GEMOLOGY SUMMER 2006
several dark brown stains (four analy-ses) and dark green stains (seven analy-ses) using micro-Raman spectroscopywith 633 nm laser excitation (figure 7).The brown stains showed strong,broad bands centered at 1630 cm−1 and1316 cm−1. The 1630 cm−1 band likelyhas been observed previously in irradi-ated diamond (A. M. Zaitsev, Optical
Properties of Diamond: A Data Hand-book, Springer-Verlag, Berlin, 2001, p.114). The peak at 1316 cm−1 may sig-nify low-quality diamond. Nano-crystalline diamond grown by chemi-cal vapor deposition methods, dia-mond powders, and neutron-irradiateddiamond all can show a shift to lowerwavenumbers from the standard
Raman peak for diamond, at 1332 cm−1
(see, e.g., Zaitsev, 2001, pp. 93–94).The region of crystal distortion waslimited, though, as areas close to thestains showed a very strong peak at1332 cm−1.
Raman analysis of the green stainsshowed strong, broad bands centeredat approximately 3010 cm−1 and 2340cm−1, while only a very weak dia-mond peak at 1332 cm−1 was detect-ed. The spectrum of the surroundinggreen-blue diamond (~100 µm away),collected under the same conditions,showed a much stronger peak at 1332cm−1, while broad bands around 3010cm−1 and 2340 cm−1 were also ob-served but with much weaker intensi-ties. These results indicated that thestained areas did not possess a purediamond structure; instead, they wereprobably a mixture of various formsof carbon. Under the short-wave UVradiation of the DiamondView, thebrown and green stains were inertand appeared dark, while the sur-rounding diamond displayed strongblue fluorescence. This observationis consistent with the conclusionthat these stains represented areas ofthe diamond that were severely dam-aged by radiation.Wuyi Wang, Chin Cheung Cheung,
and Thomas Gelb
With Clarity Affected by Intense Graining
The clarity grade of a faceted dia-mond is usually determined by thepresence of inclusions, fractures,clouds, or etch channels. However,in the East Coast laboratory, werecently examined an unusual dia-mond with a clarity grade that wasdetermined by intense internalgraining.
The 8.01 ct rectangular modifiedbrilliant cut (11.86 × 11.00 × 6.97mm) in figure 8 was color gradedFancy Light blue. Infrared absorptionspectroscopy showed a weak absorp-tion at 2803 cm−1, which confirmedthat it was type IIb. Under the micro-scope, this stone appeared very
Figure 7. Raman spectra of the dark brown (upper spectrum) and darkgreen (lower spectrum) stains showed little evidence of diamond. Theseresults indicate that the material in the area of the stains is probably amixture of various forms of carbon.
Figure 5. The numerous brownstains on the 1.47 ct diamondshow a nearly perfect circularshape. The region above the dot-ted line is slightly polished,while the region below the lineis unpolished. Image width isabout 1 mm.
Figure 6. Circular green stainssimilar to those shown in figure 5were observed in the 1.60 ctFancy Vivid green-blue diamond,though in this case thin, well-developed etch channels appearto begin at the dark centers.Image width is about 1 mm.
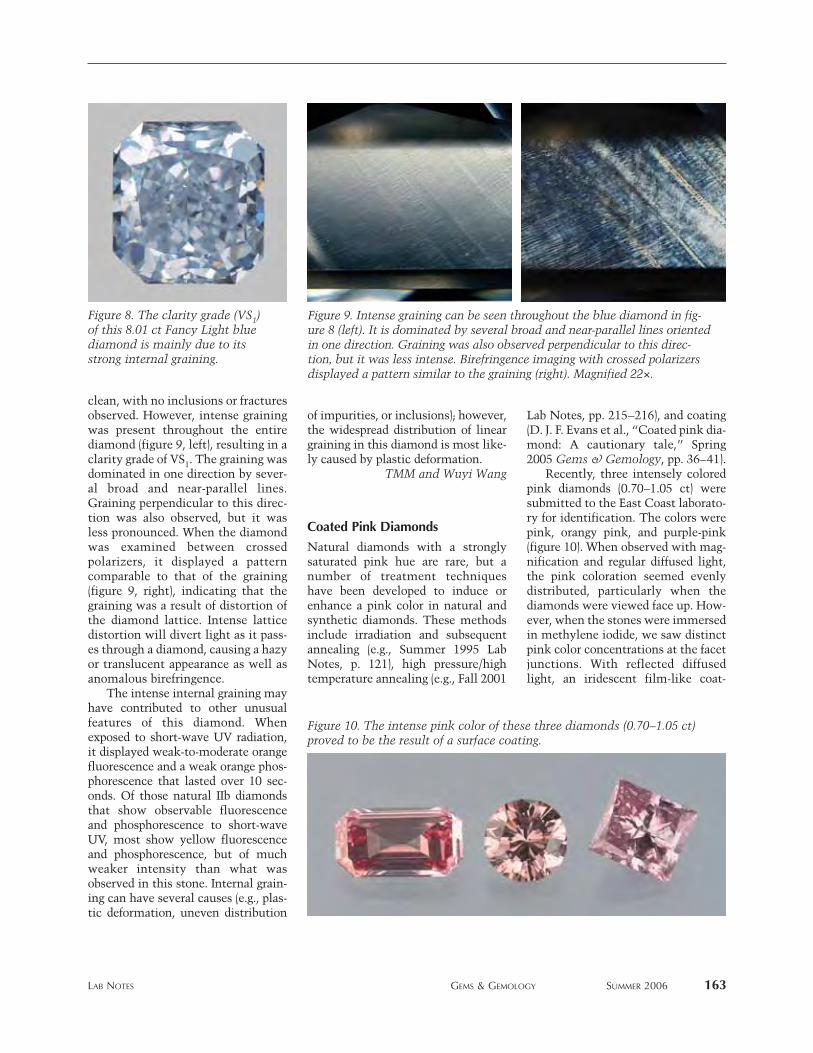
LAB NOTES GEMS & GEMOLOGY SUMMER 2006 163
clean, with no inclusions or fracturesobserved. However, intense grainingwas present throughout the entirediamond (figure 9, left), resulting in aclarity grade of VS1. The graining wasdominated in one direction by sever-al broad and near-parallel lines.Graining perpendicular to this direc-tion was also observed, but it wasless pronounced. When the diamondwas examined between crossedpolarizers, it displayed a patterncomparable to that of the graining(figure 9, right), indicating that thegraining was a result of distortion ofthe diamond lattice. Intense latticedistortion will divert light as it pass-es through a diamond, causing a hazyor translucent appearance as well asanomalous birefringence.
The intense internal graining mayhave contributed to other unusualfeatures of this diamond. Whenexposed to short-wave UV radiation,it displayed weak-to-moderate orangefluorescence and a weak orange phos-phorescence that lasted over 10 sec-onds. Of those natural IIb diamondsthat show observable fluorescenceand phosphorescence to short-waveUV, most show yellow fluorescenceand phosphorescence, but of muchweaker intensity than what wasobserved in this stone. Internal grain-ing can have several causes (e.g., plas-tic deformation, uneven distribution
of impurities, or inclusions); however,the widespread distribution of lineargraining in this diamond is most like-ly caused by plastic deformation.
TMM and Wuyi Wang
Coated Pink Diamonds
Natural diamonds with a stronglysaturated pink hue are rare, but anumber of treatment techniqueshave been developed to induce orenhance a pink color in natural andsynthetic diamonds. These methodsinclude irradiation and subsequentannealing (e.g., Summer 1995 LabNotes, p. 121), high pressure/hightemperature annealing (e.g., Fall 2001
Lab Notes, pp. 215–216), and coating(D. J. F. Evans et al., “Coated pink dia-mond: A cautionary tale,” Spring2005 Gems & Gemology, pp. 36–41).
Recently, three intensely coloredpink diamonds (0.70–1.05 ct) weresubmitted to the East Coast laborato-ry for identification. The colors werepink, orangy pink, and purple-pink(figure 10). When observed with mag-nification and regular diffused light,the pink coloration seemed evenlydistributed, particularly when thediamonds were viewed face up. How-ever, when the stones were immersedin methylene iodide, we saw distinctpink color concentrations at the facetjunctions. With reflected diffusedlight, an iridescent film-like coat-
Figure 10. The intense pink color of these three diamonds (0.70–1.05 ct)proved to be the result of a surface coating.
Figure 8. The clarity grade (VS1)of this 8.01 ct Fancy Light bluediamond is mainly due to itsstrong internal graining.
Figure 9. Intense graining can be seen throughout the blue diamond in fig-ure 8 (left). It is dominated by several broad and near-parallel lines orientedin one direction. Graining was also observed perpendicular to this direc-tion, but it was less intense. Birefringence imaging with crossed polarizersdisplayed a pattern similar to the graining (right). Magnified 22×.
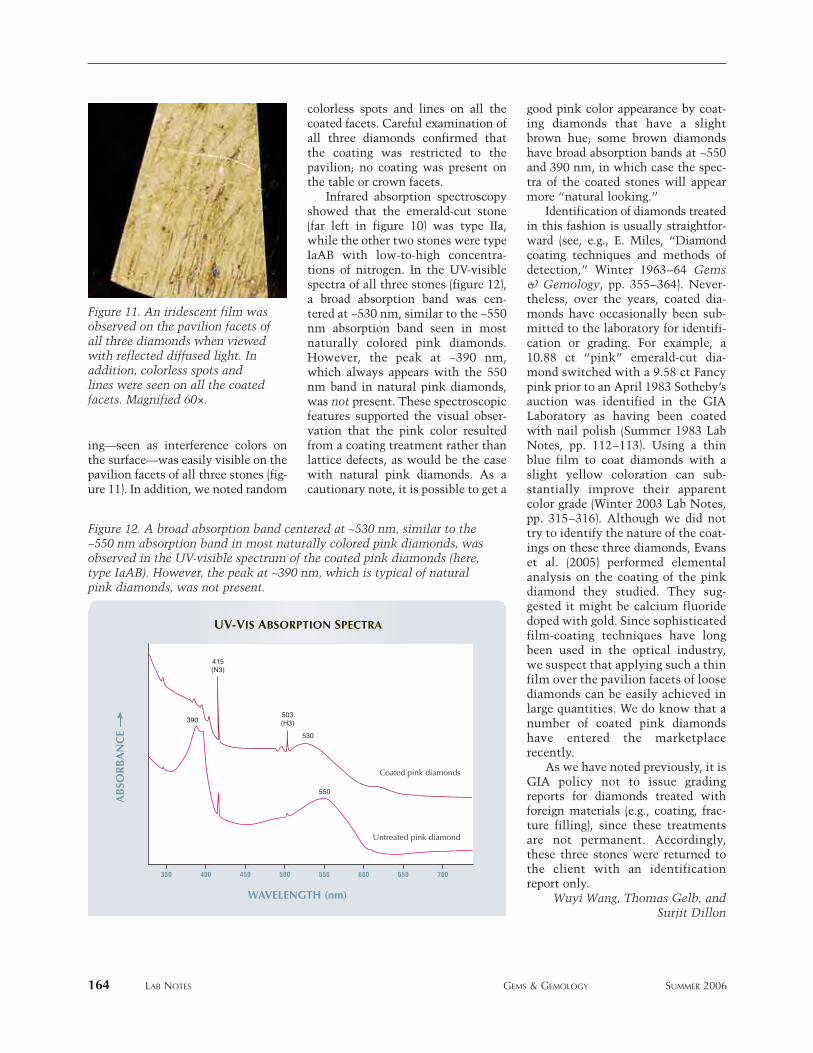
164 LAB NOTES GEMS & GEMOLOGY SUMMER 2006
ing—seen as interference colors onthe surface—was easily visible on thepavilion facets of all three stones (fig-ure 11). In addition, we noted random
colorless spots and lines on all thecoated facets. Careful examination ofall three diamonds confirmed thatthe coating was restricted to thepavilion; no coating was present onthe table or crown facets.
Infrared absorption spectroscopyshowed that the emerald-cut stone(far left in figure 10) was type IIa,while the other two stones were typeIaAB with low-to-high concentra-tions of nitrogen. In the UV-visiblespectra of all three stones (figure 12),a broad absorption band was cen-tered at ~530 nm, similar to the ~550nm absorption band seen in mostnaturally colored pink diamonds.However, the peak at ~390 nm,which always appears with the 550nm band in natural pink diamonds,was not present. These spectroscopicfeatures supported the visual obser-vation that the pink color resultedfrom a coating treatment rather thanlattice defects, as would be the casewith natural pink diamonds. As acautionary note, it is possible to get a
good pink color appearance by coat-ing diamonds that have a slightbrown hue; some brown diamondshave broad absorption bands at ~550and 390 nm, in which case the spec-tra of the coated stones will appearmore “natural looking.”
Identification of diamonds treatedin this fashion is usually straightfor-ward (see, e.g., E. Miles, “Diamondcoating techniques and methods ofdetection,” Winter 1963–64 Gems& Gemology, pp. 355–364). Never-theless, over the years, coated dia-monds have occasionally been sub-mitted to the laboratory for identifi-cation or grading. For example, a10.88 ct “pink” emerald-cut dia-mond switched with a 9.58 ct Fancypink prior to an April 1983 Sotheby’sauction was identified in the GIALaboratory as having been coatedwith nail polish (Summer 1983 LabNotes, pp. 112–113). Using a thinblue film to coat diamonds with aslight yellow coloration can sub-stantially improve their apparentcolor grade (Winter 2003 Lab Notes,pp. 315–316). Although we did nottry to identify the nature of the coat-ings on these three diamonds, Evanset al. (2005) performed elementalanalysis on the coating of the pinkdiamond they studied. They sug-gested it might be calcium fluoridedoped with gold. Since sophisticatedfilm-coating techniques have longbeen used in the optical industry,we suspect that applying such a thinfilm over the pavilion facets of loosediamonds can be easily achieved inlarge quantities. We do know that anumber of coated pink diamondshave entered the marketplacerecently.
As we have noted previously, it isGIA policy not to issue gradingreports for diamonds treated withforeign materials (e.g., coating, frac-ture filling), since these treatmentsare not permanent. Accordingly,these three stones were returned tothe client with an identificationreport only.
Wuyi Wang, Thomas Gelb, andSurjit Dillon
Figure 11. An iridescent film wasobserved on the pavilion facets ofall three diamonds when viewedwith reflected diffused light. Inaddition, colorless spots andlines were seen on all the coatedfacets. Magnified 60×.
Figure 12. A broad absorption band centered at ~530 nm, similar to the~550 nm absorption band in most naturally colored pink diamonds, wasobserved in the UV-visible spectrum of the coated pink diamonds (here,type IaAB). However, the peak at ~390 nm, which is typical of naturalpink diamonds, was not present.

LAB NOTES GEMS & GEMOLOGY SUMMER 2006 165
Diamond with Unusual Etch Channel
Etch channels, which are common innatural diamonds (both types I andII), appear in various shapes: fromnarrow hollow triangles and lines, toirregular worm-like features. Thesechannels usually have rhombic-shaped openings at the surface.
The East Coast laboratory recent-ly examined a 2.33 ct J-color roundbrilliant with a very unusual etchchannel in the pavilion that resem-bled a palm tree or hydra (figure 13).The diameter of the channel de-creased gradually with depth; sixbranches had developed before theetching process terminated.
Infrared absorption spectroscopyrevealed that the diamond was typeIaA, with a very high concentration ofnitrogen and moderately high hydro-gen. To investigate if the etch channelfollowed the diamond’s growth zon-ing, we examined the stone with theDiamondView, which uses high-ener-gy short-wave UV radiation to indi-cate diamond growth patterns. Thefluorescence image of this diamond(figure 14) displayed a complex zona-tion, with each zone representing aspecific growth stage. The differencein configuration of the lattice defectswas well reflected in the variations influorescence color and intensity, andfrom this it was clear that the etchchannel had developed within a singlegrowth zone.
Although the mechanisms ofetch-channel formation are still indebate (see, e.g., T. Lu et al., “Ob-servation of etch channels in severalnatural diamonds,” Diamond andRelated Materials, Vol. 10, 2001, pp.68–75), our examination of this dia-mond confirmed that the etch chan-nels follow localized lattice defects. Italso indicated that the penetrationdirection of an etch channel maychange within the same growth zone,and the etching process could bestopped as it meets other growthzones.
Alina Nemirovskaya and Wuyi Wang
Diamond with SapphireInclusionsDiamonds often contain interestingsuites of inclusions. Because of thequantity of diamonds that comethrough the lab, we occasionally seemineral inclusions that are very rare.
Such was the case with a 1.03 ctD-color SI2 diamond we received (fig-ure 15), which revealed several rela-tively large included blue crystalswhen examined with magnification.Few mineral inclusions in diamondare blue, so this immediately sparkedour interest. Fortunately, some ofthese inclusions reached the surfaceof the stone, so we were able to deter-mine their identity with Ramananalysis. To our surprise, the crystalswere sapphire. The largest crystal (fig-ure 16) measured approximately 0.6 ×0.6 × 0.2 mm.
Corundum inclusions in diamondare extremely rare. We located onlythree reports of ruby crystals trappedin diamonds (H. O. A. Meyer and E.Gübelin, “Ruby in diamond,” Fall1981 Gems & Gemology, pp. 153–156;G. Watt et al., “A high-chromiumcorundum (ruby) inclusion in dia-mond from the Sa~o Luiz alluvialmine, Brazil,” Mineralogical Maga-
zine, Vol. 58, 1994, pp. 490–493; M. T.Hutchison et al., “Corundum inclu-sions in diamonds: Discriminatorycriteria and a corundum composition-al database,” Extended Abstracts, 8thInternational Kimberlite Conference,Victoria, British Colombia, June22–27, 2003, pp. 1–5), while just a sin-gle occurrence of blue sapphire (0.3mm in diameter) has been document-ed (Hutchison et al., 2003). Of these,
Figure 15. This 1.03 ct diamondcontained several large blue crys-tals that proved to be sapphire.
Figure 13. Resembling a palmtree, this unusual etch channelwas discovered in a 2.33 ct roundbrilliant diamond. Magnified 80×.
Figure 14. DiamondView fluores-cence imaging revealed that theetch channel formed within aspecific growth zone, indicatingthat its development was proba-bly controlled by localized lat-tice defects.

166 LAB NOTES GEMS & GEMOLOGY SUMMER 2006
only one (a ruby; Meyer and Gübelin,1981) occurred in a gem diamond, andboth the diamond (0.06 ct) and theinclusion (<0.4 mm) were very small.To the best of our knowledge, the bluesapphire inclusions described here arethe first of their kind to be found in agem diamond and represent thelargest corundum inclusions reportedin diamond to date.
The occurrence of syngenetic sap-phire inclusions provides insight intothe environment in which the hostdiamond crystallized. Corundum iswidely reported to occur as an accesso-ry mineral in several types of alu-minum-rich, diamond-bearing eclog-ite xenoliths found in kimberlites.This association suggests that the dia-mond was most likely eclogitic andformed in a part of the earth’s crustthat was deeply subducted into themantle. In previous reports of corun-dum in diamond (e.g., Hutchison etal., 2003), additional mineral inclusionssuggested a crystallization depth of700–800 km in the transition zone orlower mantle.
SFM and Christopher M. Breeding
IMITATION MELO “PEARLS” Recently, the West Coast laboratoryreceived two unusual sphericalobjects for identification (figure 17).The client had purchased them in
Vietnam as rare, nonnacreous Melo“pearls,” which are produced by theMelo genus of mollusk and arenotable for their orange color andinteresting flame structure. Althoughthese items had some visual similari-ties to Melo “pearls,” they proved tobe a very different product.
The first item was a translucent,banded, orange-to-white sphere thatmeasured 27.75–28.05 × 27.15 mm.The second was a translucent, band-ed, light orange-yellow to orangeovoid that measured 27.40–27.65 ×
24.65 mm. Both had a prominentbanded structure. The sphere had acoarse flame structure oriented per-
pendicular to the banding (figure 18),but it was difficult to distinguish anyflame structure on the ovoid. Al-though no dye was removed by swab-bing with acetone, low-power magni-fication revealed numerous fracturesand some cavities, both with orangedye concentrations (again, see figure18). There were also wheel and polish-ing marks on the surfaces of the sam-ples, which indicated that they hadbeen fashioned. Fluorescence wasmoderate to long-wave UV radiationand weak to short-wave UV, and wasa combination of chalky orange andyellow; the uneven fluorescence pat-terns appeared banded, with eitherspots or swirls.
Spot R.I.’s gave a birefringenceblink for both samples, with values of1.50–1.67 for the sphere and 1.52–1.67for the ovoid. The S.G. values were2.84 and 2.86, respectively. No absorp-tion bands were visible in the desk-model spectroscope.
Coincidentally, we had recentlycompleted the identification of atrue Melo “pearl” submitted by EvanCaplan of Omi Gems, Los Angeles(figure 19). Although some of theproperties (such as R.I.) overlappedwith the two other samples, therewere distinct differences. Whenexamined with magnification, the26.60 × 25.60 × 25.50 mm (129.81 ct)Melo “pearl” also presented a very
Figure 17. This sphere and ovoid (158.69 and 142.43 ct, respectively) weresubmitted for identification as possible Melo “pearls.” They proved to bedyed shell, as evidenced by the prominent banded structure.
Figure 16. The largest blue crystal, 0.6 × 0.6 × 0.2 mm, had a mostlyrounded shape (left, as seen through the pavilion). It reached the surfaceof the crown (right), enabling Raman analysis that showed it to be sap-phire. Magnified 40×.

LAB NOTES GEMS & GEMOLOGY SUMMER 2006 167
coarse flame structure, but the sur-face was slightly dimpled, especiallyat the bases of these flame struc-tures, and there was no banding. Ithad a porcelaneous luster that is alsocharacteristic of conch “pearls.”(The same high luster was not seenin the samples in figure 17.)
Its UV fluorescence was distinct-ly different from that of the other twosamples as well. When exposed tolong-wave UV radiation, the Melo“pearl” fluoresced a very weak brownthat was mottled with weak-to-strong chalky greenish yellow spots;it was generally inert to short-waveUV, but also showed weak chalkygreenish yellow spots. (For a moredetailed discussion of the gemologi-cal properties of Melo “pearls,”please refer to K. Scarratt, “‘Orangepearls’ from the Melo volutes [marinegastropods],” in D. J. Content, Ed.,The Pearl and the Dragon: A Study ofVietnamese Pearls and a History ofthe Oriental Pearl Trade, Houlton,Maine, 1999, pp. 79–108.)
Given the differences between thetwo samples and natural Melo“pearls” with regard to structure, thepresence of dye, the UV fluorescence,and evidence of fashioning, it wasobvious that the two samples weredyed imitations; the R.I. and bandedstructure indicated shell material. KenScarratt, of GIA Research in Bangkok,
reports that he has seen a number ofsuch imitations and that they arebeing produced in Vietnam andMyanmar. Some are fashioned fromactual Melo shells (i.e., those that areparticularly thick in the whorl),whereas others are manufacturedfrom the shell of Tridacna gigas (thegiant clam), which is also being usedas a source of bead nuclei. However,we must reiterate that Tridacna is pro-tected by a CITES agreement, and itsimportation is restricted (see the erra-tum in Winter 2004 Gem NewsInternational, p. 357).
CYW
MOONSTONE ImitationsMoonstone, typically an orthoclasefeldspar that displays the phenome-non of adularescence, is a popular andcomparatively inexpensive gemstone.Despite its affordability, we do occa-sionally see moonstone imitations.We have even seen instances where apiece bears an amazing resemblanceto moonstone, even though it clearlywas never intended to imitate thefeldspar.
The 3.92 ct cushion shape in fig-ure 20 was submitted to the WestCoast lab for identification. Whenviewed face up, it had a slightly yel-low bodycolor and what appeared tobe blue adularescence; it looked verysimilar to albite moonstone from arelatively new find in Tanzania (seefigure 20, right, and Spring 2005 GemNews International, pp. 60–61).
However, microscopic examina-tion easily established that the cush-ion shape was not a genuine moon-stone. An obvious separation planeparallel to the girdle identified thestone as assembled (figure 21).Refractive index readings taken fromthe top and bottom of the stone were1.54–1.55, which showed those por-tions to be quartz. The source of theblue “adularescence” was a thin,transparent, foil-like material placedin the separation plane (figure 22).
Figure 20. While visually very similar, these two stones are not the samematerial. The 3.92 ct cushion shape on the left is actually a quartz triplet,while the stone on the right is an albitic moonstone from Tanzania.
Figure 18. A close-up image ofthe sphere in figure 17 reveals acoarse flame structure orientedperpendicular to the banded shellstructure, and the presence of dyeconcentrations in fractures andcavities.
Figure 19. The true nature of theimitations appears obvious whentheir structure is compared tothat of this genuine Melo “pearl”(see also figure 28 on p. 310 of theWinter 2000 issue of G&G).

168 LAB NOTES GEMS & GEMOLOGY SUMMER 2006
When this phenomenon was observedthrough the crown, it created a verygood imitation of moonstone. If thisassemblage was bezel set in a ring, itcould easily pass as a moonstone tothe unaided eye.
An “accidental” imitation ofmoonstone, set in a very nice piece ofjewelry (figure 23), came into theWest Coast lab several years ago. Theoval cabochon was highly translu-cent, colorless, and appeared to have awhite adularescence. However, thestone gave a spot R.I. reading of 1.66,and microscopic examination re-vealed a fine-grained, somewhatfibrous structure that was typical ofjadeite. With close examination, itwas evident that the setting was of aconstruction commonly used withfine jadeite: a closed-back white metalmounting in which the back plate ishighly polished on the side facing thestone. With semitransparent to verytranslucent jadeite, this polishedbacking reflects light back through
the stone, often giving the appearanceof an internal luminescence. In thiscase, it gave the jadeite its apparentadularescence.
Though the effect of the reflectorwas clearly intentional, we refer tothis example as an “accidental” imita-tion because it was certainly notintended to imitate moonstone. Anexceptionally translucent jadeite suchas this one is highly prized and has avalue many times that of moonstone.Since this first encounter, we haveseen a few similar examples comethrough the lab.
SFM
Figure 23. Though it bears astrong resemblance to moon-stone, the stone in this ring actu-ally is a very translucent color-less jadeite.
Figure 21. When the triplet in fig-ure 20 is viewed through thecrown, the separation layer alongthe girdle can be seen to be thecause of the blue “adulares-cence” in this assembled stone.Note the scratches in the colorlayer. Magnified 10×.
Figure 22. The central layer of the triplet is easily seen along the girdle. Itis extremely thin compared to that of most triplets. Magnified 37×.
PHOTO CREDITSJessica Arditi—1, 4, and 8; Kyaw SoeMoe—2; Wuyi Wang—5, 6, 9, 11, 13, and14; Elizabeth Schrader—10; RobisonMcMurtry—15; Shane F. McClure—16, 21,and 22; C. D. Mengason—17–20; MahaCalderon—23.
www.gia.edu/gemsandgemology
For regular updates from the world of GEMS & GEMOLOGY, visit our website at:

GEM NEWS INTERNATIONAL GEMS & GEMOLOGY SUMMER 2006 169
tusk fragments. The amber in figure 1 was eventuallyacquired by Barry Schenck of M. M. Schenck Jeweler Inc.,Chattanooga, Tennessee, who recently loaned it to GIA forexamination. Mr. Schenck has counted more than 30insects trapped inside the piece, as well as other organicmaterials, including an apparent seedpod. GIA subsequent-ly purchased the piece (Collection no. 35840).
Most of the insects were eye-visible, though otherswere best seen with magnification (up to 40×). Prominentwere a mosquito, spiders, beetles, gnats, ants, and possiblya bee (see, e.g., figure 2). Other inclusions consisted of gasbubbles and debris that was probably associated with thetrees from which the amber formed. The specimen alsocontained a network of fissures that are undoubtedly dueto the stress from numerous freeze-thaw cycles that thefossil endured over time.
Sinkankas (1959) noted that white cedar forests oncecovered vast swaths of the northern hemisphere, includ-ing Asia and Alaska. As resins oozed from the trees, theytrapped a variety of insects. These exudations hardenedover time, and the fossil resins were incorporated intosedimentary deposits. Geologic upheavals and erosionexposed these deposits, and in some cases the amber
COLORED STONES AND ORGANIC MATERIALSAlaskan amber. Few may think of Alaska as a source ofamber, but the Inuit people have long collected this organ-ic gem from northern beach gravels between Harrison Bayand Smith Bay on the Arctic Ocean. In Gemstones ofNorth America (D. Van Nostrand Co., Princeton, NJ,1959), J. Sinkankas noted that locals refer to the amber asauma, which translates as “live coal.”
In 1943, an American soldier stationed in Alaska founda 117.8 g chunk of amber (figure 1) while strolling alongthe coast. Subsequent visits to the area yielded othersmaller amber pieces, wooly mammoth teeth, and ivory
Editor’s note: The initials at the end of each item identify theeditor or contributing editor who provided it. Full names andaffiliations are given for other contributors.
Interested contributors should send information and illus-trations to Brendan Laurs at [email protected] (e-mail), 760-603-4595 (fax), or GIA, The Robert Mouawad Campus,5345 Armada Drive, Carlsbad, CA 92008. Original photoswill be returned after consideration or publication.GEMS & GEMOLOGY, Vol. 42, No. 2, pp. 169–188© 2006 Gemological Institute of America
Figure 1. This Alaskan amber specimen (117.8 g; 78 ×59 × 36 mm) contains an unusually wide variety oftrapped insects, some easily visible without magnifi-cation. Photo by R. Weldon.
EDITORBrendan M. Laurs ([email protected])
CONTRIBUTING EDITORSEmmanuel Fritsch, IMN, University of Nantes, France ([email protected])
Henry A. Hänni, SSEF, Basel, Switzerland([email protected])
Franck Notari, GIA GemTechLab, Geneva, Switzerland([email protected])
Kenneth V. G. Scarratt, GIA Research, Bangkok, Thailand([email protected])

170 GEM NEWS INTERNATIONAL GEMS & GEMOLOGY SUMMER 2006
was loosened and tumbled by rivers or washed out tosea. Because amber floats in saltwater, it was carried bycurrents and deposited in a random fashion alongAlaska’s coast.
Robert Weldon ([email protected])GIA, Carlsbad
Update on iridescent andradite from Mexico. During thepast few years, additional production of iridescent andra-dite has come from the previously known mining area forthis material that is located about 150–200 km southeastof Hermosillo, Sonora, Mexico. After two years of testmarketing the garnet in Tucson, and a number of trips tothe mine to purchase rough, Pala International (Fallbrook,California) and JOEB Enterprises helped reactivate themine in January 2006.
The andradite crystals commonly consist of two dis-tinct layers: an opaque dark brown core that is overgrown
by a layer of transparent greenish yellow material thatshows the iridescence. Since the layer exhibiting the phe-nomenon tends to be very thin (i.e., less than 1–2 mm),pieces of rough are carefully polished to help bring outtheir colors. The polished material exhibits a range of spec-tral colors from orange to blue; a few stones also are cha-toyant, and some show four-rayed stars. The color displayis quite dramatic in daylight or with strong incandescentillumination; some of the initial material from this locali-ty has even been mistaken for black opal (see Fall 1987Gem News, pp. 173–174). The visual appearance of thematerial recently recovered is consistent with observa-tions reported for earlier production in the Summer 1988Gem News section (pp. 120–121). E. J. Gübelin and J. I.Koivula attributed the color display to interference colors,and referred to their lamellar appearance as “kaleidoscopicstripes” (PhotoAtlas of Inclusions in Gemstones, Vol. 2,Opinio Publishers, Basel, Switzerland, 2005, pp. 482–484).
The garnets are mined from a skarn deposit (figure 3).In 2003, local miners using only picks and shovels recov-ered enough material to bring two parcels to the U.S. Theinitial parcel consisted of about 20 small crystals rangingfrom 5 to 10 mm in diameter. The miners were encour-aged to polish as much of the production as possible forthe 2004 Tucson gem show, and they subsequently pro-duced approximately 100 polished crystal fragments andcabochons. Marketed as Rainbow garnet, interest in high-er-quality material especially (e.g., figure 4) has been strongamong designers and collectors.
John McLean, Pala International’s mine foreman, sub-sequently worked with the local mine owners to introducemore effective mining methods through the use of explo-sives and a compressor to operate a pneumatic jackham-
Figure 3. The iridescent andradite is mined from askarn deposit, as shown in this boulder. The irides-cent garnet is cut from the greenish yellow material,which here has been mostly removed, leaving theunderlying brown garnets. Photo by E. Boehm.
Figure 2. Viewed with 10× magnification, details ofthe Alaskan amber become evident: A mosquito, spi-der, and possibly a bee are permanent neighbors,entombed together with hundreds of gas bubbles.Photomicrograph by R. Weldon.

GEM NEWS INTERNATIONAL GEMS & GEMOLOGY SUMMER 2006 171
mer. By the beginning of April 2006, they had achievedproduction of approximately 50 kg of material consistingof small crystals with areas of cutting quality. Today, sev-eral lapidaries are experimenting with polishing, cutting,and carving the material. Because the iridescence isrestricted to such a thin overgrowth, they must exerciseextreme caution to avoid cutting through it and exposingthe dark underlying garnet. Nevertheless, sizable carvingshave been produced from some of the crystal clusters (fig-ure 5). Most of the rough, however, has a finished yield ofless than 10%, which is lower than the yield from mosttransparent gem rough (usually about 20%). As of June2006, approximately 70 finished gems had been produced,in sizes ranging from just under 2 ct to more than 20 ct.
Edward Boehm ([email protected])JOEB Enterprises, Solana Beach, California
Two unusual star emeralds. The Gem Testing Laboratory,Jaipur, India, recently examined two fine bright greenemeralds that showed asterism (5.40 and 11.37 ct; figure6). Both displayed a weak (though distinct) six-rayed star,with the strongest ray aligned parallel to the length ofthe stone.
The gemological properties were consistent with natu-ral emerald: A spot R.I. was measured at around 1.59, thehydrostatic S.G. was 2.73, and both specimens exhibitedthe strong chromium absorption spectrum characteristicfor emeralds when they were examined with a desk-modelspectroscope.
Observation of both cabochons with magnification andstrong fiber-optic lighting revealed minute iridescentinclusions in abundance (figure 7). At higher magnifica-tion, these inclusions appeared to be hexagonal and trian-gular discs or platelets; some were elongated as well, simi-lar to knife-shaped rutile silk in corundum (see, e.g., K.
Schmetzer et al., “Asterism in beryl, aquamarine andemerald—an update,” Journal of Gemmology, Vol. 29, No.2, 2004, pp. 65–71). In transmitted light, the inclusionsappeared gray, varying from translucent to opaque (figure8), whereas they appeared weakly birefringent in cross-polarized illumination.
When the stones were viewed in immersion (usingbromoform), the inclusions were seen to form cloudyplanes that were mainly oriented perpendicular to the
Figure 4. These cabochons and polished crystal frag-ments of Rainbow garnet (2.38–6.23 ct) are represen-tative of recent production from the previouslyknown mining area in Sonora, Mexico. Courtesy ofPala International & JOEB Enterprises; compositephoto by C. D. Mengason.
Figure 5. At 25.89 ct, this free-form carving is thelargest fashioned Rainbow garnet known to this con-tributor. Carved by Bud Standley (Oceanside,California) and courtesy of Pala International; photoby Wimon Manorotkul.
Figure 6. These emeralds (5.40 and 11.37 ct) showasterism as well as an attractive green color. Photo byG. Choudhary.

172 GEM NEWS INTERNATIONAL GEMS & GEMOLOGY SUMMER 2006
c-axis. These orientations are similar to those seen instar corundum. The maximum concentration of inclu-sions occurred at the center of both stones, causing thecentral area of the star to appear brightest when thestones were viewed with reflected light. Careful exami-nation showed that the inclusions within the planeswere roughly aligned (figure 9); up to three directions ofalignment could be seen that intersected at approximate-ly 60°. This, combined with the elongate habit of some of
the inclusions, is apparently responsible for the asterismseen in these emeralds.
Both stones also contained a number of long, tube-like,two-phase inclusions parallel to the c-axis (figure 10).Other inclusions present were colorless rhombohedronsand rounded colorless crystals.
The source of these stones is not known, but staremeralds have been reported from Brazil (Nova Era andSanta Terezinha) and Madagascar (Mananjary area; see K.Schmetzer et al., 2004, and references therein). Althoughstar emerald is unusual, the bright green color of theseemeralds makes them even rarer.
Gagan Choudhary ([email protected]) Gem Testing Laboratory, Jaipur, India
Figure 7. Magnification of the star emeralds in figure6 revealed iridescent hexagonal and triangularplatelets that are mainly concentrated in planes per-pendicular to the c-axis. Although not visible in thisimage, some of the inclusions were elongated.Photomicrograph by G. Choudhary; magnified 50×.
Figure 8. When the star emeralds were immersed inbromoform and viewed with transmitted light, theinclusions in figure 7 appeared gray, with diaphaneityvarying from translucent to opaque. Photomicrographby G. Choudhary; magnified 50×.
Figure 10. Long, tube-like, two-phase inclusions wereoriented parallel to the c-axis in the star emeralds.Photomicrograph by G. Choudhary; magnified 40×.
Figure 9. In this view looking down the c-axis of oneof the star emeralds, two directions of inclusion align-ment (oriented at approximately 60°) can be seen. Athird direction of alignment was also present in thesamples; combined with the elongate habit of someof the inclusions, it was apparently responsible for theasterism. Photomicrograph by G. Choudhary; inimmersion with transmitted light, magnified 35×.
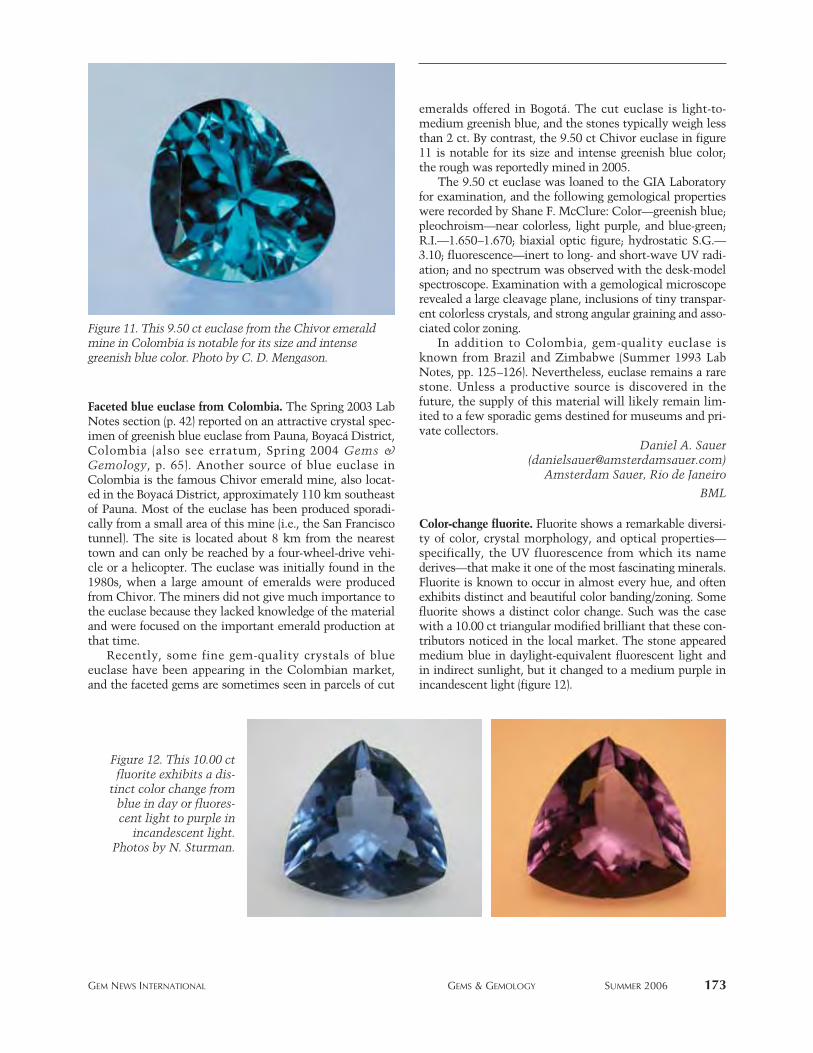
GEM NEWS INTERNATIONAL GEMS & GEMOLOGY SUMMER 2006 173
Faceted blue euclase from Colombia. The Spring 2003 LabNotes section (p. 42) reported on an attractive crystal spec-imen of greenish blue euclase from Pauna, Boyacá District,Colombia (also see erratum, Spring 2004 Gems &Gemology, p. 65). Another source of blue euclase inColombia is the famous Chivor emerald mine, also locat-ed in the Boyacá District, approximately 110 km southeastof Pauna. Most of the euclase has been produced sporadi-cally from a small area of this mine (i.e., the San Franciscotunnel). The site is located about 8 km from the nearesttown and can only be reached by a four-wheel-drive vehi-cle or a helicopter. The euclase was initially found in the1980s, when a large amount of emeralds were producedfrom Chivor. The miners did not give much importance tothe euclase because they lacked knowledge of the materialand were focused on the important emerald production atthat time.
Recently, some fine gem-quality crystals of blueeuclase have been appearing in the Colombian market,and the faceted gems are sometimes seen in parcels of cut
emeralds offered in Bogotá. The cut euclase is light-to-medium greenish blue, and the stones typically weigh lessthan 2 ct. By contrast, the 9.50 ct Chivor euclase in figure11 is notable for its size and intense greenish blue color;the rough was reportedly mined in 2005.
The 9.50 ct euclase was loaned to the GIA Laboratoryfor examination, and the following gemological propertieswere recorded by Shane F. McClure: Color—greenish blue;pleochroism—near colorless, light purple, and blue-green;R.I.—1.650–1.670; biaxial optic figure; hydrostatic S.G.—3.10; fluorescence—inert to long- and short-wave UV radi-ation; and no spectrum was observed with the desk-modelspectroscope. Examination with a gemological microscoperevealed a large cleavage plane, inclusions of tiny transpar-ent colorless crystals, and strong angular graining and asso-ciated color zoning.
In addition to Colombia, gem-quality euclase isknown from Brazil and Zimbabwe (Summer 1993 LabNotes, pp. 125–126). Nevertheless, euclase remains a rarestone. Unless a productive source is discovered in thefuture, the supply of this material will likely remain lim-ited to a few sporadic gems destined for museums and pri-vate collectors.
Daniel A. Sauer([email protected])
Amsterdam Sauer, Rio de Janeiro
BML
Color-change fluorite. Fluorite shows a remarkable diversi-ty of color, crystal morphology, and optical properties—specifically, the UV fluorescence from which its namederives—that make it one of the most fascinating minerals.Fluorite is known to occur in almost every hue, and oftenexhibits distinct and beautiful color banding/zoning. Somefluorite shows a distinct color change. Such was the casewith a 10.00 ct triangular modified brilliant that these con-tributors noticed in the local market. The stone appearedmedium blue in daylight-equivalent fluorescent light andin indirect sunlight, but it changed to a medium purple inincandescent light (figure 12).
Figure 11. This 9.50 ct euclase from the Chivor emeraldmine in Colombia is notable for its size and intensegreenish blue color. Photo by C. D. Mengason.
Figure 12. This 10.00 ctfluorite exhibits a dis-
tinct color change fromblue in day or fluores-cent light to purple in
incandescent light.Photos by N. Sturman.

174 GEM NEWS INTERNATIONAL GEMS & GEMOLOGY SUMMER 2006
The R.I. (1.430) and hydrostatic S.G. (3.18) were con-sistent with fluorite, including an irradiated color-changefluorite reported in the Summer 2002 Gem News Inter-national section (p. 186). Magnification revealed promi-nent wavy color banding that was related to fine planarzones of minute pinpoint inclusions. Damage to onepoint of the stone (again, see figure 12) revealed the dis-tinct cleavage present in fluorite, as did some minor sur-face-reaching cleavage fractures.
With a handheld spectroscope, the fluorite showed an
absorption band in the yellow-orange area of the spectrumand some absorption in the violet region. This could beseen more clearly in the UV-Vis spectrum (figure 13), withabsorption bands centered at ~400 and ~570 nm. Con-sistent with other true color-change stones, the spectrumshowed transmission windows in the blue-green and redregions and a local absorption maximum in the yellowregion. As expected given the spectral features, the fluoriteappeared very strong red through the Chelsea color filter.Although fluorite commonly fluoresces to UV radiation,this sample was inert, as was the irradiated color-changefluorite in the Summer 2002 GNI entry. However, theinert behavior of the present color-change fluorite does notnecessarily indicate that it has been irradiated, since fluo-rite does not always show fluorescence.
The Summer 2002 GNI entry mentioned that no fadetesting was performed on the irradiated color-change fluo-rite described. Similarly, we did not perform fade testingon the present fluorite. Although fade testing could revealthe presence of unstable color centers that were createdby exposure to radiation, it could not confirm whetherthis exposure occurred naturally or artificially.
Nick Sturman ([email protected]) and Abeer Al-Alawi
Gem & Pearl Testing LaboratoryManama, Kingdom of Bahrain
Herderite from Pakistan. Herderite–hydroxyl-herderite[CaBePO4(F,OH)] has been known from granitic pegmatitesin Pakistan’s Northern Areas for several years. Well-formedcrystal specimens of herderite from this region are soughtafter by mineral collectors, but the material is rarely trans-parent enough to be faceted. In June 2006, Farooq Hashmi(Intimate Gems, Jamaica, New York) loaned GIA somerough and cut examples of “lime” green herderite that heobtained during the past two years in the mineral marketof Peshawar, Pakistan. The material was represented ascoming from the Shigar Valley, as well as from the moregeneral localities of Skardu and Gilgit, which are commongem and mineral trading areas in northern Pakistan. Themost likely source of the gem herderite is the Kandaharmine, Baha, Braldu Valley (about 35 km north of Skardu),according to Dudley Blauwet (Dudley Blauwet Gems,Louisville, Colorado), who has extensive experience travel-ing to the gem and mineral localities of northern Pakistan.Mr. Blauwet also indicated that he recently obtained cut-table herderite from two additional locations in the ShigarValley area: near Chhappu in the Braldu Valley, and at anew mine near Doko in the Basha Valley.
The two faceted herderites (2.06 and 5.52 ct; figure 14)were characterized by one of us (EPQ) for this report; the properties of the smaller stone are listed first, as appropriate: color—light green and medium-light green;pleochroism—both stones showed weak-to-moderategreen and yellowish green (a third color was not observed);diaphaneity—transparent; R.I.—1.587–1.616 and
Figure 13. The UV-Vis absorption spectrum of thecolor-change fluorite shows absorption bands centeredat ~400 and ~570 nm. The transmission windows inthe blue-green and red regions, and a local absorptionmaximum in the yellow region, are consistent withthat of other true color-change stones.
Figure 14. These cut stones (2.06 and 5.52 ct) and crystal(14 g) of herderite are from northern Pakistan. Courtesy
of Farooq Hashmi; photo by C. D. Mengason.

GEM NEWS INTERNATIONAL GEMS & GEMOLOGY SUMMER 2006 175
1.586–1.616; birefringence—0.029 and 0.030; hydrostaticS.G.—3.02 and 3.04; Chelsea filter reaction—none; fluores-cence—weak-to-moderate blue and moderate-to-strongblue to long-wave UV radiation, weak violet and moderateviolet to short-wave UV radiation; and a weak 585 nmabsorption feature was observed with the desk-model spec-troscope for both stones. Microscopic examination of bothsamples revealed moderate-to-strong doubling and numer-ous partially healed fractures with negative crystals, someof which contained both a liquid and a gas. EDXRF spec-troscopy of the larger stone showed major amounts of Ca,P, and Sr, and minor Cr, Mn, Y, and Pb. The instrumentcannot detect Be or F.
The properties of these Pakistani samples are compara-ble to those previously reported for herderite (e.g., Spring2004 Lab Notes, pp. 61–62), although their refractiveindices were somewhat higher. Based on the work of P. B.Leavens et al. (“Compositional and refractive index varia-tions of the herderite–hydroxyl-herderite series,” AmericanMineralogist, Vol. 63, No. 9–10, 1978, pp. 913–917), the R.I.values of the Pakistani herderite indicate that the composi-tion is near the midpoint between the OH- and F-dominantend-members. Such a composition was also inferred froman R.I. value (n
β= 1.610) of a herderite from the Shigar
Valley area by A. H. Kazmi et al. (“Gem pegmatites of theShingus-Dusso area, Gilgit, Pakistan,” MineralogicalRecord, Vol. 16, No. 5, 1985, pp. 393–411). Although wehave referred to the material as herderite in this entry forsimplicity, the correct mineralogical designation isherderite–hydroxyl-herderite.
BML
Elizabeth P. QuinnGIA GemTechLab, Geneva, Switzerland
Jeremejevite from Myanmar and Sri Lanka. Jeremejeviteis a rare gem that is mainly known from Namibia (CapeCross and the Erongo Mountains) and the PamirMountains of Tajikistan (see K. Scarratt et al., “Jereme-jevite: A gemological update,” Fall 2001 Gems &Gemology, pp. 206–211; Fall 2002 GNI, pp. 264–265).More recently, a near-colorless 7.88 ct jeremejevite wasdocumented from an additional locality, Madagascar(Winter 2004 GNI, pp. 340–341). With only a few sourcesof this rare gem known for many years, it is surprisingthat two more localities for gem-quality jeremejevite havejust been reported: Myanmar (Burma) and Sri Lanka (fig-ure 15).
The Burmese jeremejevite was recently documentedby H. Kyi and K. Thu (“A new deposit of jeremejevite fromthe Mogok Stone Tract, Myanmar,” Australian Gem-mologist, Vol. 22, No. 9, 2006, pp. 402–405), who pictureda 4.35 ct light yellow faceted stone and indicated thatgemmy crystals can reach 4.0 × 1.3 cm. They reported thatthe jeremejevite ranges from colorless to light yellow andwas mined from alluvial deposits and associated pegmatite
dikes. Their samples came from a pegmatite on Loi-Saumountain, which is located 19 km northeast of Mogok,near Pan-tara village; some pink tourmaline and quartzcrystals were also produced from this mine (K. Thu, pers.comm., 2006). According to Bill Larson (Pala International,Fallbrook, California), who regularly travels to Myanmar,most of the jeremejevite was produced 1–21⁄2 years ago.Well-formed crystals have been found, with terminationsthat show varying development of pyramidal and basalforms (figure 16).
Figure 16. Jeremejevite crystals from Myanmar areprismatic and commonly of gem quality. The crystalon the left is 21.6 × 5.4 mm. Courtesy of Bill Larson;photo by Wimon Manorotkul.
Figure 15. These jeremejevites are from Sri Lanka(left, 5.26 ct) and Myanmar (right, 1.34 ct). Courtesyof Dudley Blauwet; photo by C. D. Mengason.

In late 2005, Dudley Blauwet loaned a 1.34 ct Burmesejeremejevite to GIA for examination (again, see figure 15).The following properties were determined by one of us(EAF): color—light yellowish orange; R.I.—1.643–1.650;birefringence—0.007; hydrostatic S.G.—3.29; and fluores-cence—inert to long-wave and weak yellow to short-waveUV radiation. No absorption features were observed withthe desk-model spectroscope. Microscopic examinationrevealed angular growth lines, growth tubes, and two-phase inclusions. The R.I. values of this stone fell within aslightly narrower range (yielding a lower birefringence)than was reported for Burmese jeremejevite by Kyi andThu (2006; ne = 1.640 and no = 1.653).
Sri Lankan jeremejevite was brought to our attentionby Mr. Blauwet in September 2005. He obtained a pieceof rough that was reportedly from the Ratnapura area,and it was subsequently faceted into a 5.26 ct colorlessgem with an interesting inclusion centered beneath thetable (again, see figure 15). Mr. Blauwet’s supplier in SriLanka indicated that several small pieces of colorlessjeremejevite have been found sporadically in the samearea over the past few years. Examination of the 5.26 ctjeremejevite by one of us (EAF) yielded the followingproperties: color—colorless; R.I.—1.640–1.649; birefrin-gence—0.009; hydrostatic S.G.—3.29; and fluores-cence—inert to long- and short-wave UV radiation.Again, no absorption features were observed with thedesk-model spectroscope. Microscopic examinationshowed that the inclusion under the table consisted of alinear arrangement of angular platelets that ranged fromwhite to yellow to orange (figure 17). Primary fluidinclusions of similar shape have been seen in jeremeje-vite crystals previously by J. I. Koivula (pers. comm.,2005); he suggested that those in the Sri Lankan stone
are probably drained negative crystals that have beenepigenetically iron-stained. No other inclusions wereobserved in this stone. Mr. Blauwet recently informed usabout another colorless jeremejevite that was found inthe Ratnapura area in May 2006, which is expected toyield a cut stone weighing ~2 ct.
BML
Eric A. FritzGIA Laboratory, Carlsbad
Pink opal from Monte Rosa, Peru. Peru is an importantproducer of a few lapidary materials, especially chryso-colla and blue and pink opal from the Acari mine nearNazca (460 km south of Lima), as well as “gem silica”(chrysocolla-stained chalcedony) from the Lily mine nearPisco (J. Hyrsl, “Gemstones of Peru,” Journal ofGemmology, Vol. 27, No. 6, 2001, pp. 328–334), 150 kmsouth of Lima. Pink opal is a mixture of opal with paly-gorskite, and the color is caused by organic compoundscalled quinones (E. Fritsch et al., “Relationship betweennanostructure and optical absorption in fibrous pinkopals from Mexico and Peru,” European Journal ofMineralogy, Vol. 16, 2004, pp. 743–752). Pink and blueopals probably form in volcanic lake environments.
Pink opal from the Acari mine is typically ofmediocre quality, and only rarely has it been found inhomogenously colored pieces large enough to be polishedinto gems. Much better quality material (e.g., figure 18)was found in 2002 at Monte Rosa, about 5 km east of Icaand 250 km southeast of Lima. At present, about 60 peo-ple are using primitive methods to mine the deposit viatunnels that reach almost 100 m underground. The satu-rated pink opal forms veins up to 30 cm thick. The veinssometimes contain very soft, felt-like aggregates of white
176 GEM NEWS INTERNATIONAL GEMS & GEMOLOGY SUMMER 2006
Figure 18. This specimen of pink opal (9 cm long) wasmined at a relatively new locality in Peru, known asMonte Rosa. Photo by J. Hyrsl.
Figure 17. The Sri Lankan jeremejevite contained a con-spicuous inclusion formed by angular platelets thatranged from white to yellow to orange. This featuremight have been created by a series of negative crystalsthat were epigenetically iron-stained. Photomicrographby Shane F. McClure; magnified 15×.

GEM NEWS INTERNATIONAL GEMS & GEMOLOGY SUMMER 2006 177
palygorskite. Also typical in the opal are cavities, some-times with a sparkling surface caused by an overgrowthof drusy quartz crystals (figure 19). Some specimens ofthe pink opal are covered by a layer of milky white opal.However, the youngest phase of deposition identifiedwas a crust of botryoidal colorless hyalite opal, up to 7mm thick, which commonly fluoresced green to short-wave UV radiation. So far, blue Cu-bearing opal has notbeen found at Monte Rosa.
Gemological properties were collected on five cabo-chons and two pieces of polished rough pink opal thatwere obtained from a local dealer who regularly visitsMonte Rosa: R.I.—1.475, hydrostatic S.G.—2.18–2.25,Mohs hardness—6, and fluorescence—inert to short-wave UV radiation and weak pinkish white to long-wave UV. These properties are identical to those report-ed for the Acari material (Hyrs l, 2001). Powder X-raydiffraction analysis confirmed that this material is amixture of opal, palygorskite, and minor chalcedony.
The Monte Rosa opal is available in large quantities(tonnes) from several dealers in Lima and at interna-tional gem shows. The relatively large size of the veinsallows the material to be carved into large objects; anattractive fish carving measuring 60 cm in diameterwas seen by this contributor in Lima. The mine ownersplan to develop a large open pit, which will help guar-antee a steady production of this attractive material inthe future.
Jaroslav Hyrsl ([email protected])Kolin, Czech Republic
Update on prehnite from Australia. The Spring 2001 GemNews International section (pp. 71–72) reported on attrac-tive gem-quality prehnite from Wave Hill, NorthernTerritories. At the 2006 TGMS show in Tucson, Arizona,some new samples of prehnite from this deposit (e.g., fig-ure 20) were shown to this contributor by Robert Sielecki(Ausrox/Crystal Universe, Port Melbourne, Victoria,Australia). Mr. Sielecki reported that in early 2005, hiscompany began exploring an area of Wave Hill that hadbeen prospected for 30 years by Gerald Pauley, whobecame interested in collaborating on developing theprospect. The deposit is located near the small townshipof Kalkarindji on the edge of the Tanami Desert, approxi-mately 885 km (550 miles) by road south of Darwin. Mr.Sielecki stated that this area is underlain by ancient (earlyCambrian) flood basalts of the Antrim Plateau Volcanics,and there are several minerals produced in addition toprehnite: scolecite, calcite, amethyst, smoky quartz, andagates.
So far the prehnite has only been surface collected aspart of a bulk-sampling program being conducted toassess the viability of the deposit for commercial produc-tion. A program of pitting and trenching will commenceshortly, and full-scale mining is planned for late 2006,depending on the onset of the rainy season (which willlimit access to the area). Preliminary results suggest thatapproximately 3% of the prehnite is of sufficient gemgrade for polishing cabochons or faceted stones, with 95%of this yellowish green and the remainder yellow. Whileto date mostly small faceted stones have been cut fromthe weathered surface material, Mr. Sielecki expects torecover larger and more transparent rough once miningbegins. The lower-quality prehnite is being fashioned into
Figure 19. Drusy quartz crystals have overgrown thepink opal within a cavity in this 7-cm-long samplefrom Monte Rosa, Peru. Note also the surroundinglayers of milky white opal and the thin crust of botry-oidal colorless hyalite opal on the top of this sample,which represents the last stage of deposition in thevein. Photo by J. Hyrsl.
Figure 20. Prehnite from Australia is being mined bya new venture, and the higher-quality material isbeing polished into cabochons and faceted stones incolors ranging from yellowish green to yellow. Thecabochons shown here weigh 9.52–45.80 ct, and thefaceted stones are 1.55 and 7.19 ct. Gift of RobertSielecki–Ausrox/Crystal Universe; GIA Collectionnos. 32980–32984. Photo by C. D. Mengason.
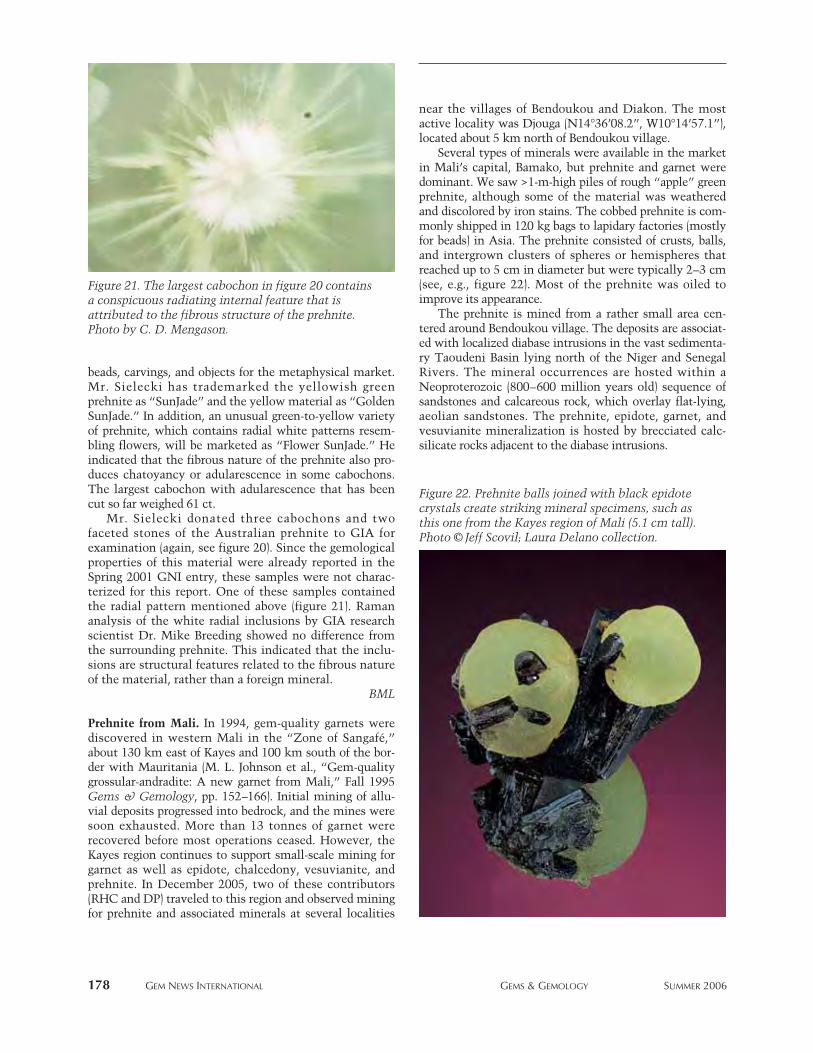
178 GEM NEWS INTERNATIONAL GEMS & GEMOLOGY SUMMER 2006
beads, carvings, and objects for the metaphysical market.Mr. Sielecki has trademarked the yellowish greenprehnite as “SunJade” and the yellow material as “GoldenSunJade.” In addition, an unusual green-to-yellow varietyof prehnite, which contains radial white patterns resem-bling flowers, will be marketed as “Flower SunJade.” Heindicated that the fibrous nature of the prehnite also pro-duces chatoyancy or adularescence in some cabochons.The largest cabochon with adularescence that has beencut so far weighed 61 ct.
Mr. Sielecki donated three cabochons and twofaceted stones of the Australian prehnite to GIA forexamination (again, see figure 20). Since the gemologicalproperties of this material were already reported in theSpring 2001 GNI entry, these samples were not charac-terized for this report. One of these samples containedthe radial pattern mentioned above (figure 21). Ramananalysis of the white radial inclusions by GIA researchscientist Dr. Mike Breeding showed no difference fromthe surrounding prehnite. This indicated that the inclu-sions are structural features related to the fibrous natureof the material, rather than a foreign mineral.
BML
Prehnite from Mali. In 1994, gem-quality garnets werediscovered in western Mali in the “Zone of Sangafé,”about 130 km east of Kayes and 100 km south of the bor-der with Mauritania (M. L. Johnson et al., “Gem-qualitygrossular-andradite: A new garnet from Mali,” Fall 1995Gems & Gemology, pp. 152–166). Initial mining of allu-vial deposits progressed into bedrock, and the mines weresoon exhausted. More than 13 tonnes of garnet wererecovered before most operations ceased. However, theKayes region continues to support small-scale mining forgarnet as well as epidote, chalcedony, vesuvianite, andprehnite. In December 2005, two of these contributors(RHC and DP) traveled to this region and observed miningfor prehnite and associated minerals at several localities
near the villages of Bendoukou and Diakon. The mostactive locality was Djouga (N14°36’08.2”, W10°14’57.1”),located about 5 km north of Bendoukou village.
Several types of minerals were available in the marketin Mali’s capital, Bamako, but prehnite and garnet weredominant. We saw >1-m-high piles of rough “apple” greenprehnite, although some of the material was weatheredand discolored by iron stains. The cobbed prehnite is com-monly shipped in 120 kg bags to lapidary factories (mostlyfor beads) in Asia. The prehnite consisted of crusts, balls,and intergrown clusters of spheres or hemispheres thatreached up to 5 cm in diameter but were typically 2–3 cm(see, e.g., figure 22). Most of the prehnite was oiled toimprove its appearance.
The prehnite is mined from a rather small area cen-tered around Bendoukou village. The deposits are associat-ed with localized diabase intrusions in the vast sedimenta-ry Taoudeni Basin lying north of the Niger and SenegalRivers. The mineral occurrences are hosted within aNeoproterozoic (800–600 million years old) sequence ofsandstones and calcareous rock, which overlay flat-lying,aeolian sandstones. The prehnite, epidote, garnet, andvesuvianite mineralization is hosted by brecciated calc-silicate rocks adjacent to the diabase intrusions.
Figure 21. The largest cabochon in figure 20 containsa conspicuous radiating internal feature that isattributed to the fibrous structure of the prehnite.Photo by C. D. Mengason.
Figure 22. Prehnite balls joined with black epidotecrystals create striking mineral specimens, such asthis one from the Kayes region of Mali (5.1 cm tall).Photo © Jeff Scovil; Laura Delano collection.

GEM NEWS INTERNATIONAL GEMS & GEMOLOGY SUMMER 2006 179
Over the past three years, prehnite mining has becomean important part of the economy of Bendoukou. Themines—actually, individual shafts—are worked by rudi-mentary methods (figure 23) and the material is hand-sort-ed on-site. We observed 50–75 independent miners duringthe trip, but the workforce fluctuates according to agricul-tural priorities; it grows to several hundred at the end ofthe dry season. There were about 120 shafts within a 200 ×100 m area, reaching a maximum depth of about 24 m.They were dug randomly until prehnite-bearing rock waslocated, and then tunnels radiated outward from the shaft.The production included crusts of translucent gray-green,blue-green, and yellow-green prehnite up to a maximum of10 cm thick, although most are 2–5 cm thick. Many ofthese crusts have flat undersides and had grown on whatmay have been anhydrite crystals that subsequently dis-solved. Also found in this area were balls and intergrownspherical clusters of prehnite, sometimes intergrown withstout, black, prismatic epidote crystals up to about 5 cmlong (again, see figure 22).
Another area near Bendoukou, called Baga(N14°30’34.2”, W10°15’54.9”), produced prehnite cruststhat varied in color from gray to grayish green. Specimensweighing at least 100 kg were produced at this deposit, butprehnite mining has ceased because of the poor color. Bagais also the source of some very fine epidote specimens,with crystals up to about 10 cm, as well as abundantsmall, rhombic dodecahedral yellow-brown garnets, someassociated with epidote.
Four polished samples of prehnite from unknown locali-ties in Mali were donated to GIA by Dudley Blauwet, andwere characterized by one of us (EPQ). The samples consist-ed of three oval modified brilliants and one cabochon (figure24), and they yielded the following gemological properties:color—light-to-medium grayish green and yellow; diaphane-ity—transparent to semitransparent; R.I.—n
α=1.617–1.619
and nγ=1.643–1.645 from the faceted stones; birefringence—
0.026; hydrostatic S.G.—2.92–2.93; Chelsea filter reaction—very weak red reaction from the three green stones and noreaction from the yellow sample; and fluorescence—inert toboth long- and short-wave UV radiation. No absorption wasobserved with the desk-model spectroscope. These proper-ties are comparable to those reported for prehnite by R.Webster (Gems, 5th ed., rev. by P. Read, Butterworth-Heinemann, Oxford, 1994, p. 361). Microscopic examina-tion of the four samples revealed a wavy fibrous aggregatestructure that sometimes showed a radiating pattern, “fin-gerprints,” hazy clouds, and reflective thin films. The yel-low prehnite had some weak, irregular color zoning.
Rock H. Currier ([email protected])Jewel Tunnel Imports
Baldwin Park, California
Demetrius PohlSanú Resources Ltd., Los Angeles
Elizabeth P. Quinn
Natural sapphire with unusual inclusions. A 3.56 ct bluecushion-shaped mixed cut (figure 25) was tested and certi-fied at the Gem Testing Laboratory, Jaipur, India.Refractive indices of 1.760–1.770 and a hydrostatic S.G.value of 3.99 confirmed the stone as corundum.
With magnification, the sample displayed some unusu-al inclusion patterns. Long, parallel needle-like inclusionswith some curved bends (figure 26, left) were present,along with long, slightly wavy fiber- or needle-like
Figure 23. Djouga is the most active mining area forprehnite in Mali. Simple hand methods are used tofollow the prehnite veins underground for up to 24 m.Photo by R. H. Currier.
Figure 24. Although prehnite from Mali is typicallysold to bead manufacturers, a small amount of theproduction is polished into cabochons and facetedstones (here, 17.91 ct and 1.62–2.19 ct, respectively).Gift of Dudley Blauwet; GIA Collection nos.32974–32977. Photo by Maha Calderon.
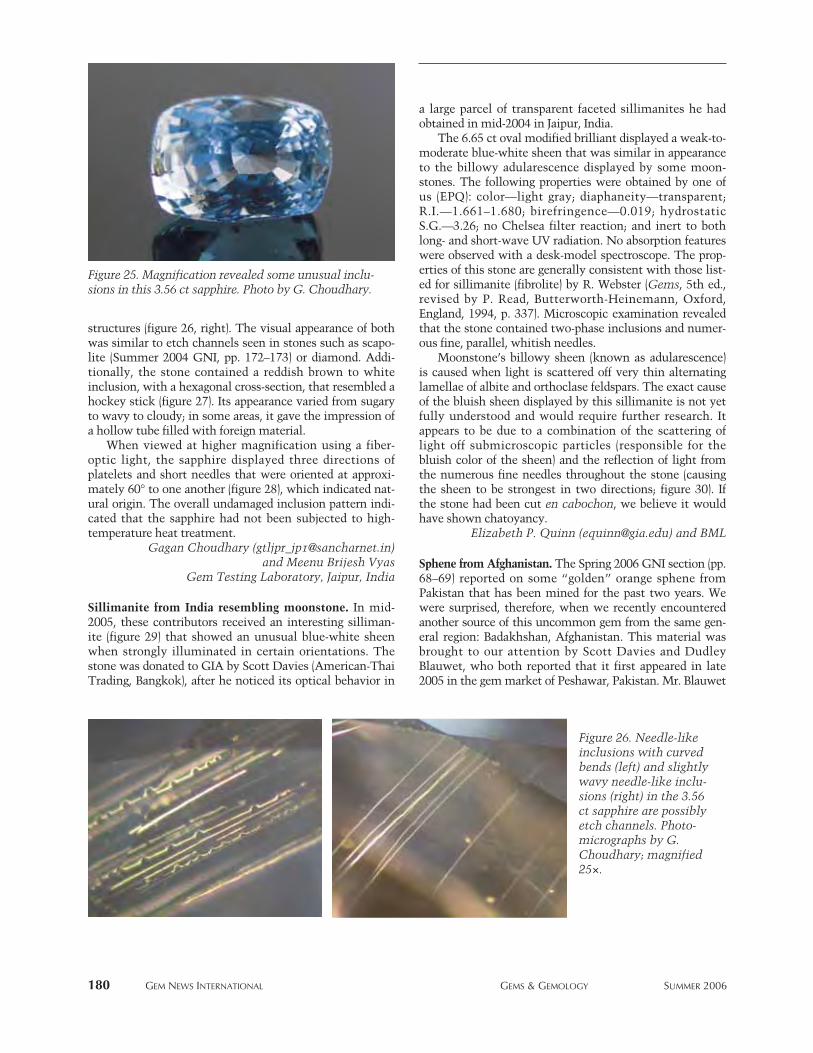
180 GEM NEWS INTERNATIONAL GEMS & GEMOLOGY SUMMER 2006
structures (figure 26, right). The visual appearance of bothwas similar to etch channels seen in stones such as scapo-lite (Summer 2004 GNI, pp. 172–173) or diamond. Addi-tionally, the stone contained a reddish brown to whiteinclusion, with a hexagonal cross-section, that resembled ahockey stick (figure 27). Its appearance varied from sugaryto wavy to cloudy; in some areas, it gave the impression ofa hollow tube filled with foreign material.
When viewed at higher magnification using a fiber-optic light, the sapphire displayed three directions ofplatelets and short needles that were oriented at approxi-mately 60° to one another (figure 28), which indicated nat-ural origin. The overall undamaged inclusion pattern indi-cated that the sapphire had not been subjected to high-temperature heat treatment.
Gagan Choudhary ([email protected])and Meenu Brijesh Vyas
Gem Testing Laboratory, Jaipur, India
Sillimanite from India resembling moonstone. In mid-2005, these contributors received an interesting silliman-ite (figure 29) that showed an unusual blue-white sheenwhen strongly illuminated in certain orientations. Thestone was donated to GIA by Scott Davies (American-ThaiTrading, Bangkok), after he noticed its optical behavior in
a large parcel of transparent faceted sillimanites he hadobtained in mid-2004 in Jaipur, India.
The 6.65 ct oval modified brilliant displayed a weak-to-moderate blue-white sheen that was similar in appearanceto the billowy adularescence displayed by some moon-stones. The following properties were obtained by one ofus (EPQ): color—light gray; diaphaneity—transparent;R.I.—1.661–1.680; birefringence—0.019; hydrostaticS.G.—3.26; no Chelsea filter reaction; and inert to bothlong- and short-wave UV radiation. No absorption featureswere observed with a desk-model spectroscope. The prop-erties of this stone are generally consistent with those list-ed for sillimanite (fibrolite) by R. Webster (Gems, 5th ed.,revised by P. Read, Butterworth-Heinemann, Oxford,England, 1994, p. 337). Microscopic examination revealedthat the stone contained two-phase inclusions and numer-ous fine, parallel, whitish needles.
Moonstone’s billowy sheen (known as adularescence)is caused when light is scattered off very thin alternatinglamellae of albite and orthoclase feldspars. The exact causeof the bluish sheen displayed by this sillimanite is not yetfully understood and would require further research. Itappears to be due to a combination of the scattering oflight off submicroscopic particles (responsible for thebluish color of the sheen) and the reflection of light fromthe numerous fine needles throughout the stone (causingthe sheen to be strongest in two directions; figure 30). Ifthe stone had been cut en cabochon, we believe it wouldhave shown chatoyancy.
Elizabeth P. Quinn ([email protected]) and BML
Sphene from Afghanistan. The Spring 2006 GNI section (pp.68–69) reported on some “golden” orange sphene fromPakistan that has been mined for the past two years. Wewere surprised, therefore, when we recently encounteredanother source of this uncommon gem from the same gen-eral region: Badakhshan, Afghanistan. This material wasbrought to our attention by Scott Davies and DudleyBlauwet, who both reported that it first appeared in late2005 in the gem market of Peshawar, Pakistan. Mr. Blauwet
Figure 26. Needle-likeinclusions with curvedbends (left) and slightlywavy needle-like inclu-sions (right) in the 3.56ct sapphire are possiblyetch channels. Photo-micrographs by G.Choudhary; magnified25×.
Figure 25. Magnification revealed some unusual inclu-sions in this 3.56 ct sapphire. Photo by G. Choudhary.

learned that the sphene is mined near the village of “FargonMeeru” (Fargha–mi–ru–), which is four hours by jeep down theKokcha Valley from the lapis lazuli mines and four hours byjeep up from the capital of Badakhshan, Faiza–ba–d(Feyza–ba–d).
During a visit to Peshawar in early 2006, Mr. Davieswas shown approximately 20 kg of rough material (consid-erably more than was available at that time from depositsin Pakistan). Unlike the Pakistani material, which variesfrom yellow to orange-brown (with rare greenish hues), the
color of the Afghan sphene he examined fell into a narrow-er range of light-to-medium greenish yellow to brownishyellow (and, rarely, reddish orange). In addition, while thePakistani sphene was typically seen as broken crystal frag-ments, the Afghan rough consisted of smaller but morecomplete crystals, with some showing glassy surfaces. Hereported that most of the stones he has cut from 1.2 kg ofselected rough weighed 1–2 ct, with a few in the 3–5 ctrange, and only six clean gems were over 5 ct. The largestclean stone he has cut weighed 8.36 ct.
Mr. Davies indicated that sizeable clean gems are diffi-cult to produce for two reasons: the abundance of inclu-sions and the twin plane that is typical of sphene.Fractures are common in the sphene, and it must be
GEM NEWS INTERNATIONAL GEMS & GEMOLOGY SUMMER 2006 181
Figure 30. As seen here through the pavilion of the silli-manite in figure 29, the blue-white sheen shows linearconcentrations that correlate to the orientation of par-allel needle inclusions. Photomicrograph by James E.Shigley; magnified 20×.
Figure 29. When viewed with strong lighting in cer-tain directions, this 6.65 ct sillimanite showed aweak-to-moderate blue-white sheen that is reminis-cent of the adularescence displayed by some moon-stones. Gift of G. Scott Davies; GIA Collection no.32498. Photo by C. D. Mengason.
Figure 27. This inclusion in the 3.56 ct sapphire,which resembles a hockey stick, appears to be a hol-low tube that is filled with foreign material.Photomicrograph by G. Choudhary; magnified 30×.
Figure 28. Higher magnification reveals fine needlesand platelets in the sapphire, which are oriented inthree directions at approximately 60° to one another.They show that the sapphire has not undergone high-temperature heat treatment. Also visible is a portionof the “hockey stick” inclusion in figure 27. Photo-micrograph by G. Choudhary; magnified 70×.

faceted so that the twin plane does not intersect thecrown or it will be easily seen. The twin plane does notappear to be a source of weakness; his cutters have notreported any breakage along it. Positioning the twin planebelow the girdle restricts the cutter’s options for orientingthe rough, and therefore reduces the size of the cut gemsand decreases the overall yield. For example, Mr. Blauwetreported that he was able to facet only about 70 carats ofclean 4–5 mm round brilliants from 450 grams of rough.The bright yellow color and dispersion shown by thesestones gave a resemblance to yellow diamond.
Mr. Davies donated five faceted samples (1.28–1.95 ct;figure 31) of the Afghan sphene to GIA, and gemologicalproperties were collected by one of us (EPQ): color—brown-ish yellow to greenish yellow; trichroism—medium yel-low, yellow-brown, and yellow-green; diaphaneity—trans-parent; dispersion—strong with predominantly red andgreen flashes; R.I.—above the limits of a standard refrac-tometer; hydrostatic S.G.—3.53–3.54; Chelsea filter—weakpink; and fluorescence—inert to both long- and short-waveUV radiation. All of the sphenes displayed a 580 nm dou-blet along with a 510 nm line when viewed with a hand-held spectroscope. These properties are comparable tothose reported for sphene by R. Webster (Gems, 5th ed.,revised by P. Read, Butterworth-Heinemann, Oxford,England, 1994, pp. 375–376). Microscopic examination ofthe five samples revealed strong doubling, straight and/orangular transparent growth lines, partially healed fractureswith two-phase negative crystals containing a liquid and adoubly refractive crystal (in all but one stone), one or moretwin planes (in three samples), and a few small crystals (intwo of the stones).
EDXRF spectroscopy of three of the samples indicatedSi, Ca, and Ti, as expected, along with varying amounts ofAl, Fe, Nb, Zr, and Nd with some Y. Interestingly, thesesphenes showed a subtle shift in their colors when viewed
under different light sources. In both incandescent lightand natural daylight, three of the stones appeared brown-ish yellow and the other two were greenish yellow. Butwhen they were viewed with a 5500 K non-daylight-equivalent fluorescent light, we observed that the threebrownish yellow sphenes shifted to brownish greenishyellow and the two greenish yellow sphenes changed toyellow-green. This shift in color could be due to the inter-action between the rare-earth elements in the sphene andthe emission bands of the fluorescent light.
We previously reported on a material (manufacturedglass) that exhibited a “color change” also believed to becaused by the interaction of rare-earth elements and cer-tain fluorescent light sources (see Winter 2005 GNI, pp.364–365). To fully understand this type of “color change,”however, more research would be needed.
Elizabeth P Quinn and BML
Uvite-dravite tourmaline from Morogoro, Tanzania. Atthe 2006 Tucson gem shows, Menahem Sevdermish ofAdvanced Quality A.C.C. Ltd., Ramat Gan, Israel, showedone of us (BML) some new tourmalines from Morogoro,Tanzania, that were available in a range of “earth tone”colors. The rough was recovered from alluvial deposits inJanuary 2005, as waterworn pebbles weighing 0.1–5 grams.Most of the rough material (95%) that Mr. Sevdermishobtained weighed up to one gram. Larger pieces have beenrecovered, but most were too dark (only about one-third ofthe 2+ gram material was suitable for faceting). He esti-mated that an average of about 5–10 kg per month of finefacetable material was being produced. The faceted tour-malines typically range from 0.25 to 3 ct, although stonesas large as 15 ct have been cut.
Six faceted stones (0.93–9.05 ct; figure 32), representingthe range of color of this tourmaline, were loaned to GIAby Mr. Sevdermish, and one of us (EPQ) recorded the fol-lowing properties: color—brownish orange, brown-yellow,orangy yellow, brownish yellowish green, and yellowishgreen, with one stone appearing bicolored in yellow-greenand reddish brown due to its cut revealing strong pleochro-ism face-up; pleochroism—moderate to strong in brown-yellow, brown-orange, yellow-brown, or reddish brown,and yellowish green to green; diaphaneity—transparent;R.I.—no=1.641–1.643, ne=1.622–1.623; birefringence—0.019–0.021; hydrostatic S.G.—3.05–3.07; Chelsea filterreaction—none to medium red; fluorescence—inert tolong-wave UV radiation and weak-to-strong chalky green-ish yellow to short-wave UV (again, see figure 32). Theproperties of this stone are generally consistent with thoselisted for tourmaline by R. Webster (Gems, 5th ed., revisedby P. Read, Butterworth-Heinemann, Oxford, England,1994, pp. 168–169); this reference also mentions the short-wave UV fluorescence in tourmaline of this color rangefrom Tanzania. Microscopic examination revealed moder-ate doubling, straight and angular transparent growthlines, pinpoints and small clouds in two stones occurring
182 GEM NEWS INTERNATIONAL GEMS & GEMOLOGY SUMMER 2006
Figure 31. These brownish yellow to brownish green-ish yellow sphenes from Afghanistan (1.28–1.95 ct)show the narrow range of color that is typically seenin material from this locality. Gift of G. ScottDavies; GIA Collection nos. 32908–32912. Photoby Candice Grobon.

in linear stringers oriented near-parallel to the c-axis andalso in three directions at ±28° from the c-axis (perpendic-ular to the three pyramid faces), and a small semitranspar-ent crystal in one stone.
The six samples were chemically analyzed by electronmicroprobe at the University of Oklahoma, Norman.Energy-dispersive X-ray analysis showed that the tourma-lines are Ti-bearing solid solutions between the end mem-bers uvite and alkali-deficient dravite. Alkali-deficient (oralkali-free) dravite is an aluminum-rich theoretical end-member in which Al3+ is accommodated in the normallydivalent Y site by removal of cations from the X (alkali)site (G. Werding and W. Schreyer, “Alkali-free tourmalinein the system MgO-Al2O3-B2O3-SiO2-H2O,” Geochimicaet Cosmochimica Acta, Vol. 48, 1984, pp. 1331–1344).Two of the samples were dominated by the alkali-deficientdravite component, three were dominated by uvite, andone of them was transitional between the end members(slightly uvite-dominant). The Ti concentrations (~0.5–1.1wt.% TiO2) were higher in the alkali-deficient dravite samples. No Fe or other cations were found at the
detectable concentration of ~0.3–0.5 wt.% on an oxidebasis. The chemical analyses of these samples indicatethat gemologists would best refer to them as tourmalinesin the uvite-dravite series.
Elizabeth P. Quinn and BML
Triploidite from China. In August 2004, mineral collectorJohn Lucking (Phoenix, Arizona) purchased a reddishorange mineral while visiting a local stone market inGuilin, China. The dealer represented the material asrhodochrosite, but the color, luster, cleavage, and hardnesssuggested a different mineral. Mr. Lucking was unable toobtain reliable information on the source of the mineral,but based on the associated minerals and other materialthat he saw for sale, he believes that it came from the tin-polymetallic sulfide deposits near Dachang, Guangxi,China. After returning to the U.S., he asked Mark Kaufman(Kaufman Enterprises, San Diego, California) to cut a cabo-chon and a faceted stone from this material (figure 33).
In March 2005, Mr. Lucking submitted samples toresearchers at the Department of Geosciences of theUniversity of Arizona, Tucson. Single-crystal X-ray diffrac-tion (XRD) and chemical analysis obtained by two of thesecontributors (MJO and RTD) identified the mineral astriploidite, which has an idealized formula ofMn2(PO4)(OH) and a Mohs hardness of 41⁄2–5. PowderXRD data and Raman spectra for the sample are availableon the Internet at http://rruff.geo.arizona.edu/rruff (searchfor R050186, and click the icon under “Options”). Theresults for both electron-microprobe analysis and a crystalstructure refinement yielded an empirical formula of(Mn1.70Mg0.15Fe3+
0.06Fe2+0.05Ca0.04)(P0.97Fe3+
0.03)O4(OH0.67F0.33).The triploidite occurred with quartz (identified by Ramanspectroscopy), pyrite (identified by XRD), and sphalerite(identified by XRD), which is consistent with an originfrom a hydrothermal mineral deposit.
GEM NEWS INTERNATIONAL GEMS & GEMOLOGY SUMMER 2006 183
Figure 32. Tourmaline has recently been recoveredfrom the Morogoro region of Tanzania in a range of“earth tone” colors (top, 0.93–9.05 ct). Chemicalanalysis of these samples revealed that they areuvite-dravite tourmalines. The stones display weak-to-strong chalky greenish yellow fluorescence whenexposed to short-wave UV radiation (bottom).Courtesy of Advanced Quality A.C.C. Ltd.; photos byCandice Grobon (top) and Franck Notari (bottom).
Figure 33. This faceted stone (3.70 ct) and cabochon(14.97 ct) of triploidite were cut from a portion of therough sample, which was obtained at a local mineralmarket in Guilin, China. Courtesy of John Lucking;photo © Jeff Scovil.

184 GEM NEWS INTERNATIONAL GEMS & GEMOLOGY SUMMER 2006
In March 2006, Mr. Lucking loaned the faceted stoneand the cabochon (3.70 and 14.97 ct, respectively) to GIA,and donated some fragments of the triploidite. The follow-ing gemological properties were collected by one of us(EAF) on the polished samples: color—reddish orange, withvery weak pleochroism in reddish orange and yellowishorange; diaphaneity—transparent (faceted stone) andtranslucent (cabochon); R.I.—1.660–1.679 (faceted stone)and a spot reading of 1.66 (cabochon); birefringence 0.019;hydrostatic S.G.—3.83 and 3.80; and fluorescence—inertto long- and short-wave UV radiation. A cutoff at 420 nmand an absorption band at 530–550 nm were seen in bothsamples with the desk-model spectroscope. Microscopicexamination revealed numerous two-phase (liquid-gas)inclusions and fractures.
The R.I. values are lower than those reported for trip-loidite in mineralogy textbooks (e.g., 1.723–1.730 for a sam-ple with a Mn/Fe ratio of 3.3:1; C. Palache et al., The Systemof Mineralogy, Volume 2, John Wiley & Sons, New York,1966, pp. 853–855). However, lower R.I. values are expectedfor triploidite Mn end-member compositions (Palache et al.,1966), and this is consistent with the much higher Mn/Feratio of the gem-quality triploidite reported here. The S.G. oftriploidite is typically reported as 3.70, which is considerablylower than the values recorded in the present study.Nevertheless, the density calculated from the crystal struc-ture refinement was 3.82 g/cm3, which is quite similar tothe S.G. values that were measured hydrostatically.
UV-Vis-NIR spectra of the two samples showed fea-tures similar to those noted in the desk-model spectro-scope (e.g., figure 34): A strong absorption at 400–420 nm(actually a doublet) and a broad peak at approximately
520–560 nm. A series of absorption features were alsorecorded in the UV region below 370 nm.
To our knowledge, this is the first report of gem-qualitytriploidite.
BML
Eric A. Fritz
Marcus J. Origlieri and Robert T. Downs Department of Geosciences
University of Arizona, Tucson
Väyrynenite from Afghanistan. The Spring 2006 Gem NewsInternational section (p. 75) documented a faceted väyrynen-ite from Pakistan, which had properties comparable to aväyrynenite from an unspecified locality that was describedin the Summer 1994 Lab Notes section (p. 121). Since it issuch a rare mineral, we were quite surprised when wereceived three more faceted väyrynenites in May 2006, thistime from a different locality. The stones were supplied byFarooq Hashmi, who obtained the rough from Afghan sup-pliers in Peshawar, Pakistan; they reported that the materialcame from granitic pegmatites in Laghman Province,Afghanistan, but they did not know the identity of the min-eral. Over the course of the past two years, Mr. Hashmi sawa few parcels of this material in Peshawar, with a totalweight of up to 20 grams, but only small pieces of gem roughwere available. He noticed that the Afghan väyrynenite wasmore pink and less orange than the Pakistani material.
Gemological properties of the three faceted stones(0.09–0.17 ct; figure 35) were collected by one of us (EAF):color—orangy pink, with orange and pink pleochroism;R.I.—n
α=1.640–1.642 and n
γ=1.668–1.770; birefringence—
0.028; hydrostatic S.G.—3.20–3.25; Chelsea filter reac-tion—none; and fluorescence—inert to both long- andshort-wave UV radiation. An absorption line at 413 nm,and weak bands at 435, 465, 505, and 565 nm, were visiblewith the desk-model spectroscope in the two larger stones.With magnification, all three stones had numerous frac-tures and chips, and the largest väyrynenite also containeda “fingerprint.” EDXRF spectroscopy recorded the expect-ed Mn and P, as well as minor amounts of Fe.
The nγand birefringence values of the Afghan väyrynen-
ite were somewhat higher than those reported in the twoGems & Gemology entries referenced above, but they are
Figure 34. This UV-Vis-NIR spectrum of the facetedtriploidite shows a strong absorption at 400–420 nmand a broad peak at approximately 520–560 nm, aswell as a series of absorption features in the UVregion below 370 nm.
Figure 35. Laghman, Afghanistan is reportedly thesource of these väyrynenites (0.09–0.17 ct). Courtesyof Farooq Hashmi; photo by C. D. Mengason.

GEM NEWS INTERNATIONAL GEMS & GEMOLOGY SUMMER 2006 185
still consistent with the values given for väyrynenite inmineralogy textbooks. The absorption in the blue-green togreen region of the spectrum (i.e., at 500–570 nm) wassomewhat different from the absorption features reportedpreviously. While the Pakistani väyrynenite was alsodescribed as orangy pink, slightly more pink color was seenin these Afghan stones, which is consistent with Mr.Hashmi’s observations.
BML and Eric A. Fritz
SYNTHETICS AND SIMULANTSDiffusion-treated synthetic sapphire. Recently, a 2.95 cttransparent blue oval mixed cut (figure 36) was submittedfor identification to the Gem Testing Laboratory, Jaipur,India. Initial testing produced values of R.I.—1.763–1.772;birefringence—0.009; uniaxial negative optic sign; andhydrostatic S.G.—3.99. These were consistent with eithernatural or synthetic sapphire.
When exposed to short-wave UV radiation, the speci-men showed a strong patchy chalky blue fluorescence fol-lowing the crown facets. The pavilion was inert, althougha weak internal glow was observed through the pavilionthat is commonly associated with synthetic material.There was no reaction to long-wave UV. Such an overallresult could indicate the presence of an assembled stone.However, no other features were detected (such as a sepa-ration plane) that might indicate a composite material.
With magnification and immersion of the stone in bro-moform, a slightly wavy “fingerprint” inclusion wasobserved that was oriented almost parallel to the optic axis(figure 37). On careful examination at higher magnifica-tion, this fingerprint appeared to be made up of opaque,dark, nonreflective flux-like particles arranged in linearand square-shaped patterns (figure 38). A similar but small-er fingerprint was seen inclined to the first; both reachedthe surface of the stone. No other inclusions were visible.
Further examination with diffuse illumination con-firmed the source of the blue color. The patchy, shallowcoloration and its confinement to the facet junctions Figure 37. When viewed with immersion, the blue
color in the 2.95 ct synthetic sapphire is concentrat-ed along facet junctions, which is an indication ofdiffusion treatment. Also note the large surface-reaching fingerprint inclusion. Photomicrograph byC. Golecha.
Figure 38. This fingerprint inclusion in the syntheticsapphire consists of unusual square-shaped arrange-ments of flux particles. The linear trails are some-what similar to rows of mineral inclusions in naturalstones. The flux was apparently trapped in surface-reaching fractures during the diffusion treatment.Photomicrograph by C. Golecha; magnified 35×.
Figure 36. This 2.95 ct pale blue gem was identifiedas a flame-fusion synthetic sapphire treated by a dif-fusion process. Photo by G. Choudhary.

186 GEM NEWS INTERNATIONAL GEMS & GEMOLOGY SUMMER 2006
indicated that the specimen owed its color to a diffusionprocess (again, see figure 37). No curved color banding orangular color zoning was present, which would have beenexpected if the color was inherent to the sapphire, synthet-ic or natural. Since the use of flux is common with high-temperature heat treatment (which is typically requiredfor diffusion treatment), we concluded that a pre-existingfracture may have trapped flux during the diffusion pro-cess. However, the square-shaped patterns of the flux par-ticles were highly unusual.
The specimen, still immersed in bromoform, was thenexamined between crossed polarizers. When viewed downthe optic axis, distinct Plato lines were observed (figure39), which are highly indicative of a Verneuil synthetic ori-gin (see Spring 1999 Gem News, pp. 58–59; S. Elen and E.Fritsch, “The separation of natural from synthetic color-less sapphire,” Spring 1999 Gems & Gemology, pp.
30–41). This feature consisted of two sets of lines (withone set being more prominent than the other) that formeda crisscross pattern in certain portions of the specimen.Plato lines have traditionally been seen only in pale-col-ored flame-fusion synthetic sapphires, and this is consis-tent with this sample since the blue color was a result ofthe surface diffusion treatment of a pale starting material.
Synthetic materials with natural-appearing features areencountered from time to time (see, e.g., Spring 1991 LabNotes, p. 45; K. Schmetzer and F. J. Schupp, “Flux-inducedfingerprint pattern in synthetic ruby: An update,” Spring1994 Gems & Gemology, pp. 33–38; Fall 1996 Lab Notes,pp. 211–212; Fall 2003 Gem News International, pp.239–240). However, this is the first time we have seen fluxinclusions trapped in a square-shaped arrangement. Thecause of such an unusual inclusion pattern, as well as theunusual fluorescence characteristics, is unclear. Any sug-gestions or comments that might help explain these fea-tures are welcome.
With other standard gemological properties being simi-lar, magnification is the key to separating natural fromsynthetic gemstones. However, the several reports of mis-leading natural-appearing features in synthetic materialsreinforce the importance of careful examination.
Acknowledgment: The author is grateful to GaganChoudhary, assistant director of the Gem TestingLaboratory, Jaipur, for his helpful discussions.
Chaman Golecha ([email protected])Gem Testing Laboratory, Jaipur, India
TREATMENTSLead glass–filled ruby bead necklace. Gem trade fairs pro-vide an excellent opportunity to screen gem materialscurrently in the market. During the recent BaselWorld
Figure 39. Plato lines are seen when the syntheticsapphire is viewed between crossed polarizers in theoptic-axis direction while immersed in bromoform.This feature is strongly indicative of Verneuil syn-thetic sapphires. Photomicrograph by G. Choudhary;magnified 40×.
Figure 40. All of theruby rondelles in this
necklace (13–23 mm indiameter) proved to belead-glass filled. Photo
by H. A. Hänni, © SSEFSwiss Gemmological
Institute.

GEM NEWS INTERNATIONAL GEMS & GEMOLOGY SUMMER 2006 187
fair, the SSEF Swiss Gemmological Institute received aruby necklace for an identification report. The necklaceconsisted of 41 translucent “raspberry” red rondelleswith a total weight of 290 grams (figure 40). A microscop-ic inspection revealed the presence of undamaged inclu-sions such as rutile and negative crystals, indicating thatthe beads had not been subjected to high-temperatureheat treatment.
However, further examination with the microscopeshowed evidence of glass filling, such as faint bluishflashes and gas bubbles throughout the beads. In addi-tion, many fractures, twin planes, and cavities werefilled with a glassy substance (figure 41). Some of thecavities even contained more than one gas bubble,
another sign that the beads were glass filled (figure 42).The presence of the undamaged natural inclusions wasnot surprising, since modern fissure treatment in rubiescan be done with lead-bearing glass at lower tempera-tures than are commonly used with the traditionalborax process. Although the yellowish color in the largercavities that is characteristic of lead-glass filling was notevident, analysis of the rondelles with EDXRF spec-troscopy did reveal the presence of Pb in addition to theexpected Al, Cr, Fe, and Ga.
While in Kenya recently, this contributor had theopportunity to see large amounts of rough Tanzaniancorundum that was intended for lead-glass treatment inThailand (figure 43). The tabular crystals were closer topink sapphire than ruby, but filling of porous material usu-ally causes an increased saturation of the color.
HAH
ANNOUNCEMENTSAGTA Spectrum Awards competition. The 2007 AGTASpectrum Awards will recognize outstanding colored gem-stone and cultured pearl jewelry designs from NorthAmerica, as well as achievements in the lapidary arts.Winning entries will be displayed and award recipientshonored at the 2007 AGTA GemFairs in Tucson and LasVegas. The entry deadline is September 22; the competi-tion will be held in New York City during October. Forentry forms and more information, visit www.agta.org orcall 800-972-1162.
NAJA conference scholarship. The National Associationof Jewelry Appraisers is offering a scholarship for gemologystudents who are interested in exploring a career in gemand jewelry appraising. Open to GIA, FGA, FGAA, FGG,and FCGmA students, the scholarship covers the confer-ence fee for NAJA's 27th Annual Winter EducationalConference January 29–30, 2007, in Tucson. Applications
Figure 41. With magnification, numerous gas bubblesare apparent in the glassy substance filling fractures,twin planes, and cavities in this ruby bead.Photomicrograph by H. A. Hänni, © SSEF SwissGemmological Institute; magnified 15×.
Figure 42. This ruby bead contains filled fracturesand twin planes, as well as cavities with multiple gasbubbles. Photomicrograph by H. A. Hänni, © SSEFSwiss Gemmological Institute; magnified 30×.
Figure 43. These semitranslucent ruby crystals froman East African source are typical of the materialused for lead-glass filling. Photo by H. A. Hänni, ©SSEF Swiss Gemmological Institute.
188 GEM NEWS INTERNATIONAL GEMS & GEMOLOGY SUMMER 2006
are available at www.najaappraisers.com or by fax to 718-997-9057. The submission deadline is November 1,2006, and the selection will be announced December 1.
ConferencesGems at IAGOD. The 12th Quadrennial InternationalAssociation on the Genesis of Ore Deposits symposiumwill be held on August 21–24, 2006, in Moscow, Russia.The program will include symposia titled “Genesis ofGem Deposits” and “Genesis of Diamonds.” A field tripto diamond placer deposits of the Central Ural Mountainswill take place on August 25–31. Visit www.iagod.sgm.ruor e-mail [email protected].
Goldschmidt 2006. 16th Annual V.M. GoldschmidtConference will take place August 27–September 1 inMelbourne, Australia. This important geochemistry confer-ence will feature a session titled “The deepest lithosphereand beyond: Diamonds and related research, a session inhonour of Jeff Harris.” Visit www.goldschmidt2006.org ore-mail [email protected].
Diamond 2006. The 17th European Conference onDiamond, Diamond-like Materials, Carbon Nanotubes,and Nitrides will be held September 3–8 in Estoril,Portugal. Presentations on the growth, processing, andcharacterization of diamond will be given at this meeting.Visit www.diamond-conference.elsevier.com or e-mailNina Woods at [email protected].
Santa Fe Symposium changes venue in 2006. The 20thannual Santa Fe Symposium on jewelry manufacturingtechnology will be held in Nashville, Tennessee, onSeptember 10–13. Visit www.santafesymposium.org.
Minerals, Magmas and Megastructures. Diamonds will beamong the topics included at the 2006 Geological SocietyFermor Meeting, titled Minerals, Magmas andMegastructures, which will be held at the Natural HistoryMuseum in London on September 13–15, 2006. Visitwww.geolsoc.org.uk/fermor2006.
Clasp: A Convergence of Jewelers. This new conferenceaimed at small manufacturers, metalsmiths, jewelrydesigners, and bench jewelers will be held September15–17 in Nashville, Tennessee. The educational programwill cover all aspects of the art, methodology, and businessof jewelry making, from design to marketing. Visithttp://secure.lenos.com/lenos/riogrande/clasp.
Hong Kong Jewellery & Watch Fair. Held at theAsiaWorld-Expo (September 18–23, 2006) and the HongKong Convention & Exhibition Centre (September19–23), this show will also host GIA GemFest Asia (onpearls) on Thursday, September 21. RSVP to [email protected], or call +852-2303-0075 in Hong Kong. A num-
ber of educational seminars are also planned. For moreinformation visit www.jewellerynetasia.com/exhibitions.
Gem and Mineral Conference in China. The 1st InternationalMinerals & Gem Crystal Conference and Exhibition will beheld October 9–10 in Beijing. The program includes educa-tional seminars on gem and mineral localities, collecting, andmarketing in China, and optional visits to gem mines inHunan Province. Visit www.aaamineral.com/Minerals/conference/conference_details.asp.
Exhibits
Upcoming GIA Museum Exhibits. Beginning August 27,2006, in conjunction with the 4th International Gemolo-gical Symposium, the GIA Museum in Carlsbad will pre-sent “Celebrating Excellence in Gems & Jewelry,” an exhib-it featuring mineral specimens, finished gems, jewelry, andjeweled objects that are superlative examples of their type orhave special provenance or historic significance. This exhib-it will remain open until November 30, 2006.
During the International Gemological Symposium, therewill be additional exhibit areas open throughout theInstitute, including a display of important and historic dia-mond replicas from Graff; photos by noted photographersHarold & Erica Van Pelt, Tino Hammid, and Robert Weldon;and gems and jewelry from the GIA Collection; these willremain on view until March 2007.
King Tut Returns. “Tutankhamun and the Golden Age ofthe Pharaohs,” an exhibition of more than 130 artifactsfrom the tomb of King Tut and other royal tombs inEgypt's Valley of the Kings, are on display at the FieldMuseum in Chicago through January 1, 2007. Among theitems included are a gem-studded gold diadem and a jew-eled pectoral ornament. Only a few of the artifacts in thisexhibit were part of the famed 1977 exhibition, and manyhave never traveled outside Egypt. Visit www.kingtut.org.
ERRATA1. The biography for Dr. Wuyi Wang in the Spring 2006
Most Valuable Article Award section (p. 3) should haveread, “Wuyi Wang is a research scientist for GIA Researchand Identification in New York. He holds a Ph.D. in geolo-gy from the University of Tsukuba in Japan, and has con-siderable experience in studying diamond geochemistry.”Gems & Gemology regrets the error.
2. In the Spring 2006 article by S. F. McClure et al.,“Identification and durability of lead glass–filledrubies,” the carat weight given in figure 5 on p. 26 wasin error. The correct weight of the stone is 2.31 ct, asstated on p. 33. We thank Brent Malgarin, ElegantGems Ltd., Spokane, Washington, for bringing this toour attention.

BOOK REVIEWS GEMS & GEMOLOGY SUMMER 2006 189
The Heartless Stone: A Journeythrough the World of Diamonds,Deceit and DesireBy Tom Zoellner, 294 pp., publ. bySt. Martin’s Press, New York, 2006.US$24.95
The mystique and value of diamondsis a double-edged sword, inspiring thepassions that help fuel an industrywith $65 billion in worldwide saleswhile engendering a great number ofmyths and not-so-noble emotions.Like several other mainstream booksabout diamonds, The Heartless Stoneoffers a pastiche of history, myth,assumption, fact, and misinformationinto an engagingly written stew. Thebook describes diamond mining inCanada, Brazil, Angola, and Russia;provides an overview of “The Cartel”(the De Beers Diamond TradingCompany); and examines diamondcutting in India as well as consumermarkets of the U.S. and Japan.Unfortunately, much of this informa-tion is inaccurate.
Typical of how information ispresented in this book is the firstchapter, in which the author juxta-poses his own ill-fated engagementand the diamond that sealed it withthe history of the Central AfricanRepublic (CAR). He recounts thesociopolitical troubles of the CARfrom its French colonial past throughthe reign of Emperor Bokassa in the1970s and ’80s, in the process main-taining that the republic is part of the“conflict diamonds” trade. Zoellner’schoice of the CAR as an example isodd, given that the country, whilegoverned badly, has not experiencedwidespread conflict or civil war. Norhas it ever been named by the UnitedNations, Kimberley Process, or any
nongovernmental organization as asource of conflict diamonds—itseconomy, for the most part, is sus-tained by foreign aid.
Even more problematic is hisstatement that conflict diamondscomprise 14% of the stones in themarket. In reality, at the peak of theAngolan and Sierra Leone civil wars,conflict diamonds represented be-tween 4% and 5% of all diamonds inthe market. Illicitly traded diamonds,those smuggled or under declared toavoid taxes, made up an estimated14% before the 2003 KimberleyProcess forced accountability.
In the chapter on the U.S. dia-mond market, titled “The BigNothing,” the author states that themarkup on diamond engagementrings and other diamond jewelry “isnothing short of outrageous,” addingthat the term keystone was developed“several years ago” as a euphemismto disguise this fact. Of course, key-stone has been in use for manydecades, and retail jewelry profit mar-gins are in fact in line with those ofsimilar consumer products such asapparel and sporting goods. Mall jew-elers, Zoellner says, “have the powerto foist some of the worst deals ontothe consumer thanks to their mam-moth volumes,” failing to note thatthose same jewelers typically pay5–6% assessments on gross sales aspart of their mall lease agreements.Zoellner does discuss the impact ofthe Internet but fails to note howdeeply it has cut into the margins ondiamond solitaires.
The chapter on India, “The StoneMills,” asserts on page 213 that chil-dren constitute 10% of the workforcein the country’s diamond industry,citing a 1997 statement from the
International Confederation of FreeTrade Unions—which at the timerepresented the Belgian diamondworkers’ unions in bargaining forbenefits in the face of Indian compe-tition. Four pages later, however,Zoellner credits the same source for astatement that “20% of India’s [dia-mond] workers were underage.” Inreality, an independent survey ofIndia’s diamond labor force conduct-ed by Ferguson Associates in 2003found that less than 3% of India’sdiamond workers were under 15years old, and many of these wereapprentices of family-run businesses.The author also fails to point out thatthe great majority of India’s diamondworkers earn wages well above thenational average, and that in recentyears Surat has made a dramatictransformation from one of the mostpoverty-stricken cities in India to acenter of budding prosperity (as arecent visit by this reviewer attests).
Old myths long established asapocryphal, such as the “Belgian”(Asscher was Dutch) who cleaved theCullinan diamond fainting after hestruck the first blow (there is no evi-dence this occurred), are presented asfact. At the same time, newer myths,such as De Beers crushing theattempt to develop the Crater ofDiamonds deposit in Arkansas into aviable mine, are given new life. Onthe latter, Zoellner spends pages
*This book is available for purchasethrough the GIA Bookstore, 5345Armada Drive, Carlsbad, CA 92008.Telephone: 800-421-8161; outsidethe U.S. 760-603-4200. Fax: 760-603-4266. E-mail: [email protected]
b o o k
REVIEWS‘06EDITORSSusan B. JohnsonJana E. Miyahira-SmithStuart Overlin

190 BOOK REVIEWS GEMS & GEMOLOGY SUMMER 2006
discussing the alleged potential of the“kimberlite” (actually lamproite)deposits at Murfreesboro despiteextensive bulk sampling performed inthe late 1990s by the state ofArkansas (which he dismisses as afew “core samples”) that clearlyestablished the deposit as uneconomic(about 1.1 ct/100 tonne at $12.30/ct;see D. P. Dunne, “Diamond eco-nomics of the Prairie Creek lamproite,Murfreesboro, AR, USA,” Ore GeologyReviews, Vol. 22, No. 3-4, 2003, pp.251–262).
No one disputes that conflict dia-monds remain an issue today: Evenat less than 1% they are too numer-ous. And certainly not every dia-mond worker in India finds prosperi-ty and not every consumer in theU.S. gets a great deal on a diamond.But these facts must be consideredagainst the whole picture, which wasnot offered here. The tragedy of thisbook is that, like his literary prede-cessors Edward Jay Epstein, MatthewHart, and Janine Roberts, Zoellnerpossesses the skill and drive to pro-duce a work that could have lastingvalue, but instead chose to perpetu-ate misinformation.
RUSSELL SHORGemological Institute of America
Carlsbad, California
Making the Most of Your Flex-shaftBy Karen Christians, 96 pp., illus.,publ. by MJSA/AJM Press and theGanoksin Project, Providence, RI,2006. US$34.95
As Karen Christians states in her newbook, one of the first power tools anew jeweler should purchase is a flex-shaft. This lightweight device’s elec-tric motor powers a flexible shaft thatdrives an assortment of rotationaltools such as burrs and drills, or oscil-lating tools such as hammers. Makingthe Most of Your Flex-shaft is a clear-ly written, easy-to-understand guideto this important jewelry manufactur-ing tool.
Christians takes the time to care-fully show how the electric motor ofthe flex-shaft works, right down tointernal views and schematics.Explaining torque vs. rpm or the rela-tionship between volts and ohms canbe difficult, but she succeeds in usinganalogies to make it easy for the read-er to understand the inner workingsof the machine. She also gives a briefhistory lesson on the inventors of theflex-shaft and chuck key (the toolused to tighten and loosen attach-ments on the handpiece).
Christians then explains why dif-ferent models of the flex-shaft may fitdifferent uses more or less effectively.Using this book as a guide, jewelerslooking to purchase a flex-shaft willbe able to choose a unit whose motorsize will best suit their needs.
Of course, the flex-shaft itself isonly half the equation, the otherbeing the tool that is attached to it.There are innumerable varieties oftools that can be used for operationssuch as cutting, grinding, texturing,and polishing, and each can be madefrom a range of different materials.Depending on the type of metal beingworked or the speed being used, theright tool may be made from high-speed steel, from carbide, or fromanother material. Christians uses ahandy chart to categorize the differentoperations a user may need to pre-form, and recommends the specifictool or variety of tools that is best foreach. This can be of tremendousvalue to a beginner and can preventthe purchase of costly tools that willnever be used. The category of polish-ing tools itself is so large that it hasits own chart to explain all the differ-ent varieties a jeweler may need.
In addition to the basics of the flex-shaft and its uses, there is some veryhelpful information on various add-ontools that are available, such as tools toassist in the stone setting process, waxcarving jigs, and drill press attach-ments. This information on items thatare clamped on or attached to the handpieces is of value to the intermediate-level jeweler as well, and shows theflexibility of this tool platform.
Possibly the most important sec-tion of the book covers the mainte-nance that these fairly simplemachines require. The flex-shaft is arelatively expensive purchase for abeginning jeweler, and good mainte-nance will greatly extend its operatinglife. Christians is very specific on therequired lubrication and cleaning, andeven the changing of the motor brush-es, to ensure optimal performance.
Finally, a few choice tips and trickson using the flex-shaft in unusualways that even a seasoned jewelermay find useful are added near the endof the book.
Overall, this is a very useful andeasy-to-understand text covering theoperation and maintenance of one ofthe most frequently used tools in thejeweler’s arsenal. I would recommendit for beginning- to intermediate-leveljewelers.
MARK MAXWELLJA Certified Master Bench JewelerGemological Institute of America
Carlsbad, California
Charming: The Magic of Charm JewelryBy Deborah Alun-Jones and JohnAyton, 112 pp., illus., publ. byThames & Hudson Inc., New York,2005. US$19.95*
Judging from the attention they havereceived in the fashion media, charmbracelets have once again become derigueur for the stylish woman. Yet foras long as there has been personaladornment, charms have been worn.Because charm jewelry often com-memorates important events in thewearer’s life or represents personalbeliefs, charms tend to have high sen-timental value.
This book offers a lovely look atcharms, their history, and the reasonsthey are worn. Heavily illustratedwith photographs of wonderfulcharms and women wearing charmjewelry, it is broken into six chapters:Magical Talismans, Spiritual Devo-tion, Just for Luck, Love Tokens,

BOOK REVIEWS GEMS & GEMOLOGY SUMMER 2006 191
Style and Sensibility, and Milestonesand Celebrations. Especially engagingare the brief anecdotes describingpieces worn by famous people, suchas the charm bracelet of crosses givento the Duchess of Windsor by theDuke of Windsor.
As a collector of charms, I greatlyenjoyed this book. Attractive andinteresting, it held my attentionuntil the very end. It’s the perfectaddition to the library of anyone whoappreciates charm jewelry.
JANA E. MIYAHIRA-SMITHGemological Institute of America
Carlsbad, California
Bedazzled: 5,000 Years of JewelryBy Sabine Albersmeier for TheWalters Art Museum, 64 pp., illus.,publ. by D. Giles Ltd., London,2005. US$9.95*
Each summer, travelers descend onEuropean towns in search of the smallmuseums that guidebooks call “littlegems.” This slim volume capturesthe glint of a stateside gem, TheWalters Art Museum of Baltimore, acity better known for crab cakes thanclassicism.
Assistant curator of ancient artSabine Albersmeier presents 50 keyitems from the Walters’ collectiondating from the 2nd millennium BCto the early 20th century. Theseworks were once part of the privatecollection of Henry Walters, son ofrailroad magnate and art collectorWilliam T. Walters. At his death in1931, the younger Walters bequeathedto the city and citizens of Baltimorean entire jewelry collection culledfrom World’s Fairs, expositions, andantiquarians around the globe.
Highlights include two lavishgemstone-encrusted gold braceletsdating to the first century BC, whichexemplify ancient Greek embellish-ments of inlay, cloisonné, and bead-ing. Spain’s 6th century Visigoth pastis dramatized by two gemstone andglass fibulae, the ornamental pinsused to fasten medieval garments.
Elaborate crucifixes and rings from theRenaissance are well represented byclean photography and color details.
The collection’s later worksinclude a stunning piece Waltersacquired from René Lalique at the1904 Louisiana Purchase Expo-sition—a plique-à-jour enamel, glass,gold, and blue sapphire pansy brooch.Another floral masterpiece, a gold-stemmed Tiffany corsage ornamentwith Montana sapphires and deman-toid garnets, won the grand prize atthe famed 1900 Paris ExpositionUniverselle. The Walters’ treasuresare complemented by loans from theZucker family ring collection, whichinclude an interlocking ruby-and-dia-mond gimmel ring from 1631.
A whirlwind summary of Westernjewelry traditions and a compact glos-sary expand the 7” × 7” (about 18 × 18cm) catalogue’s accessibility to audi-ences beyond devotees of antiquity,history, and jewelry making.
Albersmeier is organizing curatorfor the traveling exhibit, which isscheduled to visit Nashville’s FristCenter for the Visual Arts fromSeptember 2006 to January 2007 andthe John and Mable Ringling Museumof Art in Sarasota, Florida, fromFebruary to May 2007.
MATILDE PARENTELibertine
Indian Wells, California
Modernist Jewelry, 1930–1960:The Wearable Art Movement By Marbeth Schon, 227 pp., illus.,publ. by Schiffer Publishing Ltd.,Atglen, PA, 2004. US$69.95
Modernist jewelry came at a cross-roads of “isms”—Constructivism,Primitivism, Modernism, Surrealism,Cubism, Expressionism, Dadaism—each contributing to the overall artis-tic sensibilities. The pioneering mod-ernist designers developed their voic-es at a time when the art movementwas prevalent, giving rise to a panoplyof seemingly divergent aesthetics.
This book examines the work of 175of the most important Americanmodernist jewelry artists.
As with nearly every jewelrymovement, some of the resultingworks may appear crude or elemental.Indeed, one common theme during themodernist period was a lack of embel-lishment, as artists preferred the mate-rials left in their original state as muchas possible. Gemstones, wood, andother natural materials were roughlytumbled and cut into bold shapes.Often the metal was allowed to showthe “imperfections” of hammering,texturing, and natural patination,while the necessary functional parts ofjewelry—findings, pins, etc.—wereintegrated into the overall design.
Many of the biographical sketch-es in Modernist Jewelry give a truesense of the artists’ struggles and cre-ativity, though others are muchbriefer, in some cases because littleinformation exists. For instance, thetwo gorgeous photos of MadelineTurner’s earrings and enamel workare accompanied by a mere two-sen-tence bio. For the modernist ArthurKing, there are his maker’s marksand photos of a ring and a cuffbracelet, yet no biography.
This book is especially interestingwhen the iconic jewelry of the artistappears with the bio. The maker’smarks are not shown as line drawingsbut as crisp images of the actualstampings, though only 73 hallmarksare presented. Also of benefit are pho-tos of the artists that visually connectthe creator with the final product.“Prices”—or values, if you will—areused sparingly and appropriately as arange to reflect such variables as con-dition, rarity, and geography.
Between 1930 and 1960, thesemodernist designers, jewelers, andmetalsmiths laid the groundwork forthe next two decades of metal workand wearable art jewelry, giving artis-tic sustenance to the generations ofrespected artists who have followed.
GAIL BRETT LEVINENational Association of Jewelry
AppraisersRego Park, New York

192 GEMOLOGICAL ABSTRACTS GEMS & GEMOLOGY SUMMER 2006
COLORED STONES AND ORGANIC MATERIALSBeryl and its color varieties. A. Falster et al., Eds., extraLapis
English, No. 7, 2005.This is an English translation of extraLapis No. 23,Aquamarine & Co. (2002), which has been updated with somenew information. It begins with a summary of beryl-groupmineralogy and crystallography that includes details on someof the more obscure minerals of the beryl group (i.e., pezzot-taite, bazzite, and stoppaniite). Emerald is given only passingmention, as it was addressed in a previous extraLapis volume,Emeralds of the World (see Fall 2002 Gems & Gemology, p.284). Reviews of all major localities follow, and recent informa-tion on new finds in Canada and Finland is provided.
Some of the more interesting locality reviews include adetailed analysis of China’s future potential as a source of gemberyl, a review of beryl mining in southern California, and adiscussion of the “mysterious golden water of Tajikistan”(heliodor reportedly from this locality is thought by the authorto be irradiated goshenite from elsewhere).
The issue concludes with a brief review of gem beryl pric-ing and a history of the discovery, mining, and industrial usesof beryllium. Like all extraLapis publications, this one is wellillustrated with high-quality gem and mineral photographs aswell as detailed maps and line drawings. TWO
Les corindons à changement de couleur [Color-changing corun-dum]. L. Massi ([email protected]), Revue deGemmologie a.f.g., No. 152, 2005, pp. 16–19 [in Frenchwith English abstract].
By examining natural and synthetic samples of color-change
EDITORS
Brendan M. LaursThomas W. Overton
GIA, Carlsbad
REVIEW BOARDChristopher M. BreedingGIA Laboratory, Carlsbad
Jo Ellen ColeVista, California
Eric A. FritzGIA Laboratory, Carlsbad
R. A. HowieRoyal Holloway, University of London
Alethea InnsGIA Laboratory, Carlsbad
HyeJin Jang-GreenGIA Laboratory, New York
Paul JohnsonGIA Laboratory, New York
David M. KondoGIA Laboratory, New York
Taijin LuGIA Research, Carlsbad
Wendi M. MayersonGIA Laboratory, New York
Kyaw Soe MoeGIA Laboratory, New York
Keith A. MychalukCalgary, Alberta, Canada
James E. ShigleyGIA Research, Carlsbad
Boris M. Shmakin Russian Academy of Sciences, Irkutsk, Russia
Russell ShorGIA, Carlsbad
Rolf Tatje Duisburg University, Germany
Sharon WakefieldNorthwest Gem Lab, Boise, Idaho
This section is designed to provide as complete a record aspractical of the recent literature on gems and gemology. Articlesare selected for abstracting solely at the discretion of the sectioneditors and their reviewers, and space limitations may requirethat we include only those articles that we feel will be of greatestinterest to our readership.
Requests for reprints of articles abstracted must be addressed tothe author or publisher of the original material.
The reviewer of each article is identified by his or her initials at theend of each abstract. Guest reviewers are identified by their fullnames. Opinions expressed in an abstract belong to the abstracterand in no way reflect the position of Gems & Gemology or GIA.© 2006 Gemological Institute of America
g e m o l o g i c a l
ABSTRACTS‘06

GEMOLOGICAL ABSTRACTS GEMS & GEMOLOGY SUMMER 2006 193
corundum with UV-visible spectroscopy, the authordescribes four different types of color change, based ontrace-element content. Type 1, which changes from blue(daylight) to purple (incandescent and fluorescent light),contains chromium, iron, and titanium. Type 2, whichchanges from green (daylight) to orange (incandescent/fluo-rescent), contains only iron and titanium. The colorchange in type 3 sapphires, which involves green and red(daylight color is different from that seen with incandes-cent light, which is different from the color in fluorescentlight), is due to vanadium. Type 4, which shows bluishgreen (daylight) and reddish violet (incandescent/fluores-cent), contains chromium, iron, and nickel.
Almost all natural color-change corundum belongs totype 1, although type 2 is also found in natural corundum.Type 3 can be seen in corundum of various origins.Verneuil synthetics show either type 1 or type 3. Type 4occurs in hydrothermal synthetics.
A natural sapphire from Myanmar studied by theauthor showed purple, bluish green, and orangy yellowcolors. This sapphire also contained nickel, which isunusual in natural corundum. RT
Gem corals: Classification and spectroscopic features. V.Rolandi, A. Brajkovic [[email protected]], I.Adamo, R. Bocchio, and M. Landonio, AustralianGemmologist, Vol. 22, No. 3, 2005, pp. 285–297.
Several gem corals of the classes Hydrozoa and Anthozoaof the phylum Cnidaria were analyzed by FTIR andRaman spectroscopy. Such spectroscopic characterizationhas proved useful for determining the main features of themineral phases (calcite or aragonite) and of the organiccontents in each sample. Chromophore complexes belong-ing to the carotenoid family were detected. Coral zoologyis also discussed. RAH
Identification of an imitation of pearl by FTIR, EDXRFand SEM. T. L. Tan, T. S. Tay, S. K. Khairoman, andY. C. Low, Journal of Gemmology, Vol. 29, No. 5/6,2005, pp. 316–324.
In recent years, there has been an increase in the qualityand number of imitation pearls in the marketplace. Manyimitation pearls now show strong iridescence and thus arenot easily distinguished by visual observation. This articlereports on an investigation showing that EDXRF and FTIRspectroscopy, in combination with scanning electronmicroscopy (SEM), can lead to reliable identification ofboth imitation and cultured pearls. Reactions to UV radia-tion were also studied. The objects tested in this investiga-tion were five natural-color freshwater cultured pearls,four dyed freshwater cultured pearls, four imitation pearls,one bead representative of those commonly used in cul-tured pearls, and one bead used for imitation pearls.
EDXRF spectroscopy showed that both the naturallycolored and dyed cultured pearls, as well as the bead usedfor pearl culturing, contained C, O, and Ca, the compo-
nents of calcium carbonate (CaCO3). The EDXRF spectraof the imitation pearls showed only C and O, with peaksconsistent with the presence of polymers. No Ca was pre-sent. EDXRF data for the imitation pearl bead showed thepresence of O, Si, Al, and Na, with peaks indicating glass.
FTIR data for the naturally colored and dyed freshwa-ter cultured pearls, as well as the cultured pearl bead,showed typical absorption peaks for CaCO3. The FTIRdata for the imitation pearls and bead were very differentand easily distinguished from that of the cultured pearls.Spectra for the imitation pearls revealed polymeric mate-rial but no CaCO3 peaks. The imitation bead was opaqueto infrared below 2500 cm−1 and showed a broad bandcentered at 3510 cm−1, which indicated that it was madefrom a different material than the imitation pearl coating.
The SEM results also identified obvious differencesbetween the cultured and imitation pearls. Both the natu-rally colored and dyed cultured pearls showed layered,contoured, flake-like patterns consistent with crystallinelayers of CaCO3. In contrast, the pearl imitations showedsmall cubic particles, all of approximately the same size,randomly distributed over the whole surface. The densesuspension of these polymeric cubes created the irides-cent effect that mimicked the iridescence of nacre.
WMM
Identification of seawater cultured pearls with dyed nucle-us. L. Li and M. Yang, Journal of Gems and Gem-mology, Vol. 7, No. 2, 2005, pp. 7–8 [in Chinesewith English abstract].
Recently, saltwater cultured pearls with unusual colorshave been seen in the Chinese market. These productswere developed in 2002 by a company in Guangxi usingdyed nuclei and other techniques. In this article, theauthors, including one of China’s top pearl researchers(LL), report their preliminary results for the identificationof these saltwater cultured pearls.
Three loose cultured pearls (“rosy red,” orange, andbluish gray), one bluish gray pearl earring, and one “rosy”red pearl earring were collected for the investigation, andtheir undyed counterparts were used for comparison. Tocollect Raman spectra from the nuclei, the nacre was par-tially peeled off to expose the dyed surfaces. Microscopicobservation was also performed.
It was found that clear, parallel color bands from thedyed nucleus could be seen with strong transmitted light.The colored nuclei and colorless nacre layers could alsobe seen through the drill holes. The “rosy” red and bluishgray samples showed weak bluish white fluorescence toUV radiation. Raman spectra of the cultured pearl sur-faces were the same, regardless of whether the nucleiwere dyed or untreated. However, Raman spectra of theactual dyed nuclei (even when taken through the drillhole) displayed a strongly fluorescent background and sev-eral weak peaks in the 1600–1400 cm−1 range that arerelated to the dye materials.

194 GEMOLOGICAL ABSTRACTS GEMS & GEMOLOGY SUMMER 2006
The identification of these saltwater cultured pearlswith dyed nuclei can be made using both traditional andadvanced gemological techniques. TL
The study of phosphorus in seawater cultured pearlsusing FTIR. L. Wang, P. Zhou, Y. Liu, and Y. Tang,Spectroscopy and Spectral Analysis, Vol. 25, No. 6,2005, pp. 866–869 [in Chinese with Englishabstract].
The luster of saltwater cultured pearls is proportional totheir phosphorus content. However, due to P’s low con-centration, it is unclear where and in what state this ele-ment exists. In this article, the authors report their investi-gations of structural variations in saltwater cultured pearlsusing high-resolution FTIR spectroscopy, powder X-raydiffraction (XRD) analysis, and differential thermal analy-sis (DTA) techniques.
Cultured pearls of similar color and size were dividedby luster into several groups of 50. The nacre layers werecollected and crushed into powder; the powdered sampleswere further subdivided into several groups that wereheated to 160°C for varying durations (2 hours, 4 hours,etc.). Analyses by FTIR, XRD, and DTA were conductedbefore and after heating.
Several new IR absorption peaks (1083, 1049, 630, and600 cm−1) were seen in the heated samples. These peakswere not related to carbonates, and their intensitiesincreased with heating time. XRD results showed twonew diffraction peaks in the heated samples. Analysis ofthe FTIR and XRD results suggested that the P may bepresent in a hydroxyl apatite compound (called pahuite inthe abstract) in the pearls. TL
Study on relationship between luster and surface struc-ture of pearl. L. Cao, S. Guo, and L. Shi, Journal ofGems and Gemmology, Vol. 7, No. 3, 2005, pp.23–25 [in Chinese with English abstract].
The relationship between surface features and luster inpearls has been extensively investigated since the 1950s.Good luster generally results from uniform surface struc-tures; however, investigators are still trying to confirmthis relationship. In this article, the authors investigate thesurface features of Chinese cultured pearls.
Pink freshwater cultured pearls from Jiangsu andZhejiang Provinces and white saltwater cultured pearlsfrom Guangdong Province were observed with polarizedmicroscopy and scanning electron microscopy. The sam-ples were divided into three groups (poor, fair, and good)based on their luster.
There was a clear relationship between luster and sur-face features. SEM images showed spots, voids, and for-eign materials on the surface of the freshwater culturedpearls with poor luster; in addition, the aragonite crystalsin the nacre were not distributed uniformly and had anaverage size of about 4 µm. Samples with good luster hadaragonite crystals of about 3 µm that were uniformly
arranged in a layered structure. The freshwater culturedpearls with fair luster had characteristics that were inter-mediate to those described above. There was a similarrelationship between luster and surface structure in thesaltwater cultured pearls; however, the size of the arago-nite crystals was about 2.5 µm for samples showing goodluster.
The authors suggest that voids between the aragonitecrystals in the cultured pearls showing poor luster couldbe filled to enhance their luster. TL
DIAMONDSDiamond formation in metal-carbonate interactions. J.
Siebert [[email protected]], F. Guyot,and V. Malavergne, Earth and Planetary ScienceLetters, Vol. 229, No. 3–4, 2005, pp. 205–216.
While the earth’s inner core could contain the metal-car-bon alloy Fe3C, the carbon within the mantle is predomi-nantly composed of carbonates (and diamond). Thus, a bet-ter understanding of carbon alloy and carbonate chemistrywould aid the understanding of diamond formation withina young Earth. Reduced silicon alloyed with iron metalreacts chemically with FeCO3 (siderite) at pressures of10–25 GPa and temperatures of 1700–1800°C according to:2FeCO3 + 3Si(in metal) = 2Fe(in metal) + 3SiO2(stishovite) + 2C(diamond).The only source of C for diamond formation was the car-bonate phase. Prior research and modeling suggested car-bonate-containing fluids, not metals, were the likely car-bon source for diamond.
Thermodynamic modeling of this reaction suggeststhat under mantle conditions, no Si-bearing metal cancoexist with carbonates. Therefore, a high concentration ofsilicon would encourage diamond formation by reactionwith the carbonates under the kinetically favorable condi-tions of high temperature and pressure. RAH
Kalimantan diamond: Morphology, surface features andsome spectroscopic approaches. T. T. Sun [[email protected]], P. Wathanakul, W. Atichat, L.H. Moh, L. K. Kem, and R. Hermanto, AustralianGemmologist, Vol. 22, No. 5, 2005, pp. 186–195.
Alluvial diamonds are found around the Landak River inwestern Kalimantan (the Indonesian portion of Borneo), inthe Linhaisai minette in the headwaters of the Barito Riverin central Kalimantan, and in the Banjarmasin-Martapuraarea of southeastern Kalimantan. Mining activities dateback to 600 AD; fine blue, pink, and canary yellow dia-monds have been reported.
A 2002 visit to the Banjarmasin-Martapura area,which produces about 200 carats per month, is described.After a general outline of the mining and trading activi-ties, the authors report the characteristics of 14 roughgem-quality diamonds that ranged from 0.03 to 1.82 ctand were colorless to yellow and brown. The diamonds

GEMOLOGICAL ABSTRACTS GEMS & GEMOLOGY SUMMER 2006 195
showed variable crystal habits (octahedron, tetrahexahe-dron, dodecahedron, and macle), and surface features con-sisted of percussion scars and common black and brownradioactivity stains. They showed predominantly blueand green (and minor yellow) cathodoluminescence.Inclusions identified by Raman spectroscopy consisted ofdiamond, zircon, perovskite, and diopside. FTIR spectrashowed that both type IaA and type IaAB diamonds werepresent. RAH
Kimberlites of Zimbabwe: Abundance and composition.A. D. Khar’kiv, E. F Roman’ko, and B. M. Zubarev,Russian Geology and Geophysics, Vol. 46, No. 3,2005, pp. 318–327.
The authors provide data on several unusual kimberlitepipes in Zimbabwe, at Chingwisi and River Ranch in thesouth and Quest in the north. The Chingwisi pipe iscapped with a hard calcium carbonate horizon known ascalcrete; it formed within the upper few meters of the pipeand has a much different mineral composition (>90% car-bonates) than the underlying unaltered kimberlite. Thissuggests that such an outcrop of kimberlite could gounrecognized. However, indicator-mineral collectionrevealed many of the usual kimberlite pathfinders, includ-ing pyrope, picroilmenite, Cr-spinel, and clinopyroxene.Detailed chemical analysis of these indicators led theauthors to conclude that the Chingwisi pipe has the poten-tial to host diamonds and is mineralogically similar topipes in the Sakha area of Russia.
The two Quest pipes yielded unique indicator-mineralchemistry. Although both are diamondiferous, only oneG10 (high Cr) subcalcic garnet grain was collected, where-as abundant Na-bearing pyrope-almandine garnets werefound (up to 40% of the indicators). This unique garnetsignature was apparently used by Reunion Mining ofAustralia to search for more kimberlites in the region.The authors believe the garnets were derived from upper-mantle eclogites that were incorporated into the kimber-lite magma. Only generic information is provided for theRiver Ranch pipe, which hosts Zimbabwe’s single activediamond mine.
Although Zimbabwe has a large Archean-aged craton(where Clifford’s Rule, simplified, suggests diamond-bear-ing kimberlites may be found), all the diamondiferouspipes studied by the authors are located outside of this cra-ton. Thus, the data and conclusions made by the authorswill allow scientists and explorers to modify their theorieson diamond formation and emplacement. KAM
Mineral inclusions in diamonds from the Panda kimber-lite, Slave Province, Canada. R. Tappert [[email protected]], T. Stachel, J. W. Harris, N. Shimizu,and G. P. Brey, European Journal of Mineralogy,Vol. 17, No. 3, 2005, pp. 423–440.
The mineral inclusions in 90 diamonds from the Pandakimberlite (Ekati mine, Northwest Territories, Canada)
were chemically analyzed using electron microprobe andsecondary ion mass spectrometry techniques, and nitrogenaggregation characteristics of the host diamonds weremeasured by IR spectroscopy. The Panda diamonds arederived principally from peridotitic sources (85%), with aminor content of eclogitic diamonds (10%). Ferropericlase-bearing diamonds (5%) contain combinations of this min-eral with olivine, with Mg-Al spinel + olivine, or with apure silica phase. The chemical characteristics of theseinclusions indicate a lithospheric origin from ferroperi-clase-bearing dunites; however, ferropericlase coexistingwith CaSiO3 (probably originally Ca-perovskite) is regard-ed as evidence for a lower-mantle origin.
Major-element compositions indicate that the peri-dotitic diamonds formed in a moderately depleted envi-ronment. Inclusion geothermobarometry indicates forma-tion of the peridotitic diamonds in the temperature range1100–1250°C, following a geothermal gradient of 40–42mW/m2. The nitrogen contents in Panda diamonds varystrongly from below detection (<10 ppm) to 2700 atomicppm. Taking the early Achaean Re-Os isochron date forsulfide inclusions in Panda diamonds at face value, thelow aggregation states of undeformed diamonds may indi-cate mantle residence at relatively low temperatures(<1100°C); if this is the case, diamond formation beneaththe central Slave Province may be restricted to short-livedand localized thermal events. An apparent increase ingeothermal gradient with depth in the lithospheric man-tle beneath the central Slave Province during the time ofkimberlite eruptions (Upper Cretaceous to Eocene) mayreflect transient heating of the deep lithosphere duringmelt infiltration. RAH
GEM LOCALITIESBasalt petrology, zircon ages and sapphire genesis from
Dak Nong, southern Vietnam. V. Garnier[[email protected]], D. Ohnen-stetter, G. Giuliani, A. E. Fallick, T. Phan Trong, V.Hoáng Quang, L. Pham Van, and D. Schwarz,Mineralogical Magazine, Vol. 69, No. 1, 2005, pp.21–38.
Sapphire deposits associated with basalt can be foundthroughout the world. Blue, green, yellow, and colorlesssapphires are recovered from the Dak Nong mining dis-trict in Dak Lak Province, southern Vietnam. The miningtargets are Quaternary and Upper Pleistocene eluvial andalluvial placers derived from the several-hundred-meters-thick basalt flows. The 23,000 km2 basalt field is made upof a tholeiitic suite without any xenocrysts and an alkalinesuite with mantle and lower-crustal xenocrysts. The sap-phire xenocrysts contain Fe (0.43–1.26 wt.%), Cr (33–1582ppm), Ti (35–1080 ppm), Ga (149–308 ppm), and V(28–438 ppm), and are poor in Zn and Mg. Their oxygenisotope (δ18O) composition ranges from 6.0 to 6.9‰, which
196 GEMOLOGICAL ABSTRACTS GEMS & GEMOLOGY SUMMER 2006
is not in equilibrium with the basalt values of 5.0–5.7‰.The chemical composition and O-isotope data from theanalyzed sapphires, along with the presence of mantlexenoliths, suggest that the sapphires crystallized deepwithin the earth and not from the erupting basalt. Theδ
18O data of the corundum show that the crystals wereformed in a magma chamber at the crust-mantle boundaryand that the magma was contaminated by crustal materi-al. The U-Pb dating of zircons recovered from the sapphire-bearing placers indicates that there were two eruptiveevents occurring at roughly 6.5 and 1 million years ago.The dates for these basaltic eruptive episodes are in agree-ment with published data on other regional sapphire-bear-ing basalt fields. EAF
Characteristics of cathodoluminescence spectra of jadeitejades from Burma. X. Yuan, L. Qi, and S. Zhang,Journal of Gems and Gemmology, Vol. 7, No. 2,2005, pp. 9–13 [in Chinese with English abstract].
Different types of jadeite jade display different characteris-tic cathodoluminescence (CL) spectra depending on theircomposition (e.g., the presence of color-causing impuritiessuch as Cr3+, Fe3+, and Mn3+). In this article, the authorsinvestigated 97 jadeite samples of varying colors using aspecially developed CL spectroscope.
The BY-1 cathodoluminescence spectroscope featuresan interconnected UV-Vis spectrophotometer (OceanOptics USB-2000) and a digital camera. The jadeite sam-ples were divided into five groups by color (white, purple,green, yellow-brown, and grayish green). Standard gemo-logical properties and IR spectra of all samples wereobtained before testing with the BY-1 instrument.
The CL colors and the corresponding spectral peaksvaried depending on the jadeite color. White jadeite dis-played dark blue, light purple, or greenish yellow CL, withpeaks at either 370 or 554 nm. Pinkish purple and purplejadeite showed bright purplish red to reddish purple CL,with peaks located at 370 nm (dominant) and 680 nm (sub-ordinate). Bluish purple jadeite displayed bluish purple CL;the peaks were at 370 nm (subordinate) and 508 nm (domi-nant). Light green to green jadeite showed bright green toyellowish green CL, with peaks at 554 and 760 nm, whiledark green jadeite usually displayed dark red CL and peaksat 693 nm (subordinate) and 760 nm (dominant).
Differences in CL features between natural and treat-ed jadeites were also seen, such as the presence of poly-mer in B-jade. TL
Exfiltrative mineralization in the Bukantau ore district(Central Kyzyl Kum region, Uzbekistan). V. G.Pechenkin [[email protected]] and I. G.Pechenkin, Lithology and Mineral Resources, Vol.40, No. 5, 2005, pp. 462–471.
The discovery of uranium deposits in the central KyzylKum region of Uzbekistan led researchers to study the ore-bearing potential of young sedimentary sequences. Uplift
roughly 1.6 million years ago exposed Paleozoic basinalstructures along rejuvenated faults. This movementallowed for the interaction of various ascending fluidswith surface-related processes. The edges of the upliftedblocks were marked by the formation of erosional win-dows that served as discharge centers for ore-bearing solu-tions. The formation of manganese ore bodies and gemdeposits occurred near these windows at different geo-chemical barriers. As portions of the Paleozoic fault blockswere uplifted, they underwent extensive fracturing anddecompaction. Then, as metalliferous fluids derived fromthe sedimentary cover layers moved toward the erosionalwindows, they encountered a newly formed oxygenatedbarrier which caused the precipitation of manganeseoxides. When this same fluid was drawn into the decom-pacted basement structures, turquoise was deposited onfault surfaces at the reductive (sulfide) geochemical barrier.Thus, turquoise and manganese deposits are vertically sep-arated in cross section although they were formed fromthe same ore-bearing solutions during a single geologicprocess. Throughout the section, opal was deposited onfault surfaces within zones of the most intense fracturingand folding. The slightly basic surface fluids had a relative-ly high Si solubility, so when the fluid encountered deeperacidic fluids the amorphous silica precipitated. Only themost recent tectonically active areas in the north-centralportions of the district contain the complete sequence ofturquoise, opal, and manganese oxides. EAF
Gemstone resources of China. C. M. Ou Yang [[email protected]], Australian Gemmologist, Vol.22, No. 4, 2005, pp. 349–359.
The occurrence of gemstones in China is reviewed afterbrief notes on the geology of this large area. Two diamond-bearing kimberlite pipes in the Wafangdian district ofLiaoning Province are yielding 80,000–90,000 carats/year(30–40% gem quality); 12 kimberlite pipes in Mengyin,Shangdong Province, produce 50,000 carats/year (10–15%gem quality). Alluvial deposits in Hunan Province yield20,000–30,000 carats/year (60–65% gem quality, but ofsmall size). Chinese sapphire deposits are found mainly inalkaline basalts and derived alluvium, and are widely dis-tributed over 20 provinces. Ruby (mostly cabochon quali-ty) is found in impure marbles in Yunnan Province.Emeralds are associated with Precambrian pegmatites andgreisen in the Wenshan district of southeastern YunnanProvince. Both transparent and chatoyant aquamarine isfound mainly in the Altai pegmatite area of XinjiangProvince. Details are also given for gem-quality tourma-line, citrine, and amethyst, mainly from the AltaiMountains; gem-quality pyrope from Cenozoic alkalibasalts of eastern China; and peridot from Tertiary alka-line basalts in Zhangjiangkou County, Hebei Province,and in Jiaohe County, Jilin Province. Occurrences ofnephrite and bowenite (antigorite serpentine) are alsodescribed. RAH

GEMOLOGICAL ABSTRACTS GEMS & GEMOLOGY SUMMER 2006 197
The Italian island of Elba: A mineralogical jewel in theTuscan archipelago. F. Pezzotta, extraLapis English,No. 8, 2005.
Like the other issues in this series, this volume is anEnglish translation of previously published work fromextraLapis (in this case, No. 20, Ensel Elba DieUrlaubsinsel der Mineralogie, 2002), updated with somenew information.
The work begins with a review of the island’s miner-alogical history. Elba was a source of copper and iron inantiquity. Scientists began studying Elba’s mineralogyduring the 18th century, and European mineral collectorswere soon drawn to the island’s many diverse localities.More than 170 minerals have been identified on Elba (itis the type locality for nine of these), and specimens fromElba form an important part of many notable mineralcollections. The island is particularly known for speci-mens of hematite, pyrite, spessartite, and of course,elbaite tourmaline.
A short summary of Elba’s geology follows. The vol-ume then reviews in detail all of Elba’s major gem andmineral localities, including classic ones such as theMonte Capanne pegmatites and the historic ore deposits,as well as some lesser-known sites. Capsule spotlights ofnoted collectors are provided, as are high-quality pho-tographs of important specimens.
Also included are sections on visiting Elba for collect-ing trips, suggestions for prospecting certain localities, abrief review of Elba’s snakes (some of which are ven-omous), and a concluding commentary that offers a tour-maline-related explanation for an element of the Greekmyth of Jason and the Argonauts. TWO
Jazidas minerais: Ametistas [Mineral deposits: Amethysts].Diamond News, Vol. 6, No. 20, 2005, pp. 35–40 [inPortuguese].
This article gives a comprehensive description of amethystdeposits in Brazil’s Rio Grande do Sul State. Amethyst andother quartz varieties formed at approximately 50°C with-in lava deposits covering large areas of this state about 130million years ago. Amethyst is recovered via open-pit andunderground mining, and at present there are 374 miningoperations in eight municipalities of Rio Grande do Sul,more than half of which are in Ametista do Sul. Geodes of200–300 kg are common, and they can attain sizes up to3,000 kg and 3 m3. Some of the amethyst is heat treated at450–475°C to produce citrine. Amethyst production in2000 was 235 tonnes per month; 80% is exported, mainlyto the U.S., Japan, and Germany, with 97% of the materialexported as rough. Geodes must yield at least 25% cut-table crystals to be worth processing for facet rough, whichis approximately 2% of the overall weight of the geode andabout 0.5% yield after cutting. Amethyst and citrine repre-sent 12.5% of Brazil’s entire export of gem rough and10.6% of cut gems. The article explains the classificationcriteria for the geodes and cut stones, and is illustrated
with a geologic map of Rio Grande do Sul and photos ofmines and samples. RT
Musgravites from Sri Lanka. K. Schmetzer [[email protected]], L. Kiefert, H.-J. Bernhardt, and M.Burford, Neues Jahrbuch für Mineralogie, Abhand-lungen, Vol. 181, No. 3, 2005, pp. 265–270.
This article presents the physical and chemical propertiesof four faceted musgravites (BeMg2Al6O12) that are mostprobably from Sri Lanka; this represents the first data forthis rare species originating from the numerous secondarydeposits of this island. The musgravites were identified byRaman spectroscopy and electron-microprobe analysis.Their refractive indices and densities were determined andrelated to the contents of transition metals, especially Feand Zn. Mineral and multiphase inclusions indicate theformation of these samples in different geologic environ-ments. A musgravite crystal containing spinel exsolutionlamellae was possibly formed in high-grade metamorphicrocks, whereas two samples with graphite and magnesiteinclusions may have originated in magnesian skarns.
RAH
“Paraiba-Turmaline” aus Quintos de Baixo, Rio Grandedo Norte, Brasilien. C. C. Milisenda, Gemmologie:Zeitschrift der Deutschen Gemmologischen Gesell-schaft, Vol. 54, No. 2–3, 2005, pp. 73–84 [inGerman with English abstract].
Paraíba tourmalines were first produced from pegmatitesat São José da Batalha near Salgadinho, Paraíba State,Brazil. Today they are also found in the Quintos de Baixoand Boqueirão mines near Parelhas in the neighboringstate of Rio Grande do Norte. At all three mines, the peg-matites intruded quartzites of the Ecuador Formation.
The author describes the Quintos de Baixo mine,which began as a beryl mine in 1976. Mechanized under-ground mining for tourmaline started in 1996.Tourmaline is hand-picked and mostly occurs as crystalfragments averaging approximately 10 g. They are blue,green, bluish green, and red-violet, as well as color-zoned.The largest cut stone to date is “turquoise” blue andweighs 15 ct.
Microprobe analyses of 12 samples showed elbaitecomposition, with copper and manganese as the mostimportant trace elements (CuO: 0.32–1.96 wt.%; MnO:0.11–2.53 wt.%). Microscopic examination showed inclu-sions typical for tourmaline. The author points out that,like tourmaline from other locations, these stones can becolor enhanced by gentle heating to approximately 600°C.
RT
The pegmatitic gem deposits of Molo (Momeik) and Sakhan-gyi (Mogok). H. Kyi [[email protected]],T. Themelis, and K. Thu, Australian Gemmologist,Vol. 23, No. 7, 2005, pp. 303–309.
Molo, about 51 km northeast of Momeik in Myanmar’s

198 GEMOLOGICAL ABSTRACTS GEMS & GEMOLOGY SUMMER 2006
Shan State, is a new source of rare gems and minerals,including phenakite, petalite, hambergite, Cs-rich mor-ganite, and pollucite. Botryoidal-type tourmalines of vari-ous colors, aquamarine, topaz, and lepidolite also occur.All of these minerals are recovered from alluvial depositsand pegmatitic dikes that intrude the peridotite countryrock.
The pegmatite at Sakhan-gyi is about 16 km west ofMogok in the Mandalay Division, and is a source of aqua-marine, goshenite, topaz, and quartz. The pegmatite isabout 15 million years old and intruded the Kabaing gran-ite (20–16 Ma). Brief details on these pegmatites and theirminerals are presented. RAH
Rubellite and other gemstones from Momeik township,northern Shan State, Myanmar. T. Hlaing and A. K.Win, Australian Gemmologist, Vol. 22, No. 5,2005, pp. 215–218.
Colored tourmalines occur as euhedral gem-quality crystals,mushroom-shaped aggregates, and botryoidal masses in peg-matites near Molo village. Associated minerals with gempotential are aquamarine, trapiche morganite (characterizedby the presence of a fixed six-rayed star), and hambergite;other associated minerals are quartz, orthoclase, lepidolite,and petalite. The tourmalines range from black schorl togreen and pink fibrous tourmalines. The pink fibrous tour-malines have ne = 1.630, no = 1.650, S.G. = 2.84–3.06, andare Mn-bearing (average 6.58 wt.% MnO). Hambergiteforms as colorless prismatic crystals with n
α= 1.557, n
γ=
1.630, S.G. = 2.33, and hardness = 71⁄2. RAH
Trapiche of Myanmar. K. K. Win, Australian Gem-mologist, Vol. 22, No. 7, 2005, pp. 269–270.
Myanmar is the source of a range of gems that display adistinctive spoke-like star, often referred to as a trapiche.Representative examples are illustrated, including sap-phire, ruby, green tourmaline, aquamarine, morganite, andquartz. Three origins are suggested for the several types oftrapiche gems: color-inducing trace elements, inclusions ofother minerals, or intergrowths of the same mineral of dif-ferent color or orientation. RAH
INSTRUMENTS AND TECHNIQUESComplementary use of PIXE-alpha and XRF portable sys-
tems for the non-destructive and in situ characteri-zation of gemstones in museums. L. Pappalardo[[email protected]], A. G. Karydas, N. Kotzamani,G. Pappalardo, F. P. Romano, and Ch. Zarkadas,Nuclear Instruments and Methods in PhysicsResearch B, Vol. 239, 2005, pp. 114–121.
The authors used a combination of two portable, custom-built chemical analysis systems to examine three red gem-stones set in Hellenistic (4th century BC to 1st centuryAD) gold jewelry at the Benaki Museum in Athens,
Greece. The instruments consisted of a PIXE-alpha parti-cle spectrometer with a 210Po source for analyzing lightelements (Na to Zn), and an XRF spectrometer with a Rh-anode X-ray tube source for detecting heavier trace ele-ments (Cr and Y). Overall sensitivities were in the 0.2–0.3wt.% range for each element. Both systems were calibrat-ed against known standards, and the two types of analyseswere combined to get overall chemical compositions ofthe red gems.
The gems were found to be garnets. Two had composi-tions consistent with almandine from an unknowndeposit in India, while the third was an Fe- and Ca-bear-ing pyrope consistent with a Sri Lankan origin.Abstracter’s note: The captions “SiK” and “AlK” appearto have been reversed in figure 6 of the article.
Mary L. Johnson
Practical application for measuring gemstone dispersionon the refractometer. T. Linton, Australian Gem-mologist, Vol. 22, No. 4, 2005, pp. 330–344.
The low-dispersion barium glass hemicylinder refractome-ter prism of the Eickhorst SR/XS refractometer allows mea-surement of refractive index in deep blue light (below 500nm). A summary is given of two relevant papers that werepreviously published. The combination of these measuringtechniques and extrapolation of a wavelength dispersioncurve using Sellmeier’s linear conversion permits extrapo-lation of refractive indices at the B (686.7 nm) and G (430.7nm) Fraunhofer lines. Previous B-to-G lists of the disper-sion of gemstones are inaccurate and provide conflictingdata. A new list of values is presented for the dispersion of217 gem materials, measured at the C-F (656.3–486.1 nm)interval. Measurement of dispersion with the gemologist’srefractometer produces apparent dispersion, but with theuse of a technique for subtracting apparent dispersion fromthe sum of true + apparent dispersion, this value can beconverted to true dispersion. RAH
Probing diamonds with ions. B. J. Griffin [[email protected]] and R. Stern, Rough Diamond Review, No.8, 2005, pp. 42–44.
A new analytical technique called nanoSIMS holds somepromise for diamond research. This higher-resolution ver-sion of SIMS (secondary ion mass spectrometry) can pro-vide scientists with chemical information on the nanome-ter level, allowing them to better study internal diamondgrowth structures.
The basic principle of SIMS is to “sputter” a samplewith a beam of ions, and as this primary beam is very fine-ly controlled, it can scan across a sample surface. Chargedparticles (secondary ions) emitted from the sample are col-lected by a mass spectrometer, which can detect concen-trations of elements down to the ppb (parts per billion)range. NanoSIMS uses oxygen and cesium ion beams atresolutions of up to 100 and 25 nm, respectively. Althoughminimally destructive, it can ablate successive nanometer

GEMOLOGICAL ABSTRACTS GEMS & GEMOLOGY SUMMER 2006 199
layers of material from sample surfaces, providing depthprofiles of elements. The ability of nanoSIMS to providehigh-resolution, high-sensitivity chemical data in threespatial dimensions makes this technique quite promising,especially with respect to diamonds.
NanoSIMS analysis of nitrogen in diamond is shownto be well correlated to cathodoluminescence data. Bothtechniques indicate zoning where nitrogen content differsfrom one region to another. NanoSIMS may be particular-ly useful for exploring the chemical and isotopic composi-tions of these growth structures due to its high resolution,and it reveals finer details than CL imagery. It is hopedthat quantifying chemical data on the nanometer levelwill lead to insights into source classification, therebyallowing individual diamonds to be traced back to theirpoint of geologic origin.
DMK
Quantitative trace-element analysis of diamond by laserablation inductively coupled plasma mass spec-trometry. S. Rege [[email protected]], S. Jackson,W. L. Griffin, R. M. Davies, N. J. Pearson, and S. Y.O’Reilly, Journal of Analytical Atomic Spec-trometry, Vol. 20, No. 7, 2005, pp. 601–611.
LA-ICP-MS was used to quantitatively measure 41 traceelements in two fibrous diamonds from Botswana’sJwaneng mine that were previously analyzed by instru-mental neutron activation analysis (INAA) and particle-induced X-ray emission (PIXE). A range of instrumentalconditions showed that a 266 nm UV laser at 10 Hz pro-vided the best sensitivity, and that synthetic oil and adoped cellulose were the most suitable external standards.Typical detection limits were 5–20 ppb for the rare-earthelements and <500 ppb for the transition elements; Naand Fe had higher detection limits (2–3 ppm). Detailedanalytical results are presented. The trace-element pat-terns obtained by this technique may be used for the char-acterization of diamonds in genetic studies. RAH
Use of IR-spectroscopy and diffraction to discriminatebetween natural, synthetic and treated turquoise, andits imitations. A. Pavese [[email protected]],L. Prosperi, and M. Dapiaggi, Australian Gem-mologist, Vol. 24, No. 4, 2005, pp. 366–371.
An overview is given on the use of IR spectroscopy, com-bined in some cases with X-ray diffraction, for determiningthe nature of turquoise, whether natural, synthetic, treat-ed, or imitation. A total of 94 samples (32 natural, 12 syn-thetic, 16 treated, and 34 imitations) were analyzed by IRspectroscopy in reflectance mode; some treated turquoisespecimens were also examined in transmission mode.Differences in the spectra between natural, treated, andsynthetic turquoise were observed. X-ray diffraction wasused to resolve ambiguities in identifying some turquoiseimitations, and was particularly useful in the precise iden-tification of their constituent phases. RAH
Use and misuse of optical mineralogy constants in gemmol-ogy. D. B. Sturman [[email protected]], AustralianGemmologist, Vol. 22, No. 2, 2005, pp. 234–243.
Dangers inherent in the direct transfer of optical data andconcepts from mineralogy to gemology are highlighted;these can give rise to confusion and misunderstandings. Inparticular, the dispersion coefficient is not a reliable indi-cator of “fire” in faceted gemstones. The author suggeststhat faceted diamonds show strong “fire” not because ofthe large dispersion of diamond, but because of other fac-tors not yet well understood. Refractive index plays anequally important role. Factors contributing to doublingare described, and diagrams are presented for the estima-tion of the doubling effect in gemstones. RAH
X-ray luminescence, a valuable test in pearl identifica-tion. H. A. Hänni [[email protected]], L. Kiefert, andP. Giese, Journal of Gemmology, Vol. 29, No. 5/6,2005, pp. 325–329.
The majority of the world’s natural pearls come from salt-water oysters. Today, increasing numbers of beadlessfreshwater cultured pearls are entering the market. Tracesof manganese (Mn) found in the nacre of freshwater cul-tured pearls and the shells of the mollusks that producethem cause them to luminesce to X-rays. In contrast, thenacre of saltwater-borne samples is inert to X-rays. By useof a sensitive camera, this visible luminescence can berecorded and displayed on a monitor.
A difficulty in using this technique as a means of sepa-ration arises because Japanese Akoya cultured pearls andSouth Sea cultured pearls (both from saltwater) use fresh-water bead nuclei, which contain Mn and luminesce to X-rays. The thick nacre common to South Sea culturedpearls obscures the luminescence of the bead nucleus, soit is typically not seen on exposure to X-rays. However,the thinner nacre on Akoya cultured pearls allows theluminescence from the freshwater beads to shine through.Another concern is the presence of dye or natural pigmentin the nacre, which may inhibit the luminescence reac-tion. Therefore, this article suggests that X-ray lumines-cence only be used as an additional test (after X-radiogra-phy) to help separate natural saltwater pearls from bead-less freshwater cultured pearls. WMM
JEWELRY HISTORYThe history of the Ekaterinburg faceting factory. N.
Moukhina, Platinum, Vol. 1, No. 16, 2005, pp.62–65 [in Russian].
The Ekaterinburg stone cutting factory was established in1726, only three years after the founding of the city,which later became the center of the Urals mining andmetallurgy industries. Initially, the factory made marblefacades for buildings in St. Petersburg. In the mid-18thcentury, however, it began specializing in faceting gems
200 GEMOLOGICAL ABSTRACTS GEMS & GEMOLOGY SUMMER 2006
and carving decorative stones (e.g., jasper, agate,rhodonite, and quartzite). The craftsmen excelled in“Russian mosaic”—constructing images from smallpieces of malachite and jasper. The factory also operated aschool for cutting, polishing, faceting, engraving, andmaking mosaics, and the best pupils were sent to St.Petersburg for additional training.
Most of the artifacts produced in Ekaterinburg wereitems used to decorate the palaces of the emperors andother nobility. The loveliest materials were made of gray-ish green Kalkan jasper and serpentine. The articleincludes photographs of the factory’s museum of engrav-ing and jewelry art pieces, such as vases, plates, architec-tural details, and stone stamps. Notable among these is amosaic map of France that received the Grand Prize at the1900 Paris Exhibition. This map was presented to Franceand exhibited in the Louvre for many years. BMS
Ural gemmas. T. Parnyuk, Platinum, Vol. 1, No. 16, 2005,pp. 46–49 [in Russian].
Many gem carvings were produced by the Ekaterinburgstone cutting factory between 1796 and 1847, but only atthe end of the 20th century was this unique art restored. Aspecial feature of these works is the wide spectrum of mate-rials used: jasper, chalcedony, and agate, among others.Examples of articles made by I. Golubev, I. Nasibulin, G.Ponomarev, and A. Zhukov are described; some are shownin photographs. There are faces of well-known writers andwomen, fantastic bird figures, landscapes, flower symbols,and folk-tale subjects. The skill of the engravers is apparentthrough their use of the texture, color, and translucent prop-erties of the stones. Artifacts of Ural masters are very popu-lar at Russian and international expositions. BMS
PRECIOUS METALSGiving gold jewelry and coins as gifts: The interplay of
utilitarianism and symbolism. B. Ertimur and O.Sandikei, Advances in Consumer Research, Vol. 32,2005, pp. 322–327.
Turkey is the world’s fifth largest market for gold jewelry,and gold jewelry and coins serve a number of culturalfunctions. They are important for gifts that mark certainrites of passage, as well as a form of women’s empower-ment and safeguard against misfortune. This article con-tains interviews with Turkish consumers discussing thereasons they purchased gold coins and jewelry. Theauthors conclude that gold is a preferred gift for many rea-sons: investment, adornment, tradition, confidence that itwill be well-received, and a statement of a bond betweengiver and receiver. RS
Gold—The emotional metal. J. Cross [[email protected]], Applied Earth Science, Vol. 114, 2005, pp.B101–107.
Gold differs from other commodities in that the vastmajority of the metal mined over the centuries remainsavailable in the form of existing bars, coins, and jewelry,and it attracts investors who have an emotional belief init, beyond economic fundamentals. In addition, gold servesas an unofficial currency in unstable areas.
This article examines how these factors affect threemajor components of the gold market: official sales,adornment jewelry, and investment. In the first compo-nent, governments hold gold as a hedge even though itearns no interest or return. Nevertheless, in 1999 nationsof the European Union agreed to sell portions of their offi-cial holdings on an orderly basis (approximately 2,000tonnes from a total of ~16,000 tonnes during 1999–2004).In the jewelry sector, gold adornment items continue tobe important in the Middle East and India. In the West,however, it goes through different periods of fashion. Inthe U.S., yellow gold is losing market share to other con-sumer items, and in the United Kingdom, it has beenequated with crass popular culture. There are difficultieswith the investment market as well, because there are noeasy ways to invest directly in the metal. RS
SYNTHETICS AND SIMULANTSCharacteristics of large-sized ruby crystal grown by tem-
perature gradient technique. C. Song [[email protected]], Y. Hang, C. Xia, J. Xu, and G.Zhou, Optical Materials, Vol. 27, No. 4, 2005, pp.699–703.
This article describes the use of the temperature gradienttechnique (TGT) to grow a large ruby crystal. The initialexperiment produced a 75 × 45 mm boule. The bulk of theas-grown crystal, 60 × 30 mm, was of good quality with min-imal inclusions, showed only Cr3+ (no Cr2+ or Cr4+ byprod-ucts), and displayed a high degree of crystalline symmetry.
Based on their previous work and the current study,the authors believe the inclusions are gas bubbles and for-eign impurities. Concluding remarks suggest that larger,higher-purity crystals can be achieved with the TGT pro-cess by implementing meticulous procedures for preparingthe ingredient powders (Al2O3 and Cr3O2) and improvedcontrol of the thermal field during crystal growth.
SW
Growth of large high-quality type-IIa diamond crystals.X.-C. Wang, H.-A. Ma, C.-Y. Zang, Y. Tian, S.-S. Li,and X.-P. Jia [[email protected]], Chinese PhysicsLetters, Vol. 22, No. 7, 2005, pp. 1800–1802.
Colorless high-quality type IIa synthetic diamond crystalsup to 4 mm in size have been grown by the temperature-gradient technique at pressures of 5.5 GPa and tempera-tures of 1200–1300°C. The solvent metal is an Fe-Co-Nialloy. Ti is added to the solvent metal to reduce the N con-tent in the synthetic diamond, and Cu is added to inhibit

GEMOLOGICAL ABSTRACTS GEMS & GEMOLOGY SUMMER 2006 201
the formation of titanium carbide inclusions. Growthrates are about 1.1–1.6 mg/h. Within the growth chamber,a modified ring-shaped carbon source is used, with theopening in the ring positioned directly above the growingcrystal. With this configuration, titanium carbide particlesthat form in the molten alloy during a growth run are ableto float upward and away from the growing crystal, and arethereby less likely to become entrapped within the syn-thetic diamond as dark metallic inclusions. JES
Synthesizing single-crystal diamond by repetition of highrate homoepitaxial growth by microwave plasmaCVD. Y. Mokuno [[email protected]], A.Chayahara, Y. Soda, Y. Horino, and N. Fujimori,Diamond & Related Materials, Vol. 14, No. 11/12,2005, pp. 1743–1746.
Many promising technological applications have promptedongoing research into optimizing the size, quality, andgrowth rate of single-crystal synthetic diamond producedby the chemical vapor deposition (CVD) method. In thisarticle, three developments are summarized. Use of an“enclosed” substrate holder resulted in the growth of tabu-lar synthetic diamond crystals with smooth and flat sur-faces. With this apparatus, a 4.65 ct, 1-cm-thick (~5 × 5 ×10 mm) single-crystal synthetic diamond was produced by24 repetitive stages of crystallization over a total growthtime of about 150 hours. Some crystals grown in this waywere then polished with six cube faces. Further repetitivegrowth stages on several of these faces resulted in a three-dimensional enlargement of the synthetic diamond.
JES
TREATMENTSBeryllium-treatment. A. Peretti, D. Günther, and A.-L.
Graber, Contributions to Gemology, No. 4, 2005.The fourth installment of Contributions to Gemologycompiles previously published research on Be diffusiontreatment of corundum from the first two issues, withupdates and corrections, and adds new photomicrographsof corundum inclusions.
In the first section, using a variety of advanced methods(SEM, EDXRF, LA-ICP-MS, CL), as well as gemological andspectroscopic testing, the authors examine a wide varietyof natural, synthetic, untreated, and treated (before andafter) corundum. Although the originally published (2002)version of this report attributed the induced color changesto “internal movement of color centers,” the corrections inthis edition clearly establish the role of Be diffusion.
In the second section, the authors use LA-ICP-MSchemical analyses to further examine the mechanisms ofthe color changes induced by Be diffusion. In contrast toother published reports, they correlate the formation oforange color centers to the Ti/(Mg+Be) ratio; the presenceof Si was not found to be related. Orange color was
induced when Ti/(Mg+Be)>1. The role of other trace ele-ments in the formation of color centers was limited ornonexistent.
The new material in the third section of this issueconsists of several pages of high-quality inclusion pho-tomicrographs (untreated and treated corundum) withexplanatory captions. TWO
High-temperature annealing of optical centers in type-Idiamond. A. T. Collins [[email protected]], A.Connor, C.-H. Ly, A. Shareef, and P. M. Spear,Journal of Applied Physics, Vol. 97, 2005, pp.083517-1–083517-10.
The widespread availability of commercial high pressure,high temperature (HPHT) services for changing the color ofbrown gem diamonds to colorless or other fancy colors hasled to the need for a better understanding of the opticaldefect changes that occur during annealing. Several type Ianatural diamonds and type Ib synthetic diamonds wereirradiated with neutrons or 2 MeV electrons, annealed at800°C, then subsequently either annealed at 1000°C–1750°C and ambient pressure or subjected to HPHT condi-tions (2300°C, 5 GPa). One type IaA and one type IaB natu-ral diamond, both electron irradiated, were annealed at33–50°C intervals from 800°C–1600°C to study changes inthe H1b and H1c centers. For reference, one natural type Iabrown diamond was annealed at 1600°C–1750°C and sev-eral others were subjected to HPHT conditions. FTIR andVis-NIR absorption spectra (room temperature and 77 K)and cathodoluminescence (77 K) measurements were col-lected before and after each heating step.
Annealing of type IaA and IaB irradiated diamonds to1600°C revealed that the H4 defect was destroyed by con-version to H3, confirming that H3 is more stable than H4and explaining the absence of H4 in most natural dia-monds that have undergone long-term annealing in theearth. In addition, carefully controlled interval heatingdefined the temperature-dependent sequence of creationand destruction of the 594 nm, H1b, H1c, H2, H3, and H4centers. Annealing of irradiated type Ib synthetic dia-monds revealed the creation of both H3 and, surprisingly,N3 centers, as well as the increased development of Ni-Ncomplexes. Annealing of the reference natural brown dia-monds resulted in the complete removal of H4 defectsand the 491 nm CL line related to plastic deformation, aswell as the development of H3 and H2 centers. The easewith which the 491 nm line was annealed out and its dis-tinct presence in natural brown diamonds suggests thatplastic deformation occurred very late in their history,most likely during eruption to the surface. Finally, thedata indicate that H2 and H3 centers are destroyed byHPHT treatment of dislocation-free diamonds, but theirintensities are dramatically increased during HPHTannealing of natural brown diamonds (with abundant dis-locations). This suggests a dynamic, competitive processwhere the final diamond color depends on a combination
202 GEMOLOGICAL ABSTRACTS GEMS & GEMOLOGY SUMMER 2006
of annealing temperature, duration, and the defects pre-sent in the diamond before treatment. CMB
Scale determination of wax and macromolecule polymer-filled jadeite jade. L. Qi, X. Yuan, G. Peng, and G.Yang, Journal of Gems and Gemmology, Vol. 7, No.3, 2005, pp. 1–6 [in Chinese with English abstract].
Jadeite can be enhanced by a variety of processes, such aspure bleaching, corrosion by alkalis/acids, waxing, andpolymer filling. Treated jadeite can be identified by micro-scopic observation and FTIR spectroscopy. However, therelationships among these enhancement processes areunclear, and there has been no detailed investigation of thequantity of wax- and polymer-filling materials in treatedjadeite.
Enhancement experiments were mainly performed byone author (GY) at Xiangfa Jade Ltd Co., Foshan, China. Asolution of oxalic acid and H2O2 with diluted HCl wasused at 115°C for the pure bleaching treatment, followedby waxing. In the polymer filling treatment, samples werefirst placed in a solution of H3PO4 and H2O2 or HNO3 andH2O2, followed by a NaOH solution to precipitate solidparticles into the voids created by the corrosion process,and finally were subjected to polymer filling. Various treat-ed jadeite samples were cut into ~1 cm3 pieces and dried at210°C for 5 hours before FTIR spectra were obtained.
In the bleached and waxed samples, the intensity of theC-H stretching bands at 2919 and 2850 cm−1 increased withimmersion time in the wax. A group of characteristic poly-mer-related bands in the 3100–2800 cm−1 range (3053,2967, 2929, and 2874 cm−1) were detected, and slight differ-ences were noted in the fine structures of these bands inother samples reportedly treated by different factories. Theabsorption of CH2 and CH3 related to the amount of waxand polymer in the jadeite, was correlated to two parame-ters involving the 2919 and 2851 cm−1 bands. TL
MISCELLANEOUSDiamonds, foreign aid and the uncertain prospects for
post-conflict reconstruction in Sierra Leone. J. A.Grant. The Round Table, Vol. 94, No. 381, 2005,pp. 443–457.
In the 1990s, Sierra Leone was racked by a gruesome civilwar, which local diamond production played a role in sus-taining. Since 2002, with the assistance of internationalaid organizations, the United Nations, and various govern-ments, the country has been trying to rebuild its shatteredeconomy and infrastructure. Sierra Leone’s two chief rev-enue sources are agricultural products and diamonds.
The country has made significant progress in regain-ing a degree of control over its production of diamondsfrom alluvial fields in the interior. Official productionrose from $1.2 million in 1999 to $126.7 million in 2004.One reason for this dramatic increase is the Kimberley
Process, which requires certification for rough diamondsindicating that they were mined and sold legitimately.However, some industry analysts believe that the majori-ty of Sierra Leone diamonds continue to be exported ille-gally to avoid the 3% export duty. In addition, entrenchedcorruption and limited law enforcement resources contin-ue to hinder attempts to regain full control of the coun-try’s diamonds and other resources. RS
Economic feasibility of small-scale black-lipped pearl oys-ter (Pinctada margaritifera) pearl farming in theSouth Pacific. Q. S. W. Fong, S. Ellis, and M. Haws,Aquaculture Economics & Management, Vol. 9,2005, pp. 347–368.
This article offers a detailed economic analysis of the costsinvolved in starting and operating a black pearl farm in theSouth Pacific. A number of island nations in that regionhave little private industry and remain heavily dependenton aid from foreign governments and development agen-cies. The authors analyzed the start-up costs—labor,equipment, seeding, land-lease, etc.—factoring in issuessuch as anticipated oyster mortality and percentage ofrejected cultured pearls, to develop an economic model forcultured pearl production over a 20-year period.
The authors project that an initial investment of about$200,000 would be needed to establish a farm with 25,000oysters in seed. Because of the time required for the pearlculturing, there would be no income for three years againstyearly operating costs ranging from $160,000 to $236,000.Years four and five would bring income equaling 40% ofexpenses, while the operation would turn a small profit($44,000) in year six. Profits would begin in earnest in yearseven, where returns of $143,000 would be realized againstrevenues of $437,000. These figures, however, are highlydependent on fluctuations in the market price for blackcultured pearls (a 1% decrease in price would cause a 5%decrease in profits). In addition, a small farming operationwould find it difficult to compete against large, establishedproducers unless a number of farms created cooperatives torealize economies of scale. RS
Finer points of cutting. D. Knoote [[email protected]], Rough Diamond Review,No. 8, 2005, pp. 27–28.
This article reviews developments in the history of dia-mond bruting. Bruting began in the mid-16th century byrubbing the edge of one diamond against another to roundthe corners and form the face-up shape. Machine-drivenbruting was introduced in the 19th century and is stillused today.
The bruting process is similar to lathing except thediamond sharp (cutting edge) is clamped to a long holder.By tucking the shaft under the arm and clasping the endholding the sharp, a bruter leverages the stick about a cra-dle block, and can exercise accurate control of the toolwhile sensing a feel for the cutting.

GEMOLOGICAL ABSTRACTS GEMS & GEMOLOGY SUMMER 2006 203
Manual bruting requires years of experience. Theapprentice bruter first learns to center a diamond, whichis critical to maximizing diamond yield. One of the mostimportant skills is being able to shape the rough fastenough to maintain productivity but slowly enough toavoid bearding. Preserving weight versus improving clari-ty and geometry are also important considerations.Highly skilled and experienced bruters have an advantageover automatic systems, which are not yet as sensitive tosubtleties in the process.
Automated bruting was developed in the 1980s. Thesebench-top machines work by grinding two contra-rotatingdiamonds against each other. Automated bruting takeslonger than manual bruting (~2 hours vs. 15–30 minutes),but this is offset by an operator being able to monitor fiveor more operations at once. The process also creates veryparallel girdles that are particularly suitable for the hold-ers used with automatic polishing machines.
Laser bruting has the advantage of being able to createvirtually any shape in about 30–40 minutes; multiplestones can be loaded into special cartridges for unattendedoperation. When coupled with a computerized scanningand imaging system, laser bruting machines can createshapes with perfect symmetry. One drawback is that oncea cutting path is started, the cut is committed, unlikemanual bruting where the bruter can monitor and adjustthe process.
With the advent of these technologies, the number ofmanual bruters has declined rapidly. The author predictsthat they will soon become redundant, as have manualkerfers. HJ-G
The history and prehistory of pearling in the Persian Gulf.R. Carter [[email protected]], Journal of theEconomic and Social History of the Orient, Vol. 48,No. 2, 2005, pp. 139–209.
The author examines pearling activities in this ancientarea from three points of view: (1) written accounts aboutpearls and pearl harvesting in the Persian Gulf, (2) pearlsand related archeological artifacts found at various sites inthe region, and (3) indirect archeological evidence of possi-ble pearling activities.
On the first point, the author found that the earliestexplicit reference to pearling dates from the 4th and 3rdcenturies BC in what is now Abu Dhabi and Bahrain.Pearling had become an established enterprise by the timeof Alexander the Great. Centuries later, Pliny noted thatpearls were the most highly prized valuable in Romansociety and praised those from the Persian Gulf. By the15th century AD, pearling had become “quite a largeindustry,” with Bahrain as the primary center. Records ofthe Dutch East India Company from 1724 estimate thatBahrain pearlers extracted one million pearls annually.The industry continued to grow through the 19th centu-ry, with the vast majority of the trade going to India.
On the second point, archeologists discovered pearls
in Late Stone Age (6th and 5th millennia BC) settlementsin what is now Kuwait. Most of the pearls were irregular-ly shaped, and some were incorporated into ornaments.The author argues that these came from deliberate pearlfishing, though this issue is apparently in dispute.
On the third point, the author reviews shifts inhuman population throughout the area that parallel thedevelopment of the pearling industry.
By the beginning of the 20th century, pearling was theprimary industry of the region, providing the foundationof wealth for many of today’s ruling families. The majori-ty of pearls still went to India. Starting in the 1920s,demand for Persian Gulf pearls declined dramaticallywith the availability of Japanese cultured pearls. The clo-sure of Kuwait’s pearl oyster market in 2000 ended 7,000years of pearling in the region. RS
Pathology of pearl oyster mortality. M. Hirano, Y. Sugi-shita, S. M. A. Mobin, K. Kanai, and K. Yoshikoshi([email protected]), Journal of AquaticAnimal Health, Vol. 17, No. 4, 2005, pp. 323–337.
Cultured pearl farming of the Pinctada fucata martensiioyster has been marked by mass mortality events in somewestern Japanese farms. First seen in the Kagoshima pre-fecture in 1993 and progressively identified in the Oita andEhime prefectures, mass mortality of these cultured oys-ters was prominent throughout western Japan by 1997.This article presents the results of a case study of healthyand affected oysters.
Based on a single strain of test oysters, mortalityevents were examined at several farms. Accompanied bywater temperature data and growth and mortality rates,most of the information was derived from examinationsof affected oysters using optical microscopy and transmis-sion electron microscopy. A histopathological examina-tion of these oysters was comprised of dissection, dehy-dration, and stabilization of specimens, followed by slic-ing them thinly. After drying, the structure of the tissuewas examined by pathologists using microscopy.
The pathologists found that the tissue of diseased oys-ters was characterized by blebbing and cell necrosis,spreading from the digestive organ to other regions. Noviral, bacterial, mycotic, or parasitic organisms weredetected. This is in contrast to earlier suggestions thattheir mortality was due to an infectious disease. Massmortality events were demonstrated to be regular annualevents, with very similar patterns between farms. Watertemperature was found to be only an indirect factor inmass mortality events: It altered the timing and some-times the severity of the outbreaks, but it is not suspectedto be the cause. One suspected environmental factor isthe presence of neighboring fish farms, which are knownto cause water pollution and deoxygenation resultingfrom decaying fish waste. This study speculates that atleast some farms were probably influenced by organic pol-lution from these fish farms. DMK

1631–1668: Intrepid French gem dealer Jean-Baptiste Tavernier makessix voyages to India. In 1642, it is widely believed, he acquires a112.5 ct diamond crystal that becomes known as the Tavernier Blue.Following its theft from the French Treasury in 1792, the TavernierBlue is recut and eventually yields the 45.52 ct Hope diamond.
1726: A London merchant writes a letter offering the Dresden Greendiamond to Friedrich Augustus, ruler of Saxony, for 30,000 poundssterling—the first known documentation of this historic stone.
Circa 1878: The Tiffany diamond, perhaps the most famous of allyellow diamonds, is recovered from the Kimberley mine in SouthAfrica. The 287 ct piece of rough is subsequently fashioned into a128.54 ct square antique modified brilliant.
1903: South Africa’s Premier mine (renamed the Cullinan in 2003) isdiscovered. In addition to producing large colorless diamonds, the minebecomes known as a source of superb blue diamonds.
Mid-1950s: The GIA Gem Trade Laboratory begins issuing color grad-ing and origin-of-color reports for colored diamonds.
1958: Harry Winston donates the Hope diamond to the SmithsonianInstitution in Washington, D.C., where it is now seen by some fourmillion museum visitors each year.
Mid-1970s: Stanley Doppelt and Louis Glick’s Starburst cut and HenryGrossbard’s radiant cut are introduced. These experimental cuts arefound to intensify the face-up color of yellow diamonds, which leadsto a revolution in fancy-color diamond cutting. No longer are coloreddiamonds exclusively manufactured in the same shapes, cutting styles,and proportions as their colorless and near-colorless counterparts.
August 1979: The first diamond crystals are found in the area now
known as the Argyle mine in Western Australia, which soon becomesthe world’s largest volume producer of diamonds. The productionincludes brown stones that are creatively marketed as “cognac” and“champagne” diamonds, as well as a small but consistent supply of veryrare pink diamonds.
April 28, 1987: At Christie’s in New York, a 0.95 ct Fancy purplishred diamond known as the Hancock Red sells for $880,000. At$926,000 per carat, it still holds the record per-carat price for anygem sold at auction.
November 1988: Two gemologists from the GIA Gem Trade Laboratoryvisit the Green Vaults in East Germany to conduct the first completegemological examination of the 41 ct Dresden Green, one of the fewgreen diamonds whose bodycolor is known to be of natural origin.
December 12, 1988: The unmounted Hope diamond is graded by theGIA Gem Trade Laboratory, the first time it has ever been graded by awidely recognized system. The historic diamond receives a color gradeof Fancy Dark grayish blue and a VS1 clarity grade.
Early 1995: GIA formally introduces modifications to its coloreddiamond color grading system, which include two additional fancy-grade terms, Fancy Deep and Fancy Vivid. The system and itsenhancements were first described in the Winter 1994 issue ofGems & Gemology. In 1996, the color of the Hope diamond isupdated to Fancy Deep grayish blue.
June 27–September 15, 2003: The “Splendor of Diamonds” exhibitappears at the Smithsonian Institution. The display features one color-less diamond and six spectacular colored diamonds, including: the101.29 ct Fancy Vivid yellow Allnatt, the 59.60 ct Fancy Vivid pinkSteinmetz Pink, and the 27.64 ct Fancy Vivid blue Heart of Eternity.
August 2006 marks the release of the second book in the GEMS & GEMOLOGY IN REVIEW series, on colored diamonds. This 340-page volume, edited by GIA Laboratory technical director John M. King, contains more than 100 articles andother reports on historic colored diamonds, characterization of colored diamonds, and color grading, which span 70-plus years of GEMS & GEMOLOGY issues. A special feature is the 20-page booklet of color reference charts, which provides examples of GIA fancy-color grades for yellow, blue, orange, pink, and green diamonds. Some of these chartsare updated versions of those previously seen in G&G, whereas others have never been published before.
Following are some of the highlights in the history of colored diamonds in the marketplace, the public eye, and thegemological laboratory.
Available now: To order Gems & Gemology in Review:Colored Diamonds, visit www.gia.edu/gemsandgemologyor call toll-free 800-421-7250, ext. 7142. Outside the
U.S. and Canada, call 760-603-4000, ext. 7142, or e-mail [email protected]. Price: $59.95 plus shipping andhandling.
204 THE LAST PAGE GEMS & GEMOLOGY SUMMER 2006
A COLORED DIAMONDS
CHRONOLOGYLAST Page
The
THE QUARTERLY JOURNAL OF THE GEMOLOGICAL INSTITUTE OF AMERICA
SU
MM
ER2006
PA
GES
95–204V
OLU
ME
42N
O.2
VOLUME XLII SUMMER 2006
GEM
S & G
EMO
LOG
Y
LA-ICP-MS in GemologyThe Cullinan Diamonds
Zircon in Heated SapphireFaceting Rhodonite