Embed Size (px)
Citation preview

S U M M A R Y V E R S I O N


The designations employed and the presentation of material in this information product do not imply the expression of any opinion whatsoever on the part of the Food and Agriculture Organization of the United Nations (FAO) concerning the legal or development status of any country, territory, city or area or of its authorities, or concerning the delimitation of its frontiers or boundaries. The mention of specific companies or products of manufacturers, whether or not these have been patented, does not imply that these have been endorsed or recommended by FAO in preference to others of a similar nature that are not mentioned.
The views expressed in this information product are those of the author(s) and do not necessarily reflect the views or policies of FAO.
© FAO, 2017
FAO encourages the use, reproduction and dissemination of material in this information product. Except where otherwise indicated, material may be copied, downloaded and printed for private study, research and teaching purposes, or for use in non-commercial products or services, provided that appropriate acknowledgement of FAO as the source and copyright holder is given and that FAO’s endorsement of users’ views, products or services is not implied in any way.
All requests for translation and adaptation rights, and for resale and other commercial use rights should be made via www.fao.org/contact-us/licence-request or addressed to [email protected].
FAO information products are available on the FAO website (www.fao.org/publications) and can be purchased through [email protected].

S U M M A R Y V E R S I O N

FOREWORD 4
CAUSE FOR HOPE AND CONCERN 6
TRENDS 8
1 Population growth, urbanization and ageing 9
2 Global economic growth, investment, trade and food prices 10
3 Competition for natural resources 15
4 Climate change 17
5 Agricultural productivity and innovation 20
6 Transboundary pests and diseases 22
7 Conflicts, crises and natural disasters 24
8 Poverty, inequality and food insecurity 26
9 Nutrition and health 29
10 Structural change and employment 32
11 Migration and agriculture 34
12 Changing food systems 36
13 Food losses and waste 39
14 Governance for food and nutrition security 41
15 Development finance 42
This booklet summarizes key messages from the report The Future of Food and Agriculture- Trends and Challenges. The figures and graphs are taken from that publication.
CONTENTS

T H E F U T U R E O F F O O D A N D A G R I C U L T U R E T R E N D S A N D C H A L L E N G E S
CHALLENGES 44
1 Sustainably improve agricultural productivity to meet increasing demand
2 Ensure a sustainable natural resource base
3 Address climate change and intensification of natural hazards
4 Prevent transboundary pests and diseases
5 Eradicate extreme poverty and reduce inequality
6 End hunger and all forms of malnutrition
7 Improve income-earning opportunities in rural areas and address the root causes of migration
8 Build resilience to protracted crises, disasters and conflicts
9 Make food systems more efficient, inclusive and resilient
10 Meet the need for coherent and effective national and international governance

| 4 |
FAO’s vision is of a ‘world free from hunger and
malnutrition, where food and agriculture contribute to improving the living standards of all, especially the poorest, in an economically, socially and environmentally sustainable manner’. To help its Members realize that shared vision – individually at the national level and collectively at the regional and global levels – FAO organizes its work taking account of the main challenges facing the food and agriculture sector. The present study, which was undertaken for the quadrennial review of FAO’s Strategic Framework and preparation of the Organization’s Medium-Term Plan, 2018–21, lays out key global trends and challenges that will inf luence food and agriculture in the coming decades.
The trends and challenges analysed here are cause for both hope
and concern. Much progress has been made in reducing hunger and poverty and improving food security and nutrition. Gains in productivity and technological advances have contributed to more efficient resource use and improved food safety. But major concerns persist. Some 795 million people still suffer from hunger, and more than two billion from micronutrient deficiencies or forms of overnourishment. In addition, global food security could be in jeopardy due to climate change and mounting pressure on natural resources, both of which threaten the sustainability of food systems at large. Planetary boundaries may well be surpassed, if current trends continue.
Our assessment of prevailing trends suggests, therefore, that in order to realize FAO’s vision, transformative changes in agriculture and food systems are required worldwide. In FAO’s view, there are 10 key challenges that need to be addressed if we are to succeed in
FOREWORD

T H E F U T U R E O F F O O D A N D A G R I C U L T U R E T R E N D S A N D C H A L L E N G E S
| 5 |
eradicating hunger and poverty, while making agriculture and food systems sustainable. Those challenges include the uneven demographic expansion that will take place in the coming decades, the threats posed by climate change, the intensification of natural disasters and upsurges in transboundary pests and diseases, and the need to adjust to major changes taking place in global food systems.
We welcome the growing attention that the international community is paying to these concerns. Overall, trends and issues in 2015-2016 have spurred the global community into action through a series of initiatives and agreements, which reset the global development agenda. These developments constitute the global context for FAO’s work in the future, under the overall umbrella of the 2030 Agenda for Sustainable Development and the Sustainable Development Goals (SDGs), and include the Addis
Ababa Action Agenda, the Paris Agreement on climate change, the World Humanitarian Summit and the United Nations Secretary-General’s Agenda for Humanity.
The purpose of this report is to help mobilize the concrete and concerted actions required to realize these global agendas. It contributes to a common understanding of the major long-term trends and challenges that will determine the future of food security and nutrition, rural poverty, the efficiency of food systems, and the sustainability and resilience of rural livelihoods, agricultural systems and their natural resource base.
José Graziano da Silva
FAO Director-General
T H E F U T U R E O F F O O D A N D A G R I C U L T U R E T R E N D S A N D C H A L L E N G E S

| 6 |
Over the past century, enormous progress has been made in improving human welfare worldwide. Societies have changed radically thanks to quantum leaps in technology, rapid urbanization, and innovations in production systems. Yet conditions today are a far cry from the world ‘free of fear and want’ envisioned by the founders of the United Nations. In fact, much remains to be done to fulfil the vision of the Food and Agriculture Organization of the United Nations (FAO), which is to create ‘a world free of hunger and malnutrition and one in which food and agriculture contribute
to improving the living standards of all, especially the poorest, in an economically, socially and environmentally sustainable manner’.
Amid great plenty, billions of people still face pervasive poverty, gross inequalities, joblessness, environmental degradation, disease and deprivation. Displacement and migratory flows are at their highest levels since the Second World War. While many armed conflicts have been resolved, new ones have emerged. Much of humanity’s progress has come at a considerable cost to the environment. The impacts
Global trends and challenges that are shaping the future of food and agriculture:
Cause for hope and concern
INTRODUCTION

T H E F U T U R E O F F O O D A N D A G R I C U L T U R E T R E N D S A N D C H A L L E N G E S
| 7 |
of climate change are already being felt, and – if left unabated – will intensify considerably in the years ahead. Globally integrated production processes have brought many benefits. However, challenges in regulating those processes highlight the need to steer them towards more equitable and sustainable outcomes.
As global trends influence food security and the overall sustainability of food and agricultural systems, they give rise to a number of questions. Are today’s food and agricultural systems capable of meeting the needs of a
global population that is projected to reach more than nine billion by mid-century? Can we achieve the required production increases, even if this implies adding pressure to already dwindling land and water resources, and do so in a context of climate change?
”The future of food and agriculture – Trends and challenges”, tries to answer these questions, laying out and analysing key global trends that are influencing and will influence food and agriculture in the coming decades, together with the associated challenges to face ahead.
T H E F U T U R E O F F O O D A N D A G R I C U L T U R E T R E N D S A N D C H A L L E N G E S

| 8 |
Trends: Major drivers of change in the 21st century

T H E F U T U R E O F F O O D A N D A G R I C U L T U R E T R E N D S A N D C H A L L E N G E S
| 9 |
TREND 1
Global population growth is slowing, but Africa and Asia will still see a large population expansion.Population dynamics will radically change demographics over the coming decades and towards the end of the century. World population is expected to increase and reach some 9.7 billion people by 2050 (figure 1.1). Projected growth in the world’s population is likely to be concentrated in Africa and South Asia and in the world’s cities. Should this expansion materialize, it could seriously jeopardize the overall development prospects of these regions, as they rely on agriculture for employment and income generation and yet cannot expand agriculture because of stressed land and water resources. By mid-century, two-thirds of the global population will live in urban areas. By the year 2100, Asia and Africa may well
be home to a combined population of nine billion, out of the projected 11 billion people who will inhabit the Earth.
Between 2015 and 2050, the number of people between 15 and 24 years of age living in low- and middle-income countries is expected to rise from about one billion to 1.2 billion. Most of these young people will live in sub-Saharan Africa and South Asia, particularly in rural areas, where jobs are likely to be scarce. Without sufficient employment opportunities, this population trend may lead to faster rates of outmigration and urbanization, and, possibly, conflicts.
Meanwhile other regions will have to adjust to rapidly ageing populations, with ageing accelerating in low-income countries as well.
SOURCE: UN (United Nations). 2015. World Population Prospects: the 2015 Revision. Available at https://esa.un.org/unpd/wpp
LOW
HIGH
MEDIUMMEDIUM
0
10
20
30
40
50
60
70
80
90
100
0
2
4
6
8
10
12
14
16
18
1950 1960 1970 1980 1990 2000 2010 2020 2030 2040 2050 2060 2070 2080 2090 21002015
Tota
l pop
ulat
ion
(bill
ions
)
Ann
ual i
ncre
men
ts (m
illio
ns)
FIGURE 1.1 GLOBAL POPULATION GROWTH TO 2100, BY VARIANT
POPULATION GROWTH, URBANIZATION AND AGEING

Trends: Major drivers of change in the 21st century
| 10 |
TREND 2
Economic growth could accelerate dietary transitions and drive up agricultural demand.Economic growth has been sizeable in the last decades. Global GDP grew by 2.6 percent a year between 1990 and 2014, driven mainly by developments in low- and middle-income countries, where GDP grew by some 5.1 percent a year. Fast income growth in emerging countries has given rise to a global middle class and as a result is determining an acceleration in dietary transitions. Demand for food is changing towards higher consumption of meat and dairy products and other more resource-intensive food items. This carries serious implications for the sustainable use of natural resources.
FAO’s most recent projections of future patterns of agricultural demand and supply are based on moderate global economic growth to 2050, displaying some degree of narrowing of the income gap (or
economic convergence) between low- and middle-income countries and high-income countries.
These projections assume that per capita GDP at the global level would increase between 2005–7 and 2050 from US$7 600 to US$13 800, an average annual growth rate of around 1.4 percent (Figure 2.4). Per capita GDP of low- and middle-income countries would more than triple, rising from US$2 400 to US$7 500, ref lecting an average annual growth rate of 2.7 percent. Growth in high-income countries, in contrast, would be much slower, at around 1.2 percent a year. Despite this difference in growth to 2050, the average incomes of the population of low- and middle-income countries would remain only a fraction of those of people living in high-income countries, rising from 8.5 percent in 2005– 7 to 16 percent.
It should be noted, however, that any future economic pathways
VIET NAM A farmer herding cattle
through a rice field. ©FAO/Hoang Dinh Nam.
GLOBAL ECONOMIC GROWTH, INVESTMENT, TRADE AND FOOD PRICES


Trends: Major drivers of change in the 21st century
| 12 |
are shrouded by great uncertainty and depend on a wide range of interrelated factors. These include the behaviour of producers and consumers, technological change, availability and productivity of resources, population dynamics, climate change and policy responses.
Agriculture remains much less capital intensive in low- and middle-income countries.Global levels of economy-wide investment (or gross fixed capital formation) have increased over the past 25 years. This was particularly the case in East Asia and the Pacific, thanks to China, where investment
FIGURE 2.4 GROWTH OF PER CAPITA GDP TO 2050, BY REGION
NOTE: Regional groups do not include high-income countries. SOURCE: Data for 2015 are based on FAO Global Perspectives Studies (unpublished data); data for 2005–2007, 2030 and 2050 are based on Alexandratos and Bruinsma, 2012.
World High-income
countries
Low-and
middle-income
countries
East Asia LatinAmerica/Caribbean
NearEast/NorthAfrica
SouthAsia
Sub-SaharanAfrica
0
5
10
15
20
25
30
35
40
45
2005
/200
720
1520
30 2050
US$
thou
sand
s pe
r per
son
at 2
005/
2007
exc
hang
e ra
te
TREND 2 GLOBAL ECONOMIC GROWTH, INVESTMENT, TRADE AND FOOD PRICES

| 13 |
T H E F U T U R E O F F O O D A N D A G R I C U L T U R E T R E N D S A N D C H A L L E N G E S
increased at an annual rate of around 15 percent, while in high-income countries it averaged less than two percent a year between 1991 and 2014. In the same period, the share of investment over GDP shifted from less than 30 percent to more than 45 percent in China. However, the share of investment
over GDP ranked between 22 and 27 percent both in high-income and the other low- and middle-income countries.
Trends in agricultural investment display a somewhat different picture. Nowadays, low- and middle-income countries invest
FIGURE 2.9 AGRICULTURAL NET CAPITAL-OUTPUT (VALUE ADDED) RATIO, 1990–2015
NOTE: Regional groups do not include high-income countries. The agricultural capital-output ratio is defined as the net fixed capital formation in agriculture as a share of agricultural value added (GDP).
SOURCE: FAO Global Perspectives Studies, based on FAO, 2016a.
1
2
3
4
1990 1995 2000 2005 2010 2015
Ratio
South Asia
Latin America/Caribbean
Middle East/North Africa
Europe/Central Asia
Sub-Saharan Africa
High-income countries

Trends: Major drivers of change in the 21st century
| 14 |
in agriculture almost as much, in absolute terms, as high-income countries – around US$190 billion in both cases. However, agriculture in high-income countries is still significantly more capital-intensive than in low- and middle-income countries. It requires four units of capital to generate one unit of value added in high income countries, compared to around 1.5 in low- and middle-income countries. However, in East Asia and the Pacific (including China), South Asia, Europe and Central Asia, the capital-intensity of agricultural production is on the rise (figure 2.9).
‘Business-as-usual’ investment patterns would leave hundreds of millions of people undernourished by 2030.Despite increases in agricultural investment, FAO, IFAD and WFP estimate that current investment patterns and spending on social protection would not suffice to improve income growth or access to food enough to eradicate hunger by 2030. Globally, an additional annual investment of US$265 billion is needed to eradicate extreme poverty and hunger by 2030, as compared to a ‘business as usual’ scenario. This amount comprises both investment
in social protection programmes (US$67 billion) and investment in pro-poor productive activities (US$198 billion) that provide poor people opportunities to earn, save and invest while improving their livelihoods.
After peaking in 2011, food prices have dropped to lower levels. Although FAO’s real food price index remains above the levels of the 1990s and 2000s, the long-term evolution of the index suggests a downward slope since 1960, with due differences between commodities. Food price f luctuations received substantial attention in the wake of the food-price crisis of 2007-2008. Prices peaked during the 1970s, while surges during the 2000s and 2010s were above levels seen in previous decades. For this reason, price volatility during the last two decades is considered comparable with the 1970s. Future levels of food prices depend on how production systems will be able to accommodate the pressure of increasing demand in an environment of tightening resource constraints and climate change, and how far agricultural trade will adapt to this changing environment.
TREND 2 GLOBAL ECONOMIC GROWTH, INVESTMENT, TRADE AND FOOD PRICES
NIGERAssistance to improve food security of
vulnerable households in Niger ©FAO/Giulio Napolitano.
| 15 |
T H E F U T U R E O F F O O D A N D A G R I C U L T U R E T R E N D S A N D C H A L L E N G E S
TREND 3
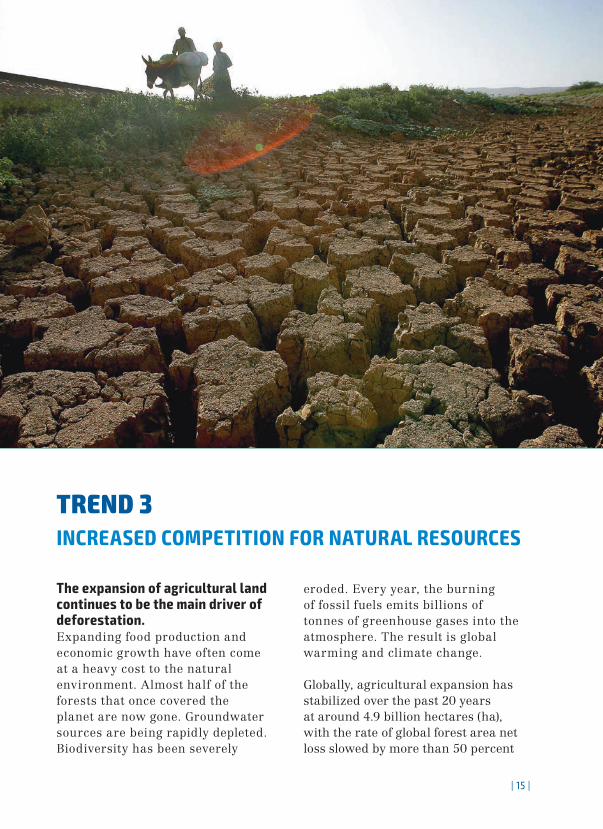
The expansion of agricultural land continues to be the main driver of deforestation.Expanding food production and economic growth have often come at a heavy cost to the natural environment. Almost half of the forests that once covered the planet are now gone. Groundwater sources are being rapidly depleted. Biodiversity has been severely
eroded. Every year, the burning of fossil fuels emits billions of tonnes of greenhouse gases into the atmosphere. The result is global warming and climate change.
Globally, agricultural expansion has stabilized over the past 20 years at around 4.9 billion hectares (ha), with the rate of global forest area net loss slowed by more than 50 percent
INCREASED COMPETITION FOR NATURAL RESOURCES

Trends: Major drivers of change in the 21st century
| 16 |
to 3.3 million hectares per year (period 2010-2015). However, these figures mask significant regional differences. For example in tropical and subtropical regions, annual forest losses amounted to seven million ha between 2000 and 2010, while the agricultural area expanded in the same period by six million ha per year. Meanwhile low-income countries experienced both the largest annual net loss of forest area and annual net gain in agricultural area.
Competition is increasing regarding natural resources for energy or food use, as countries seek bioenergy alternatives to fossil fuels.The consumption of cereals, oilseeds and sugarcane for the production of biofuels has increased, as has the use of biomass as a substitute for petrochemicals. The greater competition between food and non-food uses of biomass has strengthened the interdependence between food, feed and energy markets. For example, around two-thirds of the bioenergy used worldwide involves the traditional burning of wood and other biomass for cooking and heating. Much of this traditional wood energy is unsustainably
produced and inefficiently burned, adversely affects the health of poor populations and contributes to environmental degradation.
Competing demands from agriculture, industry and cities has led to water scarcity.Water withdrawals for agriculture represent 70 percent of all withdrawals. Industry, cities and agriculture are the main sectors competing for water supplies.
FAO estimates that over 40 percent of the world’s rural population lives in river basins that are classified as water scarce. In many low-rainfall areas of the Middle East, North Africa and Central Asia, and in India and China, farmers use much of the available water resources, resulting in the serious depletion of rivers and aquifers. In some of these areas, about 80 to 90 percent of the water is used for agricultural purposes. Combined with water scarcity, the rate of expansion of land under irrigation is slowing substantially. FAO has projected the global area equipped for irrigation may increase at a relatively low rate of 0.24 percent annually, most of which will be in low-income countries.
TREND 3 INCREASED COMPETITION FOR NATURAL RESOURCES

| 17 |
T H E F U T U R E O F F O O D A N D A G R I C U L T U R E T R E N D S A N D C H A L L E N G E S
TREND 4
Food and agriculture sectors contribute substantially to greenhouse gas emissions.According to the most recent assessment report of the Intergovernmental Panel on Climate Change (IPCC) published in 2014, levels of anthropogenic emissions of greenhouse gases
(GHGs) are now at their highest in history (figure 4.2).
Over the past 50 years, GHG emissions resulting from ‘Agriculture, Forestry and Other Land Use’ (AFOLU) have nearly doubled, and projections suggest a further increase by 2050. In 2010,
CLIMATE CHANGE
NOTE: ‘Other sources’ includes international bunkers.SOURCE: FAO, 2016b.
FIGURE 4.2 ANNUAL GREENHOUSE GAS EMISSIONS FROM ALL SECTORS
0
5
10
15
20
25
30
35
40
45
1990 1992 1994 1996 1998 2000 2002 2004 2006 2008 2010
Gig
aton
nes
of c
arbo
n di
oxid
e eq
uiva
lent
Energy
AFOLU
Transport
Residential,commercial,institutional
Industry
WasteOther sources

Trends: Major drivers of change in the 21st century
| 18 |
emissions from the AFOLU sector were an estimated 10.6 gigatonnes of carbon dioxide equivalent, and were mainly caused by land use, livestock production, and soil and nutrient management. The sector produces an estimated 21 percent of total global GHG emissions. However, forests also mitigate climate change by removing GHG from the atmosphere through biomass growth.
Climate change will affect food production, food security and nutrition.The increasing variability of precipitation and frequency of droughts and floods are likely to reduce crop yields in general. Climate change may also affect the aquatic environment, for example through changes in sea surface temperature, ocean circulation, waves and storm systems, salinity content, oxygen concentration and acidification, with an extended impact on fisheries. Higher temperatures and less reliable supplies of water will also create severe hardships for small-scale livestock producers, particularly
in arid and semi-arid grassland and rangeland ecosystems at low latitudes.
Climate change’s impact on global food security will relate not just to food supply but also to food quality, access and utilization and the stability of food security. The adoption of sustainable land, water, fisheries and forestry management practices by smallholders will be crucial to efforts at adapting to climate change, eradicating global poverty and ending hunger. However, in order to encourage adoption, improvements will also be necessary in infrastructure, extension, climate information, access to credit and social insurance.
At the same time, it is equally important to work on mitigating the effects of agriculture, as this involves opening up pathways for agricultural development that can increase food production in ways that release fewer GHG emissions per unit of food. Without efforts to adapt to and mitigate climate change, food insecurity will likely increase substantially.
BANGLADESHAerial view of flooding and coastal damage in the Sundarbans Region
following Cyclone Sidr. ©FAO/Giulio Napolitano.
TREND 4 CLIMATE CHANGE

| 19 |
T H E F U T U R E O F F O O D A N D A G R I C U L T U R E T R E N D S A N D C H A L L E N G E S

Trends: Major drivers of change in the 21st century
| 20 |
TREND 5AGRICULTURAL PRODUCTIVITY AND INNOVATIONAgricultural output will need to expand but yield increases are slowing. Agricultural production more than tripled between 1960 and 2015, owing in part to productivity-enhancing Green Revolution technologies and a significant expansion in the use of land, water and other natural resources for agricultural purposes. The same
TABLE 5.1 INCREASE IN AGRICULTURAL PRODUCTION REQUIRED TO MATCH PROJECTED DEMAND, 2005/2007-2050 (PERCENT)
2005/2007 2012-2050 2005/2007 2013-2050 2012
WorldAs projected in AT2050 (1) 100 159.6 14.8 44.8With updated population projections (UN, 2015) (2) 100 163.4 14.8 48.6
Sub-Saharan Africa and South AsiaAs projected in AT2050 100 224.9 20.0 104.9With updated population projections (UN, 2015) 100 232.4 20.0 112.4
Rest of the worldAs projected in AT2050 100 144.9 13.8 31.2With updated population projections (UN, 2015)2 100 147.9 13.8 34.2
1 World Agriculture Towards 2030/2050: the 2012 revision. ESA Working Paper No. 12–03. Rome, FAO. Alexandratos and Bruinsma, 2012 2 FAO Global Perspectives Studies, based on UN, 2015. Available at https://esa.un.org/unpd/wpp. Accessed November 2016

| 21 |
T H E F U T U R E O F F O O D A N D A G R I C U L T U R E T R E N D S A N D C H A L L E N G E S
period witnessed a remarkable process of industrialization and globalization of food and agriculture. Food supply chains have lengthened dramatically as the physical distance from farm to plate has increased and the consumption of processed, packaged and prepared foods has risen in all but the most isolated rural communities.
To meet demand, agriculture in 2050 will need to produce almost 50 percent more food, feed and biofuel than it did in 2012. This FAO estimate takes into account recent United Nations projections indicating that the world’s population would reach 9.7 billion in 2050. In sub-Saharan Africa and South Asia, agricultural output would need to more than double by 2050 to meet increased demand, while in
the rest of the world the projected increase would be about one-third above current levels (Table 5.1).
Historically, much bigger increases in agricultural production have been achieved in comparable periods. However, despite overall improvements in agricultural efficiency, yield increases are slowing due to climate change and so maintaining the historic pace of production increases may be difficult. Resource-conserving practices are certainly helping to increase agricultural productivity, such as conservation agriculture and climate smart agriculture. It is encouraging that after a period of stagnation there is a resurgence in agricultural research and development, with private investments increasing substantially.
SENEGALA farmer measuring growth rates of a rice crop while his colleague records the data as part of an exercise in Farmer Field School (FFS). ©FAO/Olivier Asselin.

Trends: Major drivers of change in the 21st century
| 22 |
TREND 6
With globalization, transboundary pests and diseases are increasing while antimicrobial resistance poses a threat to human health.There has been an alarming increase in the number of outbreaks of
transboundary pests and diseases of plants and animals, which jeopardize the food security of the affected areas and have broader economic, social and environmental impacts. A study analysing trends in the occurrence of
SRI LANKAA veterinarian holding a blood sample
taken from a cow for testing to make sure the rinderpest virus has not returned.
©FAO/Ishara Kodikara.
TRANSBOUNDARY PESTS AND DISEASES
FIGURE 6.2 GLOBAL SPREAD OF CROP PESTS AND PATHOGENS, 1950–2000
NOTE: The degree of pest saturation for a region is the mean of the degrees of saturation of countries in that region. The degree of saturation in a country is the number of crop pests and pathogens (CPPs) currently present divided by the number of CPPs that could occur.
SOURCE: Bebber, Holmes and Gurr, 2014.
Deg
ree
o f p
est s
atur
atio
n
Africa/Middle East
North America
1950
0.6
0.4
0.2
0
1960 1970 1980 1990 2000

| 23 |
T H E F U T U R E O F F O O D A N D A G R I C U L T U R E T R E N D S A N D C H A L L E N G E S
plant pests and diseases (Figure 6.2) found that the degree of saturation for each pest has reached almost 10 percent in Africa, 20 percent in Asia, and as much as 60 percent in North America.
Bovine spongiform encephalopathy, foot-and-mouth disease, the highly pathogenic avian influenza and swine flu are examples of recent pandemics the world has suffered. The spread of such outbreaks in wider geographic locations is increasing as more people, animals, plants and agricultural products move within and between countries and as production systems become more intensive. Climate change may well exacerbate transboundary threats and can alter
the distribution of animal and plant pests and diseases, the full effects of which are difficult to predict.
The potential impact of animal diseases on human health is further magnified by increasing levels of resistance in bacteria, parasites, viruses and fungi to antimicrobial drugs, such as antibiotics, antifungals, antivirals, antimalarials and anthelmintics (against parasites). Antimicrobial resistance is spreading globally, undermining the ability to treat common infectious diseases and resulting in prolonged illness, disability and death. Today, some 700 000 people die of drug-resistant infections every year.

Trends: Major drivers of change in the 21st century
| 24 |
TREND 7
Conflicts are on the rise again.The last decade has been marked by a surge in the number of conflicts, which are a major driver of food insecurity and malnutrition. Around 80 percent of humanitarian funding appeals are now funnelled to areas of conflict, most of them protracted. About half of the world’s poor live in states characterized by fragility and conflict, up from one-fifth in 1990. Countries with the highest levels of undernourishment tend to be those engaged in, or recently emerged
from, violent conflict. Conflicts entail the physical destruction and plundering of crops, livestock and food reserves, while recruitment into fighting forces drains key sources of labour. A further worrying trend is that conflict-induced negative impacts on the welfare of populations are no longer limited to specific regions. They have become a global issue with the displacement of people and migration, such as in the case of the ongoing civil war in the Syrian Arab Republic.
SOURCE: FAO. 2015. The impact of natural hazards and disasters on agriculture and food security and nutrition: A call for action to build resilient livelihoods. Rome.
CONFLICTS, CRISES AND NATURAL DISASTERS
FIGURE 7.3 AGRICULTURAL PRODUCTION LOSSES AFTER MEDIUM- TO LARGE-SCALE DISASTERS IN DEVELOPING COUNTRIES, BY CAUSE AND REGION, 2003–2013
Sub Saharan Africa
Droughts 89% Floods 9% Storms 2%
Near East
Droughts 99,6% Floods 0,4%
Latin America/Caribbean
Floods 60%Droughts 29% Storms 11%
Asia
Floods 86% Droughts 10% Storms 4%
JORDANSyrian refugees residing in host communities
outside their tents in Mafraq governorate. Families must get by with the little water and electricity
that is available to them.© Alessandra Blasi/UNDP.

| 25 |
T H E F U T U R E O F F O O D A N D A G R I C U L T U R E T R E N D S A N D C H A L L E N G E S
The number and intensity of natural disasters worldwide is also increasing.The occurrence of natural disasters has risen over the past 30 years. This increase is particularly notable by climatological events such as droughts, hydrological events such as floods, and meteorological events such as storms. Given the sector’s dependence on climate, the increase in weather-related events is of significant concern to agriculture, adding to the vulnerability of individuals and challenging their food security. Between 2003 and 2013, drought wreaked the greatest havoc on agriculture in sub-Saharan Africa and the Near East. Agriculture in Asia was mainly affected by floods, while Latin America and the Caribbean were
affected mostly by floods, and to a lesser extent by droughts and storms (Figure 7.3).
There is an expectation that natural disasters and conflicts will coincide more in the future. Extreme weather events related to climate change, which contribute to conflict risks and associated pressure on populations to migrate, are expected to exacerbate a deepening global need for humanitarian assistance. Climate change per se is not necessarily associated with violence. However, the intersection between vulnerability to climate change and broader institutional and socio-economic fragility can increase the potential for conflict.

Trends: Major drivers of change in the 21st century
| 26 |
TREND 8
While extreme poverty is decreasing on a global level, in sub-Saharan Africa there are more extremely poor people today than in the 1990s.
Extreme poverty has been declining since 1990. That said, there are still more than 700 million people living in extreme poverty, most of which in sub-Saharan Africa and South Asia.
POVERTY, INEQUALITY AND FOOD INSECURITY
FIGURE 8.2 PER CAPITA INDICATORS OF LOW- AND MIDDLE-INCOME COUNTRIES RELATIVE TO HIGH-INCOME COUNTRIES, 1990–2015
SOURCE: FAO, Global Perspectives Studies, based on United Nations. 2016. The System of National Accounts (SNA). WEBSITE: available at http://unstats. un.org/unsd/nationalaccount/sna.asp. Accessed February 2016.
Low- and middle-income countries (excluding China) China
10
0
20
Per capitaconsumption
Per capita grosscapital formation
Per capitaincome
1990 2000 2010 1990 2000 2010
Perc
ent

| 27 |
T H E F U T U R E O F F O O D A N D A G R I C U L T U R E T R E N D S A N D C H A L L E N G E S
More than 400 million extremely poor people live in conflict areas, signalling the need to address poverty across the entire humanitarian and development continuum.
Agriculture is key to poverty and hunger alleviation in rural areas, but is no longer enough.Agricultural policies play an important role in pro-poor growth. They could support increases in productivity and profitability in a number of ways: for example by providing efficient extension and advisory agricultural services, improving coordination along value chains and ensuring that the
weaker segments in the chain reap the benefits of integrating agriculture into markets. However, pro-poor growth goes beyond agriculture. To date, the ongoing wider process of economic development has led in many instances to a reduction in the number of people engaged in agriculture, with consequent urbanization. Permanently reducing poverty involves actions that cut across both rural and urban areas, such as providing broad access to good quality education, promoting economic diversification in rural non-farm income-generating activities, supporting economy-wide job creation, increasing the saving and investment potential of
SOURCE: FAO, IFAD & WFP. 2015. Achieving Zero Hunger. The critical role of investment in social protection and agriculture. Rome, FAO; FAO, IFAD & WFP. 2015. The State of Food Insecurity in the World 2015. Meeting the 2015 international hunger targets: taking stock of uneven progress. Rome, FAO; and N. Alexandratos, & J. Bruinsma, 2012. World agriculture towards 2030/2050: the 2012 revision. ESA Working Paper No. 12–03. Rome, FAO.
FIGURE 8.4 UNDERNOURISHMENT IN A ‘BUSINESS-AS-USUAL’ SCENARIO, 2005–2050
0
100
200
300
400
500
600
700
800
900
1000
2005-2007 2014-2016 2030 2050
Sub-Saharan Africa
South Asia
Near East/North Africa
Latin America/Caribbean
East Asia
High-income countries
Milli
on p
eopl
e
Trends: Major drivers of change in the 21st century
| 28 |
the poor, and implementing adequate social protection mechanisms.
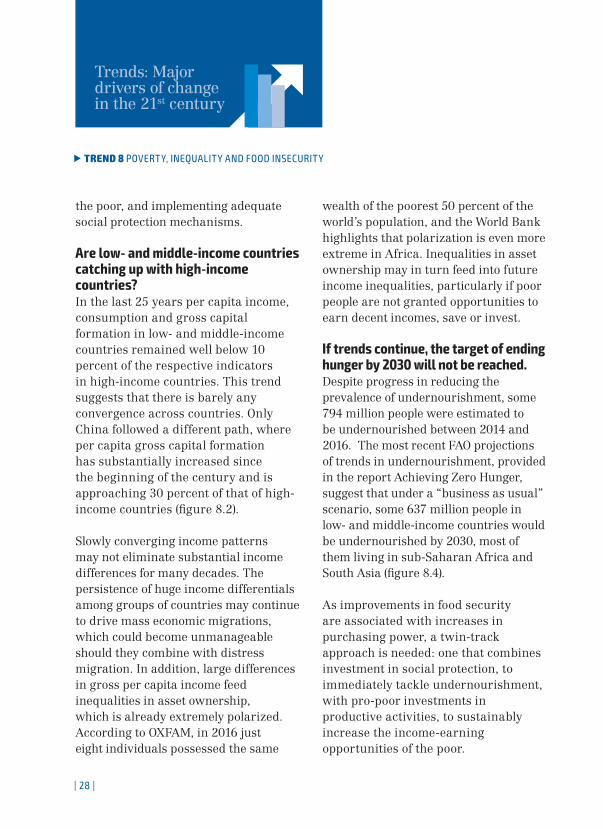
Are low- and middle-income countries catching up with high-income countries?In the last 25 years per capita income, consumption and gross capital formation in low- and middle-income countries remained well below 10 percent of the respective indicators in high-income countries. This trend suggests that there is barely any convergence across countries. Only China followed a different path, where per capita gross capital formation has substantially increased since the beginning of the century and is approaching 30 percent of that of high-income countries (figure 8.2).
Slowly converging income patterns may not eliminate substantial income differences for many decades. The persistence of huge income differentials among groups of countries may continue to drive mass economic migrations, which could become unmanageable should they combine with distress migration. In addition, large differences in gross per capita income feed inequalities in asset ownership, which is already extremely polarized. According to OXFAM, in 2016 just eight individuals possessed the same
wealth of the poorest 50 percent of the world’s population, and the World Bank highlights that polarization is even more extreme in Africa. Inequalities in asset ownership may in turn feed into future income inequalities, particularly if poor people are not granted opportunities to earn decent incomes, save or invest.
If trends continue, the target of ending hunger by 2030 will not be reached.Despite progress in reducing the prevalence of undernourishment, some 794 million people were estimated to be undernourished between 2014 and 2016. The most recent FAO projections of trends in undernourishment, provided in the report Achieving Zero Hunger, suggest that under a “business as usual” scenario, some 637 million people in low- and middle-income countries would be undernourished by 2030, most of them living in sub-Saharan Africa and South Asia (figure 8.4).
As improvements in food security are associated with increases in purchasing power, a twin-track approach is needed: one that combines investment in social protection, to immediately tackle undernourishment, with pro-poor investments in productive activities, to sustainably increase the income-earning opportunities of the poor.
TREND 8 POVERTY, INEQUALITY AND FOOD INSECURITY

| 29 |
T H E F U T U R E O F F O O D A N D A G R I C U L T U R E T R E N D S A N D C H A L L E N G E S
TREND 9
‘Triple burden’ of malnutrition remains a global health emergency.Malnutrition remains a global health emergency. The ‘triple burden’, which consists of undernutrition, micronutrient deficiencies, overweight and obesity, affects large proportions of the population worldwide. While it is promising to see that undernutrition is declining globally, almost 11 percent of the world’s population still go to bed hungry. In fact, there are parts of the world, such as sub-Saharan Africa, where the rate of stunting is not declining fast enough. Micronutrient deficiencies affect more than two billion people worldwide. Finally, overweight and obesity levels are increasing and affect men and women of all ages, owing to increased consumption of foods high in calories and fat and with added sugar or salt.
With the increases in food supply in recent decades, the world now produces more than enough food to satisfy the dietary needs of the entire global population. An analysis by food groups reveals that in the last 50 years, per capita caloric availability and the diversity of foods consumed have increased in both high-income and low- and middle-income countries (Figure 9.1a). Overall, the average dietary energy supply (DES) in low- and middle-income countries remains well below that of high-income countries, but the gap is gradually narrowing. In 1961, the DES of low- and middle-income countries was only 68 percent of that in high-income countries, but rose to 81 percent in 2011. By 2050, it is projected to reach 86 percent. Across all groups of food items, dietary patterns in the two groups of countries tend to
CONTINUES NEXT PAGE FIGURE 9.1B
NUTRITION AND HEALTH
FIGURE 9.1A PER CAPITA CALORIE INTAKE BY SOURCE, 1961–2050
0
500
1000
1500
2000
2500
3000
3500
kcal
/per
son/
day High-income countries
1961 1971 1981 1991 2001 2011 2030
2050
1961 1971 1981 1991 2001 2011 2030
2050
CerealsFruit, vegetablesMeat, milk, eggsOther Low- and middle-
income countries

Trends: Major drivers of change in the 21st century
| 30 |
converge – the ratios in Figure 9.1b are progressively getting closer to 1, except for the ratio for fruits and vegetables.
However, adequate food availability does not automatically imply adequate food intake by all. First, inequalities in income and other means of subsistence explain large differences in people’s access to food. Second, poorer households tend to face impediments to the adequate use of food, owing to a lack of access to facilities such as storage, cooking equipment and clean water, and to services such as health
care and basic nutrition education. Third, this dietary transition is partially reflected in improved access to more nutritious foods, including meat, dairy products, fruits and vegetables, but not necessary in the right balance. This trend, together with the rapidly growing consumption of processed foods that often incur excessive quantities of sugar, salt and preservatives, has given rise to concerns over the shift to less healthy diets and the increasing prevalence of micronutrient deficiency and overweight.
MADAGASCARChildren from the “Green Class” school project are
served lunch once a week using vegetables and legumes they have grown in the garden.
©FAO/Marco Longari.
SOURCE: FAO Global Perspectives Stduies, based on FAO. 2016. FAOSTAT WEBSITE: available at http://faostat.fao.org. Accessed October 2016; and N. Alexandratos, & J. Bruinsma, 2012. World agriculture towards 2030/2050: the 2012 revision. ESA Working Paper No. 12–03. Rome, FAO.
FIGURE 9.1B PER CAPITA CALORIE INTAKE IN LOW- AND MIDDLE-INCOME COUNTRIES COMPARED TO HIGH-INCOME COUNTRIES
0
0.2
0.4
0.6
0.8
1
1.2
1.4
1.6
1961 1971 1981 1991 2001 2011
2030
2050
Cereals
Fruit, vegetables
Meat, milk, eggs
Other
Ratio Projections
TREND 9 NUTRITION AND HEALTH

| 31 |
T H E F U T U R E O F F O O D A N D A G R I C U L T U R E T R E N D S A N D C H A L L E N G E S

Trends: Major drivers of change in the 21st century
| 32 |
TREND 10
The speed and patterns of structural change and agricultural transformation differ across regions.The overall economy has grown hand in hand with structural changes, such as a diminished importance of the agricultural sector and an increase of the services and industry sectors. While country and regional experiences vary, similar transformation patterns have been seen worldwide. Over the past 50 years, the relative contribution of agriculture to GDP has decreased almost everywhere (Figure 10.1).
To a lesser extent, agricultural employment shares have also declined in the last 20 years. Economic transformation and the increased efficiency of the agricultural sector gave rise to rural towns and small urban centres, which are part of rural socio-economic development. This trend has been reinforced by stronger economic links between rural and urban areas, which have contributed to reducing poverty, and often to closing the gaps between town and countryside in terms of quality of life indicators related to
SOURCE: Estimates based on World Bank. 2016. World Development Indicators (dataset). (Latest update: 14 October 2016). Accessed November 2016. WEBSITE: http://data.worldbank.org/data-catalog/world-development-indicators
STRUCTURAL CHANGE AND EMPLOYMENT
FIGURE 10.1 SECTORAL CONTRIBUTIONS TO AGGREGATE GDP, BY REGION, 1980–2010
1980 1990 2000 2010 1980 1990 2000 2010
Agriculture
Industry
Services
Perc
ent o
f GD
P
0
20
40
60
World High-incomecountries

| 33 |
T H E F U T U R E O F F O O D A N D A G R I C U L T U R E T R E N D S A N D C H A L L E N G E S
health, social welfare and livelihoods. However, in some instances, these transformation processes materialize at a very slow pace and present social and environmental drawbacks that challenge the conventional development paradigm. In Africa and South Asia in particular, land consolidation has not yet occurred, and in fact average farm sizes have become smaller through fragmentation. In other cases, labour mobility and young people’s unwillingness to remain in the sector lead to increases in the average age of farmers, stagnant or lower yields and less productivity. In many cases, whatever the type of sectoral transition, the unequal distribution of resources, especially capital, may result in less efficient outcomes and, occasionally, social tension.
Ineffective land policies and insecurity of tenure, due to missing land inventories and titling, limit owners’ investments in land and constrain productivity. Large commercial agricultural landholdings are contentious as they are often not transparent. Evidence shows they deliver poor results in terms of creating employment and generating revenues for the state.
Small-scale, non-farm enterprises can generate employment, particularly for youth, if institutional and financial constraints are addressed.In low- and middle-income countries, employment prospects for young people
are often bleaker, and their earning potential weaker, than those of their parents. It has been estimated that, globally, some 620 million young people are neither working nor studying. Young people in urban areas have recently expressed discontent about their situation, for example as seen during the Arab Spring. Most rural people, especially the young, who tend to be less educated than their urban peers, also face declining prospects for stable and remunerative employment. There are more people between the ages of 10 and 24 living today than ever before. In some low- and middle-income countries, they make up a third of the population.
There are four potential major pathways for creating employment for rural youth: full-time work on the family farm; part-time farm work combined with off-farm household enterprises; agricultural wage-earning employment; and full-time off-farm household enterprises. Off-farm, small-scale household businesses can provide productive and remunerative employment, when constraints arising from their informal status and lack of capital are addressed. Infrastructure investments may provide positive returns in terms of development and poverty reduction and can contribute to creating employment in agriculture and other sectors. But assessments are needed to select and prioritize interventions.

Trends: Major drivers of change in the 21st century
| 34 |
TREND 11
Poverty, climate change, conflicts and competition for natural resources are expected to fuel more distress migration.Conflicts, violence and natural disasters are among the root causes of migration and forced displacement. However, many migrants are compelled to move because of socio-economic factors, including poverty, food insecurity, lack of employment opportunities, limited access to social protection, natural resource depletion and the adverse impacts of environmental degradation and climate change.
The share of international migrants in destination countries is increasing – especially in high-income countries – and has started posing social challenges as migrants are often perceived as competitors for jobs and as a threat to wage levels. Nevertheless, in view of an ageing population and low fertility rates in several high-income countries, migration could provide benefits both for the recipient and the source countries.
The feminization of agriculture often increases women’s burdens, but also presents them with opportunities.As agriculture adopts labour-saving technologies, agricultural employment is expected to shrink, with both women and men moving into other sectors. However, while men may branch out of subsistence farming or of agriculture altogether, women in many low-income countries continue to stay in rural areas and work in agriculture, with trends towards agricultural feminization becoming prominent. In this role, women can improve gender inequality but only if they have a greater say in decision-making and in the control of household resources. While in most sub-Saharan African countries women have always constituted a large part of the agricultural labour force, trends towards agricultural feminization are especially prominent in the Near East and North Africa and in South and Central Asia. Between 1980 and 2010, the share of women employed in agriculture increased from about 30 percent to 43 percent
ALBANIAPreparing salted anchovies for packaging. The
EuroFish factory is an Italian-Albanian joint venture processing anchovies mostly for export
markets in Europe and overseas.©FAO/Gent Skhullaku
MIGRATION AND THE FEMINIZATION OF AGRICULTURE

| 35 |
T H E F U T U R E O F F O O D A N D A G R I C U L T U R E T R E N D S A N D C H A L L E N G E S
in North Africa, and from 35 percent to 48 percent in the Near East.
The growth in women’s share of agricultural employment is also apparent in a number of Latin American countries, including Chile, Ecuador and Peru.
Changes in food systems towards a more prominent role of commercial farms and increased consumption of processed food create some paid employment opportunities for women outside of family farms. However,
there is evidence that women working on commercial farms and in packing houses of high value-added supply chains tend to be concentrated in labour-intensive, low-skilled jobs.
The expanding role of women in agriculture can be empowering if their input and decisions hold more sway at home as well. However, it may also exacerbate women’s workloads, as infrastructure and institutions in low-income countries are rarely adapted to supporting working women.

Trends: Major drivers of change in the 21st century
| 36 |
TREND 12
While population growth increases the demand for agricultural products and stimulates farming activities, urbanization requires food to be easily processed, transported, stored and distributed. Thus, food processing and distribution have become key factors in the transformation of food systems.
Food production is changing along with retail channels.Agriculture and food production are increasingly supplying urban and peri-urban supermarkets. Between 2001 and 2014, the share of processed food distributed through supermarkets (including hypermarkets, discount and convenience stores) significantly increased in upper middle-income countries, from less than 40 percent to 50 percent. In the same period, the share grew from around 72 percent to 75 percent in high-income countries while in lower middle-income countries, it grew from 22 to 27 percent between 2001 and 2014 (figure 12.1).
Changes in retail channels are triggering significant impacts upstream. Supermarkets require standardized, industrially processed
food, which implies the creation of large-scale automated food processing plants. These plants in turn require regulated agricultural output which, in many cases, implies concentrated primary production and the consolidation of farmland. Therefore, value chains are progressively characterized by the vertical coordination – and in some instances the integration – of primary production, processing and distribution facilities, the automation of large-scale processing, higher capital and knowledge intensities and increased concentration of the agri-food sector in the hands of fewer agents.
While offering opportunities for generating formal employment, the transformation of value chains challenges small-scale farmers, for whom issues of financing, market accessibility and transport, as well as the range of standards related to quality, traceability and certification, make participation in integrated value chains difficult. Many smallholder farmers have become landless agricultural workers or migrated to towns and cities in search of
CHANGING FOOD SYSTEMS

| 37 |
T H E F U T U R E O F F O O D A N D A G R I C U L T U R E T R E N D S A N D C H A L L E N G E S
employment, further accelerating urbanization.
Longer food value chains may have a larger ecological footprint.As the pressure on scarce land and water resources increases, the agri-food sector must find ways of reducing its
environmental impact, which includes greenhouse gas emissions, water usage, food loss and waste, and its effects on soil health, ecosystem services and biodiversity.
However, evolving food systems increasingly lead to intensive production and longer food supply chains, which
FIGURE 12.1 SHARE OF THE FOOD RETAIL TRADE, BY CHANNEL AND REGION
Perc
ent
0
10
20
30
40
50
60
70
80
90
100
NorthAmerica
Europe MiddleEast/Africa
LatinAmerica
Other
Bars, kiosks
DiscountDrug stores
SmallsupermarketsConveniencestoresTraditionalstoresHypermarkets
Largesupermarkets
SOURCE: The Nielsen Company. 2015. The future of grocery. E-commerce, digital technology and changing shopping preferences around the world. New York, USA.
sug store

Trends: Major drivers of change in the 21st century
| 38 |
may be associated with higher GHG emissions from both production inputs (e.g. fertilizers, machinery, pesticides, veterinary products and transport) and activities beyond the farm gate (e.g. transportation, processing, and retailing). Global value chains have substantially increased the use of long-distance transport between primary production, processing and consumption.
The adoption of comparatively low-emission technologies in primary production phases could more than compensate for higher downstream
emissions from ‘long’ value chains. However, if technologies that produce high levels of GHG emissions are adopted to produce food that is transported far from its origin, this will result in comparatively higher GHG emissions. For instance, farmers in Kenya supplying leaf cabbage to local supermarkets use almost twice the amount of chemicals per unit of output that farmers normally use. If supplying supermarkets requires more chemical fertilizer and fossil energy per unit of output, GHG emissions may increase during the transition from ‘traditional’ to ‘modern’ value chains.
AFGHANISTANA young girl shopping for dairy products in a local store. FAO provides assistance to the milk processing sector to increase income for women in rural areas ©FAO/Danfung Dennis.
TREND 12 CHANGING FOOD SYSTEMS

| 39 |
T H E F U T U R E O F F O O D A N D A G R I C U L T U R E T R E N D S A N D C H A L L E N G E S
TREND 13
Globally, around one-third of all food produced is lost or wasted.A further indication of the inefficiency of current food systems is that around one-third of all food produced is either lost or wasted somewhere along the food chain. This can happen both in primary production and in processing and consumption (figure 13.1). Estimates suggest that the energy embedded in the lost or wasted food would amount to over ten percent of the world’s total
energy consumption for producing food, whereas further environmental footprints involve the generation of GHG emissions and the waste of natural resources to produce the lost food.
In low-income countries, significant levels of food losses occur upstream, at harvest and during post-harvest handling, owing to poor infrastructure, low levels of technology, a limited knowledge base and lack of investment
FOOD LOSSES AND WASTE
FIGURE 13.1 DISTRIBUTION OF FOOD LOSSES AND WASTE ALONG THE SUPPLY CHAIN
SOURCE: HLPE. 2014. Food losses and waste in the context of sustainable food systems. A report by the High Level Panel of Experts on Food Security and Nutrition of the Committee on World Food Security. Rome; and FAO. 2011. Global food losses and food waste. Extent, causes and prevention. Rome.
Consumption
Distribution
Processing, packagingPost-harvest
Harvest
Perc
ent
3.5 3.4 6.6
7.57.8
12.7
9.63.4 3.9 3.1
7.56.3
4.5
2.72.4 2.24.4
4.15.6
4.6
4.612.6 10.6
10.3
3.75.5
1.3
2.6
NorthAmerica/Oceania
Europe (incl. RussianFederation)
Japan/Republic
of Korea/ China
LatinAmerica
North Africa/ West and
Central Asia
Sub-SaharanAfrica
SouthSoutheast
Asia
10.5 11.39.0
13.410.8 12.5
8.7
0
10
15
20
25
30
35
40
5

Trends: Major drivers of change in the 21st century
| 40 |
in production. Food losses also tend to be caused by managerial and technical constraints in harvesting, storing, transporting, processing, packaging and marketing. The greatest losses occur in small- and medium-scale agricultural and fisheries production and processing sectors. Uncertainty about weather and market conditions and weak institutional frameworks also contribute to losses. Each year in Africa, around 13 million tonnes of cereals – or more than 15 percent of total cereal production – are lost during post-harvest operations. In North America, Europe, Japan and China, around 15 percent of food is lost
or wasted during the distribution and consumption stages. This percentage is lower in North Africa and Central Asia (11 percent) and much lower in Latin America, South and Southeast Asia and sub-Saharan Africa (5.9 to 7.8 percent).
Quantifying trends in food losses and waste is not easy as food supply chains are being transformed, vary greatly by region and involve several actors. Despite this, mounting evidence of the extent of food losses and waste has led to calls for action, including efforts to monitor a Global Food Loss Index and raise awareness to change people’s behaviour.
General views of food waste.©FAO/Jonathan Bloom.
TREND 13 FOOD LOSSES AND WASTE

| 41 |
T H E F U T U R E O F F O O D A N D A G R I C U L T U R E T R E N D S A N D C H A L L E N G E S
TREND 14
For more than two decades, beginning in the early 1990s, expert thinking in the international development community was predominantly focused on the concept of promoting ‘good governance’, i.e. improving transparency, broadening participation and ensuring social inclusion in deliberative processes, eliminating corruption and promoting institutional reform. Backed by good governance programme loans, enormous investments were made in fostering new standards of financial management and public administration, with progress to be tracked through monitoring systems and specific indicators of ‘good governance’.
A key limitation of the good governance agenda was that it was too formal and procedurally oriented to address the complex policy bottlenecks and political conflicts that impede effective governance. At the same time, governments became increasingly less willing to invest in programmes that offered few tangible benefits and were seen as a diversion from more important development objectives. Finally, over the past decade, the preponderant wisdom favoured a more modest
and pragmatic agenda, defined by a commitment to iterative, bottom-up, problem-solving and experimentalist approaches to improved or more effective governance.
Achieving Sustainable Development Goals requires a new governance framework.To be effective, efforts to achieve the Sustainable Development Goals (SDGs) require awareness of the crucial role that responsible and effective global and national governance could play in achieving key development objectives. This is because: 1) no country is on a sustainable pathway and no country can achieve all the goals on its own; 2) global goals are to be achieved from a “bottom-up” perspective; 3) both national resources and private partnerships need to be mobilized; 4) policies should be coherent, as development is complex and should involve all actors and sectors; 5) the 2030 Agenda promotes an expanded cooperation to improve access to finance, investment, markets and technology, policy support and capacity development; and 6) the global framework of indicators to monitor progress strongly implies the concept of ‘mutual accountability’.
GOVERNANCE FOR FOOD SECURITY AND NUTRITION

Trends: Major drivers of change in the 21st century
| 42 |
TREND 15
The landscape for development finance is changing.Development finance is the most effective means of stimulating economic growth and reducing poverty. This landscape is changing, however, with significant increases in the level of financial flows to low- and
middle-income countries and private finance (especially foreign direct investment and bonds) and domestic resource mobilization gaining more importance.
Adequate financing is one of the main challenges to the success of the 2030
SOURCE: OECD. 2015. Development Cooperation Report 2015. Making partnerships effective coalitions for action. Paris, OECD Publishing
MALAWIOne of the beneficiaries of the Social Cash Transfer Programme, standing with her bicycle outside her home. ©FAO/Amos Gumulira.
FIGURE 15.2 COMPOSITION OF FINANCIAL FLOWS TO LOW-INCOME COUNTRIES, 2012
Perc
ent
0
10
20
30
40
50
60
70
80
90
100
Least developedcountries
Lower middle-income
countries
Uppermiddle-income
countries
Remittances
Private grants
DEVELOPMENT FINANCE

| 43 |
T H E F U T U R E O F F O O D A N D A G R I C U L T U R E T R E N D S A N D C H A L L E N G E S
Agenda, whereby though the public sector is not a major investor, it can play a catalytic role in shaping policies and the regulatory framework. New funding mechanisms such as the Green Climate Fund have emerged, and can have multiplier effects in leveraging public and private investment flows.
Official development assistance (ODA) remains a significant source of finance for low-income countries, fragile states and states in conflict. While
the share of ODA in overall external financing for upper-middle-income countries is relatively small – they now rely primarily on private flows in the form of foreign direct investment (FDI) and bonds – they nonetheless receive 40 percent of ODA grants. In a post-2015 world, traditional ODA and domestic resource mobilization are likely to remain important to finance development efforts of low-income countries. However, they may not be enough to finance efforts that meet the global ambitions of the SDGs.

| 44 |
Global challenges facing food and agriculture

T H E F U T U R E O F F O O D A N D A G R I C U L T U R E T R E N D S A N D C H A L L E N G E S
| 45 |
CHALLENGES TO FOOD STABILITY AND AVAILABILITYSustainably improve agricultural productivity to meet increasing demand. Substantial improvements in resource-use efficiency and resource conservation will be needed if we are to collectively achieve the projected increase of food demand by 50 percent between 2012 and 2050.
Ensure a sustainable natural resource base. Because of recent and continuous expansion, agricultural land is constrained and water is becoming scarce, so any increases in agricultural production will need to come mainly from conservation and the efficient use of natural resources.
Address climate change and intensification of natural hazards. Maintaining the capacity of the planet’s natural resource base to feed the growing world population, while reducing agriculture’s environmental and climate footprint, are critical to ensuring the welfare of current and future generations.
Prevent transboundary pests and diseases. Controlling transboundary pests and diseases is a major factor in maximizing plant and animal production and food safety. It will require international coordination and capacities to understand the risks and then to control, prevent and eventually eradicate all such pests and diseases.
CHALLENGES TO FOOD ACCESS AND UTILIZATION
Eradicate extreme poverty and reduce inequality. Most of the world’s poor and hungry are rural people who earn a meagre living from agriculture, fisheries and forestry. However, pro-poor growth depends on factors that go beyond agriculture: it implies access to good quality education, economic diversification to rural non-farm income-generating activities, support to job creation, and adequate social protection mechanisms, all of which need funding.
End hunger and all forms of malnutrition. Average per capita income growth is expected to result in positive nutritional outcomes as more people
Highlighted trends point to specific challenges that food and agriculture must face if hunger, food insecurity and malnutrition are to be eradicated by 2030.
The challenges identified are all pertinent to the FAO mission of
achieving food security for all, improving rural livelihoods and making agriculture, fisheries and forestry and their natural resource base more resilient, productive and sustainable. They all have one overall challenge: they need to be addressed as a whole and in a systemic manner.

| 46 |
consume animal products and foods rich in fat and sugars. However, combined with urban sedentary lifestyles, all forms of malnutrition may be at risk of increasing – undernutrition, micronutrient deficiencies, overweight and obesity.
Improve income-earning opportunities in rural areas and address the root causes of migration. Managing migration flows and improving income and investment opportunities in rural areas will require additional efforts to ensure that the weakest participate in the benefits of market integration and investment in agriculture and to address the root causes of migration.
Build resilience to protracted crises, disasters and conflicts. More risk-informed, inclusive and equitable resilience and development processes will be essential to preventing increasing conflicts around the world.
SYSTEMIC CHALLENGES
Make food systems more efficient, inclusive and resilient. Changes in food systems are creating new concerns and challenges regarding the nutrient content of foods, the ecological footprint of food value-chains and the participation of smallholders in these chains.
Meet the needs for coherent and effective national and international governance. The challenges facing food and agriculture are largely interconnected, as highlighted in the 2030 Agenda for Sustainable Development and related global agreements. Addressing all these challenges will require integrated national and international approaches that move away from sector-specific policy-making. It will also require avoiding past deficiencies in global and national governance mechanisms,
regulatory systems, and monitoring and accountability frameworks.
CAN WE SUSTAINABLY FEED A WORLD POPULATION OF 11 BILLION BY 2100?
Several key conclusions can be drawn from the preceding review and analysis of the global trends that are influencing food security, poverty and hunger, and the sustainability of agriculture and food systems. First, overall demand for food will continue to increase, and will do so in the context of dwindling natural resources and important changes to the structural composition of the demand for food and agricultural products. Climate change and increased competition will continue to contribute to natural resource degradation and scarcity, with negative impacts on people’s livelihoods and food security. Problems of extreme poverty, hunger, food insecurity and undernourishment
Global challenges facing food and agriculture

T H E F U T U R E O F F O O D A N D A G R I C U L T U R E T R E N D S A N D C H A L L E N G E S
| 47 |
will persist, along with increases in overweight, obesity and diet-related chronic diseases.
Natural disasters are increasing in number and intensity and, along with climate change-related extreme weather events, are expected to deepen the global need for humanitarian assistance and resilience-building for farmers and rural households. At the same time, transboundary plant pests and diseases and other emerging threats continue to provoke crises in agricultural and food systems and impact productivity and human health. Conflicts are continuing and could intensify in many parts of the world, with widespread economic and social consequences, beyond the afflicted countries.Dynamic rural transformation is taking place in most low-income countries and is expected to continue. This will have impacts on agricultural production systems, employment, nutrition
and migration and will present society with the challenge of finding ways to include everyone in the development process.
Rapid changes and transitions in food systems increasingly call for effective national and international governance systems, as well as evidence-based and well targeted policy responses. More investment in agriculture and agrifood systems, including increased spending on research and development, is needed to enhance agricultural productivity and promote innovation for sustainable agriculture, rural prosperity and food security.
Looking ahead, current systems may well be able to produce enough food, but if they are to do so in an inclusive and sustainable manner they will require a major overhaul.The international community is acutely aware of these challenges. In particular, the 2030
Agenda for Sustainable Development adopted in September 2015 provides a compelling but challenging vision on how multiple objectives can be combined to define new sustainable development pathways. Achievements will depend on how policy-makers and stakeholders integrate different actions to reach interconnected objectives and face mutual challenges. On the path to sustainable development, all countries are interdependent.
Sustainable development is a universal challenge and the collective responsibility lies with all countries. This requires fundamental changes in the way all societies produce and consume. ‘Business as usual’ is no longer an option. Major changes are required in agricultural systems, rural economies and natural resource management to overcome multiple challenges and ensure a secure and healthy future for everyone and the environment.

| 48 |
The purpose of this report is to increase understanding of the nature of the challenges that agriculture and food systems are facing now and will face into the 21st century.
Its analysis of 15 global trends provides insights into what is at stake and what needs to be done. Most of the trends are strongly interdependent and, combined, inform a set of 10 challenges to achieving food security and nutrition for all and making agriculture sustainable. ‘Business-as-usual’ is not an option. Major transformations in agricultural systems, rural economies and natural resource management will be needed if we are to realize the full potential of food and agriculture to ensure a secure and healthy future for all people and the entire planet.
THE FUTURE OF FOOD AND AGRICULTURETRENDS AND CHALLENGES
S U M M A R Y V E R S I O N
The publication The Future of Food and Agriculture: Trends and Challenges is available at: www.fao.org/3/a-i6583e.pdf I6
881E
N/1/
02.17