Embed Size (px)
Citation preview

North West Irish Sea Mounds: Hard and Soft
Substrata Habitats
JNCC Contract Reference No: F90-01-942(8)
1

Personnel involved in this project:
Adam Mellor Ph.D. Queen’s University of Belfast (QUB)
Annika Mitchell M.Sc. Queen’s University of Belfast (QUB)
James Strong Ph.D. Queen’s University of Belfast (QUB)
Laurence Rooney B.Sc. Queen’s University of Belfast (QUB)
Matthew Service Ph.D. Agri-Food and Biosciences Institute (AFBI)
2

Executive Summary
• Since June 2003 a number of acoustic and biological surveys have been
conducted in the area of the North Channel north west of the Isle of Man adjacent
to the boundary of the NW Irish Sea “mud patch”.
• The area has been identified as a potential offshore SAC (Special Area for
Conservation) for Annex I reef habitat, principally rocky reef habitat.
• In June 2006 the area was mapped using multi-beam sonar and a number of
potential habitat features identified.
• A series of cruises attempting to characterise the primary biological features of
the area were undertaken in November 2006 and January/February 2007.
• The report contains the interpretation of both the soft bottom infauna data and
epifauna data together with supporting physical descriptors.
• Based on the Natura 2000 Code 1170 definition of reefs/ EC Habitats Directive
Interpretation Manual, the report concludes that this site represents Annex I reef
habitat.
• A number of important sub-features in the area are also discussed, in particular
small pockets of firmer sediment between rock surfaces were often characterised
by dense tube worm communities (Galathowenia oculata and Melinna palmata).
• The main anthropogenic activity in the area is commercial fishing.
3

Contents
Section Page
1.0 Introduction 5
1.1 Background data 7
1.2 Approach 8
2.0 Materials and Methods 8
2.1 Research cruises 8
2.2 Use of Optimal Allocation Analysis to guide ground-truthing effort 9
2.3 Field Methods 15
2.3.1 Infaunal Grabs and Particle Size Sampling 15
2.3.2 Sediment processing and analysis 15
2.3.3 Infauna analysis 16
2.3.4 Video & Stills image acquisition 16
2.4 Data Analysis 17
3.0 Results 19
3.1 Soft Substrata Habitats 21
3.2 Hard Substrata Habitats 29
3.3 Biotope Based Habitat Map 38
3.4 Photographic stills from North West Irish Sea Mounds Survey 2007 43
4.0 Discussion and Conclusions 47
5.0 References 50
6.0 Acknowledgements 51
7.0 Appendix 52
4

1.0 Introduction
The North West Irish Sea Mounds are a group of bedrock outcrops in a region of the Irish
Sea known as the North Channel, which separates Northern Ireland and Scotland (Figure
1). These mounds were originally identified and mapped by the United Kingdom
Hydrographic Office (Admiralty Charts) and British Geological Survey (BGS) who
described them as bedrock outcrops in an otherwise fairly homogeneous, deep
sedimentary region. In 2003 a survey of the area was undertaken as part of the Irish Sea
Pilot (Golding et al, 2004), which confirmed that a number of the bathymetric peaks were
bedrock outcrops, or ‘reefs’, which are listed under Annex I of the Habitats Directive as
being of conservation importance. In-between the reef areas appear to be large expanses
of soft sediments, which are bioturbated by megafauna such as Nephrops norvegicus.
5

Figure 1. Location of the North West Irish Sea Mounds in relation to Great Britain and Ireland.
6

As a first stage in producing a biotope map for the area, which is a pre-requisite to
consideration for marine protection, a multibeam echosounder (MBES) survey was
undertaken in June 2006. The results of this survey are presented, along with a synthesis
of existing data, in the 2006 North West Irish Sea Mounds report (Mitchell et al, 2006).
Recommendations from the 2006 report were used in the planning of the biological
survey for this report.
1.1 Background data
The biological survey was restricted to the south-east corner of the 2006 multibeam
survey area in order to constrain the survey effort within offshore waters (>12nm). The
biological survey was also extended further to the south-east to cover potential reef areas
identified by the BGS (Graham et al, 2001) (see Figure 2 below). A previous survey in
2003 identified two significant bathymetric ‘highs’ (shallowings) from RoxAnn AGDS
data, rising from –148m to –55m. The more southerly peak had been examined by
underwater video, which revealed a bedrock reef with a veneer of shelly mud of varying
thickness with the brittlestars Ophiothrix fragilis and Ophiocomina nigra abundant, the
squat lobster Munida rugosa common and patches of hydrozoan turf. Sloping rock walls
showed the highest diversity of epifauna, with dense patches of Alcyonium digitatum,
Urticina eques and Metridium senile common, and Echinus esculentus frequent. Before
the current survey, the large bathymetric rise in the centre of the RoxAnn interpolated
depth image had not been ground-truthed. Multibeam sonar data from the 2006 survey
have provided high resolution bathymetry for the survey site and allowed physical
classification of the site into six substrata zones (Mitchell et al, 2006). These zones are:
1. Low relief bedrock
2. Homogeneous sedimentary plain (Nephrops bioturbated mud?)
3. Deep (>100m) medium-high relief bedrock outcrops (slope > 4o)
4. Shallow (<100m) medium-high relief bedrock outcrops (slope > 4o)
5. Coarse and/or mixed sediment
6. Mixed sediment with boulder or cobble fields (plus possible sediment veneer)
7

The objectives of the investigation were:
a. to undertake biological characterisation of the physical seabed types
identified in the geomorphological survey (Mitchell et al, 2006) to highest
biotope level.
b. to produce a detailed seabed habitat map, based on the integration of
geomorphological (Mitchell et al, 2006) and biological data.
1.2 Approach
For the biological mapping of the soft substrata, the clustering and classification of areas
particle size samples have been used as the primary tool. The assumption here is that
particle size parameters dictate infaunal community characteristics, hence these have
been used as the primary unit. All of the particle size data collected in 2003, 2006 and
2007 are classified into groups which should represent biologically meaningful zones.
Where particle size points are paired with infaunal data this is used to confirm whether
distinct communities are present and what the characterizing species are of that habitat.
For the hard substrata, the video footage from the drop-down camera and epibenthic
video sledge was used to directly characterize the physical nature of the seabed and the
major taxa present.
2.0 Materials and Methods
2.1 Research cruises
In total, input from four separate research cruises is used in this report. Grab and video
sampling throughout the North West Irish Sea Mounds area was undertaken in February
2003 (AFBI Cruise Reports 2003). Additional grabs were collected in November 2006
specifically in the south-eastern area of interest (AFBI Cruise Reports 2006). Within the
same area, a new video and grab campaign was also undertaken in January 2007
8

(22/01/07-23/01/07) from RV Corystes. However, due to poor visibility on the initial
cruise a supplementary survey was used to collect additional video footage (25/02/07 RV
Corystes).
2.2 Use of Optimal Allocation Analysis to guide ground-truthing effort
As part of the Development of a Framework for Mapping European Seabed Habitats
(MESH) project (Interreg IIIB) a number of methods have been investigated into
improving survey design. One such method has been the application of Optimal
Allocation Analysis (OAA) to the design of ground-truthing surveys. The idea behind this
method is to utilise existing broad-scale, full coverage datasets such as acoustic or optical
remote sensing to guide ground-truthing for habitat mapping in an objective manner. This
rests upon the assumption that the remotely-sensed variables such as bathymetry and
backscatter may indicate habitat heterogeneity. The variables can be classified using a
number of unsupervised methods (see section 2.3 below) or manually classified into areas
of similar characteristics, known as ‘ground-types’. The underlying remotely-sensed data
for each of the resulting ground-types may be readily extracted through a GIS (using
Zonal Statistics in Spatial Analyst Tools) and the statistics of these variables calculated
for each ground-type (e.g. mean, variance, sum etc.). The summary statistics can then be
used for the OAA which will use these to assess the variance of each ground-type and
also consider the area of each ground-type, which when coupled with either a maximum
number of potential samples or a set coefficient of variance (CoV; a measure of
precision) will calculate the optimal number of samples required for ground-truthing each
ground-type. Both the CoV and maximum number of samples for the entire survey area
can be readily manipulated depending on the users requirements. The recommended
number of samples is provided in the same units as the ground-type areas are provided in
(usually m2, for instance). Where a number of remotely-sensed variables (including those
derived from bathymetry) would ideally be considered in such an analysis (for example
slope, rugosity, backscatter, aspect), these can all be incorporated into the OAA and the
results for each variable inspected, and if applicable the results for each variable can be
averaged.
9

In the case of the North West Irish Sea Mounds site, it was deemed that the variables
slope, backscatter and aspect were likely to be most representative of habitat
heterogeneity. For JNCC potential offshore SAC designation purposes, the survey area
was clipped to include largely the area falling outside the 12nM limit. The summary
statistics for each of these variables were extracted for the six substrata zones identified
by the Benthic Terrain Modeller for the clipped area, and entered into an Excel
spreadsheet containing embedded calculations for OAA. The area of each zone was also
added (in m2). The CoV was set at 5% (i.e. 95% precision) for calculating the optimal
sample numbers per ground-type. The results for each variable, and the average scores,
are presented in Table 1 below:
Table 1. Sample numbers required for a CoV of 5% for each ground-type (‘zone’) within the clipped area. Samples are in m2.
Slope angle Backscatter Aspect Average Total samples 113 65 127 102 Zone 1 12 7 16 12 Zone 2 18 28 58 35 Zone 3 46 8 12 22 Zone 4 13 2 5 7 Zone 5 18 16 30 21 Zone 6 5 3 6 5
Although the OAA recommends the number of samples for each ground-type, it does not
advise where these should be placed within each ground-type or what sampling
equipment should be used. In sedimentary regions it is generally accepted that the
biology of such areas is dominated by infauna, and therefore an appropriate infaunal
sampling tool will be required, such as a Day grab. Such samples cover a very small area,
for instance the Day grab bite aperture is 0.1m2, and therefore each 1m2 sample
recommended by the OAA will in reality require ten grab samples to cover such an area.
However, conversely, where the ground-type is likely to be reef or cobbles/boulders
epifauna will dominate the biological community, and a suitable sampling platform for
such communities would be a video/camera system (if visibility is adequate). Video
systems can cover a larger area in less time than grab sampling, with the field of view at
10

any one point usually approximating 1m2. It is therefore quite simple to cover the
recommended sample area with video tows/drops on the bedrock zones but much more
time consuming to sample the recommended area in the sedimentary zones.
In order to assess how much sampling, and using what equipment, was required to
achieve a precision of 95% for the North West Irish Sea Mounds site for the 2007
surveys, it was first necessary to incorporate the coverage of pre-existing ground-truthing
(from 2003 and 2006; see section 1.1 above). Each existing Day grab was considered to
represent 0.1m2, and the video drops area coverage was calculated by multiplying the tow
length (in m, as measured on GIS) by 1m2. If any of the footage was of poor quality (e.g.
bad visibility or too far off the seafloor) this reduced the area covered that could be used
for further analysis, however as long tows were made any loss of usable footage was
considered to have a minimal impact on the analysis below. The pre-existing ground-
truthing coverage (prior to the 2007 surveys) amongst each ground-type within the
clipped area is provided in Table 2 below.
Table 2. Existing coverage of ground-truthing for each ground-type within the clipped area (in m2).
Ground-type Video2006 Video2003 Grabs2006 Grabs2003 Total 1. low relief bedrock (sediment veneer?) 125 0.2 0.1 125.32. homogeneous sedimentary plain (bioturbated mud?) 0.7 0.7 3. deep (>100m) med-high relief bedrock outcrops 0.1 0.1 4. shallow (<100m) med-high relief bedrock outcrops 168 0.5 168.55. coarse / mixed sediment 0.5 0.5 6. mixed sediment / cobble & boulder fields
TOTAL 0 293 2 0.1 295.1
It was evident that in all but ground-types 1 and 4 (low relief bedrock and shallow med-
high relief bedrock outcrops) sampling prior to the 2007 survey was below that
recommended by the OAA. In addition, although ground-type 1 (low relief bedrock) had
11

effectively been ‘over-sampled’ according to the OAA, this actually only consisted of one
long video transect on one bedrock outcrop and it was noted from examination of this
footage that much of this area was covered in a thick sediment veneer and was therefore
likely to be characterised by both epifauna and infauna. Only three grab samples had been
taken on this ground-type and therefore it was recommended that additional grab samples
be taken in order to characterise the infauna as well as analysis of the video for epifauna
community analysis/description. Three of the under-sampled ground-types were largely
sedimentary and the 2003 footage indicated that the bedrock ground-types may also be
covered by a sediment veneer. In order to characterise the infaunal community of such
areas it was determined that grab or core samples should be taken, however it was also
decided to obtain additional video to provide a ‘landscape’ view of the habitat and detect
key epifauna species that could be critical in structuring the sediment, such as Nephrops
norvegicus and Thalassinid shrimps. In addition video may provide an idea of the
heterogeneity of the habitat that may relate to a similar spatial scale as that detected by
the acoustic remote-sensing. To address these issues, for sedimentary ground-types the
total recommended sampling area for the 2007 survey was divided into a third to be
sampled by video tows and two-thirds to be sampled by grabs or cores. Some of the
grab/core samples were selected to target habitat patches targeted by the video
drops/tows. In addition, due to the time at which the OAA was carried out, the
distribution of ground-truthing between ground-types from previous surveys did not
follow that recommended by the OAA. When considering these points, additional
sampling was suggested as provided in Table 3.
Using the above recommendations for additional ground-truthing, a series of locations
were selected for the forthcoming sampling program. These are presented in Figure 2.
12
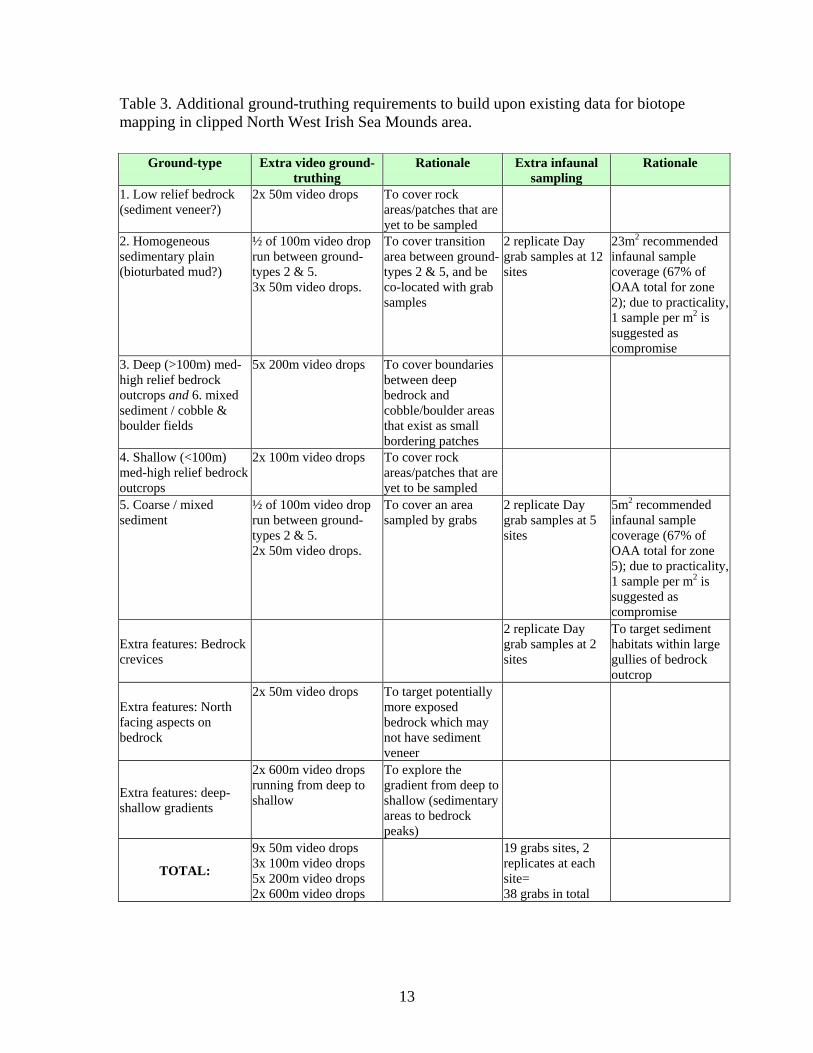
Table 3. Additional ground-truthing requirements to build upon existing data for biotope mapping in clipped North West Irish Sea Mounds area.
Ground-type Extra video ground-truthing
Rationale Extra infaunal sampling
Rationale
1. Low relief bedrock (sediment veneer?)
2x 50m video drops To cover rock areas/patches that are yet to be sampled
2. Homogeneous sedimentary plain (bioturbated mud?)
½ of 100m video drop run between ground-types 2 & 5. 3x 50m video drops.
To cover transition area between ground-types 2 & 5, and be co-located with grab samples
2 replicate Day grab samples at 12 sites
23m2 recommended infaunal sample coverage (67% of OAA total for zone 2); due to practicality, 1 sample per m2 is suggested as compromise
3. Deep (>100m) med-high relief bedrock outcrops and 6. mixed sediment / cobble & boulder fields
5x 200m video drops To cover boundaries between deep bedrock and cobble/boulder areas that exist as small bordering patches
4. Shallow (<100m) med-high relief bedrock outcrops
2x 100m video drops To cover rock areas/patches that are yet to be sampled
5. Coarse / mixed sediment
½ of 100m video drop run between ground-types 2 & 5. 2x 50m video drops.
To cover an area sampled by grabs
2 replicate Day grab samples at 5 sites
5m2 recommended infaunal sample coverage (67% of OAA total for zone 5); due to practicality, 1 sample per m2 is suggested as compromise
Extra features: Bedrock crevices
2 replicate Day grab samples at 2 sites
To target sediment habitats within large gullies of bedrock outcrop
Extra features: North facing aspects on bedrock
2x 50m video drops To target potentially more exposed bedrock which may not have sediment veneer
Extra features: deep-shallow gradients
2x 600m video drops running from deep to shallow
To explore the gradient from deep to shallow (sedimentary areas to bedrock peaks)
TOTAL:
9x 50m video drops 3x 100m video drops 5x 200m video drops 2x 600m video drops
19 grabs sites, 2 replicates at each site= 38 grabs in total
13

Figure 2. Location of ground truthing sites from the 2003 and 2006 surveys, and planned targets for the 2007 survey, implementing the recommendations from the OAA. (table of positions provided in Annex).
14
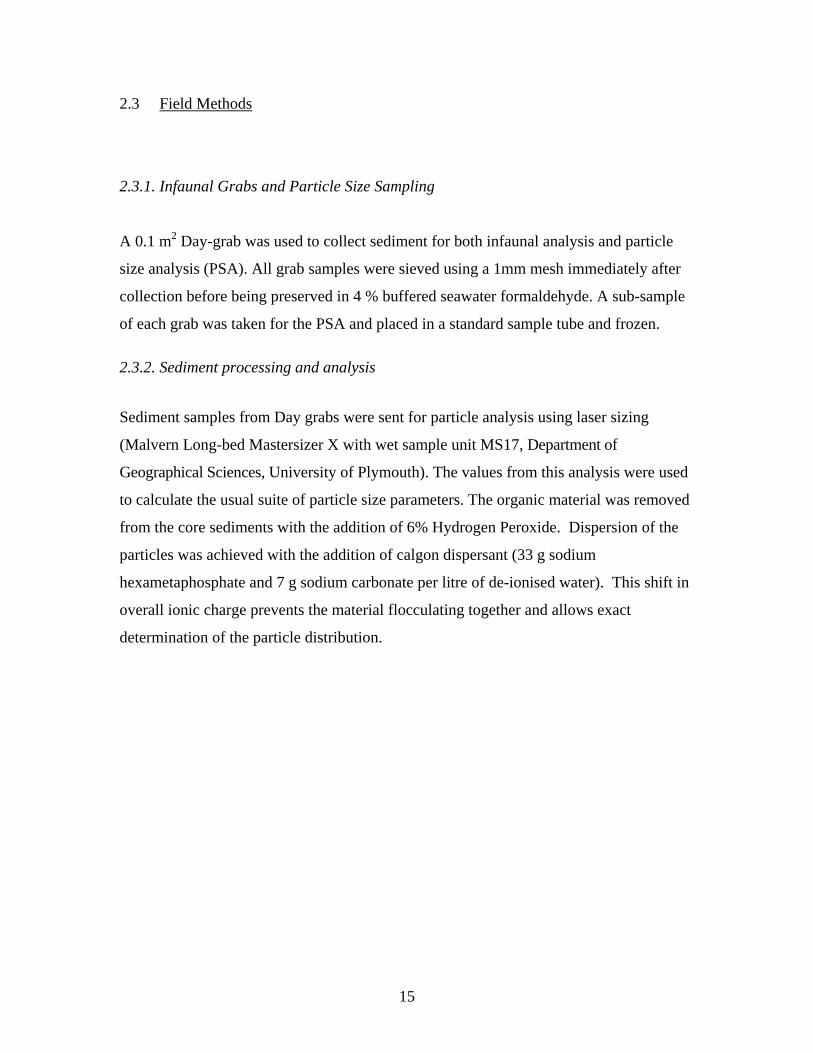
2.3 Field Methods
2.3.1. Infaunal Grabs and Particle Size Sampling
A 0.1 m2 Day-grab was used to collect sediment for both infaunal analysis and particle
size analysis (PSA). All grab samples were sieved using a 1mm mesh immediately after
collection before being preserved in 4 % buffered seawater formaldehyde. A sub-sample
of each grab was taken for the PSA and placed in a standard sample tube and frozen.
2.3.2. Sediment processing and analysis
Sediment samples from Day grabs were sent for particle analysis using laser sizing
(Malvern Long-bed Mastersizer X with wet sample unit MS17, Department of
Geographical Sciences, University of Plymouth). The values from this analysis were used
to calculate the usual suite of particle size parameters. The organic material was removed
from the core sediments with the addition of 6% Hydrogen Peroxide. Dispersion of the
particles was achieved with the addition of calgon dispersant (33 g sodium
hexametaphosphate and 7 g sodium carbonate per litre of de-ionised water). This shift in
overall ionic charge prevents the material flocculating together and allows exact
determination of the particle distribution.
15

2.3.3. Infauna analysis
Infauna analysis was carried out by an NMBAQC accredited contractor (ERT,
Edinburgh). Only infauna retained on a 1mm sieve were identified. All species were
counted and weighed for total biomass. Infaunal data were filtered and standardised by
the exclusion of colonial and epifaunal species, such as hydroids and barnacles, and
juvenile fauna unassigned to a species.
2.3.4. Video & Stills image acquisition
Video transects were made using a towed video sledge and drop frame. Both systems had
a video camera, stills camera and lights. The video camera was a Kongsberg-Simrad
Osprey underwater camera operated by a Simrad video control deck unit recording
directly to a Sony DVD recorder. A stills camera system (Photosea 1000A 35 mm
cameras and Photosea 1500S strobe) was also fitted to the sledge and operated through
the Simrad video control unit. Slide film (Kodak or Fuji 200 ASA) was used, with the
resulting stills scanned onto computer using a Nikon CoolScan IV slide scanner. These
images were enhanced using Adobe Photoshop (brightness, contrast and colour adjusted),
and catalogued with positional information, which was determined as far as possible
using the associated video footage and field log notes. Positional information was
imprinted on the video records using a dGPS linked to TrakView overlay system.
16
The majority of the video footage from the North West Irish Sea Mounds was of a fairly
poor quality as a result of the reduced visibility. The stills photographs from the first
three cruises were also poor, with back-scatter making many of the pictures unusable.
Stills collected on the final cruise were significantly better and their higher resolution
facilitated the identification of some of the epifaunal species. Both the epibenthic video
sledge and the drop-down cameras were fitted with the IPS USBL. An intermittent fault
developed with the tracker on some of the video ground truthing surveys. Therefore, all
layback corrections have been undertaken with a Pythagoras calculation verified by the
USBL.
2.4. Data Analysis
Using the mean particle diameter, sorting, % silt and % clay, all of the sediment samples
underwent hierarchical clustering in SPSS. The coefficients presented in the
agglomeration schedule were used to find the optimum number of clusters. Having
established the membership of each sediment sample, the summary statistics for each
cluster were calculated. Where possible, paired infaunal data were assigned to the same
clusters identified by the hierarchical analysis. The complete infaunal dataset, with each
sample assigned membership to a cluster, was imported into PRIMER (Plymouth
Routines in Multivariate Ecological Research). To confirm that each particle size cluster
was biologically meaningful and generated distinct communities, the infaunal data were
tested with ANOSIM. Following this, the clustered infauna were analyzed with SIMPER
to highlight the characteristic species within a grouping and hence dissimilarity between
groupings.
Video footage, classified according to substrata type and obvious fauna every 30 seconds,
was overlaid onto the predicted physical zones generated in the 2006 report (Mitchell et
al, 2006). Using Spatial Analyst tools in ArcGIS, the zone type under each video
observation was extracted. The results of the predicted zone type and the observed
type/biotope were cross tabulated.
17

Videos were analysed in the laboratory in combination with the field notes and high-
resolution stills in order to assist with species identification and sediment categorisation.
Video quality was typically not good enough to make species or detailed biotope
identification reliable. The footage was paused every 30 seconds and details of the
physical substratum made; these classifications were later reclassified to match the
physical zones used in the 2006 report. When possible, notes were also made on the
communities present, although estimation against the SACFOR abundance scale was not
possible.
Biotope selection was performed by identifying characteristic infauna and sediment from
each confirmed zone type. Each individual member (a member is one sediment sample
and its associated infauna) of a cluster identified by the multivariate analysis had its most
abundant ten species selected and pooled. This aggregated data for each cluster was then
ranked to provide a reduced ranked species list of the most commonly occurring species
within the cluster. This list (for each of the four clusters) was used in combination with
the epifauna from the video and stills camera and the sediment analysis to match up to the
characteristic biotope in the JNCC Marine Habitat Classification for Britain and Ireland
(Connor et al 2004).
The biotope selection process was performed by cross matching species lists from each
biotope description to the clusters reduced ranked species list from the infauna in a data
matrix. This matrix provides a score, which indicates the strongest matches between the
infauna and the species lists in the Habitat Classification scheme. This matrix matching
procedure was repeated for each cluster identified by the multivariate analysis. The
potential biotopes were then reviewed for each example whilst considering the
environmental, video/stills and sediment data, allowing a more comprehensive and
holistic interpretation of the data. Exclusion of remaining biotope descriptions and the
selection of the most likely biotope from the classification scheme were then performed.
18

3.0 Results
The GIS project “North West Irish Sea Mounds Biology 2007” and the 2006 GIS project
“North Channel Peaks 2006” containing all data from survey are contained in the digital
appendix.
Nineteen video tows, covering a total distance of 2950 meters, were proposed following
the recommendations from the OAA. Nineteen video tows were obtained during the 2007
survey, covering a total distance 10,555 meters. Although nineteen tows were obtained,
four of the proposed site were missed. Eighteen grabs sites were also proposed and
nineteen were obtained during the survey. Although eighteen tows were obtained four of
the proposed sites were missed. The locations of those proposed sites and the sites
successfully obtained in the 2007 survey are shown in Figure 3.
19

Figure 3. Planned targets for the 2007 survey (implementing the recommendations from
the OAA, videos and grab sites) and the locations where ground truthing was successfully
obtained during the 2007 survey (video and grab sites).
20

3.1. Soft Substrata Habitats
Hierarchical classification of the 29 particle size samples suggested the use of 5 clusters.
The membership and characteristics of the 5 clusters are shown in Table 4. The clustering
separated the particle size samples by silt and clay content, resulting in five classes spread
along a gradient of mean particle size. All classes were very poorly sorted, except for
cluster 5, which was extremely poor. Going down Table 4 shows that the clusters
decreased in particle size (phi) as silt and clay content increased. It is also evident that
cluster 5 was very poorly represented by samples with just two particle size samples and
one infaunal sample.
Table 4. Membership and characteristics of the sediment samples clustering.
Cluster
no.
PSA
n
Fauna
n
Mean
(phi)
Sorting
index
Silt
(%)
Clay
(%)
Description
(Relative clay content)
5 2 1 2.06
1.31
4.28
0.82
30.10
3.07
7.77
0.47
Extremely poorly sorted sand
(very low clay content)
2 2 0 3.63
0.09
3.89
0.03
37.83
0.41
9.29
1.61
Very poorly sorted fine sand
(low clay content)
4 8 7 4.27
0.58
3.93
0.43
45.75
1.64
9.45
1.64
Very poorly sorted coarse silt
(moderate clay content)
1 8 6 5.34
0.18
3.15
0.30
55.00
3.64
10.92
1.50
Very poorly sorted silt
(high clay content)
3 9 6 6.61
0.18
2.28
0.36
74.21
3.17
13.41
1.77
Very poorly sorted fine silt
(very high clay content)
Table 4 shows that sand samples, i.e. cluster 5, are the most coarse sediment samples.
Members of this cluster were predominantly obtained from on the bedrock outcrop,
suggesting that this material is typical of the infill between rock associated with the main
mound (figure 4, Table 5). This is not surprising considering the greater tidal current
velocities experienced at this site as the flow is forced over the main mound and thereby
21

accelerates. Cluster 2 was found to overlay the mixed sediment zone, again representing a
good level of agreement between the observed samples and the predicted physical zones
from the acoustic data. The coarse silt samples grouped in cluster 4 are fairly well spread
between sedimentary, mixed and bedrock physical zones, although more are present in
the sedimentary plain zone. The silt and fine silt clusters (1 and 3) show good agreement
with the modelled zones and mostly fall into the sedimentary plain zone.
22

Figure 4. Location of particle size samples at the North West Irish Sea Mounds; labels are the cluster membership for each grab.
23

Table 5. Cross tabulation of the clustered sediment samples and the predicted physical zone underlying these points.
Physical zones predicted in the 2006 report
PSA Cluster Homogeneous
sedimentary
plain
Coarse
mixed
sediment
Bedrock
low
relief
Deep bedrock
mid-high
relief
Shallow
bedrock mid-
high relief
5 1 1
4 3 1 2 1 1
3 5 2 1 1
2 2
1 6 1 1
Having clustered the sediment samples and used the cross tabulation to see that they
correspond well with the predicted physical zones, the accompanying infaunal data were
used to characterise these clusters and zone types. Firstly, ANOSIM was used to
determine if the sediment clusters correspond to distinct community types.
Unfortunately, there were no infaunal samples to represent sediment cluster 2. It is
apparent that the fauna for sediment clusters 1, 3 and 4 are significantly distinct and
hence represent identifiable habitats (Table 6). However, there was only one infaunal
sample for cluster 5, hence there is not enough replication to adequately represent this
cluster. This has resulted in the infauna from cluster 5 being indistinguishable from those
of other clusters.
24

Table 6. ANOSIM (Analysis of Similarities) for the infaunal samples assigned the same membership as the PSA samples. Groups Statistic Level % Possible
Permutations
Actual Number > =
Permutations
Observed
5, 1 1.000 14.3 7 7 1
5, 3 0.378 42.9 7 7 3
5, 4 0.510 25.0 8 8 2
1, 3 0.350 0.4 462 462 2
1, 4 0.598 0.1 1716 999 0
3, 4 0.288 1.4 1716 999 13
Global sample statistic (Global R): 0.424, significance level of sample statistic: 0.1%
Number of permuted statistics greater than or equal to Global R: 0
Cluster 5 infauna has not been included in the SIMPER analysis as there was only 1
sample (Table 8), however the analysis did calculate a very high dissimilarity of this site
when compared to the other 3 communities (Table 8). From the SIMPER analysis it is
apparent that high abundances of Monticellina sp, Prionospio fallax, Tharyx killariensis
and Glycera rouxi are characteristic of cluster 1 and of the medium silt habitat. The
coarse silt habitat of cluster 4 is characterised by high abundances of Galathowenia
oculat, Melinna palmata and Amphiura chiajei. The fine silt habitat (Cluster 3) is best
characterised by a fairly variable community with low abundances of several species.
Figure 5 also indicates that cluster 3 is characterized by low abundance and species
presence. By contrast, the coarse silt on cluster 4 is highly diverse and contains almost 10
times more individuals. The medium silt of cluster 1 has less species than that found in
cluster 4 but more than clusters 3 and 5.
25

Table 7. Characteristic infaunal species of the particle size clusters/physical zones as calculated by SIMPER (Similarity Percentages - species contributions). Cluster 2 has not been examined due to an absence of paired infaunal data.
Average abundance (Contribution to similarity) Species Cluster 1
Average similarity: 44.53
Cluster 3 Average similarity:
17.09
Cluster 4 Average similarity:
32.84 Monticellina sp 45.5
(39.62) 6.67
(21.08) 9.71
(7.87) Prionospio fallax 24.5
(18.15) 0.33
(> 1.00) 6.64
(> 1.0) Tharyx killariensis 17.67
(10.55) 1.83
(2.28) 4.36
(> 1.0) Glycera rouxi 2.17
(1.31) 1.67
(15.44) 1.57
(0.33) Galathowenia
oculata 4.00
(1.39) 14.83
(14.84) 93.57
(45.25) Tubulanus
polymorphus 2.50
(2.12) 0.83
(6.48) 2.57
(0.31) Terebellides stroemi 1.06
(> 1.0) 2.17
(5.66) 2.14
(0.30) Melinna palmata 7.00
(> 1.0) 9.17
(> 1.00) 28.14
(14.85) Amphiura chiajei 1.17
(> 1.0) 1.33
(0.34) 10.29 (5.96)
Table 8. Average dissimilarity between soft substrata clusters based on infaunal data.
Average dissimilarity between clusters 3 4 5 1 82.49 84.19 93.71 3 83.23 90.94 4 90.93
26

Figure 5. The total number of species, community abundance and Shannon-Wiener Diversity for soft sediment grabs from the North West Irish Sea Mounds sorted by sediment clusters.
27

The infauna associated with each cluster were then used to determine the biotope
represented by each cluster, using the biotope descriptions in Conor et al (2006) (Table
9a). It was not always possible to find a good match, and so for clusters 1,2,3 and 4, new
biotopes were proposed. Biotope codes were assigned using the same naming structure as
for existing biotopes, and these are described in Table 9b.
Table 9a. Biotope code for each sediment cluster with physical description and main fauna present.
Cluster
no.
Description
(Relative clay content)
Major fauna Biotope
(EUNIS code)
5 Extremely poorly sorted sand
(very low clay content)
Not enough
replication
SS.SSa.OSa
(A5.27)
2 Very poorly sorted fine sand
(low clay content)
No faunal
samples
SS.SSa.OFiSa
(A5.26)
4 Very poorly sorted coarse silt
(moderate clay content)
Dense
Galathowenia oculata
Melinna palmata
SS.SMu.OSaMu.Gocu
Twm
(A5.35)
1 Very poorly sorted silt
(high clay content)
Monticellina sp
Prionospio fallax
Tharyx killariensis
SS.SMu.OMu.MonPfal
(A5.37)
3 Very poorly sorted fine silt
(very high clay content)
Sparse
Galathowenia oculata
Melinna palmata
SS.Smu.OFiMu.TwmS
(A5.36)
28

Table 9b. Biotope code description.
Biotope Description
SS.SSa.OSa Offshore sands and muddy sands
SS.SSa.OFiSa Offshore fine sands and muddy sands
SS.SMu.OSaMu.AocuTwm Offshore sandy mud with Galathowenia oculata and other
tube worms
SS.SMu.OMu.MonPfal Offshore mud rich in Monticellina sp., Prionospio fallax and
Tharyx killariensis
SS.Smu.OFiMu.Twm.S Offshore fine mud with sparse tubeworm community. Also
heavily bioturbated with small and large burrow apertures
apparent.
3.2. Hard Substrata Habitats
Due to the poor visibility, all of the hard physical zone has been classified as
CR.MCR.EcCr.UrtSed. Where possible, the existing biotope structure has been used to
develop the new code required for this habitat. It follows the existing ‘moderate energy
circalittoral rock - echinoderms and crustose communities’ and finishes with the
dominant and characteristic faunal species, Urticina spp. (probably U. eques). The final
suffix code of ‘Sed’ refers to the fact that the rock surfaces are extensively covered in a
layer of silt; in some areas this infill is probably thick and of a coarse, sandy nature. The
grabs taken in this rocky biotope suggest that the infill is typically sandy and were
classified as either SS.SSa.OSa or SS.SSa.OFiSa. Due to the predominance of the rock
surfaces, the soft substrata biotopes have not been used.
Figure 6 shows the location of all of the video tows (both sledge and drop frame)
undertaken on the south eastern corner of the North West Irish Sea Mounds with figures
7, 8 and 9 further classifying the tows into broad habitat types. Table 10 illustrates how
the the habitat types in figures 6-9 relate to the physical types named in table 11 and the
biotope codes featured in figure 10.
29

Table 10. How the habitat types in figures 6-9 relate to the physical types named in table 11 and the biotope codes featured in figure 10. Physical Types (table 11)
Habitat Types (Figures, 6-9)
Biotope Code (Figure 10)
1. Soft sediment SS.SMu
2. Soft sediment < mixed soft sediment SS.SMu
3. Soft sediment = mixed soft sediment SS.SMu
Sedimentary plain
4. Soft sediment > mixed soft sediment SS.SMu
5. Mixed soft sediment CR.LCR
6. Mixed soft sediment < cobble/boulder CR.LCR
7. Mixed soft sediment = cobble/boulder CR.LCR
Mixed soft substratum
8. Mixed soft sediment > cobble/boulder CR.LCR
9. Cobble/Boulder CR.LCR Cobble boulder
10. Cobble/Boulder = Bedrock CR.LCR
Low relief bedrock 11. Bedrock LM relief CR.MCR
Shallow M/H relief bedrock 12. Bedrock H relief CR.MCR
Deep M/H relief bedrock 12. Bedrock H relief CR.MCR
(Note A) Soft sediment < mixed soft sediment indicates predominantly soft sediment with
some mixed sediment, B) Soft sediment = mixed soft sediment indicates a balance of soft
sediment and mixed sediment C) Soft sediment > mixed soft sediment indicates
predominantly mixed sediment with some soft sediment.
30

Figure 6. Location of drop frame and epibenthic sledge tows over the south eastern corner
of the North West Irish Sea Mounds.
31

Figure 7. Central survey area with tows classified into broad substrata types. Habitat
codes are on a gradient with; 1) soft mud, 2) mixed mud, sand and gravel substratum, 3)
cobble and boulder substratum, 4) low relief bedrock and 5) high relief bedrock.
32

Figure 8. Northern survey area with tows classified into broad substrata types. Habitat
codes are on a gradient with; 1) soft mud, 2) mixed mud, sand and gravel substratum, 3)
cobble and boulder substratum, 4) low relief bedrock and 5) high relief bedrock.
33

Figure 9. South-eastern survey area with tows classified into broad substrata types.
Habitat codes are on a gradient with; 1) soft mud, 2) mixed mud, sand and gravel
substratum, 3) cobble and boulder substratum, 4) low relief bedrock and 5) high relief
bedrock.
34
Using tools within ArcGis, the predicted physical zones underlying the actual observed
substrata have been extracted. A cross tabulation of the predicted and observed substrata
type are shown in Table11. It is apparent that many of the areas predicted to have bedrock
appeared on the video to be softer sediments. This apparent discrepancy was probably
due to deep sediment overlaying the rock surfaces.
Table 11. Cross tabulation table of the ground truthed substrata classification and the predicted physical zones from the 2006 report.
Video substrata classifications
Physical
zones Sedimentary
plain (1.0)
Sedimentary plain
with some coarser
material (1.5)
Mixed soft
substratum
(2.0)
Mixed
substratum with
some cobble(2.5)
Cobble
boulder
(3.0)
Bedrock
all
(4.0)
Sedimentary
plain 8% 9% 9% 12% 2% 0%
Mixed soft
substratum 52% 22% 24% 10% 0% 0%
Cobble
boulder 8% 11% 16% 0% 13% 12%
Low relief
bedrock 0% 0% 0% 0% 0% 0%
Shallow
M/H relief
bedrock 22% 26% 36% 59% 59% 80%
Deep M/H
relief
bedrock 11% 31% 15% 20% 26% 8%
Overall, it is apparent from Table 11 that as the modeled zones progress from the soft
sedimentary plain to bedrock, the video classification results also changed from
predominantly soft/mixed grounds to that of bedrock. It is possible that the modeled
zones have in some instances over-classified sedimentary plain areas as mixed soft
substratum. It also apparent that areas predicted to be bedrock by Mitchell et al, (2006),
appeared on the video ground truthing to be dominated by soft sediments. This is
35

probably a product of three things; 1) positional errors, 2) very poor video visibility and,
3) sediment infilling and overlying low relief bedrock. Video classification 3
(cobble/boulder substratum) has also failed to spot predicted cobble boulder areas and has
typically fallen on bedrock areas.
The distribution of the cross tabulation would suggest that video was unable to
distinguish bedrock relief zones. On the video, there was only one hard biotope that could
be distinguished, hence for the habitat map, the three bedrock zones modeled in the 2006
report have been amalgamated into one hard substratum category. In the video footage, it
has been very difficult to separate sedimentary plain and mixed soft substrata. Once
again, these two categories have been combined into one ‘mixed soft substrata’; where
possible, the grab results will be used to delineate biotope subdivisions in this area (see
section 3.3). The reclassifications suggested above result in a new cross tabulation
analysis shown in Table 12.
Table 12. Physical zones reclassified accordingly.
1 1.5 2 2.5 3 4
Soft substratum 59% 32% 32% 22% 2% 0%
Cobble boulder 8% 11% 17% 0% 13% 12%
All bedrock 33% 57% 51% 78% 85% 88%
Table 12 shows the reclassified physical zones based on the video transect ground
truthing. There is a clear gradient of increasing hardness in the video data and a
progression from soft to hard substrata of the modeled physical zones. It is unfortunate
that only three zones can be distinguished from the video but this will lead to the
resulting habitat map having a greater confidence. The unified physical zones are shown
in Figure 10.
36

Figure 10. Mapping showing the distribution of level 3 Biotope habitats. Physical habitat
map produced by combining the original physical zones (Mitchell et al, 2006) following
the integration of the video ground truthing.
37

38
3.3. Biotope Based Habitat Map
Combining both the video and grab samples has facilitated the production of a biotope-
based habitat map (Figure 11). Due to the poor visibility during the video and stills
collection, detailed differentiation of the biotopes present has not been possible. The
biotope codes for the hard and mixed substrata are listed in Table 13. The predicted area
for each habitat type can be found in Table 14.

Physical description Major fauna Other notes Biotope
(EUNIS code)
Bedrock outcrops with
extensive sediment infill
and veneers
Abundance Urticina eques and brittle stars
(probably Ophiothrix fragilis and Ophiocomina
nigra). Short hydroid and bryozoan turf
sometimes distinguishable from silt veneer.
Moderate energy circalittoral rock. Echinoderms and
crustose communities. All surfaces covered in silt except
for those with the most extreme aspect. Some areas are
likely to be extensively infilled with course soft sediment.
This sedimentation is despite a moderate tidal current that
accelerates over the rock surfaces.
* CR.MCR.EcCr.UrtSed
(A4.21-)
Mixed / spares cobble and
boulder with finer material
Soft sediment with small and large burrows
(Nephrops). Rocky surfaces with characteristic
Urticina eques. This habitat also includes areas
of firmer, coarser sediment often colonised by
tube worms.
Low energy circalittoral mixed sediment. Offshore
circalittoral mixed sediment. Cobble boulder on a soft
substrata background. Either very soft, bioturbated mud or
coarser, firmer material with tubeworms.
* CR.L.SMx.OMx.
(A5.45)
All soft substrata Large and small aperture burrows in softer
areas, some Sabellid worms. Occasionally
dense tube worms in firmer, coarser areas.
Sublittoral cohesive mud and sandy mud communities.
Bioturbated mud and sand. Low tidal currents. Then close
to grab samples, this biotope has been sub-divided by
fauna.
SS.SMu.
(A5.3)
Table 13. Biotopes used for hard and mixed substrata for the North West Irish Sea Mounds. * Indicates a new biotope proposed for the purposes of this study.
39

Figure12. Final habitat map for the south-western section of the North West Irish Sea
Mounds.
40

Table 14. Predicted areas for the habitats identified at the North West Irish Sea Mounds.
Habitat Biotope Area (km2)
Bedrock outcrops with extensive
sediment infill and veneers
CR.MCR.EcCr.UrtSed. 16.0
Mixed / spares cobble and boulder with
finer material
CR.L.SMx.OMx. 16.5
All soft substrata
All SS biotopes 21.2
Soft substrata
Unclassified 2.7
Soft substrata
SS.SMu.OMu.MonPfal 5.8
Soft substrata
SS.SMu.OFiMu.TwmS 11.7
Soft substrata
SS.SSa.OFiSa 1.1
41

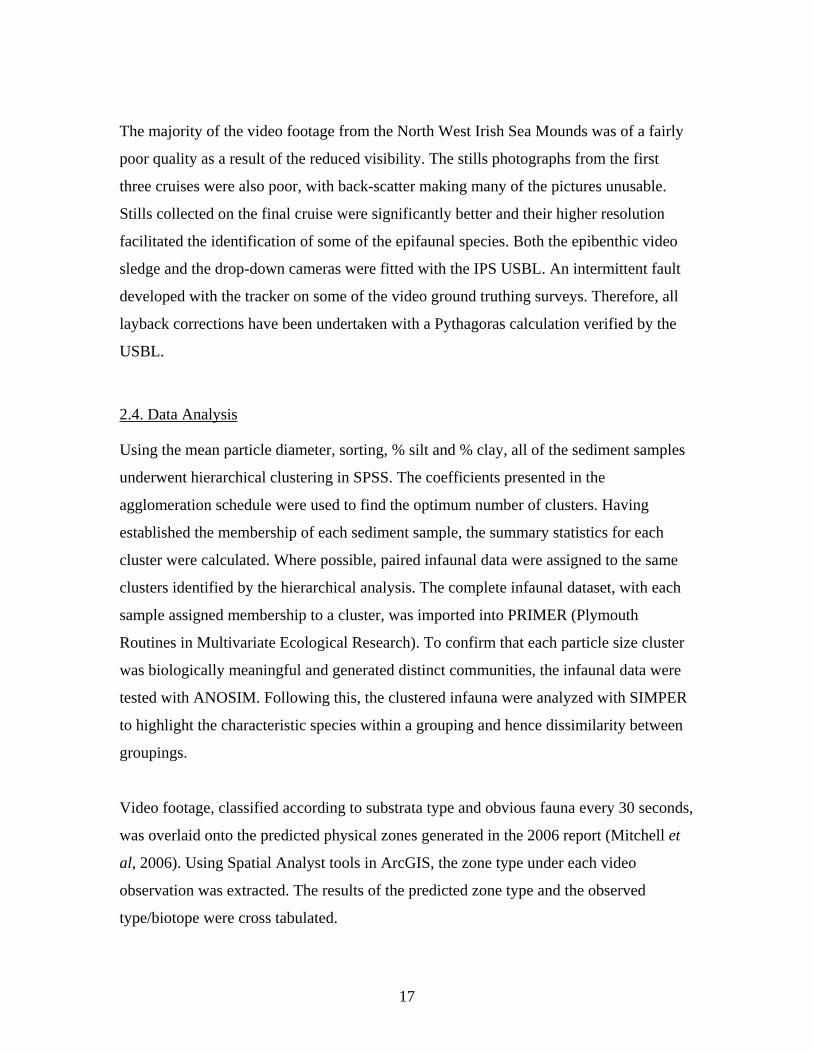
Due to the poor video visibility, only the very conspicuous fauna were apparent, i.e.
Urticina (Figure 13a and 13c). However, on a couple of stills photographs more species
could be seen and the nature of the turf observed. Encrusting turf species on rock also
included a hydroid/bryozoan turf, brittle stars (probably Ophiothrix fragilis and
Ophiocomina nigra), small sponges, and occasional Alcyonium sp.
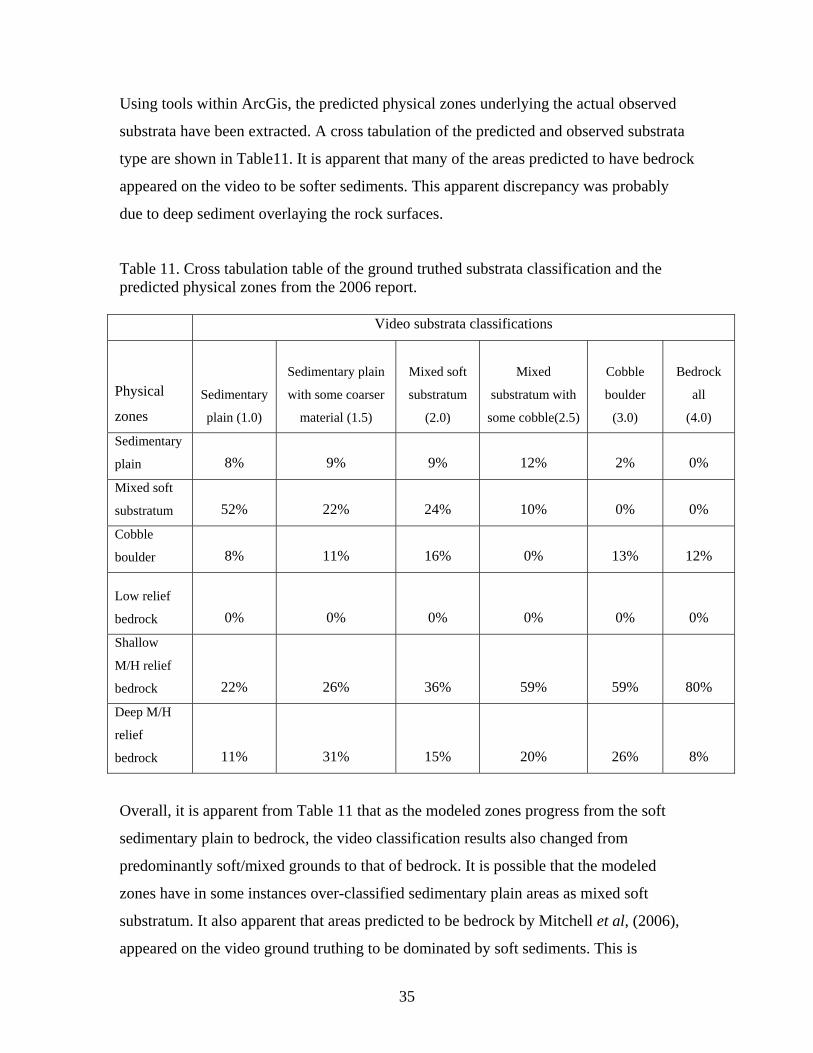
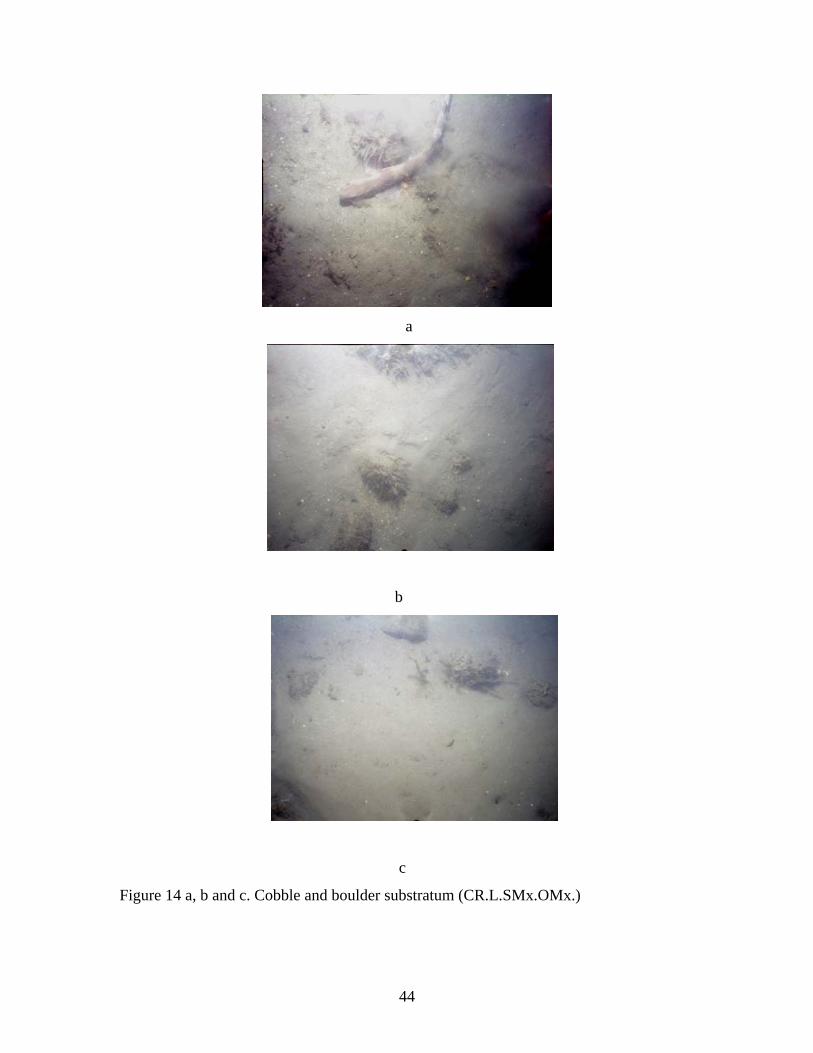
The habitats with the cobble and boulder content to the sediment were classified with the
new biotope code CR.L.SMx.OMx - Low energy circalittoral mixed sediment (Figures 14
a, b and c), offshore circalittoral mixed sediment. Cobble boulder on a soft substrata
background. The rock surfaces have a similar but sparser community than that seen on
the hard substratum. The soft substrata between cobble and boulder was either sand or
bioturbated mud.
Although the grabs were split between five groups based on the physical properties of the
sediment, the points for two of these groupings were on predominantly bedrock areas
with their own biotope code from the video analysis. The soft substrata were subdivided
into three biotope divisions based on the grab ground-truthing – only two have a
biological element to the classification. The southern sedimentary plain was characterised
by heavily bioturbated fine silt coded SS.Smu.OFiMu.Twm.S (Table 9a and 9b, Figure
16 a, b and c). The soft sediment pockets at the base of the rock to the north and north-
east were classified as SS.SMu.OMu.MonPfal (Table 9a and 9b, Figures 15 a, b and c). In
the north-eastern corner of the survey area is a patch of coarser sediment classified as
offshore fine sand/muddy sand (SS.SSa.OFiSa). Due to the low number of accompanying
faunal grabs, there is no information about the species present in this biotope.
42
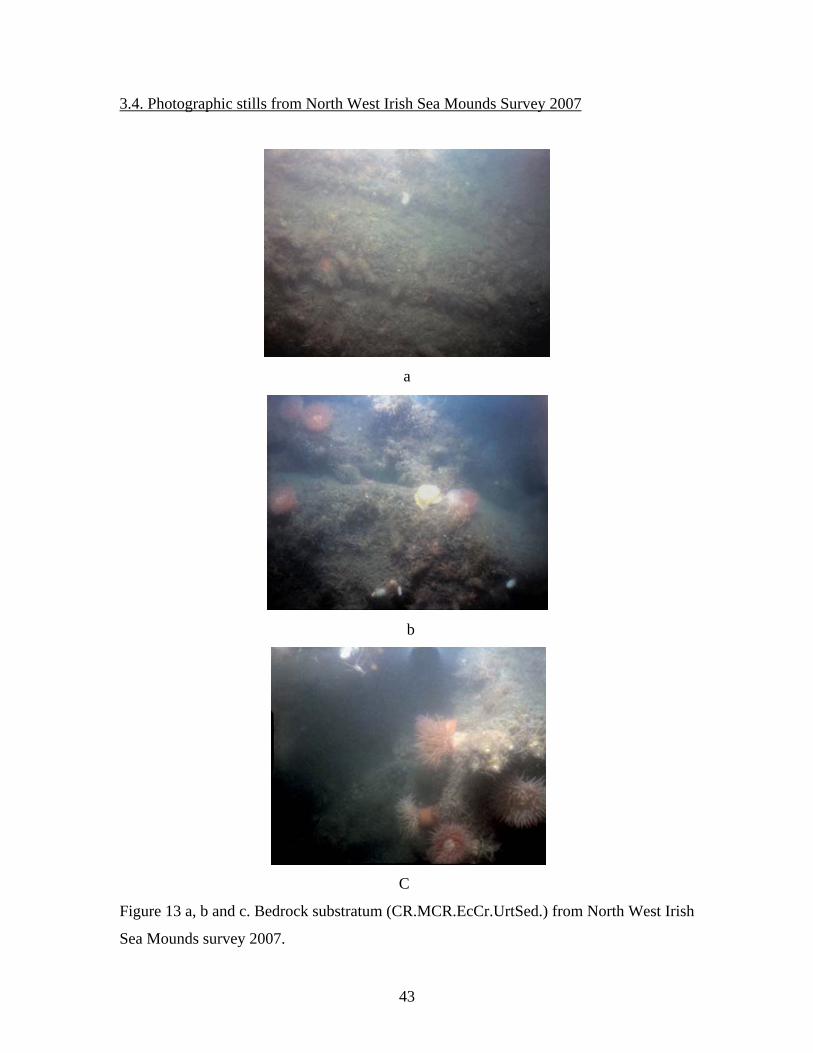
3.4. Photographic stills from North West Irish Sea Mounds Survey 2007
a
b
C
Figure 13 a, b and c. Bedrock substratum (CR.MCR.EcCr.UrtSed.) from North West Irish
Sea Mounds survey 2007.
43
a
b
c
Figure 14 a, b and c. Cobble and boulder substratum (CR.L.SMx.OMx.)
44

a
b
c
Figure 15 a, b and c. Mixed and coarse soft substrata (e.g. SS.SSa.OFiSa.)
45

a
b
c
Figure 16 a, b and c. Mud substratum (SS.SMu.)
46

4.0 Discussion and Conclusions
The habitat mapping of the North West Irish Sea Mounds was hampered by poor
visibility during the video ground-truthing cruises. The resulting habitat map has been
maintained at the original spatial resolution of 5 meters. The habitat classification used on
the map has been implemented to a fairly low level rather than using more detailed codes
with a low confidence. In Mitchell et al, (2006), the site of interest was classified into six
physical zones which included both hard and soft substrata. However, due to the visibility
during the ground truthing, it was not possible to distinguish between all six zones. Based
on the seabed features that could be seen on the video footage, three physical zones were
confidently identified to the highest biotope level possible and the dominant fauna
characterized.
The three main level 3 habitats observed at the North West Irish Sea Mounds were
CR.MCR.EcCr.UrtSed, CR.L.SMx.OMx. and SS.SMu. The SS.SMu biotope was further
divided into three other soft sediment biotopes based on the particle size clustering; two
of these subdivisions were level four codes that included information about the fauna.
The exposed rock surfaces (CR.MCR.EcCr.UrtSed) are biologically interesting for
several reasons. Firstly, the surfaces had a very high density of Urticina spp. (probably U.
eques), which appeared to be highly characteristic of the hard rock habitats on the North
West Irish Sea Mounds. The lack of visibility on the video footage revealed little of the
other epibenthic species present. However, the few stills available did provide more detail
on the smaller, turf-forming species present, which appeared to suggest that the fauna was
fairly rich and worthy of further investigation. Based on the Natura 2000 Code 1170
definition of reefs/ EC Habitats Directive Interpretation Manual, it appears that this site
represents Annex I reef habitat. However, only through further investigation of the
smaller fauna present on the rock surfaces can the exact biological quality of this site be
established.
47

Although not the original features of interest, the soft sediment areas were varied and
biologically diverse. The numerous infills and small pockets of firmer sediment between
rock surfaces were often characterised by dense tube worm communities (Galathowenia
oculata and Melinna palmate). The finer areas were extensively bioturbated in places and
numerous burrowing megafauna were apparent of the sediment surface. It was only on
these soft substrata was there an evidence of anthropogenic activity when trawl marks
were observed in the back-scatter images (Mitchell et al, 2006). It is known that trawling
for N norvegicus occurs in some of the some substrates adjacent to this area and this is
the likeliest source of these marks. However, semi-pelagic fishing does occur throughout
the North Channel and although this gear is designed to avoid the bottom occasional
contact may be made. Some of the other outcrops to the north east of the area are known
as the “Herring Peaks”; however, this fishery is pelagic and unlikely to directly influence
the benthic community structure.
This above does illustrate the wider biological importance of the area.
The location of the area north of the NW Irish Sea Gyre and summer stratified area
suggests that water column structure may have a strong influence on the development of
benthic communities and it would be a key recommendation that the AFBI oceanographic
programme extend its routine survey work to include regular CTD casts in the area.
Further video work at the North West Irish Sea Mounds would greatly improve the
resulting habitat maps for this area. The tidal currents at this site mean that there will
always be difficulties in sampling but detailed project planning to allow cruise time to be
scheduled at Neap tides in the later Spring or Summer months would undoubtedly
improve image quality. The strong currents are liable to make use of ROV’s in this area
difficult although the use of weighted tethers and “garage” systems may make limited use
possible. Similarly the visibility will limit the choice of camera system as high
backscatter can often adversely affect high definition digital systems. Given the relatively
high possibility that any single cruises on this area may suffer from poor conditions. It
may have to be recognised that a series of short sampling events targeted at this area
when conditions are appropriate, perhaps using passage time on other surveys, may allow
48

for fuller characterisation of the area. This would undoubtedly prove a more cost
effective approach as it would minimize wasted ship time, which in most cases makes up
the most expensive part of surveys of this type.
Although not overtly undertaken as part of the MESH project, outputs from this project
will be lodged with the MESH meta-database. Furthermore, further work arising from the
project is liable to contribute to the further testing of MESH protocols.
49

5.0. References
DARD. 2003. RV Lough Foyle Cruise Report LF 25 2003. Department of Agriculture
and Rural Development.
AFBI. 2006. RV Corystes Cruise Report CO 24 2006. Agri-Food and Biosciences Institute, Belfast, Northern Ireland.
AFBI. 2007. RV Corystes Cruise Report CO 03-07. Agri-Food and Biosciences Institute,
Belfast, Northern Ireland.
Mackie, A. S. Y. 1990. Offshore benthic communities of the Irish Sea. In. Irish Sea study
group, part 1 An Environmental Review: Nature Conservation. Irish Sea Study Group,
Liverpool University Press, pp 196.
Mitchell, A., Service M., Mellor, A. and Strong, J.A. 2006. North West Irish Sea
Mounds: Physical Description. Agri-Food and Biosciences Institute/Queen’s University
Belfast Report to JNCC.
Connor, D.W., Allen, J.H., Golding, N., Howell, K.L., Lieberknecht, L.M., Northen, K.O.
and Reker, J.B. 2004. The Marine Habitat Classification for Britain and Ireland Version
04.05 JNCC, Peterborough. ISBN 1 861 07561 8 (internet version).
Golding, N., Vincent, M.A., and Connor, D.W. 2004. Irish Sea Pilot - a Marine
Landscape Classification for the Irish Sea, JNCC Report 346.
Graham, C., Campbell, E., Cavill, J., Gillespie, E. and Williams, R. 2001. JNCC Marine
Habitats Version 3: its structure and content. British Geological Survey Commissioned
Report, CR/01/238, 45 pp.
50

51
6.0 Acknowledgements
As always thanks to the master and crew of the AFBI research vessels for their
professionalism and assistance.
Funding for this work has been provided by Defra Natural Environment Group
Science Division (Contract No CRO 361), and JNCC (Contract reference No: F90-01-
942(8)).

7.0. Appendix
Table 1. Location of PSA grabs from the North West Irish Sea Mounds in 2003-2007. Date Code Decimal latitude Dec longitude Descriptor
21/1/2007 NC 31 - 07A 54.4581 -5.0684 shelly mud Nephrops 21/1/2007 NC 31 - 07B 54.4573 -5.0697 shelly mud Nephrops 21/1/2007 NC 36 - 07A 54.4492 -5.0480 Dentalium shlls in mud 21/1/2007 NC 36 - 07B 54.4497 -5.0463 Dentalium shlls in mud 21/1/2007 NC 26 - 07A 54.4452 -5.0253 compact shelly mud 21/1/2007 NC 26 - 07B 54.4452 -5.0254 compact shelly mud 21/1/2007 NC 25 - 07A 54.4500 -5.0179 compact mud with stones 21/1/2007 NC 25 - 07B 54.4502 -5.0168 compact mud abundant tubeworms 21/1/2007 NC 23 - 07A 54.4396 -5.0188 shelly sand tubeworms 21/1/2007 NC 23 - 07B 54.4405 -5.0178 grab almost totally tubeworms 21/1/2007 NC 32 - 07A 54.4191 -5.0228 very soft mud 21/1/2007 NC 32 - 07B 54.4200 -5.0222 very soft mud 21/1/2007 NC 29 - 07A 54.4071 -5.0375 21/1/2007 NC 29 - 07B 54.4077 -5.0359 21/1/2007 NC 34 - 07A 54.3940 -5.0269 stones in soft mud 21/1/2007 NC 34 - 07B 54.3933 -5.0255 21/1/2007 NC 22 - 07A 54.3846 -5.0113 mud with stones 21/1/2007 NC 22 - 07B 54.3828 -5.0095 cobble 21/1/2007 NC 28 - 07A 54.3684 -5.0370 mud with Brissopsis less shell 21/1/2007 NC 28 - 07B 54.3678 -5.0358 mud with Brissopsis 21/1/2007 NC 27 - 07A 54.3799 -5.0461 resembled mud from "mudpatch" 21/1/2007 NC 27 - 07B 54.3780 -5.0444 resembled mud from "mudpatch" 21/1/2007 NC 30 - 07A 54.3687 -5.0767 soft mud 21/1/2007 NC 30 - 07B 54.3674 -5.0739 soft mud 22/1/2007 NC 24 - 07A 54.4316 -5.0583 soft mud 22/1/2007 NC 24 - 07B 54.4241 -5.0586 soft mud 22/1/2007 NC 20 - 07A 54.4265 -5.0329 shelly mud 22/1/2007 NC 20 - 07B 54.4277 -5.0355 shelly mud 22/1/2007 NC 34(100) 07 A 54.4398 -5.0538 shelly mud
52

22/1/2007 NC 34(100) 07 B 54.4400 -5.0480 shelly mud 22/1/2007 NC 37 - 07A 54.4066 -5.0608 shell in jaws but mud 22/1/2007 NC 37 - 07B 54.4050 -5.0632 shelly mud 22/1/2007 NC 33 - 07A 54.4230 -5.0723 22/1/2007 NC 33 - 07B 54.4214 -5.0738 22/1/2007 NC 38 - 07A 54.3969 -5.0618 tubeworms 22/1/2007 NC 38 - 07B 54.3948 -5.0631 tubeworms 22/1/2007 NC 21 - 07A 54.3923 -5.0783 mud with Maldanid 22/1/2007 NC 21 - 07B 54.3900 -5.0794 tubeworms
53

Table 2. The location of the faunal grabs collected from the North West Irish Sea Mounds in 2006. Station Date Decimal latitude Decimal longitude
1a 12/11/2006 54.4207 -5.0174 1b 12/11/2006 54.4206 -5.0255 2a 12/11/2006 54.4194 -5.0348 2b 12/11/2006 54.4194 -5.0378 3a 12/11/2006 54.4151 -5.0458 3b 12/11/2006 54.4163 -5.0495 4a 12/11/2006 54.4007 -5.0620 4b 12/11/2006 54.4000 -5.0603 5a 12/11/2006 54.3937 -5.0650 5b 12/11/2006 54.3943 -5.0668 6a 12/11/2006 54.3867 -5.0653 6b 12/11/2006 54.3871 -5.0672 7a 12/11/2006 54.3799 -5.0614 7b 12/11/2006 54.3807 -5.0645 8a 12/11/2006 54.3714 -5.0605 8b 12/11/2006 54.3717 -5.0625 9a 12/11/2006 54.3651 -5.0649 9b 12/11/2006 54.3649 -5.0664 10a 12/11/2006 54.4071 -5.0622 10b 12/11/2006 54.4071 -5.0622
54

Table 3. Particle size parameters for samples collected from the North West Irish Sea Mounds between 2003-2007. Folk and Ward (from phi values) Percentages in category Sample Mean Sorting Skewness Kurtosis (Gravel) Cobbles Pebbles Sand Silt Clay
2007 NC 100 -07 5.112 3.176 -0.276 0.899 3.23 0 3.23 29.39 59.13 8.26 2007 NC 21 -07 3.694 3.916 0.132 0.618 9.24 0 9.24 42.8 37.54 10.43 2007 NC 22 -07 6.261 2.632 -0.295 1.192 4.57 0 4.57 14.25 70.24 10.94 2007 NC 23 -07 4.562 3.642 -0.252 0.664 7.24 0 7.24 35.66 48.72 8.37 2007 NC 24 -07 6.529 2.27 -0.116 0.871 1.18 0 1.18 13.68 71.41 13.73 2007 NC 25 -07 5.279 3.474 -0.281 0.756 4.19 0 4.19 30.14 52.65 13.02 2007 NC 26 -07 4.577 3.773 -0.148 0.689 6.28 0 6.28 36.57 45.31 11.84 2007 NC 27 -07 6.659 2.157 -0.091 0.84 0 0 0 12.05 73.43 14.52 2007 NC 28 -07 6.767 1.929 -0.055 1.028 0 0 0 7.7 79.98 12.33 2007 NC 29 -07 4.629 3.586 -0.087 0.708 3.95 0 3.95 40.59 44.31 11.15 2007 NC 30 -07 6.807 2.043 -0.028 0.876 0 0 0 7.66 77.11 15.23 2007 NC 31 -07 5.207 2.861 0.076 0.795 2.48 0 2.48 36.03 51.25 10.24 2007 NC 32 -07 5.43 2.919 -0.139 0.74 1.14 0 1.14 34.45 53.79 10.62 2007 NC 33 -07 6.522 2.183 -0.106 0.846 0.14 0 0.14 14.21 72.64 13 2007 NC 34 -07 5.703 2.816 -0.164 0.77 0.17 0 0.17 31.19 56.97 11.67 2007 NC 36 -07 4.766 3.625 -0.071 0.852 8.34 0 8.34 35.44 45.32 10.9 2007 NC 37 -07 1.132 4.854 0.495 0.553 49.19 0 49.19 11.1 32.27 7.44 2007 NC 38 -07 3.361 4.328 -0.18 0.558 28.55 0 28.55 20.77 43.33 7.35 2007 NC STN20 3.572 3.868 0.08 0.768 12.23 0 12.23 41.5 38.12 8.15 2006 NCP 10B 6.498 3.085 -0.327 1.613 7.52 0 7.52 7.57 72.17 12.74 2006 NCP 1B 5.434 3.016 -0.134 0.72 0.54 0 0.54 34.78 52.74 11.93 2006 NCP 2B 5.306 3.279 -0.2 0.777 3.01 0 3.01 32.86 52.27 11.86 2006 NCP 3B 4.495 3.773 -0.144 0.866 10.76 0 10.76 35 45.87 8.37 2006 NCP 4B 3.311 4.818 -0.362 0.576 29.43 0 29.43 15.28 46.97 8.32 2006 NCP 5B 4.455 3.884 -0.242 0.715 11.62 0 11.62 32.93 46.18 9.27 2006 NCP 6B 6.619 2.064 -0.14 0.956 0.06 0 0.06 11.26 76.98 11.71 2006 NCP 7B 5.239 3.659 -0.428 1.106 12.25 0 12.25 16.81 61.16 9.78 2006 NCP 8B 6.831 2.148 -0.059 0.89 0 0 0 9.51 73.96 16.53 2003 NCP2A 2.98 3.7 0.58 0.7 9.19 0 9.19 54.78 27.93 8.1
55

Table 4. Infaunal species matrix for Day Grabs (0.1 m2 day-grab with a bite aperture of 0.1m2) collected at the North West Irish Sea Mounds in 2006. 1 1 2 2 3 3 4 4 4 5 5 6 6 7 7 8 8 9 9 10 10
Taxon Authority A B A B A B A B C A B A B A B A B A B A B Opercularella lacerata (Johnston 1847) P Hydrallmania falcata Linnaeus 1758 P Cerianthus lloydii Grosse 1859 9 3 2 1 PLATYHELMINTHES - 1 1 NEMERTEA spp - 7 1 1 1 1 2 2 1 2 5 Tubulanus polymorphus Reiner 1804 2 3 4 4 2 9 6 1 2 1 2 1 1 Cerebratulus spp Renier 1804 1 4 1 1 2 Golfingia spp juv Lankester 1885 2 3 1 Golfingia elongata (Keferstein 1862) 1 Thysanocardia procera (Mobius 1875) 1 1 Aphroditidae spp juv - 1 Polynoidae spp juv - 1 1 Polynoidae spp indet - 1 2 1 Harmothoe antilopes McIntosh 1876 1 2 Harmothoe fragilis Moore 1910 1 3 Harmothoe impar (Johnston 1839) 1 Lepidonotus squamatus (Linnaeus 1758) 3 Pholoe baltica Örsted 1843 1 1 1 1 1 2 3 2 Pseudomystides limbata (Saint-Joseph 1888) 1 Eumida sanguinea (Oersted 1843) 1 Notophyllum foliosum (M Sars 1835) 1 Glycera alba (Muller 1776) 2 4 2 2 1 2 1 1 1 Glycera lapidum Quatrefages 1866 1 1 1
Glycera rouxi Audouin & Edwards 1833 3 2 3 4 3 1 2 1 4 3 5 1 1 2 1
Goniada maculata Oersted 1843 1 1 2 3 3 1 1 Hesionidae spp juv - 1 1 Podarkeopsis capensis (Day 1963) 1 1 1 2
56

Gyptis rosea (Malm 1874) 2 2 2 1 5 Ancistrosyllis groenlandica McIntosh 1879 3 2 6 5 1 Litocorsa stremma Pearson 1970 3 3 2 3 1 3 2 1 Glyphohesione klatti Friedrich 1950 10 2 10 13 1 2 2 1 1 Ehlersia sp A - 1 1 6 3 5 1 1
Exogone hebes (Webster & Benedict 1884) 1
Autolytus spp Grube 1850 2 Nephtys spp juv Cuvier 1817 2 1 1 Nephtys hystricis McIntosh 1900 2 Nephtys incisa Malmgren 1865 1 2 1 3 1 8 Lumbrineris gracilis (Ehlers 1868) 2 1 1 2 2 3 3 3 Lumbrineris hibernica (McIntosh 1903) 3 1 1 1 3 1 2 5 2 1 7 1 1 1 Driloneris filum (Claparede 1868) 1 1 1 Ougia subaequalis (Oug 1978) 1 Schistomeringos neglecta (Fauvel 1923) 2 Aricidea laubieri Hartley 1981 1 1 1 2 4 2 1 1 Levinsenia gracilis (Tauber 1879) 9 1 2 8 1 1 2 2 Paradoneis lyra (Southern 1914) 1 1 Paraonis fulgens (Levinsen 1884) 1 1 1 Apistobranchus tullbergi (Theel 1879) 7 Laonice bahusiensis Soderstrom 1920 1 1 1 1 5 2 1 Polydora caeca (Oersted 1843) 1 Prionospio fallax Soderstrom 1920 36 43 22 36 1 1 2 1 9 2 Minuspio cirrifera (Wiren 1883) 1 1 1 Minuspio cf multibranchiata (Berkeley 1927) 6 4 3 3 3 2 1 Scolelepis sp indet de Blainville 1828 1 Scolelepis (P) cf gilchristi (Day 1961) 1 Spio martinensis Mesnil 1896 1 Spiophanes kroyeri Grube 1860 2 2 1 1 1 1 2
57

Magelona alleni Wilson 1958 1 1 Magelona minuta Eliason 1962 4 1 1 2 2 Caulleriella bioculata (Keferstein 1862) 3 Caulleriella zetlandica (McIntosh 1911) 1 Tharyx killariensis (Southern 1914) 5 13 22 53 2 1 2 1 3 2 11 1 7 Monticellina sp (Kirkegaard 1959) 55 38 40 101 17 5 5 13 20 8 13 8 9 30 1 2 8 2 16 Diplocirrus glaucus (Malmgren 1867) 5 3 3 4 1 2 1 3 2 5 Flabelligera affinis M Sars 1829 1 Pherusa falcata Støp-Bowitz 1948 1 Mediomastus fragilis Rasmussen 1973 2 2 3 1 2 21 1 2 2 1 1 Notomastus latericeus M Sars 1851 1 1 1 4 2 1 Asychis biceps (M Sars 1861) 1 1 Euclymeninae sp A - 1 1 7 Euclymene oerstedii (Claparede 1863) 1 Praxillella affinis (M Sars 1872) 6 3 3 1 Praxillella gracilis (M Sars 1861) 1 Scalibregma inflatum Rathke 1843 1 1 Owenia fusiformis Chiaje 1842 3 Galathowenia oculata Zaks 1922 5 2 15 41 59 372 104 1 40 38 3 2 2 1 9 74 Lagis koreni Malmgren 1866 1 Sabellaria spinulosa Leuckart 1849 1 Melinna palmata Grube 1869 19 1 72 22 28 55 1 1 Ampharete falcata Eliason 1955 3 2 Ampharete lindstroemi (Malmgren 1867) 1 3 2 2 1 2 1 3 Amphicteis gunneri (M Sars 1835) 1 2 4 3 1 Sabellides octocirrata (M Sars 1835) 1 3 1 6 2 Terebellides stroemi M Sars 1835 1 2 1 2 9 2 1 1 2 2 4 6 Streblosoma intestinalis M Sars 1872 1 1 Sabellidae spp juv - 2 Euchone rubrocincta (M Sars 1861) 1 Hydroides norvegica Gunnerus 1768 1 Pomatoceros lamarcki (Quatrefages 1866) 1
58

Tubificidae spp - 2 2 Grania spp Southern 1913 1 1 2 1 Anoplodactylus petiolatus (Kroyer 1844) 1 MYSIDACEA s p - 1 Parapleustes sp indet (G O Sars 1882) 4 1 Amphilochus manudens Bate 1862 1 Cressa dubia (Bate 1857) 1 Harpinia antennaria Meinert 1890 1 1 1 1 1 Harpinia crenulata (Boeck 1871) 1 Harpinia laevis G O Sars 1891 2 Harpinia pectinata G O Sars 1891 2 1 1 1 1 1 Ampelisca diadema (A Costa 1853) 5 6 Ampelisca macrocephala Lilljeborg 1852 1 Ampelisca spinipes Boeck 1861 1 Ampelisca tenuicornis Lilljeborg 1855 1 1 1 2 Haploops tubicola Lilljeborg 1855 1 1 3 2 1 4 1 1 Eriopisa elongata (Bruzelius 1859) 1
Maera othonis (H Milne-Edwards 1830) 2
Photis longicaudata (Bate & Westwood 1862) 1 1 1 2 3
Aoridae spp indet (female) - 1 1 1 Unciola planipes Norman 1867 1 Parvipalpus capillaceus (Chevreux 1888) 1 Phtisica marina Slabber 1769 1 1 3 1 4 1 Pseudoprotella phasma (Montagu 1804) 1 2 Gnathia spp indet (female) Leach 1814 3 Gnathia sp juv Leach 1814 1 Janira maculosa Leach 1813 2 Eudorella truncatula (Bate 1856) 1
59

Leucon nasica (Krøyer 1841) 1 Diastyloides biplicata (G O Sars 1865) 1 Nephrops norvegicus (Linnaeus 1758) 2 1 1 Calocaris macandreae Bell 1846 3 2 2 1 1 1 2 4 1 3 3 Galathea strigosa (Linnaeus 1767) 2 Pisidia longicornis (Linnaeus 1767) 5 Hyas sp juv Leach 1814 2 1 Pilumnus hirtellus (Linnaeus 1761) 2 1 Falcidens crossotus Salvini-Plawen 1968 2 5 3 2 1 2 4 4 3 1 3 1 11 Eleutheromenia sierra (Pruvot 1890) 1 Leptochiton asellus (Gmelin 1791) 1 Mangelia coarcata (Forbes 1840) 1 Antalis entalis (Linnaeus 1758) 1 Nucula sp juv Lamarck 1799 1 Nucula sulcata Bronn 1831 1 1 1 Jupiteria minuta (O F Muller 1776) 1 Palliolum tigerinum (O F Muller 1776) 2 Chlamys sulcata (Muller 1776) 1 Pododesmus patelliformis (Linnaeus 1761) 17 Thyasira flexuosa (Montagu 1803) 2 1 1 2 2 4 1 1 1 1 Tellimya ferruginosa (Montagu 1808) 1 Tridonta elliptica (Brown 1827) 2 Parvicardium ovale (G B Sowerby 1840) 1 Phaxas pellucidus (Pennant 1777) 1 Abra spp indet Lamarck 1818 4 Abra alba (W Wood 1802) 1 4 1 5 1 2 2 1 4 5 5 Abra nitida (O F Muller 1776) 4 2 3 4 1 4 Timoclea ovata (Pennant 1777) 4 3 3 1 1 Corbula gibba (Olivi 1792) 1 1 3 2 2 1 6 Hiatella arctica (Linnaeus 1767) 1 3 2 1 5 Cuspidaria cuspidata (Olivi 1792) 1 Cuspidaria costellata (Deshayes 1833) 3 2 1 1 1
60
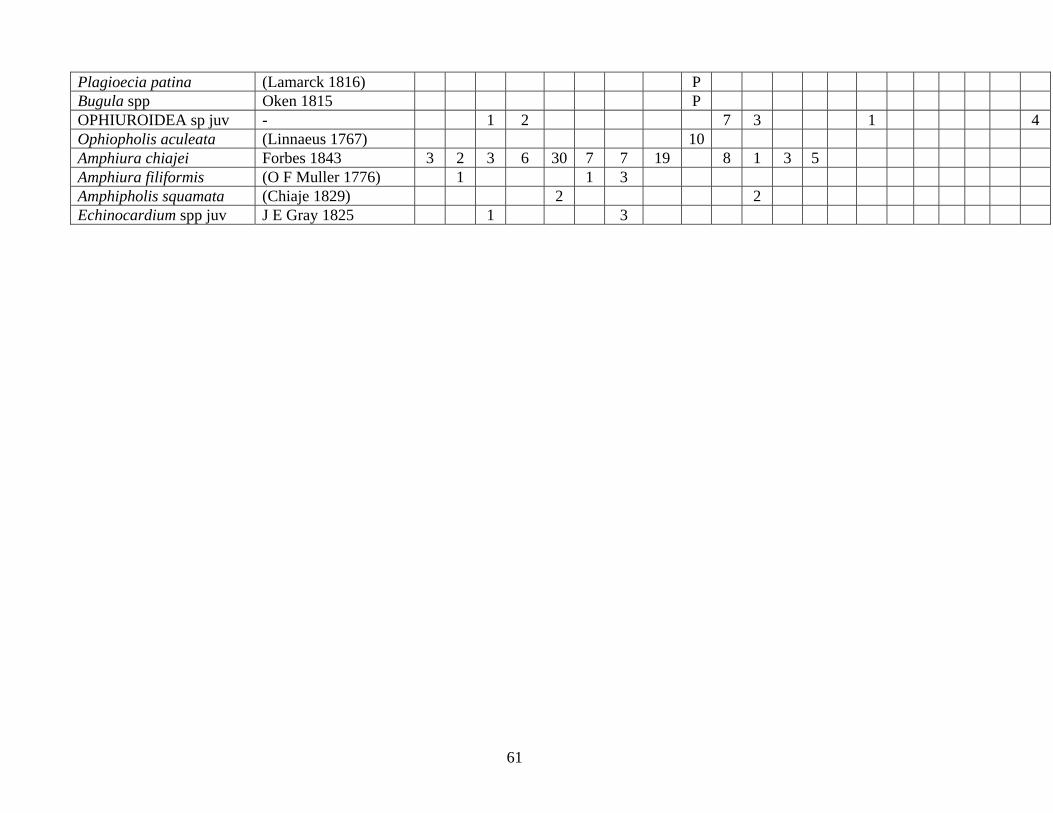
Plagioecia patina (Lamarck 1816) P Bugula spp Oken 1815 P OPHIUROIDEA sp juv - 1 2 7 3 1 4 Ophiopholis aculeata (Linnaeus 1767) 10 Amphiura chiajei Forbes 1843 3 2 3 6 30 7 7 19 8 1 3 5 Amphiura filiformis (O F Muller 1776) 1 1 3 Amphipholis squamata (Chiaje 1829) 2 2 Echinocardium spp juv J E Gray 1825 1 3
61

Table 5. Video log sheet for the 2007 cruises on the North West Irish Sea Mounds. Decimal Latitude
Decimal Longitude Time Substrata Fauna Other Sediment infill?
54.43909 -5.02821 09:56:00 Soft sediment = mixed soft sediment y 54.43887 -5.02831 09:56:30 Soft sediment = mixed soft sediment y 54.43801 -5.02880 09:59:01 Mixed soft sediment = Cobble/Boulder y 54.43783 -5.02883 09:59:30 Soft sediment = mixed soft sediment y 54.43767 -5.02900 10:00:00 Mixed soft sediment y 54.43759 -5.02929 10:00:28 Mixed soft sediment y 54.43746 -5.02947 10:01:00 Soft sediment = mixed soft sediment y 54.43664 -5.03038 10:03:59 Mixed soft sediment - 54.42331 -5.04942 10:35:00 Soft sediment New Tow 54.42309 -5.04940 10:35:30 Soft sediment 54.42284 -5.04939 10:36:02 Soft sediment 54.42258 -5.04934 10:36:33 Soft sediment 54.42234 -5.04930 10:36:59 Soft sediment 54.40475 -5.06505 14:18:59 Soft sediment 54.40477 -5.06498 14:19:30 Soft sediment 54.40481 -5.06485 14:20:00 Soft sediment 54.40487 -5.06474 14:20:30 Soft sediment 54.40502 -5.06458 14:21:00 Soft sediment 54.40514 -5.06447 14:21:33 Soft sediment 54.40529 -5.06437 14:20:00 Soft sediment 54.40590 -5.06417 14:23:00 Soft sediment 54.40577 -5.06403 14:24:00 Soft sediment 54.40609 -5.06388 14:25:00 Soft sediment 54.40619 -5.06386 14:25:30 Soft sediment 54.40625 -5.06383 14:26:00 Soft sediment 54.40628 -5.06379 14:26:30 Soft sediment 54.40634 -5.06375 14:27:00 Soft sediment 54.39148 -5.07871 16:29:02 Soft sediment = mixed soft sediment TOW 5 stn 6 y
62

54.39146 -5.07890 Soft sediment = mixed soft sediment 54.39145 -5.07909 Soft sediment = mixed soft sediment 54.39142 -5.07930 Soft sediment = mixed soft sediment Burrows 54.39138 -5.07956 16:31:06 Soft sediment = mixed soft sediment 54.39136 -5.07973 Soft sediment < mixed soft sediment 54.39134 -5.07992 Soft sediment < mixed soft sediment 54.39133 -5.08012 Soft sediment < mixed soft sediment 54.39130 -5.08038 Soft sediment < mixed soft sediment 54.39126 -5.08067 16:33:30 Soft sediment < mixed soft sediment Burrows 54.41514 -5.05764 17:10:30 Mixed soft sediment Anemone Stn 8 Tow 6 54.41506 -5.05776 Mixed soft sediment Surface material gravelly 54.41491 -5.05800 Cobble/Boulder Anemones Isolated 54.41484 -5.05809 Cobble/Boulder Anemones 54.41472 -5.05823 Mixed soft sediment > Cobble/Boulder y 54.41463 -5.05837 Mixed soft sediment < Cobble/Boulder Flat y 54.41455 -5.05852 Mixed soft sediment = Cobble/Boulder Flat y 54.41449 -5.05874 17:14:00 Cobble/Boulder Anemones y 54.41443 -5.05892 Mixed soft sediment = Cobble/Boulder y 54.41437 -5.05905 Mixed soft sediment = Cobble/Boulder y 54.41428 -5.05925 Mixed soft sediment = Cobble/Boulder Burrows y 54.41418 -5.05937 Mixed soft sediment < Cobble/Boulder Anemones Vis average Flat y 54.41407 -5.05952 Mixed soft sediment = Cobble/Boulder Anemones Flat y 54.41397 -5.05966 Mixed soft sediment = Cobble/Boulder Anemones Flat y 54.41470 -5.05979 Mixed soft sediment > Cobble/Boulder None obvious Flat y 54.41375 -5.05991 Mixed soft sediment = Cobble/Boulder Some burrows & anemones Flat y 54.41364 -5.06005 17:18:30 Mixed soft sediment Small burrows Flat y 54.41351 -5.06020 Soft sediment < mixed soft sediment Burrows Flat y 54.41339 -5.06030 Soft sediment = mixed soft sediment Burrows - Nephrops Flat y 54.41326 -5.06041 Soft sediment Burrows Flat y 54.41316 -5.06055 Soft sediment Burrows Flat y
63

54.41303 -5.06067 Soft sediment Burrows Flat y 54.41289 -5.06081 Soft sediment Burrows Flat y 54.41276 -5.06097 17:22:30 Soft sediment Small burrows Flat y 54.41265 -5.06110 Soft sediment Small burrows 54.41252 -5.06126 Soft sediment Burrows Flat y 54.41240 -5.06141 Soft sediment 54.41226 -5.06155 Soft sediment Burrows small & large Flat y 54.41212 -5.06170 Soft sediment Flat y 54.41199 -5.06186 Soft sediment > mixed soft sediment Small and large burrows Flat y 54.41186 -5.06202 17:25:30 Soft sediment Flat y 54.41172 -5.06215 Mixed soft sediment Encrusting sponge/DMF Flat y 54.41161 -5.06230 Mixed soft sediment > Cobble/Boulder Flat y 54.41149 -5.06243 Mixed soft sediment > Cobble/Boulder Anemones/Burrows rare Flat y 54.41137 -5.06254 Soft sediment = mixed soft sediment Burrows Flat y 54.41128 -5.06262 Soft sediment > mixed soft sediment Burrows Flat y 54.41119 -5.06273 Soft sediment > mixed soft sediment Burrows Flat y 54.41110 -5.06287 Soft sediment < mixed soft sediment Rock with Anemones Flat y 54.41100 -5.06307 17:29:30 Mixed soft sediment 54.41517 -5.05759 17.103 Mixed soft sediment > Cobble/Boulder Anemones New Tow fy 54.41506 -5.05776 17.11.00 Mixed soft sediment > Cobble/Boulder Anemones fy 54.41495 -5.05795 17.11.32 Mixed soft sediment > Cobble/Boulder fy 54.41483 -5.05809 17.12.00 Mixed soft sediment > Cobble/Boulder fy 54.41472 -5.05823 17.12 33 Mixed soft sediment > Cobble/Boulder fy 54.41463 -5.05837 17.12.33 Mixed soft sediment fy 54.41463 -5.05853 17.12.10 Soft sediment fy 54.41449 -5.05877 17.13.30 Soft sediment fy 54.41443 -5.05892 17.14.03 Soft sediment > mixed soft sediment fy 54.41437 -5.05905 17.14.58 Cobble/Boulder < Bedrock fy 54.41428 -5.05925 17.15.30 - fy 54.41418 -5.05937 17.16.00 - fy
64

54.41408 -5.05988 17.16.40 - fy 54.41397 -5.05966 17.17.00 - fy 54.41386 -5.05980 17.17.32 Soft sediment fy 54.41376 -5.05990 17.17.59 Soft sediment fy 54.41366 -5.06003 17.18.25 Soft sediment fy 54.41353 -5.06020 17.19.02 Soft sediment Burrows fy 54.41340 -5.06029 17.19.27 Soft sediment Burrows fy 54.41327 -5.06041 17.20.00 Soft sediment Burrows fy 54.41317 -5.06052 17.20.28 Soft sediment Burrows fy 54.41303 -5.06068 17.21.00 Soft sediment Burrows fy 54.41289 -5.06081 17.21.30 Soft sediment fy 54.41276 -5.06098 17.22.00 Soft sediment fy 54.41265 -5.06110 17.22.31 Soft sediment fy 54.41261 -5.06128 17.22.59 Soft sediment fy 54.41240 -5.06142 17.23.30 Soft sediment Burrows fy 54.41226 -5.06156 17.24.00 Soft sediment Burrows small fy 54.41212 -5.06171 17.24.30 Soft sediment Small & some large burrows fy 54.41198 -5.06185 17.24.59 Soft sediment fy 54.41185 -5.06204 17.25.30 Soft sediment fy 54.41174 -5.06215 17.26.00 Soft sediment fy 54.41162 -5.06229 17.27.30 - 54.41148 -5.06246 17.27.30 - 54.41138 -5.06255 17.28.00 Soft sediment 54.41128 -5.06262 17.28.30 Soft sediment Burrows 54.41119 -5.06273 17.29.00 Soft sediment 54.41100 -5.06288 17.29.30 - Anemones 54.41345 -5.03843 8.27.00 Soft sediment Fy 54.41314 -5.03849 8.28.00 Soft sediment Fy 54.41295 -5.03854 8.28.56 Soft sediment Fy 54.41284 -5.03857 8.29.00 Soft sediment Fy
65

54.41301 -5.03863 8.29.30 Soft sediment Fy 54.41253 -5.03869 8.30.00 Soft sediment Fy 54.41239 -5.03879 8.30.31 Soft sediment Fy 54.41225 -5.03885 8.31.10 Soft sediment Fy 54.41211 -5.03894 8.31.31 Soft sediment Fy 54.41199 -5.03904 8.31.59 Soft sediment Fy 54.41185 -5.03913 8.32.30 Soft sediment Fy 54.41175 -5.03920 8.33.00 Soft sediment Fy 54.41160 -5.03926 8.33.30 Soft sediment Fy 54.41144 -5.03930 8.34.00 Soft sediment No obs., poor vis Fy 54.41129 -5.03937 8.34.34 Soft sediment Fy 54.41113 -5.03939 8.35.00 Soft sediment Fy 54.41101 -5.03945 8.35.36 Soft sediment Fy 54.41084 -5.03949 8.36.00 Soft sediment Fy 54.41072 -5.03952 8.36.30 Soft sediment Fy 54.41058 -5.03956 8.37.00 Soft sediment Fy 54.41044 -5.03959 8.37.30 Soft sediment Fy 54.41030 -5.03963 8.38.00 Soft sediment Fy 54.38333 -5.03967 8.38.30 - Sabella Fy 54.40999 -5.03969 8.39.00 Soft sediment Burrows Fy 54.40981 -5.03967 8.39.00 - Fy 54.40967 -5.03969 8.39.59 - Fy 54.40950 -5.03971 8.40.30 - Fy 54.40939 -5.03974 8.41.00 Soft sediment Fy 54.40925 -5.03975 8.41.30 - Fy 54.40907 -5.03975 8.42.01 Bedrock Anemones xx 54.40893 -5.03976 8.42.30 Soft sediment Fy 54.40876 -5.03982 8.43.01 - Fy 54.40860 -5.03989 8.43.30 Bedrock Fy 54.40844 -5.04003 8.44.00 Soft sediment Fy
66
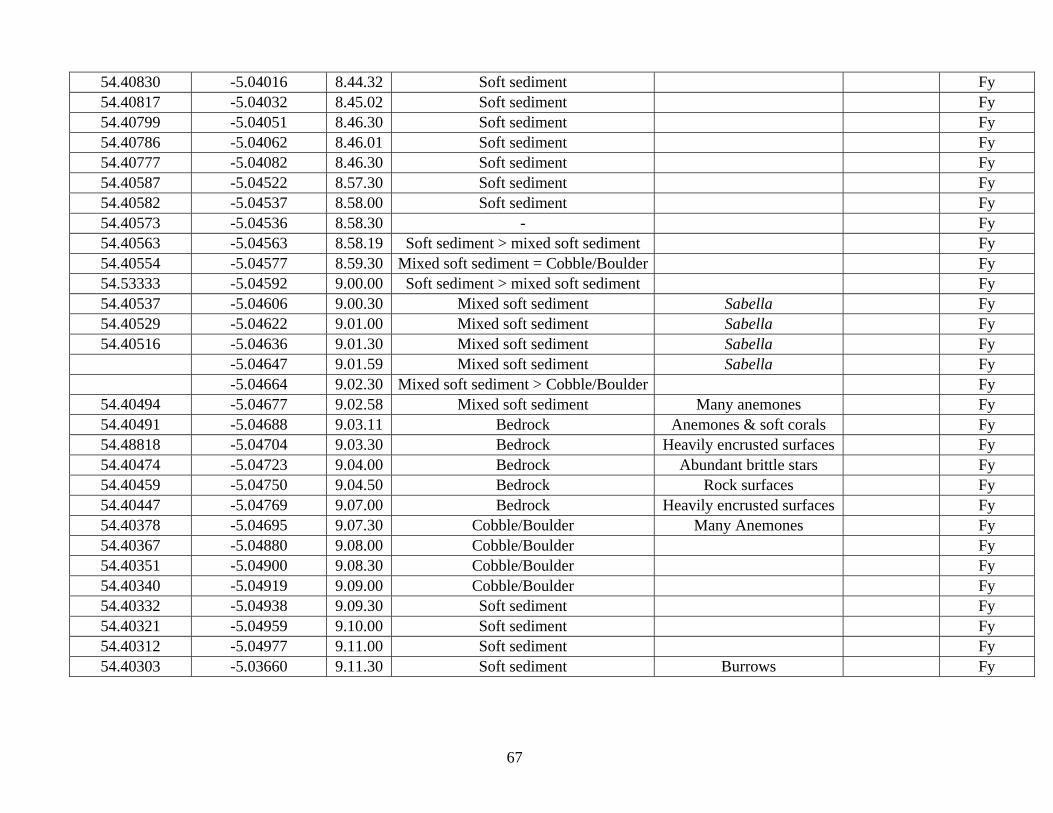
54.40830 -5.04016 8.44.32 Soft sediment Fy 54.40817 -5.04032 8.45.02 Soft sediment Fy 54.40799 -5.04051 8.46.30 Soft sediment Fy 54.40786 -5.04062 8.46.01 Soft sediment Fy 54.40777 -5.04082 8.46.30 Soft sediment Fy 54.40587 -5.04522 8.57.30 Soft sediment Fy 54.40582 -5.04537 8.58.00 Soft sediment Fy 54.40573 -5.04536 8.58.30 - Fy 54.40563 -5.04563 8.58.19 Soft sediment > mixed soft sediment Fy 54.40554 -5.04577 8.59.30 Mixed soft sediment = Cobble/Boulder Fy 54.53333 -5.04592 9.00.00 Soft sediment > mixed soft sediment Fy 54.40537 -5.04606 9.00.30 Mixed soft sediment Sabella Fy 54.40529 -5.04622 9.01.00 Mixed soft sediment Sabella Fy 54.40516 -5.04636 9.01.30 Mixed soft sediment Sabella Fy
-5.04647 9.01.59 Mixed soft sediment Sabella Fy -5.04664 9.02.30 Mixed soft sediment > Cobble/Boulder Fy
54.40494 -5.04677 9.02.58 Mixed soft sediment Many anemones Fy 54.40491 -5.04688 9.03.11 Bedrock Anemones & soft corals Fy 54.48818 -5.04704 9.03.30 Bedrock Heavily encrusted surfaces Fy 54.40474 -5.04723 9.04.00 Bedrock Abundant brittle stars Fy 54.40459 -5.04750 9.04.50 Bedrock Rock surfaces Fy 54.40447 -5.04769 9.07.00 Bedrock Heavily encrusted surfaces Fy 54.40378 -5.04695 9.07.30 Cobble/Boulder Many Anemones Fy 54.40367 -5.04880 9.08.00 Cobble/Boulder Fy 54.40351 -5.04900 9.08.30 Cobble/Boulder Fy 54.40340 -5.04919 9.09.00 Cobble/Boulder Fy 54.40332 -5.04938 9.09.30 Soft sediment Fy 54.40321 -5.04959 9.10.00 Soft sediment Fy 54.40312 -5.04977 9.11.00 Soft sediment Fy 54.40303 -5.03660 9.11.30 Soft sediment Burrows Fy
67
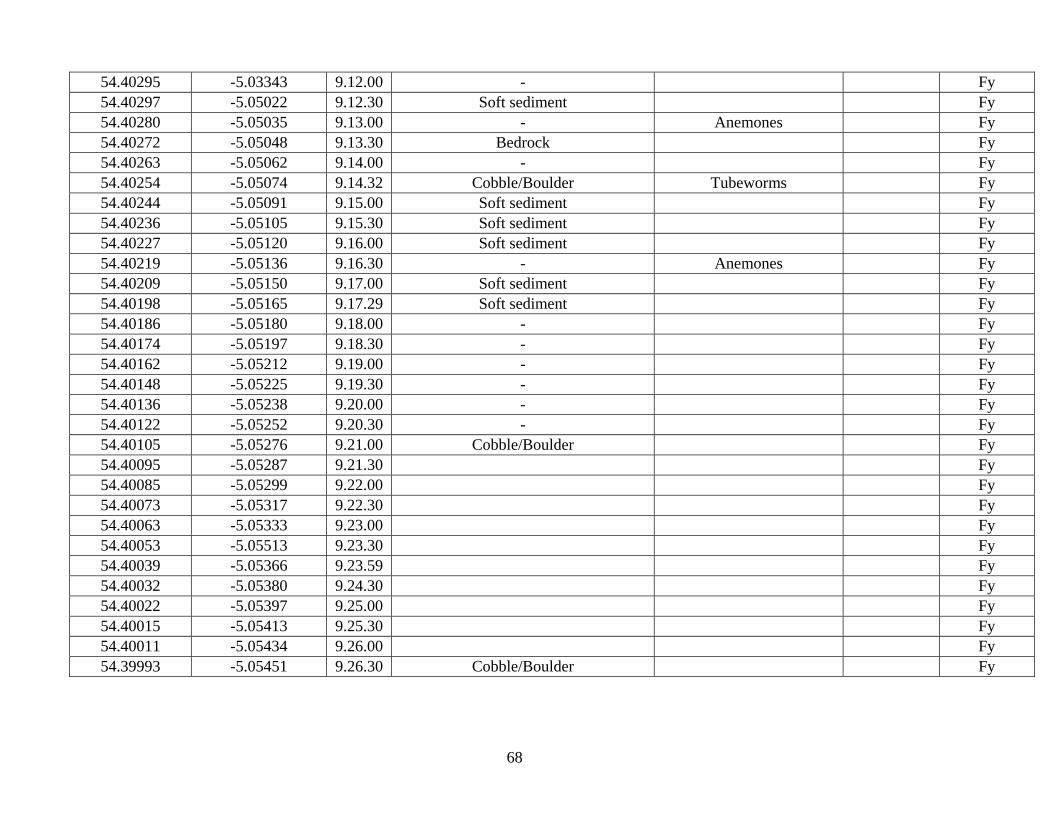
54.40295 -5.03343 9.12.00 - Fy 54.40297 -5.05022 9.12.30 Soft sediment Fy 54.40280 -5.05035 9.13.00 - Anemones Fy 54.40272 -5.05048 9.13.30 Bedrock Fy 54.40263 -5.05062 9.14.00 - Fy 54.40254 -5.05074 9.14.32 Cobble/Boulder Tubeworms Fy 54.40244 -5.05091 9.15.00 Soft sediment Fy 54.40236 -5.05105 9.15.30 Soft sediment Fy 54.40227 -5.05120 9.16.00 Soft sediment Fy 54.40219 -5.05136 9.16.30 - Anemones Fy 54.40209 -5.05150 9.17.00 Soft sediment Fy 54.40198 -5.05165 9.17.29 Soft sediment Fy 54.40186 -5.05180 9.18.00 - Fy 54.40174 -5.05197 9.18.30 - Fy 54.40162 -5.05212 9.19.00 - Fy 54.40148 -5.05225 9.19.30 - Fy 54.40136 -5.05238 9.20.00 - Fy 54.40122 -5.05252 9.20.30 - Fy 54.40105 -5.05276 9.21.00 Cobble/Boulder Fy 54.40095 -5.05287 9.21.30 Fy 54.40085 -5.05299 9.22.00 Fy 54.40073 -5.05317 9.22.30 Fy 54.40063 -5.05333 9.23.00 Fy 54.40053 -5.05513 9.23.30 Fy 54.40039 -5.05366 9.23.59 Fy 54.40032 -5.05380 9.24.30 Fy 54.40022 -5.05397 9.25.00 Fy 54.40015 -5.05413 9.25.30 Fy 54.40011 -5.05434 9.26.00 Fy 54.39993 -5.05451 9.26.30 Cobble/Boulder Fy
68
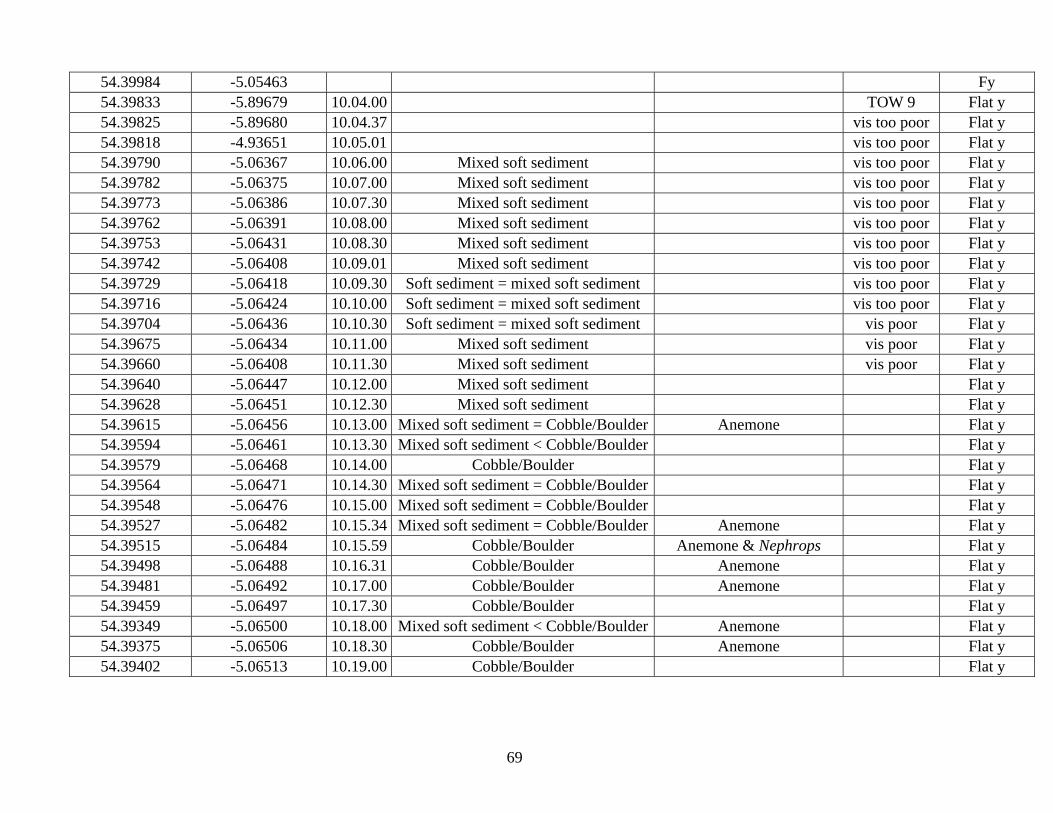
54.39984 -5.05463 Fy 54.39833 -5.89679 10.04.00 TOW 9 Flat y 54.39825 -5.89680 10.04.37 vis too poor Flat y 54.39818 -4.93651 10.05.01 vis too poor Flat y 54.39790 -5.06367 10.06.00 Mixed soft sediment vis too poor Flat y 54.39782 -5.06375 10.07.00 Mixed soft sediment vis too poor Flat y 54.39773 -5.06386 10.07.30 Mixed soft sediment vis too poor Flat y 54.39762 -5.06391 10.08.00 Mixed soft sediment vis too poor Flat y 54.39753 -5.06431 10.08.30 Mixed soft sediment vis too poor Flat y 54.39742 -5.06408 10.09.01 Mixed soft sediment vis too poor Flat y 54.39729 -5.06418 10.09.30 Soft sediment = mixed soft sediment vis too poor Flat y 54.39716 -5.06424 10.10.00 Soft sediment = mixed soft sediment vis too poor Flat y 54.39704 -5.06436 10.10.30 Soft sediment = mixed soft sediment vis poor Flat y 54.39675 -5.06434 10.11.00 Mixed soft sediment vis poor Flat y 54.39660 -5.06408 10.11.30 Mixed soft sediment vis poor Flat y 54.39640 -5.06447 10.12.00 Mixed soft sediment Flat y 54.39628 -5.06451 10.12.30 Mixed soft sediment Flat y 54.39615 -5.06456 10.13.00 Mixed soft sediment = Cobble/Boulder Anemone Flat y 54.39594 -5.06461 10.13.30 Mixed soft sediment < Cobble/Boulder Flat y 54.39579 -5.06468 10.14.00 Cobble/Boulder Flat y 54.39564 -5.06471 10.14.30 Mixed soft sediment = Cobble/Boulder Flat y 54.39548 -5.06476 10.15.00 Mixed soft sediment = Cobble/Boulder Flat y 54.39527 -5.06482 10.15.34 Mixed soft sediment = Cobble/Boulder Anemone Flat y 54.39515 -5.06484 10.15.59 Cobble/Boulder Anemone & Nephrops Flat y 54.39498 -5.06488 10.16.31 Cobble/Boulder Anemone Flat y 54.39481 -5.06492 10.17.00 Cobble/Boulder Anemone Flat y 54.39459 -5.06497 10.17.30 Cobble/Boulder Flat y 54.39349 -5.06500 10.18.00 Mixed soft sediment < Cobble/Boulder Anemone Flat y 54.39375 -5.06506 10.18.30 Cobble/Boulder Anemone Flat y 54.39402 -5.06513 10.19.00 Cobble/Boulder Flat y
69

54.39386 -5.06519 10.19.34 Cobble/Boulder Anemone Flat y 54.39372 -5.06525 10.20.00 Cobble/Boulder Flat y 54.39359 -5.06532 10.20.30 Cobble/Boulder Anemone Flat y 54.39341 -5.06539 10.21.00 Cobble/Boulder Flat y 54.39324 -5.06548 10.21.31 Cobble/Boulder Anemone Flat y 54.39307 -5.06552 10.22.02 Cobble/Boulder Flat y 54.39290 -5.06557 10.22.30 Cobble/Boulder Flat y 54.39276 -5.06564 10.23.20 Cobble/Boulder Flat y 54.39255 -5.06572 10.23.30 Cobble/Boulder Flat y 54.39241 -5.06581 10.24.00 Mixed soft sediment = Cobble/Boulder Flat y 54.39230 -5.06591 10.25.00 Cobble/Boulder Flat y 54.39213 -5.06597 10.25.30 Cobble/Boulder Flat y 54.39210 -5.06605 10.25.59 Cobble/Boulder Flat y 54.39182 -5.06610 10.26.30 Mixed soft sediment < Cobble/Boulder Flat y 54.39169 -5.06617 10.27.00 Mixed soft sediment < Cobble/Boulder stop 54.39148 -5.06628 10.27.35 Cobble/Boulder Flat y 54.39132 -5.06636 10.28.02 Mixed soft sediment < Cobble/Boulder Flat y 54.39119 -5.06646 10.28.33 Cobble/Boulder Flat y 54.39106 -5.06656 10.29.02 Cobble/Boulder Flat y 54.39092 -5.06666 10.29.33 Mixed soft sediment = Cobble/Boulder Flat y 54.39082 -5.06677 10.30.00 Mixed soft sediment = Cobble/Boulder Flat y 54.39069 -5.06688 10.30.30 Cobble/Boulder Flat y 54.40562 -5.07392 11.01.00 Mixed soft sediment Tow 10 Flat y 54.40721 -5.07401 11.01.10 Mixed soft sediment poor vis Flat y 54.40531 -5.07413 11.02.11 Soft sediment < mixed soft sediment Burrows Flat y 54.40521 -5.07414 11.02.31 Soft sediment < mixed soft sediment Burrows Flat y 54.40658 -5.07412 11.03.00 Soft sediment < mixed soft sediment Flat y 54.40486 -5.07410 11.03.29 Mixed soft sediment Flat y 54.40465 -5.07409 11.04.02 Mixed soft sediment > Cobble/Boulder Anemones Flat y 54.40447 -5.07407 11.04.30 Mixed soft sediment < Cobble/Boulder Anemones Flat y
70

54.40430 -5.07403 11.05.01 Mixed soft sediment > Cobble/Boulder Anemones Flat y 54.40411 -5.07405 11.05.30 Cobble/Boulder Large boulders with
Anemones Flat y
54.40393 -5.07403 11.06.00 Mixed soft sediment < Cobble/Boulder Flat y 54.40375 -5.07404 11.06.30 Cobble/Boulder Flat y 54.40335 -5.07407 11.07.31 Soft sediment = mixed soft sediment Flat y 54.40317 -5.07411 11.08.01 Mixed soft sediment Burrows Flat y 54.40298 -5.07416 11.08.30 Mixed soft sediment = Cobble/Boulder Anemones Flat y 54.40279 -5.07422 11.09.00 Mixed soft sediment = Cobble/Boulder Flat y 54.40252 -5.07425 11.09.30 Mixed soft sediment > Cobble/Boulder Flat y 54.40245 -5.07432 11.10.00 Soft sediment > mixed soft sediment Flat y 54.40225 -5.07438 11.10.30 - Burrows Flat y 54.40209 -5.07440 11.11.01 Soft sediment > mixed soft sediment Burrows Flat y 54.40193 -5.07446 11.11.30 Soft sediment = mixed soft sediment Burrows Flat y 54.40178 -5.07454 11.11.59 Soft sediment = mixed soft sediment Burrows Flat y 54.40161 -5.07460 11.12.30 Soft sediment > mixed soft sediment Burrows Flat y 54.40147 -5.07463 11.13.00 Soft sediment > mixed soft sediment Burrows Flat y 54.40128 -5.07459 11.13.30 Soft sediment < mixed soft sediment Burrows Flat y 54.40112 -5.07463 11.14.00 Soft sediment < mixed soft sediment Burrows Flat y 54.40092 -5.07462 11.14.30 Mixed soft sediment > Cobble/Boulder Burrows Flat y 54.40067 -5.07459 11.15.09 Soft sediment < mixed soft sediment Burrows Flat y 54.40055 -5.07459 11.75.30 Soft sediment = mixed soft sediment Burrows Flat y 54.40033 -5.07463 11.16.00 Soft sediment = mixed soft sediment Flat y 54.40008 -5.07475 11.16.30 Soft sediment > mixed soft sediment Burrows Flat y 54.39999 -5.07471 11.17.02 Soft sediment = mixed soft sediment Flat y 54.39982 -5.07469 11.17.30 Mixed soft sediment > Cobble/Boulder Burrows Flat y 54.48295 -5.07488 11.18.10 Soft sediment < mixed soft sediment Burrows Flat y 54.39950 -5.07494 11.18.36 Mixed soft sediment Flat y 54.39936 -5.07517 11.19.05 Mixed soft sediment Flat y 54.39925 -5.07509 11.19.30 Mixed soft sediment Burrows Flat y 54.39910 -5.07515 11.19.59 Mixed soft sediment Small burrows - fine sand Flat y
71
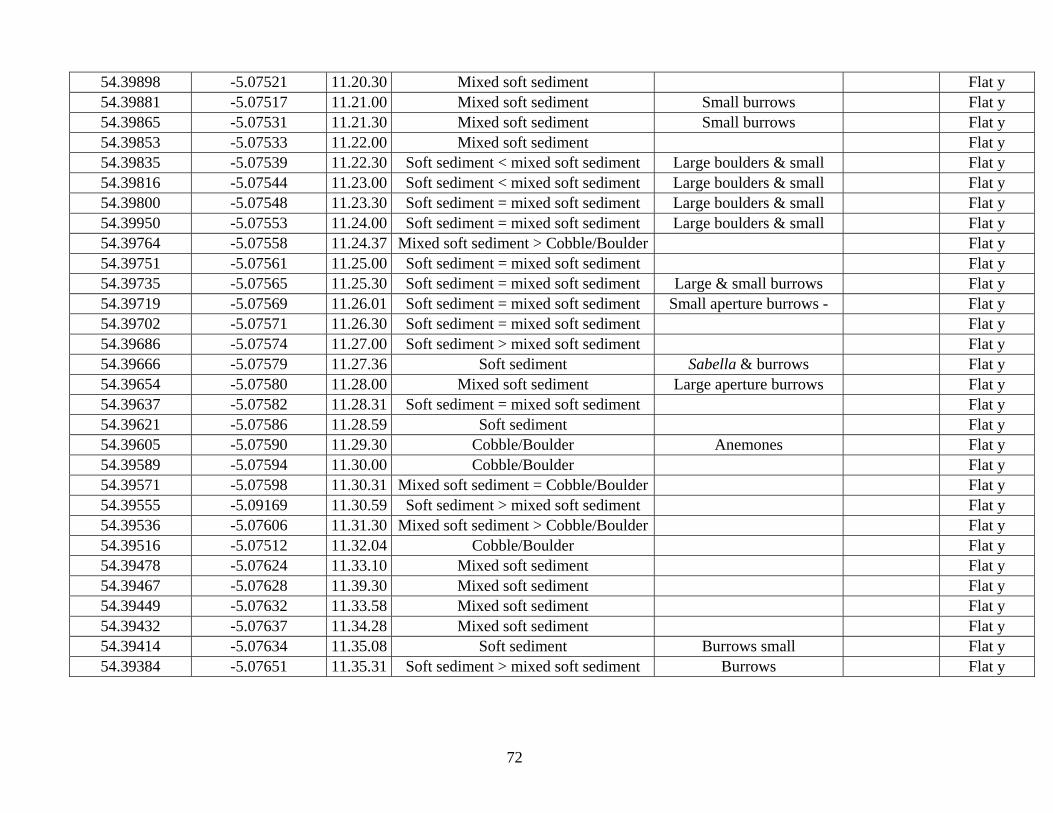
54.39898 -5.07521 11.20.30 Mixed soft sediment Flat y 54.39881 -5.07517 11.21.00 Mixed soft sediment Small burrows Flat y 54.39865 -5.07531 11.21.30 Mixed soft sediment Small burrows Flat y 54.39853 -5.07533 11.22.00 Mixed soft sediment Flat y 54.39835 -5.07539 11.22.30 Soft sediment < mixed soft sediment Large boulders & small Flat y 54.39816 -5.07544 11.23.00 Soft sediment < mixed soft sediment Large boulders & small Flat y 54.39800 -5.07548 11.23.30 Soft sediment = mixed soft sediment Large boulders & small Flat y 54.39950 -5.07553 11.24.00 Soft sediment = mixed soft sediment Large boulders & small Flat y 54.39764 -5.07558 11.24.37 Mixed soft sediment > Cobble/Boulder Flat y 54.39751 -5.07561 11.25.00 Soft sediment = mixed soft sediment Flat y 54.39735 -5.07565 11.25.30 Soft sediment = mixed soft sediment Large & small burrows Flat y 54.39719 -5.07569 11.26.01 Soft sediment = mixed soft sediment Small aperture burrows - Flat y 54.39702 -5.07571 11.26.30 Soft sediment = mixed soft sediment Flat y 54.39686 -5.07574 11.27.00 Soft sediment > mixed soft sediment Flat y 54.39666 -5.07579 11.27.36 Soft sediment Sabella & burrows Flat y 54.39654 -5.07580 11.28.00 Mixed soft sediment Large aperture burrows Flat y 54.39637 -5.07582 11.28.31 Soft sediment = mixed soft sediment Flat y 54.39621 -5.07586 11.28.59 Soft sediment Flat y 54.39605 -5.07590 11.29.30 Cobble/Boulder Anemones Flat y 54.39589 -5.07594 11.30.00 Cobble/Boulder Flat y 54.39571 -5.07598 11.30.31 Mixed soft sediment = Cobble/Boulder Flat y 54.39555 -5.09169 11.30.59 Soft sediment > mixed soft sediment Flat y 54.39536 -5.07606 11.31.30 Mixed soft sediment > Cobble/Boulder Flat y 54.39516 -5.07512 11.32.04 Cobble/Boulder Flat y 54.39478 -5.07624 11.33.10 Mixed soft sediment Flat y 54.39467 -5.07628 11.39.30 Mixed soft sediment Flat y 54.39449 -5.07632 11.33.58 Mixed soft sediment Flat y 54.39432 -5.07637 11.34.28 Mixed soft sediment Flat y 54.39414 -5.07634 11.35.08 Soft sediment Burrows small Flat y 54.39384 -5.07651 11.35.31 Soft sediment > mixed soft sediment Burrows Flat y
72

54.39382 -5.07656 11.36.01 Soft sediment = mixed soft sediment Flat y 54.39366 -5.07662 11.36.30 Soft sediment > mixed soft sediment Flat y 54.39350 -5.07668 11.37.00 Soft sediment > mixed soft sediment Flat y 54.39333 -5.07674 11.37.30 Soft sediment Flat y 54.39318 -5.07679 11.38.02 Soft sediment Flat y 54.39305 -5.07681 11.38.30 Soft sediment > mixed soft sediment Flat y 54.39289 -5.07681 11.39.07 Soft sediment Burrows Flat y 54.39239 -5.07684 11.39.30 Soft sediment > mixed soft sediment Flat y 54.39224 -5.07685 11.40.00 Soft sediment Flat y 54.39239 -5.07684 11.40.30 Soft sediment Many burrows Flat y 54.39224 -5.07685 11.41.00 Soft sediment > mixed soft sediment Flat y 54.39204 -5.07687 11.41.30 Soft sediment > mixed soft sediment Many burrows Flat y 54.39290 -5.07688 11.42.01 Soft sediment Flat y 54.39177 -5.07687 11.42.30 Soft sediment Nephrops Flat y 54.39167 -5.07687 11.42.59 Soft sediment Flat y 54.39155 -5.07686 11.43.00 Soft sediment Small burrows Flat y 54.39139 -5.07684 11.43.31 Soft sediment Sabella & burrows Flat y 54.39090 -5.07676 11.45.00 Soft sediment Burrows Flat y 54.39068 -5.07671 11.45.30 Soft sediment Flat y 54.39049 -5.07665 11.46.08 Soft sediment Flat y 54.39000 -5.07650 11.47.00 Soft sediment > mixed soft sediment Burrows & Sabella Flat y 54.38983 -5.07640 11.48.00 Soft sediment > mixed soft sediment Flat y 54.38952 -5.07637 11.49.00 Cobble/Boulder < Bedrock 54.38926 -5.07580 11.50.00 Cobble/Boulder 54.38886 -5.07652 11.51.00 Mixed soft sediment END OF
TOW Flat y
54.39165 -5.01180 13.08.01 Soft sediment = mixed soft sediment TOW 11 F Y 54.39178 -5.01182 13.08.38 Soft sediment < mixed soft sediment Sabella & Munida F Y 54.39188 -5.01186 13.09.00 Mixed soft sediment > Cobble/Boulder F Y 54.39212 -5.01181 13.10.21 Mixed soft sediment Sabella F Y 54.39217 -5.01181 13.10.31 Mixed soft sediment F Y
73

54.39230 -5.01181 13.11.01 Mixed soft sediment Sabella F Y 54.39240 -5.01180 13.11.30 Mixed soft sediment F Y 54.39251 -5.01173 13.12.00 Soft sediment = mixed soft sediment Sabella F Y 54.39258 -5.01172 13.12.34 Mixed soft sediment = Cobble/Boulder F Y 54.39258 -5.01177 13.13.00 Cobble/Boulder Nephrops & Munida F Y 54.39278 -5.01186 13.13.30 Cobble/Boulder Munida & Sabella F Y 54.39283 -5.01192 13.14.00 Cobble/Boulder Munida & Sabella F Y 54.39291 -5.01194 13.14.30 Cobble/Boulder Munida & Sabella F Y 54.39304 -5.01194 13.15.00 Cobble/Boulder Anemones & Munida F Y 54.39308 -5.01190 13.15.30 Cobble/Boulder F Y 54.39306 -5.01190 15.16.00 Cobble/Boulder F Y 54.39312 -5.01197 15.16.30 Mixed soft sediment F Y 54.39315 -5.01213 15.17.04 Mixed soft sediment Sabella F Y 54.39319 -5.01227 15.17.37 Soft sediment Sabella and small burrows F Y 54.39324 -5.01237 15.17.39 Cobble/Boulder F Y 54.39331 -5.01250 15.18.30 - 54.39340 -5.01263 15.19.00 Cobble/Boulder F Y 54.39345 -5.01268 15.19.32 - Small aperture burrows F Y 54.39352 -5.01271 15.20.01 Cobble/Boulder F Y 54.39357 -5.01273 15.20.33 - F Y 54.39363 -5.01273 15.21.00 - F Y 54.39372 -5.01276 15.21.32 Cobble/Boulder F Y 54.39380 -5.01288 15.21.59 - F Y 54.39386 -5.01302 15.22.30 Bedrock Anemones on small outcrop F Y 54.39392 -5.01318 15.23.01 Soft sediment Munida and Burrows F Y 54.39402 -5.01339 13.23.32 Cobble/Boulder Burrows F Y 54.39408 -5.01353 13.24.30 Cobble/Boulder High density F Y 54.39424 -5.01380 13.25.00 Cobble/Boulder Anemones F Y 54.39430 -5.01392 13.25.32 Cobble/Boulder Munida F Y 54.39434 -5.01402 13.26.00 Cobble/Boulder F Y
74

54.39441 -5.01418 13.26.30 Cobble/Boulder F Y 54.39444 -5.01432 13.27.00 Cobble/Boulder F Y 54.39444 -5.01443 13.27.30 Cobble/Boulder F Y 54.39441 -5.01457 13.28.00 Mixed soft sediment F Y 54.39443 -5.01467 13.28.27 Cobble/Boulder Anemones F Y 54.39452 -5.01480 13.29.00 Cobble/Boulder Luidia F Y 54.39458 -5.01151 13.29.30 Mixed soft sediment F Y 54.39467 -5.01487 13.30.00 Cobble/Boulder F Y 54.39479 -5.01485 13.30.30 Cobble/Boulder F Y 54.39490 -5.01482 13.31.00 Cobble/Boulder F Y 54.39502 -5.01480 13.31.33 Cobble/Boulder 54.39507 -5.01479 13.22.00 Cobble/Boulder F Y 54.39511 -5.01482 13.32.30 Mixed soft sediment F Y 54.39514 -5.01488 13.32.47 Cobble/Boulder F Y 54.39517 -5.01495 13.33,01 Cobble/Boulder F Y 54.39526 -5.01515 13.33.30 Cobble/Boulder F Y 54.39537 -5.01539 13.34.00 Cobble/Boulder F Y 54.39545 -5.01561 13.34.30 Cobble/Boulder F Y 54.39554 -5.01580 13.35.02 Bedrock Anemones n 54.39562 -5.01589 13.35.30 Bedrock n 54.39574 -5.01598 13.36.00 Mixed soft sediment F Y 54.39583 -5.01610 13.36.35 Soft sediment F Y 54.39590 -5.01624 13.37.00 Soft sediment F Y 54.39585 -5.01633 13.37.30 Soft sediment F Y 54.40512 -5.04574 14.10.30 Mixed soft sediment Poor viz TOW 12 54.40520 -5.04583 14.10.57 Bedrock Anemones 54.40529 -5.04590 14.11.37 Bedrock Anemones 54.40533 -5.04592 14.11.59 Bedrock Anemones 54.40540 -5.04590 14.12.31 Bedrock Anemones soft corals 54.40548 -5.04588 14.13.00 Bedrock Anemones soft corals
75

54.40583 -5.87856 14.15.29 Bedrock Anemones soft corals 54.40583 -5.87976 14.16.02 Bedrock Anemones soft corals 54.40579 -5.04666 14.16.35 Bedrock Anemones soft corals 54.40576 -5.04685 17.17.01 Bedrock 54.40569 -5.04708 14.17.32 Bedrock 54.40564 -5.04725 14.18.00 Bedrock 54.38246 -5.03545 14.52.30 Soft sediment Small burrows TOW 13 F Y 54.38239 -5.03534 14.53.00 Soft sediment Small burrows F Y 54.38229 -5.03518 14.53.30 - Anemones F Y 54.38223 -5.03502 14.54.00 - Small burrows F Y 54.38219 -5.03478 14.54.19 - Burrows & Anemones F Y 54.38214 -5.03462 14.55.00 - Burrows F Y 54.38213 -5.03440 14.55.30 - Small burrows F Y 54.38215 -5.03417 14.56.09 - Small burrows & Anemones F Y 54.38214 -5.03400 14.56.30 Cobble/Boulder F Y 54.38213 -5.03380 14.57.01 Soft sediment F Y 54.38212 -5.03360 14.57.30 Mixed soft sediment Anemones & Tubeworms F Y 54.38204 -5.03352 14.58.00 Mixed soft sediment > Cobble/Boulder F Y 54.38201 -5.03342 14.58.30 Mixed soft sediment Small burrows F Y 54.38191 -5.03339 14.59.00 Mixed soft sediment > Cobble/Boulder F Y 54.38182 -5.03332 14.59.30 Soft sediment = mixed soft sediment F Y 54.38171 -5.03318 15.00.00 Cobble/Boulder Brittle stars & Anemones F Y 54.38164 -5.03294 15.00.31 Mixed soft sediment < Cobble/Boulder Anemones F Y 54.38151 -5.03248 15.01.32 Soft sediment Small burrows F Y 54.38142 -5.03234 15.02.11 Soft sediment F Y 54.38132 -5.03225 15.02.31 Soft sediment Large burrows F Y 54.38125 -5.03210 15.03.00 Soft sediment F Y 54.38117 -5.03206 15.50.30 Soft sediment F Y 54.38113 -5.03174 15.04.00 - F Y 54.38105 -5.03163 15.04.30 Soft sediment F Y
76

54.38096 -5.03149 15.05.00 - F Y 54.38086 -5.03127 15.05.30 Soft sediment END OF
TOW F Y
54.43737 -5.03303 17.08.30 Soft sediment = mixed soft sediment Viz too poor TOW 14 F Y 54.43744 -5.03301 17.09.00 Soft sediment = mixed soft sediment F Y 54.43752 -5.03297 17.09.30 Soft sediment = mixed soft sediment F Y 54.43764 -5.03288 17.10.00 Soft sediment = mixed soft sediment Burrows F Y 54.43777 -5.03278 17.11.30 Soft sediment = mixed soft sediment Burrows F Y 54.43779 -5.03276 17.12.10 Soft sediment = mixed soft sediment Burrows F Y 54.43784 -5.03171 17.12.30 Soft sediment = mixed soft sediment Burrows F Y 54.43789 -5.03265 17.13,00 - Anemones F Y 54.43798 -5.03256 17.13.30 Cobble/Boulder Anemones F Y 54.43803 -5.03251 17.13.59 Cobble/Boulder Anemones F Y 54.43810 -5.03245 14.14.31 Cobble/Boulder F Y 54.43814 -5.03242 17.15.00 Cobble/Boulder F Y 54.43818 -5.03239 17.15.36 Cobble/Boulder F Y 54.43830 -5.03236 17.16.30 Cobble/Boulder F Y 54.43837 -5.03229 17.17.02 Mixed soft sediment > Cobble/Boulder F Y 54.43845 -5.03226 17.17.33 - F Y 54.43849 -5.03222 17.18.00 Mixed soft sediment > Cobble/Boulder F Y 54.43853 -5.03217 17.18.30 Cobble/Boulder F Y 54.43856 -5.03215 17.18.59 Cobble/Boulder F Y 54.43865 -5.03205 17.19.30 Cobble/Boulder Anemones F Y 54.43869 -5.03200 17.20.00 Cobble/Boulder TOW END F Y 54.43817 -5.04472 18.32.59 Soft sediment Vis very poor Tow 17 F Y 54.43830 -5.04439 18.33.59 Soft sediment F Y 54.43833 -5.04420 18.34.30 Soft sediment = mixed soft sediment Large burrows F Y 54.43831 -5.04405 18.35.00 Soft sediment F Y 54.43828 -5.04390 18.35.29 Mixed soft sediment F Y 54.43826 -5.04373 18.36.00 Mixed soft sediment F Y 54.43823 -5.04344 18.37.00 Mixed soft sediment F Y
77

54.43820 -5.04331 18.37.30 Mixed soft sediment F Y 54.43817 -5.04311 18.37.59 Mixed soft sediment F Y 54.43818 -5.04298 18.38.30 Mixed soft sediment F Y
4435.73333 -5.04279 18.38.59 Mixed soft sediment F Y 54.43821 -5.04258 18.39.30 Mixed soft sediment F Y 54.43823 -5.04237 18.40.00 Mixed soft sediment F Y 54.43824 -5.04217 18.40.30 Mixed soft sediment F Y 54.43827 -5.04199 18.41.00 Mixed soft sediment F Y 54.43831 -5.04179 18.41.31 Mixed soft sediment F Y 54.43835 -5.04161 18.42.00 Mixed soft sediment F Y 54.43838 -5.04140 18.42.31 Mixed soft sediment < Cobble/Boulder F Y 54.43843 -5.04119 18.43.00 Mixed soft sediment F Y 54.43860 -5.04056 18.44.30 Mixed soft sediment F Y 54.43865 -5.04036 18.45.00 Mixed soft sediment F Y 54.43871 -5.04017 18.45.30 Soft sediment = mixed soft sediment F Y 54.43875 -5.03999 18.46.00 Soft sediment = mixed soft sediment F Y 54.43881 -5.03980 18.46.30 Mixed soft sediment F Y 54.43888 -5.03959 18.47.00 Mixed soft sediment = Cobble/Boulder F Y 54.43892 -5.03938 18.47.30 Mixed soft sediment < Cobble/Boulder Vis too poor F Y 54.43897 -5.03916 18.48.00 Mixed soft sediment < Cobble/Boulder Anemones F Y 54.43902 -5.03893 18.48.34 Mixed soft sediment = Cobble/Boulder Anemones F Y 54.43907 -5.03874 18.49.00 2.9 Anemones F Y 54.43912 -5.03855 18.49.30 2.9 F Y 54.43916 -5.03833 18.50.02 Mixed soft sediment > Cobble/Boulder F Y 54.43933 -5.03815 18.50.32 - F Y 54.44000 -5.03905 18.52.00 Bedrock F x 54.44053 -5.04952 19.46.06 Soft sediment Burrows F Y 54.44052 -5.04928 19.46.37 Soft sediment F Y 54.44055 -5.04907 19.47.02 Soft sediment F Y 54.44056 -5.04885 19.47.31 - F Y
78

54.44055 -5.04864 19.48.00 - F Y 54.44057 -5.04845 19.48.30 Soft sediment = mixed soft sediment Tubeworms F Y 54.44057 -5.04823 19.49.01 - F Y 54.44056 -5.04802 19.49.33 Mixed soft sediment = Cobble/Boulder F Y 54.44052 -5.04781 19.50.02 Soft sediment = mixed soft sediment F Y 54.44052 -5.03809 19.50.32 Mixed soft sediment > Cobble/Boulder F Y 54.44045 -5.04734 19.51.00 Soft sediment < mixed soft sediment Tubeworms F Y 54.44045 -5.04710 19.51.30 Soft sediment < mixed soft sediment F Y 54.44055 -5.04684 19.52.00 Mixed soft sediment F Y 54.44034 -5.04663 19.52.30 Mixed soft sediment F Y 54.44027 -5.04631 19.53.00 Mixed soft sediment F Y 54.44026 -5.04618 19.53.30 Mixed soft sediment F Y 54.44022 -5.04598 19.54.00 Mixed soft sediment F Y 54.44020 -5.04579 19.54.30 Soft sediment < mixed soft sediment F Y 54.44013 -5.04557 19.55.00 Soft sediment < mixed soft sediment F Y 54.44008 -5.04534 19.55.30 Soft sediment F Y 54.44001 -5.04513 19.55.59 Soft sediment F Y 54.43993 -5.04486 19.56.30 Soft sediment Large burrows F Y 54.43984 -5.04462 19.57.00 Soft sediment Burrows F Y 54.43979 -5.04439 19.57.30 - F Y 54.43970 -5.04419 19.58.00 Soft sediment Burrows F Y 54.43965 -5.04397 19.58.30 Soft sediment F Y 54.43958 -5.04376 19.59.00 Soft sediment Burrows F Y 54.43953 -5.04350 19.59.30 Soft sediment > mixed soft sediment Burrows F Y 54.43948 -5.04192 20.00.00 Soft sediment Nephrops F Y 54.43944 -5.04298 20.00.30 - F Y 54.43939 -5.04279 20.01.00 Soft sediment > mixed soft sediment F Y 54.43930 -5.04252 20.01.30 - F Y 54.43929 -5.04231 20.02.00 Soft sediment > mixed soft sediment Tubeworms F Y 54.43923 -5.04204 20.02.30 Soft sediment > mixed soft sediment F Y
79

54.43923 -5.04187 20.03.30 Soft sediment > mixed soft sediment F Y 54.43919 -5.04163 20.03.00 Soft sediment > mixed soft sediment F Y 54.43914 -5.04135 20.4.00 - F Y 54.43907 -5.04105 20.4.30 Soft sediment F Y 54.43902 -5.04080 20.05.00 Soft sediment = mixed soft sediment F Y 54.43895 -5.04053 20.05.30 Soft sediment > mixed soft sediment F Y 54.43889 -5.04025 20.05.59 Soft sediment = mixed soft sediment F Y 54.43876 -5.03997 20.06.30 Soft sediment = mixed soft sediment F Y 54.43865 -5.03970 20.07.00 - Munida & Anemones F Y 54.43856 -5.03945 20.07.30 Cobble/Boulder F Y 54.43844 -5.03919 20.08.00 Cobble/Boulder F Y 54.40488 -5.06270 16:18 Bedrock Tubeworms 54.40476 -5.06269 Soft sediment 54.40437 -5.06257 Soft sediment 54.40401 -5.06250 - 54.40362 -5.06244 - 54.40333 -5.06250 16:23 Soft sediment > mixed soft sediment 54.40277 -5.06277 Soft sediment 54.40233 -5.06315 Soft sediment = mixed soft sediment 54.40217 -5.06332 Soft sediment < mixed soft sediment 54.40198 -5.06358 Mixed soft sediment 54.40180 -5.06390 Mixed soft sediment > Cobble/Boulder 54.40160 -5.06427 Mixed soft sediment = Cobble/Boulder 54.40135 -5.06465 - 54.40110 -5.06496 16:32 Mixed soft sediment = Cobble/Boulder Tubeworms 54.39987 -5.05860 17:07 Cobble/Boulder Tubeworms 54.39969 -5.05841 Mixed soft sediment = Cobble/Boulder 54.39933 -5.05820 Cobble/Boulder 54.39901 -5.05803 Mixed soft sediment < Cobble/Boulder Anemones 54.39867 -5.05793 Mixed soft sediment = Cobble/Boulder Tubeworms
80

54.39830 -5.05775 Soft sediment = mixed soft sediment 54.39798 -5.05768 17:13:04 Soft sediment = mixed soft sediment 54.39763 -5.05759 Mixed soft sediment > Cobble/Boulder 54.39746 -5.05751 Bedrock 54.39719 -5.05738 Mixed soft sediment = Cobble/Boulder 54.39698 -5.05725 Bedrock Anemones 54.39648 -5.05644 17:18 Mixed soft sediment > Cobble/Boulder 54.39625 -5.05619 Mixed soft sediment 54.39597 -5.05602 Mixed soft sediment > Cobble/Boulder Anemones 54.39557 -5.05590 Mixed soft sediment 54.39526 -5.05590 Mixed soft sediment > Cobble/Boulder 54.39486 -5.05593 Mixed soft sediment 54.39451 -5.05589 Mixed soft sediment 54.39425 -5.05573 17:25 Mixed soft sediment 54.39387 -5.05541 Mixed soft sediment 54.39369 -5.05529 17:27 Mixed soft sediment 54.41249 -5.05262 18:32:04 Mixed soft sediment = Cobble/Boulder Anemones 54.41202 -5.05248 Cobble/Boulder Anemones 54.41172 -5.05232 Cobble/Boulder Anemones 54.41142 -5.05200 - 54.41115 -5.05183 - Burrows 54.41088 -5.05165 Soft sediment = mixed soft sediment Tubeworms & burrows 54.41056 -5.05151 Mixed soft sediment > Cobble/Boulder Tubeworms 54.41019 -5.05143 Mixed soft sediment > Cobble/Boulder Anemones 54.40981 -5.05145 18:41 Soft sediment = mixed soft sediment Tubeworms 54.40953 -5.05147 Mixed soft sediment > Cobble/Boulder 54.40918 -5.05138 Mixed soft sediment Tubeworms 54.40890 -5.05129 Soft sediment < mixed soft sediment Sebella and Tubeworms 54.40849 -5.05127 Mixed soft sediment > Cobble/Boulder Sebella and Tubeworms 54.40822 -5.05123 Mixed soft sediment
81

54.40786 -5.05119 18:47:28 Mixed soft sediment > Cobble/Boulder Hydriods and Anemones 54.40761 -5.05115 Mixed soft sediment 54.40738 -5.05112 Soft sediment < mixed soft sediment Sebella and Tubeworms 54.40696 -5.05102 Mixed soft sediment > Cobble/Boulder Anemones 54.40674 -5.05100 Mixed soft sediment 54.40641 -5.05088 Mixed soft sediment 54.40619 -5.05080 Soft sediment < mixed soft sediment Sebella and Tubeworms 54.40595 -5.05067 18:54 Mixed soft sediment > Cobble/Boulder Anemones 54.40564 -5.05055 Mixed soft sediment = Cobble/Boulder Axinella 54.40537 -5.05043 Mixed soft sediment = Cobble/Boulder Anemones and sponges 54.40512 -5.05037 Mixed soft sediment = Cobble/Boulder Squats 54.40483 -5.05025 Mixed soft sediment > Cobble/Boulder 54.40445 -5.05011 18:59 Cobble/Boulder Good turf
82