Embed Size (px)
Citation preview

Summary report
Water use in the UK food and
drink industry
A review of water use in the food and drink industry in 2007 and 2010, by sub-sector and UK nations
Project code: PAD101-202 Research date: June 2012 – February 2013 Date: July 2013

WRAP‟s vision is a world without waste, where resources are used sustainably. We work with businesses, individuals and communities to help them reap the benefits of reducing waste, developing sustainable products and using resources in an efficient way. Find out more at www.wrap.org.uk Document reference: [e.g. WRAP, 2006, Report Name (WRAP Project TYR009-19. Report prepared by…..Banbury, WRAP]
Written by: Katie Bromley-Challenor(1), Mark Kowalski(2), Richard Barnard(3), Stephen Lynn(2)
Affiliation: (1) Hyder Consulting Ltd, (2) WRc plc, (3) Ashact Consulting Ltd
Front cover photography: Water imagery
While we have tried to make sure this report is accurate, we cannot accept responsibility or be held legally responsible for any loss or damage arising out of or in
connection with this information being inaccurate, incomplete or misleading. This material is copyrighted. You can copy it free of charge as long as the material is
accurate and not used in a misleading context. You must identify the source of the material and acknowledge our copyright. You must not use material to endorse or
suggest we have endorsed a commercial product or service. For more details please see our terms and conditions on our website at www.wrap.org.uk

Water use in the UK food and drink industry 1
Contents
1.0 Objectives ..................................................................................................... 2 2.0 Overall results .............................................................................................. 2 3.0 Background .................................................................................................. 5
3.1 Sector size ................................................................................................. 5 3.2 UK water use ............................................................................................. 5 3.3 Water use in UK manufacturing ................................................................... 6
4.0 Food and drink manufacturing ..................................................................... 7 4.1 Manufacturing.......................................................................................... 10
5.0 Wholesale and retail ................................................................................... 11 5.1 Opportunities in Wholesale and Retail ........................................................ 11
6.0 Hospitality and food service ....................................................................... 12 6.1 Opportunities in Hospitality and food service .............................................. 12
7.0 The food and drink industry water reduction target................................... 13 8.0 Recommendations ...................................................................................... 14 9.0 Data sources and methodology .................................................................. 16
9.1 Water data .............................................................................................. 16 9.2 2010 water use data ................................................................................ 16
Glossary of terms ................................................................................................. 18 Data tables ........................................................................................................... 20

Water use in the UK food and drink industry 2
1.0 Objectives
Objectives
establish a baseline for water use in food and drink industry in the UK, by country, by
sector and by key product categories for 2007 and 2010;
understand the potential for the food and drink industry, its sectors and product category
sectors to reduce water use (through identification of benchmark and other data, where
available), to identify best practice and recommend where the focus for future action
should be;
understand the impact that water use reduction activities, including the Federation House
Commitment, may have on delivering the overall Food Industry Sustainability Strategy
(FISS) target, and
inform understanding and strategy for future water efficiency strategy and activity.
FISS target
Food and drink industry water reduction target of 20% by the year 2020, against a 2007
baseline1.
2.0 Overall results In line with the FISS, this study defines the food and drink industry as four sectors2:
manufacturing;
retail;
wholesale; and
hospitality and food service.
The total water use for each sector for 2007 and 2010 is shown in Figure 1. The food and drink manufacturing, and hospitality and food service sectors represent the highest water users in 2010. This represents 53.4%, and between 44.3% and 43.3% total water use in the food and drink industry, respectively.
UK food and drink industry headlines
2007 total water use was estimated to be 412 million m3;
2010 total water use was estimated to be between 347 million m3 and 366 million m3; and
this represents a water reduction of up to 64.4 million m3 (up to 15.6% reduction).
Reductions in water use in manufacturing, retail and wholesale are thought to relate to improvements in water management. However, two-thirds of the reduction in the hospitality and food service sector can be accounted for by changes in activity, through declines in production and employment.
1 Water use excluding that in product. 2 Further definition of each sector is provided by the Standard Industrial Classification (SIC).

Water use in the UK food and drink industry 3
Figure 1: Total water use comparison between 2007 and 2010 (Methodology, Data)
A snapshot of total water use by nation, and food and drink sector can be seen in Figure 2.
Water use in the UK food and drink industry 4
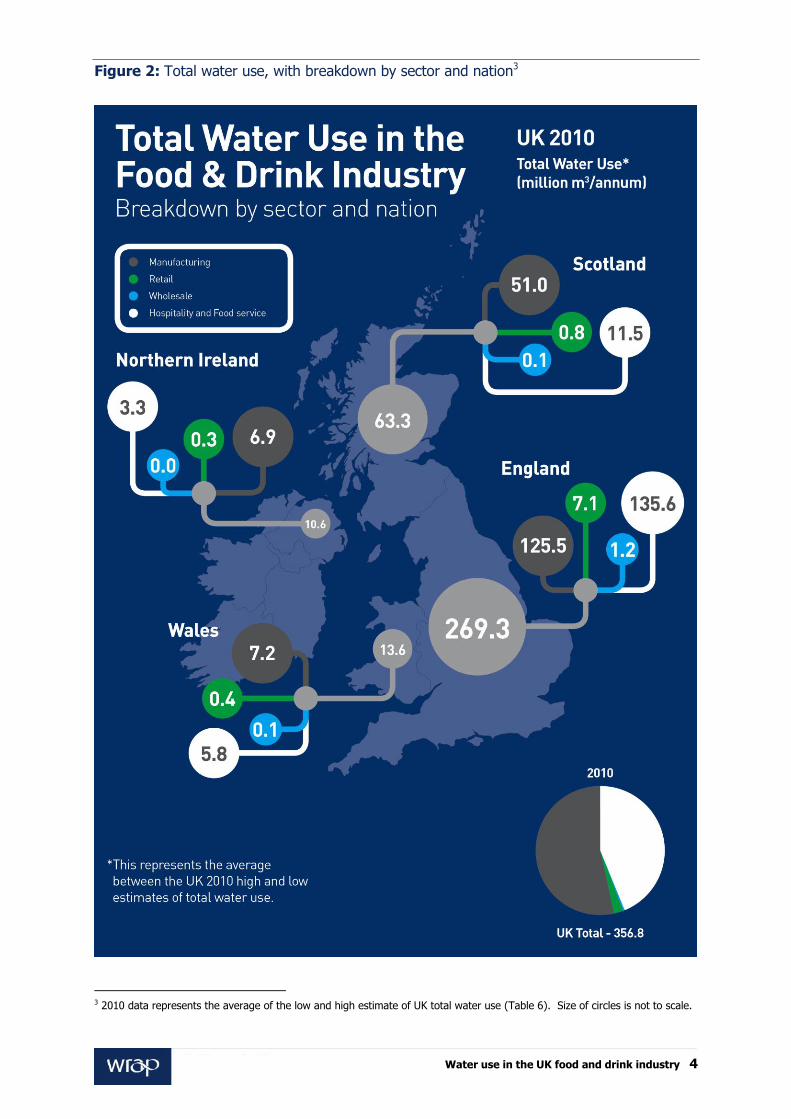
Figure 2: Total water use, with breakdown by sector and nation3
3 2010 data represents the average of the low and high estimate of UK total water use (Table 6). Size of circles is not to scale.
Water use in the UK food and drink industry 5
3.0 Background There are limitations in the original FISS estimate of water use in 2006. Hence WRAP commissioned a study to obtain a better understanding of how much water was used within the UK food and drink industry in 2007 and 2010. Therefore, the analysis uses more robust data where available, shows whether there has been a reduction in water use since 2007, provides more detail on water use progress by the sector, and what contribution has already been made to the industry target to reduce water usage. This summary report provides the headline findings from the study. The full report “Water use in the UK food and drink industry” is available on the WRAP website. 3.1 Sector size The size of each of the food and drink sectors can be expressed as production, the number of meals served and employment and is summarised in Table 1.
Table 1: Changes in the food and drink sectors between 2007 and 2010
Food and drink sector Employment
(thousands)
Change
compared to
2007
Production
(million tonnes)
Number of meals
(billions)
2007 2010 2007 2010 2007 2010
Food and drink
manufacturing 386 402 4% increase 80.2 79.1 N/A N/A
Retail 1,181 1,180 0.1% decrease N/A N/A N/A N/A
Wholesale 191 194 2% increase N/A N/A N/A N/A
Hospitality and food
service 1,920 1,895 1% decrease
N/A N/A 8.7 8.2
N/A = not applicable
Between 2007 and 2010 total employment in the food and drink industry was 3.7 million; hospitality and food service is the largest sector, representing around half the overall employment (52%) in the food and drink industry in 2007 and 2010. Overall there has been little change in employment between 2007 and 2010 (0.2% decrease); the manufacturing sector has shown a 4% increase between 2007 and 2010. 3.2 UK water use
12 billion m3 of water was abstracted from surface and groundwater sources across
England and Wales in 2007 and 2010;
of this, around half (6.0 billion m3) was used for public water supply, with the remainder
primarily used directly by industry, for electricity supply and agriculture4; and
WRAP‟s Freshwater availability and use report in the UK (WRAP, 2011) estimates that
total consumptive use is no more than 15% of the total volume directly abstracted by UK
industry and commerce (i.e. excluding public water supply).
4 http://www.defra.gov.uk/statistics/environment/inland-water/iwfg12-abstrac/
Water use in the UK food and drink industry 6
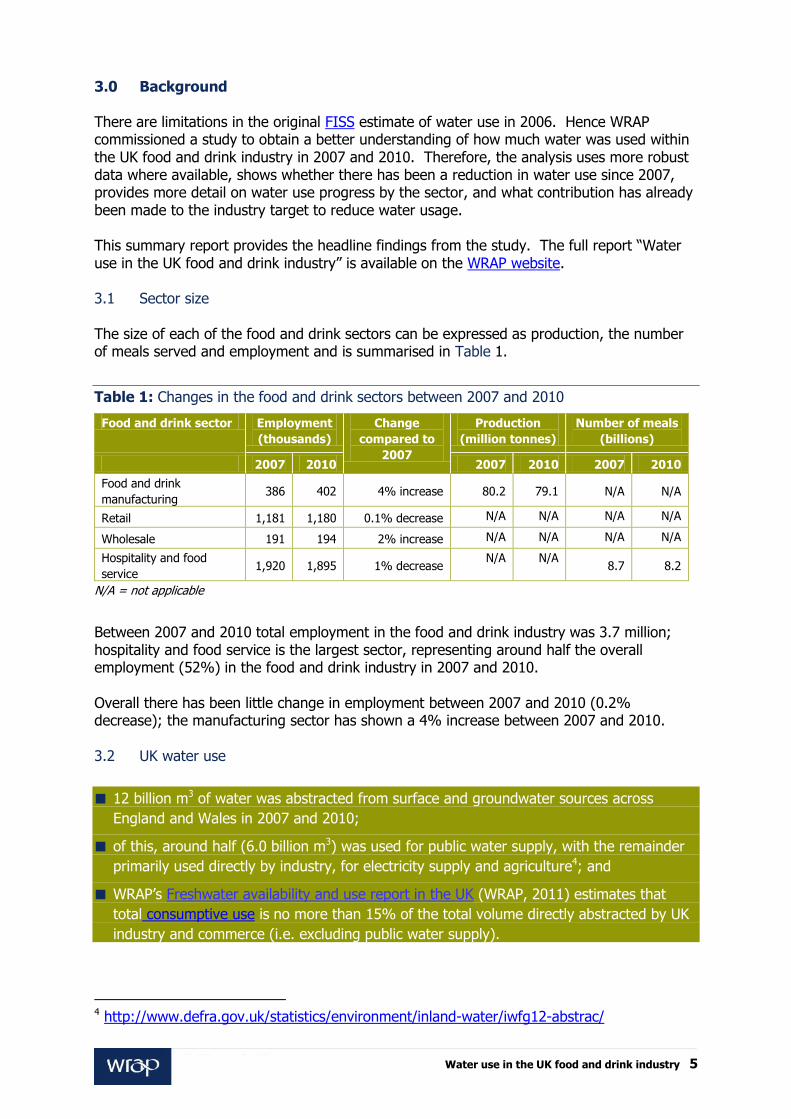
Figure 3: Abstractions from non-tidal surface water and groundwater by use: 2007 and 2010 (England and Wales) (Source: Environment Agency data download)
3.3 Water use in UK manufacturing
Previous studies
water use in manufacturing in England and Wales, in 2006/07, accounted for 10% total
water use (916 million m3); and
food and drink manufacturing contributed an estimated 173 million m3 total water use
(2%); 109 million m3 public supply and 64 million m3 direct abstraction (DEFRA).
Figure 4: Water use by industry in England and Wales, 2006/07 (Source: DEFRA)
6.0 6.0
3.8 4.3
1.2 1.1
1.0 0.9 0.1 0.2
0
2
4
6
8
10
12
14
2007 2010
Wa
ter
use
(b
illi
on
m3)
Other
Other Industry
Fish farming, cressgrowing, amenity ponds
Electricity Supply
Public water supply
0 0.5 1 1.5 2 2.5 3 3.5 4 4.5 5
Other
Hotels and Restaurants
Education, Health and Social Work
Food and Drink Manufacturing
Public and Commercial Services
Other Manufacturing
Leakage
Agriculture, Forestry and Fish
Energy, Waste, Water and Sewerage
Water use (billion m3)
Public water supply Direct abstraction

Water use in the UK food and drink industry 7
4.0 Food and drink manufacturing UK food and drink manufacturing headlines
2007 total water use was estimated to be 231 million m3 water per year. Of this,
16.6 million m3 is used as raw material in the product, with processing water the larger
proportion and being key in water management.
2010 total water use was estimated to be between 185 million m3 and 196 million m3; and
this represents a water reduction of 35 to 46 million m3 (15 to 20% reduction).
Some of this reduction will be attributed to a contraction in production from 71.9 to 71.2
million tonnes between 2007 and 20105. The sub-sectors included in this study represent
90% of UK food and drink production.
Figure 5: Total water use in UK food and drink manufacturing (2007 and 2010)
Figure 6: Water use excluding that in product in UK food and drink manufacturing (2007 and 2010)
Where possible, this study draws from actual datasets and data already published. In other cases this has not been possible, so the methodology relies on modelling of information obtained from a number of sources and assumptions made to fill any gaps.
5 For those sub-sectors included in this study.
114 108 99
117
88 86
0
50
100
150
200
250
2007 2010 highestimate
2010 lowestimate
To
tal w
ate
r u
se
(m
illi
on
m3/ye
ar)
Food Drink
110 104 96
104
76 74
0
50
100
150
200
250
2007 2010 highestimate
2010 lowestimate
Wa
ter
use
ex
clu
din
g t
ha
t in
pro
du
ct
(m
illi
on
m3/ye
ar)
Food Drink

Water use in the UK food and drink industry 8
Table 2: Top five water-using food and drink manufacturing sub-sectors (in order of descending water use), 2007
2007 Water use (million m3)
Total water use Water use excluding that in product
1 Spirits Spirits
2 Meat processing Meat processing
3 Fruit and vegetables Fruit and vegetables
4 Brewing Brewing
5 Soft drinks and beverages Dairy
Table 3: Top five water-using food and drink manufacturing sub-sectors (in order of descending water use), 2010
2010 Average water use (million m3)
Total water use Water use excluding that in product
1 Spirits Spirits
2 Meat processing Meat processing
3 Brewing Fruit and vegetables
4 Fruit and vegetables Brewing
5 Soft drinks and beverages Dairy
Note: Defined as the average of the 2010 high and low estimates.
The top five sub-sectors by water use (Table 3) shows importance of supporting these sectors to manage water use. In particular through water use excluding in product, where there is a greater opportunity for water efficiency practices.

Water use in the UK food and drink industry 9
Figure 7: Manufacture of food, total water use, with breakdown by sub-sector (Data)
Figure 8: Manufacture of drink, total water use, with breakdown by sub-sector (Data)
0
5
10
15
20
25
30
35
40
45T
ota
l w
ate
r u
se
(m
illi
on
m3/ye
ar)
2007 2010 high estimate 2010 low estimate
0
10
20
30
40
50
60
70
80
Spirits Brewing Soft drinks andbeverages
Maltings Cider Wine
To
tal
wa
ter
use
(m
illi
on
m3/ye
ar)
2007 2010 high estimate 2010 low estimate

Water use in the UK food and drink industry 10
4.1 Manufacturing Based on a sample of food and drink manufacturing sites visited6, average water savings of 12% were identified (based on the total site water use for 2011). This highlights that there are still water saving opportunities to be made. With the exception of effluent treatment and recovery of water for reuse, many opportunities relate to relatively simple process or operational changes. From the potential savings identified, the top five frequently encountered opportunities were:
1. Elimination of once-through cooling systems (24.9% of identified savings);
2. Checking water balance and fixing supply leaks (12.2% of identified savings);
3. Automatic shut-off (5.9% of identified savings);
4. Control of overflows (5.5% of identified savings); and
5. Optimising water supply pressure (4.5% of identified savings).
Figure 2: Water saving measures identified (% of total water use savings)
6 Through the Federation House Commitment (FHC).
0.2%
0.7%
0.9%
2.5%
3.2%
3.5%
4.4%
4.5%
4.7%
5.3%
5.5%
5.9%
12.2%
21.6%
24.9%
Washrooms
Restrict flow through taps
Recover RO reject water
Cooling tower loss
Recover and re-use condensate
Pump gland/seal water
Repair process leaks
Optimise pressure
Recover process water
Optimise washing
Control overflows
Automatic shut-off
Balance/ supply leak
Treated effluent - water reuse
Re-use of cooling water
Water use in the UK food and drink industry 11
5.0 Wholesale and retail
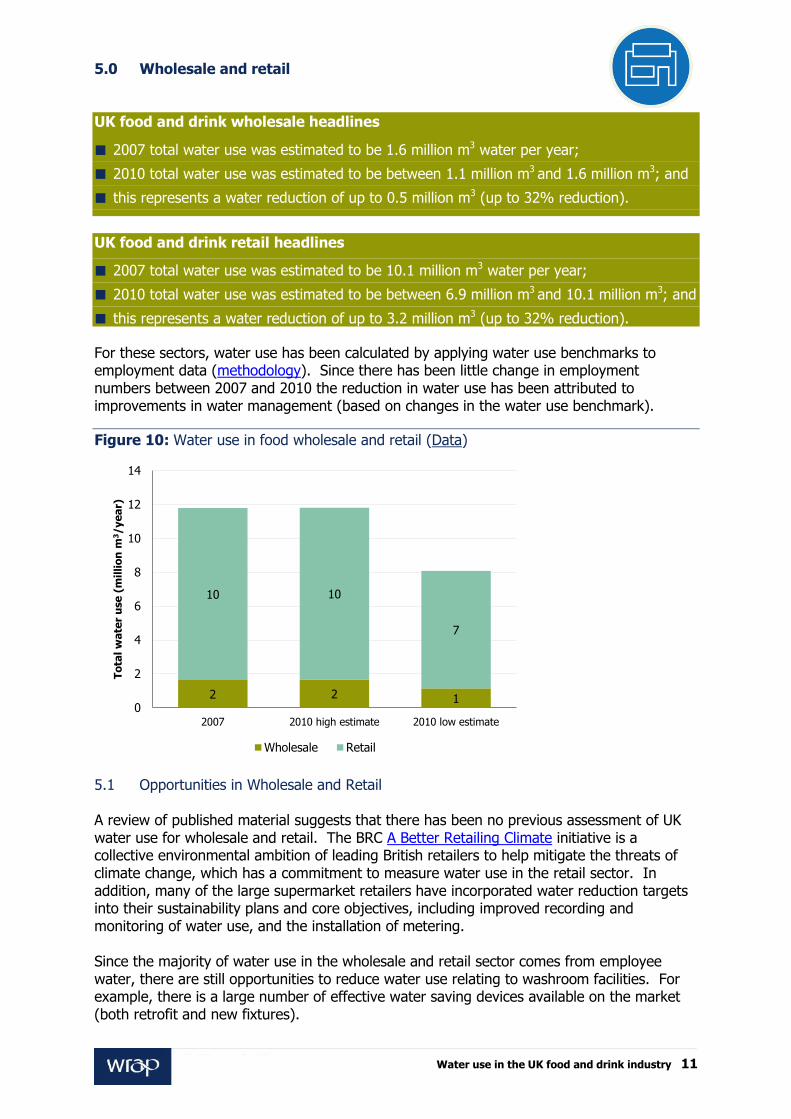
UK food and drink wholesale headlines
2007 total water use was estimated to be 1.6 million m3 water per year;
2010 total water use was estimated to be between 1.1 million m3 and 1.6 million m3; and
this represents a water reduction of up to 0.5 million m3 (up to 32% reduction).
UK food and drink retail headlines
2007 total water use was estimated to be 10.1 million m3 water per year;
2010 total water use was estimated to be between 6.9 million m3 and 10.1 million m3; and
this represents a water reduction of up to 3.2 million m3 (up to 32% reduction).
For these sectors, water use has been calculated by applying water use benchmarks to employment data (methodology). Since there has been little change in employment numbers between 2007 and 2010 the reduction in water use has been attributed to improvements in water management (based on changes in the water use benchmark).
Figure 10: Water use in food wholesale and retail (Data)
5.1 Opportunities in Wholesale and Retail
A review of published material suggests that there has been no previous assessment of UK water use for wholesale and retail. The BRC A Better Retailing Climate initiative is a collective environmental ambition of leading British retailers to help mitigate the threats of climate change, which has a commitment to measure water use in the retail sector. In addition, many of the large supermarket retailers have incorporated water reduction targets into their sustainability plans and core objectives, including improved recording and monitoring of water use, and the installation of metering. Since the majority of water use in the wholesale and retail sector comes from employee water, there are still opportunities to reduce water use relating to washroom facilities. For example, there is a large number of effective water saving devices available on the market (both retrofit and new fixtures).
2 2 1
10 10
7
0
2
4
6
8
10
12
14
2007 2010 high estimate 2010 low estimate
To
tal w
ate
r u
se
(m
illi
on
m3/ye
ar)
Wholesale Retail

Water use in the UK food and drink industry 12
6.0 Hospitality and food service
UK hospitality and food service headlines
2007 total water use was estimated to be 169 million m3 water per year;
2010 total water use was estimated to be between 154 million m3 and 159 million m3; and
this represents a water reduction of up to 15 million m3 (up to 10% reduction).
Water use has been calculated by applying water use benchmarks to employment data and number of meals prepared (methodology). Since there has been a reduction in both employment and the number of meals served between 2007 and 2010, the reduction in water use resulting from these changes has been estimated to be 10.2 million m3. The water reduction attributed to improvements in water management (based on changes in the water use benchmarks) is up to 5.1 million m3.
Figure 11: Water use in hospitality and food service (Data)
6.1 Opportunities in Hospitality and food service A review of published material suggests that there has been no previous assessment of UK water use for the hospitality and food service sector. In addition, there is little information on the collective uptake of water efficiency measures in the sector. Water use in the hospitality and food service sector has been calculated as two components: food and preparation, and employee and customer water use. The opportunities to reduce employee water use are the same as those identified for wholesale and retail. There are also opportunities to reduce water use in food preparation. Catering departments can be areas of high water consumption – particularly those where food is prepared (rather than cooked from chilled). Typically, water uses include: washing and preparing food (particularly potato peelers and salad washing); washing food preparation areas and equipment; cooking; food waste disposal channels; and dishwashers/glasswashers.
18 16 11
151 143
143
0
20
40
60
80
100
120
140
160
180
2007 2010 high estimate 2010 low estimate
To
tal
wa
ter
use
(m
illi
on
m3/ye
ar)
Employee component Meals served component

Water use in the UK food and drink industry 13
7.0 The food and drink industry water reduction target
The FISS target for water reduction in the food and drink industry is 20% by 2020 and is based on water use, excluding that in product. In order to assess whether this target is realistic and indeed achievable, water use excluding that in product was calculated for the food and drink industry as part of this study. The data collated and analysed in this study suggests that the food and drink industry, has reduced its total water use excluding that in product by 13.7% ± 2.4% between 2007 and 2010. Depending on the assumptions made to estimate water use in 2010, the water reduction could be as low as 11.3% or as high as 16.1% (Figure 3). While the reductions in water use in manufacturing, retail and wholesale are thought to relate to improvements in water management, two-thirds of the reduction in the hospitality and food service sector can be accounted for by changes in activity. However, it is important to note that the data depends heavily on benchmarks and other imputed data rather than direct measurement. Confidence in this assertion is dependent on the accuracy of these benchmarks and imputed data7.
Figure 3: Water reduction in the food and drink industry, with required annual reduction from 2010 to 2020 to meet food and drink industry target
Note: Where the solid line represents the data calculated in this study (average reduction) and dashed line represents a forecast required reduction in order to meet the industry target of 20% reduction by 2020. The low, average and high estimates refer to the water reduction trend calculated for 2010 (water excluding that in product). The high 2010 estimate of 350 million m3, represents 11.3% reduction in water (compared to 395 million m3 in 2007), whereas the low 2010 estimate of 332 million m3 represents 16.1% reduction in water compared to 2007.
7 Further detail in the confidence of the data is discussed for each sector, in the relevant sections of the full report.

Water use in the UK food and drink industry 14
8.0 Recommendations The study identified a number of gaps in the information. The key areas of focus are summarised in Table 4. The complete list can be found in the full report, available on the WRAP website.
Table 4: Summary of key data gaps and recommendations for filling the gaps
Item Gaps in data Implications and recommendations for filling the gap
Mains supply data There is no longer a requirement to publish non-domestic water use data by SIC grouping for the WRMP.
Environment Agency to review requirement of water companies to publish information by aggregated SIC code in their WRMP.
Direct abstraction data
Direct abstraction information (actual volumetric data) for Scotland and Northern Ireland.
The impact on this analysis depends on the number of operations in this sector which use a direct abstraction, and what proportion of the total water use that direct abstraction represents.
Separate data improvement programmes are underway in each region, and actual volumetric data is collected in Scotland from 2010/11 and Northern Ireland has been collected since 2007, although data coverage is limited.
Businesses in England and Wales are no longer required to report actual volumes abstracted to the
Environment Agency where the authorised quantity is less than 100 m3/day8.
A risk based decision by the Environment Agency not to collect this information, to help reduce the burden on abstractors.
The impact on this analysis depends on the number of operations in this sector which use a direct abstraction where the authorised quantity is less than 100 m3/day and the overall proportion of abstraction that this makes up.
Food and Drink Manufacturing
Sector (and sub-sector) water use. The majority of water use figures used in this report are extrapolated (applying water use benchmarks to production data).
Data not included in this study for the following sub-sectors.
Lack of water use and benchmark
data:
manufacture of oils and fats,
margarine and similar edible fats;
manufacture of macaroni,
noodles, couscous and similar
farinaceous products; and
manufacture of condiments and
seasonings.
Lack of production data or data disclosure issues:
manufacture of sugar; and
processing of tea and coffee.
Encourage trade associations to collect members‟ data to better assess the environmental impact of their sector.
These sub-sectors have not been included in the study and they account for 10% of total UK production in 2007 and 2010.
The Manufacture of oils and fats, margarine and similar edible fats represent 5% of total UK food
and drink production and therefore could have significant influence on the total UK water use for the manufacturing sector.
Encourage registration to the FHC.
8 Licence holders are still required to keep an on-site record. This is part of a risk-based approach to reduce the burden on
abstractors.

Water use in the UK food and drink industry 15
Item Gaps in data Implications and recommendations for filling the gap
Hospitality and food service
Actual water consumption data Water use data is limited for this sector, so benchmarks were used. Since this sector represents around half the employment in the food and drink industry, it could have significant impact on the total UK water use.
Recommendations include:
1. development of water use benchmarking
data by sub-sector within hospitality and
food service sector;
2. establishment of a water working group for
hospitality and food service to support the
collection of data; and
3. establishment of agreed industry targets on
reducing water use and strategy on
reducing water use, for example, through a
Voluntary Agreement.
Encourage registration to the Rippleffect
programme.
Retail and wholesale
Actual water consumption data These sectors represent 37% of UK employment in the food and drink industry although the influence on the overall water use figure is low (3% total industry water use in 2010).
Encourage registration to the Rippleffect programme.

Water use in the UK food and drink industry 16
9.0 Data sources and methodology 9.1 Water data The study aimed to collate sufficient water use data (public water supply from UK water companies and direct abstraction data from UK environmental regulators) to determine a total UK water use for the food and drink industry. Where actual data was not available, water use benchmarks and other data were used to extrapolate UK water use, and provide a breakdown of water use by sector (and sub-sector), and UK nation.
Data sources
UK water company data (public water supply);
UK environmental regulators (direct abstraction);
sector and sub-sector water use studies;
water use benchmarks; and
other data: employment, production, and number of meals served.
9.2 2010 water use data Where there is no actual 2010 data (i.e. water use benchmarks have been used), water use for 2010 is presented as a range with a „low‟ and „high‟ estimate. In reality, it is anticipated that the actual 2010 water use lies somewhere within the range presented. Further information on the methodology used in this study can be found in the full report “Water use in the UK food and drink industry”, available on the WRAP website. Definition of water use
In the context of this study, water use is defined as water used in:
the preparation of food and drink products; and
employee water use.
Water used in other activities such as accommodation (e.g. hotels and hospitals), irrigation (e.g. sports facilities and landscaping) and customer use (retail and wholesale, sports facilities, guests/delegates at hotels or patient use in hospitals) has been excluded where possible because it does not relate to food and drink activities. It has not been possible to calculate water used in the preparation/processing of food and drink products in the wholesale and retail sectors; however, it is likely that this will be minimal and limited to in-store delicatessens, fishmongers, bakeries, etc. The definition of water use for each sector is summarised in Table 5.

Water use in the UK food and drink industry 17
Table 5: Water use as defined in this study
Food and drink sector Water use definition Comments and exclusions
Manufacturing of food and
drink products
Two water use figures are calculated:
(i) total water use (including employee
water use); and
(ii) water use, excluding that in product
The water use, excluding that in
product, aligns with the food and
drink industry target (and FHC
reporting), so a direct comparison can
be made.
Includes consumptive and non-
consumptive water use.
Wholesale and retail
Water used by the employee
(washrooms)
It has not been possible to determine
any water used in processing,
although this is thought to be
minimal.
Water used by customers is not
included.
Consumptive water use.
Water used by the employee
(washrooms)
Hospitality and food service
The summation of two water use
figures:
(i) water used in food preparation
(based on number of meals and
water use per meal type); and
(ii) water used by the employee (to be
consistent with the other
categories).
Water used in accommodation (e.g.
hotels and hospitals), irrigation (e.g.
sports facilities and landscaping) and
customer use (sports/leisure facilities
and consumers) has been excluded
since this is not relevant to food and
drink activities.
Consumptive water use.
Water use in the UK food and drink industry 18
Glossary of terms
Standard industrial classification (SIC) A recognised classification that provides a framework for the collection, tabulation, presentation and analysis of data, classifying business establishments and other statistical units by the type of economic activity in which they are engaged. The Food Industry Sustainability Strategy (FISS) This was drawn up in 2006 with the aid of stakeholders and sets out how all those involved in the UK food and drink industry beyond the farm gate (manufacturers, wholesalers, retailers and food service providers) can, through widespread adoption of best practice, help achieve sustainable development. FISS estimated that the food and drink industry in England and Wales uses 252 million m3 water per year. Based on these findings, the FISS Water Champions Group recommended a food and drink industry water reduction target of 20% by the year 2020, against a 2007 baseline, which the Strategy considered to be achievable through the implementation of best practice in water use across the industry. 2010 low estimate In general, the „low‟ estimate reflects good practice and the assumption that it is has been adopted throughout the sector means that this figure is likely to be an underestimate. 2010 high estimate The „high‟ 2010 estimate assumes that there has been no improvements in water management since 2007. The assumption that overall the sector has made no improvements since 2007 is not accurate and as such the water use figure represents a higher than expected value. Water use excluding that in product Water use excluding that in product‟ is defined as „total water use‟ minus any water that is brought on to site (mains or direct abstraction) that is used as a raw material in the product. This is not the same as the water content of a product, since the latter excludes losses from any baking process but includes any water in the ingredients that are brought onto site already made up (e.g. syrups, sauces and fillings). Water use (excluding that in product) is only significant in the manufacturing sector. Although there may be some water used in product in retail (in-store bakeries etc.) and in food preparation in the food service sector it was not possible to calculate this figure and as such has been omitted from the study. Consumptive water use Consumptive uses of water are conventionally regarded as those in which water is evaporated, incorporated into products, or consumed by humans, and hence not returned to the immediate environment. WRMP In 2007, each water company in England and Wales was required by the Environment Agency to publish information on water use by aggregated SIC code into Table WRP8 of their Water Resources Management Plan (WRMP) and so information for key components of the food and drink industry was available.

Water use in the UK food and drink industry 19
Food and drink manufacturing sub-sectors Sub-sectors included in this study:
Food sub-sectors Drink sub-sectors
Bakery Soft drinks and beverages
Cereal products Brewing
Confectionery Distilling
Dairy Wine
Animal feed Cider
Fish processing Maltings
Fruit and Vegetables
Meat processing
Milling
Pet food
Pre-prepared foods
There were some manufacturing sub-sectors that were not included in this study because there were no data available. The key product categories not covered by the study include the manufacture of oils, fats, sugar, tea and coffee and account for 10% of total UK production in 2007 and 2010. Meals, defined by food service type:
restaurants;
quick service retail (QSR)9;
pubs;
hotels;
leisure;
staff catering;
health care;
education; and
services.
9 Outlets which may have takeaway or eat-in, or both, and where the customer generally pays when purchasing food or drink.
Includes fast food, cafes, coffee shops, and takeaways.

Water use in the UK food and drink industry 20
Data tables
Table 6: Total water use, with breakdown by sector and nation, 2007, 2010 average, and high and low 2010 estimates
UK 2007 Total water use (million m3/year)
UK England Wales Scotland Northern
Ireland
Food and drink manufacturing 230.9 133.3 9.4 78.3 9.9
Retail 10.1 8.3 0.5 1.0 0.4
Wholesale 1.6 1.4 0.1 0.1 0.1
Hospitality and food service 169.0 145.6 6.7 12.9 3.8
Total food and drink industry 411.7 288.6 16.7 92.2 14.1
UK 2010 Total water use (million m3/year)
Average UK England Wales Scotland Northern
Ireland
Food and drink manufacturing 190.6 125.5 7.2 51.0 6.9
Retail 8.5 7.1 0.4 0.8 0.3
Wholesale 1.4 1.2 0.1 0.1 0.0
Hospitality and food service 156.3 135.6 5.8 11.5 3.3
Total food and drink industry 356.8 269.3 13.6 63.3 10.6
UK 2010 Total water use (million m3/year)
low estimate UK England Wales Scotland Northern
Ireland
Food and drink manufacturing 185.5 121.3 7.0 50.5 6.6
Retail 6.9 5.7 0.4 0.6 0.2
Wholesale 1.1 1.0 0.0 0.1 0.0
Hospitality and food service 153.7 133.5 5.7 11.2 3.3
Total food and drink industry 347.3 261.5 13.1 62.5 10.2
UK 2010 Total water use (million m3/year)
high estimate UK England Wales Scotland Northern
Ireland
Food and drink manufacturing 195.7 129.7 7.5 51.4 7.2
Retail 10.1 8.4 0.5 0.9 0.3
Wholesale 1.7 1.4 0.1 0.1 0.1
Hospitality and food service 158.8 137.7 6.0 11.7 3.4
Total food and drink industry 366.4 277.2 14.0 64.2 11.0
Water use in the UK food and drink industry 21
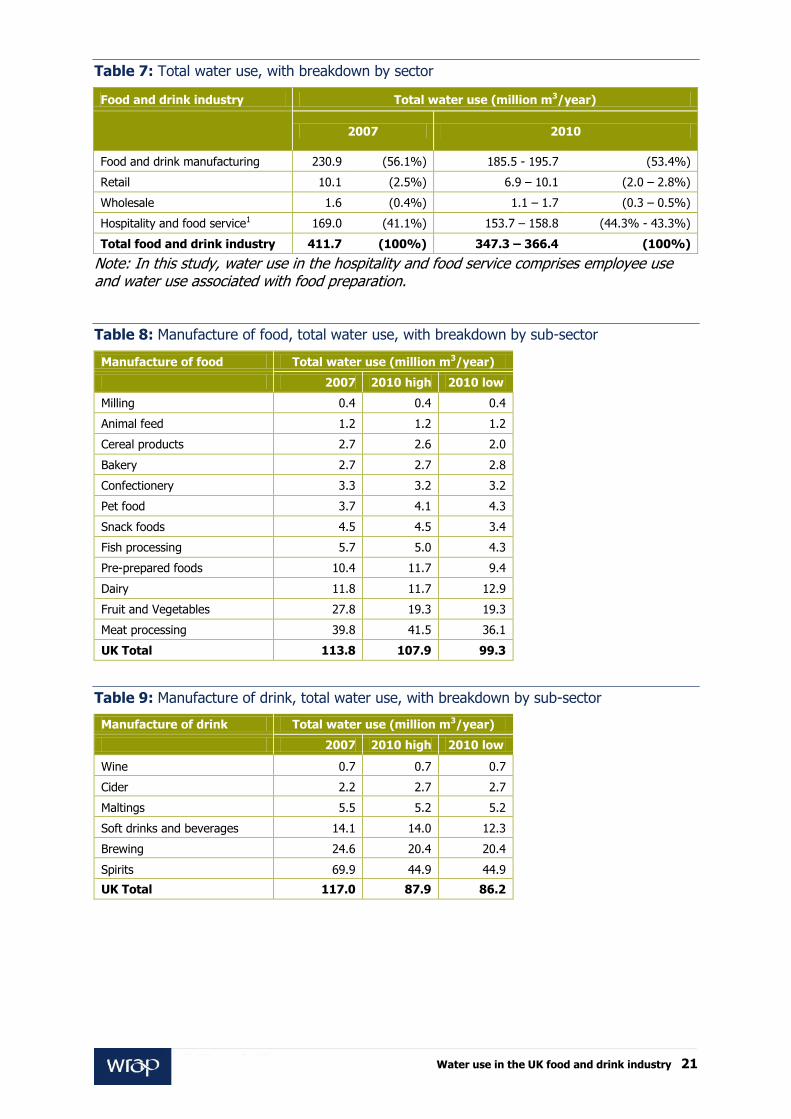
Table 7: Total water use, with breakdown by sector
Food and drink industry Total water use (million m3/year)
2007 2010
Food and drink manufacturing 230.9 (56.1%) 185.5 - 195.7 (53.4%)
Retail 10.1 (2.5%) 6.9 – 10.1 (2.0 – 2.8%)
Wholesale 1.6 (0.4%) 1.1 – 1.7 (0.3 – 0.5%)
Hospitality and food service1 169.0 (41.1%) 153.7 – 158.8 (44.3% - 43.3%)
Total food and drink industry 411.7 (100%) 347.3 – 366.4 (100%)
Note: In this study, water use in the hospitality and food service comprises employee use and water use associated with food preparation.
Table 8: Manufacture of food, total water use, with breakdown by sub-sector
Manufacture of food Total water use (million m3/year)
2007 2010 high 2010 low
Milling 0.4 0.4 0.4
Animal feed 1.2 1.2 1.2
Cereal products 2.7 2.6 2.0
Bakery 2.7 2.7 2.8
Confectionery 3.3 3.2 3.2
Pet food 3.7 4.1 4.3
Snack foods 4.5 4.5 3.4
Fish processing 5.7 5.0 4.3
Pre-prepared foods 10.4 11.7 9.4
Dairy 11.8 11.7 12.9
Fruit and Vegetables 27.8 19.3 19.3
Meat processing 39.8 41.5 36.1
UK Total 113.8 107.9 99.3
Table 9: Manufacture of drink, total water use, with breakdown by sub-sector
Manufacture of drink Total water use (million m3/year)
2007 2010 high 2010 low
Wine 0.7 0.7 0.7
Cider 2.2 2.7 2.7
Maltings 5.5 5.2 5.2
Soft drinks and beverages 14.1 14.0 12.3
Brewing 24.6 20.4 20.4
Spirits 69.9 44.9 44.9
UK Total 117.0 87.9 86.2

Water use in the UK food and drink industry 22
Table 1: Water use in food wholesale and retail
Table 2: Water use in hospitality and food service
Hospitality and food service Water use (million m3/year)
2007 2010 high
estimate
2010 low
estimate
Employee component 17.9 16.3 11.1
Meals served component 151.2 142.5 142.5
Total 169.0 158.8 153.7
Wholesale and Retail
Water use (million m3/year)
2007 2010 high
estimate
2010 low
estimate
Wholesale 1.6 1.7 1.1
Retail 10.1 10.1 6.9
Total 11.8 11.8 8.1

www.wrap.org.uk/water


![UK Food Research Report[1]](https://img.dokumen.tips/doc/110x75/577d26d91a28ab4e1ea25ac4/uk-food-research-report1.jpg)