Embed Size (px)
Citation preview

Summary Report Submitted for HCS Approach Peer Review Process
HCS Study Project Title:
High Carbon Stock Identification in PT Kalimantan Prima Agro Mandiri
Company/Organisation:
PT Kalimantan Prima Agro Mandiri
Contact person: Raymond Alfred
Date: April 18 2018

2 | P a g e
TABLE OF CONTENTS
1. Project description ..................................................................................... 4
1.1 Location and size of study area ............................................................................................... 4
1.2 Overview of proposed plantation development .................................................................... 5
1.3 Description of surrounding landscape .................................................................................... 6
1.4 Map of the site within the region ......................................................................................... 10
1.5 Relevant data sets available.................................................................................................. 11
1.6 List of any reports/assessments used in the HCS assessment .............................................. 11
2. HCS assessment team and timeline .......................................................... 12
2.1 Names and qualifications ...................................................................................................... 12
2.2 Time period for major steps in the study ............................................................................. 12
2.2.2 Assessment Stage (Step 4 – Step 6) .............................................................................. 16
2.2.3 Post- Assessment Stage (Step 7 – Step 8) ..................................................................... 17
3. Community engagement/ FPIC ................................................................. 21
3.1 Summary of community engagement, FPIC, participatory mapping .................................... 21
3.2 Summary of Social Impact Assessment (if any) .................................................................... 28
4. High Conservation Value assessment ....................................................... 35
4.1 Summary and link to public summary report ....................................................................... 35
5. Environmental Impact Assessment .......................................................... 46
5.1 Summary ............................................................................................................................... 46
6. Land cover image analysis ........................................................................ 48
6.1 Area of Interest and how it was defined .............................................................................. 48
6.2 Description of images used for classification ........................................................................ 48
6.3 Sample image ........................................................................................................................ 48
6.4 Method of stratification and software used ......................................................................... 49
6.5 Map of initial vegetation classes, with legend ...................................................................... 49
6.6 Table of total hectares per vegetation class ......................................................................... 50
6.7 Summary of which areas are potential HCS forest, subject to further analysis ................... 51
7. Forest inventory results ........................................................................... 54
7.1 Inventory sample design and plot rational ........................................................................... 54
7.2 Map indicating plots ............................................................................................................. 55
7.3 Forest inventory team members and roles .......................................................................... 56

3 | P a g e
7.4 Methodology used for forest sampling ................................................................................ 57
7.5 Methodology used for carbon calculations .......................................................................... 59
7.6 Indicative photos of each vegetation class ........................................................................... 62
7.7 Statistical analysis (allometric used, confidence tests, justification) .................................... 63
7.8 Summary of statistical analysis of carbon stock results per vegetation class ...................... 64
7.9 Forest inventory results ........................................................................................................ 65
8. Land Cover Classification .......................................................................... 66
8.1 Refined land cover map with title, date, legend and any HCS forest patches identified ..... 66
9. Patch Analysis Result ............................................................................... 67
9.1 Results of Decision Tree ........................................................................................................ 67
9.2 Comments on Decision Tree outcome .................................................................................. 68
10. Indicative Land Use Plan ........................................................................ 69
10.1 Summary of results of final ground verification (if any) ....................................................... 69
10.2 Final HCS map ....................................................................................................................... 69
10.3 Overview of forest conservation management and monitoring activities to be included in
the Conservation and Development (land use) Plan ........................................................................ 70
10.4 List of activities still to be carried out before Conservation and Development Plan can be
finalised ............................................................................................................................................. 70
4 | P a g e
1. Project description
1.1 Location and size of study area
PT. Kalimantan Prima Agro Mandiri (PT. KPAM) is planning to develop an oil palm plantation in the
South of Ketapang District. As part of the commitment made by IOI, which is “No Deforestation” in
their plantation development, therefore, High Carbon Study identification in PT. KPAM’s IUP area is
carried out. HCS identification was conducted in PT. KPAM’s IUP area, covering 11,000 ha of
agricultural licensed land area. The area consists of 2 lands that is separated by Brais River (Map 1).
The study area is surrounded by three villages, which are Desa Sukaramai, Desa Jambi and Desa Danau
Buntar. Desa Sukaramai and Desa Jambi villages are located in Manis Mata District; whereas, Danau
Buntar village is located in Kendawangan District. The location of the proposed plantation is in
Ketapang District, West Kalimantan Province while all three villages are located within the
administrative of Kalimantan Barat Province. The coordinate points of the Area of Interest (AOI) are
110o42’20” – 110o55’05” East Longitude and 2o47’00” – 2o57’20” South Latitude. PT.
PT KPAM is bordered with (i) the development area of the Danau Buntar village, PT UAI palm oil
plantation, the production forest (HP), and the development plan area of Manismata Subdistrict
(KSCT) in the north; (ii) the riparian buffer of Jelai River, the production forest, and the moratorium
peatland area in the south; (iii) the moratorium peatland area and PT BSS in the west; (iv) the riparian
buffer of Jelai River, which is also the border between Kalimantan Barat and Kalimantan Tengah, in
the east.
Map 1. Location of PT KPAM’s agricultural licensed area in Ketapang districts, Kalimantan Barat
Province
5 | P a g e
1.2 Overview of proposed plantation development
PT. KPAM has received the location permit with a total area of 11,000 hectares through the letter,
with reference no = Ref No: 1507/DPMPTSP-D/2017, from the Regent Ketapang. PT. KPAM has
obtained the permit for the area since August 2007, which was issued by Regent Ketapang (SK No.
365/2007, 20,000ha). A certified letter by Regent Ketapang, with reference no = No: 100/1193/PEM,
was issued on June 26, 2015.
Based on the regional planning map (RTRW) and approval letter (SK No.936/Menhut-II/2013 and SK
No.733/Menhut-II/2014) received from the Ministry of Forestry, the concession area of PT. KPAM is
allocated for non-forestry cultivation areas. The Forest and Waters Area Designation Map (PPKH,
2014) and Indicative Map of New Permit extended by Ministry of Living Environment and Forestry
(MoEF, 2016) are the latest updated map showing the location of forest and water resources.
Indicative Map of New Permit Postponement (PIPPIB) revision 11 designated on November 21st, 2016
has shown that the IUPs PT KPAM area is outside of the Primary Forest area, Conservation Forest or
Protected Forest and it is also no peatland area into the project site.
In addition, the company also obtained Plantation Business Permit (Ijin Usaha Perkebunan) on Nov 27,
2015 from Regent Ketapang (SK.772/DISBUN-D/2015, for 11,000 ha and mill capacity 45-ton
FFB/Hour). In 2017, PT KPAM granted with the Extension of Plantation Business Permit No.
1507/DPMPTSP-D/2017 for 11,000 Hectares. PT. KPAM also conducted an Environment Impact
Assessment (AMDAL) which received the approval of ANDAL Framework by West Kalimantan
Governor via letter No 12/2015. An environment feasibility permit no. 715/KLH-B/2015, was issued
on October 28, 2015 by the Regent of Ketapang.
PT. KPAM has conducted socialisation and consultation with the surrounding communities (Village
Head, BPD, Adat people, communities and other community representatives) to disseminate PT
KPAM’s plan to conduct several assessments (soil, land use and High Conservation Value (HCV)
assessment) in order to produce the Integrated Conservation and Land Use Plan.
After the socialization, PT KPAM has acquired support letter from the respective hed of village,
through their letters as follow (i) Surat Dukungan Kepala Desa Danau Buntar Nomor 140/386/PEM
tanggal 10 Maret 2015, (ii) Surat Dukungan Kepala Desa Jambi Nomor 140/021/III/2015/PEM tanggal
10 Maret 2015. Based on the consultation and participatory mapping conducted by with the affected
communities, land utilisation pattern as claimed by three communities in PT KPAM’s IUP is shown in
the following Map 2.

6 | P a g e
Map 2: Land utilisation pattern by three communities in PT KPAM’s IUP area.
1.3 Description of surrounding landscape
The previous land utilization in and around PT KPAM’s IUP area, includes (1) oil palm plantation, (2)
community plantation (smallholder), (3) Development area for Manismata District, (4) Peatland
moratorium, (5) Buffer zone for Jelai River, (6) Buffer zone for Belida Lake, (7) Buffer zone for wood
production forest, and (8) Buffer zone for HP agroforest (Refer to Map 3).
The nearest protected areas from PT KPAM, include the buffer zone of both Jelai River and Belida Lake.
This is the requirement, stated in PP 26/2008 (Government Regulation number 26) in year 2008, to
support the spatial management plan. There is a peat forest protected area located 2-3 km to the west
of PT KPAM’s IUP area. Based on the “Indikatif Penundaan Pemberian Izin Baru Pemanfaatan Hutan,
Penggunaan Kawasan hutan, and Perubahan Peruntukan Kawasan Hutan dan Areal Penggunaan Lain
(Revisi X)”, the proposed oil palm plantation (PT KPAM’s IUP area) is not classified as a moratorium
area (Refer to Map 4).

7 | P a g e
Map 3. Status of land use and utilisation in and around PT KPAM
Map 4. The study area relative location to primary forest and peatland moratorium areas

8 | P a g e
PT. KPAM area is located outside the biodiversity concentration region (Prihatna, 2009) and not
classified as Important Bird Area1. The area also not located intact to the forest landscape2, and
indirectly defined as not part of Heart of Borneo3 region and Ramsar4 conservation site. The nearest
conservation regions are Lamandau River Wildlife Reserve (located ± 17 km to the East) and
Kendawangan Estuary Nature Reserve (Located ± 44 km to the West). (refer to Map 5).
Map 5. Location of PT KPAM’s IUP areas at a landscape level, showing distance from the nearest conservation areas.
Land cover in this region is inseparable from the histories of land usage and community’s interaction
with land. Wood utilization activities both commercially and non-commercially have occurred from
1970 to end of 1990s (quoted in HCV Assessment at PT Kalimantan Prima Agro Mandiri, Kabupaten
Ketapang, Kalimantan Barat, Aksenta, 2015). Those activities have contributed to the reduction of
forest area size and forest cover quality. Additionally, the reduction has also been caused by large
scale forest and land fires occurred in 1997/1998.
Land fires generally occurred every year. Map 6 shows the location of hotspot distribution from year
2005 to year 2015 (Refer to Map 6). Most of the fires occurred were due to hunting activities. Fire is
normally used to surround game animals, such as deer and mouse deer, or purposely done to enhance
the growth of secondary vegetation such as grass as bait for game animals. Fire is also used as part of
the techniques to clear the land for cultivation activities, by the community. However, most of the
1 See Bird Areas factsheet: Kalimantan, http://www.birdlife.org
2 See http://www. intactforests.org/
3 See http://www.heartofborneo.org; http://wwf.panda.org/borneo_forests
4 See http://www.ramsar.org/news/seventh-ramsar-site-in-indonesia

9 | P a g e
land in PT KPAM is categorised as swamp areas, and only minimal areas that is suitable for community
cultivation activities.
Map 6. Hotspot distribution from 2005 to 2015 in the study are and its surroundings
Community that is living in and around PT KPAM’s IUP area especially in these three villages, mostly a
Dayak and local Malay people. A few communities recorded from other small ethnicities. Dayak ethnic
people are usually Christian or Roman Catholic, while Malay ethnic people are generally Muslim.
Therefore, the community don’t have any strong customary attachment to the land. The community
livelihood in this area is varied. Some of them working as fishermen, fruits/vegetables farmers,
carpenters, construction workers, workers at PT Harapan Sawit Lestari and PT Usaha Agro Indonesia,
and service providers of informal sector (Refer to Table 1).
(X
(X
(X(X
(X
(X(X (X
(X(X(X
(X(X
(X
(X (X
(X
(X(X
(X
(X(X
(X
(X
(X (X
(X (X
(X (X
(X
(X
(X
(X
(X
(X
(X
(X
(X
(X
(X
(X(X
(X (X
(X
(X
(X
(X
(X
(X
(X(X (X
(X
(X
(X
(X(X
(X
(X(X
(X
(X(X
(X
(X
(X
(X
(X
(X(X
(X
(X(X
(X (X(X
(X
(X(X
(X
(X(X (X(X
(X (X
(X(X
(X
(X (X
(X(X
(X
(X (X
(X (X
(X
(X(X
(X(X
(X (X(X
(X
(X
(X
(X(X
(X (X
(X
(X
(X
(X
(X
(X
(X
(X
(X(X
(X
(X
(X
(X
(X
(X
(X
(X
(X
(X
(X
(X
(X
(X(X
(X
(X(X(X(X
(X(X
(X(X (X
(X
(X(X
(X
(X(X
(X (X
(X
(X
(X (X
(X (X
(X (X
(X(X (X
(X (X (X
(X (X(X (X
(X (X
(X
(X
(X (X
(X (X
(X
(X(X(X
(X
(X
(X
(X
(X
(X(X
(X(X (X
(X
(X
(X
(X
(X(X (X
(X
(X(X(X(X(X(X(X(X
(X(X
(X
(X
(X
(X (X
(X (X
(X (X(X
(X
(X(X
(X (X
(X
(X
(X
(X
(X
(X (X
(X
(X
(X
(X
(X
(X(X
(X
(X
(X
(X (X
(X (X
(X
(X
(X
(X
(X
(X
(X
(X
(X
(X(X
(X (X
(X
(X
(X
(X
(X
(X(X
(X
(X
(X
(X
(X
(X(X (X
(X
(X
(X (X
(X
(X
(X
(X (X (X
(X
(X
(X
(X
(X
(X
(X (X
(X
(X
(X
(X
(X
(X
(X(X (X
(X
(X
(X
(X
(X
(X(X
(X
(X
(X
(X(X
(X
(X
(X(X (X
(X
(X
(X
(X
(X
(X
(X(X
(X
(X
(X
(X
(X(X(X (X(X
(X
(X (X
(X
(X(X
(X
(X
(X (X(X
(X (X
(X
(X
(X(X(X (X
(X
(X
(X
(X
(X
(X(X
(X
(X (X (X (X
(X (X
(X(X(X
(X
(X
(X
(X
(X (X
(X (X(X(X
(X (X
(X (X
(X (X
(X
(X (X
(X(X
(X (X(X
(X (X
(X (X(X
(X
(X
(X
(X (X
(X (X
(X (X
(X(X (X
(X (X
(X (X (X
(X
(X (X (X
(X (X (X
(X (X (X(X (X
(X (X
(X (X (X
(X
(X (X
(X
(X (X
(X (X
(X
(X (X
(X
(X (X(X (X
(X (X (X (X(X
(X
(X(X
(X (X (X (X(X (X
(X
(X (X (X (X(X (X
(X (X (X
(X
(X(X(X
(X
(X
(X(X
(X
(X(X
(X
(X(X
(X
(X
(X
(X(X
(X
(X(X (X
(X
(X(X
(X (X
(X
(X(X
(X
(X
(X
(X
(X
(X
(X (X
(X (X
(X
(X
(X
(X
(X(X (X
(X
(X
(X
(X
(X
(X
(X (X
(X
(X (X(X
(X (X
(X
(X(X
(X
(X(X (X(X
(X
(X (X
(X (X
(X
(X
(X
(X (X
(X (X
(X
(X (X
(X
(X
(X
(X(X
(X
(X (X
(X
(X
(X (X(X(X
(X
(X
(X (X
(X(X (X
(X
(X
(X
(X(X
(X
(X
(X(X
(X(X
(X (X
(X
(X
(X
(X
(X(X
(X
(X(X
(X
(X
(X (X
(X(X
(X
(X
(X
(X(X
(X(X
(X
(X
(X (X(X
(X
(X
(X
(X
(X(X
(X (X
(X
(X(X
(X(X(X
(X(X
(X(X
(X(X
(X
(X
(X
(X
(X(X
(X
(X(X
(X(X(X(X
(X
(X
(X(X(X
(X
(X
(X
(X(X
(X
(X
(X(X
(X
(X
(X
(X(X
(X
(X
(X
(X
(X (X(X(X
(X
(X
(X(X
(X
(X(X
(X(X
(X (X
(X
(X
(X
(X
(X (X(X
(X
(X
(X(X
(X(X
(X(X
(X
(X(X
(X(X
(X
(X
(X
(X
(X(X
(X
(X
(X
(X
(X(X
(X(X
(X(X (X
(X(X
(X(X(X(X
(X(X
(X
(X
(X
(X
(X
(X
(X
(X
(X (X(X
(X(X (X(X
(X
(X
(X
(X
(X(X
(X
(X (X
(X(X
(X
(X
(X(X
(X
(X
(X(X(X(X
(X
(X
(X
(X
(X
(X
(X (X
(X
(X
(X
(X
(X
(X
(X
(X
(X
(X(X
(X
(X
(X
(X
(X
(X
(X
(X(X (X
(X (X(X
(X(X
(X(X
(X(X
(X(X(X
(X
(X
(X(X
(X(X
(X
(X(X
(X(X
(X(X(X(X(X
(X
(X
(X(X
(X(X
(X
(X
(X(X
(X(X
(X
(X
(X(X
(X(X
(X
(X
(X
(X(X
(X
(X
(X
(X(X(X
(X(X
(X
(X(X(X
(X
(X(X(X
(X
(X
(X(X
(X
(X(X
(X
(X
(X
(X
(X
(X
(X
(X(X
(X
(X(X
(X
(X
(X(X
(X
(X(X
(X
(X
(X(X
(X
(X
(X(X(X(X
(X (X(X (X
(X(X
(X
(X
(X
(X
(X
(X
(X
(X
(X
(X
(X
(X (X
(X (X
(X
(X
(X
(X
(X(X
(X
(X(X(X
(X
(X
(X
(X
(X (X
(X
(X
(X(X(X(X
(X(X
(X
(X
(X
(X
(X
(X
(X
(X(X
(X(X
(X
(X
(X(X
(X
(X
(X
(X
(X
(X
(X(X
(X(X (X
(X(X
(X
(X(X
(X
(X
(X
(X (X(X
(X (X(X(X
(X(X
(X
(X (X
(X
(X
(X
(X
(X (X
(X
(X
(X
(X
(X
(X
(X
(X
(X(X
(X
(X
(X
(X(X
(X
(X
(X
(X
(X
(X
(X(X
(X
(X
(X
(X
(X(X
(X
(X
(X
(X(X
(X
(X
(X
(X
(X
(X(X
(X
(X
(X(X
(X
(X
(X(X
(X
(X
(X
(X
(X
(X
(X
(X
(X
(X
(X
(X(X
(X
(X
(X
(X
(X
(X
(X
(X (X(X
(X(X
(X
(X
(X(X
(X
(X (X
(X
(X
(X
(X(X(X (X
(X(X
(X
(X(X(X
(X
(X
(X
(X
(X(X
(X
(X(X(X(X
(X(X
(X
(X
(X
(X(X
(X(X
(X(X(X
(X(X(X(X
(X
(X
(X(X(X
(X(X(X
(X
(X
(X
(X(X
(X
(X
(X
(X(X
(X(X
(X
(X
(X
(X
(X
(X
(X(X
(X
(X
(X
(X
(X
(X
(X
(X
(X
(X
(X
(X
(X
(X(X(X
(X
(X(X
(X
(X(X
(X(X
(X
(X
(X
(X (X
(X
(X(X
(X(X
(X
(X
(X(X
(X
(X
(X
(X
(X
(X
(X
(X
(X (X
(X
(X(X
(X
(X
(X(X
(X
(X
(X(X(X (X(X
(X
(X
(X (X
(X(X
(X
(X
(X
(X
(X(X(X
(X
(X
(X
(X(X(X(X
(X
(X
(X
(X
(X(X
(X
(X
(X
(X
(X
(X(X (X
(X (X(X
(X
(X
(X
(X
(X
(X
(X
(X
(X
(X
(X
(X(X
(X
(X
(X (X
(X
(X(X(X
(X(X
(X(X(X(X
(X(X
(X(X
(X
(X(X
(X
(X(X
(X(X
(X
(X(X
(X
(X
(X
(X(X(X
(X(X(X
(X
(X
(X
(X
(X
(X
(X(X
(X(X
(X(X
(X
(X(X
(X
(X
(X
(X
(X
(X(X
(X (X(X
(X
(X(X
(X
(X
(X
(X
(X
(X(X
(X(X
(X
(X
(X
(X
(X
(X(X
(X
(X
(X
(X(X
(X(X(X(X
(X(X
(X
(X(X(X(X
(X(X
(X(X(X
(X
(X(X
(X
(X
(X(X
(X(X
(X
(X(X (X
(X
(X(X
(X(X(X(X
(X(X
(X
(X (X(X
(X(X
(X(X
(X
(X
(X
(X
(X
(X
(X (X(X(X(X (X
(X(X
(X
(X
(X
(X
(X
(X
(X
(X
(X
(X(X
(X
(X
(X
(X
(X
(X
(X (X(X(X (X
(X(X
(X
(X(X
(X(X
(X(X
(X(X
(X
(X
(X
(X(X
(X
(X
(X(X
(X(X
(X
(X(X
(X(X
(X
(X
(X
(X(X
(X
(X(X
(X
(X
(X
(X(X
(X
(X
(X
(X
(X
(X
(X
(X
(X (X(X (X (X(X
(X
(X
(X
(X
(X
(X
(X
(X
(X
(X
(X
(X
(X
(X
(X(X
(X
(X(X
(X
(X(X
(X
(X
(X
(X
(X (X(X
(X
(X (X
(X
(X
(X
(X
(X(X
(X
(X
(X(X
(X (X(X
(X
(X(X
(X
(X
(X(X(X
(X(X
(X(X
(X
(X
(X
(X
(X
(X(X
(X
(X
(X(X
(X
(X
(X
(X
(X
(X
(X
(X
(X
(X
(X
(X
(X
(X
(X(X(X
(X
(X
(X
(X(X(X(X(X
(X(X(X
(X
(X
(X
(X
(X
(X
(X (X
(X
(X
(X
(X(X(X
(X
(X
(X(X
(X(X
(X
(X
(X
(X (X(X (X
(X (X
(X
(X
(X
(X(X
(X(X
(X
(X
(X
(X (X
(X
(X
(X
(X
(X
(X
(X(X
(X
(X
(X
(X(X
(X
(X(X
(X(X
(X(X
(X(X
(X
(X
(X(X
(X(X(X
(X
(X(X
(X
(X
(X
(X
(X
(X
(X
(X(X
(X
(X(X
(X
(X
(X(X
(X
(X
(X
(X
(X
(X
(X
(X
(X
(X
(X
(X
(X
(X(X(X(X
(X
(X(X(X(X(X
(X(X
(X(X
(X
(X
(X
(X
(X
(X
(X (X (X(X(X
(X
(X(X
(X
(X
(X(X
(X
(X
(X
(X(X
(X
(X(X(X
(X (X
(X
(X
(X(X(X
(X
(X
(X
(X
(X(X
(X
(X
(X
(X
(X(X
(X (X(X
(X
(X(X
(X(X
(X
(X(X
(X(X(X
(X(X(X
(X(X(X(X
(X(X(X(X(X(X
(X
(X(X(X
(X
(X
(X(X(X(X(X
(X(X
(X
(X(X
(X(X
(X
(X(X
(X
(X(X
(X
(X
(X
(X(X
(X(X
(X
(X(X
(X
(X
(X(X
(X
(X
(X
(X
(X (X(X(X
(X(X
(X
(X
(X
(X
(X(X
(X
(X
(X
(X
(X
(X
(X
(X
(X
(X
(X
(X(X
(X(X
(X
(X
(X
(X(X
(X
(X
(X
(X(X
(X (X(X (X
(X
(X
(X
(X
(X(X
(X
(X(X
(X
(X(X
(X
(X
(X(X(X
(X
(X(X(X
(X
(X
(X
(X(X(X(X(X
(X
(X(X
(X(X(X
(X
(X(X(X
(X
(X
(X(X
(X(X
(X
(X(X
(X(X
(X
(X
(X(X(X
(X
(X
(X
(X(X
(X(X(X
(X(X
(X
(X
(X
(X
(X(X
(X
(X
(X
(X
(X(X
(X(X
(X
(X
(X
(X (X
(X(X
(X(X
(X
(X(X
(X
(X(X
(X
(X
(X
(X
(X(X (X(X(X
(X
(X
(X
(X(X(X (X(X
(X
(X
(X
(X
(X
(X
(X(X
(X
(X (X
(X(X
(X
(X(X
(X
(X
(X(X(X
(X(X(X
(X(X
(X(X(X
(X(X
(X(X
(X
(X
(X(X(X(X
(X
(X
(X(X
(X
(X
(X
(X
(X
(X
(X (X(X
(X(X (X
(X
(X
(X
(X(X(X
(X
(X(X
(X
(X
(X
(X
(X
(X
(X(X(X(X(X(X(X(X
(X
(X(X
(X(X
(X(X(X
(X
(X(X(X
(X (X(X (X
(X
(X
(X(X
(X
(X
(X
(X(X(X
(X
(X(X(X(X(X
(X(X
(X
(X(X(X
(X
(X
(X
(X(X
(X
(X(X
(X(X
(X
(X
(X
(X (X(X (X (X (X(X
(X(X (X(X(X(X(X
(X(X(X(X
(X
(X
(X(X
(X(X
(X
(X(X
(X(X(X
(X
(X(X(X
(X
(X
(X(X(X
(X
(X
(X(X
(X(X
(X(X
(X
(X(X
(X(X
(X
(X(X
(X
(X(X
(X
(X
(X (X
(X(X (X
(X (X (X
(X(X(X
(X(X(X
(X
(X(X
(X
(X
(X(X(X(X(X
(X(X
(X (X
(X(X(X(X
(X
(X
(X
(X
(X(X(X
(X (X(X(X
(X
(X
(X(X
(X
(X (X (X(X
(X(X(X(X
(X
(X(X(X
(X
(X(X
(X(X
(X
(X
(X
(X(X
(X(X
(X(X
(X
(X(X
(X
(X
(X
(X (X (X(X (X (X
(X(X
(X
(X(X
(X
(X(X
(X
(X(X
(X
(X(X(X
(X
(X
(X
(X
(X
(X
(X(X
(X
(X
(X
(X
(X
(X(X
(X(X
(X
(X(X
(X(X
(X
(X(X
(X(X(X
(X
(X
(X
(X(X (X
(X
(X(X
(X
(X
(X
(X(X
(X
(X
(X(X
(X(X(X
(X
(X
(X
(X
(X
(X
(X(X(X
(X
(X
(X(X
(X(X
(X
(X(X
(X(X
(X(X(X
(X
(X(X(X
(X(X(X
(X(X
(X
(X(X
(X
(X(X(X
(X(X
(X
(X
(X
(X
(X(X(X
(X(X
(X(X
(X(X
(X
(X
(X(X(X
(X(X(X(X
(X
(X(X
(X(X
(X(X
(X(X(X
(X(X
(X(X(X
(X(X(X
(X
(X(X(X(X
(X(X
(X(X(X
(X(X
(X
(X(X
(X(X
(X
(X (X (X
(X (X
(X (X(X
(X (X
(X(X
(X (X(X
(X
(X (X(X
(X
(X(X
(X (X(X(X(X
(X(X(X(X
(X(X
(X(X
(X(X
(X(X
(X(X(X
(X(X
(X(X(X(X
(X(X(X(X
(X
(X(X
(X
(X
(X
(X(X
(X
(X(X(X
(X(X
(X(X
(X(X(X(X (X
(X
(X
(X(X
(X
(X
(X
(X
(X
(X
(X
(X (X
(X
(X
(X
(X
(X(X (X(X (X(X (X (X
(X
(X
(X
(X
(X
(X(X
(X(X
(X(X
(X(X
(X(X
(X(X
(X
(X(X(X(X
(X
(X
(X(X(X
(X(X
(X(X(X(X
(X
(X(X(X(X(X(X(X
(X(X(X(X(X(X(X(X(X
(X
(X(X
(X(X
(X(X
(X
(X(X
(X(X
(X(X(X
(X(X
(X
(X(X(X
(X(X(X
(X
(X(X
(X
(X(X(X
(X(X(X(X(X(X(X(X(X
(X(X(X(X(X(X(X(X(X(X
(X
(X
(X
(X
(X(X
(X(X
(X(X
(X
(X(X(X
(X(X
(X(X
(X
(X
(X(X
(X (X(X (X
(X
(X(X
(X
(X (X
(X (X (X
(X(X
(X(X
(X
(X(X(X (X
(X
(X
(X
(X
(X(X
(X
(X
(X
(X(X(X
(X
(X(X
(X
(X
(X
(X
(X
(X(X(X
(X
(X
(X
(X
(X(X
(X
(X
(X
(X
(X (X
(X
(X(X(X
(X(X
(X
(X
(X
(X
(X(X
(X
(X(X
(X
(X
(X
(X
480000
480000
485000
485000
490000
490000
495000
495000
500000
500000
505000
505000
510000
510000
515000
515000
520000
520000
9680000
9680000
9685000
9685000
9690000
9690000
9695000
9695000
9700000
9700000
9705000
9705000
9710000
9710000
Peta sebaran hotspot di PT KPAM dan sekitarnya
Januari 2005 - Februari 2015N
EW
S
200 0 0 2000 400 0 Meters
su mb er :
http s://e arth data.n asa.g ov/e arth -observa tion-da ta/nea r-re al-time/ firms/a ctive -fire -data
Theme6.shp
Sungai
Hotspot (tahun) :
(X 2005
(X 2006
(X 2007
(X 2008
(X 2009
(X 2010
(X 2011
(X 2012
(X 2013
(X 2014
(X 2015
Badan air

10 | P a g e
Table 1. Demography of villages surrounding PT Kalimantan Prima Agro Mandiri
Village Size
(km2)
Population Origin, Ethnic, Religion Livelihood of majority
Sukaramai 200.0 364 households
1.218 people
Original settlers are
Malay and Dayak
ethinicities. Majority of
the settlers are Malay.
Religion being practiced
are Islam and
Christianity.
Worker at oil palm plantation
Entepreneur: fishermen,
rubber farmers, producing
fish chips.
Partnership: farmers
cooperating with PT HSL, PT
MSL, and PT UAI.
Jambi 175.4 210 households
720 people
Danau Buntar 180.2 401 households
1,159 people
Source: Ketapang Regency in numbers 2014, Social Impact Assessment (Aksenta, 2015).
1.4 Map of the site within the region
Below is the map of landscape situation and nearest conservation area to the study area.
Map 7. Map of landscape situation and nearest conservation area to the study area

11 | P a g e
1.5 Relevant data sets available
▪ Satellite imagery (Landsat 8, path/row 120/62, acquisition dates are December 23, 2015 and
March 12, 2016)
▪ Carbon stock
▪ Indication of fires (January 2005-February 2015 hotspots)
▪ HCV area
▪ Peat area
▪ Community’s socio-economic information
▪ Community consent (FPIC Verification)
1.6 List of any reports/assessments used in the HCS assessment
▪ Report of Carbon Stock Assessment
▪ Report of Monitoring and Carbon Stock Evaluation
▪ Report of HCV Area Identification
▪ Report of HCV Area Verification and Delineation Result
▪ Report of Peat Land Survey and Mapping
▪ Report of Peatland Border Verification Result and Mapping
▪ Report of Land Use Change Analysis (LUCA)
▪ Report of Social Impact Assessment (SIA)
▪ Report of FPIC Verification

12 | P a g e
2. HCS assessment team and timeline
2.1 Names and qualifications
The following Table 2 shows the relevant expertise that was involved in the HCV identification.
Table 2: Relevant expertise and role in the HCS Identification
No Name Relevant expertise and role in the team
1. Bias Berlio Pradyatma
(Registered HCS practitioners)
Forestry, biodiversity conservation, GIS, remote sensing, carbon
stock estimation, GHG estimation, HCS Approach Practice. Team
Leader.
2. Miranty Magetsari Social impact assessment, HCV assessment (HCV 5-6), FPIC.
Coordinator in Field Survey.
3. Fersely Getsemani Feliggi GIS, remote sensing, spatial analysis, HCV assessment (HCV 4), land
use change analysis. Team member.
4. Sujatnika Forest and social management, social impact assessment, social
management, HCV Assessment, FPIC. Project Supervisor.
2.2 Time period for major steps in the study
The HCS assessment was carried out using the HCS Approach Toolkit (Version March 2015) as a
guideline, in order to ensure the HCV and FPIC components is integrated. The overall process is
described in Figure 1 and Figure 2 (based on HCSA Toolkit, Module 3). Before the HCS assessment can
be initiated, due diligence activities were carried out.
The following schedule describes the process of High Carbon Stock Assessment that is carried out in
PT KPAM, and also the integration of High Conservation Value (HCV) assessments as well as the Free,
Prior and Informed Consent (FPIC) of local communities.
Table 3: Process and Timeline of HCS Identification in PT KPAM
No Stage of HCV+ HCA+ FPIC
Study Assessments and Key Socialization
Activity
2015 2016 2017
Q1 Q2 Q3 Q4 Q1 Q2 Q3 Q4 Q1 Q2 Q3 Q4
1 Due diligence
Meeting with Communities / Stakeholders
2 Pre- Assessment
Information Gathering and Scoping
3 Assessment Land Cover Classification (Apr - Jun 2015)
4 Carbon Stock Assessment and GHG (May - Jun 15)

13 | P a g e
5 Environmental Impact Assessment (Mar - Oct 2015)
6 Social Impact Assessment (Oct - Nov 2015)
7 Soil Study and Mapping (Jan - Sep 2016)
8 High Conservation Value Assessment (Mar 15 - Feb 17)
9 Post- Assessment
Boundary & HCV zoning with communities (Mar-Apr 2016)
10 Peat verification (Mar-Apr 2016)
11 Carbon Stock Monitoring & Calibration (Mar-Apr 2016)
12 High Carbon Stock Assessment (Mar 16 - Mar 17)
13 Management Plan
Finalizing Integrated Conservation & Land Use Plan (ICLUP)
14 Development of Management Plan
2.2.1 Due Diligence (Step 1) and Pre-Assessment Stage (Step 2 – Step 3)
The FIRST step, IOI has made a commitment to environmental and social safeguards – a statement
committing company operations to the core values engrained in the HCV, HCS and FPIC processes that
are being integrated: zero deforestation, peat protection, biodiversity conservation, respect for local
community tenure and rights, community food security and support for livelihoods.
IOI also commits to a moratorium on any land clearing or land preparation until the final integrated
plan is developed, and proper management plan to address social, biodiversity and environmental
issues is in place. IOI demonstrates their legal right over a specifically defined site as stated in section
2.0 Location and Status of License, in this document.
IOI also commits to ensure FPIC process is adapted, with full disclosure of the proposed project, with
all potentially affected communities. After the due diligence process, then a pre-assessment activity
was carried out, followed by assessment and post-assessment.

14 | P a g e
Pre-assessment activities include at least 2 steps,
namely (i) Information Gathering and (ii) Scoping
Study.
(i) Information Gathering
Step 2: Information gathering was carried out to
collect primary and secondary data on social
related issues.
Primary data social, economic, cultural, and public
health information was collected through focus
group discussions and individual interviews with
the local communities including the surrounding
stakeholders.
Secondary data collection was carried out through
a reference made from the studies’ findings that
were gathered from relevant government
authorities and private sectors. Information on
socio-economic and cultural components were
collected comprises population density, mortality,
structure of community, race, religion, sex ratio,
livelihood, consumption pattern, income,
infrastructure, gross regional product, community
institution, culture, community perception on
environment and the proposed project, social
interaction, and other parameters reflecting the
socio-economy & cultural conditions of the
community.
The above information is very important during the assessment of the social issues and environmental
impact assessment.
In this level, all existing data relevant to the project area and its surrounding landscape was collated.
This includes data from published and unpublished studies, research reports, papers and other
pertinent sources. There are three main types of information required for a comprehensive integrated
assessment: environmental data, social data and geospatial data.
The project also has identified the stakeholders that is potentially affected by the project especially
the local communities. The company also committed to share the oil palm development plan to the
communities including other stakeholders, to enable the project to identify the risks and further
determine the measures. One of the requirement for the companies that planned to develop oil palm
plantation is to assess the HCS areas. The management measures for the HCS areas is “No
Figure 1: HCV-HCS-FPIC Integration (Pre-
Assessment & Assessment)

15 | P a g e
Deforestation”, and therefore the company need to evaluate if this management measures could
affect the existing local communities.
The community was also fully informed of their rights as PT. KPAM is willing to provide the community
with any access to legal advisor and other services that is needed by the community. The following
Table 4 shows the list of stakeholders that is involved in the HCS assessment.
Table 4: List of stakeholders that is involved in the HCS Assessment
Key Stakeholders Representative Role
Community in Sukaramai Head and officials of village
with several communities
Official head selected by community
and several key communities (member
of the village committee)
Community in Jambi Head and officials of village
with several communities
Community in Danau Buntar Head and officials of village
with several communities
Bogor Agricultural University Dr. Ir. Basuki Winata Expert in Peat Study and Mapping
IAR Ketapang Juanisa & Zulfahmi Expert in Wildlife Study and Mapping
BKSDA, Kalimantan Barat Ir. Sustyo Iriyono Expert in Biodiversity Mapping
PT BMJ
Ninil Jannah
One of the stakeholders who has land
nearby or adjacent to PT KPAM
Flora Fauna Indonesia Pak Darmawan Expert in developing Management Plan
and SOPs
Dinas Kehutanan, Pertanian
dan Perkebunan Official officers
Government Authority
Kepolisian Resort Official officers Government Authority
Badan Lingkungan Hidup/BLHD Official officers Government Authority
Other adjacent stakeholders
such as APP, BMJ
Company officers Adjacent stakeholders
Aid Environment, GAIA and
Universiti (UNTAN).
NGOs representative Experts in Environment, Ecosystem and
Social Issues
Scoping Study and Stakeholders Consultation.
Step 3: Based on the data collected, scoping study and analyses of stakeholders’ consultation are
determined in order to support the identifying of the negative and positive impacts, which may have
occurred during the development of the oil palm plantation. Scoping studies are important for the
following reasons: they provide an opportunity to meet and consult the government, local
communities and other stakeholders; increase understanding of the terrain and land cover; gather
further existing data; and verify proposed field sampling or protocols.
It is important to meet and discuss the proposed project and the assessment with different levels of
government – both national and local – as well as other key stakeholders, for instance NGOs / civil
society and development project leaders. Such engagements are a key requirement and should be led
by the assessor during the scoping study.
16 | P a g e
Once the scoping study has been initiated, one of the first activities should be to visit local
communities likely to be affected by the development. The company’s staffs have visited these
communities team prior to the experts or assessors’ arrival, to discuss via a two-way dialogue the
proposed project, the mutually agreed process for reaching consent for the project, and the project
development phases including the forthcoming visit of the assessors.
The following studies were identified during the study scoping process, which includes
(i) Land Cover Classification;
(ii) Carbon Stock Assessment;
(iii) Environmental Impact Assessment
(iv) Social Impact Assessment
(v) Soil Study and Mapping
(vi) High Conservation Value Assessment
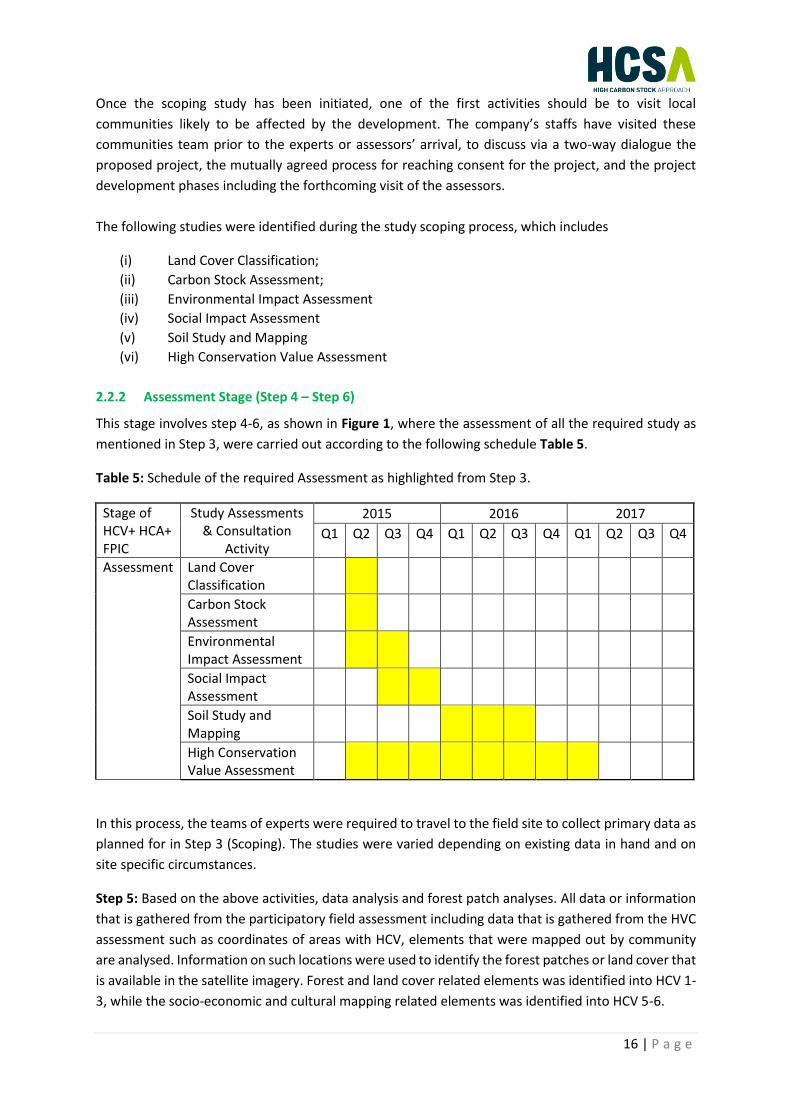
2.2.2 Assessment Stage (Step 4 – Step 6)
This stage involves step 4-6, as shown in Figure 1, where the assessment of all the required study as
mentioned in Step 3, were carried out according to the following schedule Table 5.
Table 5: Schedule of the required Assessment as highlighted from Step 3.
Stage of HCV+ HCA+ FPIC
Study Assessments & Consultation
Activity
2015 2016 2017
Q1 Q2 Q3 Q4 Q1 Q2 Q3 Q4 Q1 Q2 Q3 Q4
Assessment Land Cover Classification
Carbon Stock Assessment
Environmental Impact Assessment
Social Impact Assessment
Soil Study and Mapping
High Conservation Value Assessment
In this process, the teams of experts were required to travel to the field site to collect primary data as
planned for in Step 3 (Scoping). The studies were varied depending on existing data in hand and on
site specific circumstances.
Step 5: Based on the above activities, data analysis and forest patch analyses. All data or information
that is gathered from the participatory field assessment including data that is gathered from the HVC
assessment such as coordinates of areas with HCV, elements that were mapped out by community
are analysed. Information on such locations were used to identify the forest patches or land cover that
is available in the satellite imagery. Forest and land cover related elements was identified into HCV 1-
3, while the socio-economic and cultural mapping related elements was identified into HCV 5-6.

17 | P a g e
The assessment team, in consultation with key stakeholders and experts, reviews the relevant
biological, ecological and social baseline data (primary and secondary) from Step 4 (Previous Step) to
carry out the initial identification of HCVs 1–6. The output of the HCVs including the Management
areas is available in Appendix 1 of this document.
In parallel, the initial land cover map is already completed, supported by forest inventory plot data to
complete the Decision Tree process as described in the HCS Approach Toolkit.
The next step was to overlay all the relevant data sets to develop an integrated plan. Data sets that
was used for this overlaying in the GIS process include:
(i) Land tenure (for PT KPAM, this map is not available), or any community protected areas
or sites (for PT KPAM, this map is not available, but Management Area no 5 is highlighted);
(ii) Areas of HCVs 1–6
(iii) Areas of HVC management areas
(iv) Carbon areas (which is based on Soil Map showing peat and organic soil areas);
(v) HCS forest areas;
Finally, in order to optimize the outcomes for conservation, development and livelihoods (as set out
in the agreed HCS Convergence process recommendations), we allow some ‘give and take’ in the low
and medium priority HCS patches so that the draft production/protection map makes logical sense
from an operational perspective while maximizing conservation and livelihood results.
Step 6: After the above activities were done, consultation and quality control are carried out.
Stakeholder and public consultation. Stakeholders consultation was carried out with the local key
stakeholders, which includes local communities (community leaders, village government), sub-
district government, and other relevant government institutions at district level, in addition to NGOs
and companies operating around the assessment area. Public consultations main objectives are: (i)
to communicate the output of field findings and analysis; (ii) to collect additional data and
information and obtain clarification over the field findings; and (iii) to ensure feedback from the
community and stakeholders consultation is documented.
2.2.3 Post- Assessment Stage (Step 7 – Step 8)
Step 7: After the above activities are completed, field delineation is conducted in order to integrate
all the information that is gathered from HCV assessment activities, Soil Study activities and
Community Mapping exercise. Boundaries of the proposed HCV areas, peat area (including other
conservation areas) and community areas are delineated. In summary, the delineation process
includes the demarcation of the following areas; (i) Areas with HCV values of biodiversity, landscapes
and ecosystems (HCV1-3), (ii) Areas with important ecosystem services (HCV4; and (iii) HCV 5 and 6
areas. The output of Step 7 is the “Integrated Conservation and Land Use Plan” (ICLUP) which is shown
in Map 7.

18 | P a g e
Step 8 includes the final public
consultation process that was carried
out with the key stakeholders, including
the communities. Public consultation
was held by presenting the output of the
proposed “Integrated Conservation and
Land Use Plan” (ICLUP) to the
representatives of key stakeholders such
as local communities (community
leaders, village government), sub-district
government, and other relevant
government institutions at district level,
in addition to NGOs and companies
operating around the assessment area.
Public consultations main objectives are: (i) to communicate the out of the ICLUP; (ii) to collect
feedbacks from the key stakeholders; and (iii) to ensure their recommendation is included during the
preparation of the Management Plan, which include the Protection, Management and Monitoring
Plan. The output of Step 7 is the “Integrated Conservation & Land Use Plan” (ICLUP) which is shown in
Map 8.
Figure 2: HCV-HCS-FPIC Integration (Post -Assessment)

19 | P a g e
Map 8: Integrated Conservation and Land Use Plan for PT. KPAM
The above Map 8 is the output of this assessment which is the “Integrated Conservation and Land Use
Plan” – ICLUP. The ICLUP shows that the available planted area is about 7,251.11 Hectares. The
proposed area to be developed for plantation in year 2018 is about 3,000 Ha, while in 2019 about
4,251.11 Ha.
20% of the proposed planting area will be allocated for PLASMA Scheme as required the government
regulation.
The management of PT KPAM has decided to excise 2,871.47 Ha for HCV areas (HCVMA) including
1022.40 Ha overlap with peat areas (in ID01, ID02, ID03, HCVMA 01 and HCVMA 03 & 4). The total size
of peat land areas that is located outside HCV area is 814.65 Ha. The following table shows the details
of the proposed new planting area with hectarage to be developed for each land cover.

20 | P a g e
Table 6: Proposed ICLUP Map for PT KPAM
Areas Land Use Year 2018 (ha) Year 2019 (ha) Total (ha)
Areas to be excised and protected from new development
HCV Area, Peatland Area Overlapped with HCV & HCV MA
2,871.47 2,871.47
Peatland area located outside HCV Area
814.65 814.65
Nursery and Emplacement
None HCV area, HCVMA and Peatland area
62.77 0.00 62.77
Potential areas for new oil palm development
None HCV area, HCVMA and Peatland area
3,000 4,251.11
7,251.11
Total Area 11,000.00
21 | P a g e
3. Community engagement/ FPIC
3.1 Summary of community engagement, FPIC, participatory mapping
Identifying land rights and land usage by the community are conducted by the company through
several approaches, namely: (i) HCV (High Conservation Value) area identification facilitated by 3rd
party expert team, (ii) Social Impact Assessment by an independent team, and (iii) community area
boundary demarcation, facilitated by village officials
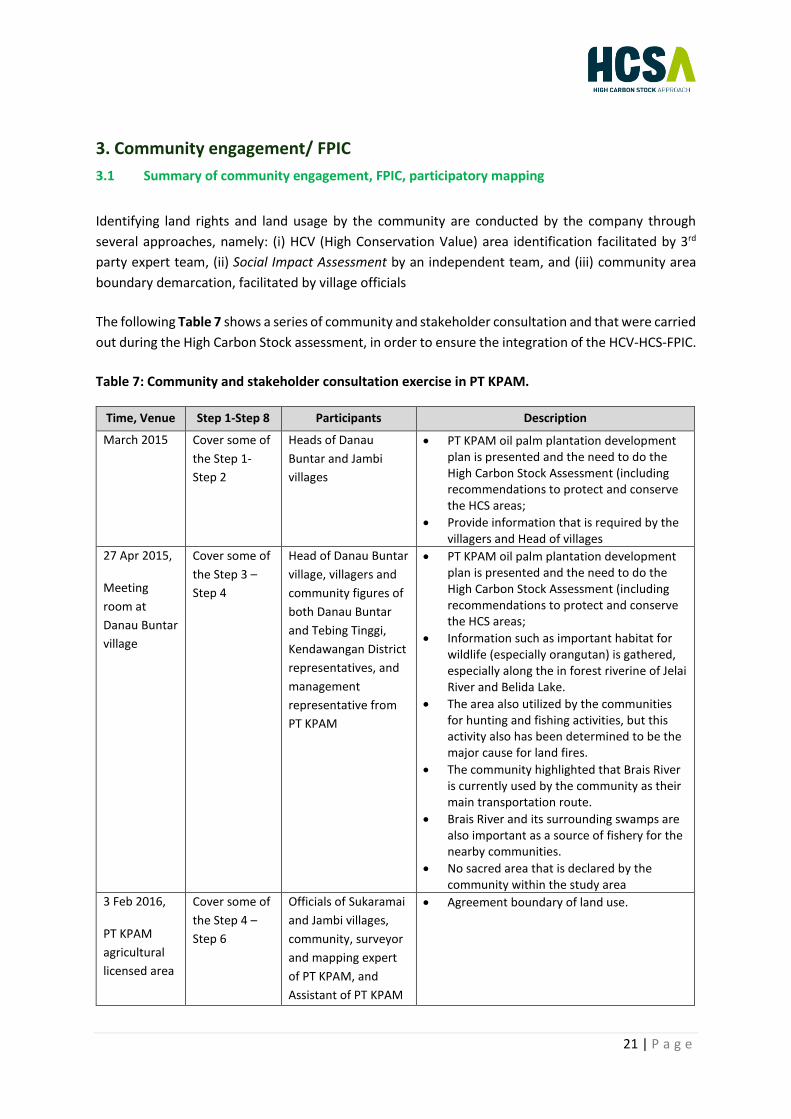
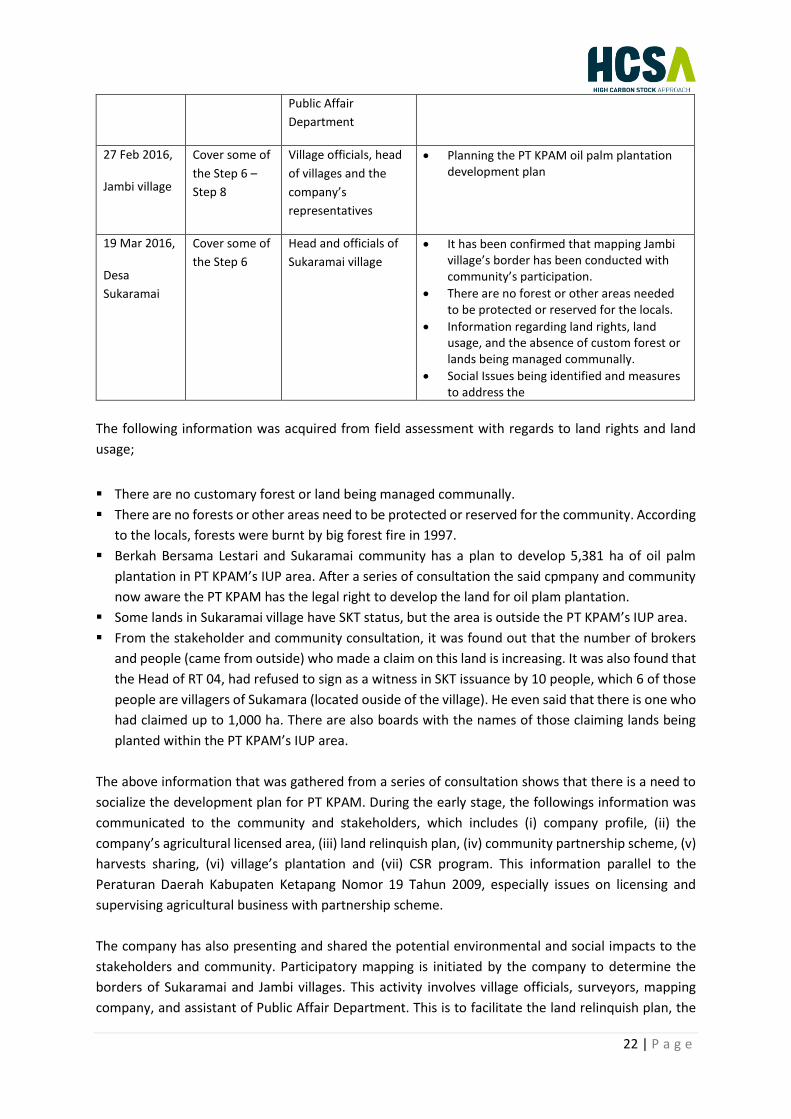
The following Table 7 shows a series of community and stakeholder consultation and that were carried
out during the High Carbon Stock assessment, in order to ensure the integration of the HCV-HCS-FPIC.
Table 7: Community and stakeholder consultation exercise in PT KPAM.
Time, Venue Step 1-Step 8 Participants Description
March 2015 Cover some of
the Step 1-
Step 2
Heads of Danau
Buntar and Jambi
villages
• PT KPAM oil palm plantation development plan is presented and the need to do the High Carbon Stock Assessment (including recommendations to protect and conserve the HCS areas;
• Provide information that is required by the villagers and Head of villages
27 Apr 2015,
Meeting
room at
Danau Buntar
village
Cover some of
the Step 3 –
Step 4
Head of Danau Buntar
village, villagers and
community figures of
both Danau Buntar
and Tebing Tinggi,
Kendawangan District
representatives, and
management
representative from
PT KPAM
• PT KPAM oil palm plantation development plan is presented and the need to do the High Carbon Stock Assessment (including recommendations to protect and conserve the HCS areas;
• Information such as important habitat for wildlife (especially orangutan) is gathered, especially along the in forest riverine of Jelai River and Belida Lake.
• The area also utilized by the communities for hunting and fishing activities, but this activity also has been determined to be the major cause for land fires.
• The community highlighted that Brais River is currently used by the community as their main transportation route.
• Brais River and its surrounding swamps are also important as a source of fishery for the nearby communities.
• No sacred area that is declared by the community within the study area
3 Feb 2016,
PT KPAM
agricultural
licensed area
Cover some of
the Step 4 –
Step 6
Officials of Sukaramai
and Jambi villages,
community, surveyor
and mapping expert
of PT KPAM, and
Assistant of PT KPAM
• Agreement boundary of land use.
22 | P a g e
Public Affair
Department
27 Feb 2016,
Jambi village
Cover some of
the Step 6 –
Step 8
Village officials, head
of villages and the
company’s
representatives
• Planning the PT KPAM oil palm plantation development plan
19 Mar 2016,
Desa
Sukaramai
Cover some of
the Step 6
Head and officials of
Sukaramai village
• It has been confirmed that mapping Jambi village’s border has been conducted with community’s participation.
• There are no forest or other areas needed to be protected or reserved for the locals.
• Information regarding land rights, land usage, and the absence of custom forest or lands being managed communally.
• Social Issues being identified and measures to address the
The following information was acquired from field assessment with regards to land rights and land
usage;
▪ There are no customary forest or land being managed communally.
▪ There are no forests or other areas need to be protected or reserved for the community. According
to the locals, forests were burnt by big forest fire in 1997.
▪ Berkah Bersama Lestari and Sukaramai community has a plan to develop 5,381 ha of oil palm
plantation in PT KPAM’s IUP area. After a series of consultation the said cpmpany and community
now aware the PT KPAM has the legal right to develop the land for oil plam plantation.
▪ Some lands in Sukaramai village have SKT status, but the area is outside the PT KPAM’s IUP area.
▪ From the stakeholder and community consultation, it was found out that the number of brokers
and people (came from outside) who made a claim on this land is increasing. It was also found that
the Head of RT 04, had refused to sign as a witness in SKT issuance by 10 people, which 6 of those
people are villagers of Sukamara (located ouside of the village). He even said that there is one who
had claimed up to 1,000 ha. There are also boards with the names of those claiming lands being
planted within the PT KPAM’s IUP area.
The above information that was gathered from a series of consultation shows that there is a need to
socialize the development plan for PT KPAM. During the early stage, the followings information was
communicated to the community and stakeholders, which includes (i) company profile, (ii) the
company’s agricultural licensed area, (iii) land relinquish plan, (iv) community partnership scheme, (v)
harvests sharing, (vi) village’s plantation and (vii) CSR program. This information parallel to the
Peraturan Daerah Kabupaten Ketapang Nomor 19 Tahun 2009, especially issues on licensing and
supervising agricultural business with partnership scheme.
The company has also presenting and shared the potential environmental and social impacts to the
stakeholders and community. Participatory mapping is initiated by the company to determine the
borders of Sukaramai and Jambi villages. This activity involves village officials, surveyors, mapping
company, and assistant of Public Affair Department. This is to facilitate the land relinquish plan, the

23 | P a g e
company have prepared the workplan and will cooperate with village’s SatLak team to identify,
measure and verify land.
In this process, the community have been given a complete freedom whether or not to relinquish their
lands. The company also highlighted the community partnership scheme that is required under the
govement regulation, and the affected community can become part of the partnershop programme.
The company also respects to those whom have chosen not to relinquish their lands and the measures
for this issues is tabled in Table 7: Management Plan to address Social Issues in PT. KPAM, with the
goal - “Partnership with local community to manage PT. KPAM sustainably is established”
3.1.2 FPIC Evaluation in this HCS assessment.
This FPIC implementation evaluation was carried out by Aksenta (3rd Party Experts) in order to (i)
determine the status of FPIC approaches that were carried out during the HCS assessment and also
(ii) to further recommend follow-up actions to be made in order to improve the FPIC integration during
the early stage of the management plan implementation.
Information about Future Development in PT KPAM’s IUP
The location of PT KPAM’s IUP is well known by the local communities from Desa Sukaramai, Desa
Jambi and Desa Danau Buntar. Based on the community mapping exercise that was done with the
local communities, the IUP areas is previously utilized by the villagers from Desa Sukaramai, Desa
Jambi, and Desa Danau Buntar for shifting cultivation, hunting area and access to Brais River. Most of
the IUP area was burnt in 1997, and therefore, the presence of forest in this area is very limited.
The socialization of the future development plan of PT KPAM was initiated in early year 2015. The
community also claimed that they have been using the IUP areas for shifting cultivation and access to
Brais River for fishing. The community also aware that 20% of the available land (oil palm plantation
in PT KPAM), will be managed in partnership with the surrounding communities.
The community is also aware on the assessment that is required by PT KPAM in order to prepare the
HCS assessment report, including the other report (such as NPP Report).
Socialization of the Development Plan
Socialization of the development plan and other required assessment was initiated in early 2015. PT
KPAM also received official support from head of Desa Danau Buntar and Desa Jambi, after series of
consultation between PT KPAM and the affected communities. Public consultation was carried out
with the communities in early 2016, to present the findings from the Environmental Impact
Assessment (EIA), so that the communities are aware of the impacts of the development plan to their
livelihood
Verification on Socialization Implementation
The following actions or evidences were gathered in order to enable the FPIC implementation
verification

24 | P a g e
• Support letters gathered from Desa Danau Buntar and Desa Jambi, as an evidence that after the
consultation, the community has no objection for PT KPAM to develop the oil palm plantation,
including to assess and protect the HCS areas in PT KPAM’s IUP;
• AMDAL report that is prepared in early 2015, contains all feedbacks that is gathered from the
surrounding communities. The communities were well informed about the future development
plan. Recommendations were made as a management measures to address the potential impacts
including other social issues that were raised by the surrounding communities.
• The HCV assessment process which was carried out from year 2015-2017, provide a neutral
platform for the communities to get enough information about the development plan and at the
same time provide inputs and suggestions especially where is the important area for their fishing
and shifting cultivation activities.
• Series of meeting and consultation headed by “Dinas Perkebunan Kabupaten Ketapang” recorded
in the form of (i) minutes of meeting and (ii) audio visual.
Verification on type of socialization to support FPIC Implementation
The following activities were carried out in order to fulfil the FPIC requirement
• Risk identifications through the AMDAL study;
• Identification of the communities’ right on the land utilization and also the requirement by the
government to allocate 20% of the available land (for oil palm development) to be allocated for
community PLASMA programme.
• Selection of the communities’ head was done by the communities and acknowledged by the
relevant government authorities. Although in some cases, there is small number of villagers, who
is not favored with the elected head.
• Information dissemination to the other communities though their communities’ internal meeting,
by the respective head of villages.
• Participatory mapping was carried out during the early stage where three villages have claimed
that each village.
• The negotiation process was facilitated by government official (Dinas Perkebunan Kabupaten
Ketapang), which allow the discussion and common agreement was achieved, supported by
adequate management plan, especially to address the social issues in PT KPAM.
Conclusions
From the verification and evaluation process, FPIC related-activities were carried out especially
dealing with the following issues
• Adequate information (on development plan, potential impacts, access to government support
and etc) was provided to the key stakeholders (especially to the local communities);
• Community participatory mapping was conducted and verified by (Dinas Perkebunan Kabupaten
Ketapang), showing the area that is utilized by three villages (as shown in Map 13);
• Access to guideline and advise from the relevant government authorities to support the
communities to have confidence in the negotiation process, especially to ensure 20% of the oil
palm development area, to be excised and managed for the communities in three villages.
25 | P a g e
• PT KPAM allowed the community to select their respective head of communities, to be involved
in the HCS assessment identification and also in developing management measures for each of
the issues that were raised by the communities.
• The negotiation process is facilitated by 3rd party which is Dinas Perkebunan Kabupaten Ketapang.
Communities are free to provide inputs, recommendations and to play important role in the
development plan of PT KPAM.
Recommendations
In order to ensure that FPIC is always integrated during the implementation of the oil palm
development plan including the implementation management plan to address social issues, there is a
need to
• Improve the FPIC practices in all stages especially during the implementation of Two management
plans as described in Table 8 and Table 9 of this document;
• Ensure that “Standard Operation Procedure” to implement FPIC is developed especially dealing
with the communities in developing the 20% of the oil palm plantation;
• Improve communication with Public Affair Department and other relevant agencies (at landscape
approach level) on PT KPAM’s plan to protect, manage and conserve the conservation areas that
was identified in the ICLUP; and
• Improve the documentation process in order to capture the activities and also the feedbacks that
are given by the communities for future reference and verification.
• Continue to socialize the output of the ICLUP to the relevant government department and
community in order to get continued support and co-operation from them in the future.

26 | P a g e
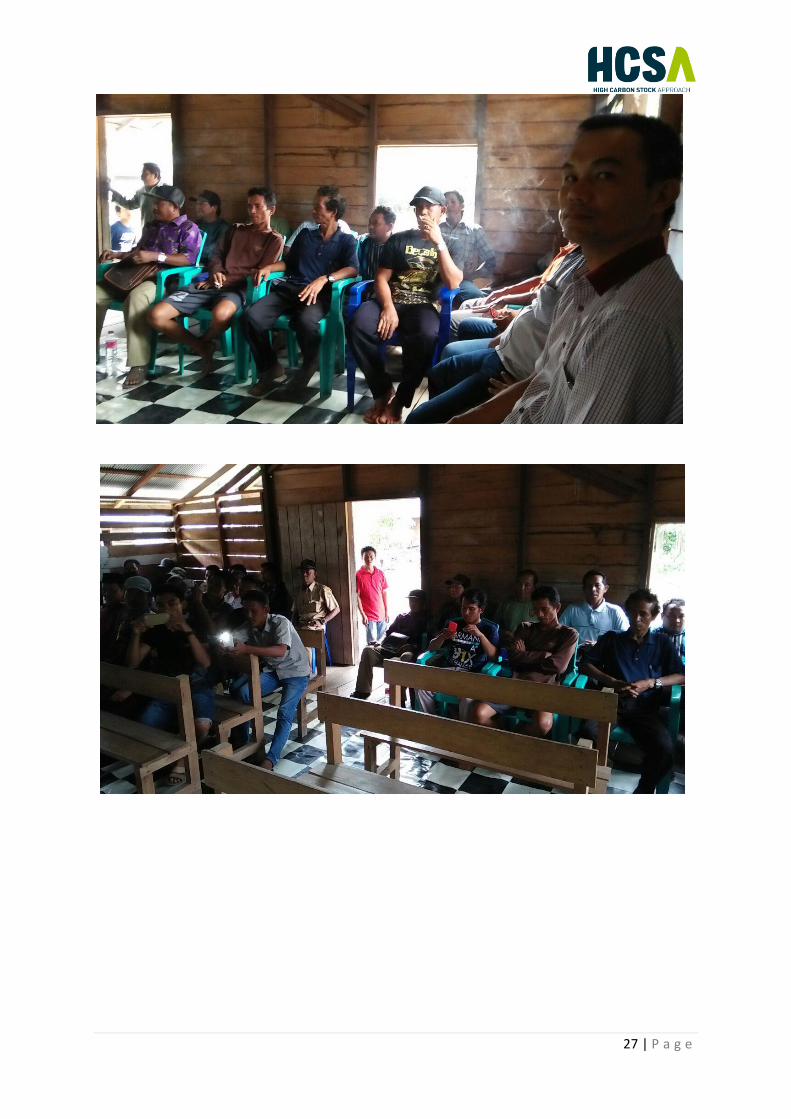
Photo Gallery: Community and Stakeholders Consultation (FPIC Process)
27 | P a g e
28 | P a g e
3.2 Summary of Social Impact Assessment (if any)
The implementation of the Social Impact Assessment (SIA) is carried out based on the following
rules or principles:
a. Participatory mapping - also called community-based mapping - is a general term used to define a
set of approaches and techniques that combines the tools of modern cartography with participatory
methods to represent the spatial knowledge of local communities. Community is invited to provide
input and recommendation in the form of mapping exercise.
b. Multi-party: Multi-party initiatives involving issues identification, which is aiming at environmental
sustainability and social equity, face complex tensions between institutionalized decision-makers,
backed up by expert knowledge, and communities with locally embedded knowledge and interests.
c. Rapid and Ex-ante: Rapid identification of issues and extraction of information which is based on
forecast against tendencies/changes rather than based on accurate factual data as a solution to the
limitations of the approach in Social Impact Assessment, including limited available timeframe.
d. Appreciative: identification of issues and key information, that is not limited only to the gaps
identification but also to explore expectations, ideas, potential solutions to the social issues.
e. Social Learning Cycle: Social Impact Assessment is conducted through the cycle scanning process,
where new knowledge is created through problem-solving activities as a respond to the environmental
changes that occurred.
The implementation stages in the field includes:
1. Introduction Meeting: Introduction meeting was held with the company (represented by the
management of plantation and mill). In this meeting, an orientation approach was used to facilitate
the field activities; socialization of Social Impact Assessment, the identification of relevant parties,
scheduling and technical preparation of the fieldwork;
2. Stakeholders Mapping and Field Scoping was carried out to obtain preliminary data accordance to
the perceptions of key operational and executing stakeholders.
3. Field observations: carried out on locations where issues or social impacts arise or occurred, as well
as other locations, which deemed important to find facts on the ground as an indication of changes,
including taking photographs. This method is used to understand the ground conditions and facts
which could be used to identify the potential social impacts
4. In-depth Interviews: Interviews were conducted with the operational executives of the company,
formal and informal leaders, government officials (village, sub-district and district) and community
members from various professions and social strata around the company's operations. This method
aims to explore and acquire a deeper understanding of the issues that arise conducted in-depth
interviews with key figures, the informant was selected based on their knowledge or parties who are
directly affected.

29 | P a g e
5. Focus Group Discussion or FGD: Discussion was carried out with employee representatives and the
plantation. This method is used to identify the relevant parties, relevant issues, determine the
expectations, ideas and aspirations for suitable solutions through series of meetings (both formal and
non-formal) and focuses on specific topics.
6. Document Review: relevant information is obtained from the documents provided by the company
as well as other documents from other relevant sources that is available on site, as guidance to
understand the social and environmental context;
7. Closing Meeting: Draft of final findings was presented to all relevant management team of the
company, feedbacks were received and amendments and recommendations is done.
Data Analysis Methods and Information
The findings from the field were then analysed to understand more on their mutual relationship, and
then synthesized to draw the conclusions. A framework for analysis of the results was developed
using criteria that have relevance to the social aspects of sustainability as well as changes in
elements of the asset pentagon. In addition, impact analysis was also conducted with respect to the
guidelines regarding the size of the impact. Each issue has a significant impact on the described
circumstances and elements of the asset pentagon.
Socio-economic impacts to country, region and local communities.
The Social Impact Assessment document reported that the economic structure of Ketapang District in
2013 is dominated by three economic sectors, which is (i) agricultural, (ii) trade-hotel-restaurant, (iii)
mining industry. Development of oil palm plantation such as PT. KPAM, will contribute to the economy
of the country and specifically to the district which in turn will increase the contribution of the
agricultural sector towards economic growth.
During the development of the plantation, 3 (three) potential positive impacts and 2 (two) potential
negative impacts for the local communities.
Potential positive impacts include:
(i) Creation of job opportunities and business opportunities (financial capital);
(ii) Improvement of accessibility through development of road & infrastructure (physical capital);
(c) Increase in community income from smallholder partnership agreement (financial capital).
Potential negative impacts include
(i) Decrease in the total area of land that can be managed or utilized by the community; and
(ii) Degradation of the water quality in the adjacent swamps and rivers (especially within the
Berais River. This will indirect affect the source of income for the nearby community who is
depended on the fisheries as source of living (natural capital).
Other potential risks and conflicts that may occurred during the development of the oil palm
plantation in KPAM include;
(i) Sporadic land fire within the PT. KPAM area (which is due to illegal hunting activity)

30 | P a g e
(ii) Land disputes or claims by the local communities due to uncertainty of the land utilization
boundary;
(iii) Long engagement process during the establishment of partnership agreement between
community and PT KPAM, due to inconsistent payment scheme.
Socio-economic Impacts in Respect of Emergent Communities (Workers, Suppliers and etc)
The minimum wage at the district level in Ketapang is about IDR 1.5 million per month. Recently, the
government has decided that for the agricultural sector, the company shall provide the minimum
wage of IDR 1.578 million per month to the workers. The company had also stated that the process of
recruitment of the workers, all local villages, who had agreed to release their land to the company
(through compensation) will be given priority to become workers of PT KPAM.
The potential impact identified also includes the increase of potential income for suppliers especially
those that will have partnership and sub-contract agreements with the company. About 20% of the
land area that is released by each of the villages, for palm oil plantation development purposes, will
be designated as smallholder scheme programme.
Issues raised by stakeholders and assessor’s comments
Based on the interviews and discussions with the specific group of communities, several issues are
raised as follows:
a. Community of Desa Danau Buntar considered that PT. KPAM had not shown any interest in
developing the palm oil plantation, in partnership with local villagers due to the distance of PT.
KPAM from the village. Nursery establishment also not flexible due to the road condition.
b. Increase of river pollution due to the oil palm effluence that is release from the mills
c. land compensation process and area designated for scheme smallholder, should be managed
transparently (if any).
Based on the issues and findings of the social impact assessment, the following recommendations
were made:
a. Develop a specific policy direction and strategy for social engagement and management as basis
for all the social activities implemented by the company
b. Develop a social development and management plan, highlighting the potential social impacts
(including priority social issues), with proper management measures.
c. Formulate a transparent land compensation scheme (if any) and a partnership scheme with the
nearby or relevant local communities, which follow the FPIC process in land
compensation/acquisition (if any).
d. Facilitate the establishment of relevant cooperatives that can help to enhance the capacity
building of the local communities.
e. Develop an effective communication strategy for all stakeholders. This could be developed
through the formation of outreach programme or platform that can enhance the interaction
between the stakeholders and communities.
31 | P a g e
f. Ensure that any land development of clearing activities during the development of oil palm
plantation in KPAM, will not affect the swamps ecosystem and the Berais river network (which
caused by water pollution and sedimentation).
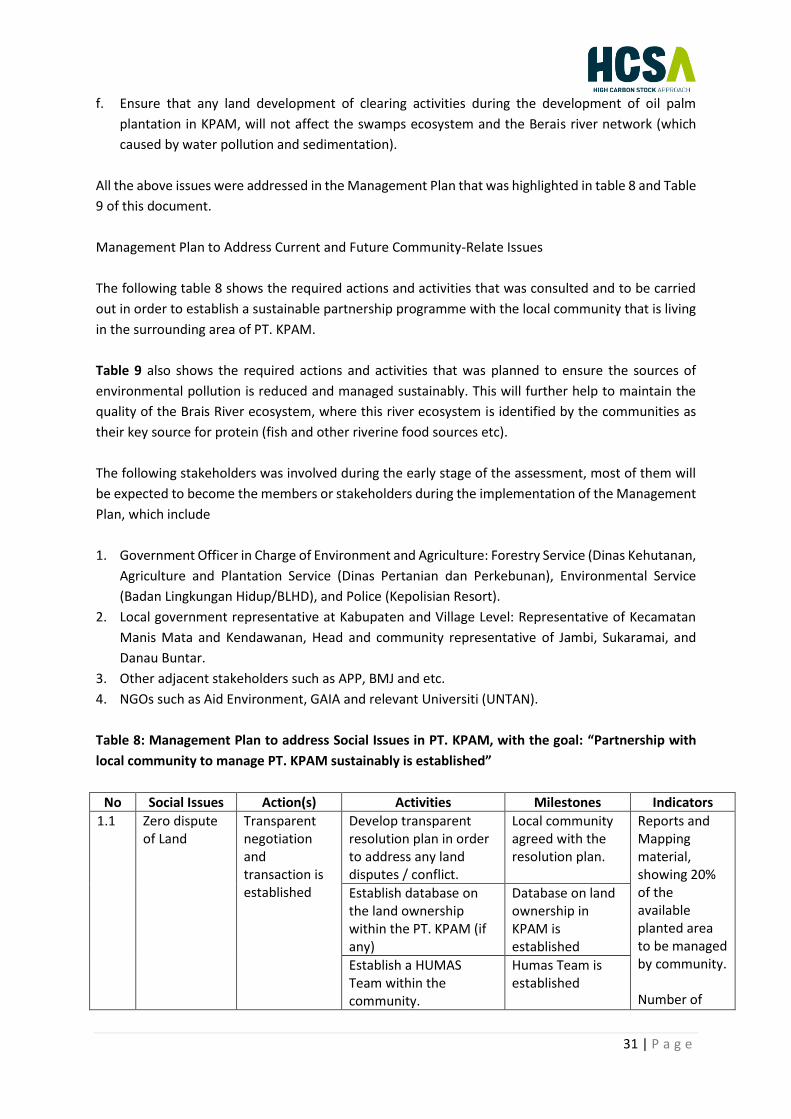
All the above issues were addressed in the Management Plan that was highlighted in table 8 and Table
9 of this document.
Management Plan to Address Current and Future Community-Relate Issues
The following table 8 shows the required actions and activities that was consulted and to be carried
out in order to establish a sustainable partnership programme with the local community that is living
in the surrounding area of PT. KPAM.
Table 9 also shows the required actions and activities that was planned to ensure the sources of
environmental pollution is reduced and managed sustainably. This will further help to maintain the
quality of the Brais River ecosystem, where this river ecosystem is identified by the communities as
their key source for protein (fish and other riverine food sources etc).
The following stakeholders was involved during the early stage of the assessment, most of them will
be expected to become the members or stakeholders during the implementation of the Management
Plan, which include
1. Government Officer in Charge of Environment and Agriculture: Forestry Service (Dinas Kehutanan,
Agriculture and Plantation Service (Dinas Pertanian dan Perkebunan), Environmental Service
(Badan Lingkungan Hidup/BLHD), and Police (Kepolisian Resort).
2. Local government representative at Kabupaten and Village Level: Representative of Kecamatan
Manis Mata and Kendawanan, Head and community representative of Jambi, Sukaramai, and
Danau Buntar.
3. Other adjacent stakeholders such as APP, BMJ and etc.
4. NGOs such as Aid Environment, GAIA and relevant Universiti (UNTAN).
Table 8: Management Plan to address Social Issues in PT. KPAM, with the goal: “Partnership with
local community to manage PT. KPAM sustainably is established”
No Social Issues Action(s) Activities Milestones Indicators
1.1 Zero dispute of Land
Transparent negotiation and transaction is established
Develop transparent resolution plan in order to address any land disputes / conflict.
Local community agreed with the resolution plan.
Reports and Mapping material, showing 20% of the available planted area to be managed by community. Number of
Establish database on the land ownership within the PT. KPAM (if any)
Database on land ownership in KPAM is established
Establish a HUMAS Team within the community.
Humas Team is established

32 | P a g e
Compensation Scheme (CS) is agreed and developed together with the affected local communities.
CS is developed and implemented transparently.
conflicts or complaint is zero.
1.2 Zero conflict or argument with the local community
Ensure genuine exercise by local community of their right to Free and Prior Informed Consent (FPIC), whenever applicable
Adequate allocation of resources needs to consider not only consultation but also training and capacity building, technical supervision, multi-stakeholder engagement and coordination, monitoring, and the establishment of grievance processes, amongst other factors.
Relevant training has been provided and grievance processes is established.
Reports of the training and platform for grievance processes
1.3 Development of Plasma Programme is accepted by the community
Get the feedback and endorsement from the local community on the Plasma Programme mechanism.
Plasma programme to be presented to the local community before it could be officially operated
Plasma Operated (whenever applicable)
Payment made to the local community
1.4 Local community is given priority to work with the company.
Ensure that local community have been priority to get the working opportunities
Ensure the information of job vacancies is well disseminated within local communities. Communities with a right skill will be recruited
Recruitment of the local community to work in the plantation and conservation project.
Letter of appointment.
1.5 Livelihood Quality of the local community is improved
Provide and implement suitable CSR project
Basic facilities are identified through community consultation and dialogue.
Basic facilities such as electricity, transportation and water supply is provided
Report of the CSR programme
Deliver the CSR programme based on the timeline that is agreed with the local community
1.6 Zero encroachment of the Peat area, Heath Forest, Buffer Zone, HCV1 and HCV3.
Local Community aware on the conservation and protection of the HCV1 and HCV3 areas
Outreach programme to socialize the guideline of HCV areas management and enhance their awareness to help protect and conserve the HCV1 and HCV3.
Outreach programme is conducted in all villages
Report of the outreach programme
Identify incentive scheme so promote
Incentive scheme to encourage local
Payment receipt to the

33 | P a g e
local community to be involved in the Peat area, Heath Forest, Buffer Zone, Riparian Reserve, HCV1 and HCV3.
community to be involved in conservation and protection plan
local communities
1.7 Improve socio-economic of the local community
Zero opening of HCV5 management area
HCV5 Management area is determined and excised from the plantation development
Management plan for HCV5(MA) is developed. Refer to actions, milestones 4.1 and 4.2 of the NPP MPs
Refer to indicators 4.1 and 4.2 of the NPP MPs
1.8 Role of Community in managing the HVC/HCS
Refer to Action No 6.2
Refer to Activity No 6.2 of the NPP MPs
Refer to Milestones No 6.2 of the NPP
Refer to Indicator No 6.2 of the NPP MPs
1.9 Option for alternative livelihood for the local communities
Identify alternative livelihood (i.e. REDD+)
Refer to Activity no 1.3 Refer to Milestone no 1.3
Refer to Indicator no 1.3
Table 9: Management Plan - Sources of environmental pollution is reduced and managed
sustainably.
No Objective(s) Action(s) Activities Milestones Indicators
2.1 Reduce Air Pollution
Minimize the sources of the air pollution.
Limit the speed of the vehicle Maintain all vehicles to reduce gas emission.
Speed bump is constructed in a strategic place
Construction of speed bump
2.2 Water Quality in the river is maintained based on government standard (PP No.82/2001)
Reduce the sources of water pollution.
Excise the high steep area from the plantation development / operation to reduce soil erosion
The usage of organic Pesticide
Report of monthly pesticide usage
Establish and conduct water quality monitoring (systematically);
Water quality station is established
Water Monitoring station
Promote the use of organic pesticide; and reduce the use of pesticide in the plantation
Plantation using 100% organic pesticide
Procurement receipt of the organic pesticide.
Protect the riparian reserve in order to reduce soil sedimentation (this is supported under Goal no 3, Action no 3.2)
All buffer zone and riparian reserve is protected
Refer to indicator(s) Action 3.2 of the NPP
34 | P a g e
Make sure all hazardous waste / liquid is managed proper
Management of hazardous waste / liquid is established
Waste Management plan
2.3 Riparian Reserve of the Key River is protected and conserved.
Refer to Actions in 1.6, 3.2 and 4.3 of the NPP MPs
Refer to activities in 1.6, 3.2 and 4.3 of the NPP MPs
Refer to milestones in 1.6, 3.2 and 4.3 of the NPP MPs
Refer to Indicators in 1.6, 3.2 and 4.3 of the NPP MPs
2.4 Zero contamination in Brais river and Jelai river.
Refer to Actions in 2.2
Refer to activities in 2.2 Refer to milestones in 2.2
Refer to Indicators in 2.2

35 | P a g e
4. High Conservation Value assessment
4.1 Summary and link to public summary report
Summary Report link to HCV PT KPAM
The coverage of the HCV assessment, is not only cover the area of IUP PT. KPAM (11,001 ha) but also
covering additional area with a size of 3,573 ha. This area includes peat land moratorium area (western
side), Belida Lake, the production forest (northern side), the development plan area (KSCT) of
Manismata Subdistrict and the riparian buffer of Jelai river and Brais river. In total, the HCV assessment
was carried out in an area of 14,574 ha.
The HCV assessment was carried out in two stages where (i) The first field survey was conducted in
April/May 2015, covering the bigger areas with a total area of 14,574 ha; The second field survey was
conducted in March to April 2016, covers the IUP area (11,001 hectares). The area consists of two
polygons and separated by the Brais River and a 100-meter width de riparian area on the left and right
side.
Administratively, the IUP is located in Danau Buntar village, Kendawangan Subdistrict and Sukaramai
village, Manismata Subdistrict of Ketapang District, West Kalimantan Province, Indonesia. The area is
located at N - 1110055’20” E – 111007’00” E and 2042’20” S - 2049’00” S. The boundary area of PT.
KPAM is bordered with: (i) the development area of the Danau Buntar village, PT UAI palm oil
plantation, production forest (HP), and the development plan area of Manismata Subdistrict (KSCT) in
the north; (ii) the riparian buffer of Jelai River, production forest, and the moratorium peat land area
in the south; the moratorium peat land area and PT BSS in the west; (iv) the riparian buffer of Jelai
River, which is also the border between Kalimantan Barat and Kalimantan Tengah, in the east.
Based on field observation and assessment, there were only 5 (five) identified HCV categories, i.e. HCV
1, HCV 3, HCV 4, HCV 5, and HCV6. HCV 2 is not found in the project area. Table 21 shows the HCV
identification summary in PT. KPAM area.
Table 10: HCV Identification Summary in PT KPAM area

36 | P a g e

37 | P a g e
HCV 1: Species diversity
HCV1 is present in the PT. KPAM area and its surroundings. The project area has at least three criteria
(out of six criteria that is stated in Brown et al., 2013), namely
(i) Populations of multiple endemic or RTE species;
(ii) Important populations or a great abundance of individual endemic or RTE species,
representing a substantial proportion of the regional, national/global population.
(iii) Small populations of individual endemic or RTE species, in cases where the national, regional
or global survival of that species is critically dependent on the area in question.
(i) Populations of multiple endemic or RTE species
The following RTE species was found, and their status is based on the latest IUCN status, which is (i)
orangutan (Pongo pygmaeus / CR), (ii) owa (Hylobates albibarbis / EN), (iii) bekantan (Nasalis larvatus
/ EN), and (iv) rusa (Cervus unicolor). Other RTE Species that are protected by government regulations
includes (i) kijang (Muntiacus muntjak), (ii) pelanduk (Tragulus javanicus), and (iii) Napoh (Tragulus
napu). The RTE bird species according to the IUCN are bangau tongtong (Leptoptilos javanicus);
whereas, according to CITES and the Indonesian government are elang bondol (Haliastur indus), elang
laut perut putih (Haliaeetus leucogaster), elang tikus (Elanus caeruleus), betet ekor panjang (Psittacula
longicauda), kangkareng hitam (Anthracoceros malayanus), kangkareng perut putih (Anthracoceros
albirostris), and several species of cranes and cangak. The RTE species of the herpetofauna taxa
according to the IUCN are buaya sinyolong (Tomistoma schlegelii/VU), bidawang (Orlitia
borneensis/VU), kura batok (Coura amboinensis/VU), and labi-labi (Amyda cartilaginea/VU). Four
species also have CITES conservation status, while those according to Indonesian laws and regulations
are estuarine crocodiles (Crocodilus porosus). The existence of these species was found in the
remaining fragmented peat swamp forests, riparian riverine forest along Jelai River, Belida lake, and
other riparian areas along the small rivers located within the PT. KPAM area.
The RTE and endemic of plants species found in peat forest according to IUCN are perepat
(Combretocarpus rotundatus/VU), pantung (Dyera polyphylla/VU), ramin (Gonystylus bancanus/VU),
belangiran (Shorea balangeran/CR) and protected by government law is kantung semar periuk
(Nephentes ampullaria). In the heath forest, tree species that is found include resak (Cotylelobium
lanceolatum/VU), belangiran (Shorea balangeran/CR) and kantung semar (Nephentes gracilis). Tree
species such as bedaru (Cantleya corniculata/VU), ulin (Eusideroxylon zwageri/VU) dan meranti putih
(Shorea bentongensis/EN) was found in the riparian areas. Other locally protected species, kempas
(Koompassia malaccensis) was also found along the edge of peat forest.
(ii) Important populations or a great abundance of individual endemic or RTE species, representing
a substantial proportion of the regional, national or global population which are needed to
maintain viable populations
Spatial and temporal species concentrations are present in the riparian of Brais river and Jelai River.
The area is suitable habitat for a migratory bird, especially for breeding site Several migratory birds
encountered consist of species with global and regional distribution. According to IUCN (2017), several
species of birds with global distribution encountered are (i) cangak abu (Ardea cinerea), (ii) cangak

38 | P a g e
merah (Ardea purpurea), (iii) kuntul kecil (Egretta garzetta), (iv) kuntul kerbau (Bubulcus ibis), (v) dara
laut (Sterna hirundo), (vi) dara laut jambul (Thalasseus bergii), and (vii) kapinis rumah (Apus affinis).
Bird species that are present in a regional distribution include bangau tongtong (Leptoptilos javanicus)
which spread from South India to Indonesia.
(iii) Small populations of individual endemic or RTE species, in cases where the national, regional or
global survival of that species is critically dependent on the area in question.
The presence of animals that are classified under RTE species is found in the project area with small
population, specifically in the remaining fragmented forest, i.e. (i) owa (Hylobates albibarbis / EN)
population in the fragmented peat forest and the (ii) orangutans (Pongo pygmaeus / CR) in the
fragmented riparian forest along Jelai River.
HCV 2: Landscape-level ecosystems and mosaics
HCV2 was not found in the PT. KPAM area and its surrounding areas. PT. KPAM area with a size of
11,001 ha is relatively close to the residential areas, transportation access, and oil palm cultivation
area. This area has been degraded due to forest fires, logging, excessive hunting, and land clearing,
thus PT. KPAM has no longer contains a HVC no 2. According to the Intact Forest Landscape (IFL) maps
(www.intactforests.org), PT KPAM's area is not included in the Intact Forest landscape network. PT.
KPAM is actually isolated and not connected to any of the nearest IFL. However, within this project
area, there remaining ecosystem include peat swamp forests, forests, and riparian forests.
HCV 3: Ecosystems and habitats
HCV3 was found in the PT. KPAM area and its surroundings. All remaining forest in the PT. KPAM area
is considered as HCV 3 area. Peat forest is naturally rare because it depends on hydrology and soil type
features. Heath forest depends on soil type and riparian forest depends on hydrological features. All
the remaining forest are also anthropogenically rare, which could be threated by hunting, fishing and
illegal burning activities. Land clearing for oil palm plantation development may also threatening the
remaining forest areas. Peat forest ecosystems is protected by at least three (3) Acts, namely (i) Act
No. 26/2007 on spatial land allocation, (ii) Act No. 32/2009 on Protection and Management of Living
Environment and (iii) the Government Regulation No. 71/2014 on Protection and Management of Peat
Ecosystem.
HCV 4: Ecosystem services
HCV4 was found and recorded in the PT. KPAM area and its surrounding areas. All the rivers and
riparian reserve (areas) provide an ecological function as a natural drainage (Brais river, Jelai River,
Paduempat River, Brais Kapat River, and Tangguk River), so that upstream and downstream flow could
be maintained naturally.
The presence of vegetation in riparian areas also functioning to maintain water quality characteristics,
control erosion of river banks, hence provide protection for the fisheries. The wider rivers such as Brais
River and Jelai River with larger dampened riparian have the function of a natural barrier that can

39 | P a g e
prevent the expansion of land fires.
Peat forests and heath forests can mitigate the extreme water flows that would have caused flooding
in the downstream area. Peat forest and riparian forest also play its function as a natural barrier that
could prevent the expansion of land fires. The existence of pollination service was also determined by
the presence of Kempas trees, where these trees are normally used as a nesting ground for pollinating
bees. This tree can be normally found along the edge of the peat forest.
The ecosystem services such as provision of clean water, stabilizing steep slope, controlling erosion,
protection against winds, and the regulation of humidity, rainfall and other climatic elements were
deemed not present. The communities normally get their sources of clean water wells. Most of the
area in PT. KPAM has a flat terrain, thus the risk of land erosion is not significant.
HCV 5: Community needs
HCV5 was not found or present in the PT. KPAM’s concession area. Based on the interviews with local
communities, most of the HCV5 areas located outside of the concession area, which is located at the
downstream. However, in order to ensure that the HCV5 that is located at the downstream area is not
degraded or affected, the riparian area and floodplain area that is located at the upper stream along
Brais River (located within the concession area) need to be maintained and protected.
Although the fishermen in the Brais River claim that there are other alternative livelihoods and Brais
river is not the only place to harvest fish, but it is very important to make sure the ecosystem along
the Brais River, could be conserved and protected, in order to ensure that the HCV5 area at the lower
stream could be protected from any pollution. Therefore, Brais can be designated as part of the HCV5.
These areas have important values as a source of livelihood to meet people's basic needs. The reasons
for determining these important values are: (i) fishing in the Brais river will be the last option for the
local community if they are unable to obtain other sources of income, (ii) other alternative livelihood
such as carpentry or become labour to build construction, transportation services, farmers and
plantation workers are not necessarily available at all times, and (iii) Currently, the Brais River is the
main transportation route between Danau Buntar Village and Sukaramai town.
HCV 6: Cultural values
HCV6 was found to be present in the concession area. Based on the participatory mapping, the local
people of Danau Buntar, Sukaramai and Jambi Village claim that area which is important for their
cultural and traditional practices within the PT KPAM area. However, within the concession area of PT
KPAM, kangkareng bird habitat is present, especially in the peat forest. According to the Dayak tribe,
this bird has a cultural and sacred values. For the Dayak community, kangkerang bird is a symbol of
ideal leader and also a symbol of peace and unity.
Although the community nearby PT KPAM is dominated by Melayu tribe, but the existence of hornbills
is important for the Dayak tribe on the regional level of the island of Borneo, as well as those outside
the island of Borneo. Thus, it can be concluded that HCV6 is present within the PT KPAM area,

40 | P a g e
especially the peat forest.
Other HCV6 values which is common includes young coconut leaves that is normally used to make
“ketupat” during the muslim or islamic festival. Cemeteries is located in the Danau Buntar, Jambi and
Sukaramai villages but this is outside the PT. KPAM concession area. Public consultation with the
community was carried out using two approaches, i.e. (i) formal meetings and (ii) interviews. Formal
meetings were conducted in each village.
The first public consultation was conducted in Danau Buntar Village on 27 April 2015 with 22
participants, attended by the Village Head of Danau Buntar, Chairman of BPD, Head of Dusun Tebing
Tinggi, Kendawangan district representative, community leaders, Melayu indigenous leader,
Babinkamtibmas (Bintara pembinanaan dan keamanan ketertiban masyarakat), KPAM management,
and Aksenta team.
The second public consultation was conducted in Jambi Village on 18 March 2016 with 11 participants,
attended by the Head of Jambi village, Chairman and members of BPD and community leaders.
Third public consultation was conducted in Sukaramai village on 19 March 2016 with 8 participants,
attended by Head of Sukaramai Village, Chairman and members of BPD, community leaders, and
Aksenta Team.
Public consultation in Jambi and Sukaramai villages was carried out using the focus group discussion
(FGD) method. Community consultations through face-to-face interviews were also conducted in the
field, i.e. with fishermen in the Brais river, community leaders, villagers, and management of PT.
KPAM.
The Aksenta team presented materials for discussion in the public consultations. These materials
include: (i) understanding of HCV in the context of oil palm plantation development; (ii) the scope of
HCV study in the PT. KPAM area; (iii) supporting maps for HCV studies in PT KPAM area; (iv) field data
and information obtained during field survey, and (v) the interim results and HCV maps (drafts-1 for
first public consultation and draft-2 for the second and third public consultation). On issues related to
HCV in the area of PT KPAM, the community provided input and information about the Brais river,
land fires, forest remnants, orangutans, livelihoods, and employment. Some issues on community land
allocation and village boundaries were also discussed. Land resource utilization issue is a common
issue that is highlighted by the local community as this issue could affect their daily livelihood.
Stakeholder consultations were conducted during HCV assessment until the stage of finalizing the
report. The consultation process includes face-to-face interview and communication through email
and Skype. Key stakeholders such as NGOs (Proforest, IAR and FFI), academics/researchers (IPB),
government (BKSDA), HCV assessors, and management of PT BMJ and PT UAI was involved during the
finalization of the HVC report.
41 | P a g e
Field Assessments
Typical primary data collection and assessment was categorized into two parts, namely (i)
Environmental data (HVC No 1 to HVC No 4) and (ii) Social / socio-economic data (HVC No 5 and HVC
No 6). Most of the data also collected from the
In general, field activities are conducted to verify the desktop studies such as land cover, data
collection on the species information, ecosystem type, land physiographic, soil type, hydrological
characteristics, socioeconomic and cultural conditions. Field activities were divided into six types of
HCV into 3 study groups, namely: (i) biodiversity, landscape and ecosystem (HCV 1-3), (ii) ecosystem
services (HCV 4), and (iii) socio-economic and cultural (HCV 5-6).
Field activities for HCV1-3: biodiversity, landscape and ecosystem; Field observations include one or
more of the following characteristics: (i) natural ecosystems that include rare or endangered
ecosystems; (ii) natural ecosystems that are part of the ecological landscape; (iii) rare or endangered,
endemic or limited-range wildlife species; (iv) areas potentially used temporally by wildlife for
migration, migration routes, corridors, including refugium areas; and (v) habitat connectivity.
The identification of wildlife’s presence is based on one or more of the following field indicators: (i)
spotted, (ii) sounds, (iii) traces or abandoned signs (e.g. treads above ground, scratches on tree trunks,
dirt, nest, remnants of body parts such as outer shell/scales / feathers/hair, skull, horns, fangs, or
other recognizable body parts). Information on the presence of animal wildlife species was also
obtained from interviews with local people (e.g. hunters, farmers, fishermen). Identification of plant
species using observations in the sample plots. Within each observation plot consists of 5 subplots to
record plant species according to the diameter of the tree at breast height (dbh), i.e. (i) sub-plot 40x40
meters for dbh > 35 cm, (ii) sub-plot 20x20 meters for dbh 20 (Iv) 5x5 meter sub-plot for dbh 2-10 cm
and (v) 1x1 meter sub-plot for the species at the seedling level, shrubs and herbaceous. The results of
this plant analysis are also used to describe the ecosystem condition and land cover verification.
Field activities for HCV4: ecosystem services; Data collection in the field is to verify the presence of
HCV attributes or ecosystem services within the study area. Observations were conducted on aspects
of land cover, land physiography, soil type, hydrological characteristics, land fire marks, microclimate
and proxy indicators for pollinators. For effectiveness and consistency, the basic questions to be
answered from each observed object are the role, value, function, and benefits of ecosystem services,
so they are essential for conservation.
Field activities for HCV5-6: socio-economic and cultural; Participatory field assessment was carried out
through the process of High Conservation Value (HCV) assessment, where communities were invited
to the consultation session to map out the area that is related to the communities, which is component
HVC 5 and component HVC 6 (Socio-economics and Cultural). Field assessment’s activities includes
semi-structured interview in a “Focus Group Discussion” (FGD), and mapping exercise by the
community in each of the village. This is followed by field observation activities in order to gather or
verify the current land use on the ground. Consultation and discussion focuses on three issues: (i)
utilization status of natural and land resources within the proposed project areas, (ii) magnitude of
the utilization including purpose, and (iii) current management pattern for the utilization of natural
resources and land resources. The details of the HCVs assessment are shown in Table 11.

42 | P a g e
Table 11: HCVs areas in PT KPAM
No ID Location Location Description HCV Type Area (ha)
1 ID01 Peat swamp secondary forest
Peat swamp secondary forest within the IUP connected to the Moratorium area
1, 3, 4 and 6
265.39
2 ID02 Peat swamp secondary forest
Peat swamp secondary forest within the IUP PT KPAM connected to the production forest in the north
1, 3, 4 and 6
59.65
3 ID03 Heat (kerangas) forest
In the west of Brais River and southern part of Peat swamp secondary forest
1, 3 and 4 44.66
4 ID04 Padu Empat River • River flows and width of riverbanks to be 50 meters on left and right, the river’s width would be 3 m to 5 m
• Riparian river could still be rehabilitated.
1, 3 and 4 29.73
5 ID05 Brais Kapat River and its riverbank
• River flows and the width of riverbanks to be 50 meters on left and right, the river wide is 5-8 meters.
• Riparian river can still be rehabilitated.
1, 3 and 4 38.10
6 ID06 Important Habitat of Jelai-Brais Kapat River
• Thicket and riparian forest of Jelai River the IUP border is in the west of Jelai River up to the forest production.
• Riparian river can still be restored naturally
1, 3 and 4 54.54
7 ID07 Tangguk River and other rivers
• River flows and riverbanks wide of 50 meters on left and right, the river wide is 3-5 meters.
• Riparian river can still be restored naturally
1, 3 and 4 38.10
8 HCVMA 01
Padu Empat upstream
Peat land and there a designated as peat and carbon conservation by PT KPAM is connected to peat land of moratorium area.
HCV4 MA 381.80
9 HCVMA 02
Flood plains of Brais River
Need to conduct water management assessment to protect the Brais River function. As of now, the government had designated buffer river to be at 100 meters from river’s edge and excluded from the IUP PT KPAM
HCV4 MA HCV5 MA
1,463.90

43 | P a g e
Map 9: Location of HCV no 1 and it’s Management Area (MA)
10 HCVMA 3 & 4
Tangguk upstream
Peat land area designated by PT KPAM for conservation
HCV4 MA 270.90
11 HCVMA 06
Wildlife corridor between HCV1 ID 01 and ID02
Non-forested area between peat forest HCV1 ID01 and ID02 as HCV1MA as wildlife corridors and connectivity should be reforestation
HCV1 MA
42.20
12 HCVMA 07
Wildlife corridor between HCV1 ID 01 and forest in the moratorium area and production forest on Southside
Non-forested area between peat forest HCV1 ID01 and forest in the moratorium area and production forest on Southside as HCV1MA as wildlife corridors and connectivity should be reforestation
HCV1 MA 56.30
13 HCVMA 08
Wildlife corridor between HCV1 ID 04 and forest in the moratorium area on west side
Non-forested area between riparian of HCV1 ID04 and forest in the moratorium area on west side as HCV1MA as wildlife corridors and connectivity should be reforestation
HCV1 MA 126.20
Total HCV + HCVMA 2,871.47
Table 1

44 | P a g e
Map 10: Location of HCV no 3 and it’s Management Area (MA)
Map 11: Location of HCV no 4 and it’s Management Area (MA)

45 | P a g e
Map 12: Location of HCV no 5 and it’s Management Area (MA)

46 | P a g e
5. Environmental Impact Assessment
5.1 Summary
Methodology and Process
The methodologies that is used in the Environment Impact Assessment comprises
(i) Primary Data Collection
(ii) Secondary Data collection
(iii) Analysis of the potential impact
Primary data collection: Primary data was collected through surveys and observations for biological,
physical, and chemical parameters; and social, economic, cultural, and public health information
through focus group discussions and individual interviews with the stakeholders including the local
communities.
Secondary data collection: Data was collected either through a secondary data from relevant research
results, or other studies within the same industry and region, as well as data from relevant
government authorities. Data on physical & chemical components were collected which include air
quality, noise levels, surface water quality, soil properties, climate, and rainfall. Biological components
that is collected, include flora and fauna diversity, while data on socio-economic and cultural
components were collected comprises population density, mortality, structure of community, race,
religion, sex ratio, livelihood, consumption pattern, income, infrastructure, gross regional product,
community institution, culture, community perception on environment and the proposed project,
social interaction, and other parameters reflecting the socio-economy & cultural conditions of the
community. Public health data components that were collected include sanitation, access to public
health and medical facility, nutrition, medical services including number of facility and medical
personnel. Based on the data collected, qualitative and quantitative analyses are developed in order
to support the identifying of the negative and positive impacts, which may have occurred during the
development of the oil palm plantation. The methodology that is used to assess the impacts is based
on the references that is available in this document “Kepka BAPEDAL No:56 in 1994.”
Outputs of the EIA
Based on the Environment Impact Assessment documents, the following list of impacts are
expected, and the impacts could be categorized into three components as follows:
1. Physical and Chemical Environment Impact
a. Decrease in ambient air quality;
b. Increase in noise level;
c. Decrease in water surface quality
d. Land subsidence
e. Physiographical changes
f. Changes in drainage pattern
g. Risk of land fire
2. Biological Impact
a. Decrease in flora diversity
b. Decrease in fauna diversity

47 | P a g e
c. Water biota species diversity
3. Social, Economy and Community Health Impact
a. Increase in economic activity
b. Increase in community income
c. Changes in community behavioral pattern
d. Social conflict
e. Decrease in community health level
The evaluation of the major and significant impact on environmental component is summarized in the
following Table 13. The result of a holistic assessment or study describes various significant impact
arising from the development of PT Kalimantan Prima Agro Mandiri oil palm and mill industry at Manis
Mata subdistrict of Kendawangan district on West Kalimantan Province. The potential impacts is
examined as unified interrelated entity, based on forecast of significant important impact that can
arise within the scope of time and space established.
Table 13: Major and significant impact on environmental component
The result of this evaluation are used as a tool of consideration of authorized agencies to decide on
the environmental feasibility on this activity plan. The major and significant impact resulting from
evaluation are presented as the major and significant impact that must be managed in the
Environmen
Management Plan (RKL) and Monitored in the Environment Plan (RPL). Measures for the key issues
were addressed in the Management Plan that was highlighted in table 8 and 9 of this document, with
the aim to minimise the impact of development plan.

48 | P a g e
6. Land cover image analysis
6.1 Area of Interest and how it was defined
Area of Interest (AOI) for the land cover assessment is PT KPAM area is located or highlighted,
including the areas that is located 1 Km from the PT. KPAM. It is necessary to identify the land cover
in a larger scale, to enable the identification of other connectivity within the forest landscape.
6.2 Description of images used for classification
The satellite imagery that was used to classify the land cover is gathered from Landsat 8 with path/row
120/62, spatial resolution at 30 m, combination band at 654, taken by the satellite on March 12, 2016
(refer to Map 8). The cloud cover of the imagery is less than 5%.
6.3 Sample image
Below is the Landsat 8 Satellite image (acquired on March 12, 2016)
Map 14: Landsat 8 Imagery
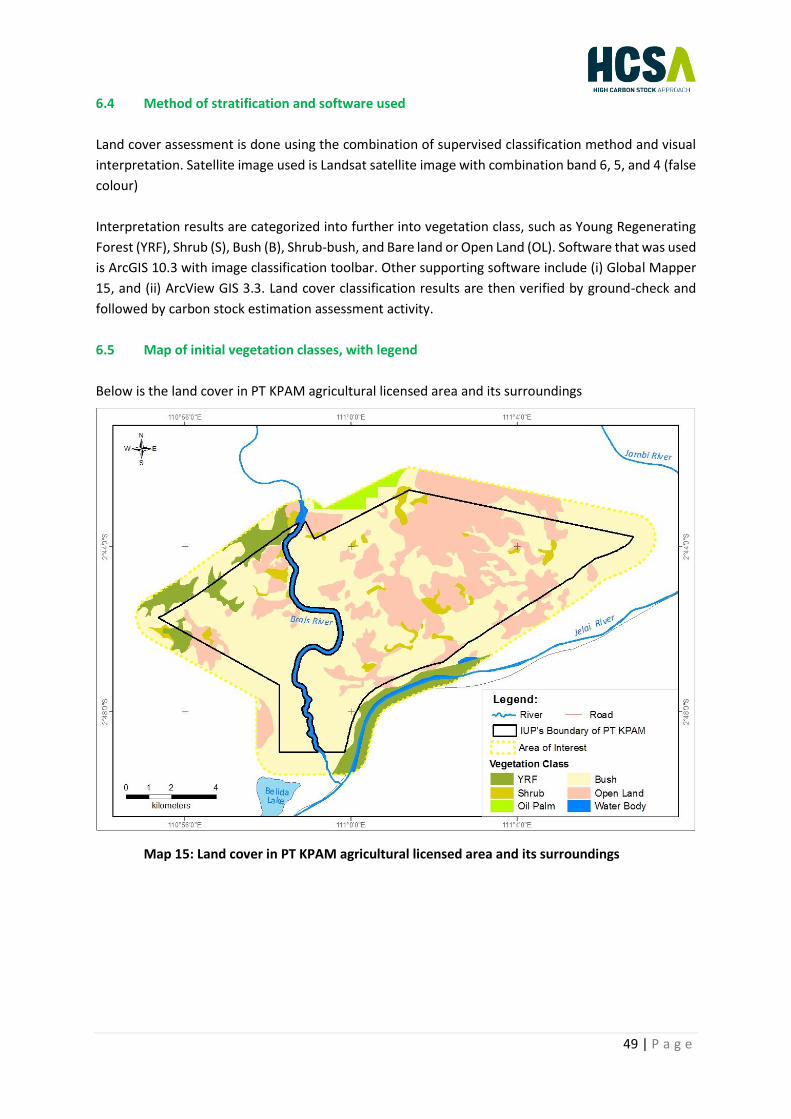
49 | P a g e
6.4 Method of stratification and software used
Land cover assessment is done using the combination of supervised classification method and visual
interpretation. Satellite image used is Landsat satellite image with combination band 6, 5, and 4 (false
colour)
Interpretation results are categorized into further into vegetation class, such as Young Regenerating
Forest (YRF), Shrub (S), Bush (B), Shrub-bush, and Bare land or Open Land (OL). Software that was used
is ArcGIS 10.3 with image classification toolbar. Other supporting software include (i) Global Mapper
15, and (ii) ArcView GIS 3.3. Land cover classification results are then verified by ground-check and
followed by carbon stock estimation assessment activity.
6.5 Map of initial vegetation classes, with legend
Below is the land cover in PT KPAM agricultural licensed area and its surroundings
Map 15: Land cover in PT KPAM agricultural licensed area and its surroundings

50 | P a g e
6.6 Table of total hectares per vegetation class
Table 14: Total hectares per vegetation class
Land cover class Number of Hectares % of total concession
Potential HCS clases:
High Density Forest - -
Medium Density Forest - -
Low Density Forest - -
Young Regenerating Forest 129 1.17
Sub-total 129 1.17
Non-HCS classes, e.g.:
Scrub 1,391.70 12.65
Bush and Shrub 631.50 5.74
Bush 6,070.90 55.19
Open Land 2,776.90 25.24
Mines, smallholder agriculture, plantation, etc. - -
Sub-total 10,871 98.83
TOTAL 11,000 100

51 | P a g e
6.7 Summary of which areas are potential HCS forest, subject to further analysis
Potential HCS area consists of YRF, which is located in the western part of study area. The YRF area is
old thicket in peatland, which is spread across three locations with < 100 ha polygon each.
The description of the land cover classification is shown in the following Table 15.
Table 15: Physical description of the land cover that is defined in the classification process.
Land cover Classification
Physical description of the land cover, e.g. species mix, forest type (pioneer, regenerating, primary etc.), diameter distribution, structural indices, maturity indices, etc.
Open Land This area is an open area due to previous land fire and other activities that involve removal of vegetation cover.
Bush This area is grassland, burnt bushes, and dessert. Types of grass found are Digitaria sp, Eragrotis sp, and Kyllinga sp.
Scrub Vegetation diversity with DBH > 2 cm, categorizes as low-medium with Shannon-Wienner average index 1.3 (0.8-2.1). Relatively dry areas have lower diversity than relatively wet areas. Types with relatively high density are kenasian (Zyzygium zeylanicum) and pansulan (Pternandra coerulescens). In this area, there are ferns, Eleocharis dulcis, croissant grass (Cyperus sp), and several seedling groups with DBH < 2 cm, such as Alstonia scholaris and Macaranga pruinosa.
Young Regenerating Forest
There is peat area in the north-west of study area. Plant biodiversity in this area is categorized as medium with Shannon-Wiener diversity index 1.69 (1.39-1.99) and there are 19 types of trees with DBH > 2 cm. Dominant vegetations are Melanorrhoea wallichii, Madhuca motleyana, Combretocarpus rotundatus, and Ploiarium alternifolium.
Field verification was conducted in the field and the following photos describe the condition of each
of the land cover in PT KPAM.
Land Cover Class – Young Re-generated Forest Land Cover Class – Bush

52 | P a g e
The following photos show the image from LIDAR data, representing each of the land cover as defined
in our land cover classification.
Land Cover Class – Shrub Land Cover Class – Bare land / Open land
Land Cover Class – Bush Bare land / Open land due to land fire
Bush-Shrub Young Re-generated Forest
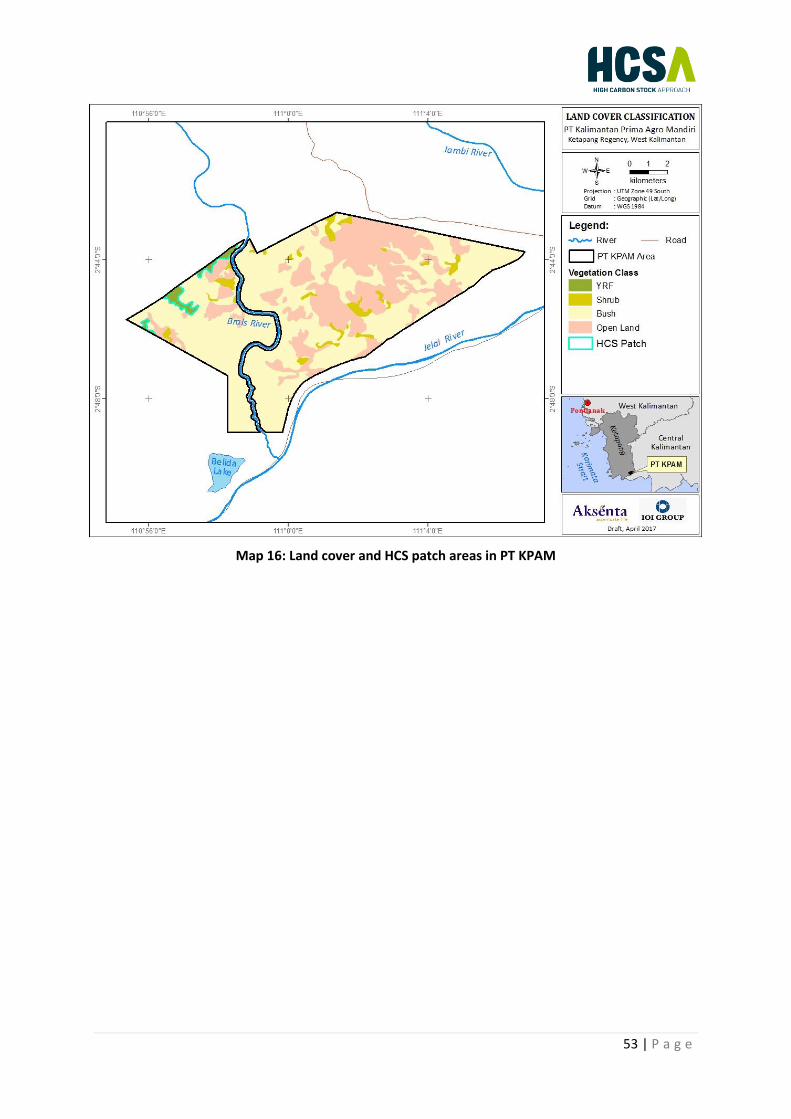
53 | P a g e
Map 16: Land cover and HCS patch areas in PT KPAM
54 | P a g e
7. Forest inventory results
7.1 Inventory sample design and plot rational
The number of observation plots in the field is carried out accordingly to vegetation cover stratification
result. Random sampling is not proportionally conducted in order to include small-sized vegetation
cover in the sample. Sampling was done in June 2014, while satellite image used was acquired in
March 2016; thus, there is a potential bias in the result due to possible succession or loss of vegetation
in the time difference. Therefore, sample monitoring and Carbon Stock evaluation are also used as
reference to estimate carbon stock. Those activities are conducted together with field survey in this
assessment.
The carbon stock assessment within the PT KPAM was conducted based on three main categories of
carbon source as referred in IPCC (2006). This include 1. AGB – Above Ground Biomass and BGB –
Below Ground Biomass; 2. Neuromas and litters, and 3. Soil carbon. Due to the estimation of carbon
using Neuromas and litter has bias and very high uncertainty, it was not included in the carbon stock
assessment.
After the land cover classification process, field sampling plot is conducted in order to estimate the
carbon stock in PT KPAM. Sampling plot method that was used is stratified random sampling, where
every class of vegetation cover has three plots, which is randomly chosen. Each sampling plot has an
observation row to make three measurement blocks. In every plot, there exists a sub-plot with various
measurements to calculate various vegetation objects, such as Diameter at Breast High. Map 10 shows
the distribution location of the sampling plots in PT KPAM. Globally, the estimated carbon value uses
0.47 from the values of biomass and necro mass (IPCC, 2006).

55 | P a g e
7.2 Map indicating plots
Map 17: Distribution of Sampling Plot for carbon stock assessment in PT KPAM

56 | P a g e
7.3 Forest inventory team members and roles
m
Idung Risdiyanto; Acquires Master of Science degree in Natural
Resources Management Technology from an international program
organized by IPB (Bogor Agricultural University), after previously
receiving Bachelor degree in Agro-Meteorology from the same
university. Began his career in 1997 as a researcher with research on GHG
(Green House Gas) and water resource with UNEP and PPLH IPB. Has
done many researches with various well-known research organizations
in Indonesia such as LIPI, LAPAN, BPPT, and BMKG. Almost all of his works
are assessment on natural resources management, which mostly relates
to water, land, and climate change using Geographical Information
System (GIS), Remote Sensing, Modelling, and Spatial Analysis. Since
2007, he is also part of Indonesia’s Forest Ministry’s team of experts,
which involves in finding solutions to problems related with watershed
area management. He teaches climatology, GIS and Remote Sensing
application, Satellite Meteorology at IPB. He is currently an RSPO
Approved HCV Assessor in Aksenta with specialization in Environmental
Services. He is the team leader for Carbon Stock Assessment.
Reza Ahda Sabiila; Forestry expert with major interest on ecology and
forest plants biodiversity. He is still active in nature loving organization
(Rimbawan Pencinta Alam) ever since he joined during his college years in
IPB in 2011. The organization focuses on preservation of tropical forests.
As an expert of forest plants biodiversity, he is responsible for ecology and
identifying forest vegetation for biomass and carbon stock calculations.
Yudha Utama; Holds Bachelor degree in Forestry from IPB. He is an expert
in assessment and analysis of vegetation. He is experienced in surveying
tropical forests in Kalimantan and Sumatra for estimating and calculating
biomass of standing trees for conservation purposes. He began his career
in 2010 with carbon stock calculation assessment on forest trees biomass
in Jambi and Riau provinces with IPB. In this assessment, he is responsible
for identifying plants and calculating forest biomass.
Aulia Bahadhori Mukti; Is a soil expert whom acquired his education from
IPB in Soil and Regional Development Study. He began his career as a soil
expert in soil suitability survey for agriculture and plantation with IPB.
Since 2010, he has conducted assessments on peatland conservation and
HCV area identification. He specializes in environmental services and GIS
on agroforest industry and oil palm plantation. In this assessment, he is
responsible for soil evaluation and identification, especially peatland, in
the study area.
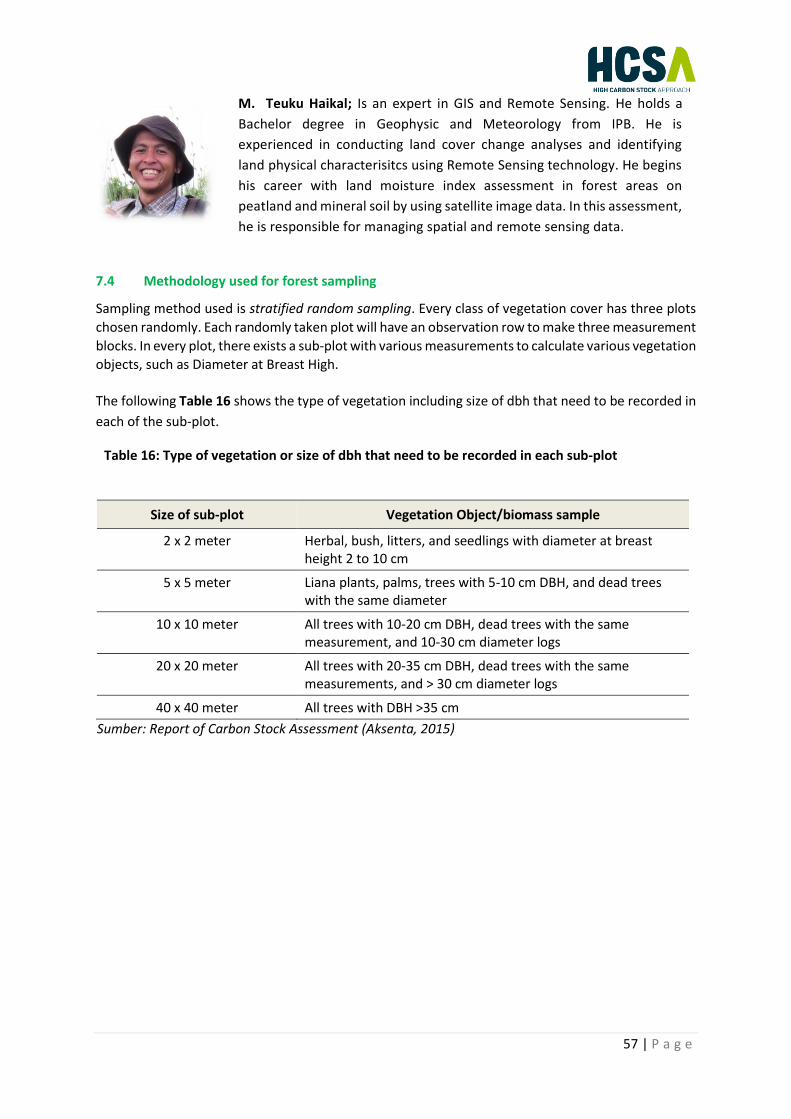
57 | P a g e
M. Teuku Haikal; Is an expert in GIS and Remote Sensing. He holds a
Bachelor degree in Geophysic and Meteorology from IPB. He is
experienced in conducting land cover change analyses and identifying
land physical characterisitcs using Remote Sensing technology. He begins
his career with land moisture index assessment in forest areas on
peatland and mineral soil by using satellite image data. In this assessment,
he is responsible for managing spatial and remote sensing data.
7.4 Methodology used for forest sampling
Sampling method used is stratified random sampling. Every class of vegetation cover has three plots
chosen randomly. Each randomly taken plot will have an observation row to make three measurement
blocks. In every plot, there exists a sub-plot with various measurements to calculate various vegetation
objects, such as Diameter at Breast High.
The following Table 16 shows the type of vegetation including size of dbh that need to be recorded in
each of the sub-plot.
Table 16: Type of vegetation or size of dbh that need to be recorded in each sub-plot
Size of sub-plot Vegetation Object/biomass sample
2 x 2 meter Herbal, bush, litters, and seedlings with diameter at breast height 2 to 10 cm
5 x 5 meter Liana plants, palms, trees with 5-10 cm DBH, and dead trees with the same diameter
10 x 10 meter All trees with 10-20 cm DBH, dead trees with the same measurement, and 10-30 cm diameter logs
20 x 20 meter All trees with 20-35 cm DBH, dead trees with the same measurements, and > 30 cm diameter logs
40 x 40 meter All trees with DBH >35 cm
Sumber: Report of Carbon Stock Assessment (Aksenta, 2015)
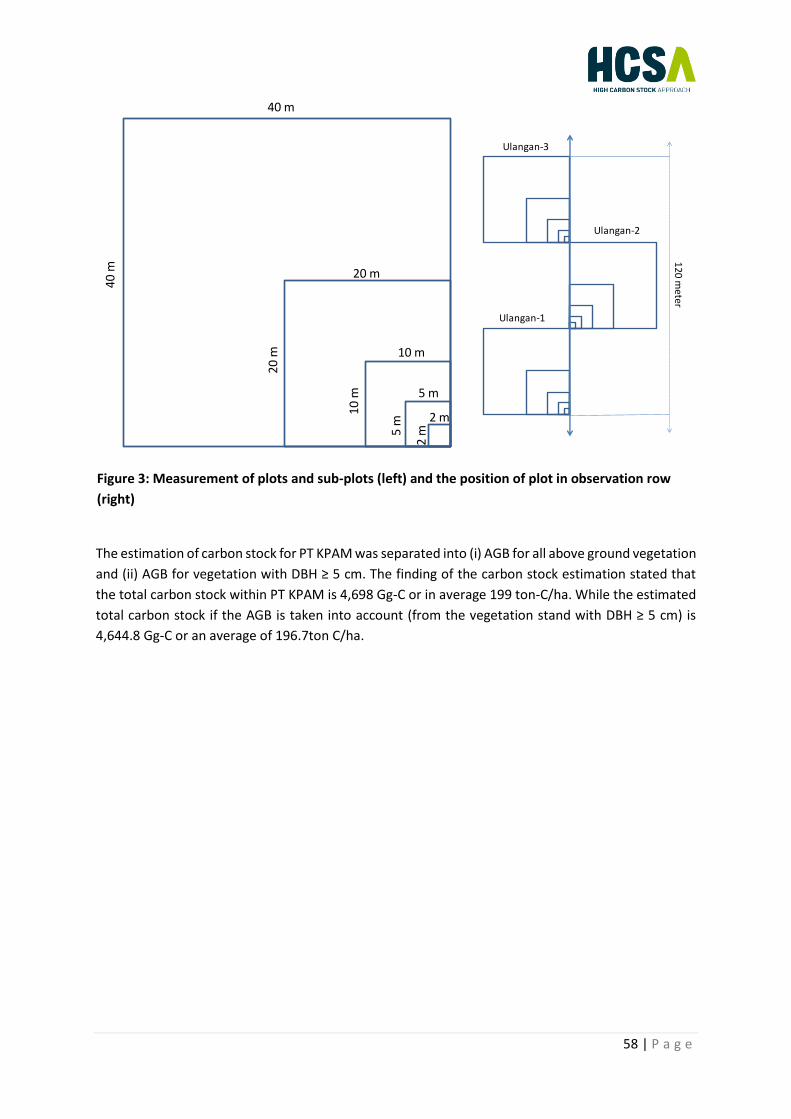
58 | P a g e
Figure 3: Measurement of plots and sub-plots (left) and the position of plot in observation row
(right)
The estimation of carbon stock for PT KPAM was separated into (i) AGB for all above ground vegetation
and (ii) AGB for vegetation with DBH ≥ 5 cm. The finding of the carbon stock estimation stated that
the total carbon stock within PT KPAM is 4,698 Gg-C or in average 199 ton-C/ha. While the estimated
total carbon stock if the AGB is taken into account (from the vegetation stand with DBH ≥ 5 cm) is
4,644.8 Gg-C or an average of 196.7ton C/ha.
40 m4
0 m
20
m
10
m
5 m
2m
20 m
10 m
5 m
2 m
Ulangan-1
Ulangan-2
Ulangan-3
12
0 m
eter
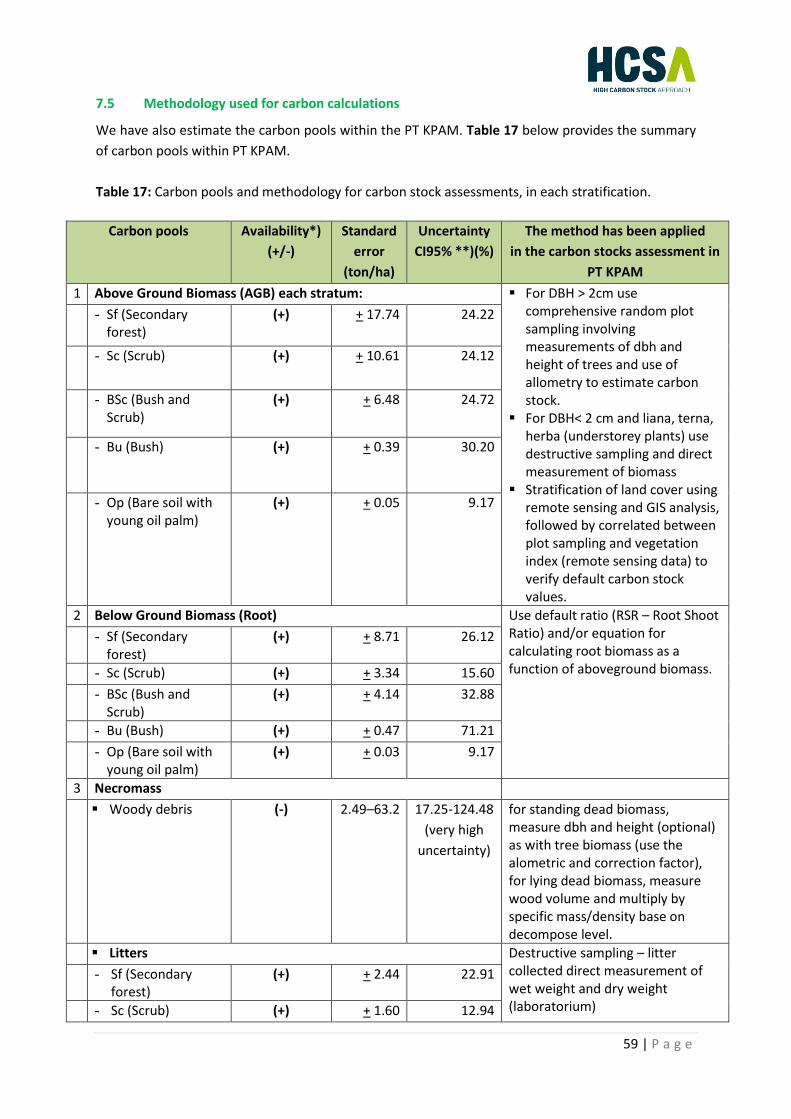
59 | P a g e
7.5 Methodology used for carbon calculations
We have also estimate the carbon pools within the PT KPAM. Table 17 below provides the summary
of carbon pools within PT KPAM.
Table 17: Carbon pools and methodology for carbon stock assessments, in each stratification.
Carbon pools Availability*)
(+/-)
Standard
error
(ton/ha)
Uncertainty
CI95% **)(%)
The method has been applied
in the carbon stocks assessment in
PT KPAM
1 Above Ground Biomass (AGB) each stratum: ▪ For DBH > 2cm use comprehensive random plot sampling involving measurements of dbh and height of trees and use of allometry to estimate carbon stock.
▪ For DBH< 2 cm and liana, terna, herba (understorey plants) use destructive sampling and direct measurement of biomass
▪ Stratification of land cover using remote sensing and GIS analysis, followed by correlated between plot sampling and vegetation index (remote sensing data) to verify default carbon stock values.
- Sf (Secondary forest)
(+) + 17.74 24.22
- Sc (Scrub) (+) + 10.61 24.12
- BSc (Bush and Scrub)
(+) + 6.48 24.72
- Bu (Bush) (+) + 0.39 30.20
- Op (Bare soil with young oil palm)
(+) + 0.05 9.17
2 Below Ground Biomass (Root) Use default ratio (RSR – Root Shoot Ratio) and/or equation for calculating root biomass as a function of aboveground biomass.
- Sf (Secondary forest)
(+) + 8.71 26.12
- Sc (Scrub) (+) + 3.34 15.60
- BSc (Bush and Scrub)
(+) + 4.14 32.88
- Bu (Bush) (+) + 0.47 71.21
- Op (Bare soil with young oil palm)
(+) + 0.03 9.17
3 Necromass
▪ Woody debris (-) 2.49–63.2 17.25-124.48
(very high
uncertainty)
for standing dead biomass, measure dbh and height (optional) as with tree biomass (use the alometric and correction factor), for lying dead biomass, measure wood volume and multiply by specific mass/density base on decompose level.
▪ Litters Destructive sampling – litter collected direct measurement of wet weight and dry weight (laboratorium)
- Sf (Secondary forest)
(+) + 2.44 22.91
- Sc (Scrub) (+) + 1.60 12.94

60 | P a g e
Carbon pools Availability*)
(+/-)
Standard
error
(ton/ha)
Uncertainty
CI95% **)(%)
The method has been applied
in the carbon stocks assessment in
PT KPAM
- BSc (Bush and Scrub)
(+) + 1.16 29.76
- Bu (Bush) (+) + 0.07 7.01
- Op (Bare soil) (+) + 4.60 46.36
4 Soil Carbon (+) + 9.60 9.70 Based on the results of the peat mapping assessment by the grid sampling method (Collected the soil physical properties such as bulk density, peat thickness, depth, peat maturity etc. and soil chemical properties such as c-organic content, ash content, C/N ratio etc.)
*) Availability to calculate carbon stocks in the area of PT KPAM (+) available and (-) un-available; **) Uncertainty for confidence level 95% The highest carbon source is contributed by peatland (1,676.4 Gg-C) and followed by mineral soil
(2,341.8 Gg-C) which amounts to 86.5% of the total carbon stock within PT KPAM. Table 18 and 19
provide the total carbon stock from carbon pools available within PT KPAM.
Table 18: Total carbon stock based on carbon pools and land cover of PT KPAM in 2014 (Mg C)
Carbon pools*) Carbon stock of PT KPAM (Gg-C) by Stratum/Land cover**) Total
Sf Sc BSc Bu Op Wb Nd
Area (ha) 2,706.2 5,152.9 5,543.0 5,304.6 4,325.4 475.5 106.2 23,613.8
Above Ground Biomass
165.3 117.0 75.7 3.5 1.1 - - 362.5
Below Ground Biomass
73.5 52.9 34.3 1.7 0.5 - - 163.0
Necromass – Litters
27.1 59.9 20.3 4.9 42.1 - - 154.3
Peat Soil- thickness :
657.6 514.3 425.9 30.2 48.4 - - 1,676.4
50-100 cm 291.8 289.4 81.2 30.1 20.2 - - 712.6
100-200 cm 122.1 156.1 93.2 0.1 4.2 - - 375.7
200-300 cm 90.7 50.4 118.1 0.0 2.4 - - 261.6
300-400 cm 105.7 13.3 100.1 0.0 13.1 - - 232.1
400-500 cm 47.3 5.1 33.4 0.0 8.6 - - 94.4
Mineral Soil 97.6 433.1 598.2 669.3 543.6 - - 2,341.8
Grand Total (Gg C)
1,021.2 1,177.1 1,154.5 709.5 635.7 - - 4,698.0
Average (Mg-C/ha)
377.4 228.4 208.3 133.8 147.0 - - 199.0
*) Not include woody debris, **) Sf (Secondary forest), Sc (Shrub), BSc (Bush and Shrub), Bu (Bush), Op (Bare soil/open land), Wb (Water body) and Nd (no data)

61 | P a g e
Table 19: Total carbon stock based on carbon pools and land cover of PT KPAM in 2014 (Mg C) if the AGB is based only on the vegetation with DBH ≥ 5 cm.
Carbon pools*) Carbon stock of PT KPAM (Gg-C) by Stratum/Land cover**)
Total Sf Sc BSc Bu Op Wb Nd
Area (ha) 2,706.2 5,152.90 5,543.00 5,304.60 4,325.40 475.5 106.2 23,613.80
Above Ground Biomass with DBH>5cm
150.4 108.8 49.9 0.2 0.0 - - 309.3
Below Ground Biomass
73.5 52.9 34.3 1.7 0.5 - - 163.0
Necromass – Litters 27.1 59.9 20.3 4.9 42.1 - - 154.3
Peat Soil- thickness: 657.6 514.3 425.9 30.2 48.4 - - 1,676.4
50-100 cm 291.8 289.4 81.2 30.1 20.2 - - 712.6
100-200 cm 122.1 156.1 93.2 0.1 4.2 - - 375.7
200-300 cm 90.7 50.4 118.1 0.0 2.4 - - 261.6
300-400 cm 105.7 13.3 100.1 0.0 13.1 - - 232.1
400-500 cm 47.3 5.1 33.4 0.0 8.6 - - 94.4
Mineral Soil 97.6 433.1 598.2 669.3 543.6 - - 2,341.8
Grand Total (Gg C) 1,006.3 1,168.9 1,128.7 706.2 634.7 - - 4,644.8
Average (Mg-C/ha) 371.9 226.9 203.6 133.1 146.7 - - 196.7
*) Not include woody debris, **) Sf (Secondary forest), Sc (Shrub), BSc (Bush and Shrub), Bu (Bush), Op (Bare
soil/open land), Wb (Water body) and Nd (no data)

62 | P a g e
7.6 Indicative photos of each vegetation class
(i) YRF
(ii) YRF
(iii) Shrub
(iv) Bush/grass
(v) Bare land
(vi) Bare land
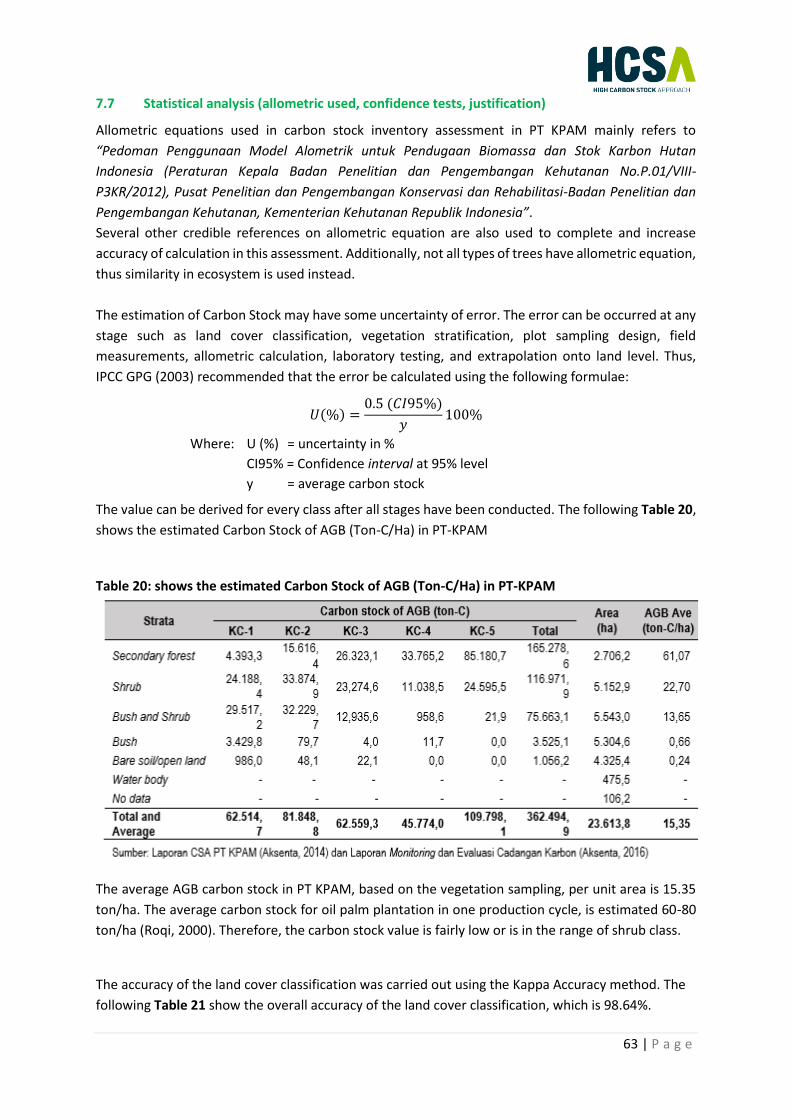
63 | P a g e
7.7 Statistical analysis (allometric used, confidence tests, justification)
Allometric equations used in carbon stock inventory assessment in PT KPAM mainly refers to
“Pedoman Penggunaan Model Alometrik untuk Pendugaan Biomassa dan Stok Karbon Hutan
Indonesia (Peraturan Kepala Badan Penelitian dan Pengembangan Kehutanan No.P.01/VIII-
P3KR/2012), Pusat Penelitian dan Pengembangan Konservasi dan Rehabilitasi-Badan Penelitian dan
Pengembangan Kehutanan, Kementerian Kehutanan Republik Indonesia”.
Several other credible references on allometric equation are also used to complete and increase
accuracy of calculation in this assessment. Additionally, not all types of trees have allometric equation,
thus similarity in ecosystem is used instead.
The estimation of Carbon Stock may have some uncertainty of error. The error can be occurred at any
stage such as land cover classification, vegetation stratification, plot sampling design, field
measurements, allometric calculation, laboratory testing, and extrapolation onto land level. Thus,
IPCC GPG (2003) recommended that the error be calculated using the following formulae:
𝑈(%) =0.5 (𝐶𝐼95%)
𝑦100%
Where: U (%) = uncertainty in %
CI95% = Confidence interval at 95% level
y = average carbon stock
The value can be derived for every class after all stages have been conducted. The following Table 20,
shows the estimated Carbon Stock of AGB (Ton-C/Ha) in PT-KPAM
Table 20: shows the estimated Carbon Stock of AGB (Ton-C/Ha) in PT-KPAM
The average AGB carbon stock in PT KPAM, based on the vegetation sampling, per unit area is 15.35
ton/ha. The average carbon stock for oil palm plantation in one production cycle, is estimated 60-80
ton/ha (Roqi, 2000). Therefore, the carbon stock value is fairly low or is in the range of shrub class.
The accuracy of the land cover classification was carried out using the Kappa Accuracy method. The
following Table 21 show the overall accuracy of the land cover classification, which is 98.64%.

64 | P a g e
Table 21: The overall accuracy of the land cover classification
7.8 Summary of statistical analysis of carbon stock results per vegetation class
Table 22: Summary of statistical analysis of carbon stock results per vegetation class
Land cover class Number of Plots
Stems per
hectare
Basal Area
Average Carbon Stocks
Standard error of
the mean
Confidence limits (90%)
Lower Upper
Open Land 21 0.24 0.05 0.19 0.29
Scrub 49 7.30 6.48 0.82 13.78
Young Regenerating Forest
7 22.7 10.61 12.09 33.31
Low Density Forest - - - - -
Medium Density Forest
- - - - -
High Density Forest - - - - -

65 | P a g e
7.9 Forest inventory results
The following table show the average of carbon value based on the result of the Forest Inventory
Table 23: Forest inventory class
Land cover class
Average carbon value
Physical description of the land cover, e.g. species mix, forest type (pioneer, regenerating, primary etc.), diameter distribution, structural indices, maturity indices, etc.
Open Land 0.24 This area is grassland, burnt bushes, and dessert. Types of grass found are Digitaria sp, Eragrotis sp, and Kyllinga sp.
Scrub 7.30 Vegetation diversity with DBH > 2 cm, categorizes as low-medium with Shannon-Wienner average index 1.3 (0.8-2.1). Relatively dry areas have lower diversity than relatively wet areas. Types with relatively high density are kenasian (Zyzygium zeylanicum) and pansulan (Pternandra coerulescens). In this area, there are ferns, Eleocharis dulcis, croissant grass (Cyperus sp), and several seedling groups with DBH < 2 cm, such as Alstonia scholaris and Macaranga pruinosa.
Young Regenerating Forest
22.70 There are peat area in the north-west of study area. Plant biodiversity in this area is categorized as medium with Shannon-Wiener diversity index 1.69 (1.39-1.99) and there are 19 types of trees with DBH > 2 cm. Dominant vegetations are Melanorrhoea wallichii, Madhuca motleyana, Combretocarpus rotundatus, and Ploiarium alternifolium.
Low Density Forest
- -
Medium Density Forest
- -
High Density Forest
- -

66 | P a g e
8. Land Cover Classification
8.1 Refined land cover map with title, date, legend and any HCS forest patches identified
Map 18. Land cover and HCS patch area in the company’s agricultural licensed area

67 | P a g e
9. Patch Analysis Result
9.1 Results of Decision Tree
Due to overlapping HCS patch areas or connectivity with other conservation areas, such as peat and
HCV, based on the HCS Patch Analysis Decision Tree (refer to Table 16) the analysis step is
recommended to proceed to stage 11 from stage 4. Therefore, the process of Pre-RBA and RBA is no
longer needed to be conducted. All the patch areas are indicated as conservation area.
Table 24: The HCS Patch Analysis Decision Tree
No Step Notes
1 Identify customary use areas, enclave community garden land and overlay HCV areas, peatlands and other areas of concern
There is no customary community area that is being identify in the HCV areas
2 Extract all HCS forest classes and merge physically-connected patches
There is no HCS patches are physically connected to each other they are merged to form one patch.
3 Identify patch core and prioritise patches There are no Low and Medium Priority patches that create connectivity between High Priority patches.
4 Connect High Priority patches Due to overlapping HCS patch area or connectivity with other conservation areas, such as peat and HCV, patch analysis is proceeded to stage 11
5 Connect Medium and Low Priority patches to High Priority patches
N/A
6 Separate Medium and Low Priority Patches N/A
7 Risk assessment N/A
8 Review of presence of LDF, MDF or HDF in Medium Priority patches
N/A
9 Rapid Biodiversity Assessment Pre-check N/A
10 Rapid Biodiversity Assessment (RBA) N/A
11 Ground check Community land in this area
12 Integration and conservation planning: Boundary adjustments; integration with HCV, peatland, and riparian zones; and final mapping and conservation planning with HCS forest areas
The output of this exercise is shown in ICLUP Map.
The aim here is to produce a conservation plan that integrates all set-aside categories (community protected areas, HCV, HCS, riparian, peatlands, etc.) and has the highest likelihood of ecological viability
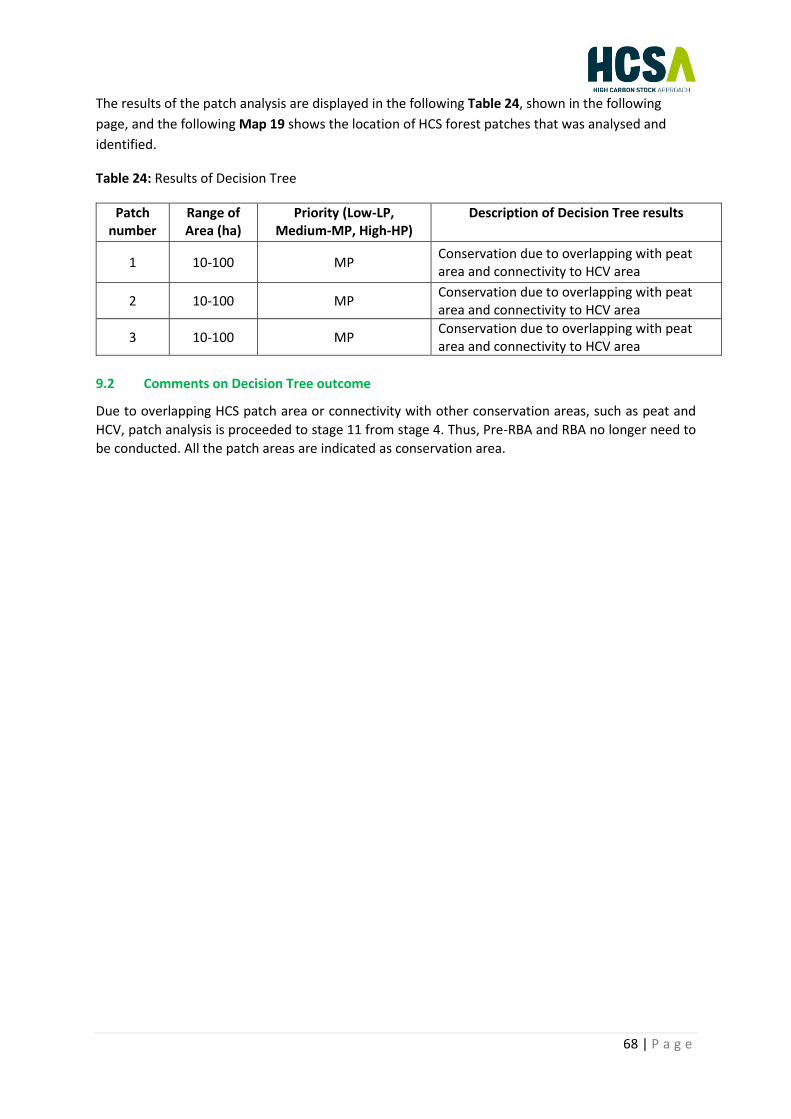
68 | P a g e
The results of the patch analysis are displayed in the following Table 24, shown in the following
page, and the following Map 19 shows the location of HCS forest patches that was analysed and
identified.
Table 24: Results of Decision Tree
Patch number
Range of Area (ha)
Priority (Low-LP, Medium-MP, High-HP)
Description of Decision Tree results
1 10-100 MP Conservation due to overlapping with peat area and connectivity to HCV area
2 10-100 MP Conservation due to overlapping with peat area and connectivity to HCV area
3 10-100 MP Conservation due to overlapping with peat area and connectivity to HCV area
9.2 Comments on Decision Tree outcome
Due to overlapping HCS patch area or connectivity with other conservation areas, such as peat and
HCV, patch analysis is proceeded to stage 11 from stage 4. Thus, Pre-RBA and RBA no longer need to
be conducted. All the patch areas are indicated as conservation area.
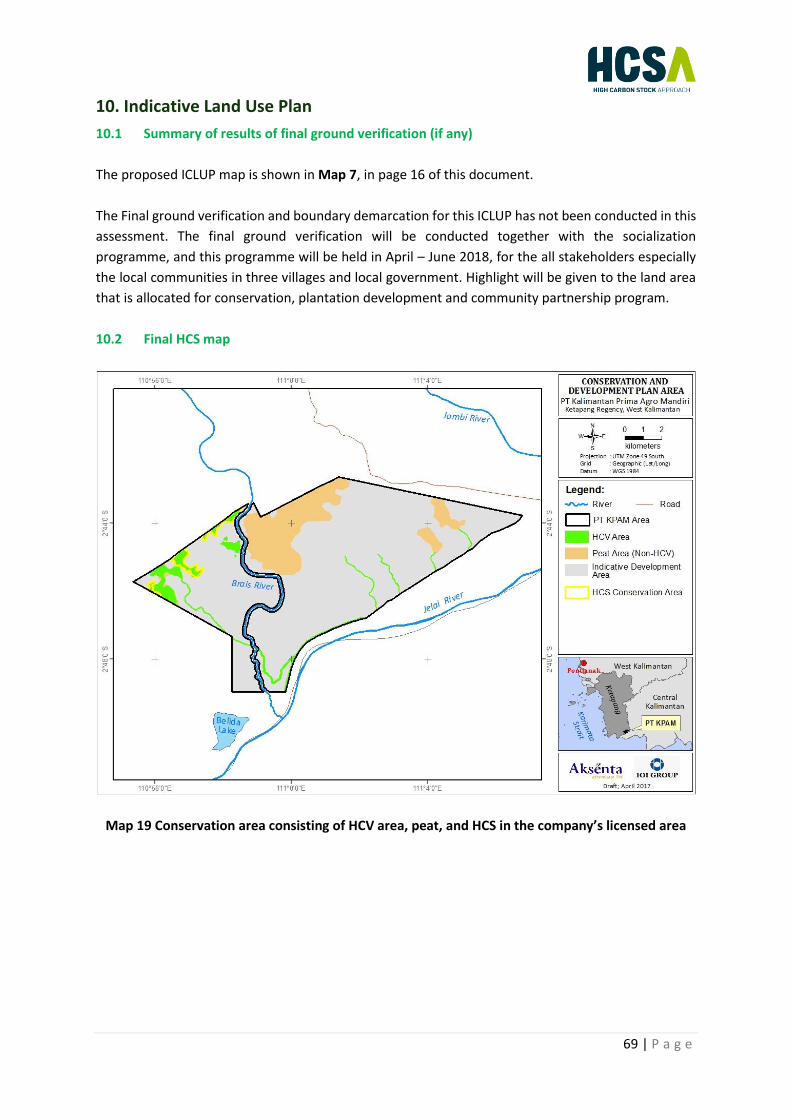
69 | P a g e
10. Indicative Land Use Plan
10.1 Summary of results of final ground verification (if any)
The proposed ICLUP map is shown in Map 7, in page 16 of this document.
The Final ground verification and boundary demarcation for this ICLUP has not been conducted in this
assessment. The final ground verification will be conducted together with the socialization
programme, and this programme will be held in April – June 2018, for the all stakeholders especially
the local communities in three villages and local government. Highlight will be given to the land area
that is allocated for conservation, plantation development and community partnership program.
10.2 Final HCS map
Map 19 Conservation area consisting of HCV area, peat, and HCS in the company’s licensed area

70 | P a g e
10.3 Overview of forest conservation management and monitoring activities to be included in
the Conservation and Development (land use) Plan
Management for the HCS areas is recommended to be integrated with the management plan for HCV
areas and peat areas. Other environment management requirement such as RKL/RPL will be also need
integration. This include the demarcation of the conservation areas, such as (i) HCS area, (ii) HCV areas,
(iii) Peat areas, and (iv) HVC Management areas should be carried out on the ground with the presence
of local community and local officials from the government.
Socialization and collaboration with relevant other stakeholders at a landscape level also important in
order to implement the HCS Management Plan. HCS Management and Mitigation Measures will be
based on the following Management Plan, shown in Table 25, 26, 27 and 28.
10.4 List of activities still to be carried out before Conservation and Development Plan can be
finalised
• Finalising the SOP on management and monitoring conservation areas, including HCV, HCS, and peat areas;
• Finalizing SOP on fire prevention and fire alert rapid response;
• Provide capacity building and training that is needed for workers and the company’s staffs.
• Equip the “Implementation Field Team” with adequate equipment and devices for better
implementation of the management plan.
• Implement patrolling activities to protect and conserve the HCV areas, HCS areas and peat areas,
from any illegal encroachment and land fires.
Table 25: Management Plan to achieve Goal 3 - Status of RTE and endemic species (population /
distribution) is determined & conservation measures is in place.
No Objective(s) Action(s) Activities Milestones Indicators
3.1 Status of RTE Species is documented for monitoring purposes.
Monitor the presence of RTE and endemic species within the HCV areas and plantations concession periodically
Conduct baseline data for the RTE and endemic species through standard survey programme
Baseline data on RTE and endemic species is established
Report of the survey and monitoring programme.
Establish permanent plot or transect line to monitor of the presence / trend and status of RTE and endemic species
Permanent transect line is established
Monitoring report based on the permanent transect line
Identify key habitat for keystone species such orangutan, proboscis, gibbon and other indicator(s) species (clouded leopard and sun bear)
Key habitat for keystone species is mapped
Survey and Mapping report in each of the forest habitat (HC1 and HCV3)

71 | P a g e
3.2 Zero hunting and illegal encroachment (logging) activities in the key habitat.
Effective Enforcement Programme using SMART Patrol is in place.
Recruit and train manpower to carry out the SMART Patrol programme
Effective SMART programme in place
Manpowers and Equipment
Identify area that is prone to hunting and illegal felling of tree activities.
All conservation and protected area (containing HCV1) has been demarcated and signboard is in place.
Signboards are in place in all HCV1 area.
Conduct the patrolling activities systematically in the core areas for illegal hunting and felling of tree activities (and illegal collection of the Nepenthes species in the HCV areas)
Enforcement is implemented consistently
Reporting System (including month report)
Table 26: Management Plan to ensure Key Habitat and important ecosystem is managed and
conserved sustainably.
No Objective(s) Action(s) Activities Milestones Indicators
4.1 Management and conservation action of the degraded forest habitat (peat, buffer zone, key wildlife habitat (HCV1 and HCV3) is established.
Determine which area to be rehabilitated and conduct tree planting in the determined areas.
Identify and Map the degraded forest / habitat using LIDAR Data and prepare work plan to rehabilitate the degraded areas.
Degraded habitat is determined and warplane for each degraded area is developed
Map and work plan
Setup tree seedling (indigenous and local species) nursery to cater forest rehabilitation programme
Nursery is established
Nursery and tree seedling
Tree planting conducted in some degraded areas such as peat, buffer zone, key wildlife habitat (HCV1 and HCV3)
Tree planting is initiated based on the work plan
Reports and relevant photos
Record the mortality of the planted tree seedling (using plot sampling) to monitor the performance and effectiveness of the tree planting programme
Mortality rate for the tree planting in each forest type/condition is documented
Report of mortality rate.
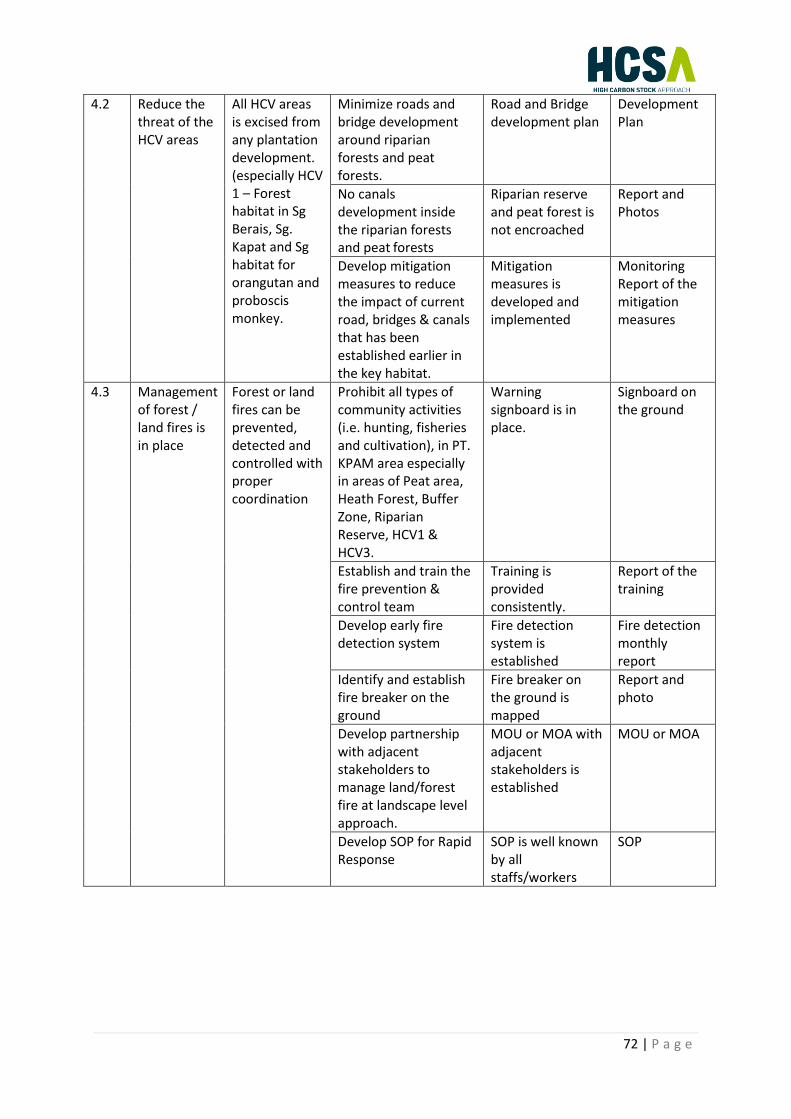
72 | P a g e
4.2 Reduce the threat of the HCV areas
All HCV areas is excised from any plantation development. (especially HCV 1 – Forest habitat in Sg Berais, Sg. Kapat and Sg habitat for orangutan and proboscis monkey.
Minimize roads and bridge development around riparian forests and peat forests.
Road and Bridge development plan
Development Plan
No canals development inside the riparian forests and peat forests
Riparian reserve and peat forest is not encroached
Report and Photos
Develop mitigation measures to reduce the impact of current road, bridges & canals that has been established earlier in the key habitat.
Mitigation measures is developed and implemented
Monitoring Report of the mitigation measures
4.3 Management of forest / land fires is in place
Forest or land fires can be prevented, detected and controlled with proper coordination
Prohibit all types of community activities (i.e. hunting, fisheries and cultivation), in PT. KPAM area especially in areas of Peat area, Heath Forest, Buffer Zone, Riparian Reserve, HCV1 & HCV3.
Warning signboard is in place.
Signboard on the ground
Establish and train the fire prevention & control team
Training is provided consistently.
Report of the training
Develop early fire detection system
Fire detection system is established
Fire detection monthly report
Identify and establish fire breaker on the ground
Fire breaker on the ground is mapped
Report and photo
Develop partnership with adjacent stakeholders to manage land/forest fire at landscape level approach.
MOU or MOA with adjacent stakeholders is established
MOU or MOA
Develop SOP for Rapid Response
SOP is well known by all staffs/workers
SOP
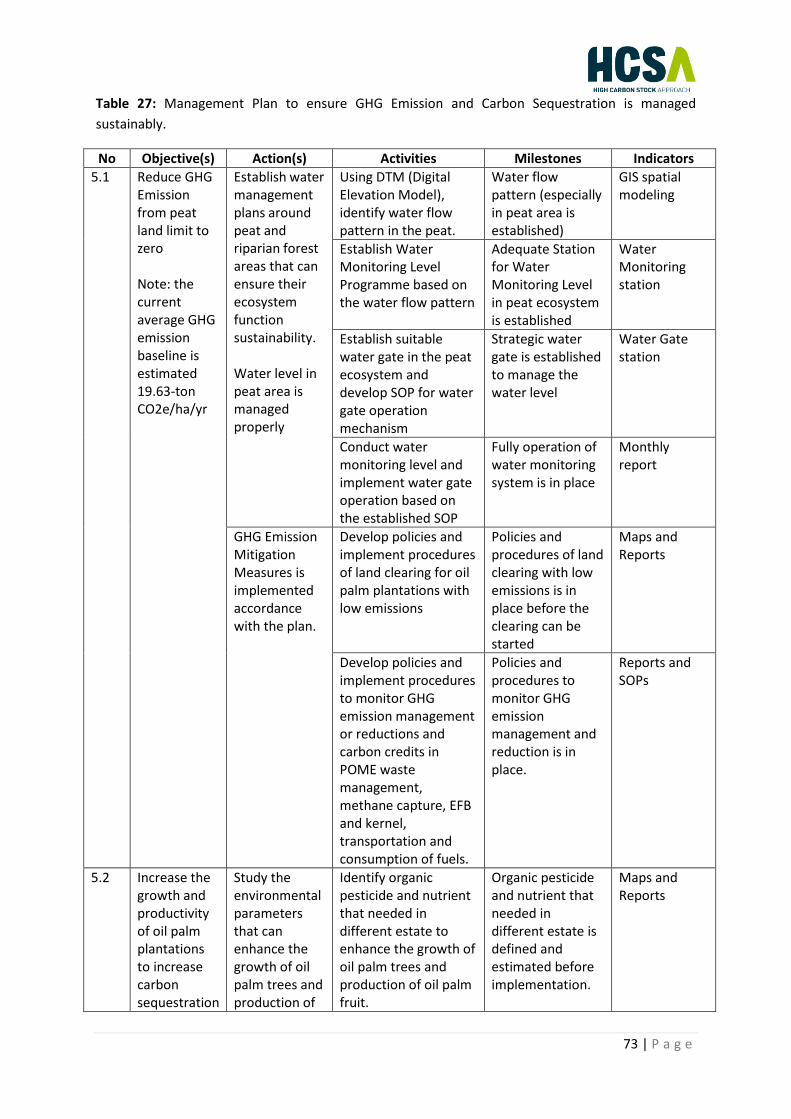
73 | P a g e
Table 27: Management Plan to ensure GHG Emission and Carbon Sequestration is managed
sustainably.
No Objective(s) Action(s) Activities Milestones Indicators
5.1 Reduce GHG Emission from peat land limit to zero Note: the current average GHG emission baseline is estimated 19.63-ton CO2e/ha/yr
Establish water management plans around peat and riparian forest areas that can ensure their ecosystem function sustainability. Water level in peat area is managed properly
Using DTM (Digital Elevation Model), identify water flow pattern in the peat.
Water flow pattern (especially in peat area is established)
GIS spatial modeling
Establish Water Monitoring Level Programme based on the water flow pattern
Adequate Station for Water Monitoring Level in peat ecosystem is established
Water Monitoring station
Establish suitable water gate in the peat ecosystem and develop SOP for water gate operation mechanism
Strategic water gate is established to manage the water level
Water Gate station
Conduct water monitoring level and implement water gate operation based on the established SOP
Fully operation of water monitoring system is in place
Monthly report
GHG Emission Mitigation Measures is implemented accordance with the plan.
Develop policies and implement procedures of land clearing for oil palm plantations with low emissions
Policies and procedures of land clearing with low emissions is in place before the clearing can be started
Maps and Reports
Develop policies and implement procedures to monitor GHG emission management or reductions and carbon credits in POME waste management, methane capture, EFB and kernel, transportation and consumption of fuels.
Policies and procedures to monitor GHG emission management and reduction is in place.
Reports and SOPs
5.2 Increase the growth and productivity of oil palm plantations to increase carbon sequestration
Study the environmental parameters that can enhance the growth of oil palm trees and production of
Identify organic pesticide and nutrient that needed in different estate to enhance the growth of oil palm trees and production of oil palm fruit.
Organic pesticide and nutrient that needed in different estate is defined and estimated before implementation.
Maps and Reports

74 | P a g e
oil palm fruit.
5.3 Zero clearance of the High Carbon Stock areas.
HCV1, HCV3 and HCV4 Conservation areas, including areas that overlaying peat land ( >300 cm only) and carbon stock from AGB > 40 ton C/ha within PT KPAM
HCV1, HCV3 and HCV4 Conservation areas, including areas that overlaying peat land ( >300 cm only) is demarcated in the ground and management plan (conservation and protection programme) is implemented. Refer to activity no 3.2, 4.1, 4.2 and 4.3
Refer to milestones no 3.2, 4.1, 4.2 and 4.3
Maps and Progress Reports
Table 28: Management Plan to ensure Landscape Management Committee is established to manage
the HCV/HCS at landscape level
No Objective(s) Action(s) Activities Milestones Indicators
6.1 Long-term and short term of the Landscape Management Approach is identified
Policy Direction document (for the “Landscape Management Approach” is developed
Prepare Policy Direction Document for the Landscape Management Approach
Policy Direction Document t is agreed by key stakeholders
Policy Direction Document (including relevant maps)
6.2 Landscape Management Approach is supported by key stakeholders
Identify key stakeholders and define their role and fund to implement the
Develop scope of work for (i) Protection, (ii) Rehabilitation, (iii) Securing Corridor for HCV and HCS; (iv) Community Development Programme (v) Fire Prevention, Control and Rapid Response Programme; (vii) Water zonation management and water/riverine catchment management.
Standard management measures and reporting system is established based on the scope of work.
Minutes of Meetings

75 | P a g e
6.3 Implementation and of the “Landscape Management Approach” Plan
MOU to manage the Landscape Management Approach is developed and signed
Scope of work, funding mechanism, standard reporting and monitoring system is presented and agreed by all stakeholders (members of the Landscape Management Approach)
MOU is signed before implementation on the ground
MOU and quarterly report
6.4 Ecological corridors for all HCV / HCS is secured and managed sustainably.
All key stakeholders agree to re-establish the key ecological corridor connecting all the HCV/HCS at a landscape level
Each of the stakeholders Identify key ecological corridor connecting all the HCV/HCS
Map showing all the HCV/HCS, buffer zones, riparian reserves, peat forest and heath forest, including key corridor is established
Map and action plan to secure and manage the key ecological corridor
6.5 Implementation a forest monitoring and prevention at a landscape level.
Platform to share information and manage forest /land fire is established at a landscape level
Each of the stakeholders Identify key area / hotspot for fires and develop rapid response programme that is supported by all stakeholders
Map showing forest / land fire hotspot and rapid response SOP
Rapid Response document, SOP and monthly reporting.
6.6 Implementation a water level and quality monitoring at a landscape level.
Platform to share information and manage water and riverine ecosystem is established at a landscape level
Each of the stakeholders Identify key area / hotspot for potential water/riverine pollution and solution to monitor and address the threat.
Water Zonation management and riverine ecosystem management plan at a landscape level is established
Water Zonation management and riverine ecosystem management plan
76 | P a g e
REFERENCES
1. HCS Forest Patch Analysis Decision Tree, y Grant Rosoman, Greenpeace and Rob McWilliam, TFT.
2. THE HCS APPROACH Putting No Deforestation into Practice, Integration of High Conservation
Values (HCV), High Carbon Stock (HCS) Forest and Free, Prior and Informed Consent (FPIC), Module
3, Ver 2, May 2017.
3. THE HCS APPROACH Putting No Deforestation into Practice, High carbon stock forest Patch
analysis and Protection, Module 5, Ver 2, May 2017.
4. THE HCS APPROACH Putting No Deforestation into Practice, Forest and vegetation stratification,
Module 4, Ver 2, May 2017.
5. THE HCS APPROACH Putting No Deforestation into Practice, The HCS Approach: an introduction,
overview and summary, Module 1, Ver 2, May 2017.
6. THE HCS APPROACH Putting No Deforestation into Practice, Social requirements, Module 1, Ver
2, May 2017.
7. Analisis Dampak Lingkungan Hidup (ANDAL) – Pembangunan Perkebunan dan Pabrik Pengelolaan
Kelapa Sawit, di Desa Danau Buntar Kec. Kendawangan, Desa Suka ramai dan desa Jambi Kec.
Manis mata, Kabupaten Ketapang. PT Kalimantan Prima Agro Mandiri. 2015.
8. Laporan Kajian HCV, PT Kalimantan Prima Agro Mandiri, Kabupaten Ketapang, Kalimantan Barat,
Indonesia, Aksenta, Februari 2017.
9. Analisis Perubahan Penggunaan Lahan, PT Kalimantan Prima Agro Mandiri, Kabupaten Ketapang,
Kalimantan Barat, Indonesia, Aksenta, October 2017.
10. Laporan Kajian Dampak Sosial, PT Kalimantan Prima Agro Mandiri, Kabupaten Ketapang,
Kalimantan Barat, Indonesia, Aksenta, Oktober 2017.
11. FPIC Verification Report – Kajian High Carbon Stock, PT Kalimantan Prima Agro Mandiri,
Kabupaten Ketapang, Kalimantan Barat, Indonesia, Aksenta, April 2016.
12. Kerangka Acuan, Analisis Dampak Lingkungan Hidup (KA-ANDAL), PT Kalimantan Prima Agro
Mandiri, Kabupaten Ketapang, Kalimantan Barat, Indonesia, 2015.
13. Public Summary Report High Conservation Value Assessment, PT Kalimantan Prima Agro Mandiri,
Kabupaten Ketapang, Kalimantan Barat, Indonesia, Aksenta, February 2016.
14. Rencana Pengelolaan dan Pemantauan Lingkungan Hidup (RKL-RPL), Pembangunan Perkebunan
dan Pabrik Pengelolaan Kelapa Sawit, di Desa Danau Buntar Kec. Kendawangan, Desa Suka ramai
dan desa Jambi Kec. Manis mata, Kabupaten Ketapang. PT Kalimantan Prima Agro Mandiri. 2015.

77 | P a g e
15. Laporan Kajian Evaluasi Kesuaian Lahan Rencana Perkebunan Kelapa Sawit, PT Kalimantan Prima
Agro Mandiri, Kabupaten Ketapang, Kalimantan Barat, Indonesia, Aksenta, September 2016.
16. Soil Taxonomy A Basic System of Soil Classification for Making and Interpreting Soil Survey, 2nd
edition 1999.