Embed Size (px)
Citation preview

1
North Santiam River downstream from Detroit Lake near Niagara at about river mile 57.
Photograph by Casey Lovato, U.S. Geological Survey, June 2011.
Leslie Bach
Jason Nuckols
Emilie Blevins
THE NATURE CONSERVANCY IN OREGON
821 SE 14TH
AVENUE
PORTLAND, OREGON 97214
nature.org/oregon
SUMMARY REPORT:
Environmental Flows Workshop for the Santiam River Basin, Oregon
January 2013

2
This page is intentionally left blank.

3
Summary Report: Environmental Flows
Workshop for the Santiam River Basin, Oregon
Contents
Introduction 4
Background 4
Santiam River 5
Environmental Flow Workshop 6
Workshop Results 10
Fall Flows 10
Winter Flows 11
Spring Flows 12
Summer Flows 14
Flow Recommendations by Reach 16
Recommendations for Future Studies 20
References Cited 22
Appendix A. Workshop Agenda 23
Appendix B. List of workshop attendees 24

4
Introduction
Background
The Willamette River and its tributaries support a rich diversity of aquatic flora and fauna,
including important runs of salmon and steelhead. The river is also home to the majority of
Oregon’s population and provides vital goods and services to the region and beyond. The U.S.
Army Corps of Engineers (USACE) operates 13 dams in the Willamette Basin - 11 multiple
purpose storage reservoirs and 2 regulating reservoirs. All 13 of the dams are located on major
tributaries; there are no USACE dams on the mainstem Willamette River. The dams provide
important benefits to society, including flood risk reduction, hydropower and recreation. At the
same time, the dams have changed the flow conditions in the river with associated effects on
ecosystem processes and native fish and wildlife.
The Willamette River is one of eight demonstration sites within the Sustainable Rivers Program
(SRP), a national partnership between the USACE and The Nature Conservancy (TNC) aimed at
creating a framework for implementing environmental flows downstream of dams. The goal of
the SRP is to identify opportunities to change dam operations to provide more ecologically-based
flows while at the same time meeting human needs and congressionally authorized purposes. The
environmental flow framework is often developed through an iterative process that includes
scientific assessment and expert input to develop the initial flow recommendations. These flow
recommendations are then evaluated by dam operators for feasibility, implemented where
possible, and monitored by scientists to evaluate their effect on the river ecosystem and dam
operations (Tharme, 2003; Acreman and Dunbar, 2004; Richter et al., 2006). This information is
used to refine the initial flow recommendations using an adaptive management approach. Given
that the dams are located on tributaries, the Willamette SRP process was divided into phases, with
flow recommendations determined separately for each of the major tributaries with USACE dams.
Once completed for all tributaries, the recommendations will be combined and opportunities for
system-wide implementation will be evaluated, tested and refined.
As a first step in the Willamette SRP process, a summary report on the flow requirements of key
Willamette species and communities was completed in 2007 (Gregory et al., 2007a). This report
was followed by a flow recommendations workshop focusing on the Coast and Middle Forks of
the Willamette River. The outcome of the workshop was a set of environmental flow
recommendations for the Middle Fork Willamette River below Lookout Point/Dexter dams
(Gregory et al., 2007b), with initial implementation of the recommendations occurring in 2008
through 2012. The implementation of environmental flows on the Middle Fork Willamette
River serves as a pilot for testing and refining the environmental flows process for the entire
Willamette River system, however the results of implementation are still in the initial stages of
review.
In 2008 TNC, USACE, the Eugene Water & Electric Board (EWEB) and the U.S. Geological
Survey (USGS) began an environmental flow study for the McKenzie River, a major tributary of
the Willamette with both USACE and EWEB dams. In 2010 USGS completed a summary report
on the hydrology, geomorphology, and ecology in the McKenzie River basin (Risley et al.,
2010a). This was followed in November of 2010 by an Environmental Flow Recommendations
Workshop for the McKenzie River (Risley et al., 2010b). To date, direct implementation of

5
environmental flows on the McKenzie has not occurred, as additional basinwide analysis is
needed to integrate the environmental flow recommendations across the 13-dam system.
Developing flow recommendations for the Santiam River basin is the final step in the Willamette
flow recommendations process.
Santiam River
The Corps of Engineers operates four dams in the Santiam River basin: Big Cliff and Detroit
Dams on the North Santiam and Foster and Green Peter dams on the South Santiam (Figure 1).
In addition, there are two major water withdrawals in the basin: the City of Salem’s intake on the
North Santiam River at Geren Island, and the City of Albany’s Lebanon-Santiam Canal on the
South Santiam.
To assist scientists in developing environmental flow recommendations, the USGS completed a
summary report on the hydrology and geomorphology in the Santiam River basin (Risley et al.,
2012). The report also evaluated how the streamflow and geomorphology of the river have been
altered by USACE dams and canals over the past 50 years and described the types of flows that
are needed to sustain key ecosystem processes.
Figure 1. Illustration of the Santiam River basin, Oregon, including the major streams, USACE
dams, and gaging stations used in development of flow recommendations and referred to in this
summary report.

6
Environmental Flow Workshop
After Santiam River stakeholders reviewed the USGS report (Risley et al., 2012), the
Conservancy held a flow recommendations workshop (August 30, 2012) at ODFW headquarters
in Salem, Oregon (Appendix A). Approximately 40 persons, from universities, State, Federal,
and local government agencies, and non-governmental organizations attended (Appendix B).
After introductions and technical presentations from TNC, USGS and USACE, the attendees
were divided into three breakout groups: North Santiam, South Santiam and mainstem Santiam
(main channel below the confluence of the North and South Santiam rivers). The groups were
formed from a mix of experts representing major disciplines, including fisheries and aquatic
biota, hydrology, geomorphology and riparian/floodplain ecology. Each group was asked to
develop a full range of flow recommendations that could meet the needs of aquatic species,
channel morphology, and riparian and floodplain processes.
Each breakout group was provided with a facilitator, a note keeper, and a person who operated a
visual computer software program called the Regime Prescription Tool (HEC-RPT). Developed
by USACE and the Conservancy, RPT allows a workshop audience to easily view hydrologic
information and create flow recommendations during discussions
(http://www.hec.usace.army.mil/software/hec-rpt/). As a visual tool, RPT can create a synthetic
annual hydrograph for a reach. Individual flow recommendations can be added (or deleted), and
their magnitudes and durations can also be easily adjusted.
To support development of the flow recommendations, hydrologic data and statistics on pre- and
post- dam streamflow were provided to the breakout groups in the form of summary tables and
plotted hydrographs. The statistics are based on measured and estimated pre- and post-dam daily-
mean streamflow data at specific streamflow gaging stations1. The hydrologic information and
data are described in Tables 1 and 2 and the following text. Additional information, such as
details of analysis methods and summarized low flow data, may be found in Risley et al., 2012.
North Santiam River
The North Santiam River begins high in the Cascade Range near Three Fingered Jack mountain
and flows more than 100 miles before it joins the South Santiam River about 2 miles upstream
from Jefferson. The USACE operates two dams on the North Santiam River: Detroit Dam
located at RM 60.9 and Big Cliff Dam located just three miles downstream from Detroit Dam.
Construction of both dams was completed in 1953. The City of Salem intake is located at RM
31.0, which can divert 227 cubic feet per second (ft3/s), though it does not currently exceed 116
ft3/s. Hydrologic data collected at USGS gaging station 14184100 (North Santiam River at
Greens Bridge near Jefferson, OR at RM 14.6) and USGS gaging station 14183000 (North
Santiam at Mehama, OR at RM 38.7) are used to summarize the conditions from Mehama to
Green’s Bridge. The flow recommendations were developed specifically for Greens Bridge;
however, data from both gages were used to inform development of these recommendations.
1 Refer to Risley et al., 2012, Table 11 for median monthly streamflow statistics for pre- and post-dam flows.

7
South Santiam River
The South Santiam River begins at a lower elevation than the North Santiam in the Western
Cascades, and flows about 70 miles before joining the North Santiam River. The USACE
operates Green Peter Dam located at RM 5.5 on the Middle Santiam and Foster Dam located at
the confluence of the South Santiam and Middle Santiam rivers, 7 miles downstream from Green
Peter Dam at RM 38.5 on the South Santiam River. Construction of both dams was completed in
1968. Another major water project on the South Santiam is the Lebanon-Santiam Canal at RM
20.8, which can divert 25-200 cfs for the City of Albany’s water supply, though it has not been
known to exceed 156 cfs. Hydrologic data collected at USGS gaging station 14187500 (South
Santiam River at Waterloo, OR at RM 23.3) are used to summarize the conditions in the reach
from Foster to Waterloo, with recommendations specific to Waterloo. Recommendations also
generally cover the river downstream of Waterloo to the confluence with the North Santiam.
Mainstem Santiam
From the confluence of the North and South Santiam rivers at Jefferson, the mainstem Santiam
River flows about 9 miles before it joins the Willamette River south of Salem and north of
Albany. Hydrologic data collected at USGS gaging station 14189000 (Santiam River at Jefferson,
OR at RM 9.6) are used to summarize the conditions in this reach.
8
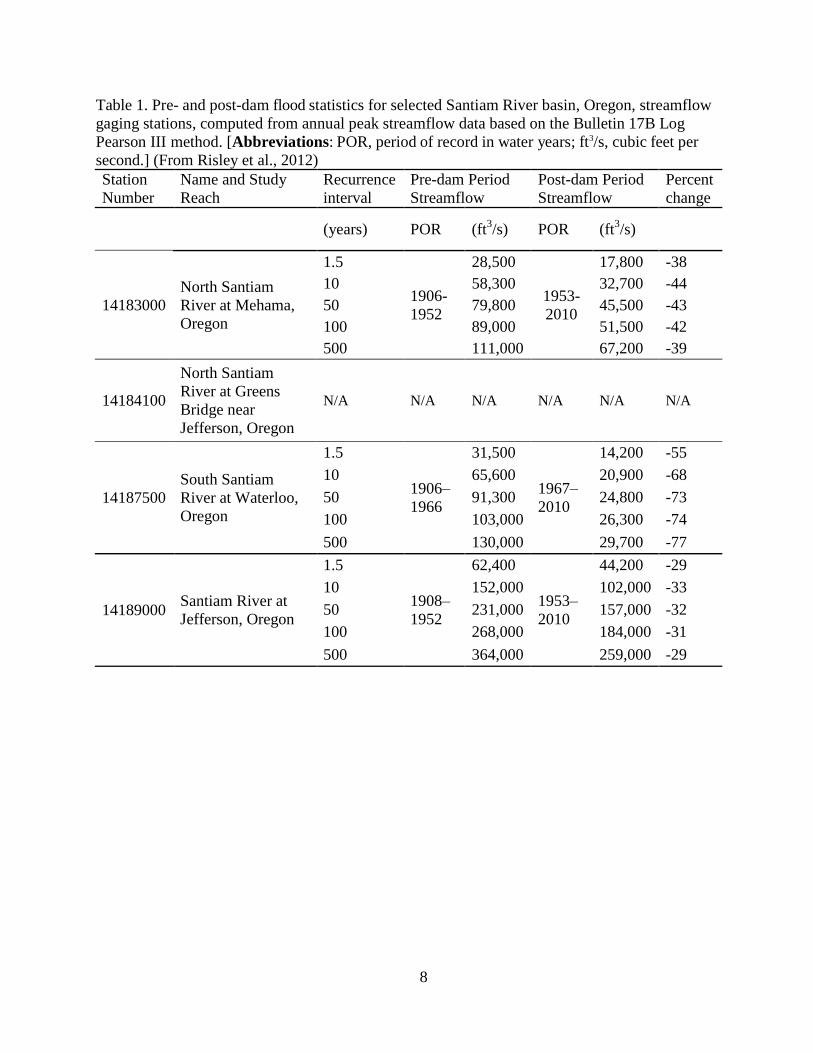
Table 1. Pre- and post-dam flood statistics for selected Santiam River basin, Oregon, streamflow
gaging stations, computed from annual peak streamflow data based on the Bulletin 17B Log
Pearson III method. [Abbreviations: POR, period of record in water years; ft3/s, cubic feet per
second.] (From Risley et al., 2012)
Station
Number
Name and Study
Reach
Recurrence
interval
Pre-dam Period
Streamflow
Post-dam Period
Streamflow
Percent
change
(years) POR (ft3/s) POR (ft
3/s)
14183000
North Santiam
River at Mehama,
Oregon
1.5
1906-
1952
28,500
1953-
2010
17,800 -38
10 58,300 32,700 -44
50 79,800 45,500 -43
100 89,000 51,500 -42
500 111,000 67,200 -39
14184100
North Santiam
River at Greens
Bridge near
Jefferson, Oregon
N/A N/A N/A N/A N/A N/A
14187500
South Santiam
River at Waterloo,
Oregon
1.5
1906–
1966
31,500
1967–
2010
14,200 -55
10 65,600 20,900 -68
50 91,300 24,800 -73
100 103,000 26,300 -74
500 130,000 29,700 -77
14189000 Santiam River at
Jefferson, Oregon
1.5
1908–
1952
62,400
1953–
2010
44,200 -29
10 152,000 102,000 -33
50 231,000 157,000 -32
100 268,000 184,000 -31
500 364,000 259,000 -29

9
Table 2. Flow estimates for selected Santiam River Basin, Oregon, streamflow gaging stations.
All calculations are cubic feet per second (ft3/s). (Adapted from Risley et al., 2012)
Station
Number
Name and Study
Reach Bankfull
Flood
Stage
Extreme
Low-flow
Threshold*
High-flow
Threshold*
2-Year
Flood*
10-Year
Flood*
14183000
North Santiam
River at Mehama,
Oregon
17,000 30,500 685 4,270 35,400 53,900
14184100
North Santiam
River at Greens
Bridge near
Jefferson, Oregon
18,000 N/A 767 4,780 39,600 60,400
14187500
South Santiam
River at Waterloo,
Oregon
18,000 25,700 223 3,980 35,800 59,100
14189000 Santiam River at
Jefferson, Oregon 35,000 55,900 551 10,100 85,000 144,000
*Indicators of Hydrologic Alteration (IHA) statistics based on the estimated unregulated flow time series from
Risley et al., 2012

10
Workshop Results
Fall Flows
Description of Flows and Conditions of Implementation:
Early fall is historically a low flow period during the annual hydrograph. As fall progresses,
evapotranspiration decreases and watershed soil moisture is replenished after summer drought.
Flood flows are historically rare before late November. Fall flow recommendations include
minimum and maximum flow objectives for September and October. According to the
Willamette Biological Opinion (NMFS 2008), the reservoir release flow rate after October 15th
(spring Chinook incubation period) is not as critical as the release flow rate prior to October 15th
(spring Chinook spawning period), when flows provide essential access to spawning gravels.
Flows higher than those recommended are acceptable if they are sustained through the season to
avoid dewatering of redds. Fall pulses are beneficial for creating and maintaining chub habitat,
but don’t necessarily need to happen during the Chinook spawning window. Recommended
flows are shown in Table 3.
Ecosystem Objectives:
Allow access to appropriate gravels for building redds; these gravels are now more likely
to be found on the channel margins due to the modifications to sediment supply and
transport associated with the dams.
Maintain flows within the recommended minimum and maximums to avoid both
dewatering and washing out redds during spawning
Provide minimum flows to benefit chub by maintaining minimum slough volumes
Allow juvenile Chinook movement downstream, adult Chinook movement upstream and
cutthroat movement into tributaries
Maintain appropriate spawning temperatures
Table 3. Fall flow recommendations for all three reaches in the Santiam basin. Magnitude is in
cubic feet per second (ft3/s).
REACH DATES FLOW
COMPONENT
FLOW RECOMMENDATIONS
Number of Events Magnitude Duration Frequency
North
Santiam
September
1 to
October 15
Fall flows
steady flow within
the identified
magnitude range
and time period
1,000-
1,500 45 days annually
South
Santiam
September
1 to
October 15
Fall flows
steady flow within
the identified
magnitude range
and time period
1,500-
3,000 45 days annually
Mainstem
Santiam
September
1 to
October 15
Fall flows
steady flow within
the identified
magnitude range
and time period
1,500-
4,000 45 days annually

11
Winter Flows
Description of Flows and Conditions of Implementation:
Winter flows were historically characterized by moderately low baseflow punctuated with rainfall
or rain-on-snow dominated floods. Winter flow recommendations were broken down into winter
base flows, winter events below bankfull and winter events above bankfull.
The winter base flow objective mimics the unregulated hydrograph and seeks to provide
consistent water sufficient for multiple biological targets. The higher winter flows (i.e., near but
below bankfull) are important for connecting and wetting side channels, opening up new habitat,
initiating gravel movement, and flushing sediment and wood into side channels. Resident trout,
macroinvertebrates and other species benefit by increased habitat diversity and clean, unarmored
substrates. These flows maintain chub habitat while also potentially reducing non-native fish
numbers in off-channel habitats. The winter events above bankfull were proposed to accomplish
some of the tasks that only a large events can: deposit fines on new floodplain for colonization of
riparian vegetation, mobilize larger wood and larger substrate, open abandoned side channels,
enhance pool and off-channel development and scour side channels silted in over a decade or
longer. These largest events open the side channels and spill over into the floodplain, rejuvenating
it with fresh sediment deposits while also protecting the banks and river bed of the main channel
from erosion and cutting during higher flows.
Important to the flow recommendations for the below- and above-bankfull pulsed events is a
requirement that the recession limb of these pulses be gradual, even while flows can be brought
up to peak conditions relatively quickly. This is necessary to allow those fish that used side
channels or floodplains as refugia to move back into deeper water rather than be stranded in these
off-channel locations. The recession limb should mimic observed rates from similar flow levels
during the pre-dam period of record (the natural flow recession rate).
Base Flow Ecosystem Objectives:
Provide sufficient water for multiple life stages of multiple fish species including:
o outmigrating juvenile Chinook
o upmigrating steelhead
o rearing juvenile Chinook and steelhead
o steelhead and Chinook redd protection
o slackwater deposits for lamprey
Winter Events Below Bankfull Ecosystem Objectives:
Connect and wet-up side channels; flush sediment and wood into side channels
Initiate gravel movement
Provide spawning and rearing habitat for spring Chinook and resident trout in newly
connected side channels
Maintain and enhance chub habitat.
Remove fines to benefit macroinvertebrates
Initiate bar formation and plant seed dispersal, allowing for colonization of riparian
vegetation

12
Winter Events Above Bankfull Ecosystem Objectives:
Provide for channel formation and maintenance
Increase fish spawning and rearing habitat through newly connected and scoured side
channels
Rejuvenate chub habitat for current or future benefit
Open side channels and inundate floodplains to rejuvenate with fresh sediment deposits
while also protecting the main channel from failure during higher flows
Table 4. Winter flow recommendations for all three reaches in the Santiam basin. Magnitude is in
cubic feet per second (ft3/s).
REACH DATES FLOW
COMPONENT
FLOW RECOMMENDATIONS
Number of
Events Magnitude Duration Frequency
North
Santiam
November
1 to March
31
Winter base
flows
minimum
sustained flow
1,000-
1,500 150 days annually
Winter events
up to bankfull 2-5
13,000-
18,000 3-5 days annually
Winter events
above bankfull 1 >18,000 3-5 days
1-3 years
in 10
South
Santiam
November
1 to March
31
Winter base
flows
minimum
sustained flow 3,000 150 days annually
Winter events
up to bankfull
5-6 7,000-
15,000 6 days annually
1-2 15,000-
17,000 2 days annually
Winter events
above bankfull
1 18,000-
26,000 1 day
2 years in
3
1 26,000-
35,000 1 day
1 year in
2
1 35,000-
60,000 1 day
1 year in
7-10
Mainstem
Santiam
November
1 to March
31
Winter base
flows
minimum
sustained flow 5,000 150 days annually
Winter events
up to bankfull 3-5 30,000 3-5 days annually
Winter events
above bankfull
2 35,000-
40,000 3-5 days
1 year in
2
1 70,000-
100,000 1-2 days
1 year in
5
Spring Flows
Description of Flows and Conditions of Implementation:
Spring flows are historically maintained by high elevation snowmelt, transitioning from winter

13
flood flows to summer low flow. These flows serve to put water into lower elevation side
channels and floodplain aquifer storage and provide sufficient low-turbidity flows to support
needed velocity for salmonid out-migration. Recommendations are to maintain flows within a
range for April through June during normal water years. The flow does not need to remain
constant and pulsing water at recommended ramping rates within the objective ranges is
acceptable.
However, the rate of recession must be matched to the length of the higher flow pulse. A
managed recession provides improved conditions for late vegetative root growth in the floodplain
and on gravel bars. Cottonwood seed distribution and germination occurs during this time, and
bare substrate is necessary for germination and establishment. The slower exposure of substrate
(caused by a more sustained flow drawdown from both pulses and normal snowmelt runoff)
provides a better opportunity for seed germination and initial root growth. Additionally, a gradual
managed recession of water is recommended following longer periods of high flow (i.e., during
snowmelt) to reduce the potential for stranding or dewatering fish or amphibian eggs.
Alternatively, if flows are pulsed more quickly (rapid rise and fall), as is often true during the
early spring prior to snowmelt, there isn’t sufficient time for spawning or egg laying, so there is a
reduced risk of dewatering eggs.
In order to balance the needs of different species, varying the rate of recession following pulses
over several years may mitigate for impacts to various species.
During dry years, when there is insufficient water to maintain normal water year objectives, a set
of pulses in the same flow range may be the best alternative. Pulsed flows, if done correctly, may
be the best solution for chub habitat maintenance, rearing (May- June) and recruitment during dry
years.
Ecosystem Objectives:
Provide cooler temperatures in sloughs and side channels, delaying spawning in Oregon
chub and therefore allowing for more successful juvenile rearing and survival in June and
July
Provide off-channel habitat for amphibian breeding
Provide sufficient water for steelhead redds
Improve riparian (especially cottonwood) seed germination and initial root growth, as well
as sufficient flows during drawdown for seedling establishment
Provide adequate flows for adult Chinook migration
Provide flows for habitat and for downstream mid-May to mid-June passage of juvenile
Chinook salmon and steelhead at Willamette Falls
Provide rates of flow recession that do not strand or dewater habitat suddenly

14
Table 5. Spring flow recommendations for all three reaches in the Santiam basin. Magnitude is in
cubic feet per second (ft3/s).
REACH DATES FLOW
COMPONENT
FLOW RECOMMENDATIONS
Number of
Events Magnitude Duration Frequency
North
Santiam
April 1
to June
30
Spring flows
steady flow
within the
identified
magnitude
range and
time period
with gradual
decrease to
summer
levels
1,500-5,000 90 days annually
April 1
to June
30
Spring events
above bankfull 1 >18,000 3-5 days
1-3 years
in 10
South
Santiam
April 1
to June
30
Spring flows
Steadily
decreasing
flow within
the identified
magnitude
range and
time period
4,000 early
season, dropping
to 1,500 late
season
90 days annually
Spring events 3-8
1,000 above the
normative flow at
the time of the
pulse. Time with
precipitation
events and major
snowmelt events
when possible
1-3
weeks
including
rise and
fall
every 3-5
years
Mainstem
Santiam
April 1
to June
30
Spring flows Minimum
flow 3,000 90 days annually
Spring events
1 extended
snowmelt
event in
May/June
10,000-20,000 2-4 days annually
Summer Flows
Description of Flows and Conditions of Implementation:
The minimum flow recommendations mirror or are slightly elevated from the Biological Opinion
(BiOp) flow-release targets for Big Cliff and Foster dams during the same time period but are

15
slightly higher than the congressionally authorized low flow levels. Due to diversions downstream
of the dams recommendations were made to maintain minimum baseflows from the dams at
higher than historic levels. As flow decreases, temperatures increase, putting many aquatic
species at risk, but more research is necessary to understand how flow recommendations
influence water temperature and general water quality throughout the rivers. Minimum flow
recommendations were made to help mitigate this threat. This should be linked with reservoir
management (let warmer water out earlier, cooler later), to meet temperature targets. Flows that
maintain connection to chub habitat or provide cooler hyporheic inputs in summer are important
in order to maintain appropriate temperatures and volumes in side channels and sloughs used by
chub. At a baseflow of 1,000 cfs in the North Santiam in summer, chub populations tend to
expand.
Ecosystem Objectives:
Maintain rearing habitat for chub and juvenile salmonids
Provide minimum flows for upstream migration of Chinook adults
Protect steelhead redds from stranding
Maintain and/or expand chub populations
Maintain temperatures appropriate for species targets
Table 6. Summer flow recommendations for all three reaches in the Santiam basin. Magnitude is
in cubic feet per second (ft3/s).
REACH DATES FLOW
COMPONENT
FLOW RECOMMENDATIONS
Number of
Events Magnitude Duration Frequency
North
Santiam
July 1 to
July 15 Summer flows
minimum
sustained flow
1,200 15 days annually
July 16 to
August 31 1,000 45 days annually
South
Santiam
July 1 to
August 31 Summer flows
minimum
sustained flow 800-1,200 60 days annually
Mainstem
Santiam
July 1 to
August 31 Summer flows
Flows should
ramp down
during July as
the snowmelt
peak declines
1,500-
4,000 July annually
steady flow
within the
identified
magnitude
range and time
period
1,500-
2,500
August and
September annually

16
Flow Recommendations by Reach
The following section outlines example hydrographs and ecosystem objectives by reach. The
hydrographs were generated using RPT. Because RPT is chiefly a visualization tool whose main
purpose is to facilitate group communication during and post-workshop, these example
hydrographs should not be interpreted as specific recommendations, but rather as a hypothetical
water year in which some, but not necessarily all, of the recommended flow components would
be achieved. The diagrams summarize the flow recommendations by reach, season and the
ecosystem objectives called out individually by groups (see full list of ecosystem objectives
within recommendations by season). Implementation hydrographs can be compared with the RPT
output and the diagrams to assess success in achieving specific flow recommendations and
achieving ecosystem objectives.

17
North Santiam
Figure 2. Example hydrograph of North Santiam flow recommendations from RPT.
Figure 3. Diagram of North Santiam flow recommendations and ecological objectives.

18
South Santiam River
Figure 4. Example hydrograph of South Santiam flow recommendations from RPT.
Figure 5. Diagram of South Santiam flow recommendations and ecological objectives.

19
Mainstem Santiam
Figure 6. Example hydrograph of mainstem Santiam flow recommendations from RPT.
Figure 7. Diagram of mainstem Santiam flow recommendations and ecological objectives.

20
Recommendations for Future Studies
During the workshop, experts identified a number of gaps in understanding key flow-ecology
relationships and the potential benefit and effects of environmental flow implementation. This
information is needed to refine environmental flow objectives and support adaptive management
of environmental flow implementation. The information is organized by season, although there
is some overlap in information needs among seasons.
Fall and Winter Flows
(1) Initiate additional studies on the relationship between flow and
o channel morphology (for example, what level of flow provides channel
maintenance or access to side channels, especially given the prevalence of channel
revetments?)
o sediment transport
o vegetation establishment, bank stability, and large wood inputs
o fish stranding (hydrograph recession rate)
o fish demography (e.g., fewer second year fish are coming out of the river-most are
first year-because of temperature limitations below dams)
(2) Determine flow levels that provide access to spawning gravels and subsequently scour
redds
(3) Test geomorphic effects under current conditions
(4) Develop wood and sediment budgets for streams and link to flow conditions
(5) Develop studies on gravel recruitment
(6) Quantify appropriate recession rate following higher flows
(7) Address implementation questions, such as:
o Can you implement high flow releases that do not affect downstream properties
while still scouring side channel features? What additional efforts (e.g. floodplain
restoration and reconnection) will increase opportunities for environmental flow
implementation?
o Can two smaller high flow events do the work of one larger high flow event? Or
what combination of higher flows, in terms of magnitude, frequency, duration, etc.
provides the best ecological result while at the same time protecting existing uses?
Spring Flows
(1) Develop local studies on vegetation life cycles and timing, specifically seedling
recruitment, establishment and survival
(2) Improve understanding of relationship and trade-offs between vegetation, gravel bars, and
flows
o extent and location of vegetated gravel bars
o trade-off between higher flows destroying vegetation and recruitment of gravel by
mobilizing vegetated bars?
o flow requirements to provide new floodplain substrate and promote cottonwood
and alder establishment
(3) Evaluate side channel connection under recommended flows and the effect of revetments
on side channel connections
(4) Quantify appropriate recession rate following higher flows
(5) Evaluate impacts of steady vs. pulsing (potentially detrimental) flows for lamprey

21
Summer Flows
(1) Determine geomorphic features and characteristics dictating temperature-flow
relationships between main channel and side channel habitats; identify effects of flow
management on temperature and water quality
(2) Determine levels that provide for Spring Chinook passage for spawning
(3) Study link between summer flows and occurrence and distribution of pools for Chinook
refugia
(4) Describe hyporheic exchange features that support Oregon chub and that could provide
opportunities for thermal refugia for salmonids
(5) Determine factors affecting pre-spawn mortality in Chinook
(6) Evaluate the ability of species to survive with flows below 1,000 cfs based on historic
unregulated flows as low as 500 cfs and potential changes in species composition due to
changes in low flow.
22
References Cited Acreman, M., and Dunbar, M.J., 2004, Defining environmental flow requirements–A review:
Hydrology and Earth System Sciences, v. 8, no. 5, p. 861–876.
Gregory, S., Ashkenas, L., and Nygaard, C., 2007a, Summary report to assist development of
ecosystem flow recommendations for the Middle Fork and Coast Fork of the Willamette
River, Oregon: Institute for Water and Watersheds, Oregon State University, Corvallis,
Oregon, 237 p.
Gregory, S., Ashkenas, L., and Nygaard, C., 2007b, Summary report—Environmental flows
workshop for the Middle Fork and Coast Fork of the Willamette River, Oregon: Institute
for Water and Watersheds, Oregon State University, Corvallis, Oregon, 34 p.
National Marine Fisheries Service (NMFS). 2008. Consultation on the "Willamette River Basin
Flood Control Project". NMFS Tracking #: FINWRl2000/02117. July 11, 2008.
Richter, B.D., Warner, A.T., Meyer, J.L., and Lutz, K., 2006, A collaborative and adaptive
process for developing environmental flow recommendations: River Research and
Applications, v. 22, p. 297–318, DOI: 10.1002/rra.892.
Risley, J.C., Wallick, J.R., Waite, Ian, and Stonewall, Adam, 2010a, Development of an
environmental flow framework for the McKenzie River basin, Oregon: U.S. Geological
Survey Scientific Investigations Report 2010-5016, 94 p. Risley, J.C., L.B. Bach, and J.R. Wallick, 2010b. Environmental Flow Recommendations
Workshop for the McKenzie River, Oregon. The Nature Conservancy, Portland Oregon.
Risley, J.C., Wallick, J.R., Mangano, J.F., and Jones, K.F, 2012, An environmental streamflow
assessment for the Santiam River basin, Oregon: U.S. Geological Survey Open-File
Report 2012-1133, 60 p. plus appendixes.
Tharme, R.E., 2003, A global perspective on environmental flow assessment: emerging trends in
the development and application of environmental flow methodologies for rivers: River
Research and Applications, v. 19, p. 397–441, DOI: 10.1002/rra.736.

23
Appendix A. Workshop Agenda
Santiam River
Environmental Flows Workshop
August 30, 2012
Oregon Department of Fish and Wildlife
Commission Room
3406 Cherry Ave. NE Salem, OR.
9:00 Welcome and introductions – Chris Budai, Corps of Engineers, Leslie Bach, The Nature
Conservancy
9:15 Review of process, progress to date, discussion of meeting outcomes - Leslie Bach, The
Nature Conservancy
9:30 Overview, and discussion of Santiam River hydrology as background for developing
environmental flow recommendations – John Risley, U.S. Geological Survey
10:00 Overview of Santiam reservoir management – Mary Karen Scullion, Corps of Engineers
10:15 Overview of Santiam River biology – Greg Taylor, Corps of Engineers
10:30 Discussion of Working Group tasks and goals – Leslie Bach, The Nature Conservancy
11:00 Working groups
Working groups will be organized with a mix of expertise and will develop recommended
flows for the North Santiam, South Santiam and mainstem Santiam River. Environmental
flow recommendations will address specific flow components (low, moderate and high
flows ), considering a range of species, communities and ecological processes including
fish and other aquatic species, riparian and floodplain systems, channel morphology and
water quality. Groups will also identify significant knowledge and information gaps and
potential monitoring elements.
3:15 Review of results of breakout groups and synthesis of flow recommendations.
4:00 Adjourn

24
Appendix B. List of workshop attendees
Group Role First Name Last Name Organization
Lead Leslie Bach The Nature Conservancy
Lead John Hickey U.S. Army Corps of Engineers
Lead Chris Budai U.S. Army Corps of Engineers
North
Santiam Facilitator Jason Nuckols The Nature Conservancy
North
Santiam RPT David Hicks U.S. Army Corps of Engineers
North
Santiam RPT Keith Duffy U.S. Army Corps of Engineers
North
Santiam Note Taker Melissa Olson The Nature Conservancy
North
Santiam Greg Taylor U.S. Army Corps of Engineers
North
Santiam Patricia Farrell City of Salem
North
Santiam Rose Wallick United States Geological Survey
North
Santiam Liz Redon North Santiam Watershed Council
North
Santiam Anne Mullan NOAA Fisheries
North
Santiam Alex Farrand Oregon Dept. of Fish and Wildlife
North
Santiam Brent Stevenson North Santiam Water Control District
South
Santiam Brian Bangs Oregon Dept. of Fish and Wildlife
North
Santiam Lawrence Schwabe
Confederated Tribes of the Grand
Ronde
South
Santiam Facilitator Anne MacDonald GeoEngineers
South
Santiam RPT John Risley United States Geological Survey
South
Santiam
Note
Taker Emile Blevins The Nature Conservancy
South
Santiam Rich Piaskowski U.S. Army Corps of Engineers
South
Santiam Eric Hartstein South Santiam Watershed Council
South Cristina Mateaus Oregon State University

25
Santiam
South
Santiam Rich Domingue NOAA Fisheries
South
Santiam Nancy Gramlich Oregon Dept. of Environmental Quality
South
Santiam Kirk Schroeder Oregon Dept. of Fish and Wildlife
South
Santiam Johan Hogervorst U.S. Forest Service
South
Santiam Wes Messinger U.S. Army Corps of Engineers
mainstem
Santiam Facilitator Valerie Kelly United States Geological Survey
mainstem
Santiam RPT Kinsey Friesen U.S. Army Corps of Engineers
mainstem
Santiam RPT
Mary
Karen Scullion U.S. Army Corps of Engineers
mainstem
Santiam Note Taker Terrence Conlon United States Geological Survey
mainstem
Santiam Dave Hulse University of Oregon
mainstem
Santiam Kim Hatfield NOAA Fisheries
mainstem
Santiam Tim Harden Oregon Dept. of Fish and Wildlife
mainstem
Santiam Dan Bell The Nature Conservancy
mainstem
Santiam Tara Davis Calapooia Watershed Council
mainstem
Santiam Erin Oost Oregon Water Resources Dept.
mainstem
Santiam Kat Beal U.S. Army Corps of Engineers
mainstem
Santiam Paul Scheerer Oregon Dept. of Fish and Wildlife