Embed Size (px)
Citation preview
May 2017
Pacifi c States/British Columbia Oil Spill Task Force
Summary of West Coast Oil Spill Data
Calendar Year 2016

CONTACT INFORMATION
Sarah Brace, Executive Coordinator2211 Elliott Ave Suite 200
Seattle WA 98121206.409.3253
www.oilspilltaskforce.com
Data analysis and summary reportby Camille Stephens

The Task Force’s regional oil spill database, which was launched in 2003, is a unique and valuable resource that enables us to track regional trends in spills and related causal factors. Using a standardized data dictionary to en-sure uniform entries, we collect data on all spills of a barrel (42 gallons) or larger.
DATABASE WORKGROUPDatabase Workgroup provides staff -level coordination to help ensure that data is collected in a consistent manner by all Task Force member agencies. The Pacifi c States/British Columbia Oil Spill Task Force Data Dictionary (available at oilspilltaskforce.org/ourwork/data-project/) was developed by the Database Workgroup and establishes standardized terms and defi nitions for collecting spill data.
Workgroup members include:
• Bill Steele (Alaska Department of Environmental Conser-vation)
• Cathy Conway, Adrian Chatigny, and Damon Williams (California Department of Fish and Wildlife, Offi ce of Spill Prevention and Response)
• Mike Zollitsch (Oregon Department of Environmental Quality)
• Steven Mow and Curtis Martin (Hawaii Department of Human Health)
• Jack Barfi eld (Washington Department of Ecology) The British Columbia Ministry of Environment monitors the project, is developing a spill database, and plans to join the Task Force project as soon as possible.
DATA LIMITATIONS• Each agency that assists in the creation and maintenance
of the Task Force database in no way guarantees the accuracy of the information and no guarantee of accuracy shall be expressed or implied.
• Only spills of one barrel (42 gallons) or larger are includ-ed in our Database.
• Detailed information about small spills is often limited or unknown because the eff ort necessary to investigate them is cost-prohibitive. For this reason, we are present-ing spill counts only.
• The Task Force oil spill database is created and main-tained for informational purposes only. The data it con-tains refl ects the respective agencies’ best information at the time it was entered in the database. This means that
recorded quantities may be under-reported. It remains an ongoing challenge to refi ne the information entered to a level of specifi city that supports eff ective analysis while also taking into account the varied collection capabilities of member agencies.
HIGHLIGHTSThe 2016 data is provided on the following pages. High-lights include:
• A total of 564 releases occurred during 2016, with a total volume of 326,814 gallons spilled. Of those, 3 releases were over 10,000 gallons.
Non-Crude Spills
• 547 releases were non-crude spills totaling 237,687 gal-lons.
• Vessels (45%) and Vehicles (37%) and were the major sources of non-crude spills during 2016, more than three-quarters of the total non-crude volume.
• Over half of the total non-crude spill volume was attrib-utable to Organizational/management failure (38%) or Human error (36%).
• Nearly half (47%) of the non-crude volume was spilled to Marine waters.
Crude Oil Spills
• 17 Crude oil releases totaling 89,127 gallons occurred in 2016.
• Crude oil releases comprised 27% the total volume for 2016.
• Human error (51%) was the cause of about half of the crude oil spill volume during 2016
• Mechanical failure (98.7%) comprised virtually all spill volume due to Equipment Failure.
• During 2016, crude spills to Marine (50%) and Fresh water (47%) comprised most of the total volume.
NOTE:
• California’s data submission does not include every spill reported to the State in 2016, compared to previous years. This resulted in a signifi cant drop in the California data presented regarding the total number of spills and the total volume for the year, especially for spills to land. Out of the 6,975 Hazardous Materials Spill Reports 2,473
OIL SPILL DATA PROJECT
Summary of Regional Spill Data (CY 2016)
were reported as petroleum to land (no waterway in-volved). The responsibility of response and investigation of spills fall under the jurisdiction of agencies other than California Department of Fish and Wildlife, Offi ce of Spill Prevention and Response (CDFW OSPR). Causal data, oil types and volumes are not collected by the CDFW OSPR and therefore are not included in this year’s report.
• Hawaii’s data submission for 2016 was incomplete due to issues encountered in their new data management system.
Trends
The 2002-2016 data provides us with an opportunity to look at 15-year trends, which is also shown in this report. Here are the highlights:
• A total of 14,401, releases occurred during the 15-year period 2002-2016, with a total volume of approximately 12.1 million gallons.
• Over the 15-year period, the combined volume of Non-Crude spills was more than 2.5 times that for Crude Oil spills.
• The top two Crude Oil spills during the 13-year period were 463,848 gallons in California (2008) and a 267,000 gallon spill in Alaska (2006). The combined volume of these two incidents comprised 23% of the total Crude Oil volume released for the period.
• Overall, Facilities (50%) and Pipelines (19%) were the major sources of spills during the 13-year period.
• Facilities were the source of 53% of the Non-Crude spill volume.
• Pipelines (53%) and Facilities (43%) were the major sources of Crude Oil spills.
• Overall, Equipment Failure (54%) and Human Error (30%) were the major spill causes.
• Equipment Failure (45%) and Human Error (37%) were the predominant causes for Non-Crude spills
• 78% of the total Crude Oil spill volume was due to Equip-ment Failure.
FOR MORE INFORMATIONData summaries for calendar years 2002 – 2012, as well as other information about the Pacifi c States/British Colum-bia Oil Spill Task Force and its work, are available at www.
oilspilltaskforce.org. Summaries for years prior to 2012 are included in the Task Force Annual Reports for those years. Beginning with calendar year 2012, the data summary was created as a separate document available at oilspilltask-force.org/ourwork/data-project/
For questions specifi cally related to this report or the Task Force’s data project, contact Sarah Brace, Executive Coor-dinator at [email protected].
5
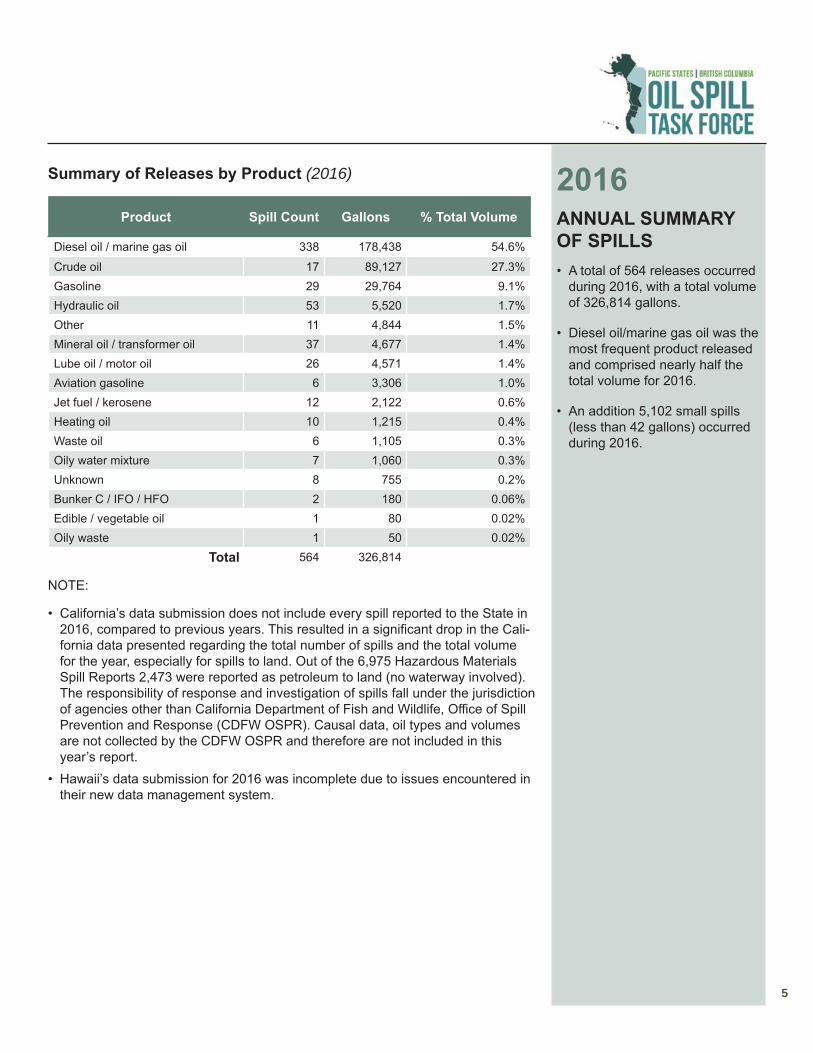
Summary of Releases by Product (2016)
Product Spill Count Gallons % Total Volume
Diesel oil / marine gas oil 338 178,438 54.6%Crude oil 17 89,127 27.3%Gasoline 29 29,764 9.1%Hydraulic oil 53 5,520 1.7%Other 11 4,844 1.5%Mineral oil / transformer oil 37 4,677 1.4%Lube oil / motor oil 26 4,571 1.4%Aviation gasoline 6 3,306 1.0%Jet fuel / kerosene 12 2,122 0.6%Heating oil 10 1,215 0.4%Waste oil 6 1,105 0.3%Oily water mixture 7 1,060 0.3%Unknown 8 755 0.2%Bunker C / IFO / HFO 2 180 0.06%Edible / vegetable oil 1 80 0.02%Oily waste 1 50 0.02%
Total 564 326,814
NOTE:
• California’s data submission does not include every spill reported to the State in 2016, compared to previous years. This resulted in a signifi cant drop in the Cali-fornia data presented regarding the total number of spills and the total volume for the year, especially for spills to land. Out of the 6,975 Hazardous Materials Spill Reports 2,473 were reported as petroleum to land (no waterway involved). The responsibility of response and investigation of spills fall under the jurisdiction of agencies other than California Department of Fish and Wildlife, Offi ce of Spill Prevention and Response (CDFW OSPR). Causal data, oil types and volumes are not collected by the CDFW OSPR and therefore are not included in this year’s report.
• Hawaii’s data submission for 2016 was incomplete due to issues encountered in their new data management system.
2016ANNUAL SUMMARY OF SPILLS• A total of 564 releases occurred
during 2016, with a total volume of 326,814 gallons.
• Diesel oil/marine gas oil was the most frequent product released and comprised nearly half the total volume for 2016.
• An addition 5,102 small spills (less than 42 gallons) occurred during 2016.
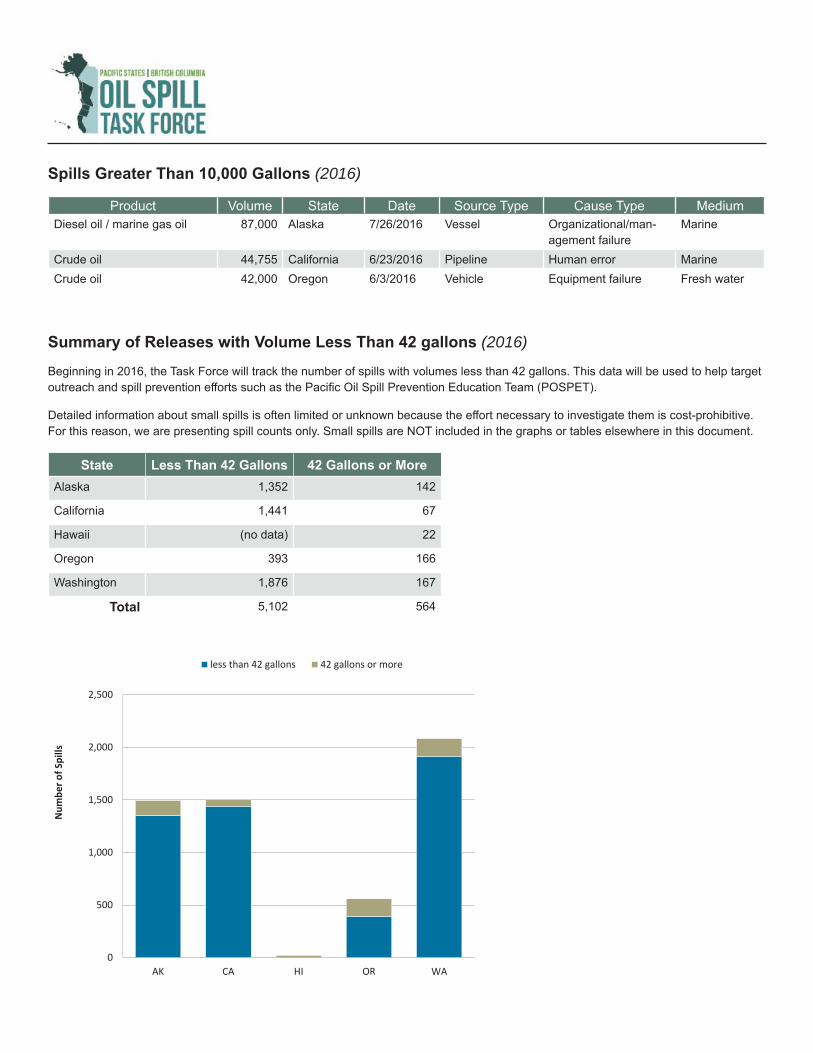
Spills Greater Than 10,000 Gallons (2016)
Product Volume State Date Source Type Cause Type MediumDiesel oil / marine gas oil 87,000 Alaska 7/26/2016 Vessel Organizational/man-
agement failureMarine
Crude oil 44,755 California 6/23/2016 Pipeline Human error MarineCrude oil 42,000 Oregon 6/3/2016 Vehicle Equipment failure Fresh water
Summary of Releases with Volume Less Than 42 gallons (2016)
Beginning in 2016, the Task Force will track the number of spills with volumes less than 42 gallons. This data will be used to help target outreach and spill prevention eff orts such as the Pacifi c Oil Spill Prevention Education Team (POSPET).
Detailed information about small spills is often limited or unknown because the eff ort necessary to investigate them is cost-prohibitive. For this reason, we are presenting spill counts only. Small spills are NOT included in the graphs or tables elsewhere in this document.
State Less Than 42 Gallons 42 Gallons or MoreAlaska 1,352 142
California 1,441 67
Hawaii (no data) 22
Oregon 393 166
Washington 1,876 167
Total 5,102 564
0
500
1,000
1,500
2,000
2,500
AK CA HI OR WA
Num
ber o
f Spi
lls
less than 42 gallons 42 gallons or more
7S /
0
20,000
40,000
60,000
80,000
100,000
120,000
AK CA HI OR WA
Volu
me
Rel
ease
d (g
allo
ns)
Gasoline
Diesel oil / marine gas oil
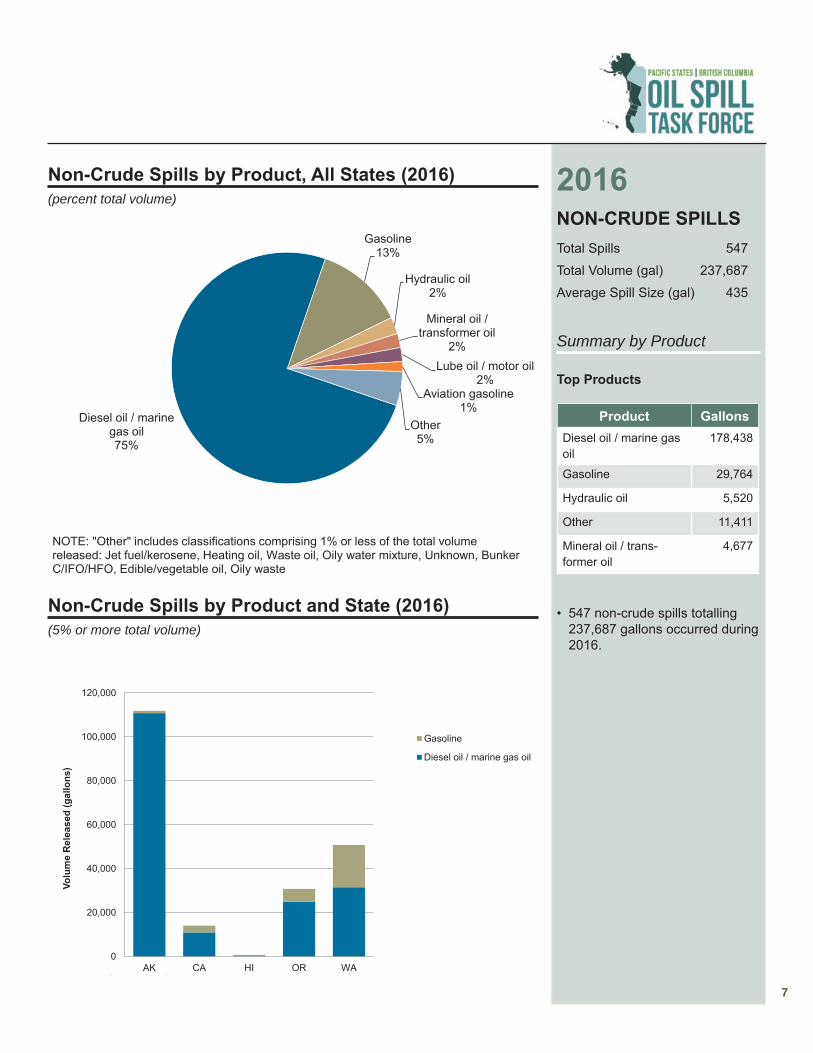
Non-Crude Spills by Product and State (2016)(5% or more total volume)
2016NON-CRUDE SPILLSTotal Spills 547Total Volume (gal) 237,687Average Spill Size (gal) 435
Summary by Product
Top Products
Product GallonsDiesel oil / marine gas oil
178,438
Gasoline 29,764
Hydraulic oil 5,520
Other 11,411
Mineral oil / trans-former oil
4,677
• 547 non-crude spills totalling 237,687 gallons occurred during 2016.
Non-Crude Spills by Product, All States (2016)(percent total volume)
Diesel oil / marine gas oil75%
Gasoline13%
Hydraulic oil2%
Mineral oil / transformer oil
2%Lube oil / motor oil
2%Aviation gasoline
1%Other5%
NOTE: "Other" includes classifications comprising 1% or less of the total volume released: Jet fuel/kerosene, Heating oil, Waste oil, Oily water mixture, Unknown, Bunker C/IFO/HFO, Edible/vegetable oil, Oily waste

8
2016NON-CRUDE SPILLS
Summary by Source
Top Sources
Source GallonsVessel 107,939
Vehicle 87,935
Facility 27,404
Private property 7,727
Public lands 2,450
• Vessels (45%) and Vehicles (37%) and were the major sources of non-crude spills dur-ing 2016.
• Vessels and Vehicles comprised more than three-quarters of the non-crude spill volume during 2016
Vessel45%
Vehicle37%
Facility12%
Private property3%
Public lands1%
Other2%
NOTE: "Other" includes classifications comprising 1% or less of the total volume released: Military, Pipeline, Unknown, Farm/Agriculture
Non-Crude Spills by Source, All States (2016)(percent total volume)
0
20,000
40,000
60,000
80,000
100,000
120,000
140,000
AK CA HI OR WA
Volu
me
Rel
ease
d (g
allo
ns)
Public landsOtherPrivate propertyFacilityVehicleVessel
NOTE: "Other" includes classifications comprising 1% or less of the total volume released: Military, Pipeline, Unknown, Farm/Agriculture
Non-Crude Spills by Source and State (2016)
9
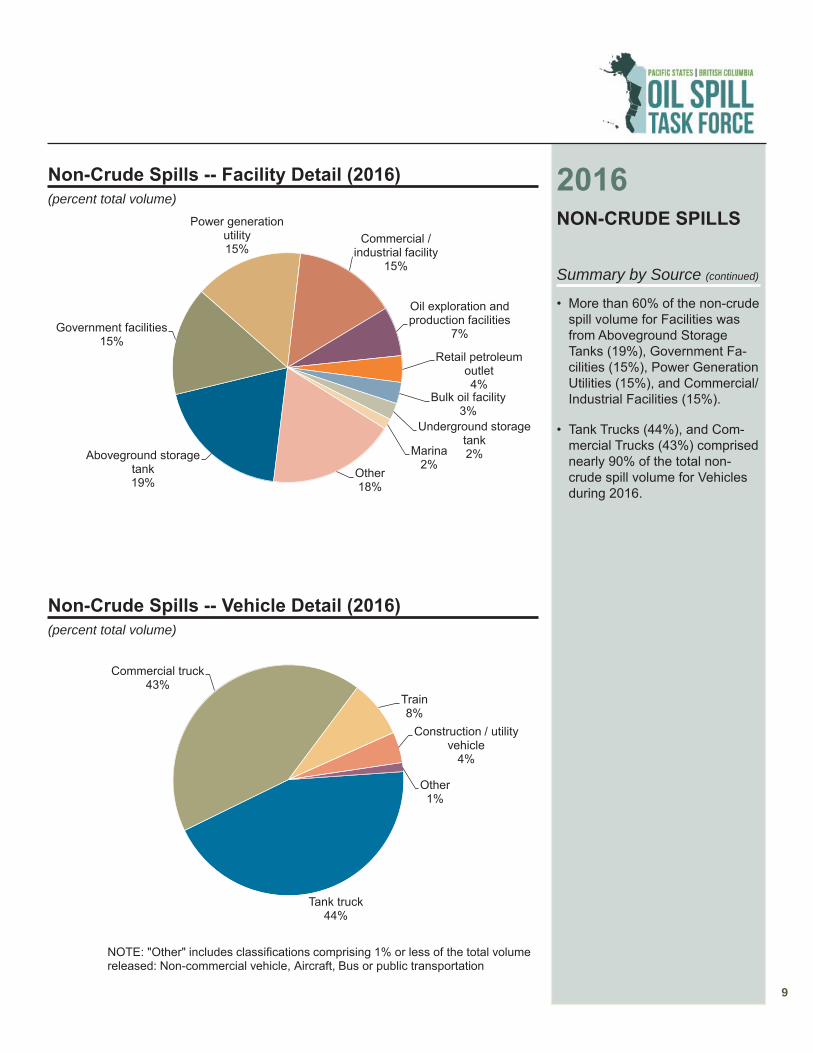
Aboveground storage tank19%
Government facilities15%
Power generation utility15%
Commercial / industrial facility
15%
Oil exploration and production facilities
7%
Retail petroleum outlet4%
Bulk oil facility3%
Underground storage tank2%Marina
2%Other18%
Non-Crude Spills -- Facility Detail (2016)(percent total volume)
Tank truck44%
Commercial truck43%
Train8%
Construction / utility vehicle
4%
Other1%
NOTE: "Other" includes classifications comprising 1% or less of the total volume released: Non-commercial vehicle, Aircraft, Bus or public transportation
Non-Crude Spills -- Vehicle Detail (2016)(percent total volume)
2016NON-CRUDE SPILLS
Summary by Source (continued)
• More than 60% of the non-crude spill volume for Facilities was from Aboveground Storage Tanks (19%), Government Fa-cilities (15%), Power Generation Utilities (15%), and Commercial/Industrial Facilities (15%).
• Tank Trucks (44%), and Com-mercial Trucks (43%) comprised nearly 90% of the total non-crude spill volume for Vehicles during 2016.
10
2016NON-CRUDE SPILLS
Summary by Cause
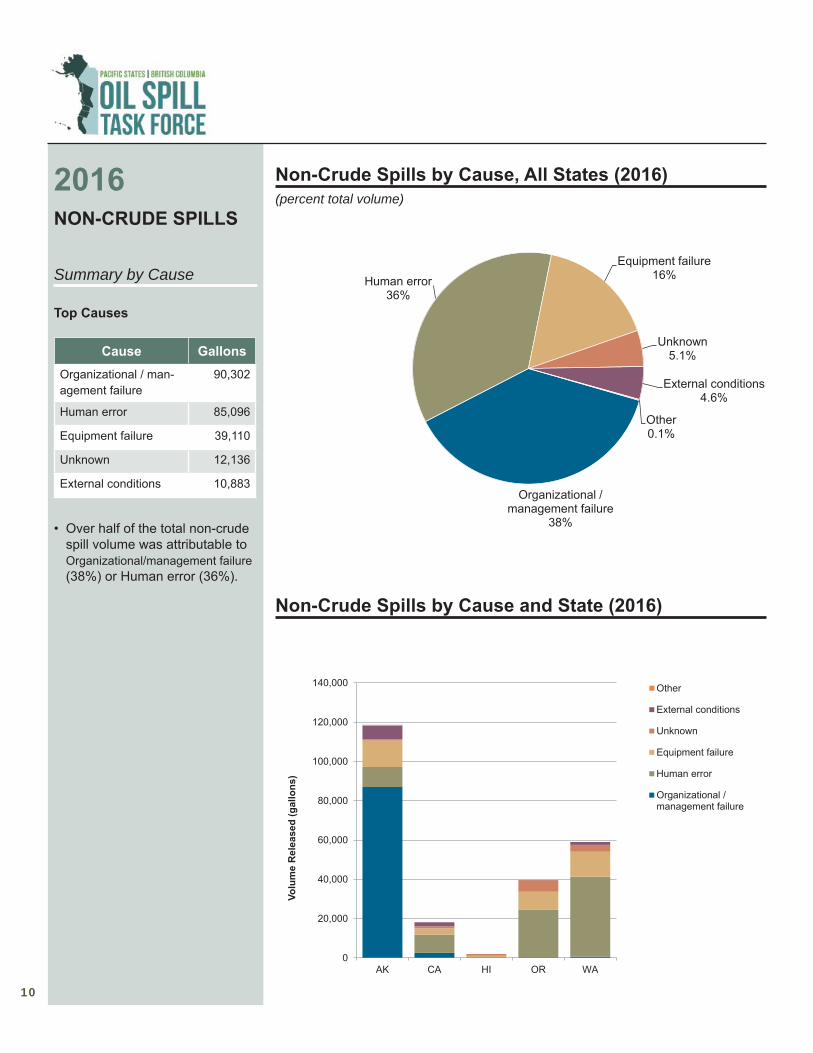
Top Causes
Cause GallonsOrganizational / man-agement failure
90,302
Human error 85,096
Equipment failure 39,110
Unknown 12,136
External conditions 10,883
• Over half of the total non-crude spill volume was attributable to Organizational/management failure (38%) or Human error (36%).
Non-Crude Spills by Cause, All States (2016)(percent total volume)
Non-Crude Spills by Cause and State (2016)
0
20,000
40,000
60,000
80,000
100,000
120,000
140,000
AK CA HI OR WA
Volu
me
Rel
ease
d (g
allo
ns)
Other
External conditions
Unknown
Equipment failure
Human error
Organizational /management failure
Organizational / management failure
38%
Human error36%
Equipment failure16%
Unknown5.1%
External conditions4.6%
Other0.1%
11
2016NON-CRUDE SPILLS
Summary by Cause (continued)
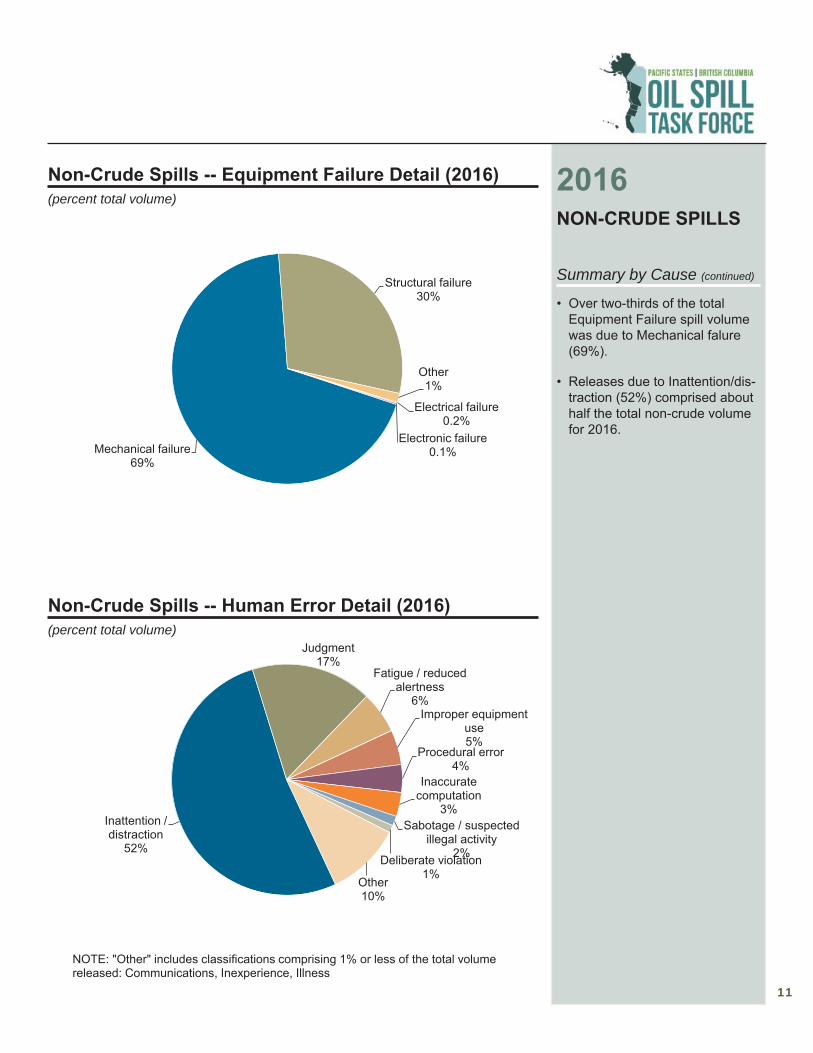
• Over two-thirds of the total Equipment Failure spill volume was due to Mechanical falure (69%).
• Releases due to Inattention/dis-traction (52%) comprised about half the total non-crude volume for 2016.
Non-Crude Spills -- Equipment Failure Detail (2016)(percent total volume)
Non-Crude Spills -- Human Error Detail (2016)(percent total volume)
Mechanical failure69%
Structural failure30%
Other1%
Electrical failure0.2%
Electronic failure0.1%
Inattention / distraction
52%
Judgment17%
Fatigue / reduced alertness
6%Improper equipment
use5%
Procedural error4%
Inaccurate computation
3%Sabotage / suspected
illegal activity2%Deliberate violation
1%Other10%
NOTE: "Other" includes classifications comprising 1% or less of the total volume released: Communications, Inexperience, Illness

12
2016NON-CRUDE SPILLS
Summary by Activity
Top Activities
Activity GallonsUnknown 91,129
Underway / in motion 79,324
Static 41,626
Oil transfer (cargo) 6,262
Other 19,346
• Underway/in motion was the main activity at the time of the spill (33%).
Unknown38%
Underway / in motion33%
Static18%
Oil transfer (cargo)3%
Other8%
( )
NOTE: "Other" includes classifications with less than 5,000 gal spilled: Not operating, Fueling (non-vessel), Oil transfer (non-fuel), Internal transfer, Maintenance/testing, Construction, Fueling, Bilge pumping, Tank/hold cleaning
0
20,000
40,000
60,000
80,000
100,000
120,000
140,000
AK CA HI OR WA
Volu
me
Rel
ease
d (g
allo
ns)
OtherOil transfer (cargo)StaticUnderway / in motionUnknown
NOTE: "Other" includes classifications with less than 5,000 gal spilled: Not operating, Fueling (non-vessel), Oil transfer (non-fuel), Internal transfer, Maintenance/testing, Construction, Fueling, Bilge pumping, Tank/hold cleaning
Non-Crude Spills by Activity (2016)(percent total volume)
Non-Crude Spills by Activity and State (2016)
1Underway/In Motion: (1) Vessel under-way conducting normal operations, no oil movements in progress (oil movements include ballasting, tank washing, internal transfers); (2) Vehicle in motion conducting designed function
13
2016NON-CRUDE SPILLS
Summary by Spill Size
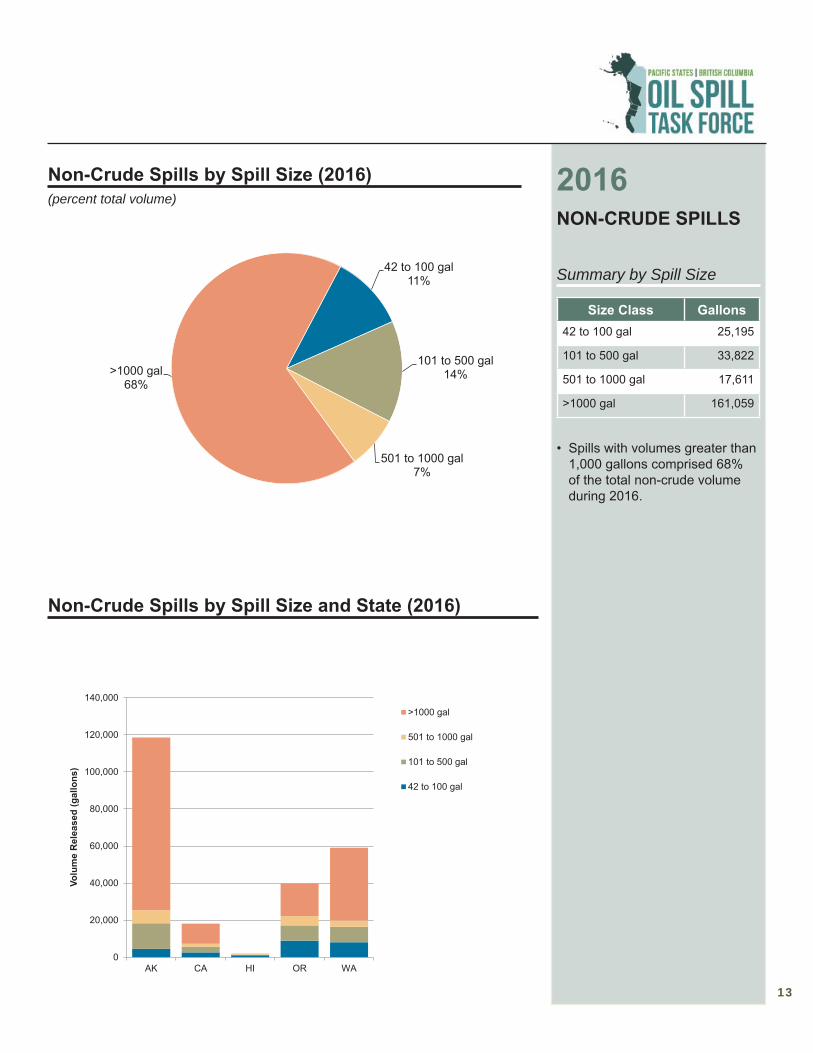
Size Class Gallons42 to 100 gal 25,195
101 to 500 gal 33,822
501 to 1000 gal 17,611
>1000 gal 161,059
• Spills with volumes greater than 1,000 gallons comprised 68% of the total non-crude volume during 2016.
42 to 100 gal 11%
101 to 500 gal14%
501 to 1000 gal7%
>1000 gal68%
Non-Crude Spills by Spill Size (2016)(percent total volume)
Non-Crude Spills by Spill Size and State (2016)
0
20,000
40,000
60,000
80,000
100,000
120,000
140,000
AK CA HI OR WA
Volu
me
Rel
ease
d (g
allo
ns)
>1000 gal
501 to 1000 gal
101 to 500 gal
42 to 100 gal

14
Marine47%
Land42%
Fresh water6%
Impermeable surface5%
Non-Crude Spills by Medium Impacted (2016)(percent total volume)
0
20,000
40,000
60,000
80,000
100,000
120,000
140,000
AK CA HI OR WA
Volu
me
Rel
ease
d (g
allo
ns)
Impermeable surface
Fresh water
Land
Marine
Non-Crude Spills by Medium and State (2016)
2016NON-CRUDE SPILLS
Summary by Medium
Medium GallonsMarine 112,035
Land 100,551
Fresh water 14,140
Impermeable surface 10,961
• Nearly half (47%) of the non-crude volume was spilled to Marine waters.
15
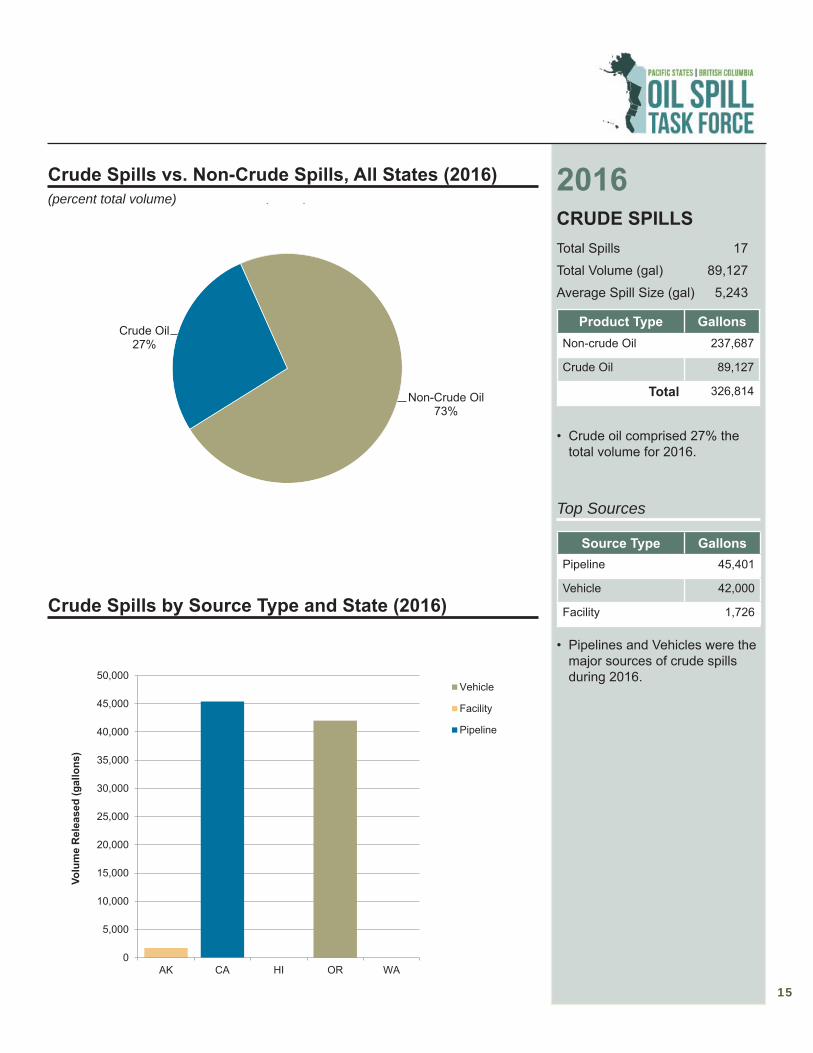
2016CRUDE SPILLSTotal Spills 17Total Volume (gal) 89,127Average Spill Size (gal) 5,243
Product Type GallonsNon-crude Oil 237,687
Crude Oil 89,127
Total 326,814
• Crude oil comprised 27% the total volume for 2016.
Top Sources
Source Type GallonsPipeline 45,401
Vehicle 42,000
Facility 1,726
• Pipelines and Vehicles were the major sources of crude spills during 2016.
Crude Spills vs. Non-Crude Spills, All States (2016)(percent total volume)
Crude Spills by Source Type and State (2016)
Crude Oil27%
Non-Crude Oil73%
( )
0
5,000
10,000
15,000
20,000
25,000
30,000
35,000
40,000
45,000
50,000
AK CA HI OR WA
Volu
me
Rel
ease
d (g
allo
ns)
Vehicle
Facility
Pipeline
16
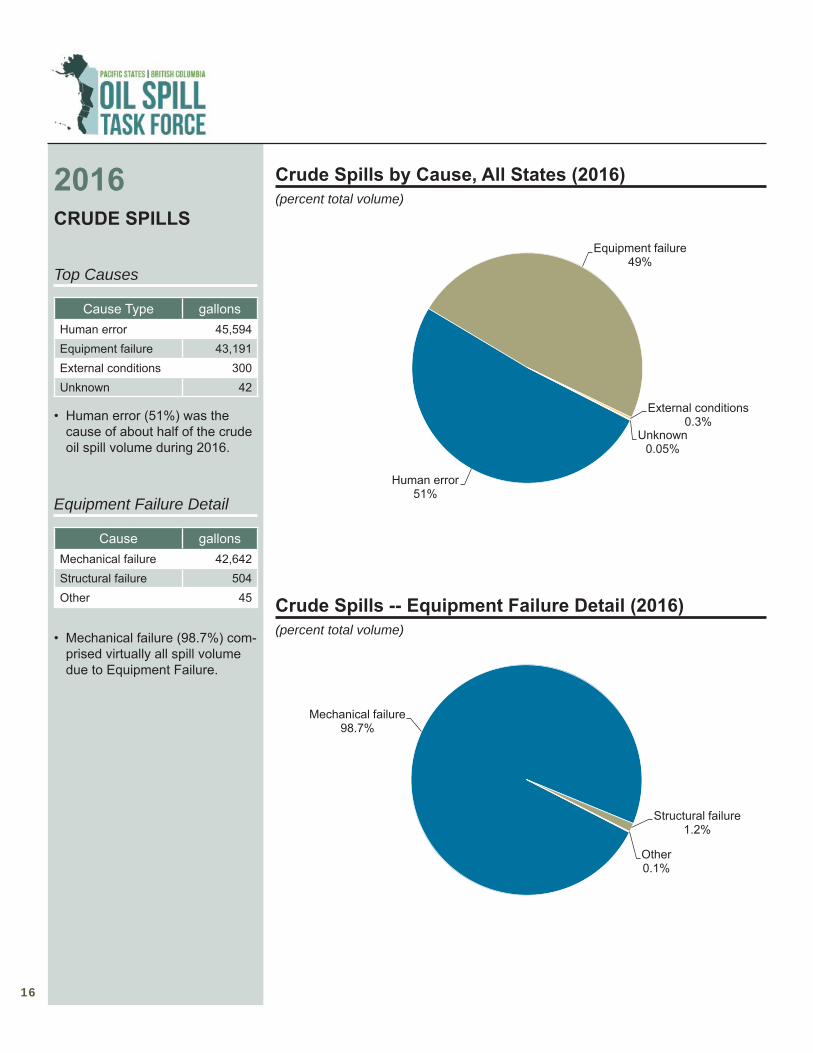
Crude Spills by Cause, All States (2016)(percent total volume)
Human error51%
Equipment failure49%
External conditions0.3%
Unknown0.05%
Crude Spills -- Equipment Failure Detail (2016)(percent total volume)
Mechanical failure98.7%
Structural failure1.2%
Other0.1%
2016CRUDE SPILLS
Top Causes
Cause Type gallonsHuman error 45,594 Equipment failure 43,191 External conditions 300 Unknown 42
• Human error (51%) was the cause of about half of the crude oil spill volume during 2016.
Equipment Failure Detail
Cause gallonsMechanical failure 42,642 Structural failure 504 Other 45
• Mechanical failure (98.7%) com-prised virtually all spill volume due to Equipment Failure.

17
Crude Spills -- Human Error Detail (2016)(percent total volume)
Procedural error99%
Inattention / distraction
1%
2016CRUDE SPILLS
Human Error Detail
Cause gallonsProcedural error 45,174 Inattention / distrac-tion
420
• Inattention / distraction (99%) was the main cause of spills attrib-uted to Human Error.

18
Marine50%
Fresh Water47%
Land2%
Impermeable surface1.2%
Crude Oil Spills by Medium Impacted (2016)(percent total volume)
0
5,000
10,000
15,000
20,000
25,000
30,000
35,000
40,000
45,000
50,000
AK CA HI OR WA
Volu
me
Rel
ease
d (g
allo
ns)
Impermeable surface
Land
Fresh Water
Marine
Crude Spills by Medium and State (2016)
2016CRUDE SPILLS
Summary by Medium
Medium GallonsMarine 44,755
Fresh Water 42,042
Land 1,291
Impermeable surface 1,039
• During 2016, crude spills to Marine (50%) and Fresh water (47%) comprised most of the total volume.

Releases by Product (2002-2016)
Product Spill Count Gallons % Total Volume
Crude oil 1,492 3,218,226 26.7%Diesel oil / marine gas oil 6,957 3,067,105 25.4%Oily water mixture 593 1,672,286 13.9%Bunker C / IFO / HFO 102 735,426 6.1%Gasoline 586 689,092 5.7%Other 390 583,766 4.8%Asphalt / creosote 166 575,359 4.8%Mineral oil / transformer oil 1,417 425,830 3.5%Kerosene / jet fuel 304 279,270 2.3%Aviation gasoline 167 154,511 1.3%Waste oil 338 138,803 1.2%Unknown 148 135,164 1.1%Lube oil / motor oil 571 134,658 1.1%Hydraulic oil 778 98,928 0.8%Heating oil 288 67,853 0.6%Edible / vegetable oil 80 57,682 0.5%Oily waste 5 20,392 0.2%LNG / LPG 16 12,590 0.1%Aviation fuel 2 1,607 0.01%Cutter stock 1 100 0.001%
Total 14,401 12,068,648
SUMMARY OF SPILLS(2002-2016)
• A total of 14,401, releases occurred during the 15-year period 2002-2016, with a total volume of approximately 12.1 million gal-lons.
0.00
0.20
0.40
0.60
0.80
1.00
1.20
1.40
1.60
1.80
0
200
400
600
800
1,000
1,200
1,400
1,600
2002 2003 2004 2005 2006 2007 2008 2009 2010 2011 2012 2013 2014 2015 2016
Volu
me
Rel
ease
d (m
illio
n ga
llons
)
Num
ber o
f Spi
lls
Volume Released Number of Spills
Number of Spills and Volume Released (2002-2016)
20
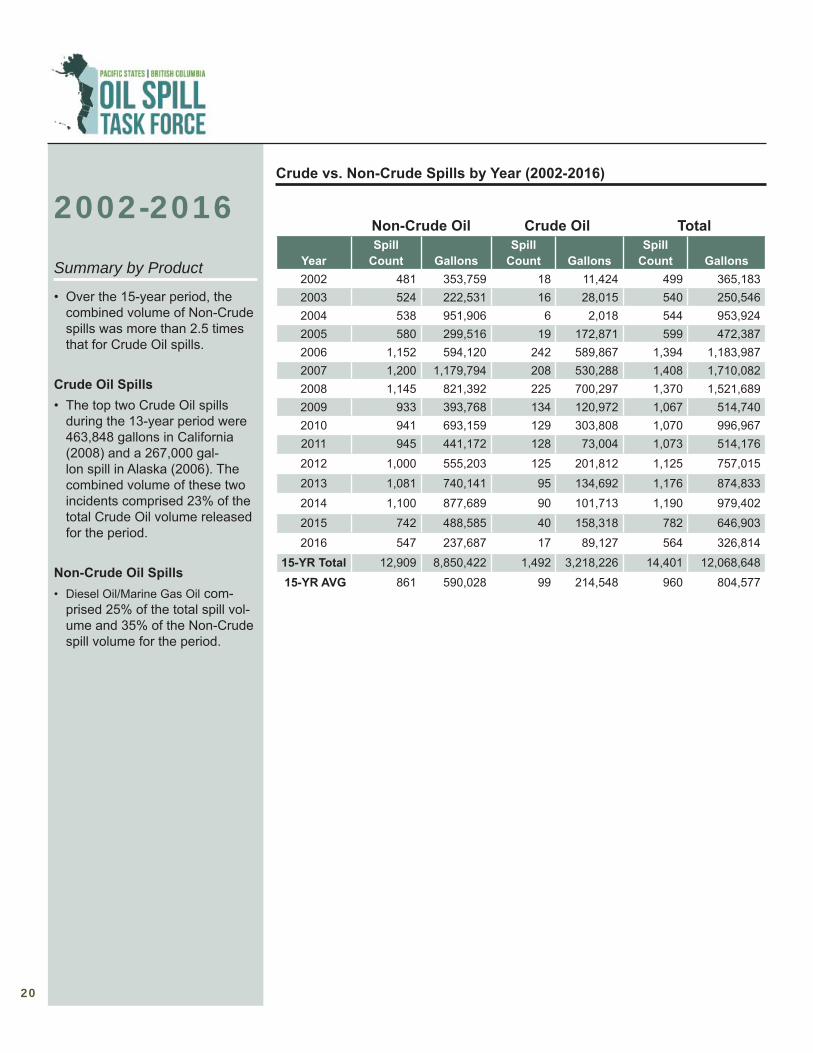
2002-2016Summary by Product
• Over the 15-year period, the combined volume of Non-Crude spills was more than 2.5 times that for Crude Oil spills.
Crude Oil Spills• The top two Crude Oil spills
during the 13-year period were 463,848 gallons in California (2008) and a 267,000 gal-lon spill in Alaska (2006). The combined volume of these two incidents comprised 23% of the total Crude Oil volume released for the period.
Non-Crude Oil Spills• Diesel Oil/Marine Gas Oil com-
prised 25% of the total spill vol-ume and 35% of the Non-Crude spill volume for the period.
Crude vs. Non-Crude Spills by Year (2002-2016)
Non-Crude Oil Crude Oil Total
YearSpill
Count GallonsSpill
Count GallonsSpill
Count Gallons2002 481 353,759 18 11,424 499 365,1832003 524 222,531 16 28,015 540 250,5462004 538 951,906 6 2,018 544 953,9242005 580 299,516 19 172,871 599 472,3872006 1,152 594,120 242 589,867 1,394 1,183,9872007 1,200 1,179,794 208 530,288 1,408 1,710,0822008 1,145 821,392 225 700,297 1,370 1,521,6892009 933 393,768 134 120,972 1,067 514,7402010 941 693,159 129 303,808 1,070 996,9672011 945 441,172 128 73,004 1,073 514,1762012 1,000 555,203 125 201,812 1,125 757,0152013 1,081 740,141 95 134,692 1,176 874,8332014 1,100 877,689 90 101,713 1,190 979,4022015 742 488,585 40 158,318 782 646,9032016 547 237,687 17 89,127 564 326,814
15-YR Total 12,909 8,850,422 1,492 3,218,226 14,401 12,068,64815-YR AVG 861 590,028 99 214,548 960 804,577
21
0
200,000
400,000
600,000
800,000
1,000,000
1,200,000
1,400,000
1,600,000
1,800,000
2,000,000
0
200,000
400,000
600,000
800,000
1,000,000
1,200,000
1,400,000
1,600,000
1,800,000
2,000,000
2002
2003
2004
2005
2006
2007
2008
2009
2010
2011
2012
2013
2014
2015
2016
Volu
me
(gal
lons
)
15-Year Average
Crude Oil
Non-Crude Oil
total Volume
Trend (Total Volume)
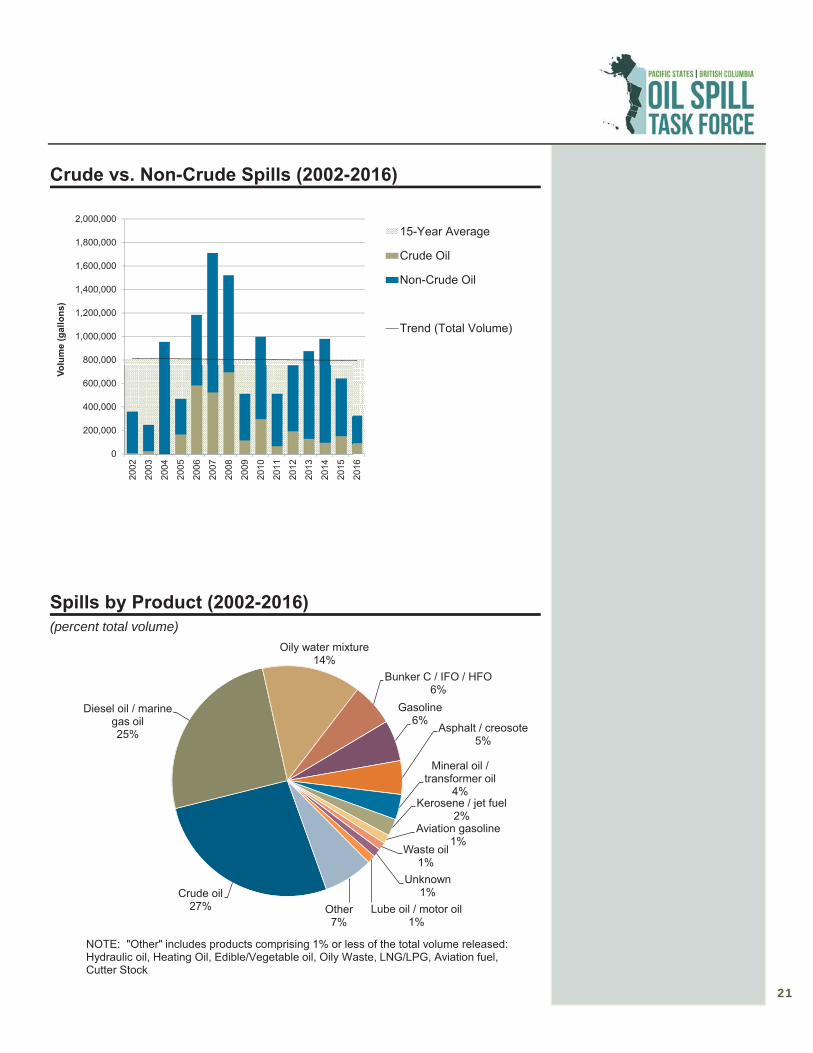
Crude vs. Non-Crude Spills (2002-2016)
Spills by Product (2002-2016)(percent total volume)
Crude oil27%
Diesel oil / marine gas oil25%
Oily water mixture14%
Bunker C / IFO / HFO6%
Gasoline6% Asphalt / creosote
5%
Mineral oil / transformer oil
4%Kerosene / jet fuel
2%Aviation gasoline
1%Waste oil
1%Unknown
1%Lube oil / motor oil
1%Other7%
NOTE: "Other" includes products comprising 1% or less of the total volume released: Hydraulic oil, Heating Oil, Edible/Vegetable oil, Oily Waste, LNG/LPG, Aviation fuel, Cutter Stock

22
0
200,000
400,000
600,000
800,000
1,000,000
1,200,000
1,400,000
1,600,000
1,800,000
2002
2003
2004
2005
2006
2007
2008
2009
2010
2011
2012
2013
2014
2015
2016
Volu
me
Rel
ease
d (g
allo
ns)
Other/Unknown
Vessel
Vehicle
Pipeline
Facility
Annual Spill Volume by Source (2002-2016)2002-2016Summary by Source
• Overall, Facilities (50%) and Pipelines (19%) were the major sources of spills during the 15-year period.
• Facilities were the source of 53% of the Non-Crude spill volume.
• Pipelines (53%) and Facilities (43%) were the major sources of Crude Oil spills.
Non-Crude Oil Spill SourcesSource gallons
Facility 4,689,126 Vehicle 1,812,464 Vessel 1,171,451 Other/Unknown 578,007 Pipeline 577,930 Military 10,429 Public Lands 10,065 Farm/Agriculture 950
Total 8,850,422
Crude Oil Spill SourcesSource gallons
Pipeline 1,714,557 Facility 1,368,180 Vehicle 74,444 Other/Unknown 55,711 Vessel 5,334
Total 3,218,226

23
2002-2016Summary by Cause
• Overall, Equipment Failure (54%) and Human Error (30%) were the major spill causes.
• Equipment Failure (45%) and Human Error (37%) were the predominant causes for Non-Crude spills
• 78% of the total Crude Oil spill volume was due to Equipment Failure.
Non-Crude Oil Spills
Cause gallonsEquipment Failure 4,008,243 Human Error 3,316,649 Other/Unknown 1,028,282 External Conditions 300,912 Organizational / Man-agement Failure
196,336
Crude Oil SpillsCause gallons
Equipment Failure 2,508,600 Human Error 300,730 Other/Unknown 200,219 External Conditions 159,096 Organizational / Man-agement Failure
49,581
0
200,000
400,000
600,000
800,000
1,000,000
1,200,000
1,400,000
1,600,000
1,800,000
2002
2003
2004
2005
2006
2007
2008
2009
2010
2011
2012
2013
2014
2015
2016
Volu
me
Rel
ease
d (g
allo
ns)
Other/Unknown
Org/Mgmt failure
Human Error
External Conditions
Equipment Failure
Annual Spill Volume by Cause (2002-2016)
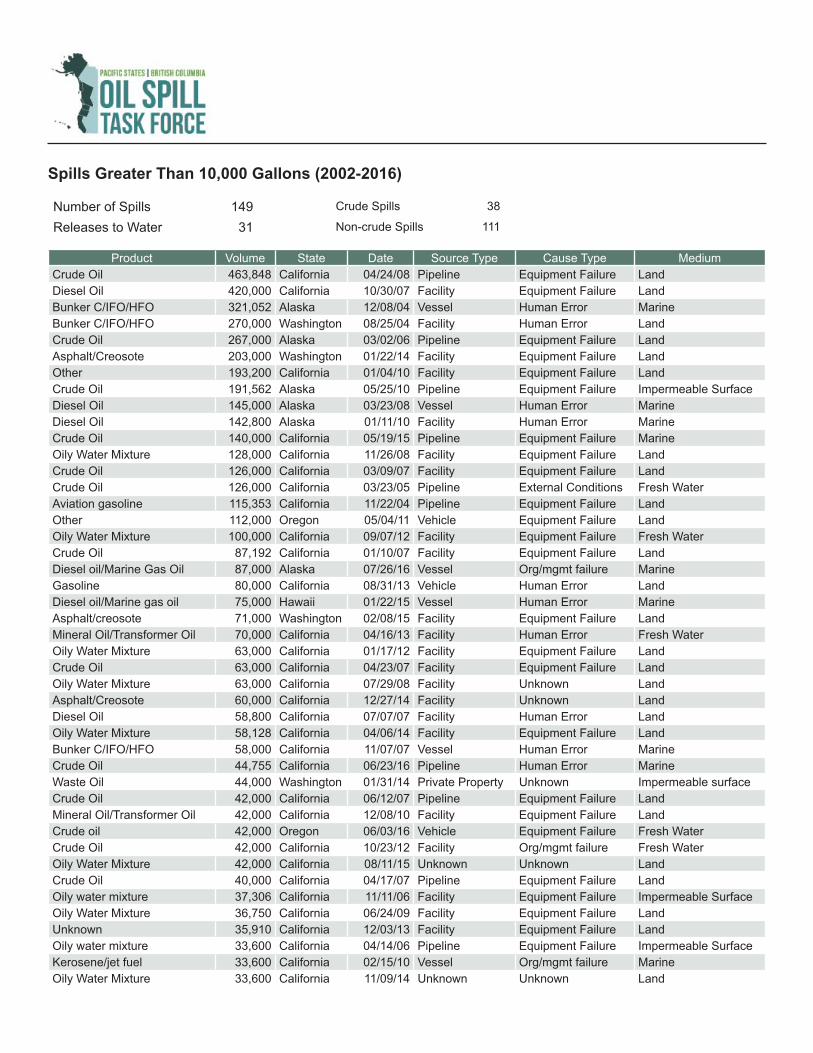
Spills Greater Than 10,000 Gallons (2002-2016)
Number of Spills 149 Crude Spills 38
Releases to Water 31 Non-crude Spills 111
Product Volume State Date Source Type Cause Type MediumCrude Oil 463,848 California 04/24/08 Pipeline Equipment Failure LandDiesel Oil 420,000 California 10/30/07 Facility Equipment Failure LandBunker C/IFO/HFO 321,052 Alaska 12/08/04 Vessel Human Error MarineBunker C/IFO/HFO 270,000 Washington 08/25/04 Facility Human Error LandCrude Oil 267,000 Alaska 03/02/06 Pipeline Equipment Failure LandAsphalt/Creosote 203,000 Washington 01/22/14 Facility Equipment Failure LandOther 193,200 California 01/04/10 Facility Equipment Failure LandCrude Oil 191,562 Alaska 05/25/10 Pipeline Equipment Failure Impermeable SurfaceDiesel Oil 145,000 Alaska 03/23/08 Vessel Human Error MarineDiesel Oil 142,800 Alaska 01/11/10 Facility Human Error MarineCrude Oil 140,000 California 05/19/15 Pipeline Equipment Failure MarineOily Water Mixture 128,000 California 11/26/08 Facility Equipment Failure LandCrude Oil 126,000 California 03/09/07 Facility Equipment Failure LandCrude Oil 126,000 California 03/23/05 Pipeline External Conditions Fresh WaterAviation gasoline 115,353 California 11/22/04 Pipeline Equipment Failure LandOther 112,000 Oregon 05/04/11 Vehicle Equipment Failure LandOily Water Mixture 100,000 California 09/07/12 Facility Equipment Failure Fresh WaterCrude Oil 87,192 California 01/10/07 Facility Equipment Failure LandDiesel oil/Marine Gas Oil 87,000 Alaska 07/26/16 Vessel Org/mgmt failure MarineGasoline 80,000 California 08/31/13 Vehicle Human Error LandDiesel oil/Marine gas oil 75,000 Hawaii 01/22/15 Vessel Human Error MarineAsphalt/creosote 71,000 Washington 02/08/15 Facility Equipment Failure LandMineral Oil/Transformer Oil 70,000 California 04/16/13 Facility Human Error Fresh WaterOily Water Mixture 63,000 California 01/17/12 Facility Equipment Failure LandCrude Oil 63,000 California 04/23/07 Facility Equipment Failure LandOily Water Mixture 63,000 California 07/29/08 Facility Unknown LandAsphalt/Creosote 60,000 California 12/27/14 Facility Unknown LandDiesel Oil 58,800 California 07/07/07 Facility Human Error LandOily Water Mixture 58,128 California 04/06/14 Facility Equipment Failure LandBunker C/IFO/HFO 58,000 California 11/07/07 Vessel Human Error MarineCrude Oil 44,755 California 06/23/16 Pipeline Human Error MarineWaste Oil 44,000 Washington 01/31/14 Private Property Unknown Impermeable surfaceCrude Oil 42,000 California 06/12/07 Pipeline Equipment Failure LandMineral Oil/Transformer Oil 42,000 California 12/08/10 Facility Equipment Failure LandCrude oil 42,000 Oregon 06/03/16 Vehicle Equipment Failure Fresh WaterCrude Oil 42,000 California 10/23/12 Facility Org/mgmt failure Fresh WaterOily Water Mixture 42,000 California 08/11/15 Unknown Unknown LandCrude Oil 40,000 California 04/17/07 Pipeline Equipment Failure LandOily water mixture 37,306 California 11/11/06 Facility Equipment Failure Impermeable SurfaceOily Water Mixture 36,750 California 06/24/09 Facility Equipment Failure LandUnknown 35,910 California 12/03/13 Facility Equipment Failure LandOily water mixture 33,600 California 04/14/06 Pipeline Equipment Failure Impermeable SurfaceKerosene/jet fuel 33,600 California 02/15/10 Vessel Org/mgmt failure MarineOily Water Mixture 33,600 California 11/09/14 Unknown Unknown Land

Product Volume State Date Source Type Cause Type MediumDiesel Oil/Marine Gas Oil 32,000 California 01/25/13 Vehicle External Conditions Fresh WaterOily Water Mixture 31,500 California 06/10/08 Facility External Conditions LandOily Water Mixture 31,500 California 12/03/09 Facility Equipment Failure LandDiesel oil/Marine Gas Oil 30,847 Alaska 08/15/15 Facility Equipment Failure LandOily Water Mixture 30,240 California 04/20/07 Facility Equipment Failure LandOily Water Mixture 30,000 California 02/03/14 Vehicle Other Fresh WaterDiesel Oil 30,000 Oregon 05/09/02 Other External Conditions Fresh WaterGasoline 29,400 California 08/14/05 Pipeline Human Error LandCrude Oil 29,400 California 10/01/06 Facility Equipment Failure Impermeable SurfaceGasoline 27,500 California 04/25/07 Vehicle Equipment Failure LandJet fuel/Kerosene 27,000 Hawaii 01/13/14 Facility Equipment Failure LandGasoline 27,000 Washington 03/23/12 Facility Equipment Failure LandCrude Oil 26,460 California 01/30/06 Pipeline Human Error LandCrude Oil 26,250 California 06/11/08 Facility Equipment Failure LandOily Water Mixture 26,250 California 06/17/09 Facility Equipment Failure LandCrude Oil 25,200 California 11/24/12 Facility Equipment Failure LandOily Water Mixture 25,200 California 07/07/15 Unknown Unknown LandCrude Oil 25,200 California 11/27/05 Pipeline Equipment Failure LandDiesel Oil 24,500 Washington 10/27/10 Facility Equipment Failure LandGasoline 24,500 Hawaii 10/06/04 Unknown Equipment Failure LandOily Water Mixture 24,360 California 05/09/14 Facility Human Error LandKerosene/Jet Fuel 24,000 Washington 03/01/05 Pipeline Equipment Failure LandKerosene/jet fuel 22,388 California 05/18/11 Vehicle Unknown MarineOily Water Mixture 21,546 California 06/27/08 Facility Equipment Failure LandCrude Oil 21,336 California 06/01/10 Pipeline Equipment Failure LandCrude Oil 21,000 California 11/06/06 Facility Unknown LandCrude Oil 21,000 California 12/10/13 Pipeline Unknown LandOily Water Mixture 21,000 California 03/29/07 Pipeline Human Error LandUnknown 21,000 Oregon 01/13/11 Vehicle Equipment Failure LandDiesel Oil 21,000 California 05/18/06 Pipeline Equipment Failure LandOily Water Mixture 21,000 California 07/11/08 Facility Equipment Failure LandOily Water Mixture 21,000 California 04/10/14 Facility Equipment Failure LandOther 21,000 California 06/04/03 Facility Equipment Failure MarineCrude Oil 20,622 California 09/06/08 Facility Equipment Failure LandAsphalt/Creosote 20,575 Washington 04/30/13 Facility Human Error LandAsphalt/Creosote 20,000 Washington 10/06/14 Vehicle Unknown LandOily Waste 20,000 Washington 11/13/14 Facility Equipment Failure Impermeable surfaceMineral Oil/Transformer Oil 20,000 Washington 03/25/13 Facility Equipment Failure LandDiesel Oil/Marine Gas Oil 20,000 California 04/13/13 Vessel Unknown MarineDiesel Oil 20,000 California 12/08/09 Facility Human Error LandDiesel Oil 20,000 California 11/07/12 Vessel Org/mgmt failure MarineDiesel Oil 20,000 California 05/02/05 Pipeline Equipment Failure LandGasoline 18,900 Hawaii 02/13/08 Facility Human Error LandCrude Oil 18,900 California 05/15/06 Facility Human Error LandDiesel Oil 18,200 Washington 11/03/06 Facility Equipment Failure LandCrude Oil 17,640 California 05/27/12 Facility Equipment Failure Land
Spills Greater than 10,000 Gallons -- continued

Product Volume State Date Source Type Cause Type MediumBunker C/IFO/HFO 17,000 California 09/14/11 Private Property Equipment Failure MarineCrude Oil 16,800 California 10/13/06 Pipeline Equipment Failure LandBunker C/IFO/HFO 16,800 California 08/07/07 Facility Equipment Failure LandCrude Oil 16,800 California 12/03/09 Facility Equipment Failure LandCrude Oil 16,800 California 06/02/06 Facility Equipment Failure Impermeable SurfaceOily Water Mixture 16,800 California 04/09/14 Facility Equipment Failure LandGasoline 16,800 California 03/24/06 Vehicle Unknown LandWaste Oil 15,750 Washington 06/12/06 Facility Equipment Failure LandDiesel Oil 15,000 Oregon 10/31/05 Facility Human Error Fresh WaterDiesel Oil 15,000 Washington 08/01/08 Facility Equipment Failure Impermeable SurfaceCrude Oil 14,700 California 03/02/14 Unknown Unknown LandOther 14,700 California 12/04/04 Pipeline Equipment Failure Fresh WaterDiesel Oil 14,680 Alaska 12/08/04 Vessel Human Error MarineEdible/Vegetable Oil 14,400 California 04/08/13 Facility Human Error LandOily Water Mixture 14,070 California 07/29/07 Facility Human Error LandDiesel Oil 14,000 Hawaii 11/01/11 Vessel Equipment Failure LandCrude Oil 14,000 California 03/07/03 Pipeline Equipment Failure LandOily water mixture 14,000 California 09/16/06 Pipeline Equipment Failure LandOily Water Mixture 13,659 California 01/10/07 Facility Equipment Failure LandKerosene/jet fuel 13,630 Alaska 10/30/08 Facility Equipment Failure LandBunker C/IFO/HFO 13,524 Washington 04/07/05 Facility Human Error LandCrude Oil 13,500 Alaska 11/29/09 Facility Equipment Failure LandOily Water Mixture 13,440 California 01/21/07 Facility External Conditions LandDiesel Oil 13,000 Hawaii 07/20/06 Vessel Equipment Failure MarineMineral oil/Transformer oil 13,000 Hawaii 03/22/07 Vessel Equipment Failure MarineAsphalt/Creosote 13,000 Oregon 08/11/04 Vehicle Equipment Failure LandCrude Oil 12,852 California 06/28/10 Facility Equipment Failure Fresh WaterOily Water Mixture 12,684 California 04/03/08 Facility Equipment Failure LandOily Water Mixture 12,600 California 10/15/12 Facility Equipment Failure LandAsphalt/creosote 12,600 California 11/13/09 Facility Human Error LandCrude Oil 12,600 California 11/09/14 Unknown Unknown LandOily Water Mixture 12,600 California 10/12/07 Pipeline Equipment Failure LandCrude Oil 12,600 California 11/26/07 Facility Equipment Failure LandOily water mixture 12,600 Alaska 01/29/07 Facility Equipment Failure LandCrude Oil 12,600 California 07/15/07 Facility Equipment Failure LandOily Water Mixture 12,600 California 12/03/09 Facility Equipment Failure LandDiesel Oil 12,248 Alaska 04/24/05 Facility Human Error LandOther/Unknown 12,118 Alaska 12/18/02 Facility Other LandMineral oil/Transformer oil 12,096 California 09/30/07 Pipeline Equipment Failure LandDiesel Oil 12,045 Alaska 01/19/12 Facility Human Error Impermeable SurfaceCrude Oil 12,012 California 06/28/12 Facility Equipment Failure LandCrude Oil 12,000 California 03/15/07 Facility Equipment Failure LandOily Water Mixture 11,970 California 05/01/07 Pipeline Equipment Failure LandOily Water Mixture 11,760 California 12/10/13 Facility Unknown LandCrude Oil 11,676 California 03/04/06 Facility Equipment Failure LandOther/Unknown 11,611 Alaska 02/26/02 Facility Other Land
Spills Greater than 10,000 Gallons -- continued

Product Volume State Date Source Type Cause Type MediumGasoline 11,300 Oregon 12/13/15 Vehicle Human Error LandDiesel Oil 11,000 Alaska 11/17/03 Facility Human Error LandGasoline 11,000 Washington 11/27/03 Vehicle Unknown Fresh WaterGasoline 11,000 Oregon 12/02/02 Vehicle Human Error Fresh WaterGasoline 11,000 Washington 03/23/09 Vehicle Human Error LandDiesel Oil 10,584 Hawaii 08/05/05 Pipeline Equipment Failure LandOily Water Mixture 10,500 California 04/11/08 Facility Human Error LandOily water mixture 10,500 California 05/29/06 Pipeline Equipment Failure Fresh WaterOily water mixture 10,500 California 08/12/06 Pipeline Equipment Failure LandOther 10,500 Washington 09/13/07 Facility Human Error LandAsphalt/Creosote 10,080 California 02/13/13 Facility Equipment Failure LandOily Water Mixture 10,080 California 09/29/14 Unknown Unknown LandCrude Oil 10,080 California 07/21/08 Pipeline Equipment Failure Land
Spills Greater than 10,000 Gallons -- continued