Embed Size (px)
Citation preview

Summary of the Previous Lecture
1. Differentiate and understand the various terms used to express value including liquidation value, going concern value, book value, market value and intrinsic value.
2. Determine the value of bonds, preferred stocks, and common stocks.
3. Dividend valuation models
4. Yield to maturity and determination of required rate of return
5. Behavior of bond prices under different conditions

Chapter 6 (I)
Financial Statement Analysis

After studying Chapter 6, you should be able to:1. Understand the purpose of basic financial statements and
their contents.
2. Explain why financial statement analysis is important to the firm and to outside suppliers of capital.
3. Define, calculate, and categorize (according to liquidity, financial leverage, coverage, activity, and profitability) the major financial ratios and understand what they can tell us about the firm.
4. Define, calculate, and discuss a firm’s operating cycle and cash cycle.

After studying Chapter 6, you should be able to:5. Use ratios to analyze a firm's health and then recommend
reasonable alternative courses of action to improve the health of the firm.
6. Analyze a firm’s return on investment (i.e., “earning power”) and return on equity using a DuPont approach.
7. Understand the limitations of financial ratio analysis.
8. Use trend analysis, common-size analysis, and index analysis to gain additional insights into a firm's performance.

Financial Statement Analysis
1. Financial Statements
2. A Possible Framework for Analysis
3. Balance Sheet Ratios
4. Income Statement and Income Statement/Balance Sheet Ratios
5. Trend Analysis
6. Common-Size and Index Analysis
1. Financial Statements
2. A Possible Framework for Analysis
3. Balance Sheet Ratios
4. Income Statement and Income Statement/Balance Sheet Ratios
5. Trend Analysis
6. Common-Size and Index Analysis

Examples of External Uses of Statement Analysis
Examples of External Uses of Statement Analysis
Trade Creditors -- Focus on the liquidity of the firm.
Bondholders -- Focus on the long-term cash flow of the firm.
Shareholders -- Focus on the profitability and long-term health of the firm.
Trade Creditors -- Focus on the liquidity of the firm.
Bondholders -- Focus on the long-term cash flow of the firm.
Shareholders -- Focus on the profitability and long-term health of the firm.

Examples of Internal Uses of Statement Analysis
Plan -- Focus on assessing the current financial position and evaluating potential firm opportunities.
Control -- Focus on return on investment for various assets and asset efficiency.
Understand -- Focus on understanding how suppliers of funds analyze the firm.
Plan -- Focus on assessing the current financial position and evaluating potential firm opportunities.
Control -- Focus on return on investment for various assets and asset efficiency.
Understand -- Focus on understanding how suppliers of funds analyze the firm.

Primary Types of Financial Statements
Income Statement A summary of a firm’s revenues and
expenses over a specified period, ending with net income or loss for the period.
Income Statement A summary of a firm’s revenues and
expenses over a specified period, ending with net income or loss for the period.
Balance Sheet A summary of a firm’s financial position on
a given date that shows total assets = total liabilities + owners’ equity.
Balance Sheet A summary of a firm’s financial position on
a given date that shows total assets = total liabilities + owners’ equity.

Basket Wonders’ Balance Sheet (Asset Side)
a. How the firm stands on a specific date.
b. What BW owned.c. Amounts owed by
customers.d. Future expense items
already paid.e. Cash/likely convertible to
cash within 1 year.f. Original amount paid.g. Acc. deductions for wear
and tear.
a. How the firm stands on a specific date.
b. What BW owned.c. Amounts owed by
customers.d. Future expense items
already paid.e. Cash/likely convertible to
cash within 1 year.f. Original amount paid.g. Acc. deductions for wear
and tear.
Cash and C.E. $ 90 Acct. Rec.c 394 Inventories 696 Prepaid Exp d 5 Accum Tax Prepay 10 Current Assetse $ 1,195 Fixed Assets (@Cost)f 1,030 Less: Acc. Depr. g (329)
Net Fix. Assets $ 701 Investment, LT 50 Other Assets, LT 223
Total Assets b $2,169
Basket Wonders Balance Sheet (thousands) Dec. 31, 2007a

Basket Wonders’ Balance Sheet (Liability Side)
a. Note, Assets = Liabilities + Equity.
b. What BW owed and ownership position.
c. Owed to suppliers for goods and services.
d. Unpaid wages, salaries, etc.
e. Debts payable < 1 year.f. Debts payable > 1 year.g. Original investment. h. Earnings reinvested.
a. Note, Assets = Liabilities + Equity.
b. What BW owed and ownership position.
c. Owed to suppliers for goods and services.
d. Unpaid wages, salaries, etc.
e. Debts payable < 1 year.f. Debts payable > 1 year.g. Original investment. h. Earnings reinvested.
Notes Payable $ 290 Acct. Payablec 94 Accrued Taxes d 16 Other Accrued Liab. d 100 Current Liab. e $ 500 Long-Term Debt f
530 Shareholders’ Equity Com. Stock ($1 par) g
200 Add Pd in Capital g
729 Retained Earnings h 210 Total Equity $1,139 Total Liab/Equitya,b $ 2,169
Basket Wonders Balance Sheet (thousands) Dec. 31, 2007

Basket Wonders’ Income Statement
a. Measures profitability over a time period.
b. Received, or receivable, from customers.
c. Sales comm., adv., officers’ salaries, etc.
d. Operating income.e. Cost of borrowed funds.f. Taxable income.g. Amount earned for
shareholders.
a. Measures profitability over a time period.
b. Received, or receivable, from customers.
c. Sales comm., adv., officers’ salaries, etc.
d. Operating income.e. Cost of borrowed funds.f. Taxable income.g. Amount earned for
shareholders.
Net Sales $ 2,211 Cost of Goods Sold b 1,599
Gross Profit $ 612 SG&A Expenses c 402 EBITd $ 210 Interest Expensee 59 EBT f $ 151 Income Taxes 60
EATg $ 91 Cash Dividends 38 Increase in RE $ 53
Basket Wonders Statement of Earnings (in thousands) for Year Ending December 31, 2007a

Framework for Financial Analysis
Analytical Tools Used
Sources and Uses Statement
Statement of Cash Flows
Cash Budgets
Analytical Tools Used
Sources and Uses Statement
Statement of Cash Flows
Cash Budgets
1. Analysis of the funds needs of the firm.
Trend / Seasonal Component
How much funding will be required in the future?
Is there a seasonal component?
Trend / Seasonal Component
How much funding will be required in the future?
Is there a seasonal component?
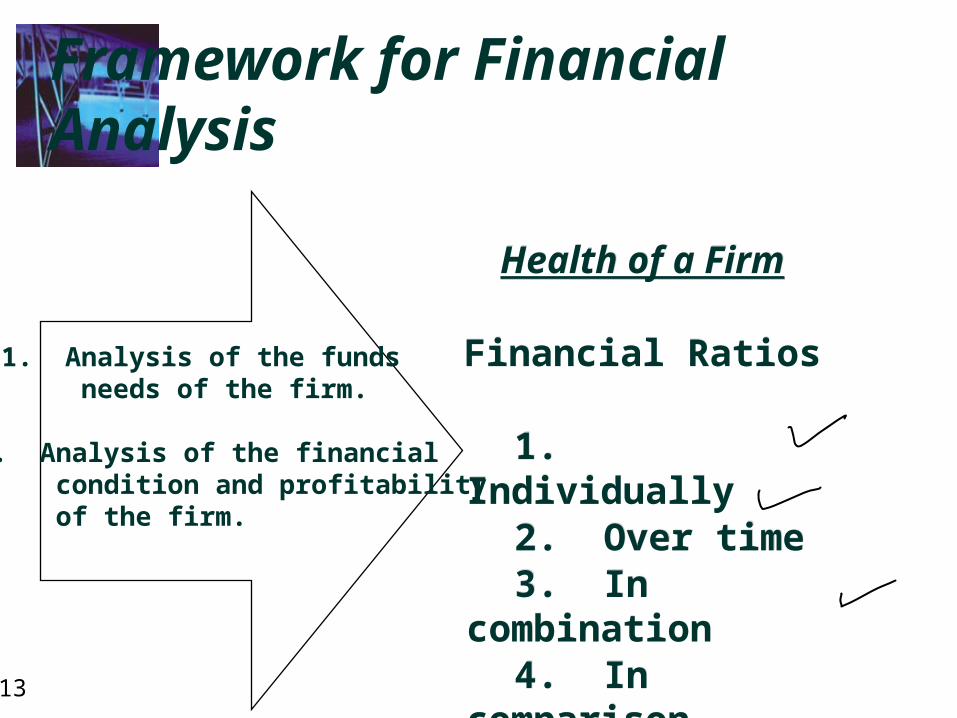
Framework for Financial Analysis
Health of a Firm
Financial Ratios
1. Individually2. Over time3. In
combination4. In
comparison
Health of a Firm
Financial Ratios
1. Individually2. Over time3. In
combination4. In
comparison
1. Analysis of the funds needs of the firm.
2. Analysis of the financial condition and profitability of the firm.

Framework for Financial Analysis
Examples:
Volatility in sales
Volatility in costs
Proximity to break-even point
Examples:
Volatility in sales
Volatility in costs
Proximity to break-even point
1. Analysis of the funds needs of the firm.
2. Analysis of the financial condition and profitability of the firm.
3. Analysis of the business risk of the firm.
Business risk relates to the risk inherent in the operations of the firm.
Business risk relates to the risk inherent in the operations of the firm.

Framework for Financial Analysis
A Financial Manager must consider all three jointly when determining the financing needs of the firm.
Determiningthe
financingneeds of the firm.
1. Analysis of the funds needs of the firm.
2. Analysis of the financial condition and profitability of the firm.
3. Analysis of the business risk of the firm.
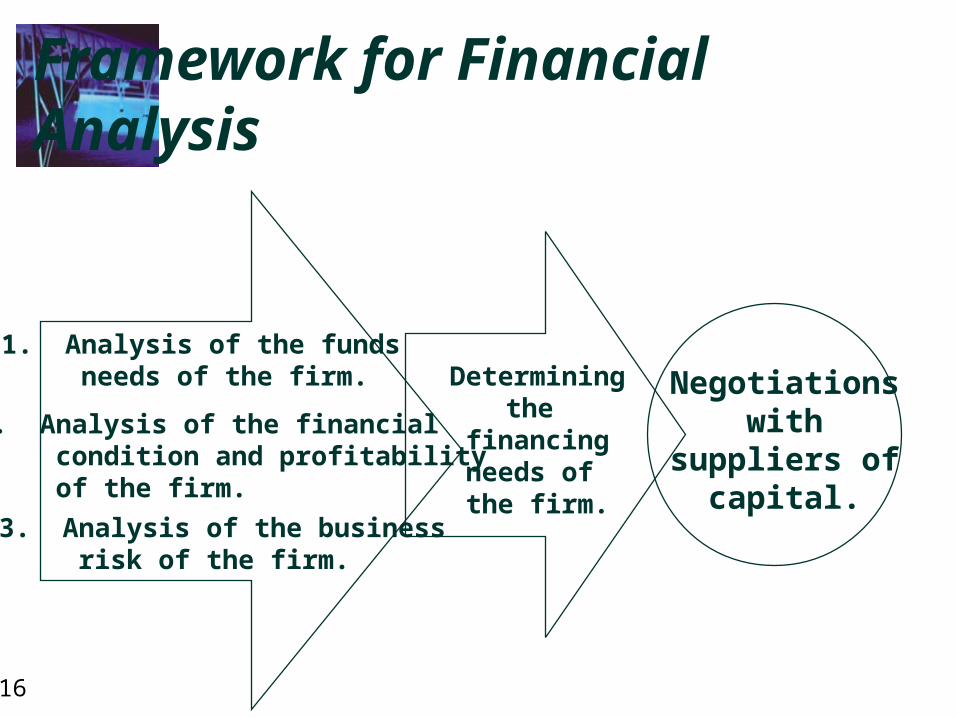
Framework for Financial Analysis
Negotiationswith
suppliers ofcapital.
Determiningthe
financingneeds of the firm.
1. Analysis of the funds needs of the firm.
2. Analysis of the financial condition and profitability of the firm.
3. Analysis of the business risk of the firm.

Use of Financial Ratios
A Financial Ratio is an index that relates two accounting numbers and is obtained by dividing one number by the other.
Types of Comparisons
Internal Comparisons
External Comparisons

External Comparisons and Sources of Industry Ratios
This involves comparing the ratios of one firm with those of similar firms or with industry averages. Similarity is important as one should compare “apples to apples.”
Examples:
Risk Management Association
Dun & Bradstreet
Almanac of Business and Industrial Financial Ratios

Liquidity Ratios
Current
Current Assets Current Liabilities
For Basket Wonders December 31, 2007
Shows a firm’s ability to cover its current liabilities with its current assets.
Balance Sheet RatiosBalance Sheet Ratios
Liquidity RatiosLiquidity Ratios
$1,195 $500$1,195 $500
= 2.39= 2.39

Liquidity Ratio Comparisons
BW Industry
2.39 2.15
2.26 2.09
1.91 2.01
Year
2007
2006
2005
Current Ratio
Ratio is stronger than the industry average.

Liquidity Ratios
Acid-Test (Quick)
Current Assets - Inv
Current Liabilities
For Basket Wonders
December 31, 2007
Shows a firm’s ability to meet current liabilities with its most liquid assets.
Balance Sheet Ratios
Liquidity Ratios
$1,195 - $696$500
= 1.00

Liquidity Ratio Comparisons
BW Industry
1.00 1.25
1.04 1.23
1.11 1.25
Year
2007
2006
2005
Acid-Test Ratio
Ratio is weaker than the industry average.

Summary of the Liquidity Ratio Comparisons
• Strong current ratio and weak acid-test ratio indicates a potential problem in the inventories account.
• Note that this industry has a relatively high level of inventories.
Ratio BW Industry
Current 2.39 2.15
Acid-Test1.00 1.25

Current Ratio -- Trend Analysis Comparison
1.5
1.7
1.9
2.1
2.3
2.5
2005 2006 2007
Analysis Year
Rat
io V
alu
e
BW
Industry
Trend Analysis of Current Ratio

Acid-Test Ratio -- Trend Analysis Comparison
0.5
0.8
1.0
1.3
1.5
2005 2006 2007
Analysis Year
Rat
io V
alu
e
BW
Industry
Trend Analysis of Acid-Test Ratio

Summary of the Liquidity Trend Analyses
The current ratio for the industry has been rising slowly at the same time the acid-test ratio has been relatively stable.
This indicates that inventories are a significant problem for BW.
The current ratio for the industry has been rising slowly at the same time the acid-test ratio has been relatively stable.
This indicates that inventories are a significant problem for BW.
The current ratio for BW has been rising at the same time the acid-test ratio has been declining.
The current ratio for BW has been rising at the same time the acid-test ratio has been declining.

Financial Leverage Ratios
Debt-to-Equity
Total DebtShareholders’ Equity
For Basket Wonders December 31, 2007
Shows the extent to which the firm is financed by debt.
Balance Sheet Ratios
Financial LeverageRatios
$1,030$1,139
= .90

Financial Leverage Ratio Comparisons
BW Industry
.90 .90
.88 .90
.81 .89
Year
2007
2006
2005
Debt-to-Equity Ratio
BW has average debt utilizationrelative to the industry average.
Financial Leverage Ratios
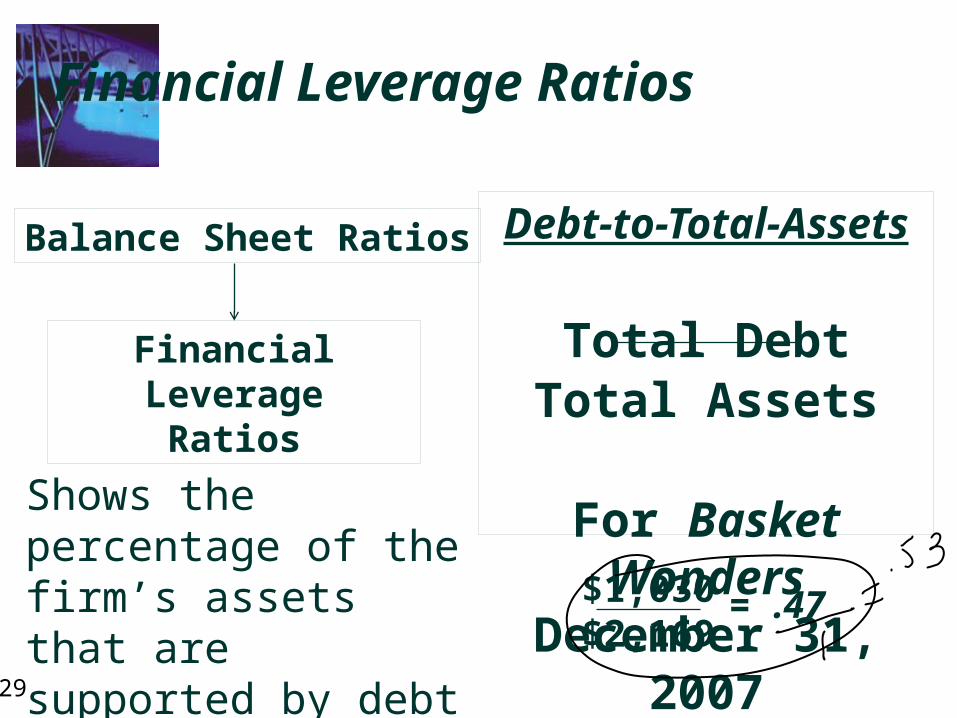
Debt-to-Total-Assets
Total DebtTotal Assets
For Basket Wonders
December 31, 2007
Shows the percentage of the firm’s assets that are supported by debt financing.
Balance Sheet Ratios
Financial LeverageRatios
$1,030$2,169
= .47

Financial Leverage Ratio Comparisons
BW Industry
.47 .47
.47 .47
.45 .47
Year
2007
2006
2005
Debt-to-Total-Asset Ratio
BW has average debt utilization relative to the industry average.

Financial Leverage Ratios
Total Capitalization
Long-term DebtTotal Capitalization
For Basket Wonders
December 31, 2007
Shows the relative importance of long-term debt to the long-term financing of the firm.
Balance Sheet Ratios
Financial LeverageRatios
$530$1,669
= .32
(i.e., LT-Debt + Equity)

Financial Leverage Ratio Comparisons
BW Industry
.32 .30
.32 .31
.37 .32
Year
2007
2006
2005
Total Capitalization Ratio
BW has average long-term debt utilizationrelative to the industry average.

Coverage Ratios
Interest Coverage
EBITInterest Charges
For Basket Wonders
December 31, 2007
Indicates a firm’s ability to cover interest charges.
Income StatementRatios
Coverage Ratios
$210$59
= 3.56

Coverage Ratio Comparisons
BW Industry
3.56 5.19
4.35 5.02
10.30 4.66
Year
2007
2006
2005
Interest Coverage Ratio
BW has below average interest coveragerelative to the industry average.

Coverage Ratio -- Trend Analysis Comparison
3.0
5.0
7.0
9.0
11.0
2005 2006 2007
Analysis Year
Rat
io V
alu
e
BW
Industry
Trend Analysis of Interest Coverage Ratio

Summary of the Coverage Trend Analysis
This indicates that low earnings (EBIT) may be a potential problem for BW.
Note, we know that debt levels are in line with the industry averages.
The interest coverage ratio for BW has been falling since 2005. It has been below industry averages for the past two years.

Summary Of the Lecture
Liquidity Ratios Current = Current Assets/Current Liabilities Acid Test (Quick) = (Current assets – Inventory)/Current
Liabilities Leverage Ratios Debt to to Equity = Total Debt/Shareholder’s equity Debt to Total Assets = Total Debt / Total Assets Coverage Ratio Interest Coverage Ratio = EBIT / Interest Expense