Embed Size (px)
Citation preview
Summary of Resources and Land Use Issues
Related to Riparian Areas
in the
Seine River Watershed Study Area
Agriculture and Agri-Food Canada - Prairie Farm Rehabilitation Administration (AAFC-PFRA) Winnipeg, MB
2005

Preface This report is one of a series of watershed summary reports completed for the Agriculture Environmental Sustainable Initiative’s Riparian Areas: Planning and Priority Setting project. Due to scale and data accuracy limitations, these reports do not replace the need for site-specific analysis; rather, they serve as a generalized guide for overall planning purposes on a watershed basis. These reports are available in .pdf format on the Manitoba Riparian Health Council’s website (www.riparianhealth.ca), or can be obtained by contacting: Agriculture and Agri-Food Canada - Prairie Farm Rehabilitation Administration Prairies East Region, 200-303 Main Street Winnipeg, Mb R3C 3G7 Tel: (204)983-2243 Fax: (204)983-2178 Information contained in this report may be quoted and utilized with appropriate reference to the originating agency. The authors and originating agency assume no responsibility for the misuse, alteration, re-packaging, or re-interpretation of the information. Citation: Agriculture and Agri-Food Canada - Prairie Farm Rehabilitation Administration, Prairies East Region. 2004. Summary of Resources and Land Use Issues Related to Riparian Areas in the Seine River Watershed Study Area. Agriculture and Agri-Food Canada - Prairie Farm Rehabilitation Administration, Winnipeg. Acknowledgements: Funding for this project was provided by the Manitoba Rural Adaptation Council. The following individuals from AAFC-PFRA contributed significantly to the compilation, interpretation and derivation of the information contained in this report. Professional expertise was provided by: P. Michiels, T. Horechko, J. Fitzmaurice, J. Powers, R. Lewis, T. Scott, N. Mischuk, J. Tokarchuk Technical support was provided by: C. Wyrzykowski, K. Gottfried, R. Aquino, S. Garrick, S. Solivar, J. Bergthorson, N. Diehl, R. Rosario

1
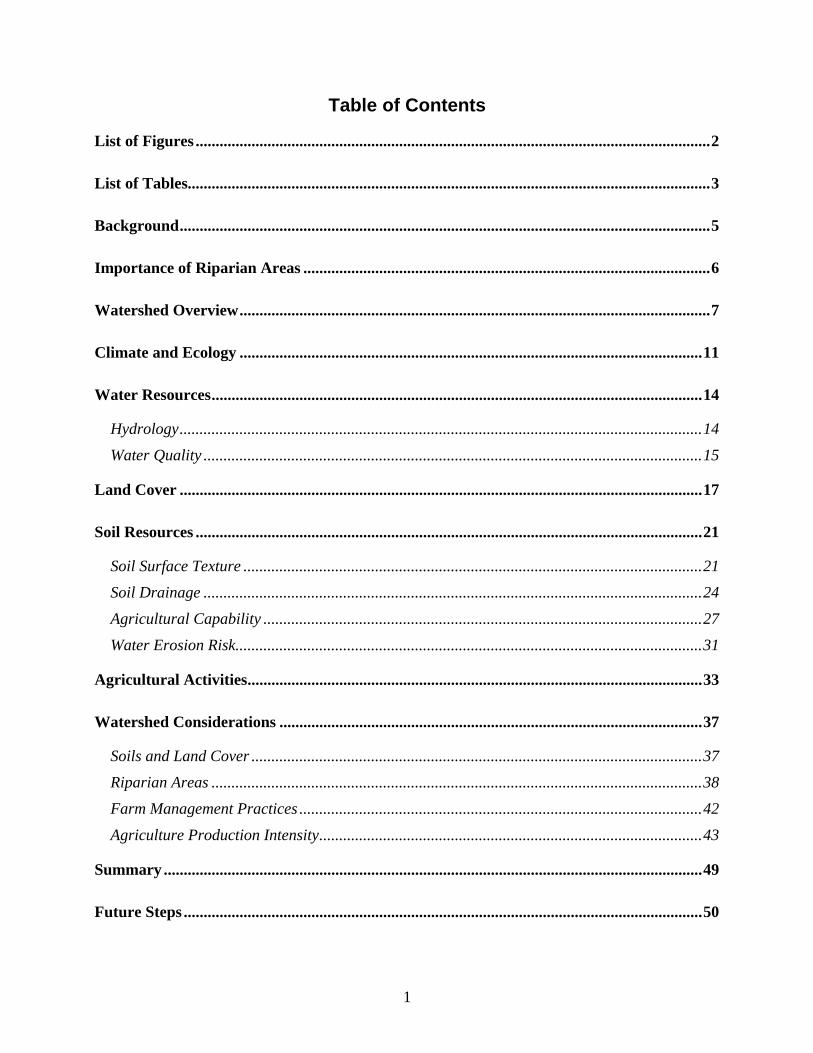
Table of Contents
List of Figures .................................................................................................................................2
List of Tables...................................................................................................................................3
Background.....................................................................................................................................5
Importance of Riparian Areas ......................................................................................................6
Watershed Overview......................................................................................................................7
Climate and Ecology ....................................................................................................................11
Water Resources...........................................................................................................................14
Hydrology...................................................................................................................................14
Water Quality .............................................................................................................................15
Land Cover ...................................................................................................................................17
Soil Resources ...............................................................................................................................21
Soil Surface Texture ...................................................................................................................21
Soil Drainage .............................................................................................................................24
Agricultural Capability ..............................................................................................................27
Water Erosion Risk.....................................................................................................................31
Agricultural Activities..................................................................................................................33
Watershed Considerations ..........................................................................................................37
Soils and Land Cover .................................................................................................................37
Riparian Areas ...........................................................................................................................38
Farm Management Practices .....................................................................................................42
Agriculture Production Intensity................................................................................................43
Summary .......................................................................................................................................49
Future Steps ..................................................................................................................................50

2
References .....................................................................................................................................51
Glossary.........................................................................................................................................54
Appendix A ...................................................................................................................................55
Appendix B ...................................................................................................................................56
Appendix C ...................................................................................................................................58
Appendix D ...................................................................................................................................61
List of Figures
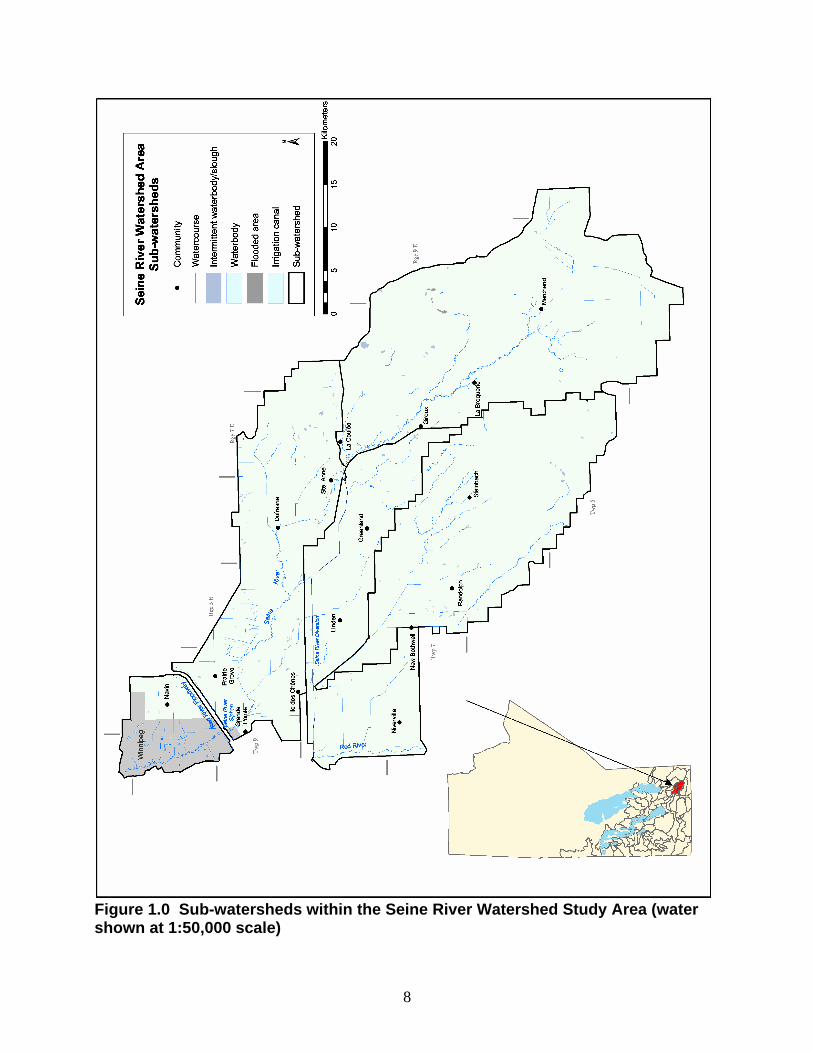
Figure 1.0 Sub-watersheds within the Seine River Watershed Study Area (water shown at 1:50,000 scale) .........................................................................................................................8
Figure 2.0 Digital elevation model of the Seine River Watershed Study Area (radar image was obtained by the Shuttle Radar Topography Mission, 2000)............................9
Figure 3.0 Rural municipalities in the Seine River Watershed Study Area ..........................10 Figure 4.0 Ecoregions and ecodistricts in the Seine River Watershed Study Area ..............13 Figure 5.0 Hydrometric gauging and water quality sampling stations in the Seine River
Watershed Study Area.........................................................................................................16 Figure 6.0 2001 Land cover in the Seine River Watershed Study Area.................................19 Figure 7.0 1994 Land cover in the Seine River Watershed Study Area.................................20 Figure 8.0 Soil surface texture in the Seine River Watershed Study Area ............................23 Figure 9.0 Soil drainage classes for the Seine River Watershed Study Area ........................26 Figure 10.0 Agricultural capability class in the Seine River Watershed Study Area...........30 Figure 11.0 Water erosion risk in the Seine River Watershed Study Area ...........................32 Figure 12.0 Density of shoreline in the Seine River Watershed Study Area, as determined
by the 1:50,000 NTS data sheets .........................................................................................40 Figure 13.0 Livestock density in the Seine River Watershed Study Area, as a percentage of
the highest value in Manitoba of 0.98 AU/ha (as reported in the 2001 Census of Agriculture)...........................................................................................................................45
Figure 14.0 Level of fertilizer use in the Seine River Watershed Study Area in 2000, as a percentage of the highest value in Manitoba of $101.23/ha (as reported in the 2001 Census of Agriculture) .........................................................................................................47
Figure 15.0 Level of pesticide use in the Seine River Watershed Study Area in 2000, as a percentage of the highest value in Manitoba of $81.65/ha (as reported in the 2001 Census of Agriculture) .........................................................................................................48

3
List of Tables
Table 1.0 Climate data for ecoregions within the Seine River Watershed Study Area........12 Table 2.0 Mean stream flow on the Seine River as recorded by hydrometric station
05OH006 (1942-1986) south-east of Prairie Grove, MB, and station 05OH009 (1986-2002) south of Prairie Grove. ..............................................................................................14
Table 3.0 Land cover (2001) and general trend over a seven-year period (1994 – 2001) in the Seine River Watershed Study Area..............................................................................18
Table 4.0 Soil surface texture in the Seine River Watershed Study Area..............................22 Table 5.0 Soil drainage classes for the Seine River Watershed Study Area..........................25 Table 6.0 Canada Land Inventory (CLI) class descriptions ...................................................27 Table 7.0 Canada Land Inventory (CLI) subclass descriptions .............................................28 Table 8.0 Agricultural capability in the Seine River Watershed Study Area and the major
type of limitations within each class. ..................................................................................29 Table 9.0 Water erosion risk classes in the Seine River Watershed Study Area ..................31 Table 10.0 Summary of cultivated crops (including crops cut for hay, silage, green feed,
etc.) grown in the Seine River Watershed Study Area (2001 Census) ............................34 Table 11.0 Summary of tillage practices in the Seine River Watershed Study Area (2001
Census) ..................................................................................................................................34 Table 12.0 Summary of the conservation practices carried out in the Seine River Watershed
Study Area (2001 Census) ...................................................................................................35 Table 13.0 Livestock distribution in the Seine River Watershed Study Area (2001
Census) ..................................................................................................................................36 Table 14.0 Summary of manure application in the Seine River Watershed Study Area in
2000 (from 2001 Census of Agriculture) ............................................................................37 Table 15.0 Summary of shoreline density in the Seine River Watershed Study Area
(includes permanent and intermittent streams and waterbodies). ..................................39 Table 16.0 Summary of land cover in a 50 m buffer around all waterbodies and on either
side of watercourses in the Seine River Watershed Study Area (using 2001 satellite imagery and 1:50,000 NTS water layers) ...........................................................................42
Table 17.0 Comparison of livestock density in the Seine River Watershed Study Area using 2001 Census livestock numbers converted to Animal Units1 ...........................................44
Table 18.0 – Comparison of crop production intensity the Seine River Watershed Study Area using dollars spent on pesticides and fertilizers in 2000, (as reported in the 2001 Census of Agriculture) .........................................................................................................46

4
5
Background Riparian areas play an important role in surface water quality and their ability to carry out this function can be affected by anthropogenic activities on the landscape. Agriculture is only one component, with other human activities such as industry, recreation and residences contributing to degraded riparian areas. The intent of this report is to be a first step towards addressing the issue of riparian health, with respect to agriculture, in the watershed study area. By providing information on the land resources and the agricultural activities in the study area, a better understanding of the issue can be obtained which will assist towards better planning and priority setting by local decision makers, land use planners and policy decision-makers. While this reports studies the agricultural aspect of the watershed study area, in a true watershed study, all factors of activities of all sectors must be considered. This project is a component of the Agriculture and Agri-Food Canada – Prairie Farm Rehabilitation Administration (AAFC-PFRA) Agricultural Riparian Areas: Planning and Performance Monitoring project. Funding was provided by the Manitoba Rural Adaptation Council (MRAC), through the Agricultural Environmental Stewardship Initiative (AESI). The purpose of this project is to provide a central source of riparian-related resource information in a format that is easily accessible to land use planners and policy decision-makers. The information provided can assist in strategic planning for riparian areas in Manitoba. Through the identification of potential problem areas, decision makers can make informed land use decisions that target priority areas. As part of the Agricultural Riparian Areas: Planning and Performance Monitoring project, AAFC-PFRA has collected, analyzed, and displayed riparian-related data using an Internet Map Server (IMS). The IMS web server is designed to be a one-stop source of riparian-related data and information relevant for analysis, land-use planning, and program design. The IMS site is available under the tools menu on the Riparian Health Council website (www.riparianhealth.ca). The Riparian Health Council (RHC) is comprised of government and non-government agencies with an interest in increasing producer involvement and improving the coordination of cooperative efforts among agencies that develop riparian projects with landowners throughout Manitoba. The Council has developed a vision for cooperative programming that enhances riparian areas and surface water quality across agro-Manitoba while also supporting landowner needs. This project will provide information which can assist the RHC in achieving its vision. The boundaries used in this report are based on the watershed layer produced by a joint venture between Manitoba Conservation and AAFC-PFRA. For reporting purposes, water flow direction data was used to amalgamate individual sub-watershed units into larger sub-watershed and watershed groups (refer to Appendix D). Due to scale and data accuracy limitations, neither this report nor the information and data provided on the RHC website can replace the need for site-specific analysis. However, these information sources can serve as a guide for general watershed planning purposes.

6
Importance of Riparian Areas Although riparian areas occupy only a small percentage of the area of a watershed, they represent an extremely important component of the overall landscape. They are the transitional areas between the aquatic and surrounding upland area. These “green zones” are one of the most ecologically diverse ecosystems. A healthy riparian area can perform a number of ecological functions, including trapping sediment, building and maintaining streambanks, storing floodwater and energy, recharging groundwater, filtering and buffering water, reducing and dissipating stream energy, maintaining biodiversity and creating primary productivity. These functions are essential for sustaining a majority of fish and wildlife species, maintaining functioning watersheds, providing good water quality, forage for livestock and supporting people on the landscape. Disturbance and alteration of a riparian area will impact its ability to carry out these ecological functions. Impacted riparian areas will have a reduced capacity to trap and store sediment and nutrients and stabilizing streambanks (important for surface water quality), provide fish and wildlife habitat, etc. Recognizing that many sectors contribute to the alteration of riparian areas, including agriculture, recreation, urban and residential development, and forestry, this report will focus on the agricultural impacts to riparian areas in an attempt to provide information that can be used by the agricultural industry to begin to address the issue of riparian health.
7
Watershed Overview The Seine River Watershed Study Area is approximately 210,748 ha in size and is comprised of four sub-watershed units (refer to Figure 1.0). The watershed drains into the Seine River, which has its headwaters in the Sandilands Provincial Forest. The river meanders northwest through the watershed and converges with the Red River in the City of Winnipeg. There is a small lake, Lac Bosse, present in this watershed, 20 km north of Marchand, as well as a few intermittent waterbodies and wetlands. The Seine River Diversion is present central watershed which drains the southwest part of the study area as well as diverts water from the Seine into the Red River. The Seine River Siphon is also present in the study area where the river meets with the Red River Floodway. When the floodway was built, the siphon was buried underneath to allow for the Seine River to continue flowing into Winnipeg. The siphon can handle a lower capacity of water per second than normal river capacity, which means the downstream portions will never receive a spring flush, protecting the city from flooding. Changes in elevation occur throughout the watershed, with values ranging from 398 metres above sea level (masl) in the south-eastern portion of the watershed, down to 224 masl in the north-western region (refer to Figure 2.0). The northern half of the watershed remains fairly level, while the southern half sees an elevation increase of over 125 meters over a 40 km stretch. At the time of this report, part of the study area is served by a Conservation District. The Seine-Rat River Conservation District covers 58,111 ha of area in this watershed, which corresponds to the Rural Municipality of La Broquerie. Eleven Rural Municipalities (RM’s) are contained within the watershed boundary, and include Taché, Hanover, Ste. Anne and La Broquerie (refer to Figure 3). The City of Winnipeg is also present in this watershed and is located in the north-western corner of the watershed. The Sandilands Provincial Forest covers a small portion of the watershed and is used recreationally for activities such as hiking, biking and skiing. Though the City of Winnipeg has the majority of the population in the watershed, outside the city limits, the population is predominantly rural and farm-based. Larger towns and communities within the watershed include Ile des Chênes, Grande Pointe, Steinbach, Ste. Anne and Niverville. The City of Winnipeg portion in this watershed adds not only to the population of the watershed, but to the diversity of revenue sources. Agriculture is the main industry in the communities within the watershed, however, there is also some forestry along the eastern edge of the watershed, and tourism and recreation in the Sandilands Provincial Forest, which offer additional income.
8
Figure 1.0 Sub-watersheds within the Seine River Watershed Study Area (water shown at 1:50,000 scale)

9
Figure 2.0 Digital elevation model of the Seine River Watershed Study Area (radar image was obtained by the Shuttle Radar Topography Mission, 2000)

10
Figure 3.0 Rural municipalities in the Seine River Watershed Study Area
11
Climate and Ecology The Canadian Ecological Land Classification System divides Canada’s natural landscapes into terrestrial ecozones, which are further sub-divided into ecoregions and ecodistricts. The classification system was developed by integrating surface vegetation cover, underlying geology, physiography, soils, and climate data (Smith et al. 1998). Ecozones, the most generalized level in Environment Canada’s ecological land classification system, are defined by Smith et al. (1998) as “areas of the earth’s surface representative of very generalized ecological units that consist of a distinctive assemblage of physical and biological characteristics”. Ecoregions are broad, integrated map units characterized by a unique combination of landscape physiography and ecoclimate. Ecodistricts are integrated map units characterized by relatively homogeneous physical landscape and climatic conditions and they contain Soil Landscapes of Canada polygons nested within them (Smith et al. 1998). Based on the Terrestrial Ecozones of Canada (Smith et al. 1998), this watershed contains three distinct ecozones (refer to Table 1.0, Figure 4.0). The Prairies Ecozone covers the western half of the study area, and contains the Lake Manitoba Plain Ecoregion (which further contains the Winnipeg Ecodistrict); the Boreal Plains Ecozone is found mid-watershed and contains the Interlake Plain Ecoregion (which further contains the Steinbach Ecodistrict); and the Boreal Shield Ecozone, located in the eastern section of the study area, contains the Lake of the Woods Ecoregion (which further contains the Stead and Piney Ecodistricts). The vegetation of the area varies based on moisture, landscape and other ecoregion characteristics. The Lake Manitoba Plain Ecoregion native vegetation consisted of tall and meadow grass communities, however this has largely disappeared due to cultivation and development (Smith et al. 1998). Local pockets of natural vegetation do occur in poorly-drained areas and in areas of unbroken land. In better drained areas, species such as bur oak and trembling aspen with an undergrowth of snowberry and red-osier dogwood occur. On flood plains and lower river terraces, white elm, basswood, cottonwood, Manitoba maple and green ash, with an understory of willows, ferns and associated herbaceous plants occur while shrubs such as saskatoon and high bush cranberry are found on both floodplains and high terraces. Some grassland species are also still present (for example, junegrass and Kentucky bluegrass), however trees have survived better in this region. Poorly drained sites and riparian areas support vegetation such as slough grasses, marsh reed grasses, cattails, sedges and shrubby willow. In contrast, the Interlake Plain Ecoregion is dominated by trembling aspen and balsam poplar, with an understory of red-osier dogwood and willow and a ground cover of grasses and herbs. Jack pine is also found on well-drained sandy areas. In this ecoregion, as well as the Lake of the Woods Ecoregion, water filled depressions, peatlands, bogs and organic soils support sedges, mosses, willow, tamarack and black spruce. The Lake of the Woods Ecoregion also has eastern white cedar and alder growing on shallow organic soils and swamps. Jack pine, trembling aspen, black
12
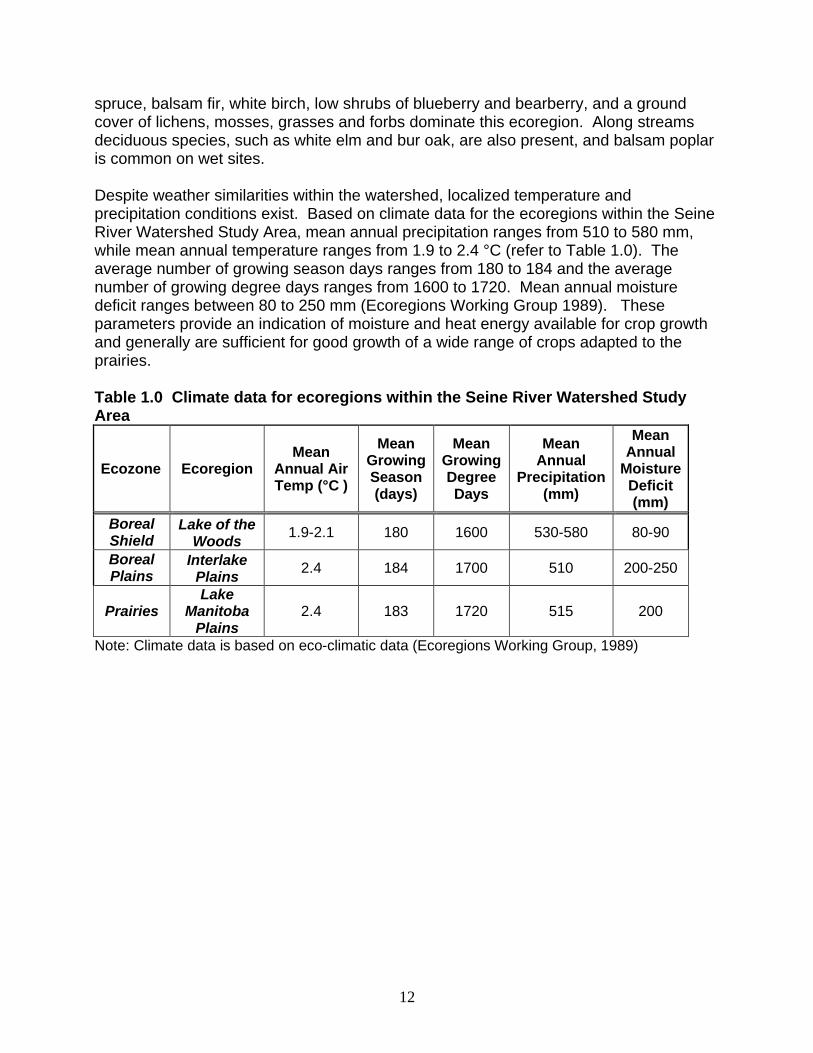
spruce, balsam fir, white birch, low shrubs of blueberry and bearberry, and a ground cover of lichens, mosses, grasses and forbs dominate this ecoregion. Along streams deciduous species, such as white elm and bur oak, are also present, and balsam poplar is common on wet sites. Despite weather similarities within the watershed, localized temperature and precipitation conditions exist. Based on climate data for the ecoregions within the Seine River Watershed Study Area, mean annual precipitation ranges from 510 to 580 mm, while mean annual temperature ranges from 1.9 to 2.4 °C (refer to Table 1.0). The average number of growing season days ranges from 180 to 184 and the average number of growing degree days ranges from 1600 to 1720. Mean annual moisture deficit ranges between 80 to 250 mm (Ecoregions Working Group 1989). These parameters provide an indication of moisture and heat energy available for crop growth and generally are sufficient for good growth of a wide range of crops adapted to the prairies. Table 1.0 Climate data for ecoregions within the Seine River Watershed Study Area
Ecozone Ecoregion Mean
Annual Air Temp (°C )
Mean Growing Season (days)
Mean Growing Degree Days
Mean Annual
Precipitation (mm)
Mean Annual
Moisture Deficit (mm)
Boreal Shield
Lake of the Woods
1.9-2.1 180 1600 530-580 80-90
Boreal Plains
Interlake Plains
2.4 184 1700 510 200-250
Prairies Lake
Manitoba Plains
2.4 183 1720 515 200
Note: Climate data is based on eco-climatic data (Ecoregions Working Group, 1989)

13
Figure 4.0 Ecoregions and ecodistricts in the Seine River Watershed Study Area

14
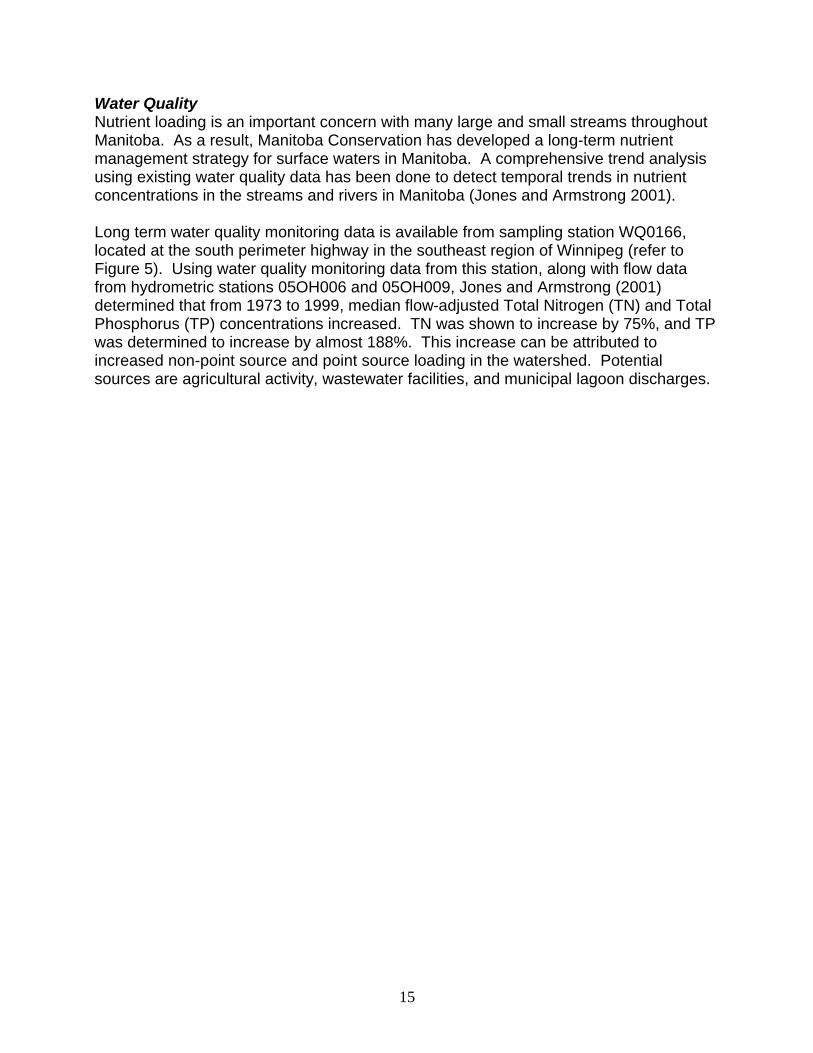
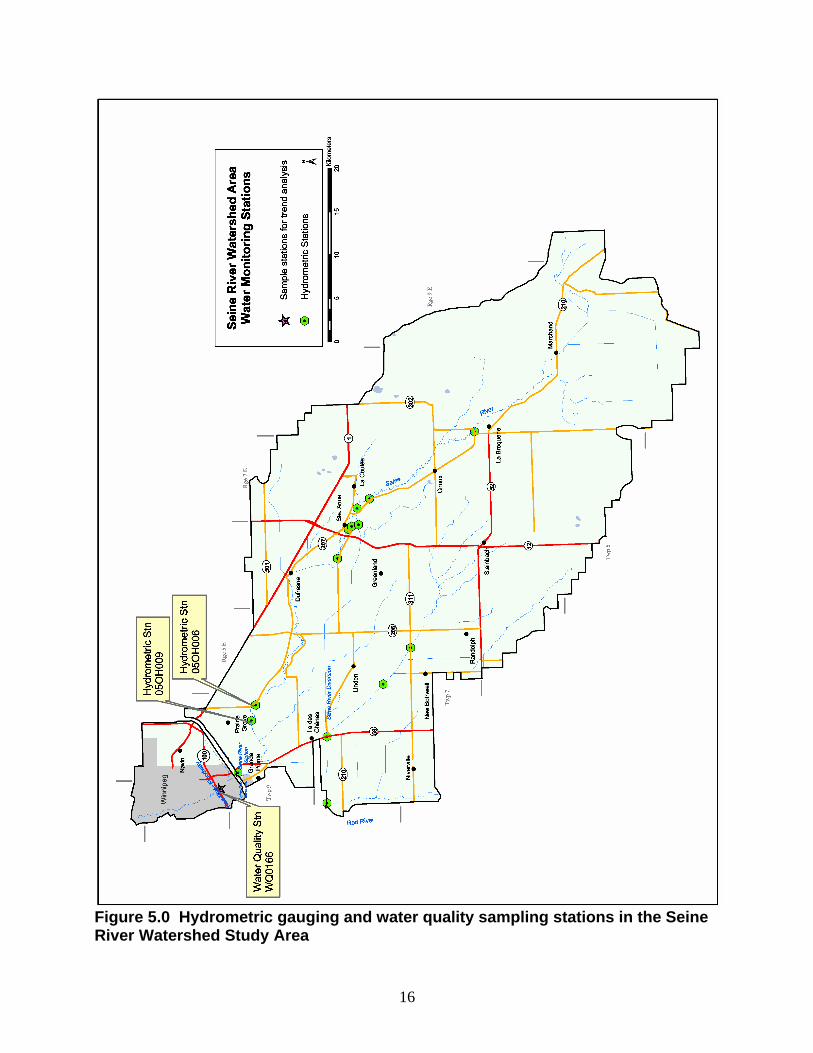
Water Resources Hydrology Small waterbodies, local creeks and ditches drain the study area into the Seine River and the Seine River Diversion. The Seine River makes its way northwest through the watershed to eventually join up with the Red River in the City of Winnipeg. The Seine River Siphon allows the river to cross under the Red River Floodway. The Seine River Diversion redirects water from the Seine into the Red River south of the Red River Floodway. The Seine River and the Seine River Diversion drains approximately 210,748 ha of land, much of which is devoted to intense cereal crop production and livestock production, including cattle, hogs and chickens. Based on the 1:50,000 National Topographic Series (NTS) data sheets, this watershed contains approximately 1,269 km of river and stream shoreline (both sides of the waterways are included in the calculation) and 152 km of waterbody shoreline. Over half of the waterbody shoreline surrounds intermittent waterbodies. Hydrometric gauging stations within the province provide surface water level and stream-flow data that is used for the operation of water control works, flood forecasting, water management investigations, and hydrologic studies (Manitoba Conservation 2003). A network of fourteen hydrometric gauging stations have been installed within this watershed (refer to Figure 5.0). Mean annual flow rate out of the watershed, as measured by gauging station 05OH006 southeast of Prairie Grove is 1.49 m3/s. Mean annual flow rate as measured by gauging station 05OH009 south of Prairie Grove is 2.46 m3/s. Table 2.0 depicts the mean annual monthly flows as measured from these stations. Spring discharge, along with spring and summer rain events, create higher flow rates from March through to July, with the peak flow generally occurring in April. Table 2.0 Mean stream flow on the Seine River as recorded by hydrometric station 05OH006 (1942-1986) south-east of Prairie Grove, MB, and station 05OH009 (1986-2002) south of Prairie Grove.
Monthly Discharge (m3/s)
Station No. Jan Feb Mar Apr May Jun Jul Aug Sept Oct Nov Dec Jan-Dec
05OH006 0.11 0.09 0.68 7.12 3.70 2.88 1.17 0.81 1.17 1.25 0.89 0.24 1.49
05OH009 -- -- 1.27 3.95 2.17 0.87 0.94 0.58 0.59 0.62 -- -- 2.46
15
Water Quality Nutrient loading is an important concern with many large and small streams throughout Manitoba. As a result, Manitoba Conservation has developed a long-term nutrient management strategy for surface waters in Manitoba. A comprehensive trend analysis using existing water quality data has been done to detect temporal trends in nutrient concentrations in the streams and rivers in Manitoba (Jones and Armstrong 2001). Long term water quality monitoring data is available from sampling station WQ0166, located at the south perimeter highway in the southeast region of Winnipeg (refer to Figure 5). Using water quality monitoring data from this station, along with flow data from hydrometric stations 05OH006 and 05OH009, Jones and Armstrong (2001) determined that from 1973 to 1999, median flow-adjusted Total Nitrogen (TN) and Total Phosphorus (TP) concentrations increased. TN was shown to increase by 75%, and TP was determined to increase by almost 188%. This increase can be attributed to increased non-point source and point source loading in the watershed. Potential sources are agricultural activity, wastewater facilities, and municipal lagoon discharges.
16
Figure 5.0 Hydrometric gauging and water quality sampling stations in the Seine River Watershed Study Area

17
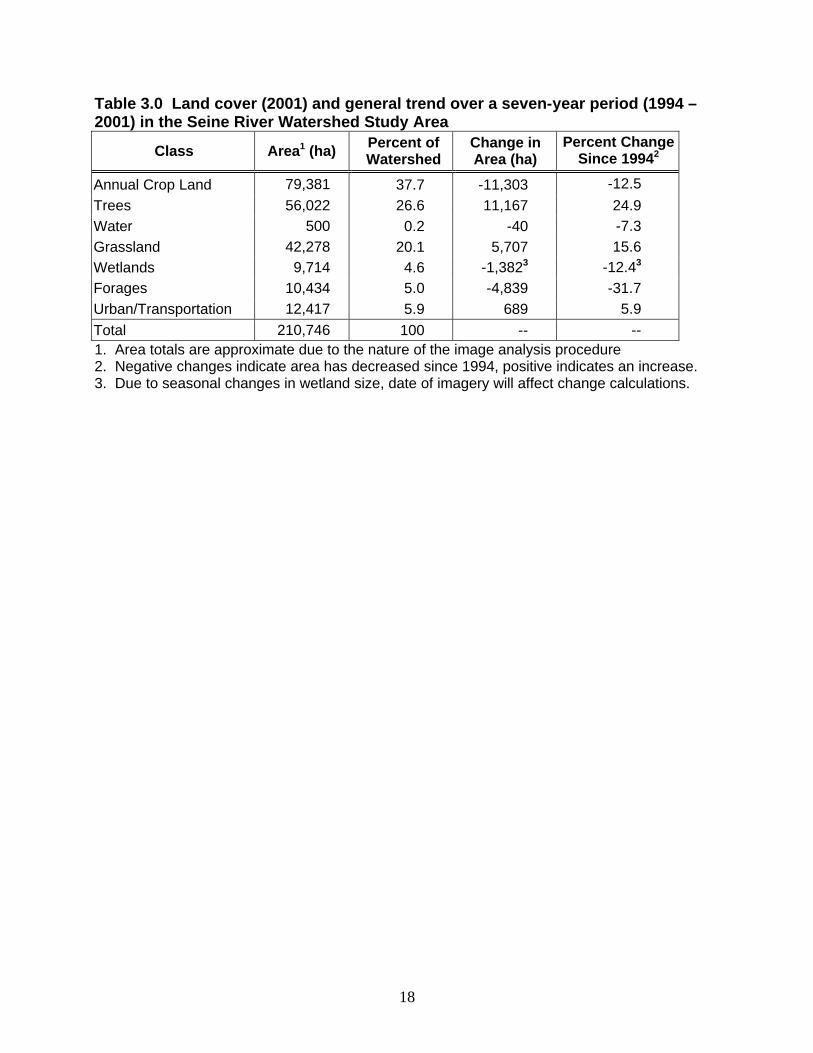
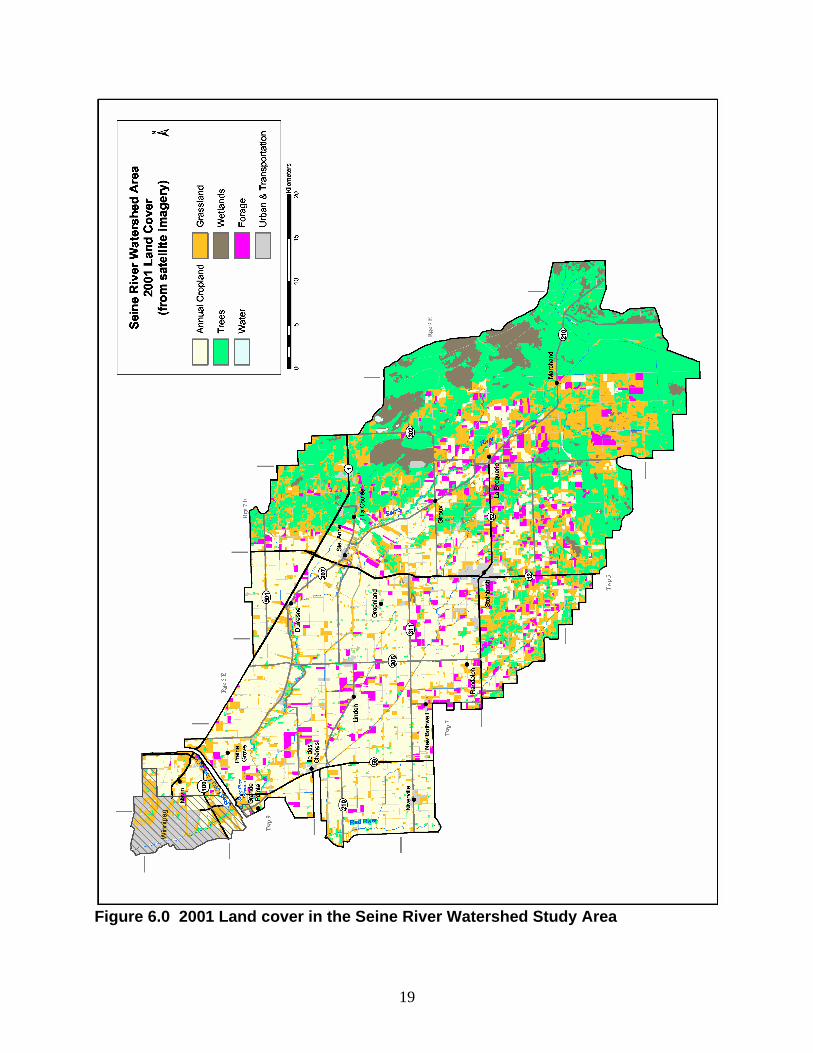
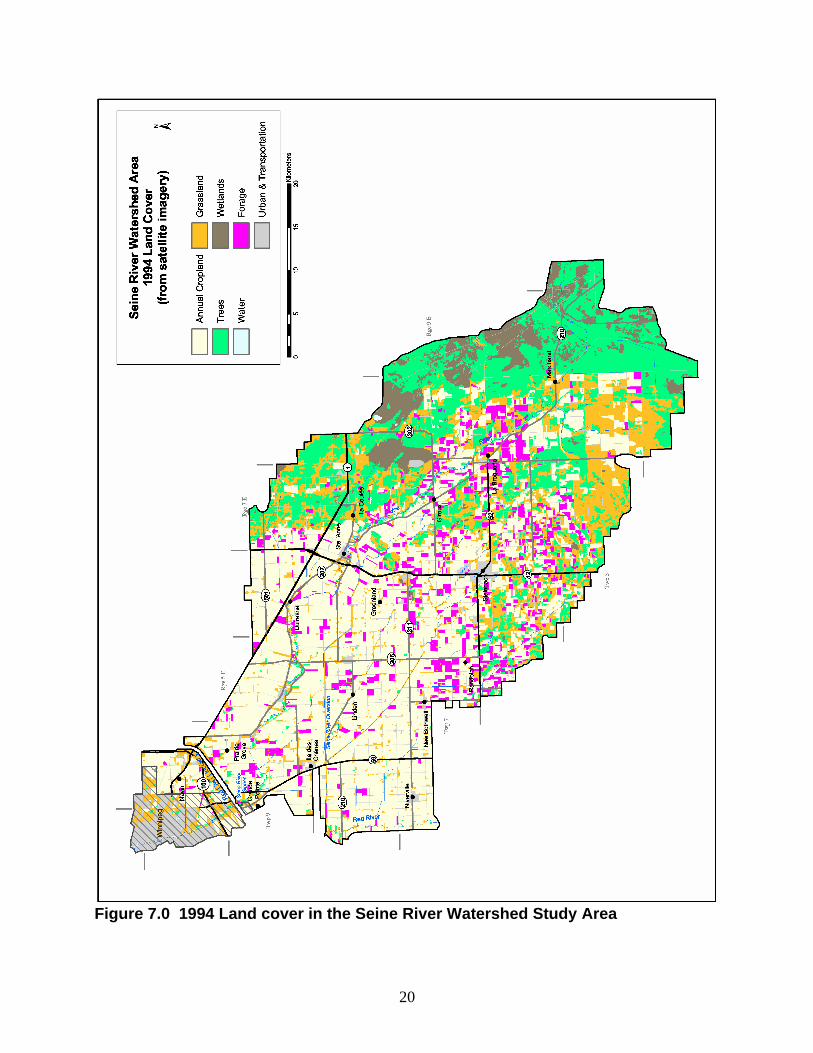
Land Cover The land cover classification of the watershed has been interpreted from LANDSAT satellite imagery (which has a 30 metre resolution), using computerized classification techniques. Individual spectral signatures were classified and grouped into the seven land cover classes: annual crop land, forage, grassland, trees, wetlands, water, urban and transportation (refer to Appendix A for land cover class descriptions). Figure 6.0 provides a general representation of the 2001 land cover within the watershed (note that the study area was analyzed using imagery taken September 28, 2001). Land cover in the watershed is a mix of natural or naturalized areas, and agriculture. Based on 2001 land cover data, annual crop land covers the majority of the study area (38%). Trees and grasslands cover 27% and 20% respectively and become the dominant covers in the eastern half of the area (refer to Table 3.0, Figure 6.0). Forage fields are visible throughout the watershed but are more concentrated in the central region. Large areas of wetlands occur along the eastern edge of the watershed. Land cover in the Sandilands Provincial Forest is dominantly trees and wetlands. Land cover information is also available from 1994 satellite imagery taken September 17, 1994 (refer to Figure 7.0). Comparison between the two datasets can result in the emergence of general trends in land cover of the seven-year period, though this will be a rough estimate due to factors such as time/season of satellite image capture, climatic variability and classification requirements. Over the seven-year period, annual crop land has decreased by approximately 12% (11,303 ha) and forages by about 32% (4,839 ha). Trees and grassland have increased by 25% and 16%, respectively, over the seven years. The large increase in treed areas could be explained by the fact that there are large areas of trees/shrubs interspersed with open, grassland areas. These open areas may have become overgrown enough with shrubs and trees to be classified as treed areas. Wetlands and water both decreased over the seven-year period, possibly indicating drier periods in the latter years. According to Environment Canada archived climate data for Steinbach, there was almost a 170 mm difference in precipitation between the 1994 and 2001 years, with the lesser amounts occurring in 2001. Wetland and open water classifications may be slightly over estimated due to the fact that the 1994 image classification concentrated specifically on annual cropland to aid in delivery of the Western Grains Transportation Payment Program. Greater attention was paid to all classification categories on the 2001 image classification. Due to the small size, and tightly integrated nature of wetlands with other land cover categories such as grasslands and shrubs, they can be very difficult to quantify using course resolution imagery. A Prairie Habitat Joint Venture Habitat Monitoring Program coordinated by the Canadian Wildlife Service provides a detailed evaluation of wetland habitat trends in targeted areas of the prairies. Preliminary analysis indicated that in the targeted areas in Manitoba, there has been a net change of -3.0% in wetland areas from 1985 to circa 2000.
18
Table 3.0 Land cover (2001) and general trend over a seven-year period (1994 – 2001) in the Seine River Watershed Study Area
Class Area1 (ha) Percent of Watershed
Change in Area (ha)
Percent Change Since 19942
Annual Crop Land 79,381 37.7 -11,303 -12.5 Trees 56,022 26.6 11,167 24.9 Water 500 0.2 -40 -7.3 Grassland 42,278 20.1 5,707 15.6 Wetlands 9,714 4.6 -1,3823 -12.43 Forages 10,434 5.0 -4,839 -31.7 Urban/Transportation 12,417 5.9 689 5.9 Total 210,746 100 -- -- 1. Area totals are approximate due to the nature of the image analysis procedure 2. Negative changes indicate area has decreased since 1994, positive indicates an increase. 3. Due to seasonal changes in wetland size, date of imagery will affect change calculations.
19
Figure 6.0 2001 Land cover in the Seine River Watershed Study Area
20
Figure 7.0 1994 Land cover in the Seine River Watershed Study Area

21
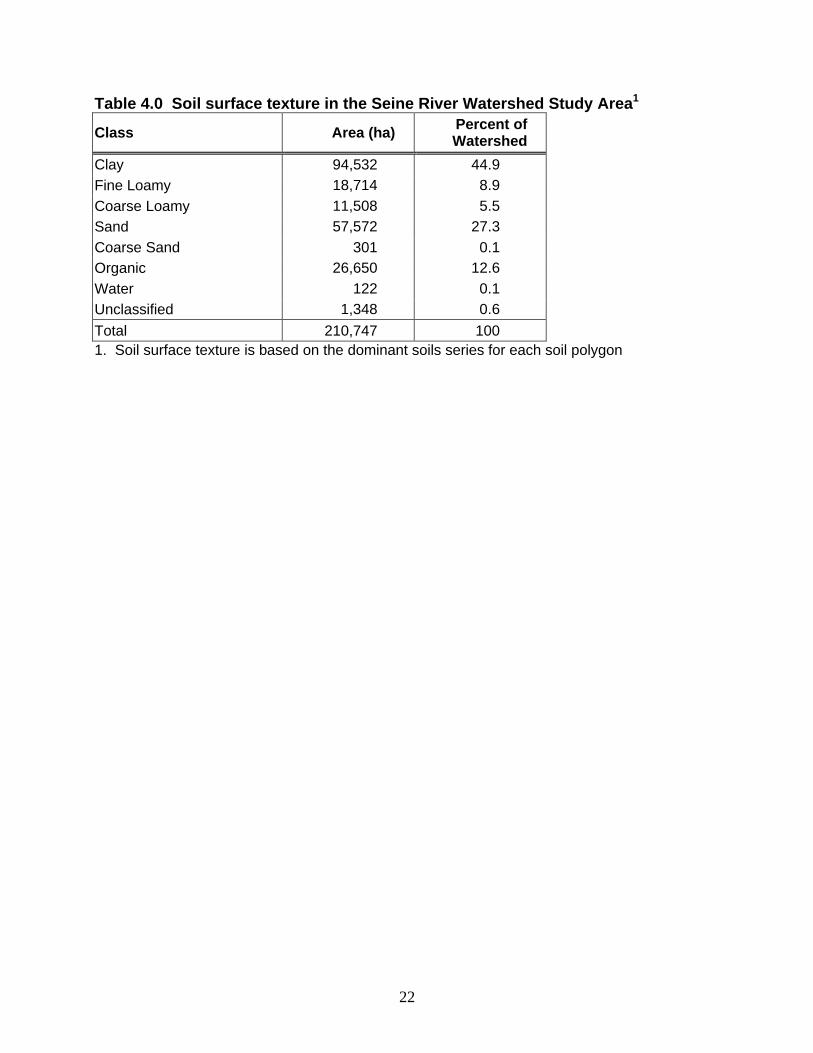
Soil Resources Soils data is a critical component of land-use planning. Soil characteristics can be used to determine agricultural capability and to predict risks of erosion, leaching, and runoff. This type of information is important for determining suitable land uses, identifying sensitive areas, and targeting land-use improvement efforts. In terms of riparian health, analysis of soil characteristics can help to identify soils at high risk for erosion and runoff that could contribute to riparian degradation. Soils data is available for all areas within the watershed. The soils data used in this report was mapped at a detailed scale of 1:50,000 for the RM of Hanover, Ste. Anne, and La Broquerie. The remaining area was surveyed at a reconnaissance scale of 1:126,720. Soils information provided in this report is based on the characteristics of the dominant soil series within the soils polygon. A more detailed and complete description of the type, distribution and textural variability of soils in the watershed can be found in the published soil surveys for the area. Soil Surface Texture Soil surface texture strongly influences the soil’s ability to retain moisture, its general level of fertility, and the ease or difficulty of cultivation. For example, water moves easily through coarse-textured (sandy) soils, so little moisture is retained and these soils dry out more quickly than fine-textured (clayey) soils. Sandy soils are often characterized by a loose or single-grained structure which is very susceptible to wind erosion. On the other hand, clay soils have a high proportion of very small pore spaces which hold moisture tightly. Clay soils are usually fertile because they are able to retain plant nutrients better than sandy soils. However, they transmit water very slowly and are therefore susceptible to excess moisture conditions. The predominant soil surface texture in this watershed is clayey, covering 45% of the study area and occurring mainly in the northwestern half of the watershed (refer to Figure 8.0, Table 4.0). The southeastern region contains a mixture of soil types, but is composed mainly of sand and organic soils. These soil textures respectively cover 27% and 13% of the total watershed area. The organic soils occur mainly along the eastern edges of the area. In the transition between the distinct areas coarse and fine loams are present.
22
Table 4.0 Soil surface texture in the Seine River Watershed Study Area1
Class Area (ha) Percent of Watershed
Clay 94,532 44.9 Fine Loamy 18,714 8.9 Coarse Loamy 11,508 5.5 Sand 57,572 27.3 Coarse Sand 301 0.1 Organic 26,650 12.6 Water 122 0.1 Unclassified 1,348 0.6 Total 210,747 100 1. Soil surface texture is based on the dominant soils series for each soil polygon

23
Figure 8.0 Soil surface texture in the Seine River Watershed Study Area
24
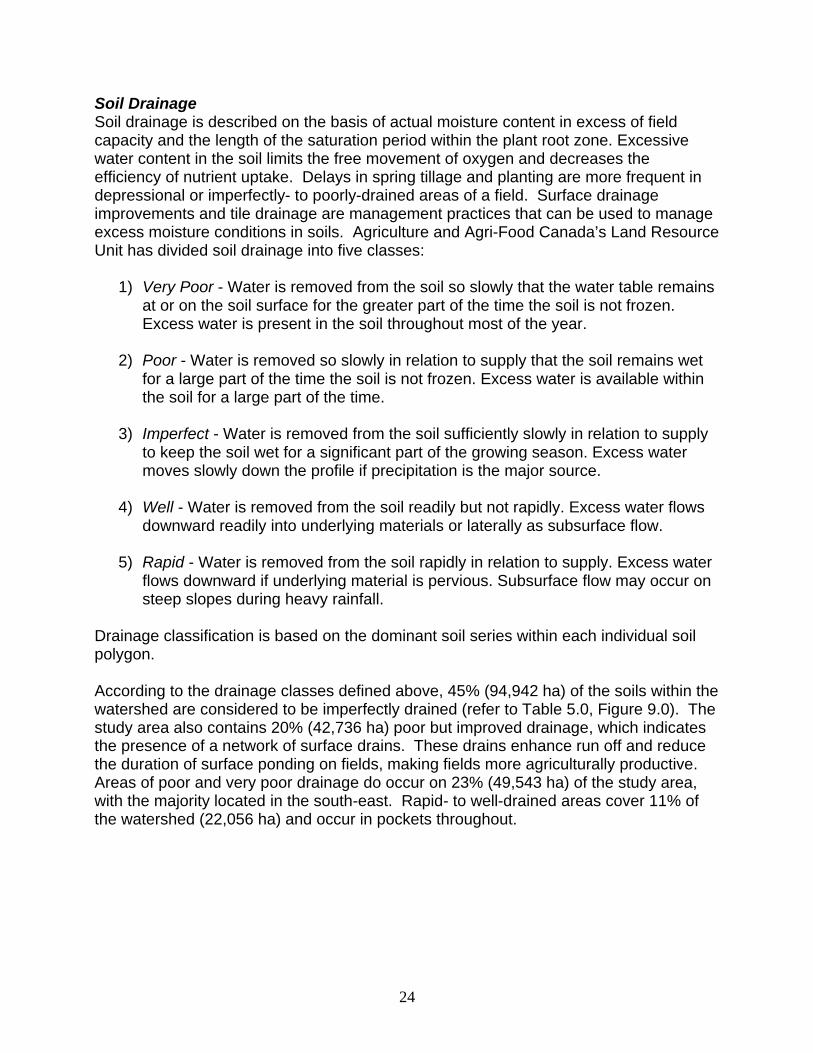
Soil Drainage Soil drainage is described on the basis of actual moisture content in excess of field capacity and the length of the saturation period within the plant root zone. Excessive water content in the soil limits the free movement of oxygen and decreases the efficiency of nutrient uptake. Delays in spring tillage and planting are more frequent in depressional or imperfectly- to poorly-drained areas of a field. Surface drainage improvements and tile drainage are management practices that can be used to manage excess moisture conditions in soils. Agriculture and Agri-Food Canada’s Land Resource Unit has divided soil drainage into five classes:
1) Very Poor - Water is removed from the soil so slowly that the water table remains at or on the soil surface for the greater part of the time the soil is not frozen. Excess water is present in the soil throughout most of the year.
2) Poor - Water is removed so slowly in relation to supply that the soil remains wet
for a large part of the time the soil is not frozen. Excess water is available within the soil for a large part of the time.
3) Imperfect - Water is removed from the soil sufficiently slowly in relation to supply
to keep the soil wet for a significant part of the growing season. Excess water moves slowly down the profile if precipitation is the major source.
4) Well - Water is removed from the soil readily but not rapidly. Excess water flows
downward readily into underlying materials or laterally as subsurface flow.
5) Rapid - Water is removed from the soil rapidly in relation to supply. Excess water flows downward if underlying material is pervious. Subsurface flow may occur on steep slopes during heavy rainfall.
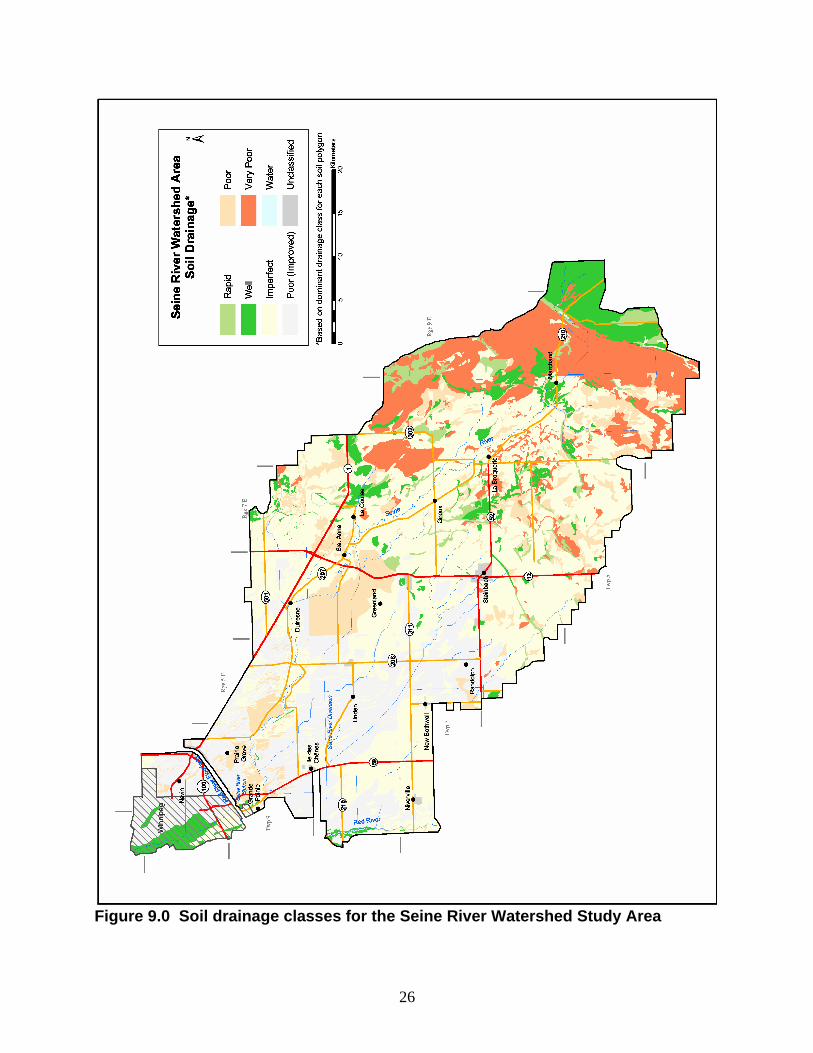
Drainage classification is based on the dominant soil series within each individual soil polygon. According to the drainage classes defined above, 45% (94,942 ha) of the soils within the watershed are considered to be imperfectly drained (refer to Table 5.0, Figure 9.0). The study area also contains 20% (42,736 ha) poor but improved drainage, which indicates the presence of a network of surface drains. These drains enhance run off and reduce the duration of surface ponding on fields, making fields more agriculturally productive. Areas of poor and very poor drainage do occur on 23% (49,543 ha) of the study area, with the majority located in the south-east. Rapid- to well-drained areas cover 11% of the watershed (22,056 ha) and occur in pockets throughout.

25
Table 5.0 Soil drainage classes for the Seine River Watershed Study Area 1
Class Area (ha) Percent of Watershed
Rapid 6,481 3.1 Well 15,575 7.4 Imperfect 94,942 45 Poor 22,699 10.8 Poor (Improved) 42,736 20.3 Very Poor 26,844 12.7 Water 122 0.1 Unclassified 1,348 0.6 Total 210,748 100 1. Area has been assigned to the dominant drainage class for each soil polygon
26
Figure 9.0 Soil drainage classes for the Seine River Watershed Study Area
27
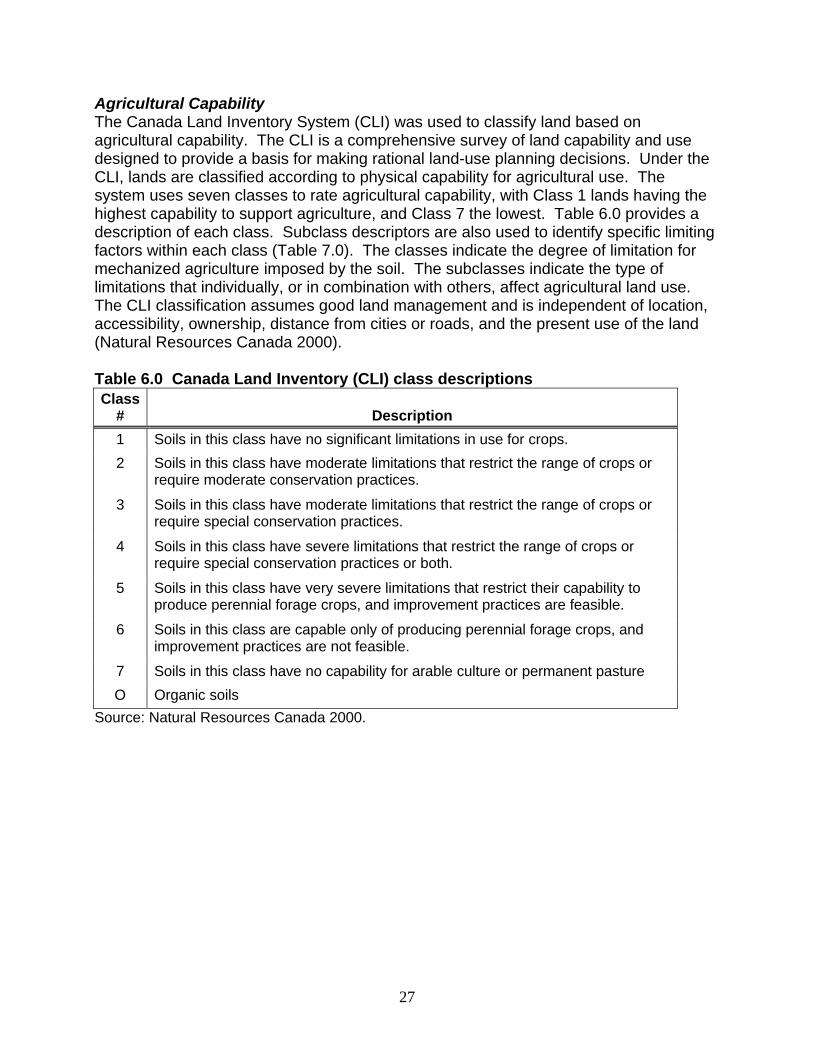
Agricultural Capability The Canada Land Inventory System (CLI) was used to classify land based on agricultural capability. The CLI is a comprehensive survey of land capability and use designed to provide a basis for making rational land-use planning decisions. Under the CLI, lands are classified according to physical capability for agricultural use. The system uses seven classes to rate agricultural capability, with Class 1 lands having the highest capability to support agriculture, and Class 7 the lowest. Table 6.0 provides a description of each class. Subclass descriptors are also used to identify specific limiting factors within each class (Table 7.0). The classes indicate the degree of limitation for mechanized agriculture imposed by the soil. The subclasses indicate the type of limitations that individually, or in combination with others, affect agricultural land use. The CLI classification assumes good land management and is independent of location, accessibility, ownership, distance from cities or roads, and the present use of the land (Natural Resources Canada 2000). Table 6.0 Canada Land Inventory (CLI) class descriptions Class
# Description
1 Soils in this class have no significant limitations in use for crops.
2 Soils in this class have moderate limitations that restrict the range of crops or require moderate conservation practices.
3 Soils in this class have moderate limitations that restrict the range of crops or require special conservation practices.
4 Soils in this class have severe limitations that restrict the range of crops or require special conservation practices or both.
5 Soils in this class have very severe limitations that restrict their capability to produce perennial forage crops, and improvement practices are feasible.
6 Soils in this class are capable only of producing perennial forage crops, and improvement practices are not feasible.
7 Soils in this class have no capability for arable culture or permanent pasture
O Organic soils
Source: Natural Resources Canada 2000.
28
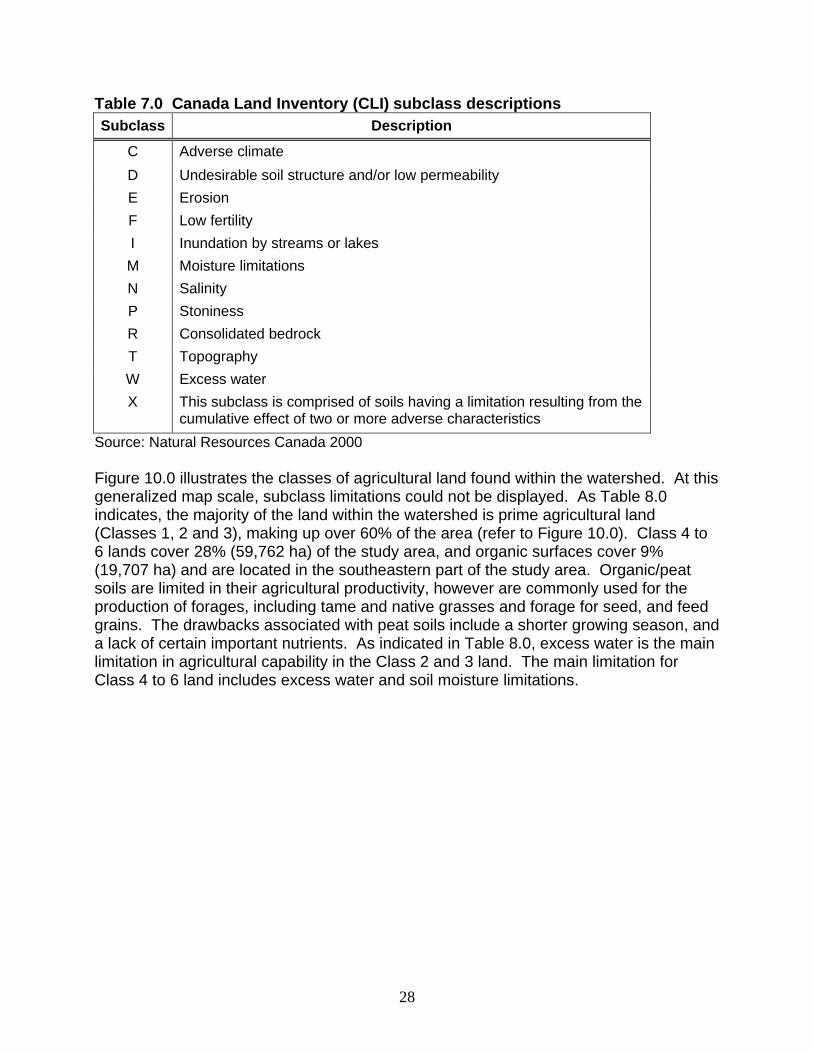
Table 7.0 Canada Land Inventory (CLI) subclass descriptions Subclass Description
C Adverse climate
D Undesirable soil structure and/or low permeability
E Erosion
F Low fertility
I Inundation by streams or lakes
M Moisture limitations
N Salinity
P Stoniness
R Consolidated bedrock
T Topography
W Excess water
X This subclass is comprised of soils having a limitation resulting from the cumulative effect of two or more adverse characteristics
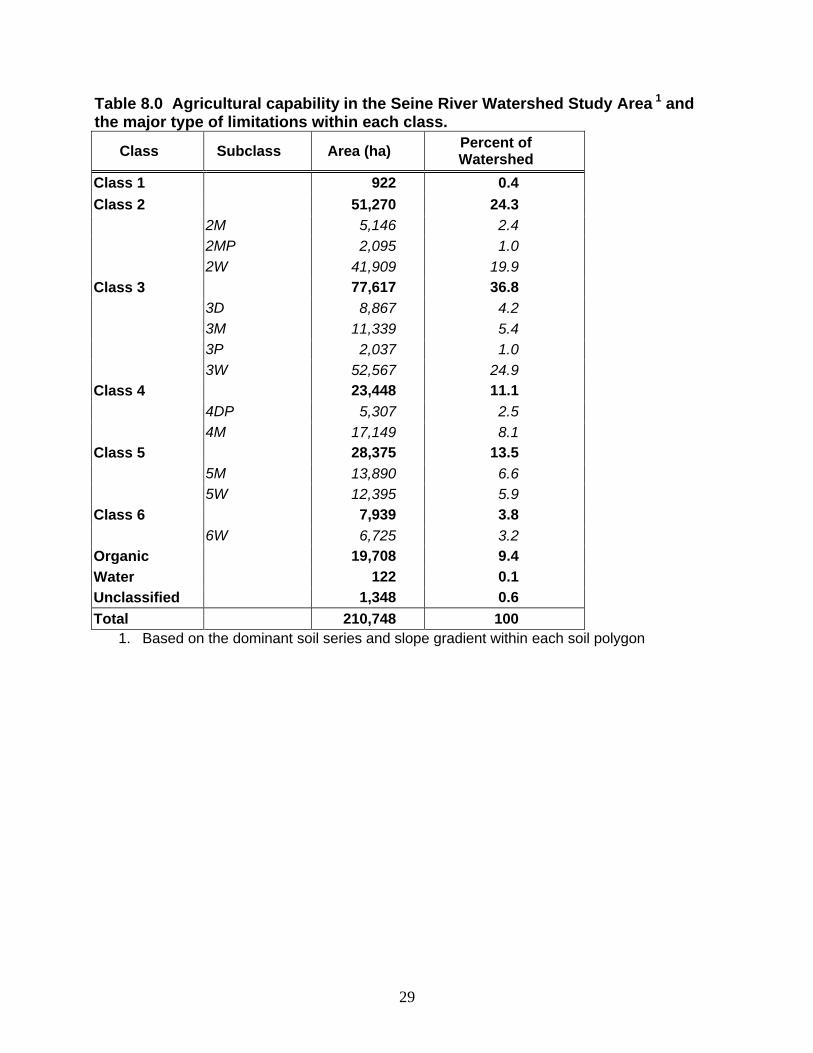
Source: Natural Resources Canada 2000 Figure 10.0 illustrates the classes of agricultural land found within the watershed. At this generalized map scale, subclass limitations could not be displayed. As Table 8.0 indicates, the majority of the land within the watershed is prime agricultural land (Classes 1, 2 and 3), making up over 60% of the area (refer to Figure 10.0). Class 4 to 6 lands cover 28% (59,762 ha) of the study area, and organic surfaces cover 9% (19,707 ha) and are located in the southeastern part of the study area. Organic/peat soils are limited in their agricultural productivity, however are commonly used for the production of forages, including tame and native grasses and forage for seed, and feed grains. The drawbacks associated with peat soils include a shorter growing season, and a lack of certain important nutrients. As indicated in Table 8.0, excess water is the main limitation in agricultural capability in the Class 2 and 3 land. The main limitation for Class 4 to 6 land includes excess water and soil moisture limitations.
29
Table 8.0 Agricultural capability in the Seine River Watershed Study Area 1 and the major type of limitations within each class.
Class Subclass Area (ha) Percent of Watershed
Class 1 922 0.4 Class 2 51,270 24.3 2M 5,146 2.4 2MP 2,095 1.0 2W 41,909 19.9 Class 3 77,617 36.8 3D 8,867 4.2 3M 11,339 5.4 3P 2,037 1.0 3W 52,567 24.9 Class 4 23,448 11.1 4DP 5,307 2.5 4M 17,149 8.1 Class 5 28,375 13.5 5M 13,890 6.6 5W 12,395 5.9 Class 6 7,939 3.8 6W 6,725 3.2 Organic 19,708 9.4 Water 122 0.1 Unclassified 1,348 0.6 Total 210,748 100
1. Based on the dominant soil series and slope gradient within each soil polygon
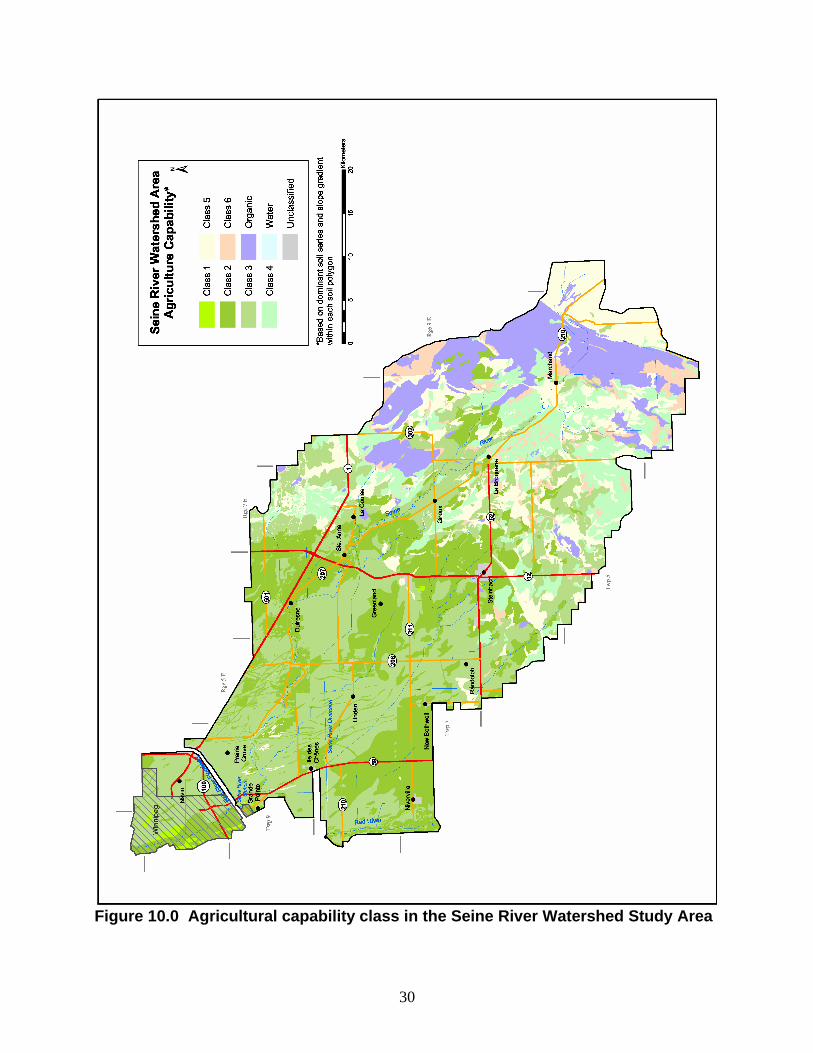
30
Figure 10.0 Agricultural capability class in the Seine River Watershed Study Area
31
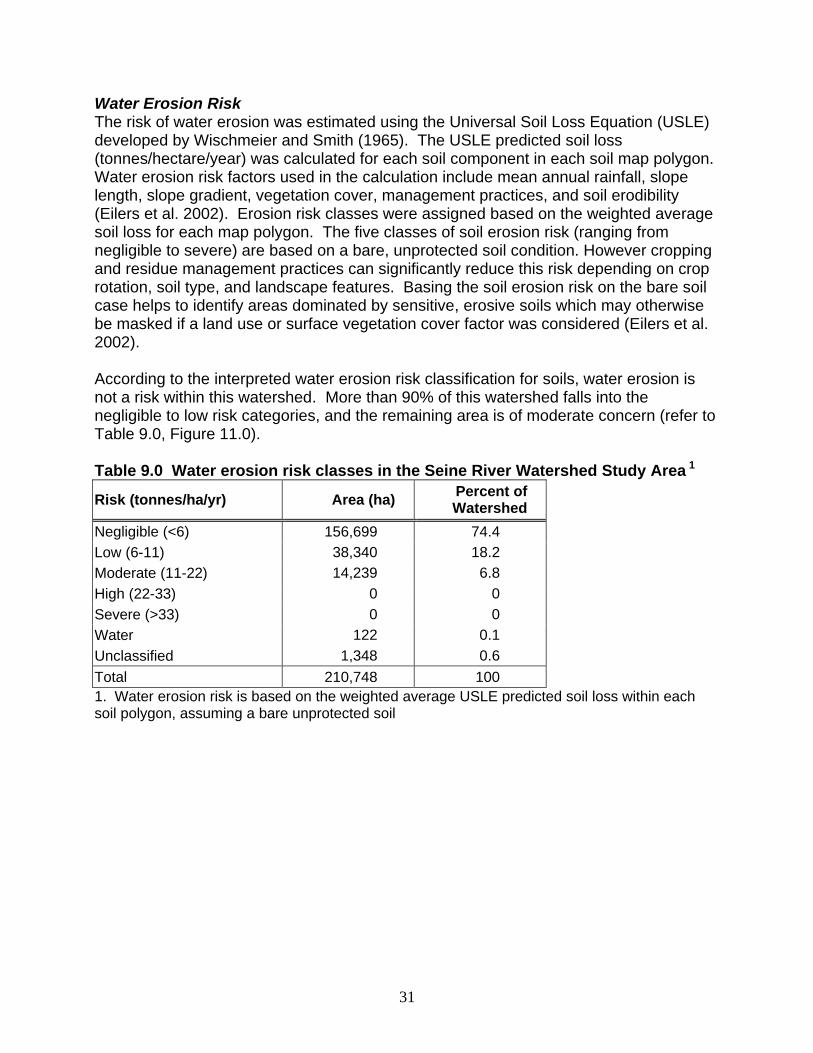
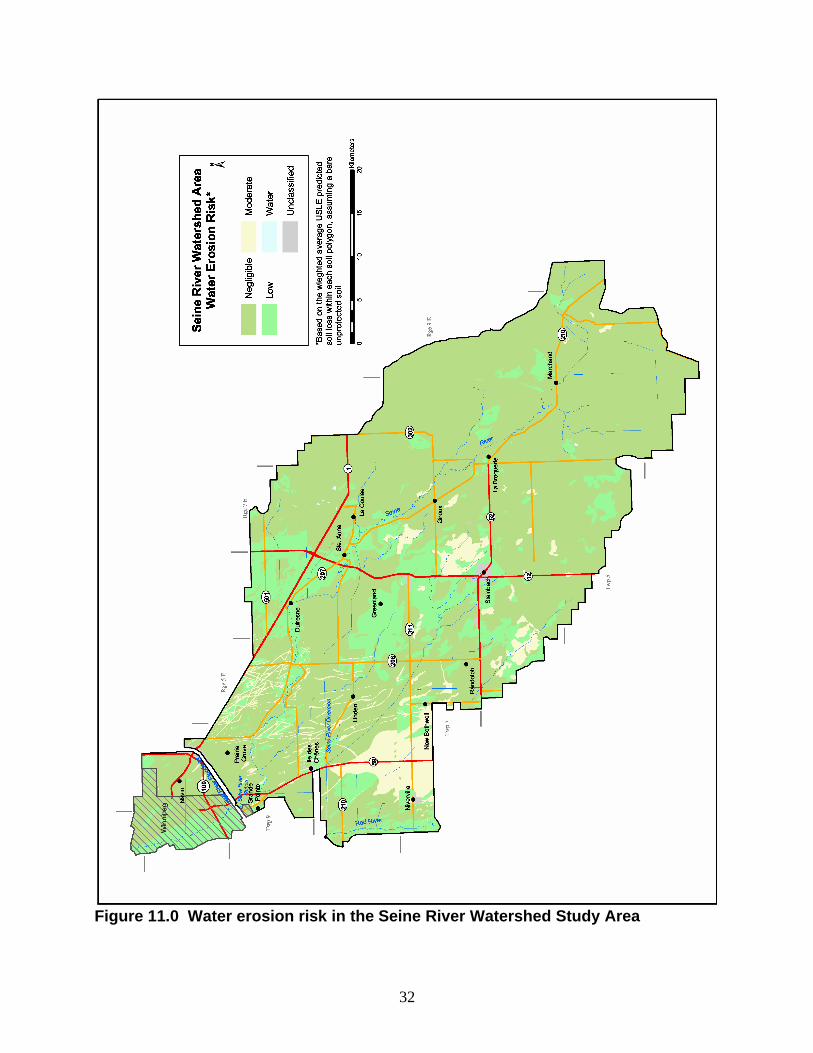
Water Erosion Risk The risk of water erosion was estimated using the Universal Soil Loss Equation (USLE) developed by Wischmeier and Smith (1965). The USLE predicted soil loss (tonnes/hectare/year) was calculated for each soil component in each soil map polygon. Water erosion risk factors used in the calculation include mean annual rainfall, slope length, slope gradient, vegetation cover, management practices, and soil erodibility (Eilers et al. 2002). Erosion risk classes were assigned based on the weighted average soil loss for each map polygon. The five classes of soil erosion risk (ranging from negligible to severe) are based on a bare, unprotected soil condition. However cropping and residue management practices can significantly reduce this risk depending on crop rotation, soil type, and landscape features. Basing the soil erosion risk on the bare soil case helps to identify areas dominated by sensitive, erosive soils which may otherwise be masked if a land use or surface vegetation cover factor was considered (Eilers et al. 2002). According to the interpreted water erosion risk classification for soils, water erosion is not a risk within this watershed. More than 90% of this watershed falls into the negligible to low risk categories, and the remaining area is of moderate concern (refer to Table 9.0, Figure 11.0). Table 9.0 Water erosion risk classes in the Seine River Watershed Study Area 1
Risk (tonnes/ha/yr) Area (ha) Percent of Watershed
Negligible (<6) 156,699 74.4 Low (6-11) 38,340 18.2 Moderate (11-22) 14,239 6.8 High (22-33) 0 0 Severe (>33) 0 0 Water 122 0.1 Unclassified 1,348 0.6 Total 210,748 100 1. Water erosion risk is based on the weighted average USLE predicted soil loss within each soil polygon, assuming a bare unprotected soil
32
Figure 11.0 Water erosion risk in the Seine River Watershed Study Area

33
Agricultural Activities Riparian areas can be impacted by anthropogenic activities occurring within a watershed. Land use and management practices within riparian zones and on upland areas affect the health of riparian areas. Although agriculture is only one component, with other human activities such as industry, recreation and residences contributing to degraded riparian areas, this report focuses on the impacts of agriculture. By knowing the extent and type of agricultural activities within the watershed, more effective decision-making and project planning can be put into place. Agriculture data for the watershed was obtained from the 2001 Census of Agriculture using the farm headquarters reporting method, which links census data to the land location of the farm headquarters. In the 2001 Census, the farm headquarters was defined as “the operator’s residence if he/she lives on land that is part of the agricultural operation; the location of the main building or main gate of the agricultural operation; or if many parcels of land without buildings are in separate locations, the parcel with the largest land area or share of gross agricultural receipts is considered the farm headquarters” (Statistics Canada 2002). It should be noted that in cases where the farm headquarters location is different from that of the actual farmed land or the location of livestock, inaccuracies in data will be introduced. For example, the reported farm headquarters could fall within one watershed, whereas a proportion of the land/livestock associated with that operation could fall within another. Despite the inaccuracies, the Census of Agriculture provides the most comprehensive source of available agricultural data (see Appendix B for more information and definitions). The Statistics Act requires that all census information be kept confidential. As a result, any data that could disclose information concerning a particular agricultural operation or individual is suppressed in the data tables reported by Statistics Canada. For example, if there are one or two dairy operations within a watershed, the number of farms reporting dairy will be given, however the total number of dairy cows reported within that watershed will be suppressed. In instances where a geographic area has very few agricultural operations, data are not released separately but are merged with data from one or more geographically adjacent areas (Statistics Canada 2002). According to the 2001 Census, there were a total of 895 farms utilizing 67% (141,657 ha) of the land in the Seine River Watershed Study Area. For the purpose of this report, farmland includes all land that is owned, rented, leased (including government land) or crop-shared by agricultural operations. Of this land, 3,730 ha (3%) was leased government land. Of the farmland, 81,624 ha (58%) were prepared for seeding in the fall of 2000 or spring 2001. Land use and management practices of upland areas are important considerations in watershed planning. Crop type (permanent vs. annual, high residue vs. low residue), tillage practices, nutrient management, and conservation practices on the upland landscape are all activities that can affect water quality within the watershed.
34
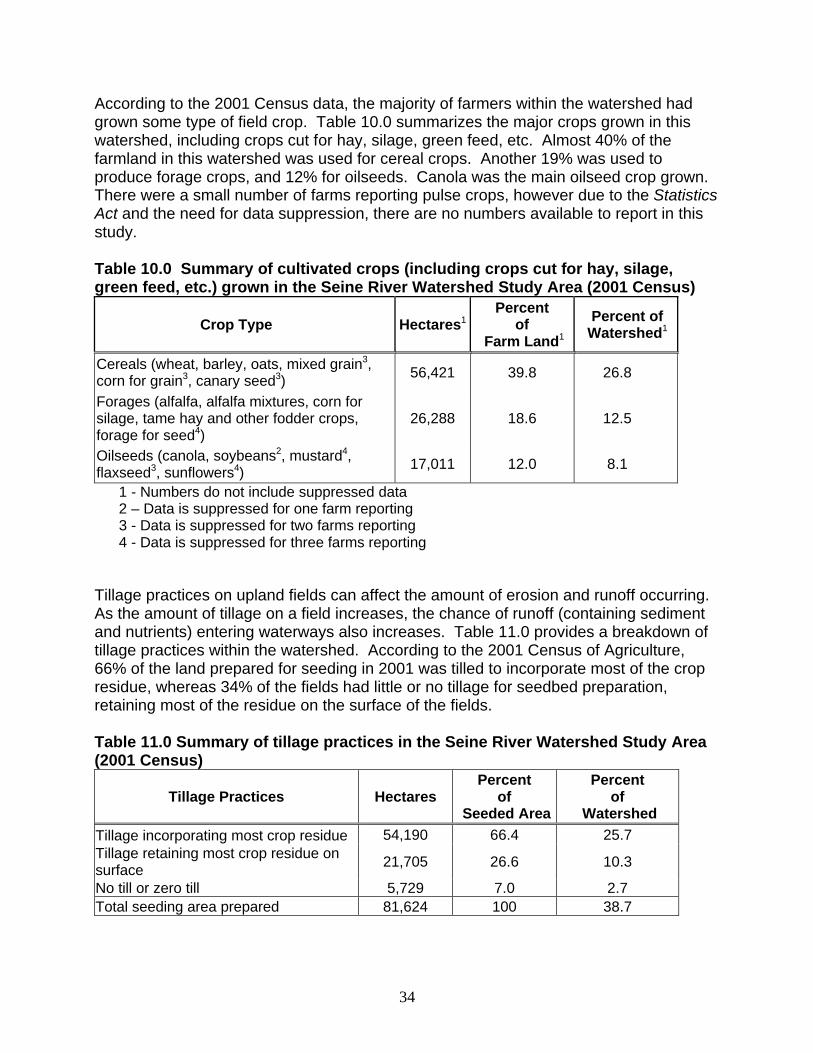
According to the 2001 Census data, the majority of farmers within the watershed had grown some type of field crop. Table 10.0 summarizes the major crops grown in this watershed, including crops cut for hay, silage, green feed, etc. Almost 40% of the farmland in this watershed was used for cereal crops. Another 19% was used to produce forage crops, and 12% for oilseeds. Canola was the main oilseed crop grown. There were a small number of farms reporting pulse crops, however due to the Statistics Act and the need for data suppression, there are no numbers available to report in this study. Table 10.0 Summary of cultivated crops (including crops cut for hay, silage, green feed, etc.) grown in the Seine River Watershed Study Area (2001 Census)
Crop Type Hectares1 Percent
of Farm Land1
Percent of Watershed1
Cereals (wheat, barley, oats, mixed grain3, corn for grain3, canary seed3) 56,421 39.8 26.8
Forages (alfalfa, alfalfa mixtures, corn for silage, tame hay and other fodder crops, forage for seed4)
26,288 18.6 12.5
Oilseeds (canola, soybeans2, mustard4, flaxseed3, sunflowers4) 17,011 12.0 8.1
1 - Numbers do not include suppressed data 2 – Data is suppressed for one farm reporting 3 - Data is suppressed for two farms reporting 4 - Data is suppressed for three farms reporting Tillage practices on upland fields can affect the amount of erosion and runoff occurring. As the amount of tillage on a field increases, the chance of runoff (containing sediment and nutrients) entering waterways also increases. Table 11.0 provides a breakdown of tillage practices within the watershed. According to the 2001 Census of Agriculture, 66% of the land prepared for seeding in 2001 was tilled to incorporate most of the crop residue, whereas 34% of the fields had little or no tillage for seedbed preparation, retaining most of the residue on the surface of the fields. Table 11.0 Summary of tillage practices in the Seine River Watershed Study Area (2001 Census)
Tillage Practices Hectares Percent
of Seeded Area
Percent of
Watershed Tillage incorporating most crop residue 54,190 66.4 25.7 Tillage retaining most crop residue on surface 21,705 26.6 10.3
No till or zero till 5,729 7.0 2.7 Total seeding area prepared 81,624 100 38.7

35
In addition to minimum or no tillage, other conservation practices also reduce water erosion, thereby decreasing the amount of contaminated runoff entering waterways. Other conservation practices reported within the watershed include crop rotation (alternating low residue crops with high residue crops to maintain a good residue cover), permanent grass cover, winter cover crops, contour cultivation, strip cropping, grassed waterways and shelterbelts or windbreaks. Table 12.0 provides a breakdown of the percentage of farms using these conservation practices within the watershed. Table 12.0 Summary of the conservation practices carried out in the Seine River Watershed Study Area (2001 Census)
Conservation Practices Percentage of Farms Using Conservation Practice
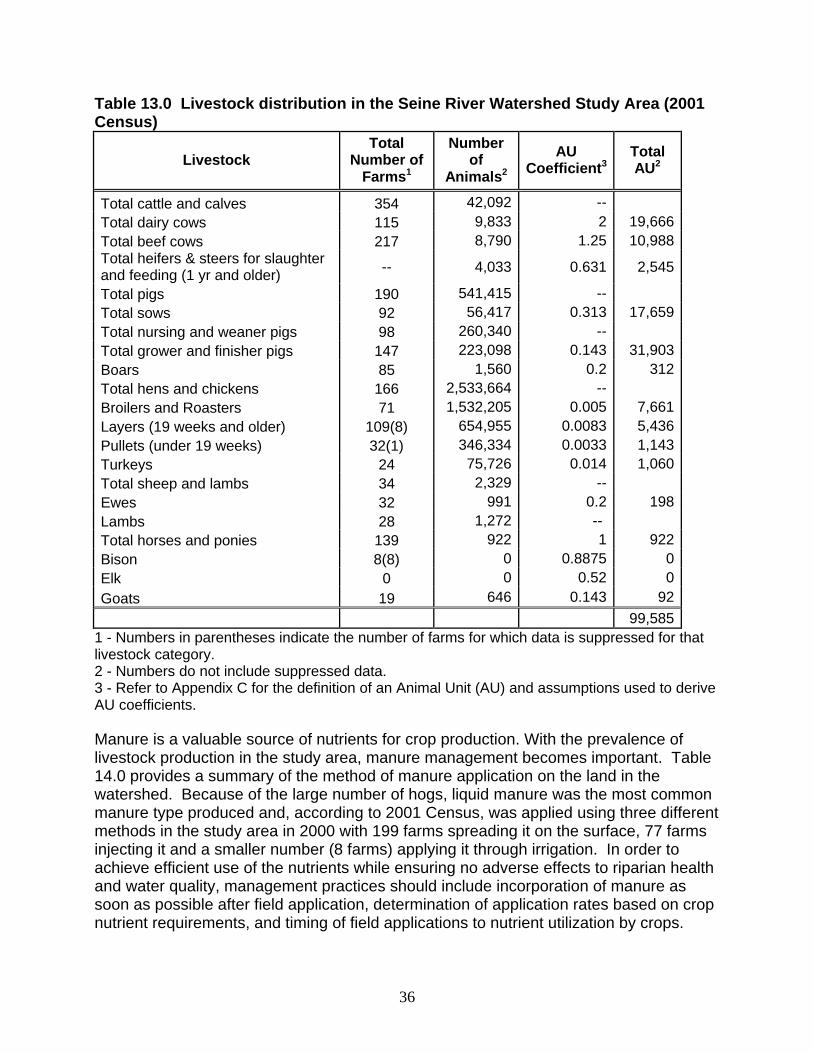
Crop rotation 52.3 Permanent grass cover 20.6 Winter cover crops 1.0 Contour cultivation 1.9 Strip cropping 1.1 Grassed waterways 3.2 Windbreaks or shelterbelts 15.6 A number of farms within the watershed reported having livestock. As a result, manure production and the utilization of riparian areas by grazing animals are two areas where appropriate management practices should be implemented to reduce nutrient loading into rivers and streams and maintain healthy riparian areas. Table 13.0 provides a breakdown of the livestock distribution within the watershed. Almost 40% of the farms within the watershed have cattle, the majority of which are beef operations. But there are a greater number of dairy cows than beef cows reported, with a dairy operation in the study area having an average of 98 cows. The hog industry has a considerable presence in this study area, accounting for 21% of the hogs reported in Manitoba. As well, the number of hens and chickens reported in the area account for 32% of the reported number in Manitoba. Total Animal Units (AU) produced in the watershed (based on annual nitrogen production) has been calculated using Manitoba’s Animal Unit coefficients and several assumptions (refer to Appendix C). Pigs contribute to half of the total AU produced in the study area. Dairy made up 20% to the total AU while poultry and beef made up 15% and 14% respectively.
36
Table 13.0 Livestock distribution in the Seine River Watershed Study Area (2001 Census)
Livestock Total
Number of Farms1
Number of
Animals2
AU Coefficient3
Total AU2
Total cattle and calves 354 42,092 -- Total dairy cows 115 9,833 2 19,666 Total beef cows 217 8,790 1.25 10,988 Total heifers & steers for slaughter and feeding (1 yr and older) -- 4,033 0.631 2,545
Total pigs 190 541,415 -- Total sows 92 56,417 0.313 17,659 Total nursing and weaner pigs 98 260,340 -- Total grower and finisher pigs 147 223,098 0.143 31,903 Boars 85 1,560 0.2 312 Total hens and chickens 166 2,533,664 -- Broilers and Roasters 71 1,532,205 0.005 7,661 Layers (19 weeks and older) 109(8) 654,955 0.0083 5,436 Pullets (under 19 weeks) 32(1) 346,334 0.0033 1,143 Turkeys 24 75,726 0.014 1,060 Total sheep and lambs 34 2,329 -- Ewes 32 991 0.2 198 Lambs 28 1,272 -- Total horses and ponies 139 922 1 922 Bison 8(8) 0 0.8875 0 Elk 0 0 0.52 0 Goats 19 646 0.143 92
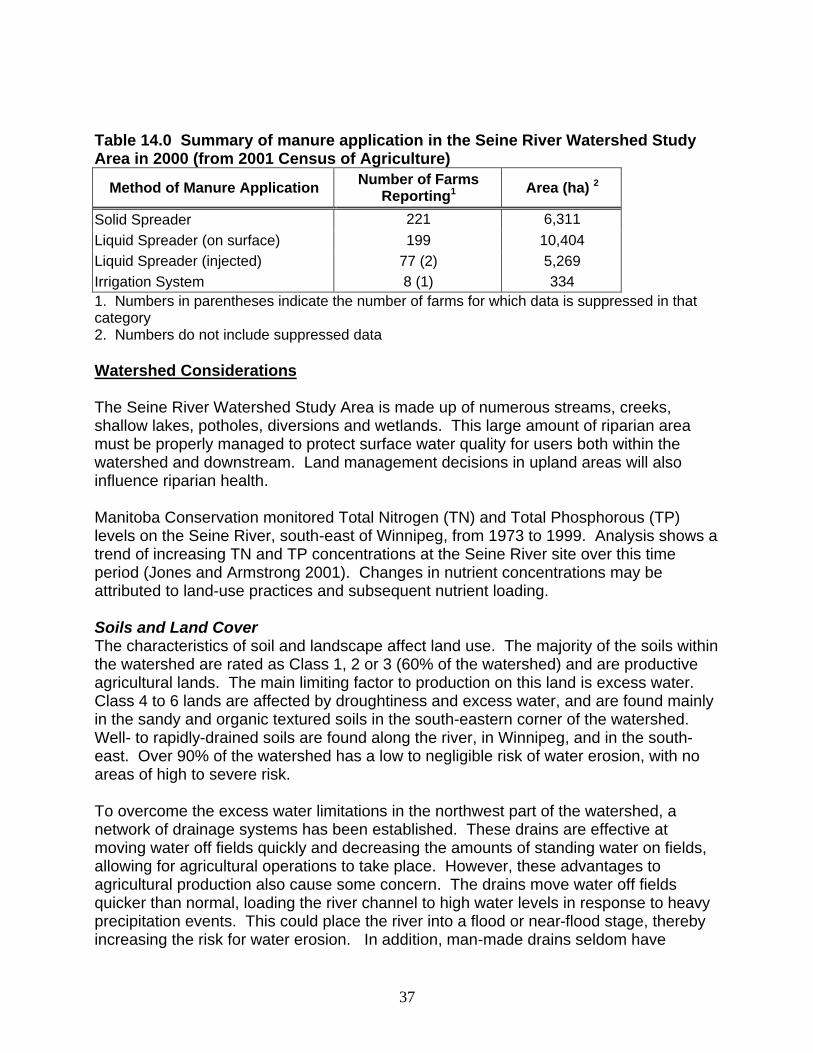
99,585 1 - Numbers in parentheses indicate the number of farms for which data is suppressed for that livestock category. 2 - Numbers do not include suppressed data. 3 - Refer to Appendix C for the definition of an Animal Unit (AU) and assumptions used to derive AU coefficients. Manure is a valuable source of nutrients for crop production. With the prevalence of livestock production in the study area, manure management becomes important. Table 14.0 provides a summary of the method of manure application on the land in the watershed. Because of the large number of hogs, liquid manure was the most common manure type produced and, according to 2001 Census, was applied using three different methods in the study area in 2000 with 199 farms spreading it on the surface, 77 farms injecting it and a smaller number (8 farms) applying it through irrigation. In order to achieve efficient use of the nutrients while ensuring no adverse effects to riparian health and water quality, management practices should include incorporation of manure as soon as possible after field application, determination of application rates based on crop nutrient requirements, and timing of field applications to nutrient utilization by crops.
37
Table 14.0 Summary of manure application in the Seine River Watershed Study Area in 2000 (from 2001 Census of Agriculture)
Method of Manure Application Number of Farms Reporting1 Area (ha) 2
Solid Spreader 221 6,311 Liquid Spreader (on surface) 199 10,404 Liquid Spreader (injected) 77 (2) 5,269 Irrigation System 8 (1) 334 1. Numbers in parentheses indicate the number of farms for which data is suppressed in that category 2. Numbers do not include suppressed data Watershed Considerations The Seine River Watershed Study Area is made up of numerous streams, creeks, shallow lakes, potholes, diversions and wetlands. This large amount of riparian area must be properly managed to protect surface water quality for users both within the watershed and downstream. Land management decisions in upland areas will also influence riparian health. Manitoba Conservation monitored Total Nitrogen (TN) and Total Phosphorous (TP) levels on the Seine River, south-east of Winnipeg, from 1973 to 1999. Analysis shows a trend of increasing TN and TP concentrations at the Seine River site over this time period (Jones and Armstrong 2001). Changes in nutrient concentrations may be attributed to land-use practices and subsequent nutrient loading. Soils and Land Cover The characteristics of soil and landscape affect land use. The majority of the soils within the watershed are rated as Class 1, 2 or 3 (60% of the watershed) and are productive agricultural lands. The main limiting factor to production on this land is excess water. Class 4 to 6 lands are affected by droughtiness and excess water, and are found mainly in the sandy and organic textured soils in the south-eastern corner of the watershed. Well- to rapidly-drained soils are found along the river, in Winnipeg, and in the south-east. Over 90% of the watershed has a low to negligible risk of water erosion, with no areas of high to severe risk. To overcome the excess water limitations in the northwest part of the watershed, a network of drainage systems has been established. These drains are effective at moving water off fields quickly and decreasing the amounts of standing water on fields, allowing for agricultural operations to take place. However, these advantages to agricultural production also cause some concern. The drains move water off fields quicker than normal, loading the river channel to high water levels in response to heavy precipitation events. This could place the river into a flood or near-flood stage, thereby increasing the risk for water erosion. In addition, man-made drains seldom have
38
riparian areas around them, unlike most natural watercourses. With small or non-existent riparian zones, there is increased risk of nutrient and sediment loading into watercourses. Riparian areas and permanent vegetation on adjacent lands are able to trap and store sediment and nutrients found in field runoff, reducing the risk of contamination of surface water. Land cover provides a glimpse into agricultural practices in the watershed. In 2001 the dominant land cover was annual crop land, making up 38% of the watershed. From 1994 to 2001, annual crop land and forage hectares had decreased by 13% and 32% respectively. Conversely, treed and grassland areas appear to have increased. Riparian Areas In order to provide an indication of the amount of riparian areas present in the study area, a shoreline density was calculated using the length of shoreline around watercourses and waterbodies. This shoreline density can provide a glimpse into how much upland is in contact with surface waterbodies and watercourses (riparian areas). A higher shoreline density could mean there is a greater potential for interaction between upland activities and surface water. For this analysis, length of shoreline of both permanent and intermittent waterbodies and watercourses was determined from the 1:50,000 NTS datasheets (note that densities will be underestimated since numerous small wetlands and potholes as well as some small constructed water courses (first, second and third order drains) are not captured by the NTS sheets). Table 15.0 provides a summary of the length and density of shoreline in the Seine River Watershed Study Area. In the Seine River Watershed Study Area, Sub-watershed #234 has the highest concentration of riparian areas with 10.5 m of shoreline/ha (refer to Figure 12.0). Watercourses (rivers, creeks, streams, etc) make up the majority of shoreline in the sub-watersheds. A higher shoreline density will indicate a greater concentration of riparian areas. Since riparian areas provide a buffer between upland areas and surface water, management practices (including riparian pasture management, buffer strips, and grassed waterways) become important to maintain this vegetated buffer area surrounding waterbodies and watercourses.
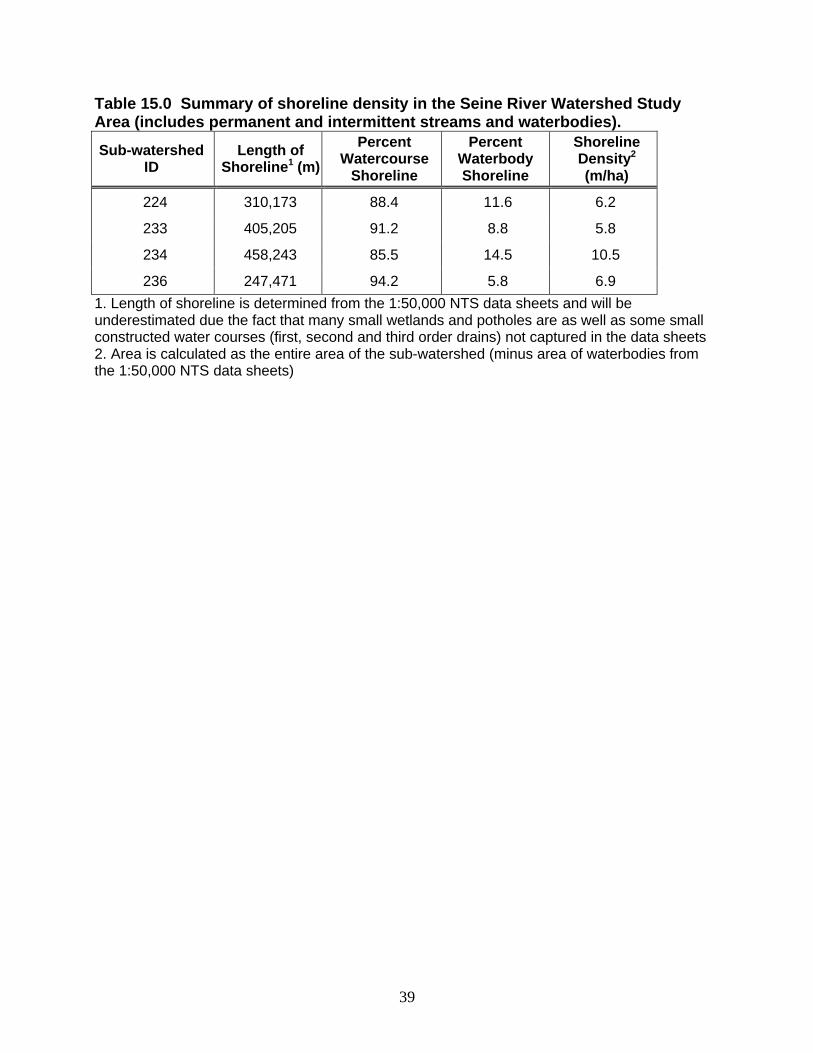
39
Table 15.0 Summary of shoreline density in the Seine River Watershed Study Area (includes permanent and intermittent streams and waterbodies).
Sub-watershed ID
Length of Shoreline1 (m)
Percent Watercourse
Shoreline
Percent Waterbody Shoreline
Shoreline Density2 (m/ha)
224 310,173 88.4 11.6 6.2
233 405,205 91.2 8.8 5.8
234 458,243 85.5 14.5 10.5
236 247,471 94.2 5.8 6.9 1. Length of shoreline is determined from the 1:50,000 NTS data sheets and will be underestimated due the fact that many small wetlands and potholes are as well as some small constructed water courses (first, second and third order drains) not captured in the data sheets 2. Area is calculated as the entire area of the sub-watershed (minus area of waterbodies from the 1:50,000 NTS data sheets)

40
Figure 12.0 Density of shoreline in the Seine River Watershed Study Area, as determined by the 1:50,000 NTS data sheets
41
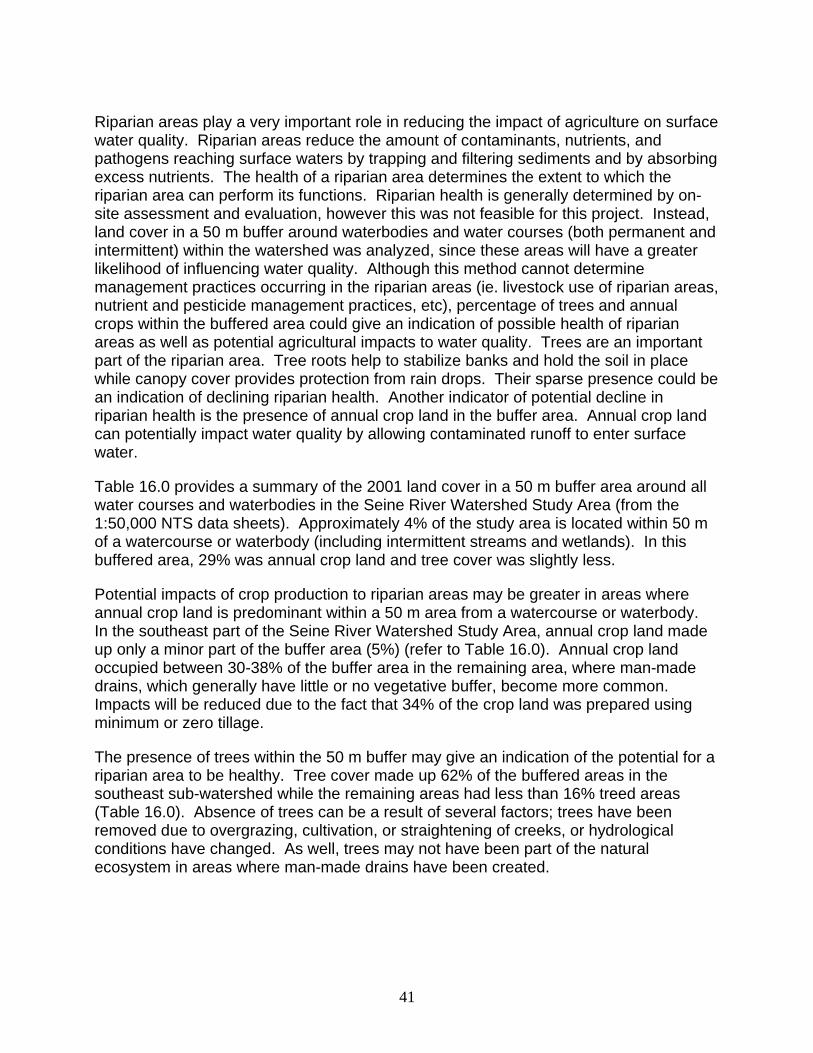
Riparian areas play a very important role in reducing the impact of agriculture on surface water quality. Riparian areas reduce the amount of contaminants, nutrients, and pathogens reaching surface waters by trapping and filtering sediments and by absorbing excess nutrients. The health of a riparian area determines the extent to which the riparian area can perform its functions. Riparian health is generally determined by on-site assessment and evaluation, however this was not feasible for this project. Instead, land cover in a 50 m buffer around waterbodies and water courses (both permanent and intermittent) within the watershed was analyzed, since these areas will have a greater likelihood of influencing water quality. Although this method cannot determine management practices occurring in the riparian areas (ie. livestock use of riparian areas, nutrient and pesticide management practices, etc), percentage of trees and annual crops within the buffered area could give an indication of possible health of riparian areas as well as potential agricultural impacts to water quality. Trees are an important part of the riparian area. Tree roots help to stabilize banks and hold the soil in place while canopy cover provides protection from rain drops. Their sparse presence could be an indication of declining riparian health. Another indicator of potential decline in riparian health is the presence of annual crop land in the buffer area. Annual crop land can potentially impact water quality by allowing contaminated runoff to enter surface water.
Table 16.0 provides a summary of the 2001 land cover in a 50 m buffer area around all water courses and waterbodies in the Seine River Watershed Study Area (from the 1:50,000 NTS data sheets). Approximately 4% of the study area is located within 50 m of a watercourse or waterbody (including intermittent streams and wetlands). In this buffered area, 29% was annual crop land and tree cover was slightly less.
Potential impacts of crop production to riparian areas may be greater in areas where annual crop land is predominant within a 50 m area from a watercourse or waterbody. In the southeast part of the Seine River Watershed Study Area, annual crop land made up only a minor part of the buffer area (5%) (refer to Table 16.0). Annual crop land occupied between 30-38% of the buffer area in the remaining area, where man-made drains, which generally have little or no vegetative buffer, become more common. Impacts will be reduced due to the fact that 34% of the crop land was prepared using minimum or zero tillage.
The presence of trees within the 50 m buffer may give an indication of the potential for a riparian area to be healthy. Tree cover made up 62% of the buffered areas in the southeast sub-watershed while the remaining areas had less than 16% treed areas (Table 16.0). Absence of trees can be a result of several factors; trees have been removed due to overgrazing, cultivation, or straightening of creeks, or hydrological conditions have changed. As well, trees may not have been part of the natural ecosystem in areas where man-made drains have been created.
42
Table 16.0 Summary of land cover in a 50 m buffer around all waterbodies and on either side of watercourses in the Seine River Watershed Study Area (using 2001 satellite imagery and 1:50,000 NTS water layers) 1
Percent of Buffered Area Sub-watershed
ID
Buffered area (percent of
sub-watershed)
annual crop land
trees water grassland wetland forages roads, urban
224 3.1 30.2 7.8 1.1 39.1 3.9 6.7 11.2
233 2.7 5.0 62.3 3.4 20.4 4.6 1.5 2.7
234 6.9 31.4 15.3 4.4 29.1 0.2 1.8 17.9
236 3.5 38.1 3.4 0.5 47.9 0.7 2.4 7.0
Total 3.9 25.8 23.3 2.8 32.0 2.1 2.8 11.1 1. Due to the nature of clipping raster data (land cover layer) with vector data (1:50,000 NTS water layer) and the various scales of the data, areas are estimate. Farm Management Practices The 2001 Census of Agriculture had 895 farm headquarters reporting within the study area (note that census data is attached to farm headquarter and reports on activities on farmland associated with that farm headquarter, therefore whether or not the farmland is located within the watershed cannot be differentiated). In 2001, agriculture in the watershed consisted mainly of livestock and grain production with about 67% of the land utilized by farmers. This includes land that is owned, rented, leased (including government land) or crop shared. Land management practices will have an effect on the health of the riparian areas. Upland management practices such as crop selection and rotation, tillage practices, nutrient management and grassed waterways can have impacts on riparian areas. According to the census data, 58% of the farmland was prepared for the 2001 growing season, of which 34% was prepared using minimum or zero tillage, resulting in a reduction of the risk of soil erosion. In addition, the majority of the farmers practice crop rotation which, along with minimum and zero tillage, will assist in providing extra soil protection by carrying residues over from one year to the next. In 2001, the area seeded to cereals was three times that sown to oilseed crops. Grassed waterways are another effective practice and, when located along natural drainage paths in fields, can help to reduce water erosion and filter out sediments from runoff before it enters the watercourse or waterbody. In the Seine River Watershed Study Area, 3% of the farms reported using grassed waterways. Efforts should continue to promote reduced tillage, crop rotation, grassed waterways and other practices which will help reduce soil erosion. Livestock grazing management is important to the health of riparian areas. Although grazing livestock in the watershed include cattle, sheep and horses, beef production is predominant with approximately 24% of the farms having cow/calf operations. Pastures and forages are necessary for summer grazing and winter feed. In order to maximize forage productivity and promote healthy riparian vegetation, ranchers must ensure that they avoid grazing riparian areas during vulnerable times, such as when streambanks and shorelines are saturated and are more vulnerable to trampling. Ranchers should also ensure that they allow the vegetation a proper rest period after grazing during the
43
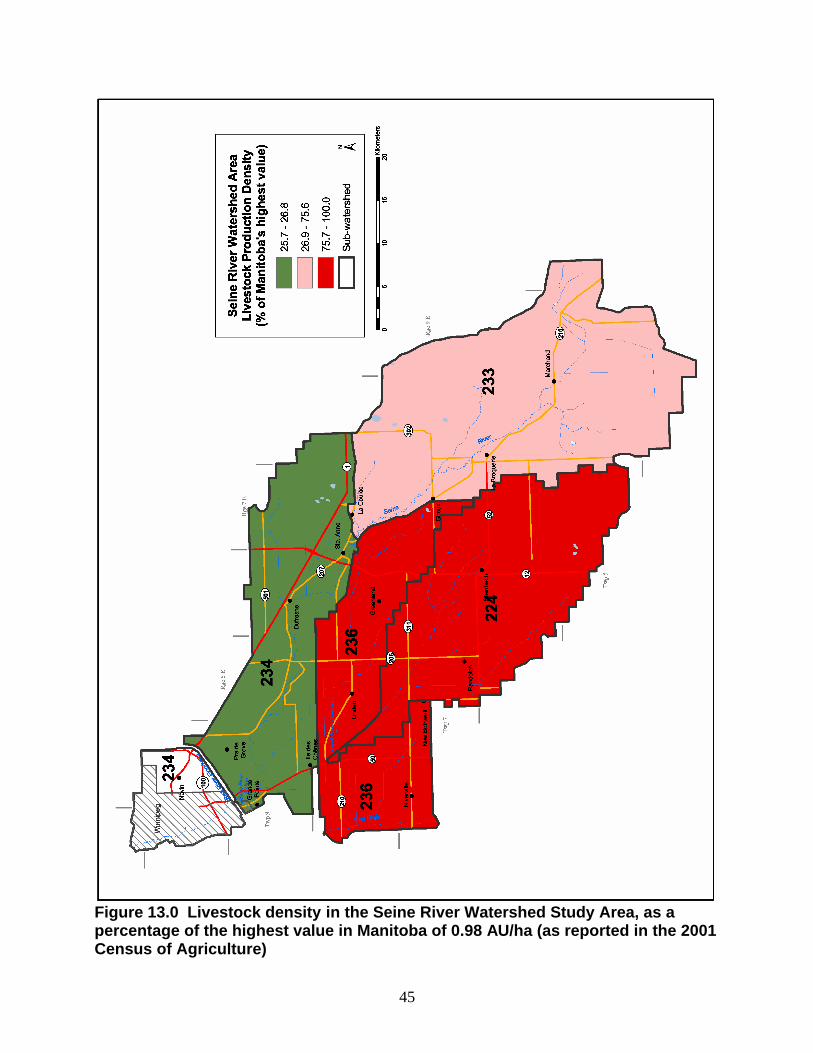
growing season. Vegetation requires adequate rest in order to rebuild roots (energy supply), and restore vigour. During grazing periods, ranchers should utilize management tools to distribute livestock evenly over the grazing area. This not only reduces streambank damage due to trampling and overuse, but it also helps to distribute manure evenly across the grazing area. Manure is a valuable source of nutrients for plants, and when evenly distributed can be fully utilized with minimal risk of contamination to nearby waterbodies. In contrast to grazing systems, confined livestock operations often result in an accumulation of manure that will require mechanical removal and subsequent land application. In the Seine River Watershed Study Area, there were 115 dairy operations, 190 hog operations and 166 poultry operations in 2001. The majority of these will have confined livestock facilities with associated manure storage facilities. Although riparian areas can trap nutrients found in runoff from fields and reduce the risk of contamination of water sources, manure management practices should include manure incorporation as soon as possible after application to the field and maintenance of buffer zones around riparian areas to minimize the risk of contaminated runoff entering water sources. Other manure management practices include soil and manure testing to assist in applying nutrients to crop requirements. Agriculture Production Intensity Riparian areas can be affected by all aspects of activities within a watershed, including agriculture, urban areas, recreation activities, etc. For this report, an attempt was made to determine the level of agriculture production intensity within each sub-watershed to determine which areas of the watershed may have a greater potential agricultural impact on riparian health. The level of livestock and crop production was determined on a per hectare basis. Because information is not available to indicate at what point the livestock density or crop production intensity becomes critical with respect to potential impacts on riparian health, the values calculated were compared to the highest value calculated in a sub-watershed in all of Manitoba. Livestock density was calculated for each sub-watershed. Densities of different types of livestock were standardized by calculating Animal Units per hectare (AU/ha). In Manitoba, an Animal Unit (AU) is defined as the number of livestock required to excrete 73 kg (160 lbs) of nitrogen in a 12-month period. Refer to Appendix C for assumptions used to derive AU coefficients. Suppression of livestock numbers in the census data will affect total AU to varying degrees, depending on the amount of suppression (refer to Table 13.0). Area used in the calculation consisted of hay and crop land, summerfallow, tame pasture and native land used for pasture (as reported in the 2001 Census of Agriculture). In Manitoba and in this report, the sub-watershed in which the City of Steinbach is located had the highest livestock density (0.98 AU/ha). All other livestock densities were compared to this one (refer to Appendix D). Table 17.0 and Figure 13.0 illustrate the different livestock densities within the sub-watersheds of the Seine River Watershed Study Area. Hogs produced the majority of AU in all sub-watersheds. Sub-watersheds #224 and #236 had the highest livestock density of 0.98 AU/ha for the study area, as well as for the province. Livestock

44
production at any density requires attention to manure management, nutrient management and riparian pasture management. Any area with a higher livestock density may have a greater potential to impact riparian areas. Table 17.0 Comparison of livestock density in the Seine River Watershed Study Area using 2001 Census livestock numbers converted to Animal Units1
Livestock Density Sub-watershed ID Area2 (ha)
AU/ha1 As a percentage of 0.981 AU/ha3
224 43,344 0.98 100.0
233 19,553 0.73 74.3
234 32,392 0.25 25.7
236 35,427 0.98 99.5 1. Refer to Appendix C for assumptions used in calculating Animal Units. Some suppression of data occurs (see Table 13.0) 2. Area is calculated as the amount of land planted to annual and hay crops, summerfallow, tame pasture and native land used for pasture, as reported in the 2001 Census of Agriculture 3. Value is calculated as a percentage of the highest AU/ha value determined in Manitoba (using 2001 Census of Agriculture data)
45
Figure 13.0 Livestock density in the Seine River Watershed Study Area, as a percentage of the highest value in Manitoba of 0.98 AU/ha (as reported in the 2001 Census of Agriculture)
46
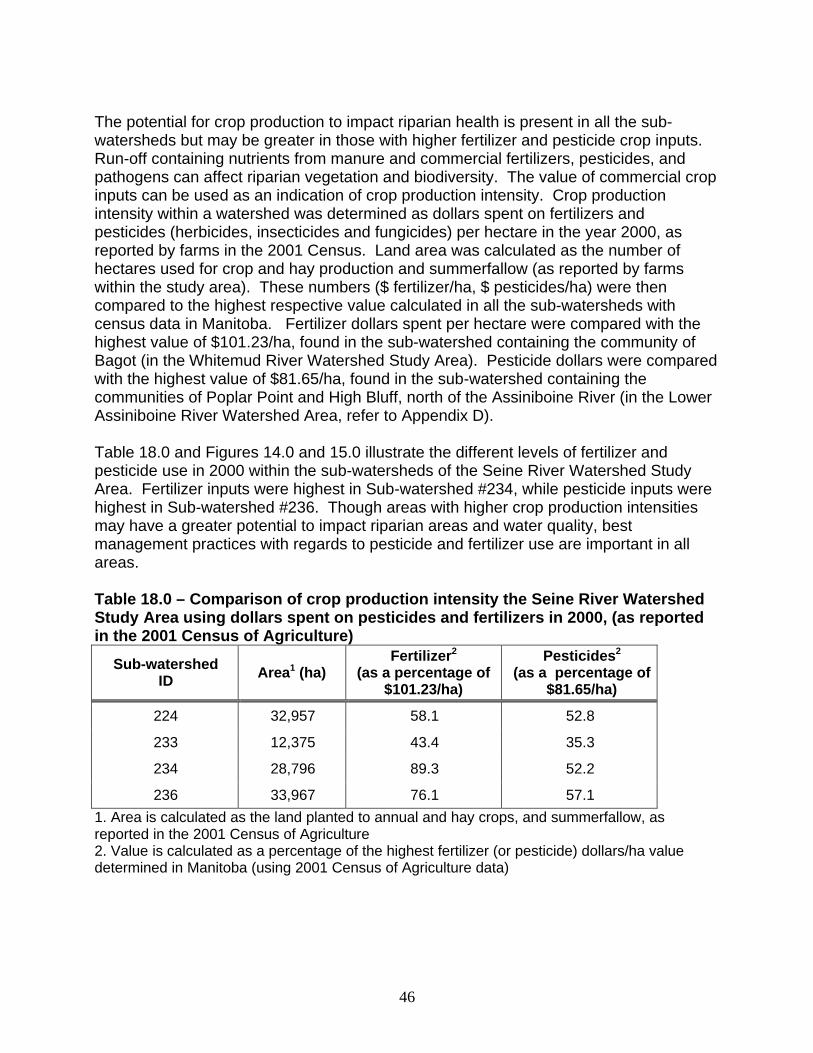
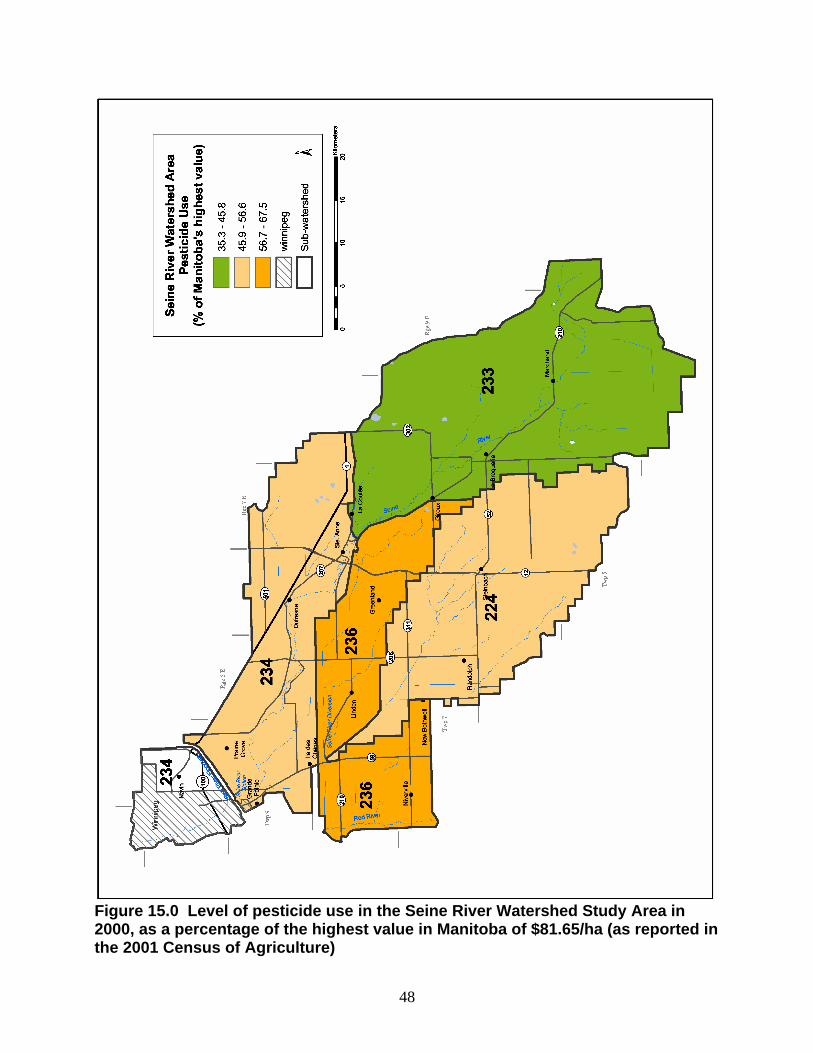
The potential for crop production to impact riparian health is present in all the sub-watersheds but may be greater in those with higher fertilizer and pesticide crop inputs. Run-off containing nutrients from manure and commercial fertilizers, pesticides, and pathogens can affect riparian vegetation and biodiversity. The value of commercial crop inputs can be used as an indication of crop production intensity. Crop production intensity within a watershed was determined as dollars spent on fertilizers and pesticides (herbicides, insecticides and fungicides) per hectare in the year 2000, as reported by farms in the 2001 Census. Land area was calculated as the number of hectares used for crop and hay production and summerfallow (as reported by farms within the study area). These numbers ($ fertilizer/ha, $ pesticides/ha) were then compared to the highest respective value calculated in all the sub-watersheds with census data in Manitoba. Fertilizer dollars spent per hectare were compared with the highest value of $101.23/ha, found in the sub-watershed containing the community of Bagot (in the Whitemud River Watershed Study Area). Pesticide dollars were compared with the highest value of $81.65/ha, found in the sub-watershed containing the communities of Poplar Point and High Bluff, north of the Assiniboine River (in the Lower Assiniboine River Watershed Area, refer to Appendix D). Table 18.0 and Figures 14.0 and 15.0 illustrate the different levels of fertilizer and pesticide use in 2000 within the sub-watersheds of the Seine River Watershed Study Area. Fertilizer inputs were highest in Sub-watershed #234, while pesticide inputs were highest in Sub-watershed #236. Though areas with higher crop production intensities may have a greater potential to impact riparian areas and water quality, best management practices with regards to pesticide and fertilizer use are important in all areas. Table 18.0 – Comparison of crop production intensity the Seine River Watershed Study Area using dollars spent on pesticides and fertilizers in 2000, (as reported in the 2001 Census of Agriculture)
Sub-watershed ID Area1 (ha)
Fertilizer2 (as a percentage of
$101.23/ha)
Pesticides2 (as a percentage of
$81.65/ha)
224 32,957 58.1 52.8
233 12,375 43.4 35.3
234 28,796 89.3 52.2
236 33,967 76.1 57.1 1. Area is calculated as the land planted to annual and hay crops, and summerfallow, as reported in the 2001 Census of Agriculture 2. Value is calculated as a percentage of the highest fertilizer (or pesticide) dollars/ha value determined in Manitoba (using 2001 Census of Agriculture data)

47
Figure 14.0 Level of fertilizer use in the Seine River Watershed Study Area in 2000, as a percentage of the highest value in Manitoba of $101.23/ha (as reported in the 2001 Census of Agriculture)
48
Figure 15.0 Level of pesticide use in the Seine River Watershed Study Area in 2000, as a percentage of the highest value in Manitoba of $81.65/ha (as reported in the 2001 Census of Agriculture)

49
Summary Although riparian areas are affected by all activities in a watershed, this report concentrates on the potential impacts from agricultural activities. The Seine River Watershed Study Area contains a variety of soils and landscapes and, as a result, supports a diverse agricultural landscape. Appropriate management of agricultural activities is very important to protect riparian areas in the watershed. Over half of the Seine River Watershed Study Area is productive agricultural land. In 2001, annual crop land covered 40% of the area but this is a 13% decrease from 1994. Both annual crop land and forage hectares decreased during this period while treed and grassland areas increased. Risk of water erosion is mostly low or negligible and is further reduced due to the fact that 34% of cropped fields had zero or minimum tillage. Pigs made up the majority of the livestock, representing 50% of the Animal Units produced in the study area. Dairy operations contributed to 20% of the Animal Units, poultry 15% and beef 14%. Efforts should continue on education and awareness of the importance of nutrient management, manure management, residue management and crop rotation. By looking at land cover in an area within a 50 metre distance from all waterbodies and watercourses, an attempt was made to determine areas which might have the potential for healthier riparian areas and areas which may be impacted by agricultural activities. Overall, about a quarter of the buffered area was annually cropped and another quarter was treed. Annual crop land was found in higher proportions in the western two-thirds of the watershed where man-made drains are more common. With annual crop land in close proximity to surface water, there may be greater opportunity for contaminated runoff or chemical drift to affect riparian areas and water quality. Trees were more prominent in the buffered areas in the southeast region of the watershed. Trees are an important part of the riparian area and their presence can indicate a certain level of riparian health. More detailed on-site analysis will be required to determine actual riparian health. Calculation of shoreline densities provides information on areas where riparian areas are more concentrated. In the Seine River Watershed Study Area, rivers and creeks, including intermittent streams make up the majority of shoreline. The sub-watershed of the upper part of the Seine River has the highest shoreline density. A higher shoreline density will indicate a greater concentration of riparian areas. Since riparian areas provide a buffer between upland areas and surface water, efforts should continue to promote management practices which maintain or improve riparian health. An attempt was made to determine an overall level of agricultural intensity with respect to livestock production and crop production. Because thresholds are not known, determinations of high, medium and low were not made. Instead, values were compared to the highest value calculated in Manitoba. In the Seine River Watershed Study Area, livestock densities tend to be higher in the west-central portions of the study area. This area also has the highest livestock density in Manitoba. Crop production intensity was generally found to be highest in the northwestern part of the watershed.

50
The Seine River Diversion sub-watershed has a high livestock density, as well as a high crop production intensity, making it an area of intensive agriculture. Areas with higher levels of livestock density or crop production intensity, or both, should be targeted for programs which promote the use of management practices that improve riparian health and reduce impacts to water quality. This report has been presented to provide a central source of riparian-related information to assist in strategic planning for riparian areas in Manitoba. Riparian areas play an important role in surface water quality and their ability to carry out this function can be affected by anthropogenic activities on the landscape. Agriculture is only one component, with other human activities such as industry, recreation and residences contributing to degraded riparian areas. The intent of this report is to be a first step towards addressing the issue of riparian health, with respect to agriculture, in the watershed study area. By providing information on the land resources and the agricultural activities in the study area, a better understanding of the issue can be obtained which will assist towards better planning and priority setting by local decision makers, land use planners and policy decision-makers. While this reports studies the agricultural aspect of the watershed study area, in a true watershed study, all factors of activities of all sectors must be considered. Due to scale and accuracy limitations, this report does not replace the need for site-specific analysis; rather, it serves as a guide for general planning purposes in the Seine River Watershed Study Area. Future Steps Agriculture is a significant land use found within many watersheds across the southern portions of Manitoba. The way in which individual producers manage their land can have positive and negative impacts on the environment. The understanding of the relationship between management choices available to agricultural producers in Manitoba and the type and extent of their impact on riparian and water quality issues is not well understood. It is crucial that a better understanding of these relationships be developed. This, in combination with more information about the agricultural activities within a watershed, will provide a solid foundation of science and information upon which programs, policies and beneficial management practices can be developed and evaluated.
However, agriculture is only one component of the anthropogenic activities that occur within any given watershed. Other human activities, such as industry, residences and recreation can also significantly contribute to degraded riparian areas and reduced water quality within a watershed. As with agriculture, the relationship between these activities and the type and extent of their impact is typically not well known. If issues related to riparian areas and water quality within watersheds are to be understood there needs to be significant work done to collect information on these other activities and relate them to watershed issues. This will require all sectors, public and private, to jointly focus on these issues and work together to reaching their resolution.

51
References Bourne, A., N. Armstrong, G. Jones. 2002. A preliminary estimate of total nitrogen and total phosphorus loading to streams in Manitoba, Canada. Manitoba Conservation Report No. 2002-04. 49 pp. Canada Land Inventory. 1965. Soil Capability Classification for Agriculture. ARDA, Dept. of Forestry, Canada, Ottawa. Digital Elevation Model – radar image obtained from Shuttle Radar Topography Mission, an international project spearheaded by the National Geospatial-Intelligence Agency (NGA) and the National Aeronautics and Space Administration, http://www.jpl.nasa.gov/srtm/ ; Cited 26 November, 2003. Ecoregions Working Group. 1989. Ecoclimatic Regions of Canada, First Approximation. Ecoregions Working Group of the Canada Committee on Ecological Land Classification. Ecological Land Classification Series, No. 23, Sustainable Development Branch, Environment Canada, Ottawa, Canada. 119p. and mapped at 1:7,500,000 scale. Eilers, R.G., G.W. Lelyk, P.Cyr, and W.R.Fraser. 2002. Status of Agricultural Soil Resources of Manitoba; Summary of Applications and Interpretations of RMSID, (Rural Municipality Soil Information Data Base). Land Resource Group - Manitoba, Semiarid Prairie Agricultural Research Centre, Research Branch, Agriculture and Agri-Food Canada. Ehrlich, W.A., E.A. Poyser, L.E. Pratt, and J.H. Ellis. 1953. Report of Reconnaissance Soil Survey of Winnipeg and Morris Map Sheet Areas. Soils Report No. 5. Manitoba Soil Survey. Published by Manitoba Dept. of Agriculture. 111pp and 2 maps. Environment Canada. Archived Hydrological Data. Available from http://www.msc.ec.gc.ca/wsc/hydat/H2O/; INTERNET; Cited 8 March, 2004. Environment Canada website for Climate Data: available from http://www.weatheroffice.ec.gc.ca; INTERNET; 13 March, 2004. Geomatics and Remote Sensing, Manitoba Conservation. 2001. Land Use/Land Cover Descriptions. Hopkins, L. A. 1985. Soils of the Rural Municipalities of Ste Anne and La Broquerie, and Part of the Local Government District of Stuartburn. Report No. D49. Canada-Manitoba Soil Survey.Winnipeg. Hopkins, L. A., E. St. Jacques, and G.F. Mills. 1993. Soils of the Rural Municipality of Hanover. Report No. D82. Canada-Manitoba Soil Survey. Winnipeg.
52
Jones, G., N. Armstrong. 2001. Long-term trends in total nitrogen and total phosphorus concentrations in Manitoba streams. Manitoba Conservation Report No. 2001-07. 154 pp. Land Resource Unit, 1998. Soils and Terrain. An Introduction to the Land Resource. Rural Municipality of Tache. Information Bulletin 98-27, Brandon Research Centre, Research Branch, Agriculture and Agri-Food Canada. Land Resource Unit, 1998. Soils and Terrain. An Introduction to the Land Resource. Rural Municipality of SteAnne. Information Bulletin 98-28, Brandon Research Centre, Research Branch, Agriculture and Agri-Food Canada. Land Resource Unit, 1998. Soils and Terrain. An Introduction to the Land Resource. Rural Municipality of Hanover. Information Bulletin 98-23, Brandon Research Centre, Research Branch, Agriculture and Agri-Food Canada. Land Resource Unit, 1998. Soils and Terrain. An Introduction to the Land Resource. Rural Municipality of Richot. Information Bulletin 98-26, Brandon Research Centre, Research Branch, Agriculture and Agri-Food Canada. Land Resource Unit, 1998. Soils and Terrain. An Introduction to the Land Resource. Rural Municipality of La Broquerie. Information Bulletin 98-24, Brandon Research Centre, Research Branch, Agriculture and Agri-Food Canada. Land Resource Unit, 1999. Soils and Terrain. An Introduction to the Land Resource. Rural Municipality of Reynolds. Information Bulletin 99-23, Brandon Research Centre, Research Branch, Agriculture and Agri-Food Canada. Lewis, R., C. Wyrzykowski, M. Wisener. 2004. Watershed-based Census of Agriculture in Canada (as reprocessed by farm headquarters to the Manitoba Gross watershed delineations, Version 5, in the Province of Manitoba with variable totals from the 2001 Census). [electronic format]. Based on: Statistics Canada, 2001 Census of Agriculture custom tabulation, Winnipeg, Manitoba Manitoba Agriculture and Food. 2000. Farm Practices Guidelines for Poultry Producers in Manitoba. Province of Manitoba Manitoba Conservation. 2003. 2001-2002 Annual Report. Available from http://www.gov.mb.ca/conservation/annual-report/conservation/2002-report.pdf Manitoba Conservation 2000. Development of a nutrient management strategy for surface waters in southern Manitoba, Winnipeg, Manitoba. Information Bulletin 2000-02E. http://www.gov.mb.ca/natres/watres/nutrmgt.pdf Mills, G.F., H. Velduis and R.G. Eilers. 1990. Physiographic Subdivisions of Manitoba, Map and Extended Legend. Manitoba Society of Soil Science: 33rd Annual Meeting, Winnipeg, Manitoba.

53
Natural Resources Canada. Geogratis CLI Home Page. http://geogratis.cgdi.gc.ca/CLI/frames.html; INTERNET; Cited 14 July 2003. Updated January 2000. Save Our Seine. 2003. The Seine River. Available from: http://www.saveourseine.com/seineriver/river.html; INTERNET; Cited 7 April, 2004. Smith, R.E., W.A. Ehrlich, J.S. Jameson, and J.H. Cayford. 1964. Report of the Soil Survey of the South-Eastern Map Sheet Area. Soils Report No. 14. Canada-Manitoba Soil Survey. Winnipeg. 108 pp and 1 map. Smith, R.E., G.F. Veldhuis, G.F. Mills, R.G. Eilers, W.R. Fraser, G.W. Lelyk. 1998. Terrestrial Ecozones, Ecoregions, and Ecodistricts, An Ecological Stratification of Manitoba’s Natural Landscapes. Technical Bulletin 98-9E. Land Resource Unit, Brandon Research Centre, Research Branch, Agriculture and Agri-Food Canada, Winnipeg, Manitoba. Soil Classification Working Group. 1998. The Canadian System of Soil Classification, 3rd Edition. Research Branch, Agriculture and Agri-Food Canada. Statistics Canada. 2002. Census of Agriculture. Available from http://www.statcan.ca/english/freepub/95F0301XIE/about.htm; INTERNET; Cited 27 May 2003. Toews, E. 1990. Peatland Farming Manual. Manitoba Peatland Farming Association. Manitoba Agriculture, Manitoba, Canada. Watmough, M.D., D. Ingstrup, D. Duncan, and H. Schinke. 2002. Prairie Habitat Joint Venture Habitat Monitoring Program Phase I: Recent habitat trends in NAWMP targeted landscapes. Technical Report Series No. 391. Canadian Wildlife Service, Edmonton, Canada Wischmeier, W.H. and D.D Smith. 1965. Predicting Rainfall-erosion Loss from Crop land East of the Rocky Mountains. U.S. Department of Agriculture, Agriculture Handbook No. 282, U.S. Government Printing Office, Washington, D.C.

54
Glossary Alluvial – An accumulation of alluvium (sediment), consisting of gravel or clay, in the bed of a former river. Glaciers may also deposit alluvium known as till. Animal Unit - the number of livestock required to excrete 73 kg (160 lbs) of nitrogen in a 12-month period in Manitoba Erosion – The wearing away of the land surface by detachment and transportation of soil and rock material through the action of moving water, wind or other geological processes. Field Capacity – The amount of water remaining in a soil after free water has been allowed to drain away after the root zone had been previously saturated Glacial till – Unstratified glacial deposits consisting of clay, sand, gravel and boulders intermingled in any proportion. Lacustrine – Mineral deposits that either have settled from suspension in bodies of standing fresh water or have accumulated at their margins through wave action. The sediments generally consist of either stratified are varved (layered annual deposits) fine sand, silt and clay deposited on the lake bed; or moderately well sorted and stratified sand and coarser materials that are beach and other near-shore sediments transported and deposited by wave action. Mean Annual Growing Degree Days - accumulation of days that the daily average temperature [average of maximum and minimum temperature] is greater than 5 C multiplied by the number of 5 C the daily average exceeds 5 C for each day). Moisture Deficit – Precipitation [P] – Potential Evapotranspiration [PE] = Moisture Deficit accumulated over the growing season by August 13 or September 30. Permeability – The ease with which water and air pass through the soil to all parts of the profile.

55
Appendix A
Classification Scheme: Land Cover Mapping of Manitoba
1. Annual crop land: Land that is normally cultivated on an annual basis.
2. Forage: Perennial forages, generally alfalfa or clover with blends of tame grasses.
3. Grassland: Areas of native or tame grasses, may contain scattered stands of trees
4. Trees: Lands that are primarily in tree cover
5. Wetlands: Areas that are wet, often with sedges, cattails, and rushes
6. Water Open water – lakes, rivers, streams, ponds, and lagoons
7. Urban and Transportation:
Towns, roads, railways, quarries
56
Appendix B
The Census of Agriculture is conducted concurrently with the Census of Population by Statistics Canada, every five years. The 2001 Census of Agriculture is the most recent Census to date. The Census of Agriculture collects information from operations that meet the definition of a census farm. In 1996 and 2001, a census farm was defined as “an agricultural operation that produces at least one of the following products intended for sale: crops (hay, field crops, tree fruits or nuts, berries or grapes, vegetables, seed); livestock (cattle, pigs, sheep, horses, game animals, other livestock); poultry (hens, chickens, turkeys, chicks, game birds, other poultry); animal products (milk or cream, eggs, wool, furs, meat); or other agricultural products (Christmas trees, greenhouse or nursery products, mushrooms, sod, honey, maple syrup products)” (Statistics Canada 2002). The Statistics Act requires that all census information be kept confidential. As a result, any data that could disclose information concerning a particular agricultural operation or individual is suppressed in the data tables reported by Statistics Canada. Suppressed data are, however, included in the aggregate subtotals and totals within each data table. In instances where a geographic area has very few agricultural operations, data are not released separately, but are merged with data from one or more geographically adjacent areas (Statistics Canada 2002). 2001 Census of Agriculture Terms and Definitions (Source: Statistics Canada 2002)
Agricultural operation: a farm, ranch or other agricultural operation producing agricultural products for sale. Other agricultural operations include, for example: feedlots, greenhouses, mushroom houses, nurseries, Christmas tree farms, fur farms, hobby farms, game farms, beekeeping, sod, fruit and berry, maple syrup and poultry hatchery operations. Sales in the past 12 months are not necessary but there must be the intent of sales.
Summerfallow land: a term used to describe land on which no crop will be grown in order to conserve moisture but which will be sprayed or cultivated for weed control.
Tame or seeded pasture: grazeable land that has been improved from its natural state by seeding, draining, irrigating, fertilizing or weed control.
Natural land for pasture: grazeable land that has not been recently improved.
Tillage: the practice of working the soil for the purpose of bringing about the more favourable conditions for plant growth. Clean-till (conventional tillage) incorporates most of the crop residue into the soil, while minimum-till (conservation tillage) retains most of the crop residue on the surface. No-till includes direct seeding into stubble or sod.
Crop rotation: a practice where crops are alternated each year, or in a multi-year cycle, for soil conservation or disease control purposes.
57
Permanent grass cover: a practice where a field or land is kept in grass cover indefinitely to keep the soil from being eroded away.
Winter cover crops: crops such as oats or fall rye seeded in the fall to protect the soil from water and wind erosion during the winter and from heavy rains and runoff in the spring.
Green manure crops for plough down: the practice of incorporating young green plants into the soil for fertility purposes. These plants are usually grown with the single purpose of being used as a soil improver. Common examples are buckwheat and red clover.
Contour cultivation: the practice of cultivating the field across the slope to reduce soil erosion from rapid water runoff.
Grassed waterways: either natural or constructed, to control soil erosion. The waterway is permanently grassed and consists of a shallow channel, which is designed to slow down runoff water. The grass stabilizes the soil and prevents it from being washed away. They are usually shaped to allow easy crossings by farm machinery.
Strip-cropping: (or strip farming, field strip-cropping or wind strip-cropping) a method of controlling soil erosion by dividing the farm into narrow fields having different crops, with or without fallow. For example, the narrow fields may be alternately cropped–uncropped (e.g., wheat–fallow–wheat–fallow) or they may be strips of different crops (cereals, corn, soybeans). The widths of the cropped strips are usually multiples of a tillage implement or spray boom, etc.
Windbreaks or shelterbelts: trees, either planted or naturally present. This practice is used more predominantly in western Canada where farmland is more susceptible to wind action and where trapping snow for moisture is important.

58
Appendix C Summary of Animal Unit coefficients used in Manitoba as compared to those used for calculations in this report1. Assumptions are given in the following Table.
Livestock Animal Units
produced by one animal (MAFRI)
Animal Unit coefficient used in
report
Dairy
Milking Cows (including associated livestock) 2.000 2.000
Beef
Beef Cows, incl. associated livestock 1.250 1.250
Backgrounder 0.500 \
Summer pasture 0.625 } 0.631
Feedlot 0.769 /
Hogs
Sows, farrow-to-finish 1.250 --
Sows, farrow-to-weanling 0.313 0.313
Sows, farrow-to-nursery 0.250 --
Weanlings 0.033 --
Grower/finishers 0.143 0.143
Boars (artificial insemination operations) 0.200 0.200
Chickens
Broilers 0.0050 0.0050
Roasters 0.0100 --
Layers 0.0083 0.0083
Pullets 0.0033 0.0033
Turkeys
Broilers 0.010 \
Heavy Toms 0.020 } 0.014
Heavy Hens 0.010 /
Horses (PMU)
Mares, including associated livestock 1.333 1.00
Sheep
Ewes, including associated livestock 0.200 0.200
Feeder Lambs 0.063 --
Goats 0.143 0.143
Bison
Cow 1.00 \
Bull 1.00 } 0.8875 Calf 0.25 / Elk
Cow 0.53 \
Bull 0.77 } 0.520
Calf 0.05 / 1. An Animal Unit is defined as the number of livestock required to excrete 73 kg (160 lbs) of nitrogen in a 12-month period (as defined in the Farm Practices Guidelines for Poultry Producers in Manitoba)

59
Summary of assumptions made in calculating Animal Units1 from 2001 Agricultural Census Data. Livestock Manitoba Animal Unit
Category Census Category Assumptions Used for Animal Unit Calculations
with census data Dairy Milking cows (including
associated livestock) Dairy cows Assumed categories are equal.
Beef cows Beef cows Assumed number of beef cows reported in 2001 Census equal cow/calf pairs
Beef
Backgrounder Summer pasture Feedlot cattle
Heifers and steers for slaughter or feeding 1 yr and older (combined categories)
Assumed steers and heifers reported in these census categories are split into the three categories (communication with MAFRI). Animal unit coefficient determined using this ratio.
Sows, farrow–to-weanling Sows Grower/finishers Grower and finisher pigs
Assumed there are no farrow-to-finish operations and no weanling operations in Manitoba – only farrow-to-weanling and grower/finisher operations.
Pigs
Boars (artificial insemination operations)
Boars Assumed all boars reported in the 2001Census are from artificial inseminations.
Broilers Broilers and roasters Assumed all birds reported in the census category are broilers (communication with MAFRI).
Layers Laying hens (19 weeks and older)
Assumed categories are equal.
Pullets Pullets (under 19 weeks) Assumed categories are equal.
Chickens
Broiler breeding hens Laying hens in hatcheries Assumed all laying hens in hatchery supply flocks reported in Manitoba are broiler breeder hens.
Turkeys Broiler, Heavy Toms, Heavy Hens
Turkeys Assumed “turkeys” represents 20% boilers, 40% heavy toms, 40% heavy hens (communication with MAFRI). Animal unit coefficient is determined using this ratio.
Ewes, including associated livestock
Ewes Assumed ewe/lamb pairs (communication with MAFRI). Sheep
Feeder lambs Lambs Assumed no feeder lambs in province since numbers are very small and cannot be determined from census data (communication with MAFRI).
Horses Horses Total horses and ponies Assumed each animal produces 1 Animal Unit – PMU farms not identified in Census (communication with MAFRI).
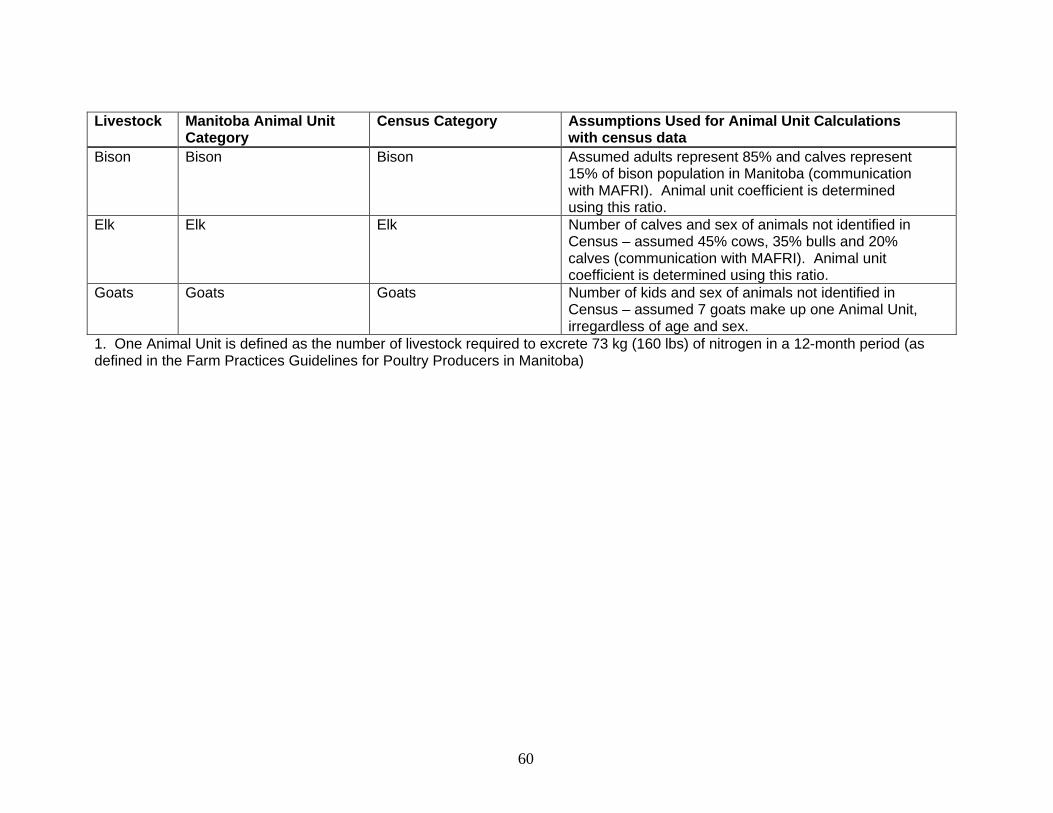
60
Livestock Manitoba Animal Unit Category
Census Category Assumptions Used for Animal Unit Calculations with census data
Bison Bison Bison Assumed adults represent 85% and calves represent 15% of bison population in Manitoba (communication with MAFRI). Animal unit coefficient is determined using this ratio.
Elk Elk Elk Number of calves and sex of animals not identified in Census – assumed 45% cows, 35% bulls and 20% calves (communication with MAFRI). Animal unit coefficient is determined using this ratio.
Goats Goats Goats Number of kids and sex of animals not identified in Census – assumed 7 goats make up one Animal Unit, irregardless of age and sex.
1. One Animal Unit is defined as the number of livestock required to excrete 73 kg (160 lbs) of nitrogen in a 12-month period (as defined in the Farm Practices Guidelines for Poultry Producers in Manitoba)
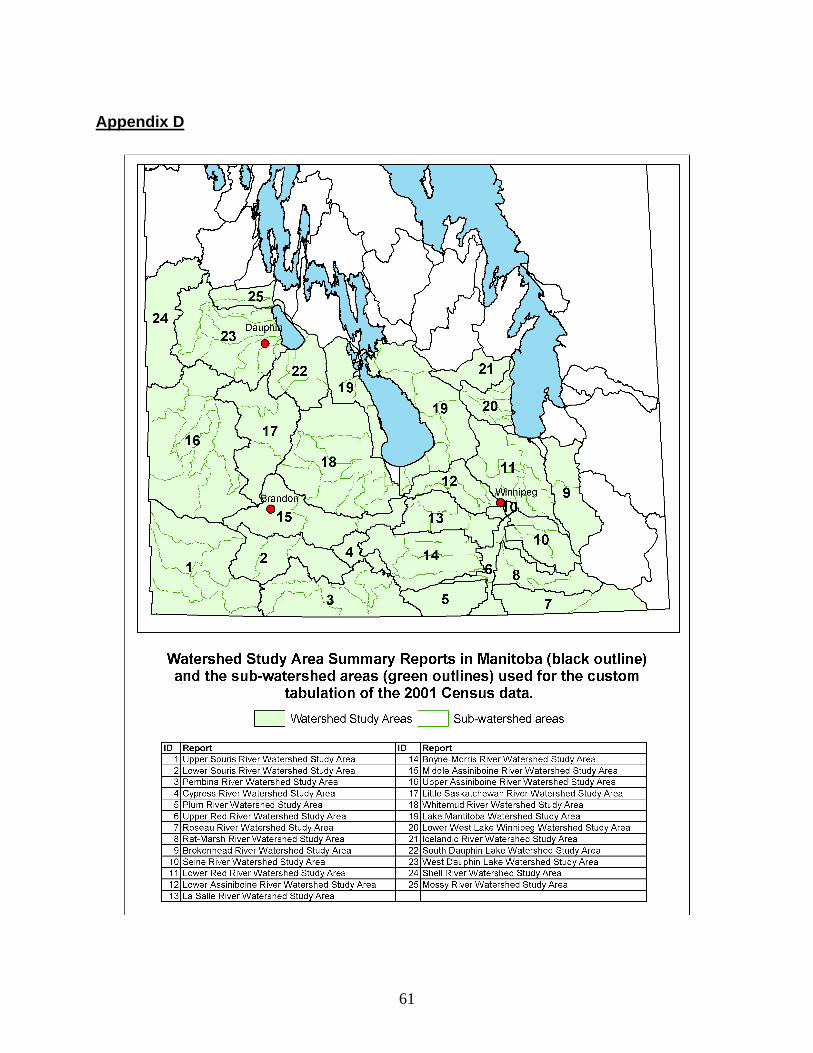
61
Appendix D

62
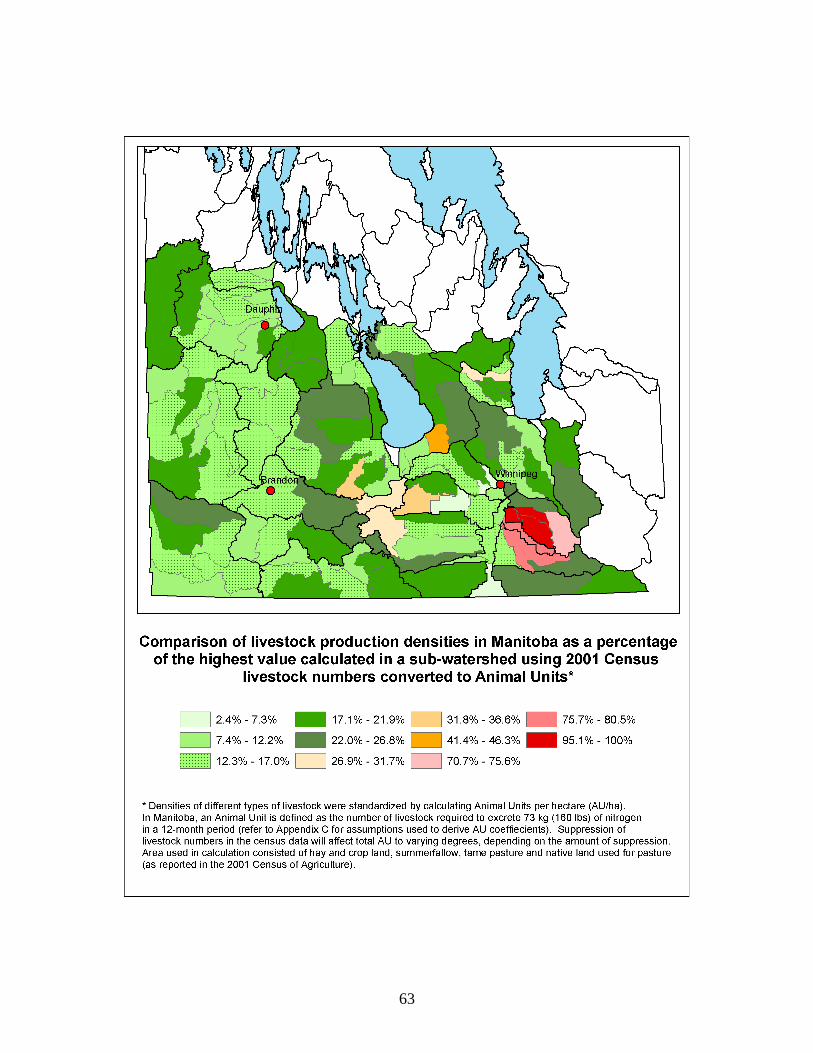
63

64
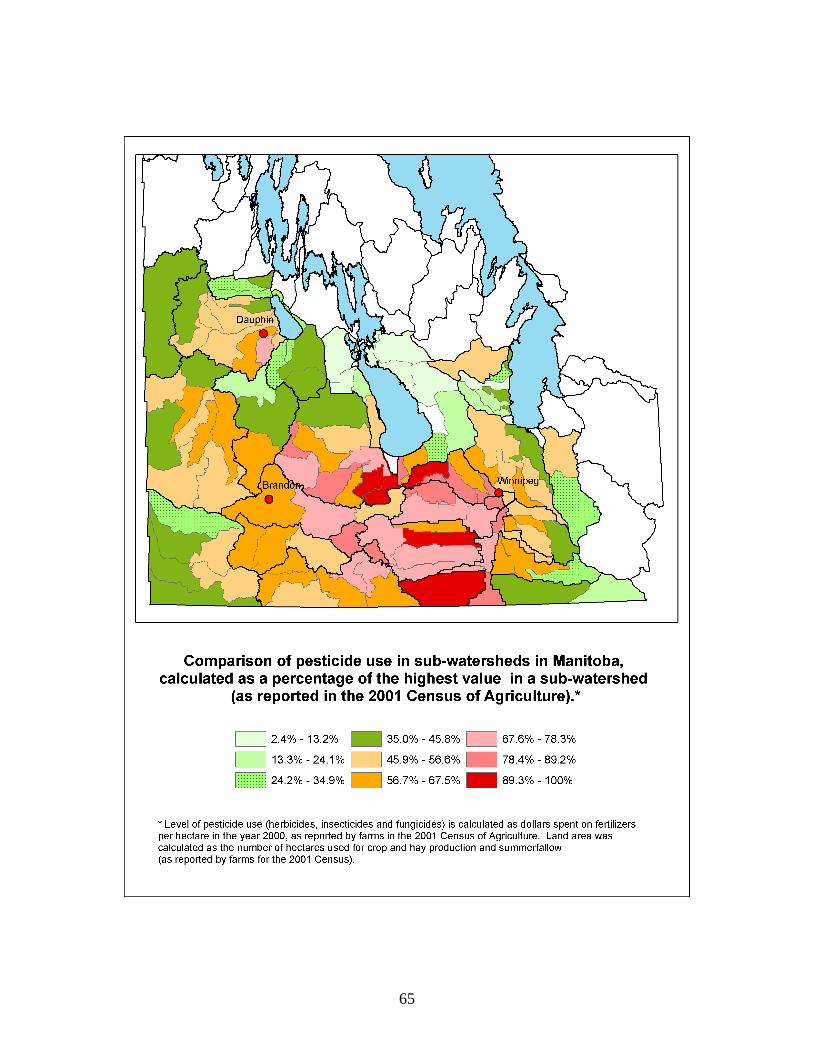
65