Embed Size (px)
Citation preview

Item 4: Conservation Voltage ReductionTesla and SEIA Initial Proposal LNBA Working Group
Summary of Recommendations
SEIA and Tesla propose to create a locational value for Conservation Voltage Reduction(CVR) benefits that can be realized through the utilities’ existing CVR schemes when DERs are available at the low-voltage customers on a distribution circuit, typically the end of a circuit.
Since the 1970s, utilities have employed CVR programs that seek to reduce voltage flowing into distribution circuits where possible in order to conserve energy, reduce costs and avoid construction of generation capacity
The degree to which voltages can be lowered is limited, however, by the lowest-voltage secondary line on the circuit.
Deploying solar with smart inverters on buildings located on these lines can increase their voltage, which allows voltages to be lowered on the remainder of the circuit, which has an energy conservation effect
Tesla and SEIA propose to calculate the CVR benefit in the form of reduced energy consumption and capacity reductions, much the same way benefits are quantified for other energy savings programs. The energy conservation benefit would be calculated by using a CVR factor to convert voltage reduction to energy savings using standard CVR factors for typical customer types on a circuit.
Introduction and Background1
As part of their core responsibilities, utilities must supply electricity to customers within established power quality standards. The range of allowable voltages (i.e. 114 to 126 V), an aspect of power quality, is set by American National Standards Institute (ANSI) standards. In practice, utilities over-supply voltage above the median 120v to most customers due to line losses that reduce voltage as electricity flows along distribution circuits. This over-supply of voltage results in excess energy consumption by customers.
To address this voltage delivery inefficiency, utilities are increasingly deploying conservation voltage reduction (CVR) programs. CVR is a demand reduction and energy efficiency technique that flattens and reduces distribution voltage profiles in order to achieve a corresponding reduction in energy consumption and greenhouse gas emissions. A 1% reduction in distribution service voltage can drive a 0.4% to 1% reduction in energy consumption.2 CVR programs typically save 0.5 to 4% of energy
1 The description of the benefits of CVR derived from solar and smart inverters described below include selected passages from a longer paper authored by Tesla/SolarCity:http://www.solarcity.com/company/distributed-energy-resources#2 “Review on Implementation and Assessment of Conservation Voltage Reduction”, Wang and Wang, IEEE Transactions on Power Systems, May 2014.

consumption on individual circuits, and are often implemented on a large portion of a utility’s distribution grid.
Distributed PV and smart inverters can enable greater savings from utility CVR programs because those programs typically only control utility-owned distribution voltage regulating equipment. Such utility equipment affects all customers downstream of any specific device; therefore, CVR benefits in practice are limited by the lowest customer voltage in any utility voltage regulation zone (often a portion of a distribution circuit) since dropping the voltage any further would violate ANSI voltage standards for that customer. Because distributed PV with smart inverters can increase or decrease the voltage at any individual customer location, these resources can be used to more granularly control customer voltages.
Typical distribution capacity planning studies do not consider the effects of the secondary distribution system, or secondary voltage drop – the portion of the distribution grid consisting of the power lines and pole top transformers that connect a customer’s meter to the utility’s primary distribution system.3 However, incorporating these details is critical to capturing the technical potential of CVR since secondary voltage drop is a limiting factor for utility voltage reduction strategies today. Within a voltage regulation zone, if the lowest customer voltages on the secondary distribution system were to be increased by one volt, the entire voltage regulation zone could then be subsequently lowered another volt. Therefore, the benefit of addressing the secondary voltage drop is significant.
The CVR concept is demonstrated in the figure below, where three voltage profiles are shown along a typical distribution circuit, from substation to end customers. The solid lines depict the primary voltage drop, while the dashed lines represent the secondary voltage drop. The reduction in voltage between the gray and green lines represents the voltage reduction that can be achieved solely by controlling utility-owned voltage regulating equipment within a traditional CVR scheme. However, potential voltage reduction is limited by the customer voltage at the end of the line, which in this example is already at the lowest permissible voltage according to ANSI standards. By installing distributed PV with smart inverters at this customer site, the secondary voltage drop is decreased and voltage is subsequently increased, which is evident in the reduced slope of the secondary voltage drop. This allows the overall voltage profile in yellow to be further reduced, increasing efficiency savings.
3 “Evaluation of Conservation Voltage Reduction on a National Level”, Schneider, Fuller, Tuffner, and Singh, Pacific Northwest National Laboratory (PNNL) for the US Department of Energy (DOE), July 2010

Discussion and MethodologyThe following methodology for determining the CVR benefits of distributed PV with smart inverters focuses on inverter contributions at the secondary (low voltage) level. This methodology quantifies the benefit from increasing the voltages of a subset of customers through targeted deployment of distributed PV with smart inverters in order to enable the subsequent decrease of voltages to all other customers on the circuit, resulting in energy efficiency savings. This methodology does not evaluate the incremental benefits to the primary (medium voltage) system due to the complexity introduced in modeling such benefits. Primary system benefits could be modeled if circuit model, equipment, and loading data were available.
Modeling Secondary Voltage Drop
Secondary voltage drop is a function of net load and the impedance of the service transformer and secondary line. To represent a typical secondary system, a simplified secondary model was utilized that consisted of typical pole top transformer, secondary conductor, and customer loads. For simplicity, all load is modeled as connected at a single location at the end of the secondary line. Consistent with the IEEE 8500-Node Test Feeder,4 the secondary system, and therefore the impedance, consists of a 25 kVA transformer and 50 feet of 4/0 Al secondary conductor. The single line diagram of this typical secondary system is depicted in the figure below.
Equation 1 below shows how the secondary voltage drop is calculated, which is the difference of voltage magnitude between the primary side of the service transformer and the customer’s meter. The voltage at the primary side of the transformer can be derived using the transformer load and secondary impedance, as seen in Equation 2. The voltage at the meter is used as reference and is fixed to a nominal value, 120 ∠0° V, as shown in Equation 3. The difference in magnitudes between these two voltages equals the voltage drop across the secondary system (Equation 1).
Modeling PV with Smart Inverter Capability
The voltage drop reduction of PV with smart inverters is a function of both the underlying PV generation as well as the reactive power capability of the smart inverter. Therefore, their combined impact on the
4 "The IEEE 8500-Node Test Feeder”, Arritt and Dugan, Electric Power Research Institute (EPRI), 2010
secondary voltage drop must be modeled. To do so, PV production data from the National Renewable Energy Lab’s (NREL) PVWatts® Calculator5 is applied to an archetypal 5 kVA smart inverter. Inverter reactive power capability is activated for all hours of the day, but the smart inverter is assumed to maintain an active power priority because the economic value of active power is generally greater than reactive power (note: in geographies or times of day when reactive power is more valuable, this prioritization can be removed; this is actively being discussed in California). Therefore, the amount of reactive power available per inverter is limited by the coincident apparent power generation. For example, at night when the PV is not generating, the smart inverter is capable of supplying the full 5 kVAr. However, during peak PV generation, the smart inverter maynot be capable of supplying any VArs, depending on the size of the inverter and assuming an active power priority of the inverter. However, since both active and reactive power enable a reduction in secondary voltage drop, any combination of active and reactive power output provides benefits.
A negative secondary voltage drop (i.e. voltage rise) can occur due to reverse power flows from PV back-feeding onto the primary, or excessive reactive power support during low loading conditions. While voltage rises can occur in practice, overall CVR benefits would be limited by the customer with the next lowest voltage. Therefore, secondary voltage drops are assumed to be able to be reduced to zero, but no incremental benefits are attributed to voltage rises on the secondary.
Relating Voltage Reduction to Energy Reduction
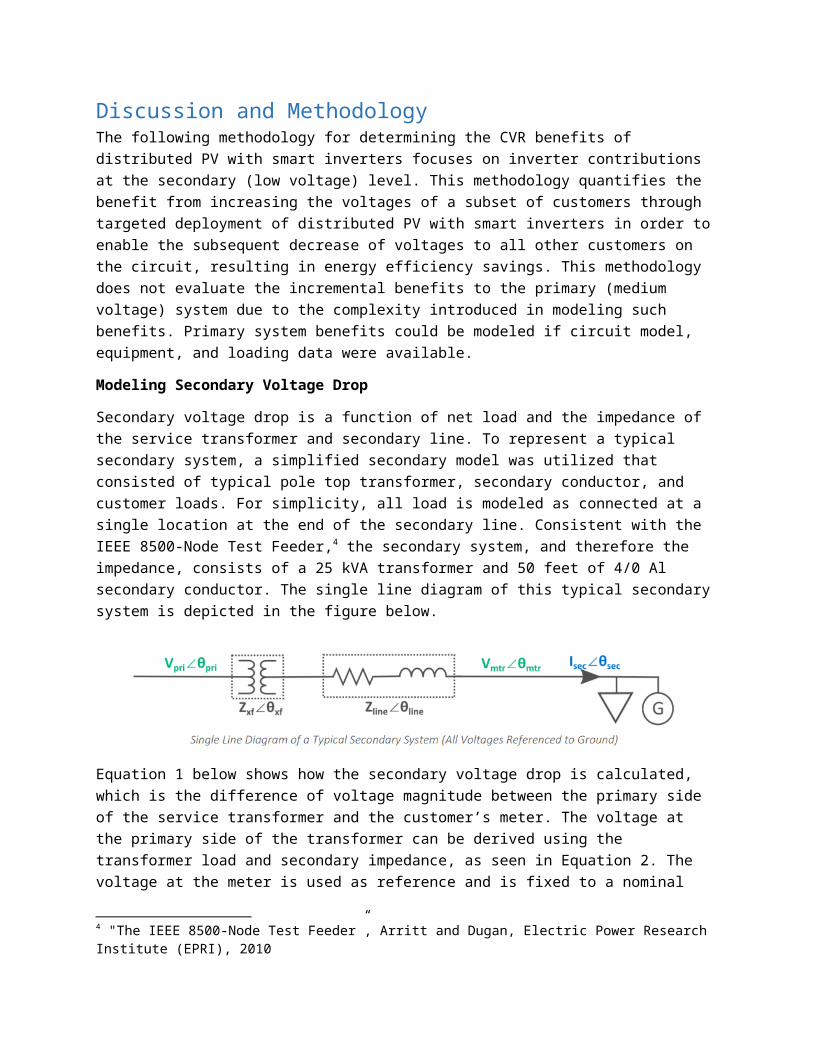
Equation 4 details how the incremental CVR energy savings ($/kWh) are calculated for each voltage regulation zone.
The difference in the secondary voltage drop with and without PV (VDnoPV - VDPV) is calculated for each hour over the course of one year (8760 hours) using Equations 1-3 above. The change in voltage drop after PV is deployed is then converted to a percentage by dividing by the nominal voltage at the customer meter (i.e. 120 V).
The percent reduction in energy for a voltage regulation zone is then determined by multiplying the percent reduction in voltage by the relevant CVR factor. The CVR factor of a load is the change in energy that results from a corresponding change in voltage. For example, if a load has a CVR factor of one, then a 1% reduction in voltage would result in a 1% reduction in energy. A CVR factor of 0.8 has been found to be representative of typical distribution circuits.6
5 “NREL’s PVWatts® Calculator”, National Renewable Energy Lab (NREL), Accessed June 2016. http://pvwatts.nrel.gov6 “Green Circuit Distribution Efficiency Case Study”, Electric Power Research Institute (EPRI), October 2010 PPPhttp://www.epri.com/abstracts/Pages/ProductAbstract.aspx?ProductId=000000000001023518

Percent reduction in energy for the entire circuit is then determined by multiplying the voltage drop and CVR factor by the percentage of customers that are having their voltage reduced. In this case, the customers who are experiencing the voltage reduction are those without PV installations (1 - %Targeted). Those customers with PV installations will receive the same voltage before and after the CVR scheme is in place, since the PV will raise their voltage while the CVR scheme will then lower it to its previous value. Equation 4 assumes that all customers have the same net load. In other words, 1% of customers consume 1% of the circuit load.
Quantifying Incremental CVR Benefits
After determining the percent reduction in energy, total financial savings in the numerator of Equation 4 are determined by multiplying the percent reduction in energy by the cost of energy in the voltage regulation zone. $/kWh benefits are calculated by dividing this number by the estimated annual energy production from all of the targeted systems. Equation 5 shows an annotated version of the energy benefits calculation highlighting where the change in voltage, reduction in energy, energy costs, and annual energy production are calculated.
After determining the savings attributed to energy, the savings attributed to capacity can be similarly found by taking the demand reduction at peak and multiplying it by the distribution marginal cost of capacity (DMC) as seen in Equation 6.
Total financial savings are determined by adding equations 5 and 6.
ProposalThere are two potential means of accounting for CVR value in the context of the LNBA and DER Avoided Cost (DERAC) Calculators.
The first option is to represent CVR as a locational value for solar and smart inverter deployment on areas of distribution circuits with the lowest voltage. This value could be represented in the LNBA/ICA
maps of the utilities’ distribution grids. Value would be calculated by using the formulas above to compute the percentage voltage reduction made possible on a particular circuit by raising the voltage of the lowest-voltage secondary lines. This voltage reduction could then be converted to MWh of energy and MW of capacity saved using a CVR factor and equations 5 and 6 above.
Our understanding is that the utilities lack sufficient understanding of all of their secondary lines to develop this value on a locationally-specific CVR value across their distribution systems. This should not mean, however, that CVR is valued as zero. Thus, in addition to the first option, we propose an alternative method in which averaged CVR value could be integrated into the LNBA and included in instances where CVR is one of the benefits provided by DERs – for example, in the evaluation of a voltage management tariff developed in the Integrated Distributed Energy Resources proceeding.
Conclusion and Next StepsSolar with smart inverters provide the opportunity for enhanced conservation voltage reduction, which is a powerful energy efficiency strategy for utilities. There are likely multiple ways where DER owners could be provided compensation for providing this service. What is key in the LNBA is to develop a value that ensures that such benefits are accounted for in instances where DERs used to provide CVR. A methodology is available for calculating this locationally, but should the utilities lack the data to calculate this on a locational basis an averaged value can be developed.
The next steps are:
Create a system-wide CVR value based on an average CVR factor and the avoided energy values in the LNBA tool
If utilities are able to better understand their secondary lines,, and those can be identified in the LNBA through the maps or spreadsheet tool, CVR should be incorporated as a locational value
If utilities are not able to identify the low-voltage secondary lines, determine the average contribution of solar PV and smart inverters to CVR in utilities existing CVR programs