Embed Size (px)
Citation preview

Summary ofPesticide Use Report Data
2015
California Department of Pesticide RegulationP.O. Box 4015
Sacramento, CA 95812-4015
California Environmental Protection AgencyDepartment of Pesticide Regulation
Edmund G. Brown Jr., Governor
Matt Rodriquez, SecretaryCalifornia Environmental Protection Agency
Brian Leahy, DirectorDepartment of Pesticide Regulation
April 2017
Any portion of this report may be reproduced for any but profit-making purposes.For information on obtaining electronic data files, see Page ii.
This report is also available on DPR’s Web site <www.cdpr.ca.gov>.If you have questions concerning this report, contact <[email protected]>.

ContentsHow to Access the Summary of Pesticide Use Report Data ii
1 Introduction 1Continuous Evaluation of Pesticides . . . . . . . . . . . . . . . . . . . . . . . . . . . . 2Data Collection . . . . . . . . . . . . . . . . . . . . . . . . . . . . . . . . . . . . . . . 3CalAgPermits . . . . . . . . . . . . . . . . . . . . . . . . . . . . . . . . . . . . . . . . 4Improving Accuracy . . . . . . . . . . . . . . . . . . . . . . . . . . . . . . . . . . . . 4Improving Access to the Data . . . . . . . . . . . . . . . . . . . . . . . . . . . . . . . . 5
2 Comments and Clarifications of Data 6Terminology . . . . . . . . . . . . . . . . . . . . . . . . . . . . . . . . . . . . . . . . . 6Agricultural and Nonagricultural Pesticide Use . . . . . . . . . . . . . . . . . . . . . . 6Commodity Codes . . . . . . . . . . . . . . . . . . . . . . . . . . . . . . . . . . . . . 9Unregistered Use . . . . . . . . . . . . . . . . . . . . . . . . . . . . . . . . . . . . . . 9Adjuvants . . . . . . . . . . . . . . . . . . . . . . . . . . . . . . . . . . . . . . . . . . 10Cumulative Area Treated . . . . . . . . . . . . . . . . . . . . . . . . . . . . . . . . . . 10Number of Applications . . . . . . . . . . . . . . . . . . . . . . . . . . . . . . . . . . . 10
3 Data Summary 11Pesticide Use in California . . . . . . . . . . . . . . . . . . . . . . . . . . . . . . . . . 11Pesticide Sales in California . . . . . . . . . . . . . . . . . . . . . . . . . . . . . . . . 14
4 Trends in Pesticide Use in Certain Pesticide Categories 14
5 Trends In Pesticide Use In Certain Commodities 68Alfalfa . . . . . . . . . . . . . . . . . . . . . . . . . . . . . . . . . . . . . . . . . . . 69Almond . . . . . . . . . . . . . . . . . . . . . . . . . . . . . . . . . . . . . . . . . . . 71Carrot . . . . . . . . . . . . . . . . . . . . . . . . . . . . . . . . . . . . . . . . . . . . 75Cotton . . . . . . . . . . . . . . . . . . . . . . . . . . . . . . . . . . . . . . . . . . . . 78Orange . . . . . . . . . . . . . . . . . . . . . . . . . . . . . . . . . . . . . . . . . . . 81Peach and nectarine . . . . . . . . . . . . . . . . . . . . . . . . . . . . . . . . . . . . . 84Pistachio . . . . . . . . . . . . . . . . . . . . . . . . . . . . . . . . . . . . . . . . . . 88Processing tomato . . . . . . . . . . . . . . . . . . . . . . . . . . . . . . . . . . . . . 91Rice . . . . . . . . . . . . . . . . . . . . . . . . . . . . . . . . . . . . . . . . . . . . . 94Strawberry . . . . . . . . . . . . . . . . . . . . . . . . . . . . . . . . . . . . . . . . . 97Table and raisin grape . . . . . . . . . . . . . . . . . . . . . . . . . . . . . . . . . . . 100Walnut . . . . . . . . . . . . . . . . . . . . . . . . . . . . . . . . . . . . . . . . . . . 104Wine grape . . . . . . . . . . . . . . . . . . . . . . . . . . . . . . . . . . . . . . . . . 107Appendix . . . . . . . . . . . . . . . . . . . . . . . . . . . . . . . . . . . . . . . . . . 115
i

How to Access the Summary of Pesticide Use Report Data
The Summary of Pesticide Use Report Data issued by the California Department of PesticideRegulation (DPR) for the years 1989-2015 can be found by selecting the year from the drop-downmenu under the Pesticide Use Annual Summary Reports section at<www.cdpr.ca.gov/docs/pur/purmain.htm>. The tables in the Statewide Report and CountySummary Reports list the pounds of active ingredient (AI) applied, the number of applications,and the number of acres or other unit treated. The data is available in two formats:
• Indexed by chemical: The report indexed by chemical shows all the commodities and sitesin which a particular AI was applied.
• Indexed by commodity: The report indexed by commodity shows all the AIs that wereapplied to a particular commodity or site.
The data used in the Pesticide Use Annual Summary Reports for 1989 to 2015 are available onCD and on the Department’s File Transfer Protocol (FTP) site at<ftp://transfer.cdpr.ca.gov/pub/outgoing/pur archives/>. The FTP site also includes data for theyears 1974 to 1989. The files are in text (comma-delimited) format. Data obtained from the FTPsite does not include updates that occur after the Pesticide Use Annual Summary was released.For the most up-to-date data, use the online California Information Portal (CalPIP) at<http://calpip.cdpr.ca.gov/main.cfm> or contact DPR at <[email protected]>
Please direct any questions regarding the Summary of Pesticide Use Report Data to theDepartment of Pesticide Regulation, Pest Management and Licensing Branch, P.O. Box 4015,Sacramento, California 95812-4015, or you may request copies of the data by contacting<[email protected]>.
ii

1 Introduction
California’s pesticide use reporting program is the most comprehensive in the world. Californiahas reported pesticide use in some form since 1934. However the detailed reporting that occurstoday did not begin until the 1990s. Until 1954, only statistics on aerial pesticide applicationswere recorded. In 1954, state regulators asked for reports on ground appliction acreage, withoutany detailed information about the pesticides used or commodities treated. In 1970, farmers wererequired to report all applications of restricted materials and pest control operators were requiredto report all pesticides used. The Food Safety Act of 1989 (Chapter 1200, AB 2161) gave DPRstatutory authority to require full reporting of agricultural pesticide use. In 1990, Californiabecame the first state requiring full reporting of agricultural pesticide use to better inform DPR’spesticide regulatory programs. Prior to full reporting, the regulatory program’s estimates ofpesticide use frequently relied on maximum rates and applications as listed on the label,overstating many risks. Over the years, these data have been used by a variety of individuals andgroups, including government officials, scientists, growers, legislators, and public interest groups.Most pesticide use data required to be reported must be sent to the county agriculturalcommissioner (CAC), who then reports the data to DPR. In the last few years, DPR has annuallycollected and processed more than three million records of pesticide applications. (A pesticideapplication record represents an individual pesticide product, even if it was appliedsimultaneously with other products in the field or if it contained more than one AI).
California’s broad definition of “agricultural use” requires reporting pesticide applications inproduction agriculture, parks, golf courses, cemeteries, rangeland, pastures, and along roadsideand railroad rights-of-way. Each application of pesticide on crops (production agriculture) mustinclude the site name given to a location or field by the CAC as well as the section (square mile)in which the application occurred. Most other uses are aggregated and reported by month withonly the county identified. These other uses include rights-of-way applications, all postharvestpesticide treatments of agricultural commodities, structural applications by licensed applicators,all pesticide treatments in poultry and fish production, and some livestock applications. Inaddition, all applications made by licensed applicators and outdoor applications of pesticides thathave the potential to pollute ground water must be reported. The primary exceptions to thereporting requirements are home-and-garden use and most industrial and institutional uses.
In addition to requiring pesticide use reporting, California law (Food and Agricultural Code[FAC] section 12979) directs DPR to use the reports in setting priorities for monitoring food,enforcing pesticide laws, protecting the safety of farm workers, monitoring the environment forunanticipated residues, researching pest management practices, monitoring and researchingpublic health issues, and similar activities. These activities help DPR continuously evaluatecurrently registered pesticides (FAC section 12824), another mandated activity. Informationgathered during continuous evaluation is used to gauge the performance of DPR’s regulatoryprograms and justify additional measures, including development of new regulations orreevaluation or cancellation of pesticide registrations. California Code of Regulations Title 3,
1

sections 6624 et seq. further describe pesticide use record keeping and reporting requirements.
Continuous Evaluation of Pesticides
The Pesticide Use Report (PUR) greatly increases the accuracy and efficiency of continuousevaluation of pesticides by providing details on each application, including date, location, site(e.g., crop), time, acres or units treated, and the identity and quantity of each pesticide productapplied. These data allow scientists and others to identify trends in pesticide use, compare uselocations with other geographical information and data, and perform quantitative assessments andevaluations of risks pesticides may pose to human health and the environment.
DPR uses the PUR throughout its pesticide regulatory programs in ways that can be broadlygrouped as temporal (time), geospatial (place), and quantitative (amount), often combiningelements of each.
Temporal analyses can pinpoint specific applications or span many years. Investigations intosuspected worker illnesses, spray drift, fish or wildlife losses, or other enforcement inquiriesfrequently begin with a review of the PUR to see what applications were made in an area at aparticular time. Protection of ground and surface waters, assessments of acute and chronic risks tohuman health, and allocation of monitoring and enforcement resources often begin with analysesof PUR data spanning many years to evaluate pesticide use trends.
Geospatial analyses may be local or expansive. Local analyses are used to help set priorities forsurface and ground water monitoring programs by determining pesticide use and runoff potentialin specific watersheds or other defined areas. DPR scientists calculate contributions ofsmog-forming volatile organic compounds (VOCs) in the atmosphere using reliable pesticide usedata and emissions data on products. DPR further refines the analyses to specific air basins thatare particularly vulnerable to air pollution to determine whether pesticide-related VOC emissionsare below required targets or whether additional restrictions on use may be warranted to protectair quality. More expansive analyses examine the proximity of pesticide use to endangeredspecies habitat, resulting in the development of best use practices to protect these species. Theseanalyses are invaluable when assessing regulatory responses or evaluating the performance ofvoluntary stewardship efforts.
Quantitative assessments are broadly used to model risks of pesticide use to humans and theenvironment. The quality and depth of the information provided in the PUR allow researchers toapply realistic assumptions when modeling pesticide exposure. PUR data have been used tomodel pesticide exposure of people who live near agricultural lands, workers in the field, handlerspreparing and applying pesticides, and aquatic organisms inhabiting waterways that receiveagricultural runoff. Analysis of the PUR enables well-informed and realistic assessments for riskmanagement decisions.
2

The passage of the federal Food Quality Protection Act (FQPA) of 1996 launched the PUR into amore integral role as a tool for monitoring and achieving compliance with updated food safetyregulations. The FQPA contained a new food safety standard against which all pesticidetolerances–amounts of pesticide residue allowed by federal law to remain on a harvestedcrop–must be measured. PUR data became increasingly important to commodity groups,University of California (UC) specialists, the United States Environmental Protection Agency(U.S. EPA), and other interested parties as they reassessed tolerances and calculated dietary risksfrom pesticides based on actual reported uses.
PUR information such as pesticide type, use rates, geographical locations, crops, and timing ofapplications help researchers understand how various pest management options are implementedin the field. Analyses of these data are the basis for grant projects that DPR funds to promote thedevelopment and adoption of integrated pest management practices in both agricultural and urbansettings.
The PUR data are used by state, regional, and local agencies, scientists, and public interestgroups. The data are an invaluable tool for understanding pesticide use in order to protect humanhealth and the environment while balancing the population’s need for quality food, fiber, shelter,and surroundings.
Data Collection
Partial reporting of agricultural pesticide use has been in place in California since at least the1950s. In the early years, CACs required agricultural pest control operators to submit monthlyreports. County requirements varied, but many reports included a statement for each applicationthat showed the grower’s name, the location and date of the application, the crop and the size ofarea treated, the target pest, and the type and amount of pesticide applied. Only statistics on aerialpesticide applications were forwarded to the state for tabulation. In 1955, state regulators askedfor reports on ground application acreage but discontinued requirements for detailed reporting ofpesticides used and commodities treated. In 1970, DPR required farmers to report all applicationsof restricted-use pesticides, and pest control operators to report all pesticides used, whetherrestricted or not. Both kinds of reports had to include the date, location, site (e.g., crop), acres orunits treated, and the identity and quantity of each pesticide applied. Production agriculturalapplications included records for each application and the location to within a square mile area(section, township, and range); all other applications were reported as a monthly summary bycounty. The reports were filed with the CAC, who forwarded the data to the state, where it wasentered into a database and summarized in annual publications.
The Food Safety Act of 1989 (Chapter 12001, Assembly Bill 2161) gave DPR statutory authorityto require full reporting of pesticide use. DPR adopted regulations the same year and full-usereporting began in 1990. The first years of full-use reporting nearly overwhelmed DPR’s capacityto process data. Use reports were on paper, and required staff to manually enter data from more
3

than a million records each year. DPR began searching almost immediately for ways to automatereporting from pesticide users to the CAC, and, in turn, from the counties to DPR. However, itwas difficult to find an approach that suited the diversity of use reporting and differing budgetresources among the counties. Starting in 1991, various automated programs were developed andmodified by DPR and CACs. Meanwhile, technological progress and increasing use of onlineresources by businesses fed expectations for more web-based functionality for pesticide usereporting.
CalAgPermits
In 2011, the counties implemented CalAgPermits, a standardized, web-based system that greatlyenhanced the efficiency of data entry and transfer, and thus the accuracy and integrity of the PURdatabase. In addition to helping CACs issue restricted-materials permits, it allowed individualsand firms the option of reporting pesticide use electronically. CalAgPermits also greatly enhanceddata quality assurance by automating data validation and error checking of submitted pesticideuse reports before transmission to DPR. The many improvements in the ability to share dataelectronically between DPR and CACs have greatly improved the efficiency and effectiveness ofquality control for the PUR.
Improving Accuracy
DPR checks the accuracy of PUR data many times between the initial data entry and before it ismade available to the public. CalAgPermits checks for data entry errors, such as whether thepesticide applicator has the correct permits for any restricted materials reported or whether thepesticide product is allowed on the reported application site. Once the data have been received byDPR they undergo more than 50 different validity checks such as verifying product registrationnumbers and confirming that products are registered for use on the reported site of application.The PUR database may include products that do not have an active registration since end-usersare allowed to continue using stocks purchased prior to a product’s registration becominginactive. Records flagged for suspected errors are returned electronically to the county forresolution. Additional data checks are performed to identify errors and outliers in pesticide useamounts via an extensive statistical method developed by DPR in the late 1990s. If a reported userate (amount of pesticide per area treated) greatly exceeds maximum label rates, it is flagged as anerror and sent back to the CAC to confirm. If the county is unable to identify the correct rate, anestimated rate equal to the median rate of all other applications of the pesticide product on thesame crop or site is used instead. Although less than one percent of the reports are flagged withthis type of error, some errors are so large that if included, they would significantly affect the totalcumulative amount of applied pesticides. For more information on errors and identifying outliersin the PUR, see <www.cdpr.ca.gov/docs/pur/outlier.pdf> and<www.cdpr.ca.gov/docs/pestmgt/pubs/pm9801.pdf>
4

Improving Access to the Data
There are several ways to access the PUR data. Annual reports serve as an accessible snapshotsummary of the much larger PUR database. Before the late 1990s, summaries were only availablein hard copy and only by request, indexed by AI and commodity with summaries of pesticide useby county. As use of online resources increased, DPR improved public access to the data andpresented it in a more meaningful context, posting the summary annually on its website. Inaddition, the PUR data used in each annual report from 1974 on can be downloaded from DPR’sFTP website <ftp://pestreg.cdpr.ca.gov/pub/outgoing/pur archives>. This data does not includeany updates that may have occurred after the release of the annual report.
In 2003, DPR launched the web-based California Pesticide Information Portal (CalPIP) databaseto increase public access to the PUR. CalPIP provides pesticide use information including date,site or crop treated, pounds used, acres treated, pesticide product name, AI name, applicationpattern (ground, air, or other), county, ZIP code, and location where the application was made towithin a one-square-mile area. CalPIP annually updates any changes due to errors identified afterthe annual report has been released, so it is the most up-to-date source of pesticide informationavailable via the website.
Starting in 1996, DPR scientists began analyzing critical crops and their pest problems as well astrends in the pounds of pesticides used, and the number of applications and acres treated. Eachyear, the annual report charts pesticide use over several years in specific categories:
• Reproductive toxins• Carcinogens• Insecticide organophosphate and carbamate chemicals• Chemicals classified by DPR as ground water contaminants• Chemicals listed by DPR as toxic air contaminants• Fumigants• Oil pesticides derived from petroleum distillation (some may be on the state’s Proposition
65 list of chemicals “known to cause cancer,” but most serve as alternatives to high-toxicitypesticides)
• Biopesticides (including microorganisms, naturally occurring compounds, or compoundsessentially identical to naturally occurring compounds that are not toxic to the target pest,such as pheromones)
• Crops (DPR analyzes pesticide use trends for around a dozen crops with the highest amountof pesticide used or acreage treated)
Pesticide use trend analyses can help regulatory agencies understand where efforts to promotereduced-risk pest management strategies are succeeding or failing. Information on long-termtrends also helps researchers better identify emerging challenges and direct research to findingsolutions.
5

2 Comments and Clarifications of Data
The following comments and points should be considered when analyzing data contained in thisreport.
Terminology
• Product versus active ingredient (AI): A pesticide product contains both active and inertingredients. An AI is a component of a pesticide product that controls target pests. Therecan be more than one AI in a product. Inert ingredients are all the other ingredients of theproduct which do not target the pest but may enhance product performance and application.Pesticide use is reported to DPR at the product level, where the associated AIs are identifiedand their use trends are analyzed.
• Number of agricultural applications: Number of applications of pesticide products made toproduction agriculture. More detailed information is given below under “Number ofApplications.”
• Pounds applied: Number of pounds of an AI.
• Unit type: The type of area treated with the pesticide:
A = AcreageC = Cubic feet (usually of post-harvest commodity treated)K = Thousand cubic feet (usually of post-harvest commodity treated)P = Pounds (usually of post-harvest commodity treated)S = Square feetT = Tons (usually of post-harvest commodity treated)U = Miscellaneous units (e.g., number of tractors, trees, tree holes, bins)
• Acres treated: Cumulative number of acres treated. More detailed information is givenbelow under “Acres Treated.”
Agricultural and Nonagricultural Pesticide Use
Many pesticide licensing, sales, and use requirements are tied to California’s definition ofagricultural use. Pesticide labels differentiate between agricultural, industrial, or institutionaluses. Some pesticide products are labeled for both agricultural and nonagricultural uses.
California law (FAC section 11408) identifies agricultural use as all use except the followingcategories specifically identified as nonagricultural use:
• Home: Use in or around the immediate environment of a household
• Industrial: Use in or on property necessary to operate factories, processing plants, packinghouses, or similar buildings or use for a manufacturing, mining, or chemical process. In
6

California, industrial use does not include use on rights-of-way. Postharvest commodityfumigations for buildings or on trucks, vans, or railcars are normally industrial use.
• Institutional: Use in or on property necessary to operate buildings such as hospitals, officebuildings, libraries, auditoriums, or schools. When a licensed structural pest controloperator treats these buildings, it is structural use. Use on landscaping and aroundwalkways, parking lots, and other areas bordering such buildings is institutional use, but useon landscaping not affiliated with such buildings is not.
• Structural: Use by licensed structural pest control operators within the scope of theirlicenses
• Vector control: Use by certain vector control (e.g., mosquito abatement) districts
• Veterinarian: Use according to a written prescription of a licensed veterinarian
Agricultural use of pesticides includes:
• Production agricultural use: Any pesticide used to produce a plant or animal agriculturalproduct (food, feed, fiber, ornamental, or forest) that will be distributed in the channels oftrade (Some requirements—most notably those that address worker safety and usereporting—apply only to plant product production.)
• Nonproduction agricultural use: Any pesticide used on watersheds, rights-of-way, andlandscaped areas (e.g., golf courses, parks, recreation areas, and cemeteries) not covered bythe definitions of home and institutional uses
The following specific pesticide uses are required to be reported to the CAC who, in turn, reportsthe data to DPR:
• Production of any agricultural commodity except livestock (where livestock is defined inFAC section 18663 as “any cattle, sheep, swine, goat, or any horse, mule or other equine,whether live or dead”)
• Treatment of postharvest agricultural commodities
• Landscape maintenance in parks, golf courses, cemeteries, and similar sites defined in theFAC as agricultural use
• Roadside and railroad rights-of-way
• Poultry and fish production
• Application of a restricted material
• Application of a pesticide listed in regulation as having the potential to pollute groundwater when used outdoors in industrial and institutional settings
• Application by licensed pest control operators, including agricultural and structuralapplicators and maintenance gardeners
7

What must be reported. Growers must submit their production agricultural pesticide use reports tothe CAC by the tenth day of the month following the month in which the work was performed,and pest control businesses must submit seven days after the application. Not all informationsubmitted to the counties is transferred to DPR.
Production agricultural pesticide use reports include the following:
• Date and time of application
• Geographic location including the county, section, township, range, base, and meridian.
• Operator identification number (An operator identification number, sometimes called a“grower ID,” is issued by CAC to property operators. The number is needed to reportpesticide use and to purchase restricted-use pesticides. Pest control professionals are notrequired to obtain an operator ID number.)
• Operator name and address (although this information is not submitted to DPR)
• Site identification number (A site identification code must be assigned to each location orfield where pesticides will be used for production of an agricultural commodity. Thisalphanumeric code is also recorded on any restricted material permit the grower obtains forthe location. CalAgPermits has a map server feature that tracks locations of sites for countyuse.)
• Commodity, crop, or site treated
• Acres or units planted and treated
• Application method (e.g., by air, ground, or other means)
• Fumigation methods. Since 2008, fumigation applications in nonattainment areas that donot meet federal air quality standards for pesticide VOC emissions must be identified alongwith details on fumigation methods (for example, shallow shank injection with a tarp). Thisinformation allows DPR to estimate pesticide VOC emissions, which contribute to theformation of atmospheric ozone, an important air pollutant.
• Product name, U.S. EPA Registration Number (or the California Registration Number if theproduct is an adjuvant), and the amount of product applied
All other kinds of pesticide use (mostly nonagricultural) are reported by monthly summaries thatinclude the following information:
• Pesticide product name
• Product registration number
• Amount used
• Number of applications
• Application site (e.g., roadside, structure)
• Month of application (rather than date and time)
8

• County (rather than square mile location)
Commodity Codes
DPR uses its product label database at <www.cdpr.ca.gov/docs/label/labelque.htm>to verify thatproducts listed in pesticide use reports are registered for use on the reported commodity or site.The product label database uses a coding system consistent with U.S. EPA official labelinformation. To minimize errors, a cross-reference table was developed to link different namingsystems between the U.S. EPA, the product label database, and the PUR database.
Certain commodities or sites may have more than one site code associated with them if differentproduction methods or uses of the commodity result in different pesticide use. For example,greenhouse and nursery operations are divided into six different site codes: greenhouse-grown cutflowers or greens, outdoor-grown cut flowers or greens, greenhouse-grown plants in containers,outdoor-grown plants in container/field-grown plants, greenhouse-grown transplants/propagativematerial, and outdoor-grown transplants/propagative material.
Tomatoes and grapes are also separated into further subcategories because of public and processorinterest in differentiating pesticide use. Tomatoes are assigned codes to differentiate betweenfresh market and processing categories. Grapes are assigned separate codes to differentiate tablegrapes and raisins from wine grapes.
Unregistered Use
The PUR database may contain records of pesticide use on a commodity or site for which thepesticide is not currently registered. Unregistered uses that survive the error-checking processmay be due to an error in the DPR product label database, where the product incorrectly lists acommodity or site as being registered. Other unregistered uses may be flagged as errors by thevalidation procedures, but left unchanged in the database. The error-checking process does notcheck whether the product was registered at the time of application. It is therefore possible that anapplication flagged as an error due to a recent change in registration may have been legallyapplied at the time of application. In addition, the law sometimes allows growers to use existingstocks of a pesticide product following its withdrawal from the market by the manufacturer, orsuspension or cancelation by regulatory authorities since the safest way to dispose of smallquantities of pesticides is to use them as they were intended. Finally, some pesticide products donot list specific sites or commodities on their labels, as they are designed to target specific pestsacross all sites, such as some soil fumigants, certain pre-plant herbicides, and rodenticides. Inthese cases, reporting an application of one of these types of pesticides on a specific commodityor site can result in an error. In 2015, an option was added in CalAgPermits that allows the user todesignate any application as “pre-plant” and enter the commodity or site without generating anyerror messages.
9

Adjuvants
Use data on spray adjuvants (e.g., emulsifiers, wetting agents, foam suppressants, and otherefficacy enhancers) were not reported before full-use reporting was required. Adjuvants areexempt from federal registration requirements but must be registered as pesticides in California.Examples of adjuvants include many alkyl groups and some petroleum distillates.
Cumulative Area Treated
The cumulative area treated is the sum of the area treated with an AI and is expressed in acres(applications reported in square feet are converted to acres). The cumulative area treated for acrop may be greater than the planted area of the crop since this measure accounts for a field beingtreated with the same AI more than once in a year. For example, if a 20-acre field is treated threetimes in a calendar year with an AI, the cumulative area treated would be reported as 60 acres.
It is important, however, to be aware of the potential to over-count acreage when summingcumulative area for products that have more than one AI. If a 20-acre field is treated with aproduct that contains three different pesticide AIs, the PUR record will correctly show that theproduct was applied to 20 acres, but that 20 acre value will also be attributed to each of the threeAIs in any chemical summary reports. Adding these values across the AIs results in a total of 60acres treated instead of the 20 acres actually treated.
Number of Applications
The number of applications is only reported for production agricultural applications. Applicatorsare required to submit one of two basic types of use reports, a production agricultural report or amonthly summary report. The production agricultural report must include information for eachapplication. The monthly summary report, required for all uses other than production agriculture,includes only monthly totals for all applications of pesticide product, site or commodity, andapplicator.
The total number of applications in the monthly summary reports is not consistently reported, sothey are no longer included in the annual totals. (In the annual PUR reports before 1997, eachmonthly summary record was counted as one application) Note that in the annual summary reportarranged by commodity, the total number of agricultural applications for the site or commoditymay not equal the sum of all applications of the listed AIs. Since the summary report is at the AIlevel rather than the product level, a single application of a product comprised of two AIs willresult in the summary report assigning the single application to both AIs listed under thecommodity heading. Summing the agricultural applications for these two AIs would result in anincorrect total of two applications. The total applications value at the bottom of each commoditysection removes the possibility of over-counting applications for products with more than one AI,and is therefore a more accurate value.
10

3 Data Summary
This report is a summary of 2015 data submitted to DPR as of September 27, 2016. PUR data arecontinually updated and therefore may not match later data from CalPIP or internal queries thatcontain corrected records identified after September 27, 2016.
Pesticide Use in California
In 2015, 213 million pounds of pesticide AIs were used in California. Since full use reporting wasrequired in 1990, annual pesticide use has been observed to vary by less than 15 percent from theprevious year. These fluctuations can be attributed to a variety of factors, including changes inplanted acreage, crop plantings, pest pressures, and weather conditions.
The pounds of pesticides used and the number of applications are not necessarily accurateindicators of pesticide risk. There are reduced-risk pesticides that require higher use rates or moreapplications than many conventional pesticides but have little environmental or human health riskdue to their mode of action, toxicity, and selectivity to the targeted pest.
In 2015, as in previous years, the region of greatest pesticide use was California’s San JoaquinValley (Table 1). The four counties in this region with the highest use were Fresno, Kern, Tulare,and San Joaquin. These counties were also among the leading producers of agriculturalcommodities.
Table 1: Total pounds of pesticide active ingredients reported in each county and rank during2014 and 2015
2014 Pesticide Use 2015 Pesticide UseCounty Pounds Applied Rank Pounds Applied Rank
Alameda 306,144 38 356,310 38Alpine 272 58 193 58Amador 96,036 44 95,631 45Butte 2,988,763 17 3,227,227 15Calaveras 59,965 48 52,806 47Colusa 2,489,789 18 2,595,649 21Contra Costa 412,947 36 580,357 35Del Norte 199,519 41 135,966 43El Dorado 152,314 42 148,703 42Fresno 31,969,270 1 37,546,827 1Glenn 2,091,507 21 2,210,193 22Humboldt 36,735 51 38,253 50Imperial 5,030,191 11 4,975,642 11Inyo 12,151 55 14,009 53
11
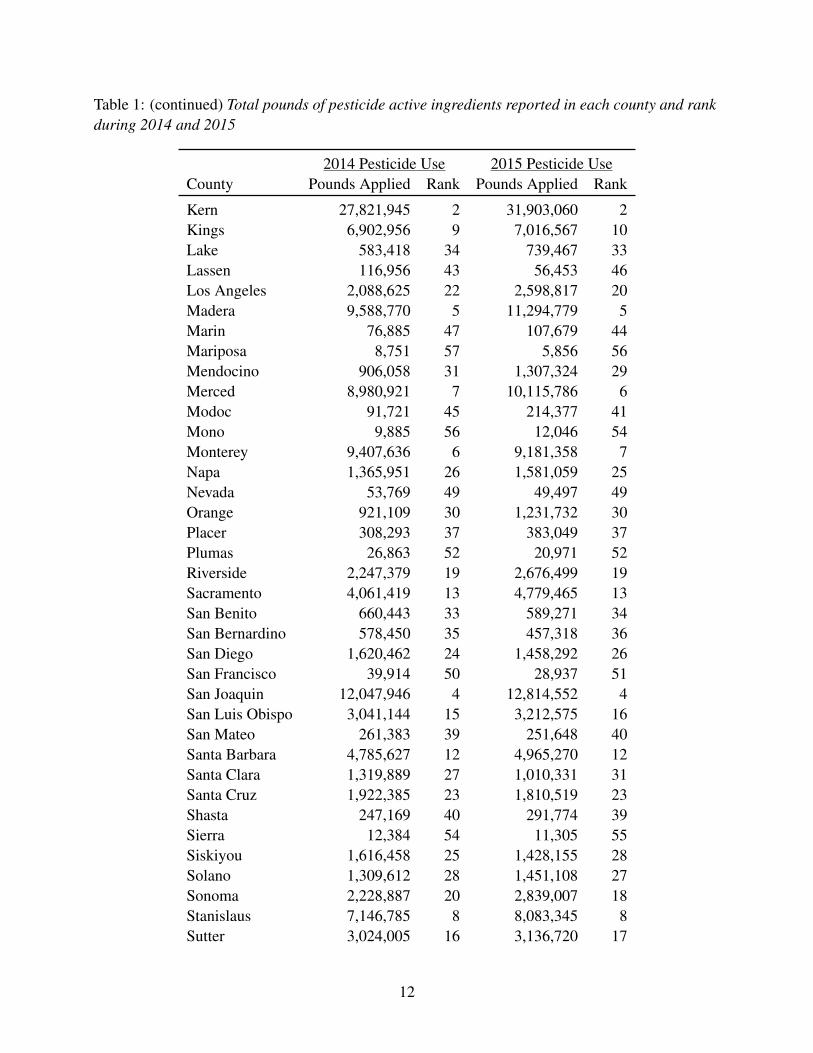
Table 1: (continued) Total pounds of pesticide active ingredients reported in each county and rankduring 2014 and 2015
2014 Pesticide Use 2015 Pesticide UseCounty Pounds Applied Rank Pounds Applied Rank
Kern 27,821,945 2 31,903,060 2Kings 6,902,956 9 7,016,567 10Lake 583,418 34 739,467 33Lassen 116,956 43 56,453 46Los Angeles 2,088,625 22 2,598,817 20Madera 9,588,770 5 11,294,779 5Marin 76,885 47 107,679 44Mariposa 8,751 57 5,856 56Mendocino 906,058 31 1,307,324 29Merced 8,980,921 7 10,115,786 6Modoc 91,721 45 214,377 41Mono 9,885 56 12,046 54Monterey 9,407,636 6 9,181,358 7Napa 1,365,951 26 1,581,059 25Nevada 53,769 49 49,497 49Orange 921,109 30 1,231,732 30Placer 308,293 37 383,049 37Plumas 26,863 52 20,971 52Riverside 2,247,379 19 2,676,499 19Sacramento 4,061,419 13 4,779,465 13San Benito 660,443 33 589,271 34San Bernardino 578,450 35 457,318 36San Diego 1,620,462 24 1,458,292 26San Francisco 39,914 50 28,937 51San Joaquin 12,047,946 4 12,814,552 4San Luis Obispo 3,041,144 15 3,212,575 16San Mateo 261,383 39 251,648 40Santa Barbara 4,785,627 12 4,965,270 12Santa Clara 1,319,889 27 1,010,331 31Santa Cruz 1,922,385 23 1,810,519 23Shasta 247,169 40 291,774 39Sierra 12,384 54 11,305 55Siskiyou 1,616,458 25 1,428,155 28Solano 1,309,612 28 1,451,108 27Sonoma 2,228,887 20 2,839,007 18Stanislaus 7,146,785 8 8,083,345 8Sutter 3,024,005 16 3,136,720 17
12

Table 1: (continued) Total pounds of pesticide active ingredients reported in each county and rankduring 2014 and 2015
2014 Pesticide Use 2015 Pesticide UseCounty Pounds Applied Rank Pounds Applied Rank
Tehama 863,442 32 969,530 32Trinity 22,324 53 4,874 57Tulare 14,924,204 3 17,610,519 3Tuolumne 83,337 46 50,298 48Ventura 6,541,333 10 7,345,915 9Yolo 3,487,379 14 4,168,753 14Yuba 1,035,852 29 1,602,424 24
Total 190,235,729 212,846,042
Reported pesticide use in California in 2015 totaled 213 million pounds, an increase of 23 millionpounds (12 percent) from 2014. Production agriculture, the major category of use subject toreporting requirements, accounted for most of the increase. Applications increased by 22 millionpounds for production agriculture and 511,000 pounds for post-harvest treatments. Use alsoincreased for structural pest control, landscape maintenance, and other reported non-agriculturaluses that includes rights-of-way, vector control, research, and fumigation of non-food andnon-feed materials such as lumber and furniture. Table 2 breaks down the pounds of pesticide useby general use categories: production agriculture, post-harvest commodity treatment, structuralpest control, landscape maintenance, and all others.
13

Table 2: Pounds of pesticide active ingredients, 1998 – 2015, by general use categories.
Production Post-Harvest Structural Landscape All TotalYear Agriculture Treatment Pest Control Maintenance Others Pounds
1998 207,992,681 1,760,320 5,931,471 1,407,577 6,874,091 223,966,1411999 189,345,226 2,059,856 5,673,549 1,412,248 7,906,798 206,397,6762000 175,767,646 2,167,778 5,187,122 1,414,849 6,854,657 191,392,0522001 142,963,040 1,462,153 4,922,709 1,290,208 6,324,210 156,962,3202002 159,214,665 1,852,668 5,469,430 1,449,912 6,834,190 174,820,8652003 161,052,563 1,785,747 5,177,461 1,975,868 7,526,922 177,518,5622004 165,915,754 1,874,210 5,120,268 1,612,069 6,996,577 181,518,8772005 178,369,796 2,260,932 5,625,437 1,775,676 8,517,584 196,549,4242006 168,668,394 2,216,042 5,273,689 2,286,673 10,269,490 188,714,2892007 157,482,263 2,279,537 3,967,352 1,672,401 7,337,591 172,739,1442008 149,462,298 2,540,189 3,202,933 1,589,055 7,236,531 164,031,0052009 146,533,494 1,479,776 2,911,101 1,344,884 6,016,194 158,285,4482010 160,439,568 2,164,627 3,699,143 1,734,503 8,025,216 176,063,0562011 177,360,991 1,546,236 3,149,099 1,723,384 8,732,163 192,511,8742012 171,840,307 1,238,020 3,465,040 1,555,171 9,084,021 187,182,5582013 178,927,830 1,526,568 3,804,556 1,465,698 9,746,194 195,470,8472014 174,736,093 1,318,037 4,030,200 1,622,677 8,528,721 190,235,7292015 196,252,578 1,829,561 4,299,033 1,727,864 8,737,006 212,846,042
Pesticide Sales in California
The amount of pesticides reported in the PUR database does not reflect the total amount ofpesticides sold each year. Typically, only a third of the pesticide AIs sold in a given year aresubject to use reporting. Examples of AIs that do not require reports of use are chlorine (usedprimarily for municipal water treatment) and home-use pesticide products.
There were 687 million pounds of pesticide AIs sold in 2014, an 8 percent increase from the yearbefore. 2015 sales are currently estimated at around 981 million, although that figure may change.Sales data are continuously updated and corrected. Values from earlier years are posted on DPR’swebsite at <www.cdpr.ca.gov>, click “A - Z Index,” “Sales of pesticides.”
4 Trends in Pesticide Use in Certain Pesticide Categories
This report discusses two different measures of pesticide use: amount of AI applied in pounds andcumulative area treated in acres (for an explanation of cumulative area treated see page 10).
14

Because different AIs are often used at different rates, the picture of pesticide use may varybetween the two measures. Most pesticides are applied at rates of 1-2 pounds per acre, but othersat a few ounces or hundreds of pounds per acre. The contrast between measures, pounds andacres, can be seen by looking at the use of different pesticide types (Figures 1 and 2). Figure 1,the amount applied by weight (pounds), shows that pesticides with both fungicide and insecticideproperties (fungicide/insecticides) such as sulfur had the highest use, followed by insecticides andfumigants. By cumulative area (acres) treated in Figure 2, insecticides, herbicides, and fungicideswere used the most.
When comparing use among different AIs, area treated is often the more useful measure. Poundsof use will emphasize pesticides used at high rates, such as sulfur, horticultural oils, andfumigants. However, the trends in use for any individual AI will be similar regardless of themeasure of use.
Figure 1: Pounds of all AIs in the major types of pesticides from 1995 to 2015, where “Other”includes pesticides such as rodenticides, molluscicides, algaecides, repellents, anti-microbials,anti-foulants, disinfectants, and biocides.
The AIs with the highest total reported pounds were sulfur, petroleum and mineral oils,1,3-dichloropropene, glyphosate, and metam-potassium (potassium N-methyldithiocarbamate).Sulfur accounted for 24 percent of all reported pesticide use in 2015.
Reported pesticide use by cumulative area treated in 2015 was 96 million acres, an increase of 4.8
15

Figure 2: Acres treated by all AIs in the major types of pesticides from 1995 to 2015, where“Other” includes pesticides such as rodenticides, molluscicides, algaecides, repellents,anti-microbials, anti-foulants, disinfectants, and biocides.
million acres (5.3 percent) from 2014. The non-adjuvant pesticides applied to the greatest area in2015 were glyphosate, sulfur, petroleum and mineral oils, abamectin, and oxyfluorfen (Figures 3,4, and A-1). The top AIs by use types were petroleum and mineral oils for insecticides, copper forfungicides, sulfur for fungicide/insecticides, glyphosate for herbicides, and aluminum phosphidefor fumigants.
Pesticide use is summarized for eight different pesticide categories from 2007 to 2015 (Tables 3 –18) and from 1995 to 2015 (Figures 5 – 12). These categories include reproductive toxicity,carcinogens, cholinesterase inhibitors, ground water contaminants, toxic air contaminants,fumigants, oils, and biopesticides. Changes from 2014 to 2015 are summarized as follows:
• Reproductive toxins: Chemicals classified as reproductive toxins increased slightly inamount applied from 2014 to 2015 (31,000-pound increase, 0.4 percent) but decreased inthe area treated (2,700-acres treated decrease, 0.1 percent). The increase in amount appliedwas mainly due to greater use of the fumigant metam-sodium. The decrease in area mostlyresulted from less use of the fungicides myclobutanil and thiophanate-methyl and themiticide propargite. Pesticides in this category are listed on the State’s Proposition 65 list ofchemicals known to cause reproductive toxicity.
16

Figure 3: Acres treated by the top 5 AIs in each of the major types of pesticides from 2008 to 2015.
• Carcinogens: The amount of pesticides classified as carcinogens increased by 5.1 millionpounds from 2014 to 2015 (17 percent), but the area treated decreased by 111,000 acres(3.8 percent). The increase in amount applied was mainly due to the greater use of thefumigants metam-potassium and 1,3-dichloropropene. The decrease in area treated wasmostly due to less use of the herbicides diuron and oryzalin and the fungicide iprodione.The pesticides in this category are listed by U.S. EPA as A or B carcinogens or on theState’s Proposition 65 list of chemicals known to cause cancer.
• Cholinesterase inhibitors: Use of cholinesterase-inhibiting pesticides (organophosphateand some carbamate pesticides) decreased from the previous year (178,000-pound decrease,3.8 percent; 416,000-acre decrease, 11 percent). Most of the decrease in amount applied
17

Figure 4: Acres treated by the top 5 AIs in each of the major types of pesticides from 2008 to 2015.
and area treated resulted from a decrease in the use of the insecticide chlorpyrifos , whichwas designated as a restricted-use pesticide for agriculture in 2015. Other AIs with largedecreases were the insecticides dimethoate, oxamyl, and malathion.
• Ground water contaminants: The use of AIs categorized as ground water contaminantsdecreased in both amount applied and area treated (107,000-pound decrease, 15 percent;114,000-acre decrease, 20 percent). The decreases were mostly from less use of theherbicides diuron and simazine.
• Toxic air contaminants: The use of AIs categorized as toxic air contaminants increased inboth amount applied and area treated (4.5 million-pound increase, 10 percent; 37,000-acre
18

increase, 1.5 percent). By pounds, most toxic air contaminants are fumigants such asmetam-potassium and 1,3-dichloropropene that are used at high rates and whose overall useincreased. The increase in area treated was mainly due to increased uses of the fungicidemancozeb and the insecticide carbaryl.
• Fumigants: The use of fumigant AIs increased in both amount applied and area treated (4.7million-pound increase, 11 percent; 41,000-acre increase, 11 percent). Most of the increasewas from metam-potassium and 1,3-dichloropropene; however, use of methyl bromide andchloropicrin decreased.
• Oils: Use of oil pesticides increased in both amount and area treated (11 million-poundincrease, 37 percent; 303,000-acre increase, 6.9 percent). Oils comprise different AIs, butthe category used here includes only those derived from petroleum distillation. Some ofthese oils may be on the State’s Proposition 65 list of chemicals known to cause cancer, butmost serve as alternatives to highly toxic pesticides. Some highly refined petroleum-basedoils are also used by organic growers.
• Biopesticides: Use of biopesticides increased in both amount and area treated(770,000-pound increase, 13 percent; 573,000-acre increase, 8.4 percent). The biopesticidewith the most use by amount was kaolin, which accounted for most of the increased use inthis category. Citric acid, vegetable oil, and s-methoprene accounted for most of theincrease by area treated. Kaolin is used both as a fungicide and insecticide, s-methoprene asan insect growth regulator, and citric acid and vegetable oil as adjuvants. In general,biopesticides are derived from or synthetically mimic natural materials such as animals,plants, bacteria, and minerals and fall into three major classes: microbial,plant-incorporated protectant, or naturally occurring substances.
Since 1990, the reported pounds of pesticides applied have fluctuated from year to year. Anincrease or decrease in use from one year to the next or in the span of a few years does notnecessarily indicate a general trend in use, but rather variations related to changes in weather,pricing, supply of raw ingredients, or regulations. Use changes over short periods of time (three tofive years) may suggest trends such as the increased pesticide use from 2001 to 2005 or decreaseduse from 2005 to 2009. However, regression analyses on use from 1996 to 2015 do not indicate asignificant trend of either increase or decrease in total pesticide use.
The summaries detailed in the following use categories are not intended to serve as indicators ofpesticide risks to the public or the environment. Rather, the data supports DPR regulatoryfunctions to enhance public safety and environmental protection. (See “Continuous Evaluation ofPesticides” on page 2.)
19

USE
TR
EN
DS
OF
PEST
ICID
ES
ON
TH
EST
AT
E’S
PRO
POSI
TIO
N65
LIS
TO
FC
HE
MIC
AL
ST
HA
TA
RE
“KN
OW
NTO
CA
USE
RE
PRO
DU
CT
IVE
TOX
ICIT
Y.”
Tabl
e3:
The
repo
rted
poun
dsof
pest
icid
esus
edth
atar
eon
the
Stat
e’s
Pro
posi
tion
65lis
tofc
hem
ical
sth
atar
e“k
now
nto
caus
ere
prod
uctiv
eto
xici
ty.”
Use
incl
udes
both
agri
cultu
rala
ndre
port
able
non-
agri
cultu
rala
pplic
atio
ns.D
ata
are
from
the
Dep
artm
ento
fPe
stic
ide
Reg
ulat
ion’
sPe
stic
ide
Use
Rep
orts
.
AI
2007
2008
2009
2010
2011
2012
2013
2014
2015
1080
<1
<1
<1
<1
<1
<1
<1
<1
<1
2,4-
DB
AC
ID9,
185
11,4
1613
,523
4,57
055
5,82
610
,807
10,5
479,
104
AB
AM
EC
TIN
12,3
6212
,846
16,6
2419
,384
26,7
2732
,958
40,0
9337
,403
38,2
63A
MIT
RA
Z0
07
00
01,
486
2096
AR
SEN
ICPE
NTO
XID
E7,
805
7,43
340
016
,144
8,03
49,
240
8,48
016
,719
22,1
90A
RSE
NIC
TR
IOX
IDE
<1
<1
<1
<1
<1
<1
0<
1<
1B
EN
OM
YL
590
100
5631
2832
310
2B
RO
MA
CIL
,LIT
HIU
MSA
LT1,
172
1,85
189
61,
835
1,48
61,
422
1,14
52,
472
2,89
1B
RO
MO
XY
NIL
OC
TAN
OA
TE
41,4
0665
,375
50,3
0043
,643
47,8
1756
,495
49,7
0544
,088
52,5
71C
AR
BA
RYL
142,
010
126,
742
135,
301
114,
077
74,9
4411
3,96
511
7,36
713
1,60
015
5,33
3C
YAN
AZ
INE
00
00
1<
10
110
3C
YC
LO
AT
E31
,868
21,2
4225
,284
27,2
9231
,037
33,5
6230
,619
36,5
6639
,444
DIC
LO
FOP-
ME
TH
YL
157
015
07
00
00
DIN
OC
AP
22
20
<1
00
00
DIN
OSE
B81
166
816
2675
6022
374
7D
IOC
TY
LPH
TH
AL
AT
E61
034
018
645
324
826
219
873
36D
ISO
DIU
MC
YAN
OD
ITH
IOIM
IDO
CA
RB
ON
AT
E0
00
00
80<
10
101
EPT
C15
2,70
712
9,47
012
8,99
311
8,50
913
9,60
516
8,66
518
7,34
923
5,27
123
5,81
6E
TH
YL
EN
EG
LYC
OL
MO
NO
ME
TH
YL
ET
HE
R2,
653
1,98
62,
257
5,18
74,
333
3,78
26,
202
5,60
17,
601
ET
HY
LE
NE
OX
IDE
23
70
08
0<
10
FEN
OX
APR
OP-
ET
HY
L15
321
911
<1
80
00
0FL
UA
ZIF
OP-
BU
TY
L5
321
118
617
4216
HY
DR
AM
ET
HY
LN
ON
887
825
393
609
1,09
648
644
46,
024
398
LIN
UR
ON
58,5
9260
,247
51,2
6548
,424
54,5
3057
,637
52,5
2954
,158
50,9
63M
ETA
M-S
OD
IUM
9,93
0,33
79,
497,
562
9,02
8,10
311
,428
,913
10,8
61,3
178,
428,
425
4,84
6,42
84,
300,
079
4,64
3,12
2M
ET
HY
LB
RO
MID
E6,
448,
643
5,69
3,32
55,
615,
653
4,80
9,31
14,
057,
921
4,00
3,02
03,
535,
185
2,96
4,77
52,
666,
222
ME
TIR
AM
00
00
1534
1713
<1
MO
LIN
AT
E75
,241
19,6
5312
,516
24<
13
<1
<1
<1
MY
CL
OB
UTA
NIL
68,4
0361
,550
59,0
5665
,604
65,4
9564
,481
61,1
5565
,085
60,9
51N
AB
AM
9,07
39,
635
8,96
310
,518
13,3
5813
,485
22,1
8716
,535
9,35
7N
ICO
TIN
E<
1<
1<
1<
17
<1
00
<1
NIT
RA
PYR
IN9
084
211
0<
12
05
OX
AD
IAZ
ON
12,5
179,
402
8,74
112
,382
7,78
37,
272
6,75
54,
958
12,1
10O
XY
DE
ME
TON
-ME
TH
YL
122,
723
111,
612
68,5
7671
,290
26,0
1717
,562
10,6
568,
407
6,75
6
20

Tabl
e3:
(con
tinue
d)Th
ere
port
edpo
unds
ofpe
stic
ides
used
that
are
onth
eSt
ate’
sP
ropo
sitio
n65
listo
fche
mic
als
that
are
“kno
wn
toca
use
repr
oduc
tive
toxi
city
.”
AI
2007
2008
2009
2010
2011
2012
2013
2014
2015
OX
YT
HIO
QU
INO
X16
617
045
6<
11
<1
10
POTA
SSIU
MD
IME
TH
YL
DIT
HIO
CA
RB
AM
AT
E0
0<
10
00
00
0
PRO
PAR
GIT
E53
1,83
238
6,20
337
8,09
929
4,85
329
6,35
125
2,21
329
1,00
724
6,83
121
3,43
4R
ESM
ET
HR
IN45
226
921
120
612
246
4923
339
SOD
IUM
DIM
ET
HY
LD
ITH
IOC
AR
BA
MA
TE
9,07
39,
800
8,96
311
,053
13,3
5813
,485
22,1
8716
,535
9,35
7
STR
EPT
OM
YC
INSU
LFA
TE
5,80
94,
394
3,23
34,
040
4,65
14,
054
4,79
45,
148
4,71
7TA
U-F
LU
VAL
INA
TE
1,02
81,
068
1,17
986
983
41,
084
1,05
71,
261
1,19
5T
HIO
PHA
NA
TE
-ME
TH
YL
99,4
9774
,903
89,8
8211
5,02
587
,664
109,
800
103,
618
112,
663
113,
106
TR
IAD
IME
FON
873
1,50
31,
056
2,15
31,
940
2,42
71,
620
1,98
61,
610
TR
IBU
TY
LTIN
ME
TH
AC
RYL
AT
E0
00
00
01
00
TR
IFO
RIN
E64
694
4222
24
1<
1V
INC
LO
ZO
LIN
392
512
476
217
328
470
151
219
149
WA
RFA
RIN
1<
1<
11
22
11
<1
TOTA
L17
,778
,384
16,3
21,8
9515
,711
,200
17,2
26,9
1415
,827
,222
13,4
02,3
509,
413,
342
8,32
5,70
08,
357,
067
21
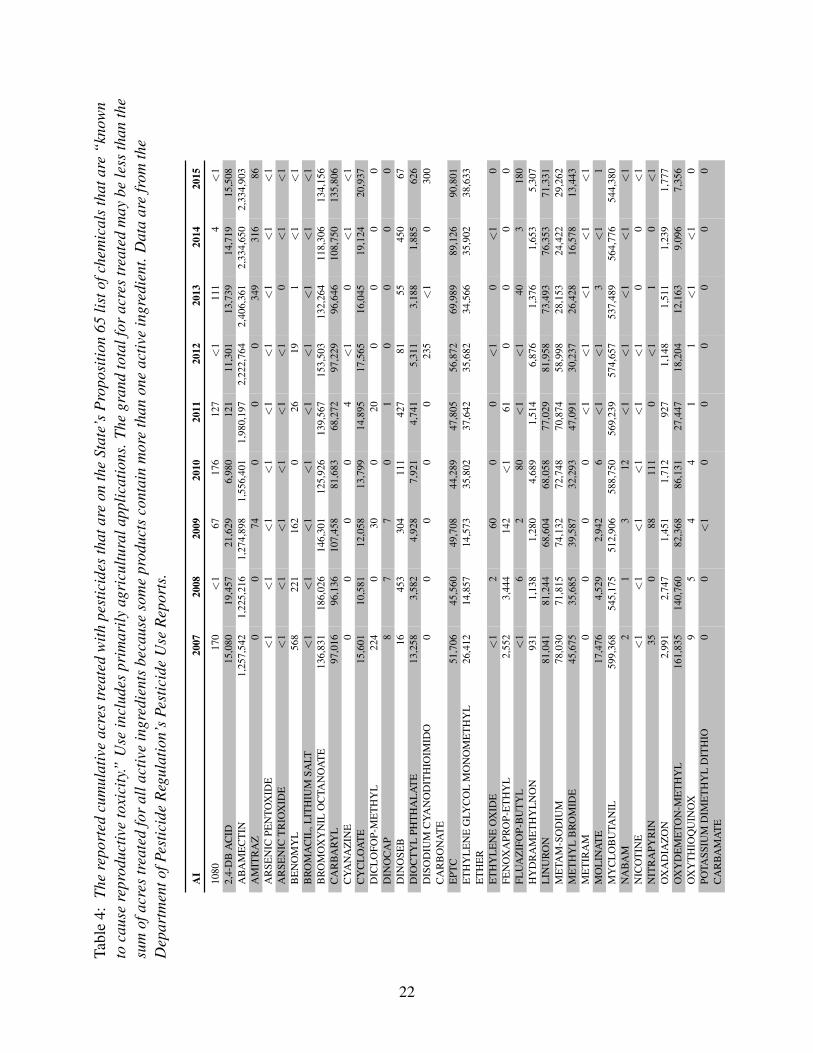
Tabl
e4:
The
repo
rted
cum
ulat
ive
acre
str
eate
dw
ithpe
stic
ides
that
are
onth
eSt
ate’
sP
ropo
sitio
n65
listo
fche
mic
als
that
are
“kno
wn
toca
use
repr
oduc
tive
toxi
city
.”U
sein
clud
espr
imar
ilyag
ricu
ltura
lapp
licat
ions
.The
gran
dto
talf
orac
res
trea
ted
may
bele
ssth
anth
esu
mof
acre
str
eate
dfo
ral
lact
ive
ingr
edie
nts
beca
use
som
epr
oduc
tsco
ntai
nm
ore
than
one
activ
ein
gred
ient
.Dat
aar
efr
omth
eD
epar
tmen
tofP
estic
ide
Reg
ulat
ion’
sPe
stic
ide
Use
Rep
orts
.
AI
2007
2008
2009
2010
2011
2012
2013
2014
2015
1080
170
<1
6717
612
7<
111
14
<1
2,4-
DB
AC
ID15
,080
19,4
5721
,629
6,98
012
111
,301
13,7
3914
,719
15,5
08A
BA
ME
CT
IN1,
257,
542
1,22
5,21
61,
274,
898
1,55
6,40
11,
980,
197
2,22
2,76
42,
406,
361
2,33
4,65
02,
334,
903
AM
ITR
AZ
00
740
00
349
316
86A
RSE
NIC
PEN
TOX
IDE
<1
<1
<1
<1
<1
<1
<1
<1
<1
AR
SEN
ICT
RIO
XID
E<
1<
1<
1<
1<
1<
10
<1
<1
BE
NO
MY
L56
822
116
20
2619
1<
1<
1B
RO
MA
CIL
,LIT
HIU
MSA
LT<
1<
1<
1<
1<
1<
1<
1<
1<
1B
RO
MO
XY
NIL
OC
TAN
OA
TE
136,
831
186,
026
146,
301
125,
926
139,
567
153,
503
132,
264
118,
306
134,
156
CA
RB
ARY
L97
,016
96,1
3610
7,45
881
,683
68,2
7297
,229
96,6
4610
8,75
013
5,80
6C
YAN
AZ
INE
00
00
4<
10
<1
<1
CY
CL
OA
TE
15,6
0110
,581
12,0
5813
,799
14,8
9517
,565
16,0
4519
,124
20,9
37D
ICL
OFO
P-M
ET
HY
L22
40
300
200
00
0D
INO
CA
P8
77
01
00
00
DIN
OSE
B16
453
304
111
427
8155
450
67D
IOC
TY
LPH
TH
AL
AT
E13
,258
3,58
24,
928
7,92
14,
741
5,31
13,
188
1,88
562
6D
ISO
DIU
MC
YAN
OD
ITH
IOIM
IDO
CA
RB
ON
AT
E0
00
00
235
<1
030
0
EPT
C51
,706
45,5
6049
,708
44,2
8947
,805
56,8
7269
,989
89,1
2690
,801
ET
HY
LE
NE
GLY
CO
LM
ON
OM
ET
HY
LE
TH
ER
26,4
1214
,857
14,5
7335
,802
37,6
4235
,682
34,5
6635
,902
38,6
33
ET
HY
LE
NE
OX
IDE
<1
260
00
<1
0<
10
FEN
OX
APR
OP-
ET
HY
L2,
552
3,44
414
2<
161
00
00
FLU
AZ
IFO
P-B
UT
YL
<1
62
80<
1<
140
318
0H
YD
RA
ME
TH
YL
NO
N93
11,
138
1,28
04,
689
1,51
46,
876
1,37
61,
653
5,30
7L
INU
RO
N81
,041
81,2
4468
,604
68,0
5877
,029
81,9
5873
,493
76,3
5371
,331
ME
TAM
-SO
DIU
M78
,030
71,8
1574
,132
72,7
4870
,874
58,9
9828
,153
24,4
2229
,262
ME
TH
YL
BR
OM
IDE
45,6
7535
,685
39,5
8732
,293
47,0
9130
,237
26,4
2816
,578
13,4
43M
ET
IRA
M0
00
0<
1<
1<
1<
1<
1M
OL
INA
TE
17,4
764,
529
2,94
26
<1
<1
3<
11
MY
CL
OB
UTA
NIL
599,
368
545,
175
512,
906
588,
750
569,
239
574,
657
537,
489
564,
776
544,
380
NA
BA
M2
13
12<
1<
1<
1<
1<
1N
ICO
TIN
E<
1<
1<
1<
1<
1<
10
0<
1N
ITR
APY
RIN
350
8811
10
<1
10
<1
OX
AD
IAZ
ON
2,99
12,
747
1,45
11,
712
927
1,14
81,
511
1,23
91,
777
OX
YD
EM
ETO
N-M
ET
HY
L16
1,83
514
0,76
082
,368
86,1
3127
,447
18,2
0412
,163
9,09
67,
356
OX
YT
HIO
QU
INO
X9
54
41
1<
1<
10
POTA
SSIU
MD
IME
TH
YL
DIT
HIO
CA
RB
AM
AT
E0
0<
10
00
00
0
22

Tabl
e4:
(con
tinue
d)Th
ere
port
edcu
mul
ativ
eac
res
trea
ted
with
pest
icid
esth
atar
eon
the
Stat
e’s
Pro
posi
tion
65lis
tofc
hem
ical
sth
atar
e“k
now
nto
caus
ere
prod
uctiv
eto
xici
ty.”
AI
2007
2008
2009
2010
2011
2012
2013
2014
2015
PRO
PAR
GIT
E26
1,95
318
6,58
117
4,06
313
7,10
614
2,43
011
4,21
312
1,95
210
4,73
388
,018
RE
SME
TH
RIN
183
11<
16
443
618
7SO
DIU
MD
IME
TH
YL
DIT
HIO
CA
RB
AM
AT
E2
13
12<
1<
1<
1<
1<
1
STR
EPT
OM
YC
INSU
LFA
TE
38,4
6827
,011
24,4
5328
,966
39,1
9034
,894
37,9
9939
,665
40,6
78TA
U-F
LU
VAL
INA
TE
4,77
75,
708
5,01
54,
583
5,04
85,
001
5,39
65,
363
5,18
4T
HIO
PHA
NA
TE
-ME
TH
YL
100,
011
71,8
6792
,429
122,
563
85,8
0612
4,18
912
0,64
913
4,96
911
9,73
7T
RIA
DIM
EFO
N1,
806
2,04
31,
007
1,17
22,
469
1,34
190
71,
282
2,04
0T
RIB
UT
YLT
INM
ET
HA
CRY
LA
TE
00
00
00
<1
00
TR
IFO
RIN
E37
311
1022
3<
1<
13
<1
VIN
CL
OZ
OL
IN25
821
285
8610
034
115
10W
AR
FAR
IN3,
165
1,11
836
529
01,
290
3,11
538
143
555
6TO
TAL
3,01
5,20
32,
783,
199
2,71
3,20
53,
022,
469
3,36
4,36
83,
655,
434
3,74
1,70
13,
703,
825
3,70
1,09
2
23
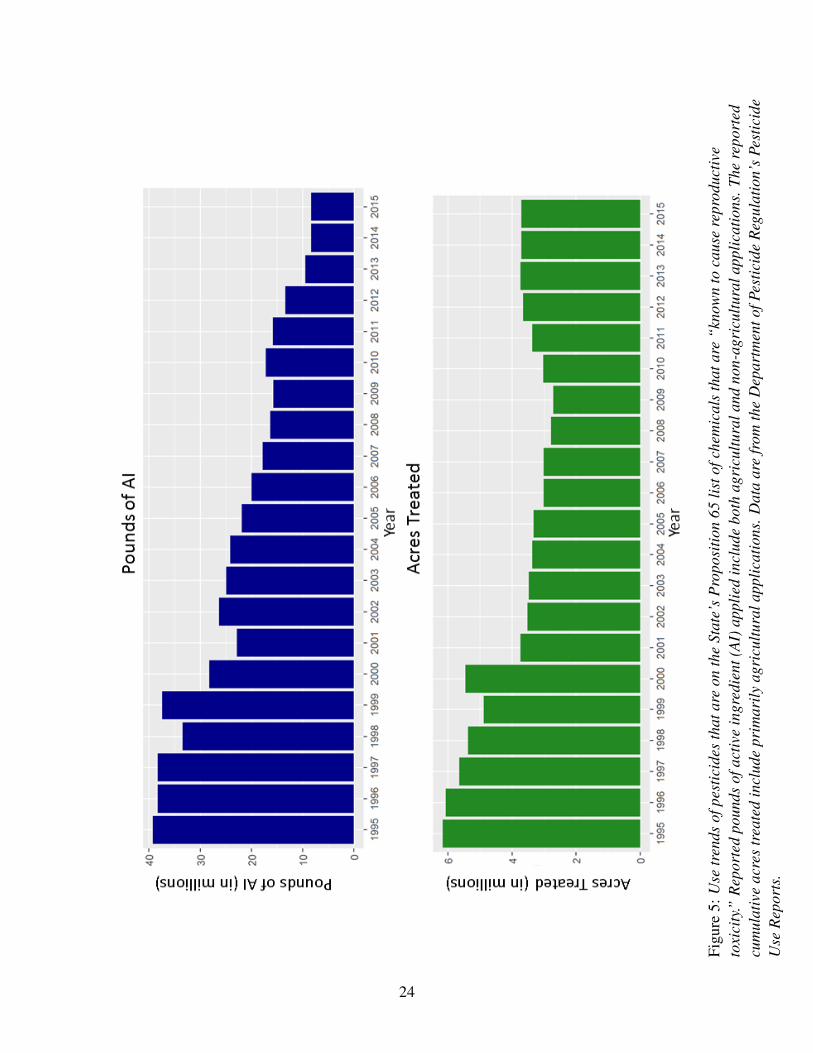
Figu
re5:
Use
tren
dsof
pest
icid
esth
atar
eon
the
Stat
e’s
Pro
posi
tion
65lis
tofc
hem
ical
sth
atar
e“k
now
nto
caus
ere
prod
uctiv
eto
xici
ty.”
Rep
orte
dpo
unds
ofac
tive
ingr
edie
nt(A
I)ap
plie
din
clud
ebo
thag
ricu
ltura
land
non-
agri
cultu
rala
pplic
atio
ns.T
here
port
edcu
mul
ativ
eac
res
trea
ted
incl
ude
prim
arily
agri
cultu
rala
pplic
atio
ns.D
ata
are
from
the
Dep
artm
ento
fPes
ticid
eR
egul
atio
n’s
Pest
icid
eU
seR
epor
ts.
24
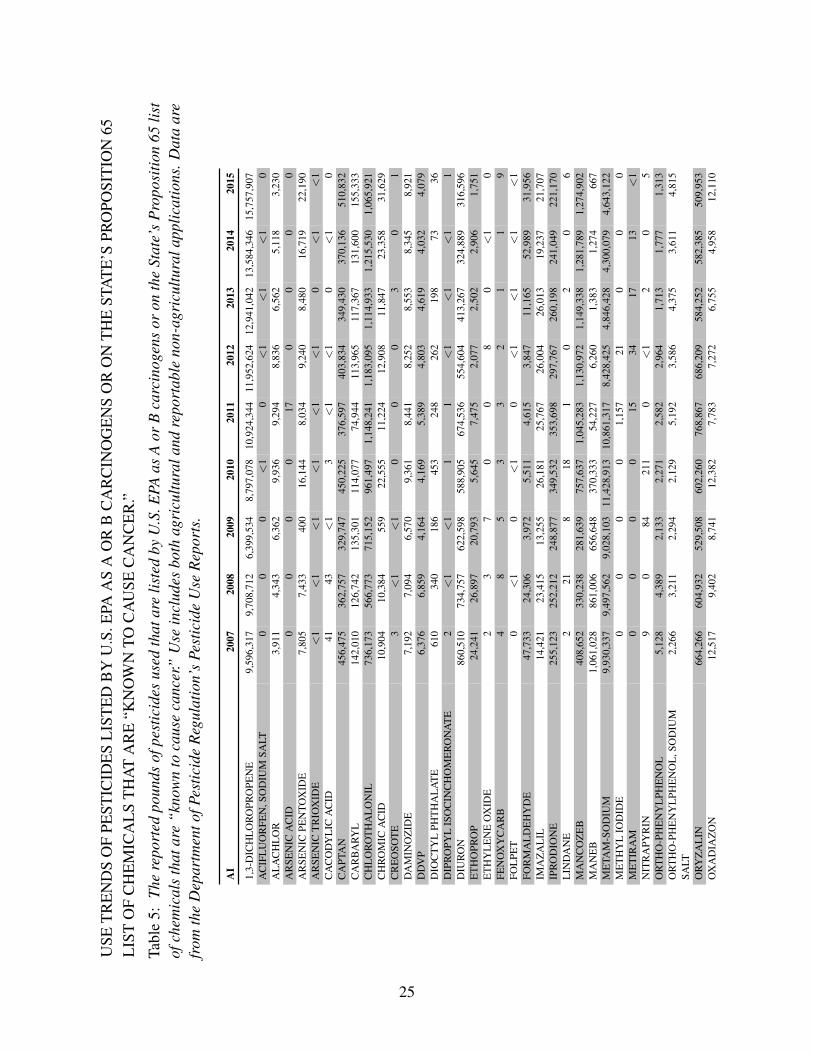
USE
TR
EN
DS
OF
PEST
ICID
ES
LIS
TE
DB
YU
.S.E
PAA
SA
OR
BC
AR
CIN
OG
EN
SO
RO
NT
HE
STA
TE
’SPR
OPO
SIT
ION
65L
IST
OF
CH
EM
ICA
LS
TH
AT
AR
E“K
NO
WN
TOC
AU
SEC
AN
CE
R.”
Tabl
e5:
The
repo
rted
poun
dsof
pest
icid
esus
edth
atar
elis
ted
byU
.S.E
PAas
Aor
Bca
rcin
ogen
sor
onth
eSt
ate’
sP
ropo
sitio
n65
list
ofch
emic
als
that
are
“kno
wn
toca
use
canc
er.”
Use
incl
udes
both
agri
cultu
rala
ndre
port
able
non-
agri
cultu
rala
pplic
atio
ns.D
ata
are
from
the
Dep
artm
ento
fPes
ticid
eR
egul
atio
n’s
Pest
icid
eU
seR
epor
ts.
AI
2007
2008
2009
2010
2011
2012
2013
2014
2015
1,3-
DIC
HL
OR
OPR
OPE
NE
9,59
6,31
79,
708,
712
6,39
9,53
48,
797,
078
10,9
24,3
4411
,952
,624
12,9
41,0
4213
,584
,346
15,7
57,9
07A
CIF
LU
OR
FEN
,SO
DIU
MSA
LT0
00
<1
0<
1<
1<
10
AL
AC
HL
OR
3,91
14,
343
6,36
29,
936
9,29
48,
836
6,56
25,
118
3,23
0A
RSE
NIC
AC
ID0
00
017
00
00
AR
SEN
ICPE
NTO
XID
E7,
805
7,43
340
016
,144
8,03
49,
240
8,48
016
,719
22,1
90A
RSE
NIC
TR
IOX
IDE
<1
<1
<1
<1
<1
<1
0<
1<
1C
AC
OD
YL
ICA
CID
4143
<1
3<
1<
10
<1
0C
APT
AN
456,
475
362,
757
329,
747
450,
225
376,
597
403,
834
349,
430
370,
136
510,
832
CA
RB
ARY
L14
2,01
012
6,74
213
5,30
111
4,07
774
,944
113,
965
117,
367
131,
600
155,
333
CH
LO
RO
TH
AL
ON
IL73
6,17
356
6,77
371
5,15
296
1,49
71,
148,
241
1,18
3,09
51,
114,
933
1,21
5,53
01,
065,
921
CH
RO
MIC
AC
ID10
,904
10,3
8455
922
,555
11,2
2412
,908
11,8
4723
,358
31,6
29C
RE
OSO
TE
3<
1<
10
00
30
1D
AM
INO
ZID
E7,
192
7,09
46,
570
9,36
18,
441
8,25
28,
553
8,34
58,
921
DD
VP
6,37
66,
859
4,16
44,
169
5,38
94,
803
4,61
94,
032
4,07
9D
IOC
TY
LPH
TH
AL
AT
E61
034
018
645
324
826
219
873
36D
IPR
OPY
LIS
OC
INC
HO
ME
RO
NA
TE
2<
1<
11
1<
1<
1<
11
DIU
RO
N86
0,51
073
4,75
762
2,59
858
8,90
567
4,53
655
4,60
441
3,26
732
4,88
931
6,59
6E
TH
OPR
OP
24,2
4126
,897
20,7
935,
645
7,47
52,
077
2,50
22,
906
1,75
1E
TH
YL
EN
EO
XID
E2
37
00
80
<1
0FE
NO
XY
CA
RB
48
53
32
11
9FO
LPE
T0
<1
0<
10
<1
<1
<1
<1
FOR
MA
LD
EH
YD
E47
,733
24,3
063,
972
5,51
14,
615
3,84
711
,165
52,9
8931
,956
IMA
ZA
LIL
14,4
2123
,415
13,2
5526
,181
25,7
6726
,004
26,0
1319
,237
21,7
07IP
RO
DIO
NE
255,
123
252,
212
248,
877
349,
532
353,
698
297,
767
260,
198
241,
049
221,
170
LIN
DA
NE
221
818
10
20
6M
AN
CO
ZE
B40
8,65
233
0,23
828
1,63
975
7,63
71,
045,
283
1,13
0,97
21,
149,
338
1,28
1,78
91,
274,
902
MA
NE
B1,
061,
028
861,
006
656,
648
370,
333
54,2
276,
260
1,38
31,
274
667
ME
TAM
-SO
DIU
M9,
930,
337
9,49
7,56
29,
028,
103
11,4
28,9
1310
,861
,317
8,42
8,42
54,
846,
428
4,30
0,07
94,
643,
122
ME
TH
YL
IOD
IDE
00
00
1,15
721
00
0M
ET
IRA
M0
00
015
3417
13<
1N
ITR
APY
RIN
90
8421
10
<1
20
5O
RT
HO
-PH
EN
YL
PHE
NO
L5,
128
4,38
92,
133
2,27
12,
582
2,96
41,
713
1,77
71,
313
OR
TH
O-P
HE
NY
LPH
EN
OL
,SO
DIU
MSA
LT2,
266
3,21
12,
294
2,12
95,
192
3,58
64,
375
3,61
14,
815
ORY
ZA
LIN
664,
266
604,
932
529,
508
602,
260
768,
867
686,
209
584,
252
582,
385
509,
953
OX
AD
IAZ
ON
12,5
179,
402
8,74
112
,382
7,78
37,
272
6,75
54,
958
12,1
10
25

Tabl
e5:
(con
tinue
d)Th
ere
port
edpo
unds
ofpe
stic
ides
used
that
are
liste
dby
U.S
.EPA
asA
orB
carc
inog
ens
oron
the
Stat
e’s
Pro
posi
tion
65lis
tofc
hem
ical
sth
atar
e“k
now
nto
caus
eca
ncer
.”
AI
2007
2008
2009
2010
2011
2012
2013
2014
2015
OX
YT
HIO
QU
INO
X16
617
045
6<
11
<1
10
PAR
A-D
ICH
LO
RO
BE
NZ
EN
E15
117
0<
118
<1
00
PEN
TAC
HL
OR
OPH
EN
OL
224
03
1822
427
411
2PO
TASS
IUM
DIC
HR
OM
AT
E0
00
00
0<
10
<1
POTA
SSIU
MN
-ME
TH
YL
DIT
HIO
CA
RB
AM
AT
E3,
785,
436
5,52
4,64
74,
102,
412
4,83
2,61
55,
673,
371
8,32
0,25
59,
484,
467
7,79
8,70
310
,513
,789
PRO
PAR
GIT
E53
1,83
238
6,20
337
8,09
929
4,85
329
6,35
125
2,21
329
1,00
724
6,83
121
3,43
4PR
OPO
XU
R19
118
820
229
880
835
937
325
110
0PR
OPY
LE
NE
OX
IDE
110,
068
105,
600
111,
609
300,
008
449,
037
389,
070
410,
360
400,
719
392,
724
PRO
PYZ
AM
IDE
114,
882
104,
077
73,8
1151
,384
49,6
7847
,404
42,0
2242
,662
41,9
09SO
DIU
MD
ICH
RO
MA
TE
00
00
00
02
0T
ER
RA
ZO
LE
872
1,53
41,
140
1,50
063
850
339
043
743
7T
HIO
DIC
AR
B68
641
051
115
247
214
515
60
0V
INC
LO
ZO
LIN
392
512
476
217
328
470
151
219
149
TOTA
L28
,798
,623
29,2
97,1
8323
,684
,962
30,0
18,4
6532
,849
,990
33,8
58,5
3232
,099
,645
30,6
66,0
5035
,762
,708
26

Tabl
e6:
The
repo
rted
cum
ulat
ive
acre
str
eate
dw
ithpe
stic
ides
that
are
liste
dby
U.S
.EPA
asA
orB
carc
inog
ens
oron
the
Stat
e’s
Pro
posi
tion
65lis
tofc
hem
ical
sth
atar
e“k
now
nto
caus
eca
ncer
.”U
sein
clud
espr
imar
ilyag
ricu
ltura
lapp
licat
ions
.The
gran
dto
tal
for
acre
str
eate
dm
aybe
less
than
the
sum
ofac
res
trea
ted
for
alla
ctiv
ein
gred
ient
sbe
caus
eso
me
prod
ucts
cont
ain
mor
eth
anon
eac
tive
ingr
edie
nt.D
ata
are
from
the
Dep
artm
ento
fPes
ticid
eR
egul
atio
n’s
Pest
icid
eU
seR
epor
ts.
AI
2007
2008
2009
2010
2011
2012
2013
2014
2015
1,3-
DIC
HL
OR
OPR
OPE
NE
53,9
3757
,922
38,3
7454
,209
59,0
6569
,422
71,7
9469
,558
79,4
22A
CIF
LU
OR
FEN
,SO
DIU
MSA
LT0
00
<1
0<
1<
14
0A
LA
CH
LO
R1,
500
1,63
52,
261
3,27
63,
385
3,28
42,
670
2,03
31,
497
AR
SEN
ICA
CID
00
00
<1
00
00
AR
SEN
ICPE
NTO
XID
E<
1<
1<
1<
1<
1<
1<
1<
1<
1A
RSE
NIC
TR
IOX
IDE
<1
<1
<1
<1
<1
<1
0<
1<
1C
AC
OD
YL
ICA
CID
<1
<1
<1
<1
<1
<1
0<
10
CA
PTA
N21
5,86
419
8,26
217
3,13
324
5,46
420
9,97
920
9,62
718
7,98
821
1,31
221
1,98
0C
AR
BA
RYL
97,0
1696
,136
107,
458
81,6
8368
,272
97,2
2996
,646
108,
750
135,
806
CH
LO
RO
TH
AL
ON
IL38
9,49
729
2,38
537
7,95
449
3,21
658
8,44
157
1,89
353
0,30
556
6,23
554
0,37
2C
HR
OM
ICA
CID
<1
<1
<1
<1
<1
<1
<1
<1
<1
CR
EO
SOT
E1
12
00
0<
10
<1
DA
MIN
OZ
IDE
2,29
12,
471
2,11
14,
357
2,43
02,
982
2,52
92,
413
2,39
4D
DV
P2,
733
2,23
12,
685
1,88
05,
184
6,53
05,
593
3,30
76,
282
DIO
CT
YL
PHT
HA
LA
TE
13,2
583,
582
4,92
87,
921
4,74
15,
311
3,18
81,
885
626
DIP
RO
PYL
ISO
CIN
CH
OM
ER
ON
AT
E<
1<
1<
119
<1
<1
<1
<1
1D
IUR
ON
702,
939
514,
554
405,
583
520,
587
691,
391
555,
446
440,
197
342,
067
284,
513
ET
HO
PRO
P4,
283
4,15
94,
293
1,34
81,
892
541
676
802
574
ET
HY
LE
NE
OX
IDE
<1
260
00
<1
0<
10
FEN
OX
YC
AR
B21
048
935
310
010
611
037
5815
FOL
PET
0<
10
<1
0<
1<
1<
1<
1FO
RM
AL
DE
HY
DE
5767
51
64
522
30IM
AZ
AL
IL<
166
8<
126
2<
1<
132
1IP
RO
DIO
NE
412,
699
436,
226
434,
326
578,
691
638,
622
530,
012
479,
154
458,
958
407,
705
LIN
DA
NE
037
1031
10
<1
028
MA
NC
OZ
EB
212,
349
169,
422
145,
616
433,
833
634,
215
678,
916
675,
954
710,
867
741,
714
MA
NE
B65
5,23
555
8,50
647
1,39
529
0,26
640
,588
4,55
91,
524
1,00
669
8M
ETA
M-S
OD
IUM
78,0
3071
,815
74,1
3272
,748
70,8
7458
,998
28,1
5324
,422
29,2
62M
ET
HY
LIO
DID
E0
00
027
837
00
0M
ET
IRA
M0
00
0<
1<
1<
1<
1<
1N
ITR
APY
RIN
350
8811
10
<1
10
<1
OR
TH
O-P
HE
NY
LPH
EN
OL
149
2249
5811
785
130
104
329
OR
TH
O-P
HE
NY
LPH
EN
OL
,SO
DIU
MSA
LT<
1<
1<
1<
1<
1<
1<
1<
1<
1
ORY
ZA
LIN
313,
343
272,
273
236,
523
217,
193
294,
499
263,
655
203,
900
203,
359
162,
309
OX
AD
IAZ
ON
2,99
12,
747
1,45
11,
712
927
1,14
81,
511
1,23
91,
777
OX
YT
HIO
QU
INO
X9
54
41
1<
1<
10
PAR
A-D
ICH
LO
RO
BE
NZ
EN
E<
10
<1
<1
<1
<1
<1
00
27

Tabl
e6:
(con
tinue
d)Th
ere
port
edcu
mul
ativ
eac
res
trea
ted
with
pest
icid
esth
atar
elis
ted
byU
.S.E
PAas
Aor
Bca
rcin
ogen
sor
onth
eSt
ate’
sP
ropo
sitio
n65
listo
fche
mic
als
that
are
“kno
wn
toca
use
canc
er.”
AI
2007
2008
2009
2010
2011
2012
2013
2014
2015
PEN
TAC
HL
OR
OPH
EN
OL
1046
04
115
170
25
POTA
SSIU
MD
ICH
RO
MA
TE
00
00
00
<1
0<
1PO
TASS
IUM
N-M
ET
HY
LD
ITH
IOC
AR
BA
MA
TE
42,9
8856
,009
38,1
9741
,444
44,0
7850
,361
46,8
6139
,708
49,5
07
PRO
PAR
GIT
E26
1,95
318
6,58
117
4,06
313
7,10
614
2,43
011
4,21
312
1,95
210
4,73
388
,018
PRO
POX
UR
<1
1035
6<
13
<1
417
839
PRO
PYL
EN
EO
XID
E<
112
<1
<1
<1
288
9<
1<
1PR
OPY
ZA
MID
E14
8,39
913
3,42
610
2,17
669
,328
61,0
1457
,625
51,9
2151
,307
49,0
40SO
DIU
MD
ICH
RO
MA
TE
00
00
00
0<
10
TE
RR
AZ
OL
E87
91,
419
711
5,10
744
357
941
466
025
5T
HIO
DIC
AR
B1,
196
673
680
192
656
206
247
00
VIN
CL
OZ
OL
IN25
821
285
8610
034
115
10TO
TAL
3,61
4,11
13,
064,
004
2,79
9,06
43,
261,
999
3,56
3,74
03,
283,
112
2,95
3,58
82,
905,
007
2,79
4,20
6
28

Figu
re6:
Use
tren
dsof
pest
icid
esth
atar
elis
ted
byU
.S.E
PAas
Aor
Bca
rcin
ogen
sor
onth
eSt
ate’
sP
ropo
sitio
n65
listo
fche
mic
als
that
are
“kno
wn
toca
use
canc
er.”
Rep
orte
dpo
unds
ofac
tive
ingr
edie
nt(A
I)ap
plie
din
clud
ebo
thag
ricu
ltura
land
non-
agri
cultu
ral
appl
icat
ions
.The
repo
rted
cum
ulat
ive
acre
str
eate
din
clud
epr
imar
ilyag
ricu
ltura
lapp
licat
ions
.Dat
aar
efr
omth
eD
epar
tmen
tof
Pest
icid
eR
egul
atio
n’s
Pest
icid
eU
seR
epor
ts.
29

USE
TR
EN
DS
OF
CH
OL
INE
STE
RA
SE-I
NH
IBIT
ING
PEST
ICID
ES.
Tabl
e7:
The
repo
rted
poun
dsof
pest
icid
esus
edth
atar
ech
olin
este
rase
-inh
ibiti
ngpe
stic
ides
.The
sepe
stic
ides
are
orga
noph
osph
ate
and
carb
amat
eac
tive
ingr
edie
nts.
Use
incl
udes
both
agri
cultu
rala
ndre
port
able
non-
agri
cultu
rala
pplic
atio
ns.D
ata
are
from
the
Dep
artm
ento
fPes
ticid
eR
egul
atio
n’s
Pest
icid
eU
seR
epor
ts.
AI
2007
2008
2009
2010
2011
2012
2013
2014
2015
3-IO
DO
-2-P
RO
PYN
YL
BU
TY
LC
AR
BA
MA
TE
00
<1
2,67
510
2<
119
<1
28
AC
EPH
AT
E14
3,07
315
2,30
311
2,56
213
4,99
315
2,61
013
0,46
118
5,16
614
4,64
217
0,37
8A
LD
ICA
RB
115,
475
75,7
6731
,579
64,6
2624
,167
1,48
91,
487
126
0A
ZIN
PHO
S-M
ET
HY
L25
,418
16,2
6913
,045
1,61
91,
582
1,23
232
01,
638
BE
ND
IOC
AR
B8
2<
11
33
24
1B
EN
SUL
IDE
259,
548
244,
526
247,
733
271,
835
288,
432
267,
050
285,
471
319,
400
345,
261
BU
TY
LA
TE
945
270
299
00
8853
0C
AR
BA
RYL
142,
010
126,
742
135,
301
114,
077
74,9
4411
3,96
511
7,36
713
1,60
015
5,33
3C
AR
BO
FUR
AN
25,4
6716
,389
10,1
174
10
00
0C
HL
OR
PRO
PHA
M1,
532
4,38
44,
675
6,99
03,
093
2,96
927
,481
4,43
33,
955
CH
LO
RPY
RIF
OS
1,44
2,52
11,
368,
568
1,24
6,56
01,
290,
982
1,30
0,37
91,
106,
479
1,46
9,30
01,
308,
690
1,10
8,38
6C
OU
MA
PHO
S<
10
0<
13
314
01
CY
CL
OA
TE
31,8
6821
,242
25,2
8427
,292
31,0
3733
,562
30,6
1936
,566
39,4
44D
DV
P6,
376
6,85
94,
164
4,16
95,
389
4,80
34,
619
4,03
24,
079
DE
ME
TON
10
20
00
00
0D
ESM
ED
IPH
AM
1,90
51,
598
1,25
71,
385
1,34
51,
482
1,01
753
011
2D
IAZ
INO
N35
3,09
825
8,54
414
2,06
112
6,80
486
,647
78,5
2461
,224
61,1
2652
,828
DIC
RO
TOPH
OS
00
00
00
05
<1
DIM
ET
HO
AT
E31
5,35
829
2,11
925
1,72
621
0,43
122
6,39
218
3,20
727
0,18
333
5,55
928
8,51
0D
ISU
LFO
TON
24,5
588,
028
10,2
339,
085
4,35
15,
479
1,92
42,
219
415
EPT
C15
2,70
712
9,47
012
8,99
311
8,50
913
9,60
516
8,66
518
7,34
923
5,27
123
5,81
6E
TH
EPH
ON
430,
522
296,
421
207,
788
375,
561
548,
700
484,
335
397,
058
348,
470
320,
938
ET
HIO
N0
228
721
440
<1
1E
TH
OPR
OP
24,2
4126
,897
20,7
935,
645
7,47
52,
077
2,50
22,
906
1,75
1FE
NA
MIP
HO
S39
,677
17,4
8211
,493
8,97
82,
964
5,25
42,
244
865
97FE
NT
HIO
N4
49
4<
10
0<
10
FON
OFO
S0
10
<1
00
00
0FO
RM
ETA
NA
TE
HY
DR
OC
HL
OR
IDE
34,1
2744
,704
32,6
7030
,313
20,9
5220
,446
26,9
1228
,333
31,1
72M
AL
AT
HIO
N46
8,61
448
4,32
253
1,96
656
1,39
851
2,00
440
5,48
544
6,87
950
3,00
144
2,69
5M
ET
HA
MID
OPH
OS
18,8
6724
,224
17,9
349,
664
6,03
7<
155
00
ME
TH
IDA
TH
ION
45,6
6647
,203
47,3
1951
,343
29,5
4523
,396
6,37
53,
614
389
ME
TH
IOC
AR
B1,
767
2,06
83,
093
3,50
62,
708
3,78
63,
678
3,60
63,
362
ME
TH
OM
YL
307,
169
251,
382
221,
248
231,
690
220,
085
273,
328
260,
542
278,
793
282,
230
ME
TH
YL
PAR
AT
HIO
N75
,385
34,1
1025
,770
21,4
2722
,970
25,4
0821
,520
481
182
ME
VIN
PHO
S30
49
2411
83
<1
89
ME
VIN
PHO
S,O
TH
ER
RE
LA
TE
D20
36
1679
20
56
ME
XA
CA
RB
AT
E0
00
00
01
00
30
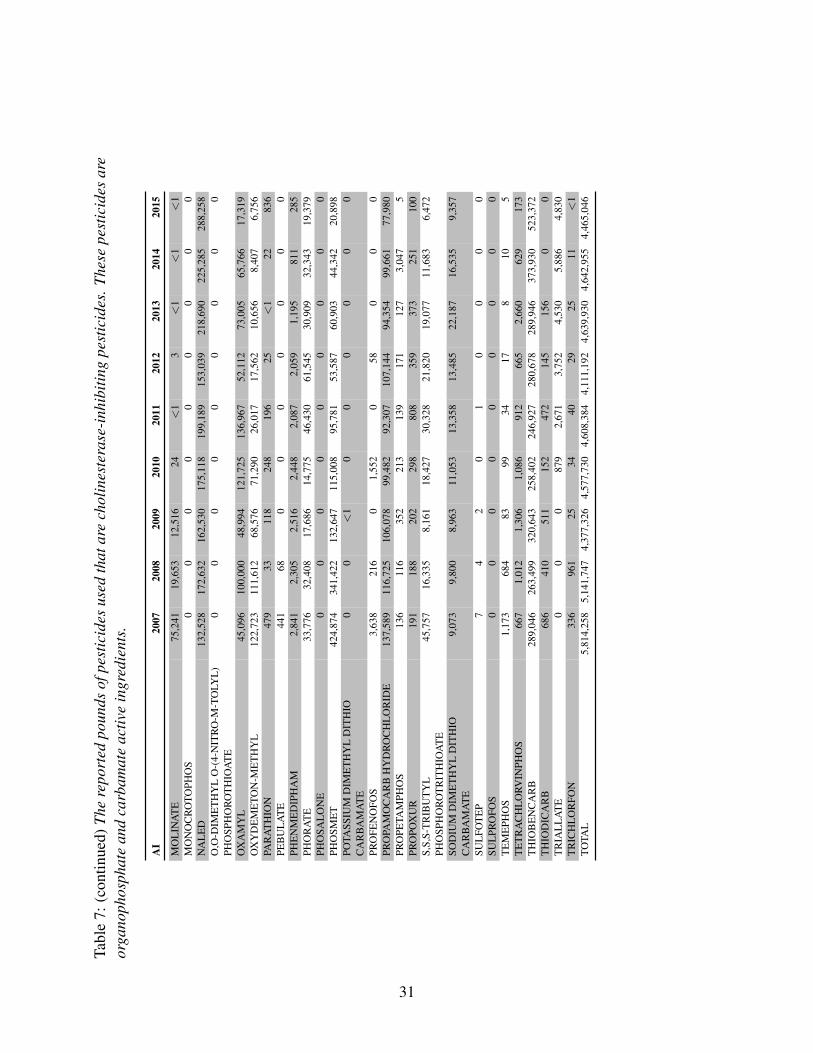
Tabl
e7:
(con
tinue
d)Th
ere
port
edpo
unds
ofpe
stic
ides
used
that
are
chol
ines
tera
se-i
nhib
iting
pest
icid
es.T
hese
pest
icid
esar
eor
gano
phos
phat
ean
dca
rbam
ate
activ
ein
gred
ient
s.
AI
2007
2008
2009
2010
2011
2012
2013
2014
2015
MO
LIN
AT
E75
,241
19,6
5312
,516
24<
13
<1
<1
<1
MO
NO
CR
OTO
PHO
S0
00
00
00
00
NA
LE
D13
2,52
817
2,63
216
2,53
017
5,11
819
9,18
915
3,03
921
8,69
022
5,28
528
8,25
8O
,O-D
IME
TH
YL
O-(
4-N
ITR
O-M
-TO
LYL
)PH
OSP
HO
RO
TH
IOA
TE
00
00
00
00
0
OX
AM
YL
45,0
9610
0,00
048
,994
121,
725
136,
967
52,1
1273
,005
65,7
6617
,319
OX
YD
EM
ETO
N-M
ET
HY
L12
2,72
311
1,61
268
,576
71,2
9026
,017
17,5
6210
,656
8,40
76,
756
PAR
AT
HIO
N47
933
118
248
196
25<
122
836
PEB
UL
AT
E44
168
00
00
00
0PH
EN
ME
DIP
HA
M2,
841
2,30
52,
516
2,44
82,
087
2,05
91,
195
811
285
PHO
RA
TE
33,7
7632
,408
17,6
8614
,775
46,4
3061
,545
30,9
0932
,343
19,3
79PH
OSA
LO
NE
00
00
00
00
0PH
OSM
ET
424,
874
341,
422
132,
647
115,
008
95,7
8153
,587
60,9
0344
,342
20,8
98PO
TASS
IUM
DIM
ET
HY
LD
ITH
IOC
AR
BA
MA
TE
00
<1
00
00
00
PRO
FEN
OFO
S3,
638
216
01,
552
058
00
0PR
OPA
MO
CA
RB
HY
DR
OC
HL
OR
IDE
137,
589
116,
725
106,
078
99,4
8292
,307
107,
144
94,3
5499
,661
77,9
80PR
OPE
TAM
PHO
S13
611
635
221
313
917
112
73,
047
5PR
OPO
XU
R19
118
820
229
880
835
937
325
110
0S,
S,S-
TR
IBU
TY
LPH
OSP
HO
RO
TR
ITH
IOA
TE
45,7
5716
,335
8,16
118
,427
30,3
2821
,820
19,0
7711
,683
6,47
2
SOD
IUM
DIM
ET
HY
LD
ITH
IOC
AR
BA
MA
TE
9,07
39,
800
8,96
311
,053
13,3
5813
,485
22,1
8716
,535
9,35
7
SUL
FOT
EP
74
20
10
00
0SU
LPR
OFO
S0
00
00
00
00
TE
ME
PHO
S1,
173
684
8399
3417
810
5T
ET
RA
CH
LO
RVIN
PHO
S66
71,
012
1,30
61,
086
912
665
2,66
062
917
3T
HIO
BE
NC
AR
B28
9,04
626
3,49
932
0,64
325
8,40
224
6,92
728
0,67
828
9,94
637
3,93
052
3,37
2T
HIO
DIC
AR
B68
641
051
115
247
214
515
60
0T
RIA
LL
AT
E0
00
879
2,67
13,
752
4,53
05,
886
4,83
0T
RIC
HL
OR
FON
336
961
2534
4029
2511
<1
TOTA
L5,
814,
258
5,14
1,74
74,
377,
326
4,57
7,73
04,
608,
384
4,11
1,19
24,
639,
930
4,64
2,95
54,
465,
046
31

Tabl
e8:
The
repo
rted
cum
ulat
ive
acre
str
eate
dw
ithpe
stic
ides
that
are
chol
ines
tera
se-i
nhib
iting
pest
icid
es.T
hese
pest
icid
esar
eor
gano
phos
phat
ean
dca
rbam
ate
activ
ein
gred
ient
s.U
sein
clud
espr
imar
ilyag
ricu
ltura
lapp
licat
ions
.The
gran
dto
talf
orac
res
trea
ted
may
bele
ssth
anth
esu
mof
acre
str
eate
dfo
ral
lact
ive
ingr
edie
nts
beca
use
som
epr
oduc
tsco
ntai
nm
ore
than
one
activ
ein
gred
ient
.D
ata
are
from
the
Dep
artm
ento
fPes
ticid
eR
egul
atio
n’s
Pest
icid
eU
seR
epor
ts.
AI
2007
2008
2009
2010
2011
2012
2013
2014
2015
3-IO
DO
-2-P
RO
PYN
YL
BU
TY
LC
AR
BA
MA
TE
00
0<
1<
1<
1<
1<
1<
1
AC
EPH
AT
E14
8,88
714
7,91
011
5,06
314
4,13
415
0,26
813
2,39
618
3,26
012
2,68
116
2,77
2A
LD
ICA
RB
108,
892
66,8
2931
,977
66,1
9229
,363
1,45
11,
882
166
0A
ZIN
PHO
S-M
ET
HY
L16
,636
9,88
87,
849
1,72
41,
809
1,63
924
081
9B
EN
DIO
CA
RB
6<
1<
1<
1<
1<
1<
1<
1<
1B
EN
SUL
IDE
76,7
4875
,695
73,3
0678
,736
84,2
0179
,195
84,3
8485
,657
93,9
57B
UT
YL
AT
E23
66
060
00
2012
0C
AR
BA
RYL
97,0
1696
,136
107,
458
81,6
8368
,272
97,2
2996
,646
108,
750
135,
806
CA
RB
OFU
RA
N39
,795
24,6
517,
331
1530
00
00
CH
LO
RPR
OPH
AM
178
147
159
3882
7644
117
104
CH
LO
RPY
RIF
OS
1,15
4,68
11,
162,
654
934,
562
1,09
8,95
81,
188,
283
1,05
6,02
61,
297,
160
1,10
8,23
882
9,41
1C
OU
MA
PHO
S<
10
0<
1<
1<
11
062
CY
CL
OA
TE
15,6
0110
,581
12,0
5813
,799
14,8
9517
,565
16,0
4519
,124
20,9
37D
DV
P2,
733
2,23
12,
685
1,88
05,
184
6,53
05,
593
3,30
76,
282
DE
ME
TON
100
100
00
00
0D
ESM
ED
IPH
AM
24,7
8016
,787
16,0
7319
,264
19,3
4917
,100
9,30
74,
797
887
DIA
ZIN
ON
422,
244
310,
125
140,
620
104,
443
71,1
5648
,594
35,0
6932
,862
27,0
79D
ICR
OTO
PHO
S0
00
00
00
23<
1D
IME
TH
OA
TE
608,
819
576,
286
499,
889
436,
845
532,
778
422,
179
594,
441
725,
257
626,
602
DIS
UL
FOTO
N20
,315
4,72
37,
591
6,16
71,
621
2,59
51,
042
1,15
720
4E
PTC
51,7
0645
,560
49,7
0844
,289
47,8
0556
,872
69,9
8989
,126
90,8
01E
TH
EPH
ON
490,
361
362,
926
261,
211
455,
338
602,
803
533,
731
475,
399
414,
018
366,
380
ET
HIO
N0
615
184
8133
20
<1
297
ET
HO
PRO
P4,
283
4,15
94,
293
1,34
81,
892
541
676
802
574
FEN
AM
IPH
OS
22,6
1810
,730
7,53
75,
873
2,12
72,
690
1,43
746
5<
1FE
NT
HIO
N<
1<
1<
1<
1<
10
0<
10
FON
OFO
S0
<1
03
00
00
0FO
RM
ETA
NA
TE
HY
DR
OC
HL
OR
IDE
35,3
8345
,715
32,6
7830
,898
22,0
3821
,821
27,8
9428
,234
31,5
15M
AL
AT
HIO
N25
0,82
328
8,85
227
7,52
343
4,71
728
1,02
627
1,70
028
9,86
128
5,25
926
7,01
6M
ET
HA
MID
OPH
OS
23,0
2227
,532
20,4
0810
,731
6,46
4<
169
00
ME
TH
IDA
TH
ION
37,3
0143
,010
54,2
2749
,968
34,9
1831
,741
9,04
63,
564
489
ME
TH
IOC
AR
B2,
649
2,43
92,
131
2,33
52,
057
2,80
13,
378
2,41
22,
439
ME
TH
OM
YL
502,
384
406,
030
377,
954
410,
186
396,
429
473,
027
439,
709
450,
050
453,
496
ME
TH
YL
PAR
AT
HIO
N45
,173
21,5
7415
,198
13,0
4613
,343
15,5
5112
,486
<1
298
ME
VIN
PHO
S19
834
6911
108
2<
151
51M
EV
INPH
OS,
OT
HE
RR
EL
AT
ED
198
3469
1110
82
051
51M
EX
AC
AR
BA
TE
00
00
00
<1
00
32

Tabl
e8:
(con
tinue
d)Th
ere
port
edcu
mul
ativ
eac
res
trea
ted
with
pest
icid
esth
atar
ech
olin
este
rase
-inh
ibiti
ngpe
stic
ides
.The
sepe
stic
ides
are
orga
noph
osph
ate
and
carb
amat
eac
tive
ingr
edie
nts.
AI
2007
2008
2009
2010
2011
2012
2013
2014
2015
MO
LIN
AT
E17
,476
4,52
92,
942
6<
1<
13
<1
1M
ON
OC
RO
TOPH
OS
00
00
00
00
0N
AL
ED
107,
774
105,
505
128,
415
145,
673
163,
486
108,
978
160,
907
139,
823
164,
391
O,O
-DIM
ET
HY
LO
-(4-
NIT
RO
-M-T
OLY
L)
PHO
SPH
OR
OT
HIO
AT
E0
00
00
00
00
OX
AM
YL
60,7
7311
6,20
259
,118
138,
801
150,
265
61,9
6783
,585
75,3
3021
,149
OX
YD
EM
ETO
N-M
ET
HY
L16
1,83
514
0,76
082
,368
86,1
3127
,447
18,2
0412
,163
9,09
67,
356
PAR
AT
HIO
N41
410
119
551
6815
<1
120
7PE
BU
LA
TE
163
151
00
00
00
0PH
EN
ME
DIP
HA
M26
,762
18,1
9818
,837
21,3
6620
,767
18,3
299,
692
5,42
51,
304
PHO
RA
TE
23,5
5710
,933
10,2
368,
719
32,8
6347
,176
22,4
6925
,658
14,6
64PH
OSA
LO
NE
00
00
00
00
0PH
OSM
ET
142,
991
116,
516
51,5
1440
,276
33,6
9218
,923
23,7
2621
,120
10,7
76PO
TASS
IUM
DIM
ET
HY
LD
ITH
IOC
AR
BA
MA
TE
00
<1
00
00
00
PRO
FEN
OFO
S4,
509
289
01,
635
015
50
00
PRO
PAM
OC
AR
BH
YD
RO
CH
LO
RID
E14
4,94
912
3,69
910
9,02
710
3,73
495
,934
112,
188
101,
774
106,
352
82,1
07PR
OPE
TAM
PHO
S<
1<
1<
1<
1<
1<
1<
13,
621
<1
PRO
POX
UR
<1
1035
6<
13
<1
417
839
S,S,
S-T
RIB
UT
YL
PHO
SPH
OR
OT
RIT
HIO
AT
E31
,408
10,8
507,
182
15,7
8527
,139
21,8
9422
,774
15,1
397,
582
SOD
IUM
DIM
ET
HY
LD
ITH
IOC
AR
BA
MA
TE
21
312
<1
<1
<1
<1
<1
SUL
FOT
EP
52
30
10
00
0SU
LPR
OFO
S0
00
00
00
00
TE
ME
PHO
S<
1<
1<
1<
1<
1<
1<
1<
1<
1T
ET
RA
CH
LO
RVIN
PHO
S20
05
<1
55
84
31,
044
TH
IOB
EN
CA
RB
74,2
7167
,483
83,5
6775
,172
71,8
2479
,689
84,7
2610
7,63
614
8,28
9T
HIO
DIC
AR
B1,
196
673
680
192
656
206
247
00
TR
IAL
LA
TE
00
086
71,
854
2,71
52,
998
3,91
83,
221
TR
ICH
LO
RFO
N<
1<
1<
1<
1<
1<
1<
1<
1<
1TO
TAL
4,97
6,66
74,
462,
290
3,59
7,71
84,
131,
807
4,18
4,84
73,
766,
713
4,17
0,59
23,
994,
527
3,57
8,11
3
33

Figu
re7:
Use
tren
dsof
pest
icid
esth
atar
ech
olin
este
rase
-inh
ibiti
ngpe
stic
ides
.The
sepe
stic
ides
are
orga
noph
osph
ate
and
carb
amat
eac
tive
ingr
edie
nts.
Rep
orte
dpo
unds
ofac
tive
ingr
edie
nt(A
I)ap
plie
din
clud
ebo
thag
ricu
ltura
land
non-
agri
cultu
rala
pplic
atio
ns.T
here
port
edcu
mul
ativ
eac
res
trea
ted
incl
ude
prim
arily
agri
cultu
rala
pplic
atio
ns.D
ata
are
from
the
Dep
artm
ento
fPes
ticid
eR
egul
atio
n’s
Pest
icid
eU
seR
epor
ts.
34

USE
TR
EN
DS
OF
PEST
ICID
ES
ON
TH
E“A
”PA
RT
OF
DPR
’SG
RO
UN
DW
AT
ER
PRO
TE
CT
ION
LIS
T.
Tabl
e9:
The
repo
rted
poun
dsof
pest
icid
esus
edth
atar
eon
the
“a”
part
ofD
PR
’sgr
ound
wat
erpr
otec
tion
list.
Thes
epe
stic
ides
are
the
activ
ein
gred
ient
slis
ted
inth
eC
alifo
rnia
Cod
eof
Reg
ulat
ions
,Titl
e3,
Div
isio
n6,
Cha
pter
4,Su
bcha
pter
1,A
rtic
le1,
Sect
ion
6800
(a).
Use
incl
udes
both
agri
cultu
rala
ndre
port
able
non-
agri
cultu
rala
pplic
atio
ns.D
ata
are
from
the
Dep
artm
ento
fPes
ticid
eR
egul
atio
n’s
Pest
icid
eU
seR
epor
ts.
AI
2007
2008
2009
2010
2011
2012
2013
2014
2015
AT
RA
ZIN
E27
,546
28,4
9123
,260
28,9
3722
,654
32,1
7323
,763
20,8
9617
,912
AT
RA
ZIN
E,O
TH
ER
RE
LA
TE
D57
160
048
260
747
567
648
843
437
5B
EN
TAZ
ON
,SO
DIU
MSA
LT4,
858
8,07
59,
589
7,44
75,
800
7,06
08,
250
8,50
68,
322
BR
OM
AC
IL85
,097
68,1
6252
,049
67,7
8492
,437
82,4
8568
,294
61,7
9337
,472
BR
OM
AC
IL,L
ITH
IUM
SALT
1,17
21,
851
896
1,83
51,
486
1,42
21,
145
2,47
22,
891
DIU
RO
N86
0,51
073
4,75
762
2,59
858
8,90
567
4,53
655
4,60
441
3,26
732
4,88
931
6,59
6N
OR
FLU
RA
ZO
N78
,150
58,5
9044
,762
43,6
8630
,697
42,0
4529
,946
30,2
2622
,601
PRO
ME
TON
33
16
38
341
59SI
MA
ZIN
E54
1,29
643
8,95
241
9,42
337
8,66
142
5,62
136
8,64
230
0,39
424
2,88
017
8,92
2TO
TAL
1,59
9,20
41,
339,
482
1,17
3,06
11,
117,
868
1,25
3,71
01,
089,
114
845,
581
692,
098
585,
150
35

Tabl
e10
:Th
ere
port
edcu
mul
ativ
eac
res
trea
ted
with
pest
icid
esth
atar
eon
the
“a”
part
ofD
PR
’sgr
ound
wat
erpr
otec
tion
list.
Thes
epe
stic
ides
are
the
activ
ein
gred
ient
slis
ted
inth
eC
alifo
rnia
Cod
eof
Reg
ulat
ions
,Titl
e3,
Div
isio
n6,
Cha
pter
4,Su
bcha
pter
1,A
rtic
le1,
Sect
ion
6800
(a).
Use
incl
udes
prim
arily
agri
cultu
rala
pplic
atio
ns.T
hegr
and
tota
lfor
acre
str
eate
dm
aybe
less
than
the
sum
ofac
res
trea
ted
for
alla
ctiv
ein
gred
ient
sbe
caus
eso
me
prod
ucts
cont
ain
mor
eth
anon
eac
tive
ingr
edie
nt.D
ata
are
from
the
Dep
artm
ento
fPe
stic
ide
Reg
ulat
ion’
sPe
stic
ide
Use
Rep
orts
.
AI
2007
2008
2009
2010
2011
2012
2013
2014
2015
AT
RA
ZIN
E17
,382
16,7
6615
,767
19,9
9017
,236
23,8
2718
,305
15,4
0414
,537
AT
RA
ZIN
E,O
TH
ER
RE
LA
TE
D17
,382
16,7
6615
,767
19,9
9017
,236
23,8
2718
,305
15,4
0414
,537
BE
NTA
ZO
N,S
OD
IUM
SALT
4,21
56,
631
6,42
46,
258
4,84
66,
539
7,46
67,
956
6,82
3B
RO
MA
CIL
20,4
5521
,471
24,4
2028
,757
32,1
8328
,746
16,6
1012
,634
5,99
7B
RO
MA
CIL
,LIT
HIU
MSA
LT<
1<
1<
1<
1<
1<
1<
1<
1<
1D
IUR
ON
702,
939
514,
554
405,
583
520,
587
691,
391
555,
446
440,
197
342,
067
284,
513
NO
RFL
UR
AZ
ON
74,0
8558
,866
44,5
0345
,638
30,6
0131
,693
23,3
0625
,112
17,3
68PR
OM
ETO
N4
352
20<
1<
123
4<
118
SIM
AZ
INE
411,
719
320,
992
339,
117
289,
198
324,
529
241,
365
205,
341
165,
206
118,
650
TOTA
L1,
212,
529
919,
200
812,
543
882,
518
1,06
9,23
585
9,26
469
5,16
255
6,11
144
2,50
1
36
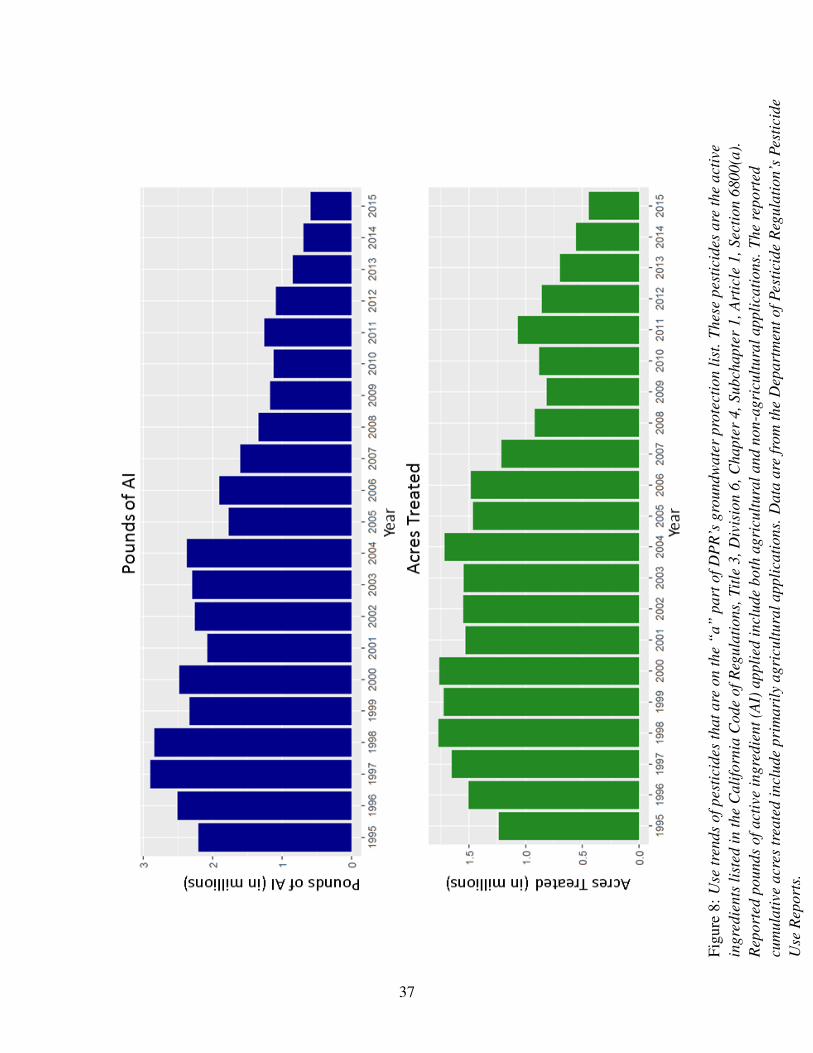
Figu
re8:
Use
tren
dsof
pest
icid
esth
atar
eon
the
“a”
part
ofD
PR
’sgr
ound
wat
erpr
otec
tion
list.
Thes
epe
stic
ides
are
the
activ
ein
gred
ient
slis
ted
inth
eC
alifo
rnia
Cod
eof
Reg
ulat
ions
,Titl
e3,
Div
isio
n6,
Cha
pter
4,Su
bcha
pter
1,A
rtic
le1,
Sect
ion
6800
(a).
Rep
orte
dpo
unds
ofac
tive
ingr
edie
nt(A
I)ap
plie
din
clud
ebo
thag
ricu
ltura
land
non-
agri
cultu
rala
pplic
atio
ns.T
here
port
edcu
mul
ativ
eac
res
trea
ted
incl
ude
prim
arily
agri
cultu
rala
pplic
atio
ns.D
ata
are
from
the
Dep
artm
ento
fPes
ticid
eR
egul
atio
n’s
Pest
icid
eU
seR
epor
ts.
37

USE
TR
EN
DS
OF
PEST
ICID
ES
ON
DPR
’STO
XIC
AIR
CO
NTA
MIN
AN
TS
LIS
T.
Tabl
e11
:Th
ere
port
edpo
unds
ofpe
stic
ides
used
that
are
onD
PR
’sto
xic
air
cont
amin
ants
lista
pplie
din
Cal
iforn
ia.T
hese
pest
icid
esar
eth
eac
tive
ingr
edie
nts
liste
din
the
Cal
iforn
iaC
ode
ofR
egul
atio
ns,T
itle
3,D
ivis
ion
6,C
hapt
er4,
Subc
hapt
er1,
Art
icle
1,Se
ctio
n68
60.U
sein
clud
esbo
thag
ricu
ltura
land
repo
rtab
leno
n-ag
ricu
ltura
lapp
licat
ions
.Dat
aar
efr
omth
eD
epar
tmen
tofP
estic
ide
Reg
ulat
ion’
sPe
stic
ide
Use
Rep
orts
.
AI
2007
2008
2009
2010
2011
2012
2013
2014
2015
1,3-
DIC
HL
OR
OPR
OPE
NE
9,59
6,31
79,
708,
712
6,39
9,53
48,
797,
078
10,9
24,3
4411
,952
,624
12,9
41,0
4213
,584
,346
15,7
57,9
072,
4-D
2,75
511
,619
10,7
8812
,526
5,40
04,
281
5,96
56,
384
7,86
92,
4-D
,2-E
TH
YL
HE
XY
LE
STE
R15
,029
20,4
6415
,113
74,3
9825
,794
27,6
3925
,620
21,6
4926
,924
2,4-
D,A
LK
AN
OL
AM
INE
SALT
S(E
TH
AN
OL
AN
DIS
OPR
OPA
NO
LA
MIN
ES)
2925
131
516
116
18<
120
1
2,4-
D,B
UTO
XY
ET
HA
NO
LE
STE
R84
31,
775
2,75
11,
368
1,75
71,
807
3,01
62,
318
1,79
12,
4-D
,BU
TOX
YPR
OPY
LE
STE
R0
130
00
00
00
2,4-
D,B
UT
YL
EST
ER
90
23
47
260
129
2,4-
D,D
IET
HA
NO
LA
MIN
ESA
LT4,
025
5,53
34,
913
6,87
23,
165
2,64
92,
875
4,08
13,
627
2,4-
D,D
IME
TH
YL
AM
INE
SALT
397,
197
466,
872
446,
575
488,
863
408,
926
371,
705
352,
130
329,
054
359,
904
2,4-
D,D
OD
EC
YL
AM
INE
SALT
00
00
00
00
02,
4-D
,HE
PTY
LA
MIN
ESA
LT0
00
00
00
00
2,4-
D,I
SOO
CT
YL
EST
ER
11,5
729,
603
4,44
64,
214
5,36
14,
623
2,15
677
999
42,
4-D
,ISO
PRO
PYL
EST
ER
10,5
7810
,671
13,1
2311
,682
19,0
7313
,467
11,7
6710
,439
11,4
212,
4-D
,N
-OL
EY
L-1
,3-P
RO
PYL
EN
ED
IAM
INE
SALT
00
00
00
00
0
2,4-
D,O
CT
YL
EST
ER
00
00
00
00
02,
4-D
,PR
OPY
LE
STE
R21
214
199
570
06
00
2,4-
D,T
ET
RA
DE
CY
LA
MIN
ESA
LT0
00
00
00
00
2,4-
D,T
RIE
TH
YL
AM
INE
SALT
383
332
472
2,82
910
65
<1
2310
2,4-
D,T
RII
SOPR
OPA
NO
LA
MIN
ESA
LT98
51,
140
1,93
02,
092
2,74
11,
746
1,58
82,
439
1,94
52,
4-D
,TR
IISO
PRO
PYL
AM
INE
SALT
636
472
1,94
11,
655
1,97
177
01,
263
1,87
11,
372
AC
RO
LE
IN20
1,15
621
5,82
216
1,63
712
3,66
010
1,42
511
4,13
099
,023
84,2
2053
,679
AL
UM
INU
MPH
OSP
HID
E10
5,16
913
2,29
610
8,08
410
8,40
615
7,09
814
8,73
113
8,61
711
0,49
285
,453
AR
SEN
ICA
CID
00
00
170
00
0A
RSE
NIC
PEN
TOX
IDE
7,80
57,
433
400
16,1
448,
034
9,24
08,
480
16,7
1922
,190
AR
SEN
ICT
RIO
XID
E<
1<
1<
1<
1<
1<
10
<1
<1
CA
PTA
N45
6,47
536
2,75
732
9,74
745
0,22
537
6,59
740
3,83
434
9,43
037
0,13
651
0,83
2C
APT
AN
,OT
HE
RR
EL
AT
ED
10,1
318,
031
7,37
410
,002
8,39
58,
918
5,96
74,
717
4,02
3C
AR
BA
RYL
142,
010
126,
742
135,
301
114,
077
74,9
4411
3,96
511
7,36
713
1,60
015
5,33
3C
HL
OR
INE
857,
144
1,27
8,58
058
5,67
31,
011,
383
834,
152
1,43
7,63
71,
323,
645
800,
013
490,
089
CH
LO
RO
PIC
RIN
5,50
5,91
25,
590,
285
5,68
7,57
16,
398,
482
7,31
0,07
68,
931,
078
8,22
0,34
68,
992,
756
8,48
8,83
1C
HR
OM
ICA
CID
10,9
0410
,384
559
22,5
5511
,224
12,9
0811
,847
23,3
5831
,629
DA
ZO
ME
T37
,537
40,2
7265
,725
60,5
3959
,245
39,2
2963
,920
58,5
7783
,058
38

Tabl
e11
:(co
ntin
ued)
The
repo
rted
poun
dsof
pest
icid
esus
edth
atar
eon
DP
R’s
toxi
cai
rco
ntam
inan
tslis
tapp
lied
inC
alifo
rnia
.The
sepe
stic
ides
are
the
activ
ein
gred
ient
slis
ted
inth
eC
alifo
rnia
Cod
eof
Reg
ulat
ions
,Titl
e3,
Div
isio
n6,
Cha
pter
4,Su
bcha
pter
1,A
rtic
le1,
Sect
ion
6860
. AI
2007
2008
2009
2010
2011
2012
2013
2014
2015
DD
VP
6,37
66,
859
4,16
44,
169
5,38
94,
803
4,61
94,
032
4,07
9E
ND
OSU
LFA
N52
,403
59,9
1741
,840
37,7
9915
,679
11,1
131,
833
8,13
66,
420
ET
HY
LE
NE
OX
IDE
23
70
08
0<
10
FOR
MA
LD
EH
YD
E47
,733
24,3
063,
972
5,51
14,
615
3,84
711
,165
52,9
8931
,956
HY
DR
OG
EN
CH
LO
RID
E1,
470
4,31
83,
976
2,24
050
433
639
541
255
3L
IND
AN
E2
218
181
02
06
MA
GN
ESI
UM
PHO
SPH
IDE
5,13
210
,507
8,00
912
,233
12,7
5711
,012
12,2
917,
562
13,9
08M
AN
CO
ZE
B40
8,65
233
0,23
828
1,63
975
7,63
71,
045,
283
1,13
0,97
21,
149,
338
1,28
1,78
91,
274,
902
MA
NE
B1,
061,
028
861,
006
656,
648
370,
333
54,2
276,
260
1,38
31,
274
667
ME
TA-C
RE
SOL
<1
<1
<1
<1
12
7<
1<
1M
ETA
M-S
OD
IUM
9,93
0,33
79,
497,
562
9,02
8,10
311
,428
,913
10,8
61,3
178,
428,
425
4,84
6,42
84,
300,
079
4,64
3,12
2M
ET
HA
NO
L0
00
00
00
00
ME
TH
IDA
TH
ION
45,6
6647
,203
47,3
1951
,343
29,5
4523
,396
6,37
53,
614
389
ME
TH
OX
YC
HL
OR
60
827
039
0<
10
<1
ME
TH
OX
YC
HL
OR
,OT
HE
RR
EL
AT
ED
00
00
00
00
0M
ET
HY
LB
RO
MID
E6,
448,
643
5,69
3,32
55,
615,
653
4,80
9,31
14,
057,
921
4,00
3,02
03,
535,
185
2,96
4,77
52,
666,
222
ME
TH
YL
ISO
TH
IOC
YAN
AT
E38
80
073
476
764
092
63M
ET
HY
LPA
RA
TH
ION
75,3
8534
,110
25,7
7021
,427
22,9
7025
,408
21,5
2048
118
2M
ET
HY
LPA
RA
TH
ION
,OT
HE
RR
EL
AT
ED
3,96
01,
792
1,35
51,
127
1,19
51,
334
1,13
1<
15
NA
PHT
HA
LE
NE
00
01
<1
0<
10
0PA
RA
-DIC
HL
OR
OB
EN
ZE
NE
151
170
<1
18<
10
0PA
RA
TH
ION
479
3311
824
819
625
<1
2283
6PC
NB
30,6
8929
,188
24,6
3737
,378
11,8
6717
,418
26,1
3123
,408
20,3
04PC
P,O
TH
ER
RE
LA
TE
D2
10
<1
332
392
<1
PCP,
SOD
IUM
SALT
<1
00
0<
10
0<
10
PCP,
SOD
IUM
SALT
,OT
HE
RR
EL
AT
ED
<1
00
00
00
00
PEN
TAC
HL
OR
OPH
EN
OL
224
03
1822
427
411
2PH
EN
OL
00
20
00
53
1PH
EN
OL
,FE
RR
OU
SSA
LT0
00
00
00
<1
0PH
OSP
HIN
E5,
286
48,2
4329
,527
11,2
9112
5,44
151
,143
20,7
8311
,341
28,0
15PH
OSP
HO
RU
S<
1<
1<
11
04
30
0PO
TASS
IUM
N-M
ET
HY
LD
ITH
IOC
AR
BA
MA
TE
3,78
5,43
65,
524,
647
4,10
2,41
24,
832,
615
5,67
3,37
18,
320,
255
9,48
4,46
77,
798,
703
10,5
13,7
89
POTA
SSIU
MPE
RM
AN
GA
NA
TE
00
109
00
00
00
PRO
POX
UR
191
188
202
298
808
359
373
251
100
PRO
PYL
EN
EO
XID
E11
0,06
810
5,60
011
1,60
930
0,00
844
9,03
738
9,07
041
0,36
040
0,71
939
2,72
4S,
S,S-
TR
IBU
TY
LPH
OSP
HO
RO
TR
ITH
IOA
TE
45,7
5716
,335
8,16
118
,427
30,3
2821
,820
19,0
7711
,683
6,47
2
SOD
IUM
CYA
NID
E2,
670
3,40
62,
579
2,50
21,
073
2,58
82,
593
2,61
13,
108
39

Tabl
e11
:(co
ntin
ued)
The
repo
rted
poun
dsof
pest
icid
esus
edth
atar
eon
DP
R’s
toxi
cai
rco
ntam
inan
tslis
tapp
lied
inC
alifo
rnia
.The
sepe
stic
ides
are
the
activ
ein
gred
ient
slis
ted
inth
eC
alifo
rnia
Cod
eof
Reg
ulat
ions
,Titl
e3,
Div
isio
n6,
Cha
pter
4,Su
bcha
pter
1,A
rtic
le1,
Sect
ion
6860
. AI
2007
2008
2009
2010
2011
2012
2013
2014
2015
SOD
IUM
DIC
HR
OM
AT
E0
00
00
00
20
SOD
IUM
TE
TR
AT
HIO
CA
RB
ON
AT
E39
1,30
335
4,29
424
9,58
023
3,94
916
8,76
149
,713
385
120
1,07
8SU
LFU
RYL
FLU
OR
IDE
2,15
2,45
12,
120,
860
2,18
4,82
32,
728,
977
2,35
9,00
62,
661,
786
3,06
2,34
32,
805,
856
3,03
8,91
0T
RIF
LU
RA
LIN
908,
614
676,
386
533,
307
473,
502
497,
887
485,
817
504,
016
513,
702
470,
532
XY
LE
NE
1,17
357
651
71,
060
282
372
1,18
11,
715
668
ZIN
CPH
OSP
HID
E3,
215
1,29
920
,898
1,74
52,
543
2,24
92,
287
3,59
83,
913
TOTA
L42
,899
,368
43,4
62,2
0136
,970
,857
43,8
64,0
3745
,772
,382
49,2
54,6
0246
,812
,104
44,7
54,9
5049
,222
,136
40

Tabl
e12
:Th
ere
port
edcu
mul
ativ
eac
res
trea
ted
with
pest
icid
esth
atar
eon
DP
R’s
toxi
cai
rco
ntam
inan
tslis
tapp
lied
inC
alifo
rnia
.Th
ese
pest
icid
esar
eth
eac
tive
ingr
edie
nts
liste
din
the
Cal
iforn
iaC
ode
ofR
egul
atio
ns,T
itle
3,D
ivis
ion
6,C
hapt
er4,
Subc
hapt
er1,
Art
icle
1,Se
ctio
n68
60.U
sein
clud
espr
imar
ilyag
ricu
ltura
lapp
licat
ions
.The
gran
dto
talf
orac
res
trea
ted
may
bele
ssth
anth
esu
mof
acre
str
eate
dfo
ral
lact
ive
ingr
edie
nts
beca
use
som
epr
oduc
tsco
ntai
nm
ore
than
one
activ
ein
gred
ient
.Dat
aar
efr
omth
eD
epar
tmen
tof
Pest
icid
eR
egul
atio
n’s
Pest
icid
eU
seR
epor
ts.
AI
2007
2008
2009
2010
2011
2012
2013
2014
2015
1,3-
DIC
HL
OR
OPR
OPE
NE
53,9
3757
,922
38,3
7454
,209
59,0
6569
,422
71,7
9469
,558
79,4
222,
4-D
7,40
533
,344
25,2
4423
,856
7,56
57,
764
11,4
4111
,041
13,6
032,
4-D
,2-E
TH
YL
HE
XY
LE
STE
R8,
362
15,0
479,
020
11,7
9710
,396
7,70
311
,634
8,54
111
,346
2,4-
D,A
LK
AN
OL
AM
INE
SALT
S(E
TH
AN
OL
AN
DIS
OPR
OPA
NO
LA
MIN
ES)
2355
270
172
136
26<
1<
1
2,4-
D,B
UTO
XY
ET
HA
NO
LE
STE
R1,
297
3,64
85,
110
2,54
21,
206
1,05
41,
661
1,77
581
32,
4-D
,BU
TOX
YPR
OPY
LE
STE
R0
<1
00
00
00
02,
4-D
,BU
TY
LE
STE
R10
06
<1
<1
7<
10
332,
4-D
,DIE
TH
AN
OL
AM
INE
SALT
13,3
3919
,085
18,9
3127
,009
11,0
757,
033
8,85
97,
547
6,57
72,
4-D
,DIM
ET
HY
LA
MIN
ESA
LT48
7,36
154
3,86
352
7,09
851
9,53
444
6,06
237
8,18
835
1,91
131
1,53
332
8,26
82,
4-D
,DO
DE
CY
LA
MIN
ESA
LT0
00
00
00
00
2,4-
D,H
EPT
YL
AM
INE
SALT
00
00
00
00
02,
4-D
,ISO
OC
TY
LE
STE
R7,
143
4,70
82,
673
2,42
42,
903
414
1,40
930
972,
4-D
,ISO
PRO
PYL
EST
ER
137,
055
135,
797
132,
302
138,
826
145,
544
161,
009
149,
976
136,
530
147,
250
2,4-
D,
N-O
LE
YL
-1,3
-PR
OPY
LE
NE
DIA
MIN
ESA
LT
00
00
00
00
0
2,4-
D,O
CT
YL
EST
ER
00
00
00
00
02,
4-D
,PR
OPY
LE
STE
R3,
348
1,95
51,
750
895
00
128
00
2,4-
D,T
ET
RA
DE
CY
LA
MIN
ESA
LT0
00
00
00
00
2,4-
D,T
RIE
TH
YL
AM
INE
SALT
473
679
740
165
117
3<
110
452,
4-D
,TR
IISO
PRO
PAN
OL
AM
INE
SALT
108
952
541
720
623
308
524
936
861
2,4-
D,T
RII
SOPR
OPY
LA
MIN
ESA
LT20
4<
1<
1<
125
3765
358
523
8A
CR
OL
EIN
141
1,02
71,
497
1245
5668
306
432
AL
UM
INU
MPH
OSP
HID
E84
,963
80,9
8911
2,06
310
0,85
913
3,23
016
4,08
214
8,96
215
0,08
815
7,64
7A
RSE
NIC
AC
ID0
00
0<
10
00
0A
RSE
NIC
PEN
TOX
IDE
<1
<1
<1
<1
<1
<1
<1
<1
<1
AR
SEN
ICT
RIO
XID
E<
1<
1<
1<
1<
1<
10
<1
<1
CA
PTA
N21
5,86
419
8,26
217
3,13
324
5,46
420
9,97
920
9,62
718
7,98
821
1,31
221
1,98
0C
APT
AN
,OT
HE
RR
EL
AT
ED
215,
229
198,
095
173,
083
245,
464
209,
979
205,
623
144,
375
119,
113
98,3
51C
AR
BA
RYL
97,0
1696
,136
107,
458
81,6
8368
,272
97,2
2996
,646
108,
750
135,
806
CH
LO
RIN
E1,
201
14,4
1424
,644
88,1
4424
,253
24,0
97<
138
,381
6,25
8C
HL
OR
OPI
CR
IN55
,490
53,4
0849
,089
51,8
0565
,973
63,4
3357
,655
55,0
0853
,853
CH
RO
MIC
AC
ID<
1<
1<
1<
1<
1<
1<
1<
1<
1D
AZ
OM
ET
700
183
301
274
243
594
768
152
368
DD
VP
2,73
32,
231
2,68
51,
880
5,18
46,
530
5,59
33,
307
6,28
2
41

Tabl
e12
:(co
ntin
ued)
The
repo
rted
cum
ulat
ive
acre
str
eate
dw
ithpe
stic
ides
that
are
onD
PR
’sto
xic
air
cont
amin
ants
lista
pplie
din
Cal
iforn
ia.T
hese
pest
icid
esar
eth
eac
tive
ingr
edie
nts
liste
din
the
Cal
iforn
iaC
ode
ofR
egul
atio
ns,T
itle
3,D
ivis
ion
6,C
hapt
er4,
Subc
hapt
er1,
Art
icle
1,Se
ctio
n68
60.
AI
2007
2008
2009
2010
2011
2012
2013
2014
2015
EN
DO
SUL
FAN
56,6
2764
,695
48,6
3948
,023
19,8
1211
,134
1,85
68,
331
6,56
1E
TH
YL
EN
EO
XID
E<
12
600
0<
10
<1
0FO
RM
AL
DE
HY
DE
5767
51
64
522
30H
YD
RO
GE
NC
HL
OR
IDE
446
4911
6<
15
015
510
0L
IND
AN
E0
3710
311
0<
10
28M
AG
NE
SIU
MPH
OSP
HID
E6
143
3214
580
2919
1413
1M
AN
CO
ZE
B21
2,34
916
9,42
214
5,61
643
3,83
363
4,21
567
8,91
667
5,95
471
0,86
774
1,71
4M
AN
EB
655,
235
558,
506
471,
395
290,
266
40,5
884,
559
1,52
41,
006
698
ME
TA-C
RE
SOL
5438
108
7914
485
761
46
128
ME
TAM
-SO
DIU
M78
,030
71,8
1574
,132
72,7
4870
,874
58,9
9828
,153
24,4
2229
,262
ME
TH
AN
OL
00
00
00
00
0M
ET
HID
AT
HIO
N37
,301
43,0
1054
,227
49,9
6834
,918
31,7
419,
046
3,56
448
9M
ET
HO
XY
CH
LO
R43
075
9058
0<
10
<1
ME
TH
OX
YC
HL
OR
,OT
HE
RR
EL
AT
ED
00
00
00
00
0M
ET
HY
LB
RO
MID
E45
,675
35,6
8539
,587
32,2
9347
,091
30,2
3726
,428
16,5
7813
,443
ME
TH
YL
ISO
TH
IOC
YAN
AT
E<
10
0<
1<
1<
10
<1
<1
ME
TH
YL
PAR
AT
HIO
N45
,173
21,5
7415
,198
13,0
4613
,343
15,5
5112
,486
<1
298
ME
TH
YL
PAR
AT
HIO
N,O
TH
ER
RE
LA
TE
D45
,165
21,3
3115
,053
13,0
2913
,326
15,3
3712
,440
<1
36
NA
PHT
HA
LE
NE
00
03
<1
0<
10
0PA
RA
-DIC
HL
OR
OB
EN
ZE
NE
<1
0<
1<
1<
1<
1<
10
0PA
RA
TH
ION
414
101
195
5168
15<
11
207
PCN
B1,
764
1,65
61,
400
4,42
987
933
160
51,
365
811
PCP,
OT
HE
RR
EL
AT
ED
1046
04
115
170
25
PCP,
SOD
IUM
SALT
<1
00
047
00
10
PCP,
SOD
IUM
SALT
,OT
HE
RR
EL
AT
ED
<1
00
00
00
00
PEN
TAC
HL
OR
OPH
EN
OL
1046
04
115
170
25
PHE
NO
L0
015
00
011
431
517
0PH
EN
OL
,FE
RR
OU
SSA
LT0
00
00
00
20
PHO
SPH
INE
31,
751
5064
382
468
711
02
25PH
OSP
HO
RU
S10
<1
<1
<1
074
108
00
POTA
SSIU
MN
-ME
TH
YL
DIT
HIO
CA
RB
AM
AT
E42
,988
56,0
0938
,197
41,4
4444
,078
50,3
6146
,861
39,7
0849
,507
POTA
SSIU
MPE
RM
AN
GA
NA
TE
00
50
00
00
0PR
OPO
XU
R<
110
356
<1
3<
14
178
39PR
OPY
LE
NE
OX
IDE
<1
12<
1<
1<
128
89
<1
<1
S,S,
S-T
RIB
UT
YL
PHO
SPH
OR
OT
RIT
HIO
AT
E31
,408
10,8
507,
182
15,7
8527
,139
21,8
9422
,774
15,1
397,
582
SOD
IUM
CYA
NID
E<
1<
1<
1<
1<
1<
1<
1<
118
SOD
IUM
DIC
HR
OM
AT
E0
00
00
00
<1
0
42

Tabl
e12
:(co
ntin
ued)
The
repo
rted
cum
ulat
ive
acre
str
eate
dw
ithpe
stic
ides
that
are
onD
PR
’sto
xic
air
cont
amin
ants
lista
pplie
din
Cal
iforn
ia.T
hese
pest
icid
esar
eth
eac
tive
ingr
edie
nts
liste
din
the
Cal
iforn
iaC
ode
ofR
egul
atio
ns,T
itle
3,D
ivis
ion
6,C
hapt
er4,
Subc
hapt
er1,
Art
icle
1,Se
ctio
n68
60.
AI
2007
2008
2009
2010
2011
2012
2013
2014
2015
SOD
IUM
TE
TR
AT
HIO
CA
RB
ON
AT
E11
,485
10,7
257,
180
7,30
14,
826
1,67
2<
14
266
SUL
FURY
LFL
UO
RID
E9
5736
113
053
753
263
585
153
TR
IFL
UR
AL
IN77
2,75
355
6,30
649
2,49
843
8,78
446
7,20
646
6,38
347
8,24
553
1,59
548
0,04
5X
YL
EN
E2,
021
1,41
81,
387
584
633
1,01
02,
157
1,77
81,
225
ZIN
CPH
OSP
HID
E9,
301
11,4
7814
,512
12,7
5121
,417
21,6
8522
,425
44,0
3951
,280
TOTA
L3,
116,
678
2,80
7,84
62,
578,
071
2,74
0,20
42,
551,
512
2,53
6,29
62,
381,
761
2,47
0,34
32,
507,
363
43

Figu
re9:
Use
tren
dsof
pest
icid
esth
atar
eon
DP
R’s
toxi
cai
rco
ntam
inan
tslis
tapp
lied
inC
alifo
rnia
.The
sepe
stic
ides
are
the
activ
ein
gred
ient
slis
ted
inth
eC
alifo
rnia
Cod
eof
Reg
ulat
ions
,Titl
e3,
Div
isio
n6,
Cha
pter
4,Su
bcha
pter
1,A
rtic
le1,
Sect
ion
6860
.Rep
orte
dpo
unds
ofac
tive
ingr
edie
nt(A
I)ap
plie
din
clud
ebo
thag
ricu
ltura
land
non-
agri
cultu
rala
pplic
atio
ns.T
here
port
edcu
mul
ativ
eac
res
trea
ted
incl
ude
prim
arily
agri
cultu
rala
pplic
atio
ns.D
ata
are
from
the
Dep
artm
ento
fPes
ticid
eR
egul
atio
n’s
Pest
icid
eU
seR
epor
ts.
44

USE
TR
EN
DS
OF
PEST
ICID
ES
TH
AT
AR
EFU
MIG
AN
TS.
Tabl
e13
:Th
ere
port
edpo
unds
ofpe
stic
ides
used
that
are
fum
igan
ts.U
sein
clud
esbo
thag
ricu
ltura
land
repo
rtab
leno
n-ag
ricu
ltura
lap
plic
atio
ns.D
ata
are
from
the
Dep
artm
ento
fPes
ticid
eR
egul
atio
n’s
Pest
icid
eU
seR
epor
ts.
AI
2007
2008
2009
2010
2011
2012
2013
2014
2015
1,2-
DIC
HL
OR
OPR
OPA
NE
,1,
3-D
ICH
LO
RO
PRO
PEN
EA
ND
RE
LA
TE
DC
3C
OM
POU
ND
S
10,5
320
00
06
01
0
1,3-
DIC
HL
OR
OPR
OPE
NE
9,59
6,31
79,
708,
712
6,39
9,53
48,
797,
078
10,9
24,3
4411
,952
,624
12,9
41,0
4213
,584
,346
15,7
57,9
07A
LU
MIN
UM
PHO
SPH
IDE
105,
169
132,
296
108,
084
108,
406
157,
098
148,
731
138,
617
110,
492
85,4
53C
AR
BO
NT
ET
RA
CH
LO
RID
E18
01,
980
<1
06
900
7<
1C
HL
OR
OPI
CR
IN5,
505,
912
5,59
0,28
55,
687,
571
6,39
8,48
27,
310,
076
8,93
1,07
88,
220,
346
8,99
2,75
68,
488,
831
DA
ZO
ME
T37
,537
40,2
7265
,725
60,5
3959
,245
39,2
2963
,920
58,5
7783
,058
ET
HY
LE
NE
DIB
RO
MID
E3
127
<1
00
60
0<
1E
TH
YL
EN
ED
ICH
LO
RID
E0
<1
00
00
00
0E
TH
YL
EN
EO
XID
E2
37
00
80
<1
0M
AG
NE
SIU
MPH
OSP
HID
E5,
132
10,5
078,
009
12,2
3312
,757
11,0
1212
,291
7,56
213
,908
ME
TAM
-SO
DIU
M9,
930,
337
9,49
7,56
29,
028,
103
11,4
28,9
1310
,861
,317
8,42
8,42
54,
846,
428
4,30
0,07
94,
643,
122
ME
TH
YL
BR
OM
IDE
6,44
8,64
35,
693,
325
5,61
5,65
34,
809,
311
4,05
7,92
14,
003,
020
3,53
5,18
52,
964,
775
2,66
6,22
2M
ET
HY
LIO
DID
E0
00
01,
157
210
00
PHO
SPH
INE
5,28
648
,243
29,5
2711
,291
125,
441
51,1
4320
,783
11,3
4128
,015
POTA
SSIU
MN
-ME
TH
YL
DIT
HIO
CA
RB
AM
AT
E3,
785,
436
5,52
4,64
74,
102,
412
4,83
2,61
55,
673,
371
8,32
0,25
59,
484,
467
7,79
8,70
310
,513
,789
PRO
PYL
EN
EO
XID
E11
0,06
810
5,60
011
1,60
930
0,00
844
9,03
738
9,07
041
0,36
040
0,71
939
2,72
4SO
DIU
MT
ET
RA
TH
IOC
AR
BO
NA
TE
391,
303
354,
294
249,
580
233,
949
168,
761
49,7
1338
512
01,
078
SUL
FURY
LFL
UO
RID
E2,
152,
451
2,12
0,86
02,
184,
823
2,72
8,97
72,
359,
006
2,66
1,78
63,
062,
343
2,80
5,85
63,
038,
910
ZIN
CPH
OSP
HID
E3,
215
1,29
920
,898
1,74
52,
543
2,24
92,
287
3,59
83,
913
TOTA
L38
,087
,522
38,8
30,0
1433
,611
,533
39,7
23,5
4842
,162
,078
44,9
88,4
6542
,738
,455
41,0
38,9
3145
,716
,930
45
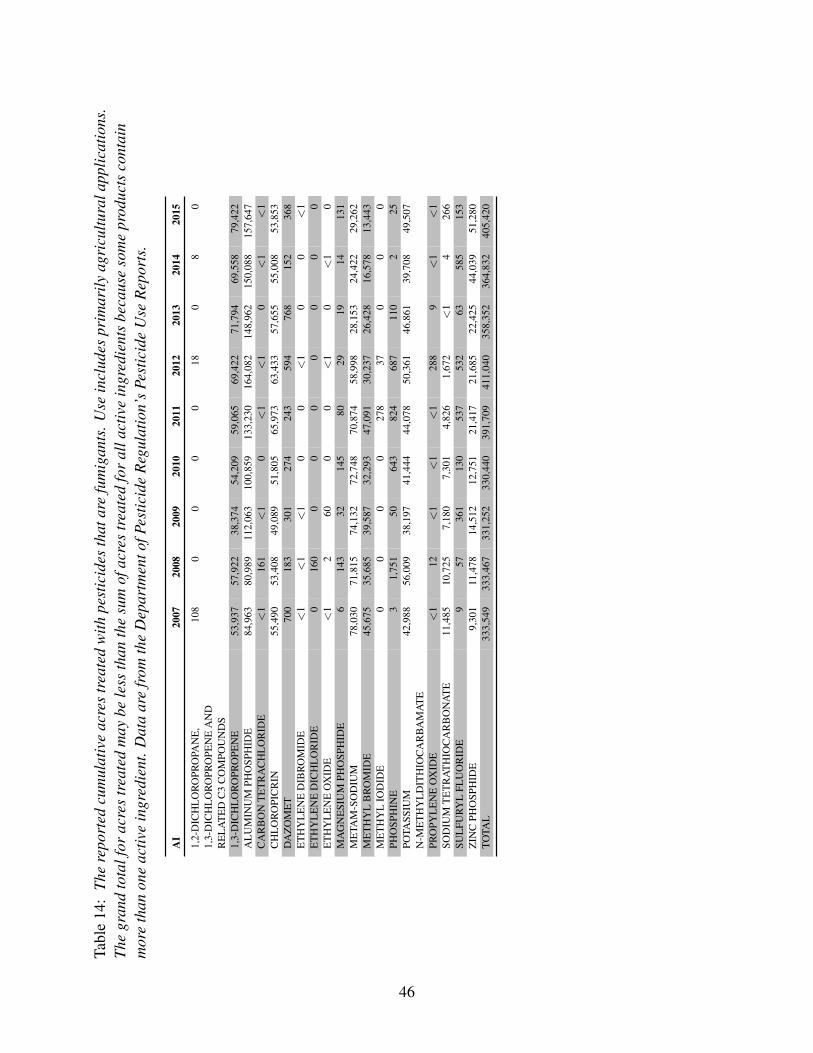
Tabl
e14
:Th
ere
port
edcu
mul
ativ
eac
res
trea
ted
with
pest
icid
esth
atar
efu
mig
ants
.Use
incl
udes
prim
arily
agri
cultu
rala
pplic
atio
ns.
The
gran
dto
talf
orac
res
trea
ted
may
bele
ssth
anth
esu
mof
acre
str
eate
dfo
ral
lact
ive
ingr
edie
nts
beca
use
som
epr
oduc
tsco
ntai
nm
ore
than
one
activ
ein
gred
ient
.Dat
aar
efr
omth
eD
epar
tmen
tofP
estic
ide
Reg
ulat
ion’
sPe
stic
ide
Use
Rep
orts
.
AI
2007
2008
2009
2010
2011
2012
2013
2014
2015
1,2-
DIC
HL
OR
OPR
OPA
NE
,1,
3-D
ICH
LO
RO
PRO
PEN
EA
ND
RE
LA
TE
DC
3C
OM
POU
ND
S
108
00
00
180
80
1,3-
DIC
HL
OR
OPR
OPE
NE
53,9
3757
,922
38,3
7454
,209
59,0
6569
,422
71,7
9469
,558
79,4
22A
LU
MIN
UM
PHO
SPH
IDE
84,9
6380
,989
112,
063
100,
859
133,
230
164,
082
148,
962
150,
088
157,
647
CA
RB
ON
TE
TR
AC
HL
OR
IDE
<1
161
<1
0<
1<
10
<1
<1
CH
LO
RO
PIC
RIN
55,4
9053
,408
49,0
8951
,805
65,9
7363
,433
57,6
5555
,008
53,8
53D
AZ
OM
ET
700
183
301
274
243
594
768
152
368
ET
HY
LE
NE
DIB
RO
MID
E<
1<
1<
10
0<
10
0<
1E
TH
YL
EN
ED
ICH
LO
RID
E0
160
00
00
00
0E
TH
YL
EN
EO
XID
E<
12
600
0<
10
<1
0M
AG
NE
SIU
MPH
OSP
HID
E6
143
3214
580
2919
1413
1M
ETA
M-S
OD
IUM
78,0
3071
,815
74,1
3272
,748
70,8
7458
,998
28,1
5324
,422
29,2
62M
ET
HY
LB
RO
MID
E45
,675
35,6
8539
,587
32,2
9347
,091
30,2
3726
,428
16,5
7813
,443
ME
TH
YL
IOD
IDE
00
00
278
370
00
PHO
SPH
INE
31,
751
5064
382
468
711
02
25PO
TASS
IUM
N-M
ET
HY
LD
ITH
IOC
AR
BA
MA
TE
42,9
8856
,009
38,1
9741
,444
44,0
7850
,361
46,8
6139
,708
49,5
07
PRO
PYL
EN
EO
XID
E<
112
<1
<1
<1
288
9<
1<
1SO
DIU
MT
ET
RA
TH
IOC
AR
BO
NA
TE
11,4
8510
,725
7,18
07,
301
4,82
61,
672
<1
426
6SU
LFU
RYL
FLU
OR
IDE
957
361
130
537
532
6358
515
3Z
INC
PHO
SPH
IDE
9,30
111
,478
14,5
1212
,751
21,4
1721
,685
22,4
2544
,039
51,2
80TO
TAL
333,
549
333,
467
331,
252
330,
440
391,
709
411,
040
358,
352
364,
832
405,
420
46

Figu
re10
:Use
tren
dsof
pest
icid
esth
atar
efu
mig
ants
.Rep
orte
dpo
unds
ofac
tive
ingr
edie
nt(A
I)ap
plie
din
clud
ebo
thag
ricu
ltura
land
non-
agri
cultu
rala
pplic
atio
ns.T
here
port
edcu
mul
ativ
eac
res
trea
ted
incl
ude
prim
arily
agri
cultu
rala
pplic
atio
ns.D
ata
are
from
the
Dep
artm
ento
fPes
ticid
eR
egul
atio
n’s
Pest
icid
eU
seR
epor
ts.
47

USE
TR
EN
DS
OF
OIL
PEST
ICID
ES.
Tabl
e15
:Th
ere
port
edpo
unds
ofpe
stic
ides
used
that
are
oils
.As
abr
oad
grou
p,oi
lpes
ticid
esan
dot
her
petr
oleu
mdi
still
ates
are
onU
.S.E
PA’s
listo
fAor
Bca
rcin
ogen
sor
the
Stat
e’s
Pro
posi
tion
65lis
tofc
hem
ical
s“k
now
nto
caus
eca
ncer
.”H
owev
er,t
hese
clas
sific
atio
nsdo
notd
istin
guis
ham
ong
oilp
estic
ides
that
may
notq
ualif
yas
carc
inog
enic
due
toth
eir
degr
eeof
refin
emen
t.M
any
such
oilp
estic
ides
also
serv
eas
alte
rnat
ives
tohi
gh-t
oxic
itych
emic
als.
For
this
reas
on,o
ilpe
stic
ide
data
was
clas
sifie
dse
para
tely
inth
isre
port
.Use
incl
udes
both
agri
cultu
rala
ndre
port
able
non-
agri
cultu
rala
pplic
atio
ns.D
ata
are
from
the
Dep
artm
ento
fPes
ticid
eR
egul
atio
n’s
Pest
icid
eU
seR
epor
ts.
AI
2007
2008
2009
2010
2011
2012
2013
2014
2015
CO
AL
TAR
HY
DR
OC
AR
BO
NS
00
00
00
00
0H
YD
RO
TR
EA
TE
DPA
RA
FFIN
ICSO
LVE
NT
300,
501
247,
676
248,
774
224,
458
239,
204
156,
552
169,
847
183,
198
128,
691
ISO
PAR
AFF
INIC
HY
DR
OC
AR
BO
NS
16,8
5911
,250
13,0
076,
628
13,8
239,
822
7,29
02,
191
11,4
19K
ER
OSE
NE
12,4
3122
,269
148,
478
95,9
7334
,662
20,4
236,
938
13,6
134,
402
MIN
ER
AL
OIL
12,8
61,9
8112
,341
,868
11,6
56,5
9411
,437
,427
10,3
19,9
2211
,562
,118
16,1
53,5
1315
,798
,390
25,1
68,7
37M
INE
RA
LO
IL,P
ET
RO
LE
UM
DIS
TIL
LA
TE
S,SO
LVE
NT
RE
FIN
ED
LIG
HT
139
219
124
401
110
00
0
NA
PHT
HA
,HE
AVY
AR
OM
AT
IC0
00
00
0<
10
31PE
TR
OL
EU
MD
ER
IVA
TIV
ER
ESI
N0
01
0<
10
60
0PE
TR
OL
EU
MD
IST
ILL
AT
ES
343,
123
504,
035
548,
178
341,
843
280,
132
247,
408
207,
201
158,
763
139,
413
PET
RO
LE
UM
DIS
TIL
LA
TE
S,A
LIP
HA
TIC
18,3
2316
,390
10,4
9315
,635
8,98
96,
638
7,68
015
,233
11,0
31PE
TR
OL
EU
MD
IST
ILL
AT
ES,
AR
OM
AT
IC1,
160
367
103
247
1210
030
343
412
8PE
TR
OL
EU
MD
IST
ILL
AT
ES,
RE
FIN
ED
1,23
7,89
11,
487,
043
1,22
2,83
02,
005,
527
1,98
6,32
21,
909,
574
1,90
5,04
91,
736,
898
2,02
1,19
9PE
TR
OL
EU
MH
YD
RO
CA
RB
ON
S1,
407
184
138
177
177
2777
3369
2PE
TR
OL
EU
MN
APH
TH
EN
ICO
ILS
240
248
254
984
1,07
551
834
984
257
5PE
TR
OL
EU
MO
IL,P
AR
AFF
INB
ASE
D51
1,25
550
6,83
91,
048,
107
618,
417
759,
923
982,
942
1,24
8,16
61,
058,
366
1,12
7,92
0PE
TR
OL
EU
MO
IL,U
NC
LA
SSIF
IED
13,4
19,1
4113
,583
,475
12,2
46,7
6512
,528
,157
17,8
40,0
8513
,418
,065
15,8
91,3
4311
,085
,592
12,7
79,4
18PE
TR
OL
EU
MSU
LFO
NA
TE
S<
1<
10
0<
10
00
0TO
TAL
28,7
24,4
5128
,721
,863
27,1
43,8
4727
,275
,875
31,4
84,3
3628
,314
,189
35,5
97,7
6130
,053
,553
41,3
93,6
56
48

Tabl
e16
:Th
ere
port
edcu
mul
ativ
eac
res
trea
ted
with
pest
icid
esth
atar
eoi
ls.A
sa
broa
dgr
oup,
oilp
estic
ides
and
othe
rpe
trol
eum
dist
illat
esar
eon
U.S
.EPA
’slis
tofA
orB
carc
inog
ens
orth
eSt
ate’
sP
ropo
sitio
n65
listo
fche
mic
als
“kno
wn
toca
use
canc
er.”
How
ever
,the
secl
assi
ficat
ions
dono
tdis
tingu
ish
amon
goi
lpes
ticid
esth
atm
ayno
tqua
lify
asca
rcin
ogen
icdu
eto
thei
rde
gree
ofre
finem
ent.
Man
ysu
choi
lpes
ticid
esal
sose
rve
asal
tern
ativ
esto
high
-tox
icity
chem
ical
s.Fo
rth
isre
ason
,oil
pest
icid
eda
taw
ascl
assi
fied
sepa
rate
lyin
this
repo
rt.U
sein
clud
espr
imar
ilyag
ricu
ltura
lapp
licat
ions
.The
gran
dto
talf
orac
res
trea
ted
may
bele
ssth
anth
esu
mof
acre
str
eate
dfo
ral
lact
ive
ingr
edie
nts
beca
use
som
epr
oduc
tsco
ntai
nm
ore
than
one
activ
ein
gred
ient
.Dat
aar
efr
omth
eD
epar
tmen
tofP
estic
ide
Reg
ulat
ion’
sPe
stic
ide
Use
Rep
orts
.
AI
2007
2008
2009
2010
2011
2012
2013
2014
2015
CO
AL
TAR
HY
DR
OC
AR
BO
NS
00
00
00
00
0H
YD
RO
TR
EA
TE
DPA
RA
FFIN
ICSO
LVE
NT
261,
415
226,
988
232,
299
227,
415
254,
618
183,
177
193,
661
193,
965
175,
083
ISO
PAR
AFF
INIC
HY
DR
OC
AR
BO
NS
27,9
0319
,228
22,9
1313
,709
19,1
2915
,023
8,63
74,
657
23,1
95K
ER
OSE
NE
254,
279
284,
440
303,
497
316,
705
319,
278
288,
599
286,
883
267,
821
191,
021
MIN
ER
AL
OIL
823,
500
875,
257
1,00
9,84
11,
193,
988
1,27
2,82
91,
386,
176
1,82
0,64
61,
927,
402
2,36
0,24
9M
INE
RA
LO
IL,P
ET
RO
LE
UM
DIS
TIL
LA
TE
S,SO
LVE
NT
RE
FIN
ED
LIG
HT
522
1,01
085
01,
255
600
00
0
NA
PHT
HA
,HE
AVY
AR
OM
AT
IC0
00
00
0<
10
<1
PET
RO
LE
UM
DE
RIV
AT
IVE
RE
SIN
00
<1
0<
10
<1
00
PET
RO
LE
UM
DIS
TIL
LA
TE
S28
0,74
742
2,25
327
7,89
323
8,83
121
9,25
417
5,51
917
5,47
413
1,33
911
5,94
0PE
TR
OL
EU
MD
IST
ILL
AT
ES,
AL
IPH
AT
IC31
,441
28,1
5930
,905
58,3
4275
,134
32,4
2836
,156
34,3
3844
,584
PET
RO
LE
UM
DIS
TIL
LA
TE
S,A
RO
MA
TIC
383
107
225
445
1217
066
040
89
PET
RO
LE
UM
DIS
TIL
LA
TE
S,R
EFI
NE
D23
1,86
028
8,36
325
8,02
627
3,92
325
5,91
324
4,55
225
8,72
427
4,25
028
9,46
3PE
TR
OL
EU
MH
YD
RO
CA
RB
ON
S54
633
430
915
935
575
8017
3PE
TR
OL
EU
MN
APH
TH
EN
ICO
ILS
17,9
5018
,093
22,4
3544
,879
65,4
3027
,369
30,5
3921
,266
35,9
79PE
TR
OL
EU
MO
IL,P
AR
AFF
INB
ASE
D73
8,03
765
8,70
963
1,12
067
3,56
871
2,34
271
6,39
665
1,29
172
7,64
365
2,82
6PE
TR
OL
EU
MO
IL,U
NC
LA
SSIF
IED
674,
659
702,
988
693,
354
766,
362
1,04
2,07
185
2,99
398
4,06
180
9,60
482
1,99
3PE
TR
OL
EU
MSU
LFO
NA
TE
S<
1<
10
0<
10
00
0TO
TAL
3,32
3,24
13,
505,
504
3,45
8,25
13,
764,
424
4,17
0,61
93,
894,
875
4,41
6,23
84,
371,
466
4,67
4,22
2
49

Figu
re11
:Use
tren
dsof
pest
icid
esth
atar
eoi
ls.A
lthou
ghoi
lsar
eon
U.S
.EPA
’slis
tofA
orB
carc
inog
ens
orth
eSt
ate’
sP
ropo
sitio
n65
listo
fche
mic
als
“kno
wn
toca
use
canc
er”,
thes
ecl
assi
ficat
ions
dono
tdis
tingu
ish
amon
goi
lpes
ticid
esth
atm
ayno
tbe
carc
inog
enic
due
toth
eir
degr
eeof
refin
emen
t.M
any
such
oilp
estic
ides
serv
eas
alte
rnat
ives
tohi
gh-t
oxic
itych
emic
als.
Rep
orte
dpo
unds
ofac
tive
ingr
edie
nt(A
I)ap
plie
din
clud
ebo
thag
ricu
ltura
land
non-
agri
cultu
rala
pplic
atio
ns.T
here
port
edcu
mul
ativ
eac
res
trea
ted
incl
ude
prim
arily
agri
cultu
rala
pplic
atio
ns.D
ata
are
from
the
Dep
artm
ento
fPes
ticid
eR
egul
atio
n’s
Pest
icid
eU
seR
epor
ts.
50

USE
TR
EN
DS
OF
BIO
PEST
ICID
ES.
Tabl
e17
:Th
ere
port
edpo
unds
ofpe
stic
ides
used
that
are
biop
estic
ides
.Bio
pest
icid
esin
clud
em
icro
orga
nism
san
dna
tura
llyoc
curr
ing
com
poun
ds,o
rco
mpo
unds
esse
ntia
llyid
entic
alto
natu
rally
occu
rrin
gco
mpo
unds
that
are
nott
oxic
toth
eta
rget
pest
(suc
has
pher
omon
es).
Use
incl
udes
both
agri
cultu
rala
ndre
port
able
non-
agri
cultu
rala
pplic
atio
ns.D
ata
are
from
the
Dep
artm
ento
fPes
ticid
eR
egul
atio
n’s
Pest
icid
eU
seR
epor
ts.
AI
2007
2008
2009
2010
2011
2012
2013
2014
2015
(3S,
6R)-
3-M
ET
HY
L-6
-ISO
PRO
PEN
YL
-9-
DE
CE
N-1
-YL
AC
ETA
TE
00
<1
00
<1
0<
10
(3S,
6S)-
3-M
ET
HY
L-6
-ISO
PRO
PEN
YL
-9-
DE
CE
N-1
-YL
AC
ETA
TE
00
<1
00
<1
0<
10
(E)-
4-T
RID
EC
EN
-1-Y
L-A
CE
TAT
E11
317
680
960
00
231
(E)-
5-D
EC
EN
-1-O
L0
00
00
<1
<1
<1
1(E
)-5-
DE
CE
NO
L2
21
1<
12
31
<1
(E)-
5-D
EC
EN
YL
AC
ETA
TE
78
45
210
74
15(E
,E)-
9,11
-TE
TR
AD
EC
AD
IEN
-1-Y
LA
CE
TAT
E39
2811
26
34
32
(E,Z
)-7,
9-D
OD
EC
AD
IEN
-1-Y
LA
CE
TAT
E0
00
5024
927
024
240
(R,Z
)-5-
(1-D
EC
EN
YL
)D
IHY
DR
O-2
-(3H
)-FU
RA
NO
NE
00
00
00
00
0
(S)-
KIN
OPR
EN
E23
825
227
627
719
130
128
431
142
9(S
)-V
ER
BE
NO
NE
00
00
055
00
781
(Z)-
11-H
EX
AD
EC
EN
-1-Y
LA
CE
TAT
E2
068
10
10
00
0(Z
)-11
-HE
XA
DE
CE
NA
L2
00
00
00
0<
1(Z
)-4-
TR
IDE
CE
N-1
-YL
-AC
ETA
TE
46
33
00
01
<1
(Z)-
9-D
OD
EC
EN
YL
AC
ETA
TE
1<
1<
1<
1<
1<
1<
1<
1<
1(Z
,E)-
7,11
-HE
XA
DE
CA
DIE
N-1
-YL
AC
ETA
TE
0<
13
20
00
00
(Z,Z
)-11
,13-
HE
XA
DE
CA
DIE
NA
L<
1<
10
<1
571
271
321
619
969
(Z,Z
)-7,
11-H
EX
AD
EC
AD
IEN
-1-Y
LA
CE
TAT
E0
03
30
00
00
1,4-
DIM
ET
HY
LN
APH
TH
AL
EN
E18
837
1,54
41,
152
544
893
2,22
51,
085
891
1,7-
DIO
XA
SPIR
O-(
5,5)
-UN
DE
CA
NE
<1
<1
<1
<1
<1
<1
1<
1<
11-
DE
CA
NO
L0
00
00
00
00
1-M
ET
HY
LC
YC
LO
PRO
PEN
E<
1<
1<
1<
1<
11
1<
11
1-N
APH
TH
AL
EN
EA
CE
TAM
IDE
4955
3225
2020
1922
181-
OC
TE
N-3
-OL
00
00
00
0<
1<
12-
ME
TH
YL
-1-B
UTA
NO
L0
00
00
0<
1<
1<
13,
13O
CTA
DE
CA
DIE
N-1
-YL
AC
ETA
TE
044
01
120
<1
0<
13,
7-D
IME
TH
YL
-6-O
CT
EN
-1-O
L0
15
2312
2854
4249
AC
ET
ICA
CID
121
791,
732
7360
143
6220
,806
51

Tabl
e17
:(co
ntin
ued)
The
repo
rted
poun
dsof
pest
icid
esus
edth
atar
ebi
opes
ticid
es.B
iope
stic
ides
incl
ude
mic
roor
gani
sms
and
natu
rally
occu
rrin
gco
mpo
unds
,or
com
poun
dses
sent
ially
iden
tical
tona
tura
llyoc
curr
ing
com
poun
dsth
atar
eno
ttox
icto
the
targ
etpe
st(s
uch
asph
erom
ones
).
AI
2007
2008
2009
2010
2011
2012
2013
2014
2015
AG
RO
BA
CT
ER
IUM
RA
DIO
BA
CT
ER
577
3214
212
495
2823
614
913
7A
GR
OB
AC
TE
RIU
MR
AD
IOB
AC
TE
R,
STR
AIN
K10
26<
1<
11
<1
<1
<1
34<
1<
1
AL
LYL
ISO
TH
IOC
YAN
AT
E0
00
00
<1
00
0A
LM
ON
D,B
ITT
ER
<1
<1
<1
<1
<1
<1
<1
<1
<1
AM
INO
ET
HO
XY
VIN
YL
GLY
CIN
EH
YD
RO
CH
LO
RID
E96
31,
073
543
1,02
41,
194
1,36
81,
444
1,75
71,
988
AM
MO
NIU
MB
ICA
RB
ON
AT
E7
2<
19
147
4632
38A
MM
ON
IUM
NIT
RA
TE
35,1
1948
,460
52,9
2255
,872
68,9
8090
,857
124,
747
121,
649
119,
825
AM
PEL
OM
YC
ES
QU
ISQ
UA
LIS
<1
0<
1<
10
00
00
AN
IMA
LG
LA
ND
EX
TR
AC
TS
00
00
00
00
0A
SPE
RG
ILL
US
FLAV
US
STR
AIN
AF3
60
00
0<
14
48
9A
UR
EO
BA
SID
IUM
PUL
LU
LA
NS
STR
AIN
DSM
1494
00
00
00
081
458
353
AU
RE
OB
ASI
DIU
MPU
LL
UL
AN
SST
RA
IND
SM14
941
00
00
00
8145
835
3
AZ
AD
IRA
CH
TIN
2,23
52,
246
2,50
01,
885
2,02
42,
639
3,16
14,
041
5,03
1B
AC
ILL
US
AM
YL
OL
IQU
EFA
CIE
NS
STR
AIN
D74
70
00
00
869
84,9
5717
7,58
513
1,29
1
BA
CIL
LU
SFI
RM
US
(ST
RA
INI-
1582
)0
00
00
00
4217
9B
AC
ILL
US
POPI
LL
IAE
00
00
00
<1
<1
<1
BA
CIL
LU
SPU
MIL
US,
STR
AIN
QST
2808
7,06
28,
138
6,98
76,
783
7,55
96,
752
6,24
57,
956
8,10
9B
AC
ILL
US
SPH
AE
RIC
US,
SER
OT
YPE
H-5
A5B
,ST
RA
IN23
6220
,192
21,4
4118
,178
13,0
1310
,602
9,12
310
,500
10,4
9912
,345
BA
CIL
LU
SSU
BT
ILIS
GB
036
1<
1<
1<
11
12
3B
AC
ILL
US
SUB
TIL
ISM
BI6
000
00
00
<1
<1
00
BA
CIL
LU
SSU
BT
ILIS
VAR
.A
MY
LO
LIQ
UE
FAC
IEN
SST
RA
INFZ
B24
00
00
02
8794
102
BA
CIL
LU
ST
HU
RIN
GIE
NSI
S(B
ER
LIN
ER
)27
164
626
1811
428
BA
CIL
LU
ST
HU
RIN
GIE
NSI
S(B
ER
LIN
ER
),SU
BSP
.AIZ
AW
AI,
GC
-91
PRO
TE
IN
20,4
7420
,484
27,5
3920
,397
11,6
6617
,042
13,2
6518
,769
16,8
32
BA
CIL
LU
ST
HU
RIN
GIE
NSI
S(B
ER
LIN
ER
),SU
BSP
.AIZ
AW
AI,
SER
OT
YPE
H-7
2,87
72,
373
894
824
819
730
359
333
183
BA
CIL
LU
ST
HU
RIN
GIE
NSI
S(B
ER
LIN
ER
),SU
BSP
.ISR
AE
LE
NSI
S,SE
RO
TY
PEH
-14
8,26
79,
433
17,2
0211
,401
22,6
4012
,616
9,26
911
,779
14,8
92
52

Tabl
e17
:(co
ntin
ued)
The
repo
rted
poun
dsof
pest
icid
esus
edth
atar
ebi
opes
ticid
es.B
iope
stic
ides
incl
ude
mic
roor
gani
sms
and
natu
rally
occu
rrin
gco
mpo
unds
,or
com
poun
dses
sent
ially
iden
tical
tona
tura
llyoc
curr
ing
com
poun
dsth
atar
eno
ttox
icto
the
targ
etpe
st(s
uch
asph
erom
ones
).
AI
2007
2008
2009
2010
2011
2012
2013
2014
2015
BA
CIL
LU
ST
HU
RIN
GIE
NSI
S(B
ER
LIN
ER
),SU
BSP
.KU
RST
AK
IST
RA
INSA
-12
22,7
0212
,325
12,1
287,
424
4,68
910
,361
8,24
67,
971
8,43
4
BA
CIL
LU
ST
HU
RIN
GIE
NSI
S(B
ER
LIN
ER
),SU
BSP
.KU
RST
AK
I,SE
RO
TY
PE3A
,3B
987
460
402
150
244
234
5341
18
BA
CIL
LU
ST
HU
RIN
GIE
NSI
S(B
ER
LIN
ER
),SU
BSP
.KU
RST
AK
I,ST
RA
INE
G23
48
147
369
118
6647
844
500
514
344
BA
CIL
LU
ST
HU
RIN
GIE
NSI
S(B
ER
LIN
ER
),SU
BSP
.KU
RST
AK
I,ST
RA
INE
G23
71
00
0<
1<
10
00
0
BA
CIL
LU
ST
HU
RIN
GIE
NSI
S(B
ER
LIN
ER
),SU
BSP
.KU
RST
AK
I,ST
RA
INSA
-11
63,8
6666
,612
80,5
6575
,074
115,
679
52,4
2577
,932
80,4
0180
,988
BA
CIL
LU
ST
HU
RIN
GIE
NSI
S(B
ER
LIN
ER
),SU
BSP
.SA
ND
IEG
O2
0<
1<
10
00
00
BA
CIL
LU
ST
HU
RIN
GIE
NSI
SSU
BSP
EC
IES
KU
RST
AK
IST
RA
INB
MP
123
076
411
814
00
00
0
BA
CIL
LU
ST
HU
RIN
GIE
NSI
SSU
BSP
EC
IES
KU
RST
AK
I,G
EN
ET
ICA
LLY
EN
GIN
EE
RE
DST
RA
INE
G78
41L
EPI
DO
PTE
RA
NA
CT
IVE
TOX
IN
632
277
421
7529
85
353
BA
CIL
LU
ST
HU
RIN
GIE
NSI
SVA
R.
KU
RST
AK
IST
RA
INM
-200
<1
0<
10
00
00
<1
BA
CIL
LU
ST
HU
RIN
GIE
NSI
SVA
R.
KU
RST
AK
I,G
EN
ET
ICA
LLY
EN
GIN
EE
RE
DST
RA
INE
G78
26
154
442
950
052
80
00
BA
CIL
LU
ST
HU
RIN
GIE
NSI
S,SU
BSP
.A
IZA
WA
I,ST
RA
INA
BT
S-18
5732
,529
39,4
6431
,043
26,2
5024
,282
30,5
7329
,866
49,1
8658
,159
BA
CIL
LU
ST
HU
RIN
GIE
NSI
S,SU
BSP
.A
IZA
WA
I,ST
RA
INSD
-137
2,L
EPI
DO
PTE
RA
NA
CT
IVE
TOX
IN(S
)
563
256
243
130
881
186
42
BA
CIL
LU
ST
HU
RIN
GIE
NSI
S,SU
BSP
.IS
RA
EL
EN
SIS,
STR
AIN
AM
65-5
240
,376
52,9
6953
,778
71,0
5052
,787
173,
135
49,6
8842
,762
44,3
79
53

Tabl
e17
:(co
ntin
ued)
The
repo
rted
poun
dsof
pest
icid
esus
edth
atar
ebi
opes
ticid
es.B
iope
stic
ides
incl
ude
mic
roor
gani
sms
and
natu
rally
occu
rrin
gco
mpo
unds
,or
com
poun
dses
sent
ially
iden
tical
tona
tura
llyoc
curr
ing
com
poun
dsth
atar
eno
ttox
icto
the
targ
etpe
st(s
uch
asph
erom
ones
).
AI
2007
2008
2009
2010
2011
2012
2013
2014
2015
BA
CIL
LU
ST
HU
RIN
GIE
NSI
S,SU
BSP
.K
UR
STA
KI,
STR
AIN
AB
TS-
351,
FER
ME
NTA
TIO
NSO
LID
SA
ND
SOL
UB
LE
S
71,7
5578
,527
69,5
4596
,988
83,0
2795
,294
83,4
1911
1,38
396
,404
BA
CIL
LU
ST
HU
RIN
GIE
NSI
S,SU
BSP
.K
UR
STA
KI,
STR
AIN
HD
-12,
262
2,06
83,
747
3,58
92,
549
3,18
72,
323
1,92
81,
924
BA
CIL
LU
ST
HU
RIN
GIE
NSI
S,VA
R.
KU
RST
AK
IDE
LTA
EN
DO
TOX
INS
CRY
1A(C
)AN
DC
RY1C
(GE
NE
TIC
AL
LYE
NG
INE
ER
ED
)EN
CA
PSU
LA
TE
DIN
PSE
UD
OM
ON
AS
FLU
OR
ESC
EN
S(K
ILL
ED
)
126
28<
1<
14
0<
10
BA
CT
ER
IOPH
AG
EA
CT
IVE
AG
AIN
STX
AN
TH
OM
ON
AS
CA
MPE
STR
ISPV
.V
ESI
CA
TOR
IAA
ND
PSE
UD
OM
ON
AS
SYR
ING
AE
PV.T
OM
ATO
00
00
<1
<1
<1
<1
0
BA
LSA
MFI
RO
IL0
00
<1
0<
1<
1<
11
BE
AU
VE
RIA
BA
SSIA
NA
STR
AIN
GH
A71
156
937
835
760
81,
053
1,77
52,
747
3,47
4B
UFF
AL
OG
OU
RD
RO
OT
POW
DE
R13
727
91
110
125
56
BU
RK
HO
LD
ER
IASP
STR
AIN
A39
6C
EL
LS
AN
DFE
RM
EN
TAT
ION
ME
DIA
00
00
00
02,
829
58,5
41
CA
ND
IDA
OL
EO
PHIL
AIS
OL
AT
EI-
182
00
00
00
00
0C
AN
OL
AO
IL29
2517
131
2615
2834
97C
APS
ICU
MO
LE
OR
ESI
N10
52
44
1210
2792
CA
RB
ON
DIO
XID
E32
,010
44,3
157,
727
17,5
5021
,239
30,8
2615
,739
13,6
7614
,251
CA
STO
RO
IL4
421
7<
12
<1
8<
1C
HE
NO
POD
IUM
AM
BR
OSI
OD
ES
NE
AR
AM
BR
OSI
OD
ES
00
20,3
3010
,336
7,89
710
,231
20,2
6117
,504
12,8
65
CH
ITO
SAN
00
00
00
00
0C
HR
OM
OB
AC
TE
RIU
MSU
BT
SUG
AE
STR
AIN
PRA
A4-
10
00
00
1,16
930
,262
46,4
1845
,880
CIN
NA
MA
LD
EH
YD
E3
354
00
10
00
0C
ITR
ICA
CID
41,2
4957
,279
56,0
8674
,788
83,3
7394
,180
127,
756
116,
452
124,
321
CL
AR
IFIE
DH
YD
RO
PHO
BIC
EX
TR
AC
TO
FN
EE
MO
IL11
0,88
110
4,82
210
6,27
111
5,93
171
,133
77,2
5711
9,29
819
7,72
322
2,74
1
CO
DL
ING
MO
TH
GR
AN
UL
OSI
SV
IRU
S<
1<
1<
1<
1<
1<
1<
1<
1<
1C
ON
IOT
HY
RIU
MM
INIT
AN
SST
RA
INC
ON
/M/9
1-08
60
127
8017
624
561
164
177
9
CO
RN
GL
UT
EN
ME
AL
0<
10
00
00
00
CO
RN
SYR
UP
811,
893
2,89
13,
026
4,37
74,
766
3,21
63,
344
4,34
2
54

Tabl
e17
:(co
ntin
ued)
The
repo
rted
poun
dsof
pest
icid
esus
edth
atar
ebi
opes
ticid
es.B
iope
stic
ides
incl
ude
mic
roor
gani
sms
and
natu
rally
occu
rrin
gco
mpo
unds
,or
com
poun
dses
sent
ially
iden
tical
tona
tura
llyoc
curr
ing
com
poun
dsth
atar
eno
ttox
icto
the
targ
etpe
st(s
uch
asph
erom
ones
).
AI
2007
2008
2009
2010
2011
2012
2013
2014
2015
CO
YO
TE
UR
INE
00
0<
11
23
96
CY
TOK
ININ
00
00
<1
<1
<1
<1
<1
DIH
YD
RO
-5-H
EPT
YL
-2(3
H)-
FUR
AN
ON
E<
1<
1<
1<
10
00
00
DIH
YD
RO
-5-P
EN
TY
L-2
(3H
)-FU
RA
NO
NE
<1
<1
<1
<1
00
00
0E
,E-8
,10-
DO
DE
CA
DIE
N-1
-OL
2,27
32,
037
4,97
81,
942
1,37
61,
995
2,21
61,
401
1,45
1E
-11-
TE
TR
AD
EC
EN
-1-Y
LA
CE
TAT
E2,
399
744
312
100
172
133
142
6148
E-8
-DO
DE
CE
NY
LA
CE
TAT
E23
626
560
689
819
227
227
322
423
3E
NC
APS
UL
AT
ED
DE
LTA
EN
DO
TOX
INO
FB
AC
ILL
US
TH
UR
ING
IEN
SIS
VAR
.K
UR
STA
KII
NK
ILL
ED
PSE
UD
OM
ON
AS
FLU
OR
ESC
EN
S
3218
180
1<
10
00
EN
CA
PSU
LA
TE
DD
ELT
AE
ND
OTO
XIN
OF
BA
CIL
LU
ST
HU
RIN
GIE
NSI
SVA
R.
SAN
DIE
GO
INK
ILL
ED
PSE
UD
OM
ON
AS
FLU
OR
ESC
EN
S
00
00
00
00
0
ESS
EN
TIA
LO
ILS
<1
0<
1<
1<
11
<1
1512
ET
HY
LE
NE
00
097
1,01
895
41,
859
1,28
21,
651
EU
CA
LYPT
US
OIL
00
022
<1
00
00
EU
GE
NO
L0
00
00
1<
11
<1
FAR
NE
SOL
22
310
511
2117
20FE
NU
GR
EE
K31
617
15
82
17
FER
RIC
SOD
IUM
ED
TA0
00
01,
979
6,35
15,
855
6,79
07,
993
FISH
OIL
00
00
1,65
75,
466
4,11
40
0FO
RM
ICA
CID
1,50
949
928
022
324
163
477
341
2,59
0FO
XU
RIN
E0
00
<1
<1
21
43
GA
MM
AA
MIN
OB
UT
YR
ICA
CID
1,93
694
417
711
840
133
2815
15G
AR
LIC
142
212
3642
329
1,90
52,
832
1,39
266
7G
ER
AN
IOL
01
523
1228
5442
49G
ER
MA
NC
OC
KR
OA
CH
PHE
RO
MO
NE
<1
<1
<1
<1
<1
<1
<1
<1
0G
IBB
ER
EL
LIN
S25
,083
23,5
1622
,916
21,3
8121
,288
22,6
8240
,849
27,3
4126
,894
GIB
BE
RE
LL
INS,
POTA
SSIU
MSA
LT<
1<
10
<1
<1
50
00
GL
IOC
LA
DIU
MV
IRE
NS
GL
-21
(SPO
RE
S)15
294
535
694
564
91,
957
3,53
82,
989
4,38
7
GL
UTA
MIC
AC
ID1,
936
944
177
118
4013
328
1515
HA
RPI
NPR
OT
EIN
3216
1413
111
1<
10
HE
PTY
LB
UT
YR
AT
E0
00
<1
<1
<1
146
4H
YD
RO
GE
NPE
RO
XID
E11
,860
20,7
4021
,750
69,1
7959
,384
36,3
0347
,214
49,6
9275
,467
HY
DR
OPR
EN
E2,
282
2,38
31,
664
6,38
211
,261
3,94
87,
351
5,73
26,
450
IBA
2011
67
912
1513
13IN
DO
LE
00
00
00
<1
0<
1
55
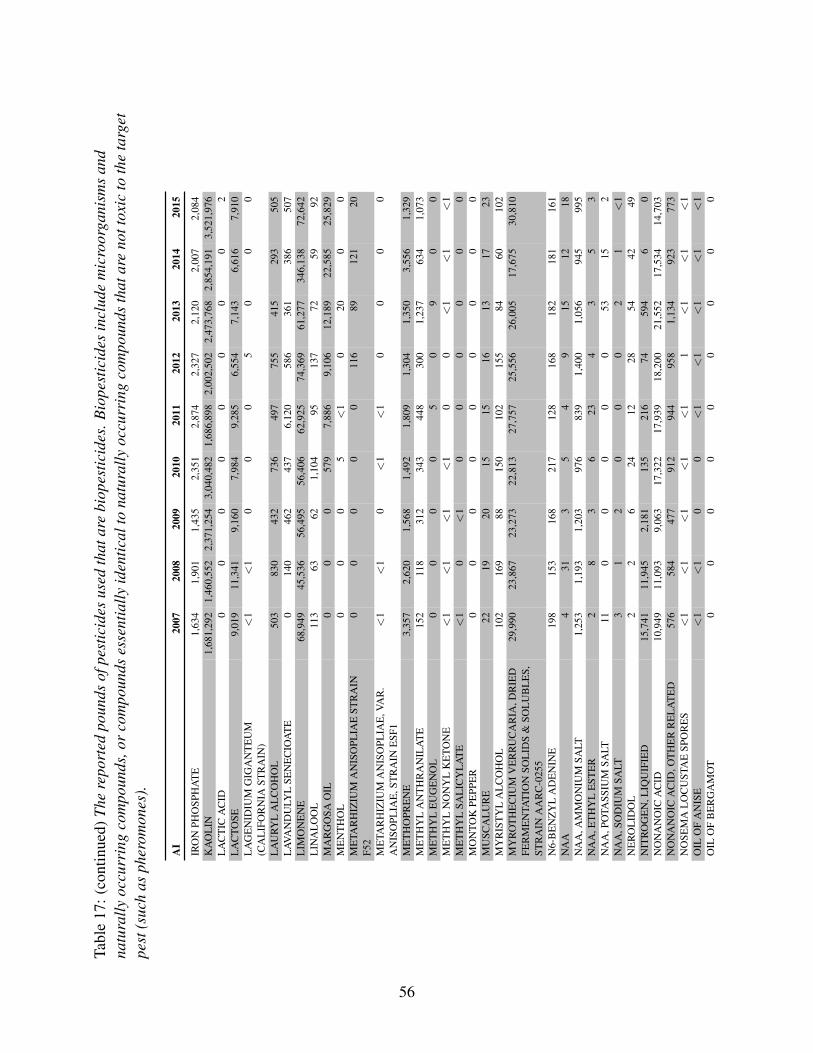
Tabl
e17
:(co
ntin
ued)
The
repo
rted
poun
dsof
pest
icid
esus
edth
atar
ebi
opes
ticid
es.B
iope
stic
ides
incl
ude
mic
roor
gani
sms
and
natu
rally
occu
rrin
gco
mpo
unds
,or
com
poun
dses
sent
ially
iden
tical
tona
tura
llyoc
curr
ing
com
poun
dsth
atar
eno
ttox
icto
the
targ
etpe
st(s
uch
asph
erom
ones
).
AI
2007
2008
2009
2010
2011
2012
2013
2014
2015
IRO
NPH
OSP
HA
TE
1,63
41,
901
1,43
52,
351
2,87
42,
327
2,12
02,
007
2,08
4K
AO
LIN
1,68
1,29
21,
460,
552
2,37
1,25
43,
040,
482
1,68
6,89
82,
002,
502
2,47
3,76
82,
854,
191
3,52
1,97
6L
AC
TIC
AC
ID0
00
00
00
02
LA
CTO
SE9,
019
11,3
419,
160
7,98
49,
285
6,55
47,
143
6,61
67,
910
LA
GE
NID
IUM
GIG
AN
TE
UM
(CA
LIF
OR
NIA
STR
AIN
)<
1<
10
00
50
00
LA
URY
LA
LC
OH
OL
503
830
432
736
497
755
415
293
505
LAV
AN
DU
LYL
SEN
EC
IOA
TE
014
046
243
76,
120
586
361
386
507
LIM
ON
EN
E68
,949
45,5
3656
,495
56,4
0662
,925
74,3
6961
,277
346,
138
72,6
42L
INA
LO
OL
113
6362
1,10
495
137
7259
92M
AR
GO
SAO
IL0
00
579
7,88
69,
106
12,1
8922
,585
25,8
29M
EN
TH
OL
00
05
<1
020
00
ME
TAR
HIZ
IUM
AN
ISO
PLIA
EST
RA
INF5
20
00
00
116
8912
120
ME
TAR
HIZ
IUM
AN
ISO
PLIA
E,V
AR
.A
NIS
OPL
IAE
,ST
RA
INE
SF1
<1
<1
0<
1<
10
00
0
ME
TH
OPR
EN
E3,
357
2,62
01,
568
1,49
21,
809
1,30
41,
350
3,55
61,
329
ME
TH
YL
AN
TH
RA
NIL
AT
E15
211
831
234
344
830
01,
237
634
1,07
3M
ET
HY
LE
UG
EN
OL
00
00
50
90
0M
ET
HY
LN
ON
YL
KE
TON
E<
1<
1<
1<
10
0<
1<
1<
1M
ET
HY
LSA
LIC
YL
AT
E<
10
<1
00
00
00
MO
NTO
KPE
PPE
R0
00
00
00
00
MU
SCA
LU
RE
2219
2015
1516
1317
23M
YR
IST
YL
AL
CO
HO
L10
216
988
150
102
155
8460
102
MY
RO
TH
EC
IUM
VE
RR
UC
AR
IA,D
RIE
DFE
RM
EN
TAT
ION
SOL
IDS
&SO
LU
BL
ES,
STR
AIN
AA
RC
-025
5
29,9
9023
,867
23,2
7322
,813
27,7
5725
,556
26,0
0517
,675
30,8
10
N6-
BE
NZ
YL
AD
EN
INE
198
153
168
217
128
168
182
181
161
NA
A4
313
54
915
1218
NA
A,A
MM
ON
IUM
SALT
1,25
31,
193
1,20
397
683
91,
400
1,05
694
599
5N
AA
,ET
HY
LE
STE
R2
83
623
43
53
NA
A,P
OTA
SSIU
MSA
LT11
00
00
053
152
NA
A,S
OD
IUM
SALT
31
20
00
21
<1
NE
RO
LID
OL
22
624
1228
5442
49N
ITR
OG
EN
,LIQ
UIF
IED
15,7
4111
,945
2,18
113
521
674
594
60
NO
NA
NO
ICA
CID
10,9
4911
,093
9,06
317
,322
17,9
3918
,200
21,5
5217
,534
14,7
03N
ON
AN
OIC
AC
ID,O
TH
ER
RE
LA
TE
D57
658
447
791
294
495
81,
134
923
773
NO
SEM
AL
OC
UST
AE
SPO
RE
S<
1<
1<
1<
1<
11
<1
<1
<1
OIL
OF
AN
ISE
<1
<1
00
<1
<1
<1
<1
<1
OIL
OF
BE
RG
AM
OT
00
00
00
00
0
56

Tabl
e17
:(co
ntin
ued)
The
repo
rted
poun
dsof
pest
icid
esus
edth
atar
ebi
opes
ticid
es.B
iope
stic
ides
incl
ude
mic
roor
gani
sms
and
natu
rally
occu
rrin
gco
mpo
unds
,or
com
poun
dses
sent
ially
iden
tical
tona
tura
llyoc
curr
ing
com
poun
dsth
atar
eno
ttox
icto
the
targ
etpe
st(s
uch
asph
erom
ones
).
AI
2007
2008
2009
2010
2011
2012
2013
2014
2015
OIL
OF
BL
AC
KPE
PPE
R<
1<
11
<1
<1
<1
11
<1
OIL
OF
CE
DA
RW
OO
D0
00
<1
00
00
<1
OIL
OF
CIT
RO
NE
LL
A<
13
05
460
01
5O
ILO
FC
ITR
US
00
00
00
00
0O
ILO
FG
ER
AN
IUM
00
0<
10
00
00
OIL
OF
JOJO
BA
7,24
012
,070
3,41
84,
176
1,23
250
713
437
644
OIL
OF
LE
MO
NE
UC
ALY
PTU
S0
00
0<
13
00
0O
ILO
FL
EM
ON
GR
ASS
00
00
00
00
0O
ILO
FM
UST
AR
D0
00
00
00
00
OIL
OF
PEPP
ER
MIN
T<
1<
10
<1
00
00
0O
XY
PUR
INO
L<
10
00
00
0<
10
PAE
CIL
OM
YC
ES
FUM
OSO
RO
SEU
SA
POPK
AST
RA
IN97
00
00
050
73,
302
5,95
05,
624
PAE
CIL
OM
YC
ES
LIL
AC
INU
SST
RA
IN25
10
00
252
515
840
4,07
35,
031
6,40
8
PAN
TOE
AA
GG
LO
ME
RA
NS
STR
AIN
E32
5,N
RR
LB
-218
560
033
41
11
00
PER
FUM
E0
00
00
00
00
PHE
NY
LE
TH
YL
PRO
PIO
NA
TE
326
502
500
822
423
535
701
712
185
POLY
HE
DR
AL
OC
CL
USI
ON
BO
DIE
S(O
B’S
)OF
TH
EN
UC
LE
AR
POLY
HE
DR
OSI
SV
IRU
SO
FH
EL
ICO
VE
RPA
ZE
A(C
OR
NE
AR
WO
RM
)
0<
11
151
61
24
POLY
OX
IND
,ZIN
CSA
LT23
433
139
71,
296
3,51
34,
738
6,73
17,
411
8,60
2PO
TASS
IUM
BIC
AR
BO
NA
TE
114,
163
109,
171
180,
858
275,
648
358,
200
228,
917
239,
681
223,
547
317,
642
POTA
SSIU
MPH
OSP
HIT
E18
9,51
218
2,37
614
1,39
528
7,73
027
9,89
628
1,60
239
0,25
370
8,83
166
3,96
8PO
TASS
IUM
SOR
BA
TE
743
0<
165
00
00
0PR
OPY
LE
NE
GLY
CO
L28
,505
24,1
3225
,792
54,2
3348
,127
58,4
6285
,788
89,5
9585
,719
PSE
UD
OM
ON
AS
FLU
OR
ESC
EN
S,ST
RA
INA
506
614
390
328
217
274
5992
270
87
PSE
UD
OM
ON
AS
SYR
ING
AE
STR
AIN
ESC
-11
00
00
00
00
0
PSE
UD
OM
ON
AS
SYR
ING
AE
,ST
RA
INE
SC-1
00
00
<1
00
30
0
PUT
RE
SCE
NT
WH
OL
EE
GG
SOL
IDS
201
143
31
11
11
PYT
HIU
MO
LIG
AN
DR
UM
DV
740
00
0<
1<
1<
10
0Q
ST71
3ST
RA
INO
FD
RIE
DB
AC
ILL
US
SUB
TIL
IS17
,337
16,7
0316
,175
21,4
6423
,962
23,5
0324
,577
20,9
5221
,047
QU
ILL
AJA
276
1,18
341
068
21,
081
785
1,03
177
382
9R
EY
NO
UT
RIA
SAC
HA
LIN
EN
SIS
00
179
8,99
614
,843
14,8
0315
,332
16,0
9918
,310
57

Tabl
e17
:(co
ntin
ued)
The
repo
rted
poun
dsof
pest
icid
esus
edth
atar
ebi
opes
ticid
es.B
iope
stic
ides
incl
ude
mic
roor
gani
sms
and
natu
rally
occu
rrin
gco
mpo
unds
,or
com
poun
dses
sent
ially
iden
tical
tona
tura
llyoc
curr
ing
com
poun
dsth
atar
eno
ttox
icto
the
targ
etpe
st(s
uch
asph
erom
ones
).
AI
2007
2008
2009
2010
2011
2012
2013
2014
2015
S-A
BSC
ISIC
AC
ID0
766
864
1,85
22,
651
2,13
12,
345
2,11
4S-
ME
TH
OPR
EN
E1,
726
3,52
03,
284
3,92
12,
313
2,32
42,
331
2,52
42,
485
SAL
ICY
LIC
AC
ID0
00
00
00
00
SAW
DU
ST<
11
<1
10
44
00
SESA
ME
OIL
883
529
851
1,30
91,
327
15<
10
0SI
LVE
RN
ITR
AT
E0
00
<1
<1
<1
00
0SO
DIU
MB
ICA
RB
ON
AT
E0
6727
351
514
644
479
420
SOD
IUM
CH
LO
RID
E71
54
32
169
124
119
211
216
SOD
IUM
LA
URY
LSU
LFA
TE
400
340
146
9645
888
443
157
01,
748
SOY
BE
AN
OIL
14,7
4712
,005
28,3
5924
,110
24,1
0922
,022
45,9
7359
,297
70,2
08ST
RE
PTO
MY
CE
SG
RIS
EO
VIR
IDIS
STR
AIN
K61
<1
<1
<1
<1
<1
<1
1011
18
STR
EPT
OM
YC
ES
LYD
ICU
SW
YE
C10
8<
1<
11
21
23
33
SUC
RO
SEO
CTA
NO
AT
E0
1,68
54,
003
1,12
823
055
188
9820
3T
HY
ME
485
593
775
1,31
166
584
41,
135
1,15
025
7T
HY
MO
L28
952
31,
675
1,53
926
518
139
831
427
8T
RIC
HO
DE
RM
AH
AR
ZIA
NU
MR
IFA
IST
RA
INK
RL
-AG
238
2011
504
129
158
184
8665
TR
ICH
OD
ER
MA
ICC
012
ASP
ER
EL
LU
M0
00
013
1943
22
TR
ICH
OD
ER
MA
ICC
080
GA
MSI
I0
00
013
1943
22
UL
OC
LA
DIU
MO
UD
EM
AN
SII(
U3
STR
AIN
)0
00
00
029
792
516
VAN
ILL
IN5
13
<1
11
<1
<1
1V
EG
ETA
BL
EO
IL15
4,12
827
0,37
519
6,07
832
3,40
151
4,88
427
6,27
831
5,21
826
7,44
648
2,13
7X
AN
TH
INE
<1
00
00
00
<1
0X
AN
TH
OM
ON
AS
CA
MPE
STR
ISPV
.PO
AN
NU
A0
00
00
00
00
YE
AST
1,03
099
992
647
01,
165
818
8032
86Y
UC
CA
SCH
IDIG
ER
A0
716
963
41,
649
7,14
711
,682
5,65
12,
565
Z,E
-9,1
2-T
ET
RA
DE
CA
DIE
N-1
-YL
AC
ETA
TE
10
6,14
91
76
1412
220
Z-1
1-T
ET
RA
DE
CE
N-1
-YL
AC
ETA
TE
228
99
94
88
<1
<1
Z-8
-DO
DE
CE
NO
L41
4610
615
733
4644
3840
Z-8
-DO
DE
CE
NY
LA
CE
TAT
E3,
647
4,05
19,
262
13,9
642,
948
3,83
63,
467
3,24
83,
548
Z-9
-TE
TR
AD
EC
EN
-1-O
L0
00
00
00
00
TOTA
L2,
930,
512
2,84
6,33
03,
727,
852
4,90
3,06
53,
811,
139
3,89
0,77
34,
711,
114
5,84
8,81
16,
618,
734
58
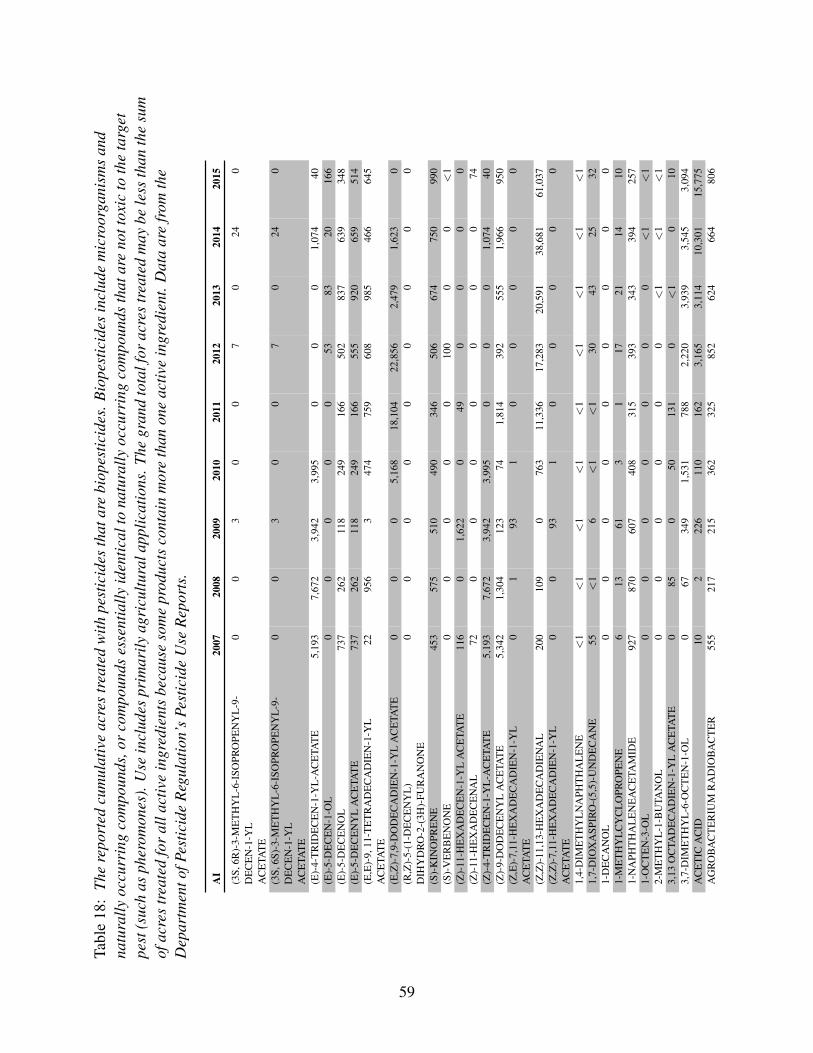
Tabl
e18
:Th
ere
port
edcu
mul
ativ
eac
res
trea
ted
with
pest
icid
esth
atar
ebi
opes
ticid
es.B
iope
stic
ides
incl
ude
mic
roor
gani
sms
and
natu
rally
occu
rrin
gco
mpo
unds
,or
com
poun
dses
sent
ially
iden
tical
tona
tura
llyoc
curr
ing
com
poun
dsth
atar
eno
ttox
icto
the
targ
etpe
st(s
uch
asph
erom
ones
).U
sein
clud
espr
imar
ilyag
ricu
ltura
lapp
licat
ions
.The
gran
dto
talf
orac
res
trea
ted
may
bele
ssth
anth
esu
mof
acre
str
eate
dfo
ral
lact
ive
ingr
edie
nts
beca
use
som
epr
oduc
tsco
ntai
nm
ore
than
one
activ
ein
gred
ient
.Dat
aar
efr
omth
eD
epar
tmen
tofP
estic
ide
Reg
ulat
ion’
sPe
stic
ide
Use
Rep
orts
.
AI
2007
2008
2009
2010
2011
2012
2013
2014
2015
(3S,
6R)-
3-M
ET
HY
L-6
-ISO
PRO
PEN
YL
-9-
DE
CE
N-1
-YL
AC
ETA
TE
00
30
07
024
0
(3S,
6S)-
3-M
ET
HY
L-6
-ISO
PRO
PEN
YL
-9-
DE
CE
N-1
-YL
AC
ETA
TE
00
30
07
024
0
(E)-
4-T
RID
EC
EN
-1-Y
L-A
CE
TAT
E5,
193
7,67
23,
942
3,99
50
00
1,07
440
(E)-
5-D
EC
EN
-1-O
L0
00
00
5383
2016
6(E
)-5-
DE
CE
NO
L73
726
211
824
916
650
283
763
934
8(E
)-5-
DE
CE
NY
LA
CE
TAT
E73
726
211
824
916
655
592
065
951
4(E
,E)-
9,11
-TE
TR
AD
EC
AD
IEN
-1-Y
LA
CE
TAT
E22
956
347
475
960
898
546
664
5
(E,Z
)-7,
9-D
OD
EC
AD
IEN
-1-Y
LA
CE
TAT
E0
00
5,16
818
,104
22,8
562,
479
1,62
30
(R,Z
)-5-
(1-D
EC
EN
YL
)D
IHY
DR
O-2
-(3H
)-FU
RA
NO
NE
00
00
00
00
0
(S)-
KIN
OPR
EN
E45
357
551
049
034
650
667
475
099
0(S
)-V
ER
BE
NO
NE
00
00
010
00
0<
1(Z
)-11
-HE
XA
DE
CE
N-1
-YL
AC
ETA
TE
116
01,
622
049
00
00
(Z)-
11-H
EX
AD
EC
EN
AL
720
00
00
00
74(Z
)-4-
TR
IDE
CE
N-1
-YL
-AC
ETA
TE
5,19
37,
672
3,94
23,
995
00
01,
074
40(Z
)-9-
DO
DE
CE
NY
LA
CE
TAT
E5,
342
1,30
412
374
1,81
439
255
51,
966
950
(Z,E
)-7,
11-H
EX
AD
EC
AD
IEN
-1-Y
LA
CE
TAT
E0
193
10
00
00
(Z,Z
)-11
,13-
HE
XA
DE
CA
DIE
NA
L20
010
90
763
11,3
3617
,283
20,5
9138
,681
61,0
37(Z
,Z)-
7,11
-HE
XA
DE
CA
DIE
N-1
-YL
AC
ETA
TE
00
931
00
00
0
1,4-
DIM
ET
HY
LN
APH
TH
AL
EN
E<
1<
1<
1<
1<
1<
1<
1<
1<
11,
7-D
IOX
ASP
IRO
-(5,
5)-U
ND
EC
AN
E55
<1
6<
1<
130
4325
321-
DE
CA
NO
L0
00
00
00
00
1-M
ET
HY
LC
YC
LO
PRO
PEN
E6
1361
31
1721
1410
1-N
APH
TH
AL
EN
EA
CE
TAM
IDE
927
870
607
408
315
393
343
394
257
1-O
CT
EN
-3-O
L0
00
00
00
<1
<1
2-M
ET
HY
L-1
-BU
TAN
OL
00
00
00
<1
<1
<1
3,13
OC
TAD
EC
AD
IEN
-1-Y
LA
CE
TAT
E0
850
5013
10
<1
010
3,7-
DIM
ET
HY
L-6
-OC
TE
N-1
-OL
067
349
1,53
178
82,
220
3,93
93,
545
3,09
4A
CE
TIC
AC
ID10
222
611
016
23,
165
3,11
410
,301
15,7
75A
GR
OB
AC
TE
RIU
MR
AD
IOB
AC
TE
R55
521
721
536
232
585
262
466
480
6
59

Tabl
e18
:(co
ntin
ued)
The
repo
rted
cum
ulat
ive
acre
str
eate
dw
ithpe
stic
ides
that
are
biop
estic
ides
.Bio
pest
icid
esin
clud
em
icro
orga
nism
san
dna
tura
llyoc
curr
ing
com
poun
ds,o
rco
mpo
unds
esse
ntia
llyid
entic
alto
natu
rally
occu
rrin
gco
mpo
unds
that
are
not
toxi
cto
the
targ
etpe
st(s
uch
asph
erom
ones
).
AI
2007
2008
2009
2010
2011
2012
2013
2014
2015
AG
RO
BA
CT
ER
IUM
RA
DIO
BA
CT
ER
,ST
RA
INK
1026
366
1,93
55,
086
8119
4,94
79,
016
754
745
AL
LYL
ISO
TH
IOC
YAN
AT
E0
00
00
<1
00
0A
LM
ON
D,B
ITT
ER
2,06
887
471
7441
227
188
6873
AM
INO
ET
HO
XY
VIN
YL
GLY
CIN
EH
YD
RO
CH
LO
RID
E9,
238
10,2
535,
611
10,1
7911
,108
14,9
9116
,371
17,6
6620
,039
AM
MO
NIU
MB
ICA
RB
ON
AT
E55
<1
6<
1<
130
4325
32A
MM
ON
IUM
NIT
RA
TE
503,
230
643,
869
679,
675
726,
842
817,
273
867,
336
1,08
5,58
495
3,19
498
7,51
7A
MPE
LO
MY
CE
SQ
UIS
QU
AL
IS14
022
20
00
00
AN
IMA
LG
LA
ND
EX
TR
AC
TS
00
00
00
00
0A
SPE
RG
ILL
US
FLAV
US
STR
AIN
AF3
60
00
026
048
,833
89,3
3714
7,01
115
9,03
6A
UR
EO
BA
SID
IUM
PUL
LU
LA
NS
STR
AIN
DSM
1494
00
00
00
025
42,
823
1,56
0
AU
RE
OB
ASI
DIU
MPU
LL
UL
AN
SST
RA
IND
SM14
941
00
00
00
254
2,82
31,
560
AZ
AD
IRA
CH
TIN
91,3
8586
,813
82,6
5271
,707
70,2
2898
,809
113,
934
159,
345
193,
785
BA
CIL
LU
SA
MY
LO
LIQ
UE
FAC
IEN
SST
RA
IND
747
00
00
02,
337
29,6
8441
,678
38,5
41
BA
CIL
LU
SFI
RM
US
(ST
RA
INI-
1582
)0
00
00
00
1245
BA
CIL
LU
SPO
PIL
LIA
E0
00
00
0<
1<
1<
1B
AC
ILL
US
PUM
ILU
S,ST
RA
INQ
ST28
0879
,795
91,7
9575
,509
72,5
8284
,276
76,2
2668
,102
83,3
8689
,263
BA
CIL
LU
SSP
HA
ER
ICU
S,SE
RO
TY
PEH
-5A
5B,S
TR
AIN
2362
<1
<1
<1
9<
123
138
110
118
BA
CIL
LU
SSU
BT
ILIS
GB
032
52
<1
6<
120
302
467
BA
CIL
LU
SSU
BT
ILIS
MB
I600
00
00
02
<1
00
BA
CIL
LU
SSU
BT
ILIS
VAR
.A
MY
LO
LIQ
UE
FAC
IEN
SST
RA
INFZ
B24
00
00
040
61,
702
3,51
64,
328
BA
CIL
LU
ST
HU
RIN
GIE
NSI
S(B
ER
LIN
ER
)1,
129
4182
127
877
292
258
9124
1
BA
CIL
LU
ST
HU
RIN
GIE
NSI
S(B
ER
LIN
ER
),SU
BSP
.AIZ
AW
AI,
GC
-91
PRO
TE
IN
53,0
4040
,440
48,8
4240
,395
18,6
5725
,262
22,5
1128
,611
26,2
45
BA
CIL
LU
ST
HU
RIN
GIE
NSI
S(B
ER
LIN
ER
),SU
BSP
.AIZ
AW
AI,
SER
OT
YPE
H-7
24,3
7920
,510
7,88
86,
943
7,80
06,
221
3,29
62,
941
1,34
8
BA
CIL
LU
ST
HU
RIN
GIE
NSI
S(B
ER
LIN
ER
),SU
BSP
.ISR
AE
LE
NSI
S,SE
RO
TY
PEH
-14
833
4,71
950
11,
873
337
773
1,11
01,
254
1,71
3
60
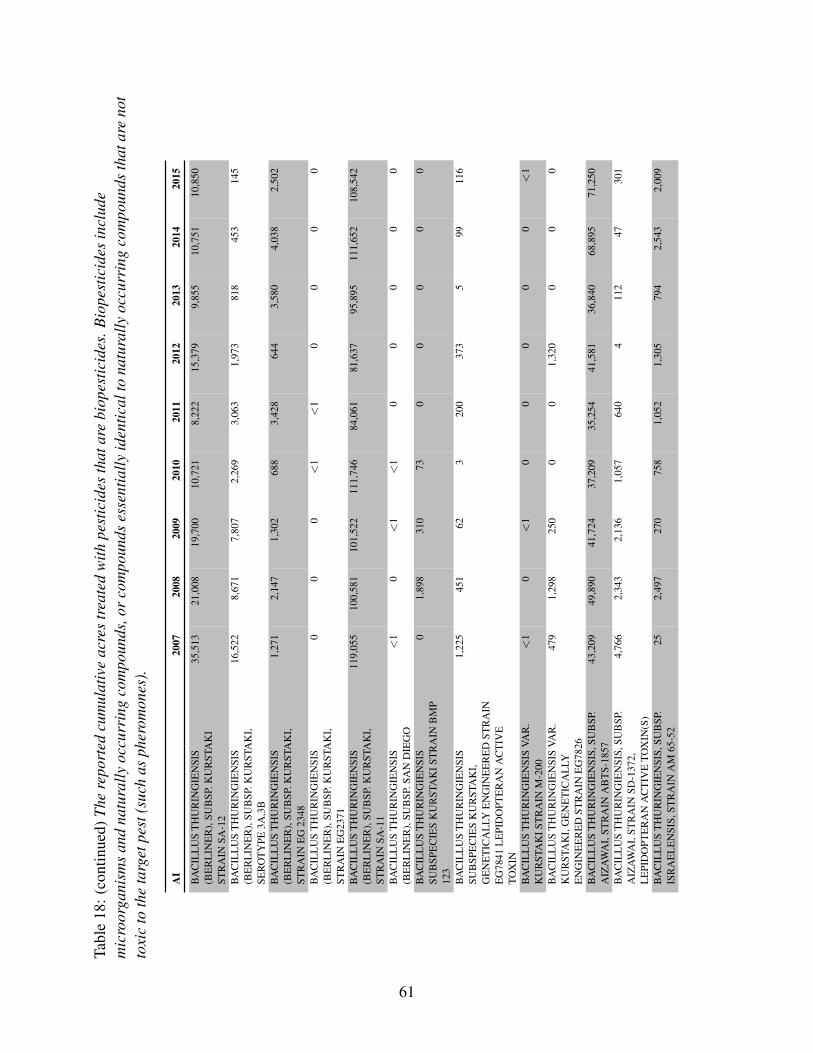
Tabl
e18
:(co
ntin
ued)
The
repo
rted
cum
ulat
ive
acre
str
eate
dw
ithpe
stic
ides
that
are
biop
estic
ides
.Bio
pest
icid
esin
clud
em
icro
orga
nism
san
dna
tura
llyoc
curr
ing
com
poun
ds,o
rco
mpo
unds
esse
ntia
llyid
entic
alto
natu
rally
occu
rrin
gco
mpo
unds
that
are
not
toxi
cto
the
targ
etpe
st(s
uch
asph
erom
ones
).
AI
2007
2008
2009
2010
2011
2012
2013
2014
2015
BA
CIL
LU
ST
HU
RIN
GIE
NSI
S(B
ER
LIN
ER
),SU
BSP
.KU
RST
AK
IST
RA
INSA
-12
35,5
1321
,008
19,7
0010
,721
8,22
215
,379
9,85
510
,751
10,8
50
BA
CIL
LU
ST
HU
RIN
GIE
NSI
S(B
ER
LIN
ER
),SU
BSP
.KU
RST
AK
I,SE
RO
TY
PE3A
,3B
16,5
228,
671
7,80
72,
269
3,06
31,
973
818
453
145
BA
CIL
LU
ST
HU
RIN
GIE
NSI
S(B
ER
LIN
ER
),SU
BSP
.KU
RST
AK
I,ST
RA
INE
G23
48
1,27
12,
147
1,30
268
83,
428
644
3,58
04,
038
2,50
2
BA
CIL
LU
ST
HU
RIN
GIE
NSI
S(B
ER
LIN
ER
),SU
BSP
.KU
RST
AK
I,ST
RA
INE
G23
71
00
0<
1<
10
00
0
BA
CIL
LU
ST
HU
RIN
GIE
NSI
S(B
ER
LIN
ER
),SU
BSP
.KU
RST
AK
I,ST
RA
INSA
-11
119,
055
100,
581
101,
522
111,
746
84,0
6181
,637
95,8
9511
1,65
210
8,54
2
BA
CIL
LU
ST
HU
RIN
GIE
NSI
S(B
ER
LIN
ER
),SU
BSP
.SA
ND
IEG
O<
10
<1
<1
00
00
0
BA
CIL
LU
ST
HU
RIN
GIE
NSI
SSU
BSP
EC
IES
KU
RST
AK
IST
RA
INB
MP
123
01,
898
310
730
00
00
BA
CIL
LU
ST
HU
RIN
GIE
NSI
SSU
BSP
EC
IES
KU
RST
AK
I,G
EN
ET
ICA
LLY
EN
GIN
EE
RE
DST
RA
INE
G78
41L
EPI
DO
PTE
RA
NA
CT
IVE
TOX
IN
1,22
545
162
320
037
35
9911
6
BA
CIL
LU
ST
HU
RIN
GIE
NSI
SVA
R.
KU
RST
AK
IST
RA
INM
-200
<1
0<
10
00
00
<1
BA
CIL
LU
ST
HU
RIN
GIE
NSI
SVA
R.
KU
RST
AK
I,G
EN
ET
ICA
LLY
EN
GIN
EE
RE
DST
RA
INE
G78
26
479
1,29
825
00
01,
320
00
0
BA
CIL
LU
ST
HU
RIN
GIE
NSI
S,SU
BSP
.A
IZA
WA
I,ST
RA
INA
BT
S-18
5743
,209
49,8
9041
,724
37,2
0935
,254
41,5
8136
,840
68,8
9571
,250
BA
CIL
LU
ST
HU
RIN
GIE
NSI
S,SU
BSP
.A
IZA
WA
I,ST
RA
INSD
-137
2,L
EPI
DO
PTE
RA
NA
CT
IVE
TOX
IN(S
)
4,76
62,
343
2,13
61,
057
640
411
247
301
BA
CIL
LU
ST
HU
RIN
GIE
NSI
S,SU
BSP
.IS
RA
EL
EN
SIS,
STR
AIN
AM
65-5
225
2,49
727
075
81,
052
1,30
579
42,
543
2,00
9
61

Tabl
e18
:(co
ntin
ued)
The
repo
rted
cum
ulat
ive
acre
str
eate
dw
ithpe
stic
ides
that
are
biop
estic
ides
.Bio
pest
icid
esin
clud
em
icro
orga
nism
san
dna
tura
llyoc
curr
ing
com
poun
ds,o
rco
mpo
unds
esse
ntia
llyid
entic
alto
natu
rally
occu
rrin
gco
mpo
unds
that
are
not
toxi
cto
the
targ
etpe
st(s
uch
asph
erom
ones
).
AI
2007
2008
2009
2010
2011
2012
2013
2014
2015
BA
CIL
LU
ST
HU
RIN
GIE
NSI
S,SU
BSP
.K
UR
STA
KI,
STR
AIN
AB
TS-
351,
FER
ME
NTA
TIO
NSO
LID
SA
ND
SOL
UB
LE
S
133,
297
134,
290
120,
661
162,
444
152,
463
164,
936
147,
824
192,
441
153,
587
BA
CIL
LU
ST
HU
RIN
GIE
NSI
S,SU
BSP
.K
UR
STA
KI,
STR
AIN
HD
-120
,045
15,1
7320
,295
18,4
6515
,940
15,2
2810
,138
7,88
711
,084
BA
CIL
LU
ST
HU
RIN
GIE
NSI
S,VA
R.
KU
RST
AK
IDE
LTA
EN
DO
TOX
INS
CRY
1A(C
)AN
DC
RY1C
(GE
NE
TIC
AL
LYE
NG
INE
ER
ED
)EN
CA
PSU
LA
TE
DIN
PSE
UD
OM
ON
AS
FLU
OR
ESC
EN
S(K
ILL
ED
)
<1
2552
2<
110
0<
10
BA
CT
ER
IOPH
AG
EA
CT
IVE
AG
AIN
STX
AN
TH
OM
ON
AS
CA
MPE
STR
ISPV
.V
ESI
CA
TOR
IAA
ND
PSE
UD
OM
ON
AS
SYR
ING
AE
PV.T
OM
ATO
00
00
1125
2112
0
BA
LSA
MFI
RO
IL0
00
<1
0<
1<
1<
1<
1B
EA
UV
ER
IAB
ASS
IAN
AST
RA
ING
HA
2,48
12,
091
2,18
81,
686
2,70
64,
012
6,85
710
,900
14,2
29B
UFF
AL
OG
OU
RD
RO
OT
POW
DE
R1,
694
3,22
78
138
025
161
200
224
BU
RK
HO
LD
ER
IASP
STR
AIN
A39
6C
EL
LS
AN
DFE
RM
EN
TAT
ION
ME
DIA
00
00
00
019
65,
528
CA
ND
IDA
OL
EO
PHIL
AIS
OL
AT
EI-
182
00
00
00
00
0C
AN
OL
AO
IL33
1,38
81,
541
4,78
63,
872
2,32
95,
791
4,27
27,
455
CA
PSIC
UM
OL
EO
RE
SIN
277
528
325
388
238
576
546
1,57
61,
997
CA
RB
ON
DIO
XID
E<
1<
1<
1<
126
917
520
19C
AST
OR
OIL
<1
412
<1
<1
<1
<1
<1
<1
CH
EN
OPO
DIU
MA
MB
RO
SIO
DE
SN
EA
RA
MB
RO
SIO
DE
S0
06,
355
9,26
56,
868
13,4
0122
,552
25,8
2019
,112
CH
ITO
SAN
00
00
00
00
0C
HR
OM
OB
AC
TE
RIU
MSU
BT
SUG
AE
STR
AIN
PRA
A4-
10
00
00
1,42
438
,138
61,1
9162
,444
CIN
NA
MA
LD
EH
YD
E2
556
00
<1
00
00
CIT
RIC
AC
ID81
5,76
691
9,73
690
3,19
81,
204,
981
1,33
1,91
31,
389,
851
1,54
2,33
21,
686,
289
1,92
1,43
1C
LA
RIF
IED
HY
DR
OPH
OB
ICE
XT
RA
CT
OF
NE
EM
OIL
71,2
7864
,156
47,4
2242
,281
40,7
7042
,615
60,2
1185
,393
88,1
72
CO
DL
ING
MO
TH
GR
AN
UL
OSI
SV
IRU
S2,
141
1,48
71,
139
984
3,46
83,
431
4,33
94,
510
3,67
7C
ON
IOT
HY
RIU
MM
INIT
AN
SST
RA
INC
ON
/M/9
1-08
120
01,
204
395
1,10
71,
697
4,28
64,
886
6,15
9
CO
RN
GL
UT
EN
ME
AL
03
00
00
00
0C
OR
NSY
RU
P1,
132
7,99
114
,316
12,8
7727
,721
27,7
6015
,992
14,2
0718
,817
62

Tabl
e18
:(co
ntin
ued)
The
repo
rted
cum
ulat
ive
acre
str
eate
dw
ithpe
stic
ides
that
are
biop
estic
ides
.Bio
pest
icid
esin
clud
em
icro
orga
nism
san
dna
tura
llyoc
curr
ing
com
poun
ds,o
rco
mpo
unds
esse
ntia
llyid
entic
alto
natu
rally
occu
rrin
gco
mpo
unds
that
are
not
toxi
cto
the
targ
etpe
st(s
uch
asph
erom
ones
).
AI
2007
2008
2009
2010
2011
2012
2013
2014
2015
CO
YO
TE
UR
INE
00
0<
112
<1
<1
<1
<1
CY
TOK
ININ
00
00
199
2,40
935
23,
290
1,96
6D
IHY
DR
O-5
-HE
PTY
L-2
(3H
)-FU
RA
NO
NE
<1
<1
<1
<1
00
00
0D
IHY
DR
O-5
-PE
NT
YL
-2(3
H)-
FUR
AN
ON
E<
1<
1<
1<
10
00
00
E,E
-8,1
0-D
OD
EC
AD
IEN
-1-O
L27
,784
21,5
8515
,300
15,2
8317
,872
15,8
7918
,241
16,5
4810
,772
E-1
1-T
ET
RA
DE
CE
N-1
-YL
AC
ETA
TE
6,18
95,
996
5,59
25,
405
1,70
14,
485
4,39
648
969
6E
-8-D
OD
EC
EN
YL
AC
ETA
TE
49,0
8654
,242
46,7
5749
,591
45,6
6749
,300
47,6
4041
,405
42,5
95E
NC
APS
UL
AT
ED
DE
LTA
EN
DO
TOX
INO
FB
AC
ILL
US
TH
UR
ING
IEN
SIS
VAR
.K
UR
STA
KII
NK
ILL
ED
PSE
UD
OM
ON
AS
FLU
OR
ESC
EN
S
3591
370
<1
<1
00
0
EN
CA
PSU
LA
TE
DD
ELT
AE
ND
OTO
XIN
OF
BA
CIL
LU
ST
HU
RIN
GIE
NSI
SVA
R.
SAN
DIE
GO
INK
ILL
ED
PSE
UD
OM
ON
AS
FLU
OR
ESC
EN
S
00
00
00
00
0
ESS
EN
TIA
LO
ILS
10
<1
4<
1<
1<
1<
1<
1E
TH
YL
EN
E0
00
470
4936
2128
EU
CA
LYPT
US
OIL
00
02
<1
00
00
EU
GE
NO
L0
00
00
<1
<1
<1
<1
FAR
NE
SOL
652
422
503
1,59
782
62,
227
3,94
03,
547
3,10
4FE
NU
GR
EE
K2,
068
8747
174
412
271
8868
73FE
RR
ICSO
DIU
ME
DTA
00
00
3,04
98,
428
8,03
810
,540
12,5
22FI
SHO
IL0
00
0<
138
225
20
0FO
RM
ICA
CID
151
1060
136
85
178
1,20
3FO
XU
RIN
E0
00
<1
12<
1<
1<
1<
1G
AM
MA
AM
INO
BU
TY
RIC
AC
ID24
,697
12,9
051,
786
835
542
1,81
138
431
428
7G
AR
LIC
346
288
374
1,12
31,
369
12,4
1014
,485
8,50
94,
767
GE
RA
NIO
L0
6734
91,
531
788
2,22
03,
939
3,54
53,
094
GE
RM
AN
CO
CK
RO
AC
HPH
ER
OM
ON
E<
1<
1<
1<
1<
1<
1<
1<
10
GIB
BE
RE
LL
INS
455,
130
490,
530
513,
398
493,
034
509,
875
530,
010
548,
243
529,
982
519,
871
GIB
BE
RE
LL
INS,
POTA
SSIU
MSA
LT32
80
3415
079
50
00
GL
IOC
LA
DIU
MV
IRE
NS
GL
-21
(SPO
RE
S)5
1,09
071
61,
401
1,07
63,
172
5,44
45,
187
7,10
9
GL
UTA
MIC
AC
ID24
,697
12,9
051,
786
835
542
1,81
138
431
428
7H
AR
PIN
PRO
TE
IN3,
721
1,99
81,
562
1,63
11,
582
115
950
0H
EPT
YL
BU
TY
RA
TE
00
0<
1<
1<
1<
1<
1<
1H
YD
RO
GE
NPE
RO
XID
E7,
744
9,36
114
,521
23,2
0839
,189
21,8
6422
,955
28,0
3432
,550
HY
DR
OPR
EN
E2
200
82<
1<
12
4<
1<
1IB
A44
,093
3,86
215
022
71,
156
1,28
396
294
048
9IN
DO
LE
00
00
00
<1
0<
1
63

Tabl
e18
:(co
ntin
ued)
The
repo
rted
cum
ulat
ive
acre
str
eate
dw
ithpe
stic
ides
that
are
biop
estic
ides
.Bio
pest
icid
esin
clud
em
icro
orga
nism
san
dna
tura
llyoc
curr
ing
com
poun
ds,o
rco
mpo
unds
esse
ntia
llyid
entic
alto
natu
rally
occu
rrin
gco
mpo
unds
that
are
not
toxi
cto
the
targ
etpe
st(s
uch
asph
erom
ones
).
AI
2007
2008
2009
2010
2011
2012
2013
2014
2015
IRO
NPH
OSP
HA
TE
7,14
56,
569
4,56
16,
345
5,47
76,
519
6,28
68,
109
8,69
8K
AO
LIN
56,9
1147
,438
66,7
8182
,636
51,1
0057
,755
80,0
7588
,044
101,
445
LA
CT
ICA
CID
00
00
00
00
38L
AC
TOSE
80,3
6699
,526
77,3
6381
,164
91,9
3668
,442
80,2
4261
,764
86,4
42L
AG
EN
IDIU
MG
IGA
NT
EU
M(C
AL
IFO
RN
IAST
RA
IN)
<1
<1
00
02
00
0
LA
URY
LA
LC
OH
OL
9,35
87,
782
4,70
55,
495
6,44
36,
652
7,80
75,
681
5,72
5L
AVA
ND
ULY
LSE
NE
CIO
AT
E0
4,31
62,
375
7,02
511
,754
6,66
65,
869
6,29
48,
394
LIM
ON
EN
E79
,012
64,1
5155
,465
29,6
2115
,514
73,6
0529
,552
32,9
2445
,187
LIN
AL
OO
L<
17
1<
1<
1<
1<
12
<1
MA
RG
OSA
OIL
00
040
4,26
07,
977
9,54
619
,010
19,7
39M
EN
TH
OL
00
02
<1
020
00
ME
TAR
HIZ
IUM
AN
ISO
PLIA
EST
RA
INF5
20
00
00
202
133
634
122
ME
TAR
HIZ
IUM
AN
ISO
PLIA
E,V
AR
.A
NIS
OPL
IAE
,ST
RA
INE
SF1
<1
<1
0<
1<
10
00
0
ME
TH
OPR
EN
E51
4221
14
896
<1
<1
<1
<1
ME
TH
YL
AN
TH
RA
NIL
AT
E29
821
955
038
02,
043
215
1,09
280
86,
126
ME
TH
YL
EU
GE
NO
L0
00
0<
10
<1
00
ME
TH
YL
NO
NY
LK
ETO
NE
<1
<1
1<
10
0<
1<
1<
1M
ET
HY
LSA
LIC
YL
AT
E1
0<
10
00
00
0M
ON
TOK
PEPP
ER
00
00
00
00
0M
USC
AL
UR
E1,
179
<1
739
300
6840
5013
941
MY
RIS
TY
LA
LC
OH
OL
9,35
87,
782
4,70
55,
495
6,44
36,
652
7,80
75,
681
5,72
5M
YR
OT
HE
CIU
MV
ER
RU
CA
RIA
,DR
IED
FER
ME
NTA
TIO
NSO
LID
S&
SOL
UB
LE
S,ST
RA
INA
AR
C-0
255
5,09
75,
257
5,33
14,
840
5,13
64,
274
4,45
63,
637
8,77
5
N6-
BE
NZ
YL
AD
EN
INE
2,62
81,
775
2,07
23,
352
1,69
11,
666
2,95
42,
630
2,59
2N
AA
43,5
073,
331
4738
219
655
293
109
209
NA
A,A
MM
ON
IUM
SALT
11,7
0910
,445
9,02
49,
140
9,07
511
,922
10,6
119,
703
9,96
6N
AA
,ET
HY
LE
STE
R<
173
123
396
384
113
189
37N
AA
,PO
TASS
IUM
SALT
410
00
00
611
035
NA
A,S
OD
IUM
SALT
340
3725
70
00
153
8555
NE
RO
LID
OL
652
422
503
1,59
782
62,
227
3,94
03,
547
3,10
4N
ITR
OG
EN
,LIQ
UIF
IED
<1
<1
<1
<1
<1
<1
<1
50
NO
NA
NO
ICA
CID
1,27
549
870
341
282
848
02,
166
2,07
41,
040
NO
NA
NO
ICA
CID
,OT
HE
RR
EL
AT
ED
1,27
549
870
141
282
846
02,
166
2,07
41,
040
NO
SEM
AL
OC
UST
AE
SPO
RE
S25
430
132
1212
1,61
21,
206
910
750
OIL
OF
AN
ISE
<1
<1
00
<1
<1
<1
<1
<1
OIL
OF
BE
RG
AM
OT
00
00
00
00
0
64
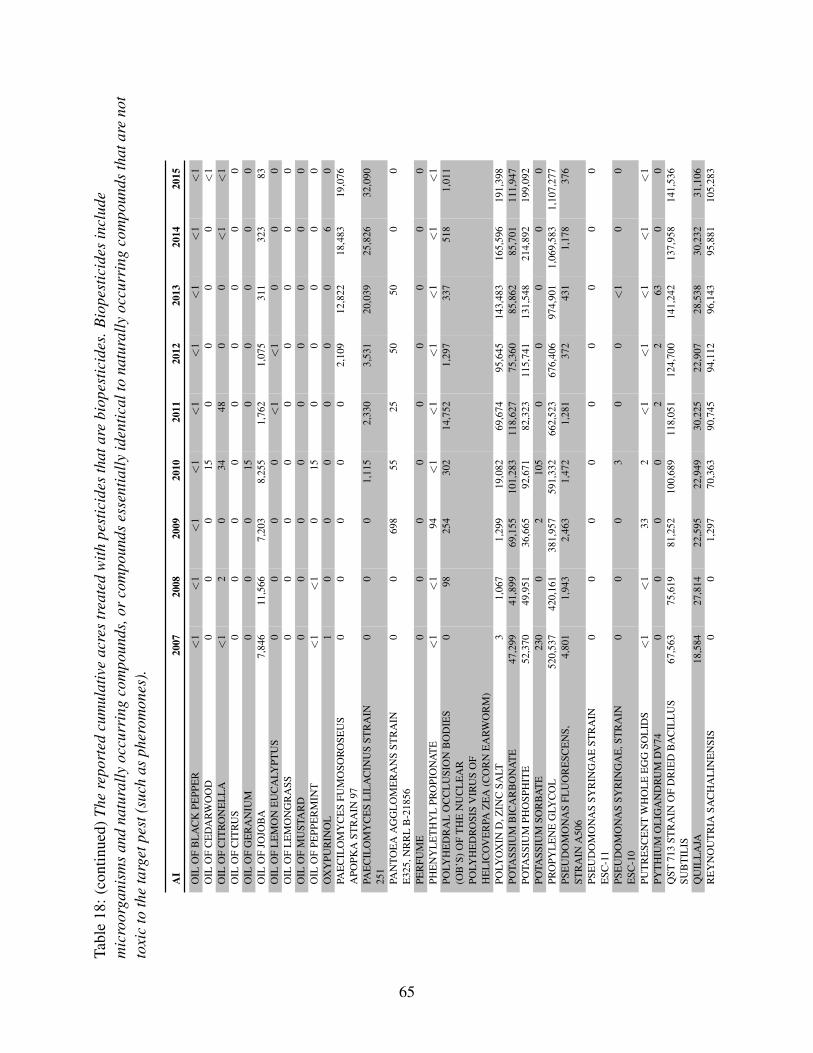
Tabl
e18
:(co
ntin
ued)
The
repo
rted
cum
ulat
ive
acre
str
eate
dw
ithpe
stic
ides
that
are
biop
estic
ides
.Bio
pest
icid
esin
clud
em
icro
orga
nism
san
dna
tura
llyoc
curr
ing
com
poun
ds,o
rco
mpo
unds
esse
ntia
llyid
entic
alto
natu
rally
occu
rrin
gco
mpo
unds
that
are
not
toxi
cto
the
targ
etpe
st(s
uch
asph
erom
ones
).
AI
2007
2008
2009
2010
2011
2012
2013
2014
2015
OIL
OF
BL
AC
KPE
PPE
R<
1<
1<
1<
1<
1<
1<
1<
1<
1O
ILO
FC
ED
AR
WO
OD
00
015
00
00
<1
OIL
OF
CIT
RO
NE
LL
A<
12
034
480
0<
1<
1O
ILO
FC
ITR
US
00
00
00
00
0O
ILO
FG
ER
AN
IUM
00
015
00
00
0O
ILO
FJO
JOB
A7,
846
11,5
667,
203
8,25
51,
762
1,07
531
132
383
OIL
OF
LE
MO
NE
UC
ALY
PTU
S0
00
0<
1<
10
00
OIL
OF
LE
MO
NG
RA
SS0
00
00
00
00
OIL
OF
MU
STA
RD
00
00
00
00
0O
ILO
FPE
PPE
RM
INT
<1
<1
015
00
00
0O
XY
PUR
INO
L1
00
00
00
60
PAE
CIL
OM
YC
ES
FUM
OSO
RO
SEU
SA
POPK
AST
RA
IN97
00
00
02,
109
12,8
2218
,483
19,0
76
PAE
CIL
OM
YC
ES
LIL
AC
INU
SST
RA
IN25
10
00
1,11
52,
330
3,53
120
,039
25,8
2632
,090
PAN
TOE
AA
GG
LO
ME
RA
NS
STR
AIN
E32
5,N
RR
LB
-218
560
069
855
2550
500
0
PER
FUM
E0
00
00
00
00
PHE
NY
LE
TH
YL
PRO
PIO
NA
TE
<1
<1
94<
1<
1<
1<
1<
1<
1PO
LYH
ED
RA
LO
CC
LU
SIO
NB
OD
IES
(OB
’S)O
FT
HE
NU
CL
EA
RPO
LYH
ED
RO
SIS
VIR
US
OF
HE
LIC
OV
ER
PAZ
EA
(CO
RN
EA
RW
OR
M)
098
254
302
14,7
521,
297
337
518
1,01
1
POLY
OX
IND
,ZIN
CSA
LT3
1,06
71,
299
19,0
8269
,674
95,6
4514
3,48
316
5,59
619
1,39
8PO
TASS
IUM
BIC
AR
BO
NA
TE
47,2
9941
,899
69,1
5510
1,28
311
8,62
775
,360
85,8
6285
,701
111,
947
POTA
SSIU
MPH
OSP
HIT
E52
,370
49,9
5136
,665
92,6
7182
,323
115,
741
131,
548
214,
892
199,
092
POTA
SSIU
MSO
RB
AT
E23
00
210
50
00
00
PRO
PYL
EN
EG
LYC
OL
520,
537
420,
161
381,
957
591,
332
662,
523
676,
406
974,
901
1,06
9,58
31,
107,
277
PSE
UD
OM
ON
AS
FLU
OR
ESC
EN
S,ST
RA
INA
506
4,80
11,
943
2,46
31,
472
1,28
137
243
11,
178
376
PSE
UD
OM
ON
AS
SYR
ING
AE
STR
AIN
ESC
-11
00
00
00
00
0
PSE
UD
OM
ON
AS
SYR
ING
AE
,ST
RA
INE
SC-1
00
00
30
0<
10
0
PUT
RE
SCE
NT
WH
OL
EE
GG
SOL
IDS
<1
<1
332
<1
<1
<1
<1
<1
PYT
HIU
MO
LIG
AN
DR
UM
DV
740
00
02
263
00
QST
713
STR
AIN
OF
DR
IED
BA
CIL
LU
SSU
BT
ILIS
67,5
6375
,619
81,2
5210
0,68
911
8,05
112
4,70
014
1,24
213
7,95
814
1,53
6
QU
ILL
AJA
18,5
8427
,814
22,5
9522
,949
30,2
2522
,907
28,5
3830
,232
31,1
06R
EY
NO
UT
RIA
SAC
HA
LIN
EN
SIS
00
1,29
770
,363
90,7
4594
,112
96,1
4395
,881
105,
283
65
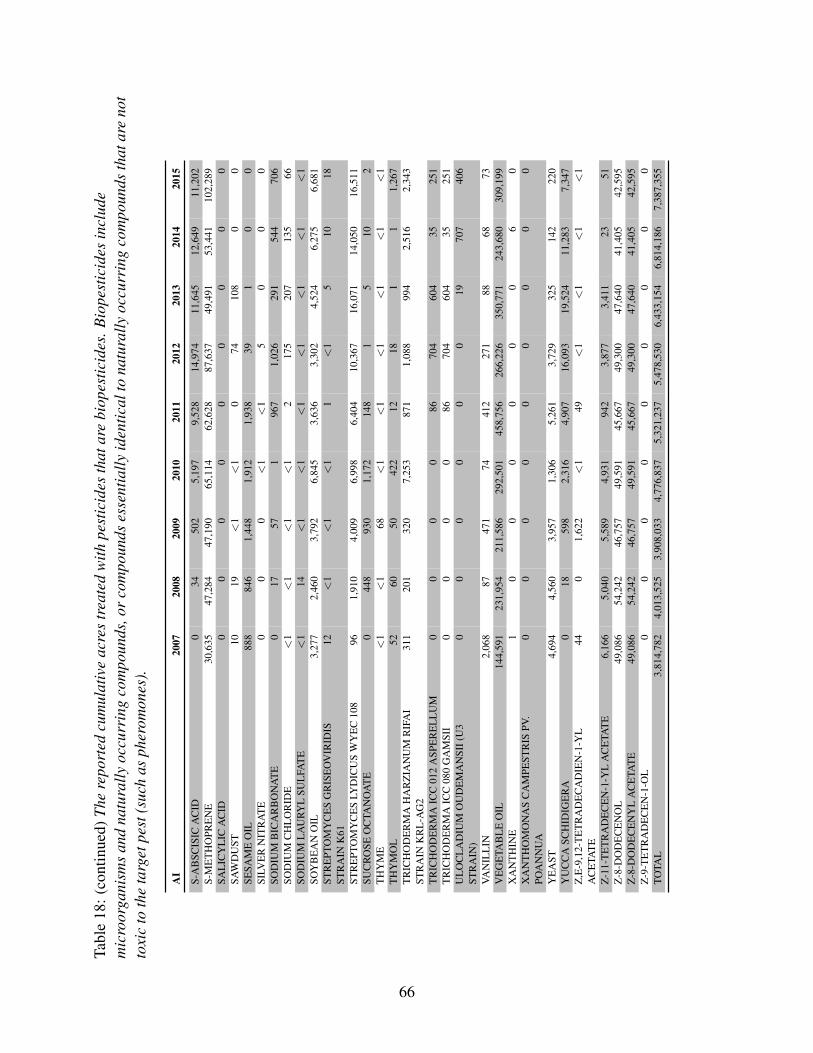
Tabl
e18
:(co
ntin
ued)
The
repo
rted
cum
ulat
ive
acre
str
eate
dw
ithpe
stic
ides
that
are
biop
estic
ides
.Bio
pest
icid
esin
clud
em
icro
orga
nism
san
dna
tura
llyoc
curr
ing
com
poun
ds,o
rco
mpo
unds
esse
ntia
llyid
entic
alto
natu
rally
occu
rrin
gco
mpo
unds
that
are
not
toxi
cto
the
targ
etpe
st(s
uch
asph
erom
ones
).
AI
2007
2008
2009
2010
2011
2012
2013
2014
2015
S-A
BSC
ISIC
AC
ID0
3450
25,
197
9,52
814
,974
11,6
4512
,649
11,2
02S-
ME
TH
OPR
EN
E30
,635
47,2
8447
,190
65,1
1462
,628
87,6
3749
,491
53,4
4110
2,28
9SA
LIC
YL
ICA
CID
00
00
00
00
0SA
WD
UST
1019
<1
<1
074
108
00
SESA
ME
OIL
888
846
1,44
81,
912
1,93
839
10
0SI
LVE
RN
ITR
AT
E0
00
<1
<1
50
00
SOD
IUM
BIC
AR
BO
NA
TE
017
571
967
1,02
629
154
470
6SO
DIU
MC
HL
OR
IDE
<1
<1
<1
<1
217
520
713
566
SOD
IUM
LA
URY
LSU
LFA
TE
<1
14<
1<
1<
1<
1<
1<
1<
1SO
YB
EA
NO
IL3,
277
2,46
03,
792
6,84
53,
636
3,30
24,
524
6,27
56,
681
STR
EPT
OM
YC
ES
GR
ISE
OV
IRID
ISST
RA
INK
6112
<1
<1
<1
1<
15
1018
STR
EPT
OM
YC
ES
LYD
ICU
SW
YE
C10
896
1,91
04,
009
6,99
86,
404
10,3
6716
,071
14,0
5016
,511
SUC
RO
SEO
CTA
NO
AT
E0
448
930
1,17
214
81
510
2T
HY
ME
<1
<1
68<
1<
1<
1<
1<
1<
1T
HY
MO
L52
6050
422
1218
11
1,26
7T
RIC
HO
DE
RM
AH
AR
ZIA
NU
MR
IFA
IST
RA
INK
RL
-AG
231
120
132
07,
253
871
1,08
899
42,
516
2,34
3
TR
ICH
OD
ER
MA
ICC
012
ASP
ER
EL
LU
M0
00
086
704
604
3525
1T
RIC
HO
DE
RM
AIC
C08
0G
AM
SII
00
00
8670
460
435
251
UL
OC
LA
DIU
MO
UD
EM
AN
SII(
U3
STR
AIN
)0
00
00
019
707
406
VAN
ILL
IN2,
068
8747
174
412
271
8868
73V
EG
ETA
BL
EO
IL14
4,59
123
1,95
421
1,58
629
2,50
145
8,75
626
6,22
635
0,77
124
3,68
030
9,19
9X
AN
TH
INE
10
00
00
06
0X
AN
TH
OM
ON
AS
CA
MPE
STR
ISPV
.PO
AN
NU
A0
00
00
00
00
YE
AST
4,69
44,
560
3,95
71,
306
5,26
13,
729
325
142
220
YU
CC
ASC
HID
IGE
RA
018
598
2,31
64,
907
16,0
9319
,524
11,2
837,
347
Z,E
-9,1
2-T
ET
RA
DE
CA
DIE
N-1
-YL
AC
ETA
TE
440
1,62
2<
149
<1
<1
<1
<1
Z-1
1-T
ET
RA
DE
CE
N-1
-YL
AC
ETA
TE
6,16
65,
040
5,58
94,
931
942
3,87
73,
411
2351
Z-8
-DO
DE
CE
NO
L49
,086
54,2
4246
,757
49,5
9145
,667
49,3
0047
,640
41,4
0542
,595
Z-8
-DO
DE
CE
NY
LA
CE
TAT
E49
,086
54,2
4246
,757
49,5
9145
,667
49,3
0047
,640
41,4
0542
,595
Z-9
-TE
TR
AD
EC
EN
-1-O
L0
00
00
00
00
TOTA
L3,
814,
782
4,01
3,52
53,
908,
033
4,77
6,83
75,
321,
237
5,47
8,53
06,
433,
154
6,81
4,18
67,
387,
355
66

Figu
re12
:Use
tren
dsof
pest
icid
esth
atar
ebi
opes
ticid
es.B
iope
stic
ides
incl
ude
mic
roor
gani
sms
and
natu
rally
occu
rrin
gco
mpo
unds
,or
com
poun
dses
sent
ially
iden
tical
tona
tura
llyoc
curr
ing
com
poun
dsth
atar
eno
ttox
icto
the
targ
etpe
st(s
uch
asph
erom
ones
).R
epor
ted
poun
dsof
activ
ein
gred
ient
(AI)
appl
ied
incl
ude
both
agri
cultu
rala
ndno
n-ag
ricu
ltura
lapp
licat
ions
.The
repo
rted
cum
ulat
ive
acre
str
eate
din
clud
epr
imar
ilyag
ricu
ltura
lapp
licat
ions
.Dat
aar
efr
omth
eD
epar
tmen
tofP
estic
ide
Reg
ulat
ion’
sPe
stic
ide
Use
Rep
orts
.
67

5 Trends In Pesticide Use In Certain Commodities
A grower’s or applicator’s decision to spray depends on many factors, such as the presence ofbiological control agents (e.g., predatory insects and other natural enemies), current pest levels,cost of pesticides and labor, value of the crop, pesticide resistance and effectiveness, otheravailable management practices, and potential pesticide risk to the environment or farm workers.Pest populations are determined by complex ecological interactions. Sometimes the causes ofpest outbreaks are unknown. Weather is a critically important factor and affects different pestspecies in different ways.
Crops treated with the greatest amounts of pesticides in 2015 were almond, wine grape,processing tomato, table and raisin grape, and strawberry. Crops or sites with the greatest increasein the amount applied from 2014 to 2015 include almond, pistachio, wine grape, orange, walnut,and carrot. Crops or sites with the greatest decrease in the amount applied include water(industrial), rice, strawberry, table and raisin grape, and raspberry (Table 19).
Table 19: The change in pounds of AI applied and acres planted or harvested and the percentchange from 2014 to 2015 for the crops or sites with the greatest increase and decrease in poundsapplied. Acre values sourced from CDFA(a, b), USDA(a,b,d)
Change in Use 2014–2015 Percent Change 2014–2015Crop Treated Pounds Acres Pounds Acres
ALMOND 9,506,374 60,000 37 6PISTACHIO 2,971,842 12,000 61 5GRAPE, WINE 2,610,266 -7,000 10 -1ORANGE 1,637,980 -3,000 19 -2WALNUT 1,208,518 10,000 21 3RASPBERRY -371,579 1,270 -30 17GRAPE -478,544 -3,000 -3 -1STRAWBERRY -517,991 -1,000 -4 -2RICE -550,192 -11,000 -11 -3WATER (INDUSTRIAL) -988,709 -39
Thirteen commodities were chosen for in-depth analysis of the possible reasons for changes inpesticide use from 2014 to 2015: alfalfa, almond, carrot, cotton, orange, peach and nectarine,pistachio, processing tomato, rice, strawberry, table and raisin grape, walnut, and wine grape.These 13 commodities were chosen because each was treated with more than 4 million pounds ofAIs or treated on more than 3 million acres, cumulatively. Collectively, these commoditiesrepresent 72 percent of the amount reported in the PUR (78 percent of total used on agriculturalfields) and 74 percent of the area treated in 2015.
For these 13 commodities, the non-adjuvant AIs applied to the most area were sulfur and
68

glyphosate. Sulfur, used on all 13 commodities except rice, was applied mostly on table and raisingrape, wine grape and processing tomato. Sulfur is a natural fungicide favored by bothconventional and organic farmers and is used mostly to manage powdery mildew on grape andprocessing tomato. However, it is used in some crops to suppress mites. Glyphosate is abroad-spectrum herbicide and crop desiccant. Almond acres received nearly 40 percent of theglyphosate use of all 13 commodities, although all 13 commodities reported some use. Inaddition, the following AIs were used on over one million cumulative acres (although not all ofthe AIs were used on every one of the 13 commodities): the insecticides (and miticides)abamectin, lambda-cyhalothrin, bifenthrin, methoxyfenozide, and petroleum and mineral oils; theherbicides oxyfluorfen and paraquat dichloride; and the fungicide copper.
Petroleum and mineral oils were second to sulfur in amount of pounds of non-adjuvant pesticidesused on all 13 commodities. All 13 crops reported use of oils, but the highest use was on almond,wine grape, orange, and pistachio. Oils are mostly used as insecticides, but can also be used asfungicides and adjuvants. The fumigants 1,3-dichloropropene, chloropicrin, metam-potassium,and metam-sodium also ranked high in pounds of pesticide used on the 13 commodities, with theexception of rice. In production agriculture, these fumigants are usually applied to the soil beforeplanting a crop to control various soil-borne diseases, nematodes, and other problematic pests. Inorchards, fumigation may be used to spot-treat a small area following tree removal before areplacement tree is planted.
Information used to develop the trend analyses for each of the thirteen crops in this chapter wasdrawn from several publications and phone interviews with pest control advisors, growers,University of California Cooperative Extension farm advisors and specialists, researchers, andcommodity association representatives. DPR staff analyzed the information, using theirknowledge of pesticides, California agriculture, pests, and pest management practices. As aresult, the explanations for changes in pesticide use are largely based on the subjective opinionsof experts as opposed to rigorous statistical analyses. Additional figures of pesticide distributionmaps and graphs associated with each crop can be found in the Appendix of this document(Appendix figures are referenced by an “A” preceding the figure number).
Alfalfa
Alfalfa is grown primarily as a forage crop, providing protein and high energy for dairy cows andother livestock. California is the leading alfalfa hay-producing state in the United States. Thereare six alfalfa growing regions in California, encompassing a range of climatic conditions:Intermountain, Sacramento Valley, San Joaquin Valley, Coastal, High Desert, and Low Desert(Figure A-3). The price received per ton of hay decreased in 2015 after having reached one of itshighest values in 2014 (Table 20). In addition, the number of acres harvested was at its lowestsince the 1940s. These two factors account for some of the observed trends in pesticide use inalfalfa in 2015 (Figures 14, A-4, and A-5).
69

Table 20: Total reported pounds of all active ingredients (AI), acres treated, acres harvested, andprices for alfalfa each year from 2011 to 2015. Harvested acres from 2011 to 2015 are fromUSDA(a), 2012-2016; marketing year average prices from 2011 to 2015 are from USDA(c),2014-2016. Acres treated means cumulative acres treated (see explanation p. 10).
2011 2012 2013 2014 2015
Pounds AI 3,526,056 3,541,911 3,740,535 3,732,816 3,509,071Acres Treated 5,545,181 5,208,146 6,206,811 6,651,029 5,686,110Acres Harvested 880,000 950,000 900,000 875,000 1,180,000Price/ton $ 239 $ 210 $ 206 $ 244 $ 185
Use of all the major insecticides decreased in 2015 (Figure 13). This decrease can be tied to lowerprices received for hay as well as reduced number of acres planted. Alternative practices, such asearly cutting, may be cheaper than spraying for some pests under these conditions. Less pressurefrom blue alfalfa aphid–the lowest in two years–likely led to decreased use of insecticides. Inaddition to the organophosphates chlorpyrifos and dimethoate (Figure 14), malathion, anotherorganophosphate, and methomyl, a carbamate, were used less.
Figure 13: Acres of alfalfa treated by all AIs in the major types of pesticides from 1995 to 2015.
There were decreases in the acres treated with all commonly used pyrethroids exceptcypermethrin. These decreases reverse a trend that had been happening since 2009. Besidescypermethrin, the only other AI to have been applied to a substantially greater number of acres in
70

2015 was the miticide hexythiazox. Nearly all applications of hexythiazox took place in ImperialCounty. Increased use of this miticide may have resulted from secondary outbreaks of mites dueto pyrethroid applications for blue alfalfa aphid. Flupyradifurone, newly registered in April 2015,was used widely as growers tried this new product to manage the blue alfalfa aphid.
Herbicide use increased (Figure 13). The largest increases were found in paraquat dichloride,glyphosate, hexazinone, flumioxazin, diuron, and carfentrazone-ethyl (Figure 14). Althoughdrought conditions may have inhibited weed growth to some extent, substantial penalties ($100per ton) levied for reduced quality likely made weed management more important. Weed growthexerts a large effect on the quality of hay.
Use of fungicides in alfalfa is minimal compared to the use of insecticides and herbicides.
Figure 14: Acres of alfalfa treated by the top 5 AIs of each AI type from 2011 to 2015.
Almond
California produces 82 percent of the world’s supply of almonds. There are approximately 1.1million acres of almond, located over a 400-mile stretch from northern Tehama County to
71

southern Kern County in the Central Valley (Figure A-6). Despite a decreasing price trend, therelatively high prices and low labor requirements of almond production are reflected in acontinued annual increase in total acreage (Table 21). Pesticide use increased as well, with a 14percent increase in treated area and 25 percent increase in the total pounds per acre planted(Table 21).
Table 21: Total reported pounds of all active ingredients (AI), acres treated, acres planted, andprices for almond each year from 2011 to 2015. Planted acres from 2011 to 2015 are fromCDFA(a), 2011-2015; marketing year average prices from 2011 to 2015 are from USDA(d),2014-2016. Acres treated means cumulative acres treated (see explanation p. 10).
2011 2012 2013 2014 2015
Pounds AI 25,853,549 23,121,348 29,874,358 25,913,046 35,419,420Acres Treated 13,740,874 14,803,998 16,973,848 18,038,068 20,578,543Acres Planted 835,000 930,000 970,000 1,050,000 1,110,000Price/lb $ 1.99 $ 2.58 $ 3.21 $ 4.00 $ 2.84
The major almond pests include mites, San Jose scale, peach twig borer, navel orangeworm, ants,Alternaria leaf spot, brown rot, band canker, scab, powdery mildew, and many weed species. Theuse of insecticides increased, as well as herbicides and fungicides. Total pounds of fumigantsused increased, although the treated area decreased (Figures 15, 16, A-7, and A-8).
The winter of 2015 had average temperatures but below-average rainfall, resulting in a largeoverwintering population of navel orangeworm, a major pest of almond. Navel orangeworm feedsdirectly on the nutmeat. As the larvae feed, they leave behind frass (or excrement), a substrate forthe fungi Aspergillus flavus and A. parasiticus, which contaminate the nut with aflatoxins andimpacts food safety. The increasing trend in area treated with insecticides since 2013 likelyreflects increasing navel orangeworm pest pressure.
Increased use of methoxyfenozide and chlorantraniliprole and decreased use of pyrethroids showthat a variety of chemical modes of action were needed to prevent pest resistance to pyrethroids.However, despite some reports of resistance to bifenthrin, a pyrethroid, its use continued toincrease, possibly in an effort to manage leaffooted bugs, which have recently become animportant almond pest (Figure 16). Abamectin continued to be widely used, although use leveledoff in 2015 (Figure 16). The long-term, widespread use of abamectin resulted in reports of miteresistance. The use of oil in spring and summer increased in 2015, possibly to boost theeffectiveness of abamectin, used to manage resistant spider mites. Use of other miticides such asetoxazole and clofentezine also increased.
Herbicides used from 1995 to 2015 steadily increased, reflecting a 36 percent increase in almondacreage, increasing herbicide resistance, and, recently, the drought. Weeds can increase water useby 10 to 30 percent. Thus, during a drought, it can be important to manage weeds to save water,resulting in increased use of herbicides. In addition, resistance to glyphosate, the most commonly
72
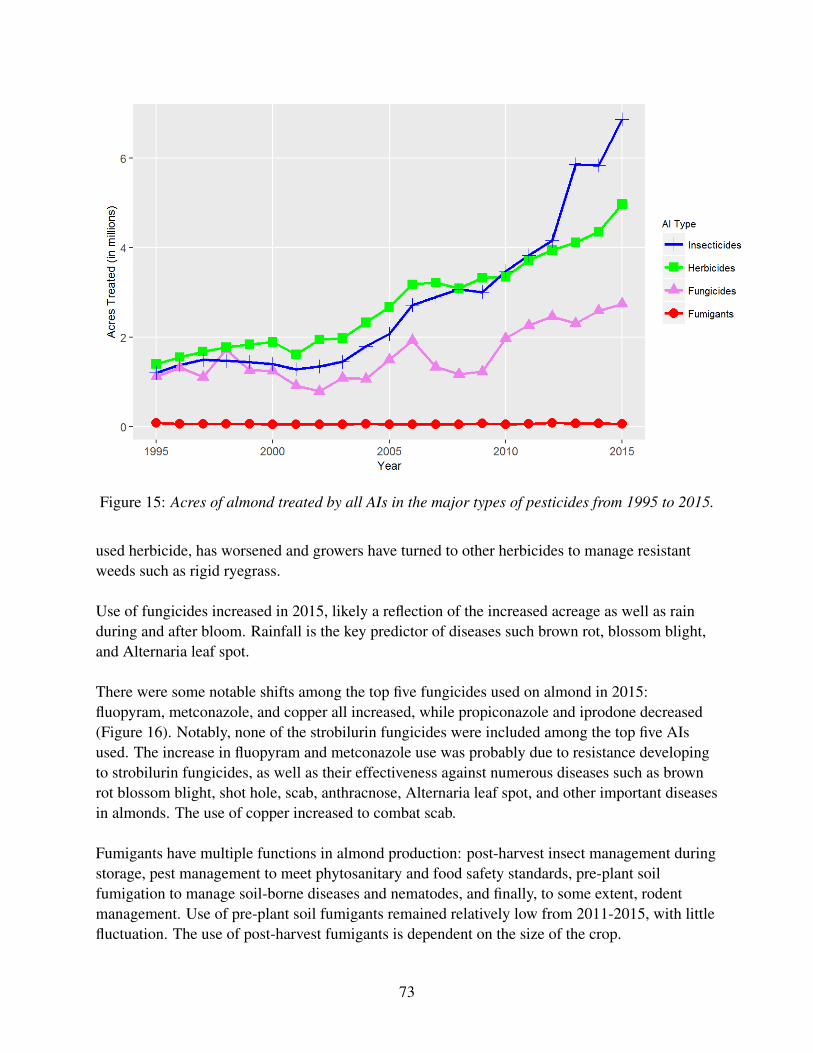
Figure 15: Acres of almond treated by all AIs in the major types of pesticides from 1995 to 2015.
used herbicide, has worsened and growers have turned to other herbicides to manage resistantweeds such as rigid ryegrass.
Use of fungicides increased in 2015, likely a reflection of the increased acreage as well as rainduring and after bloom. Rainfall is the key predictor of diseases such brown rot, blossom blight,and Alternaria leaf spot.
There were some notable shifts among the top five fungicides used on almond in 2015:fluopyram, metconazole, and copper all increased, while propiconazole and iprodone decreased(Figure 16). Notably, none of the strobilurin fungicides were included among the top five AIsused. The increase in fluopyram and metconazole use was probably due to resistance developingto strobilurin fungicides, as well as their effectiveness against numerous diseases such as brownrot blossom blight, shot hole, scab, anthracnose, Alternaria leaf spot, and other important diseasesin almonds. The use of copper increased to combat scab.
Fumigants have multiple functions in almond production: post-harvest insect management duringstorage, pest management to meet phytosanitary and food safety standards, pre-plant soilfumigation to manage soil-borne diseases and nematodes, and finally, to some extent, rodentmanagement. Use of pre-plant soil fumigants remained relatively low from 2011-2015, with littlefluctuation. The use of post-harvest fumigants is dependent on the size of the crop.
73
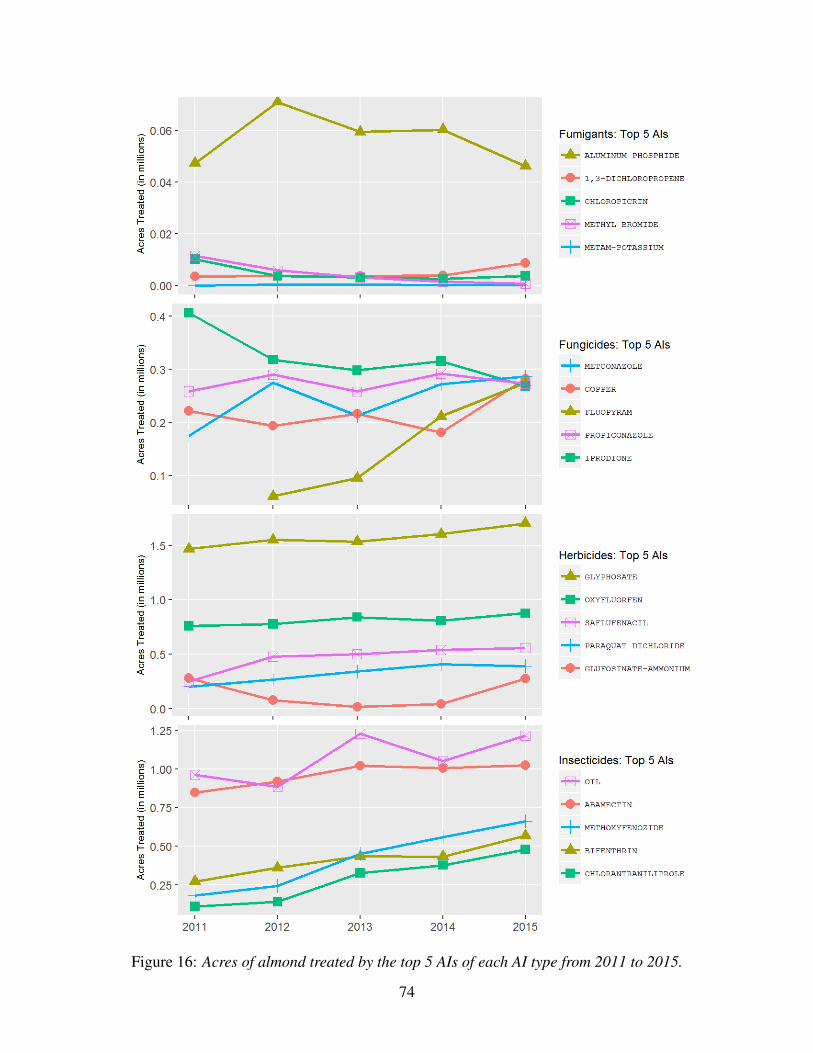
Figure 16: Acres of almond treated by the top 5 AIs of each AI type from 2011 to 2015.
74

Carrot
California is the largest producer of fresh market carrots in the United States, accounting for 81percent of the U.S. production of 2.4 billion pounds in 2015. California has four main productionregions for carrots: the San Joaquin Valley (Kern County), the Central Coast in San Luis Obispoand Santa Barbara counties (Cuyama Valley) and Monterey County, the low desert (Imperial andRiverside counties), and the high desert (Los Angeles County) (Figure A-9). The San JoaquinValley accounts for more than half the state’s acreage.
In 2015, 67,000 acres of carrots were planted in California, an increase of about 1.5 percent from2014 (Table 22). Despite this increase in acreage, the area treated with fungicides, herbicides, andinsecticides decreased. Fumigants were the only pesticide type used on more acres than in 2014(Figures 17, 18, A-10, and A-11). Nematodes, weeds, cavity spot, and leaf blights remain themajor pest concerns.
Table 22: Total reported pounds of all active ingredients (AI), acres treated, acres planted, andprices for carrot each year from 2011 to 2015. Planted acres and marketing year average pricesfrom 2011 to 2015 are from USDA(e), 2014-2016. Acres treated means cumulative acres treated(see explanation p. 10).
2011 2012 2013 2014 2015
Pounds AI 6,623,626 7,229,837 6,428,037 5,498,445 6,521,610Acres Treated 457,669 507,562 526,657 605,551 561,571Acres Planted 65,000 62,000 63,000 66,000 67,000Price/cwt $ 34.20 $ 26.90 $ 29.60 $ 28.20 $ 32.70
Fungicides were applied to more acres of carrot production in 2015 than any other pesticide type(Figure 17). The most-applied fungicides by area treated were sulfur, mefenoxam, and copper,followed by pyraclostrobin and azoxystrobin. Both the treated acreage and the applied pounds ofsulfur declined, while the use of copper increased. The use of the other three fungicides declinedslightly.
Herbicides followed fungicides as the pesticide type with the second largest treated acreage(Figure 17). As was the case in 2014, the most-applied herbicides in carrot production by areawere linuron, pendimethalin, fluazifop-p-butyl, and trifluralin (Figure 18). Clethodim replacedEPTC as the fifth most-used herbicide by area. Linuron, which was applied to the largest numberof acres, is a postemergence herbicide that manages broadleaf weeds and small grasses.
The most-used insecticides by area remain the same as last year. Use of Paecilomyces lilacinusStrain 251, a naturally occurring fungus with nematicidal properties, and imidacloprid,methoxyfenozide, and (S)-cypermethrin remained practically unchanged from 2014. Use of
75

Figure 17: Acres of carrot treated by all AIs in the major types of pesticides from 1995 to 2015.
esfenvalerate, which is applied to kill insect pests such as whiteflies, leafhoppers, and cutworms,decreased for both area treated and total pounds applied (Figure 18).
Fumigants in carrot production are primarily used to manage nematodes, weeds, and soil-bornediseases. Metam-potassium, metam-sodium, and 1,3-dichloropropene were the three most-usedfumigants for carrots in 2015 (Figure 18). Fumigant use increased both for the area treated andfor the total pounds applied. The increase in use of fumigants took place primarily in Kern, LosAngeles, and Imperial counties. The increased use of fumigants was the primary factor that led tothe 18 percent increase in total pounds of AIs used in carrot production from 2014 to 2015.
76

Figure 18: Acres of carrot treated by the top 5 AIs of each AI type from 2011 to 2015.
77
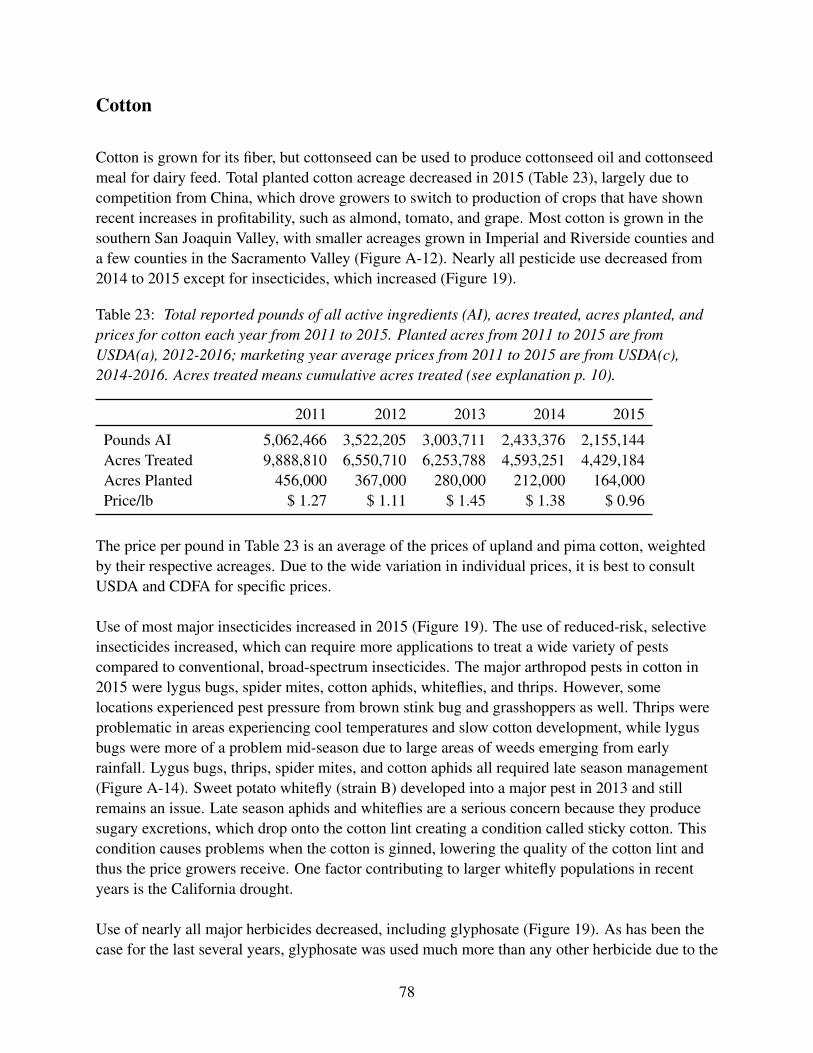
Cotton
Cotton is grown for its fiber, but cottonseed can be used to produce cottonseed oil and cottonseedmeal for dairy feed. Total planted cotton acreage decreased in 2015 (Table 23), largely due tocompetition from China, which drove growers to switch to production of crops that have shownrecent increases in profitability, such as almond, tomato, and grape. Most cotton is grown in thesouthern San Joaquin Valley, with smaller acreages grown in Imperial and Riverside counties anda few counties in the Sacramento Valley (Figure A-12). Nearly all pesticide use decreased from2014 to 2015 except for insecticides, which increased (Figure 19).
Table 23: Total reported pounds of all active ingredients (AI), acres treated, acres planted, andprices for cotton each year from 2011 to 2015. Planted acres from 2011 to 2015 are fromUSDA(a), 2012-2016; marketing year average prices from 2011 to 2015 are from USDA(c),2014-2016. Acres treated means cumulative acres treated (see explanation p. 10).
2011 2012 2013 2014 2015
Pounds AI 5,062,466 3,522,205 3,003,711 2,433,376 2,155,144Acres Treated 9,888,810 6,550,710 6,253,788 4,593,251 4,429,184Acres Planted 456,000 367,000 280,000 212,000 164,000Price/lb $ 1.27 $ 1.11 $ 1.45 $ 1.38 $ 0.96
The price per pound in Table 23 is an average of the prices of upland and pima cotton, weightedby their respective acreages. Due to the wide variation in individual prices, it is best to consultUSDA and CDFA for specific prices.
Use of most major insecticides increased in 2015 (Figure 19). The use of reduced-risk, selectiveinsecticides increased, which can require more applications to treat a wide variety of pestscompared to conventional, broad-spectrum insecticides. The major arthropod pests in cotton in2015 were lygus bugs, spider mites, cotton aphids, whiteflies, and thrips. However, somelocations experienced pest pressure from brown stink bug and grasshoppers as well. Thrips wereproblematic in areas experiencing cool temperatures and slow cotton development, while lygusbugs were more of a problem mid-season due to large areas of weeds emerging from earlyrainfall. Lygus bugs, thrips, spider mites, and cotton aphids all required late season management(Figure A-14). Sweet potato whitefly (strain B) developed into a major pest in 2013 and stillremains an issue. Late season aphids and whiteflies are a serious concern because they producesugary excretions, which drop onto the cotton lint creating a condition called sticky cotton. Thiscondition causes problems when the cotton is ginned, lowering the quality of the cotton lint andthus the price growers receive. One factor contributing to larger whitefly populations in recentyears is the California drought.
Use of nearly all major herbicides decreased, including glyphosate (Figure 19). As has been thecase for the last several years, glyphosate was used much more than any other herbicide due to the
78

Figure 19: Acres of cotton treated by all AIs in the major types of pesticides from 1995 to 2015.
large acreage of Roundup-Ready cotton, a genetically engineered crop designed to be resistant toglyphosate. Some AIs, such as paraquat dichloride, are used both as herbicides and harvest aids,chemicals used to defoliate or desiccate cotton plants before harvest. It is assumed that if anherbicide was applied in August through November, it was used as a harvest aid, not as anherbicide (Figures 20, A-13, and A-14).
Use of nearly all major fungicides decreased in 2015, continuing a decreasing trend from a smallfungicide increase in earlier years that was caused by higher-than-normal pest pressure fromseedling diseases (e.g. Rhizoctonia solani).
Fumigants are also rarely used in cotton fields and their use decreased from 2014 to 2015.Fumigants are used to treat the soil before planting for a range of soil pathogens, nematodes, andweeds, in addition to treating stored products. The higher use in previous years may be due toconcern over the soil-inhabiting fungus Fusarium oxysporum f. sp. vasinfectum race 4, morecommonly known as FOV race 4, which is spreading throughout the San Joaquin Valley. Someexperts consider this pathogen to be one of the biggest challenges California cotton growers havefaced in many years. Once a field is infected, it is impossible to achieve profitable yields of manycotton varieties. Although the pathogen cannot be completely eradicated by pesticides, someresearch has shown that metam-sodium treatments can knock down inoculum populations.
79

Figure 20: Acres of cotton treated by the top 5 AIs of each AI type from 2011 to 2015.
80
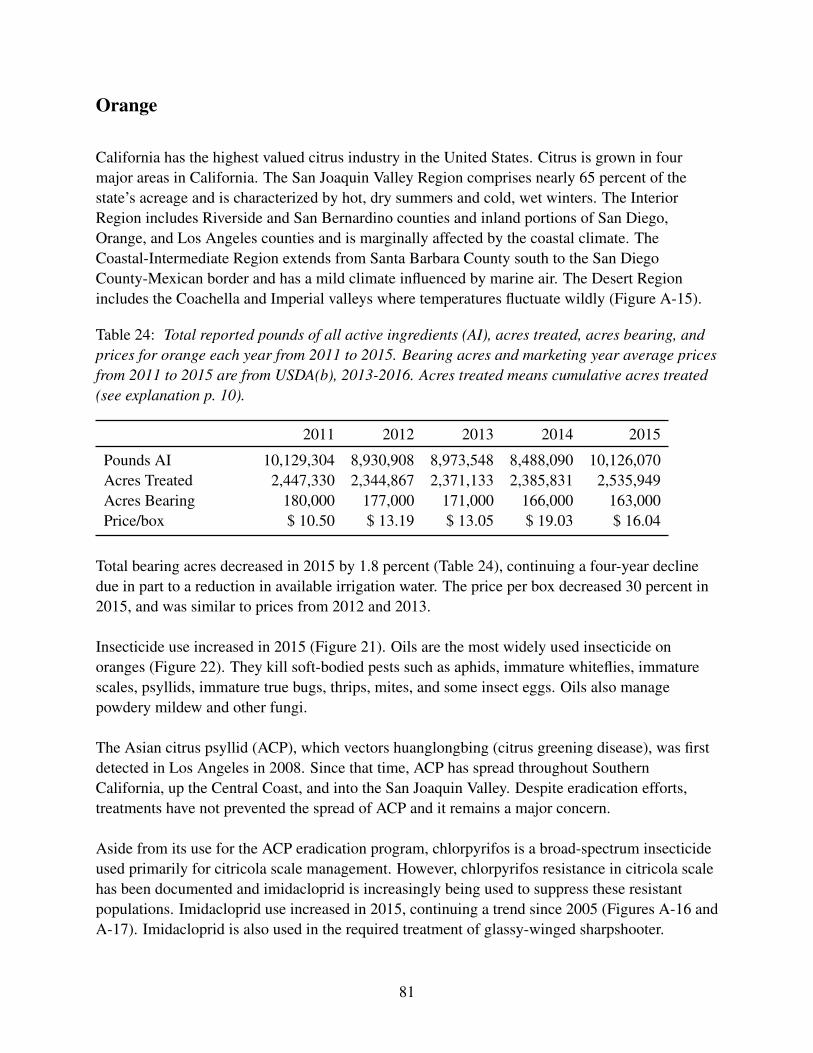
Orange
California has the highest valued citrus industry in the United States. Citrus is grown in fourmajor areas in California. The San Joaquin Valley Region comprises nearly 65 percent of thestate’s acreage and is characterized by hot, dry summers and cold, wet winters. The InteriorRegion includes Riverside and San Bernardino counties and inland portions of San Diego,Orange, and Los Angeles counties and is marginally affected by the coastal climate. TheCoastal-Intermediate Region extends from Santa Barbara County south to the San DiegoCounty-Mexican border and has a mild climate influenced by marine air. The Desert Regionincludes the Coachella and Imperial valleys where temperatures fluctuate wildly (Figure A-15).
Table 24: Total reported pounds of all active ingredients (AI), acres treated, acres bearing, andprices for orange each year from 2011 to 2015. Bearing acres and marketing year average pricesfrom 2011 to 2015 are from USDA(b), 2013-2016. Acres treated means cumulative acres treated(see explanation p. 10).
2011 2012 2013 2014 2015
Pounds AI 10,129,304 8,930,908 8,973,548 8,488,090 10,126,070Acres Treated 2,447,330 2,344,867 2,371,133 2,385,831 2,535,949Acres Bearing 180,000 177,000 171,000 166,000 163,000Price/box $ 10.50 $ 13.19 $ 13.05 $ 19.03 $ 16.04
Total bearing acres decreased in 2015 by 1.8 percent (Table 24), continuing a four-year declinedue in part to a reduction in available irrigation water. The price per box decreased 30 percent in2015, and was similar to prices from 2012 and 2013.
Insecticide use increased in 2015 (Figure 21). Oils are the most widely used insecticide onoranges (Figure 22). They kill soft-bodied pests such as aphids, immature whiteflies, immaturescales, psyllids, immature true bugs, thrips, mites, and some insect eggs. Oils also managepowdery mildew and other fungi.
The Asian citrus psyllid (ACP), which vectors huanglongbing (citrus greening disease), was firstdetected in Los Angeles in 2008. Since that time, ACP has spread throughout SouthernCalifornia, up the Central Coast, and into the San Joaquin Valley. Despite eradication efforts,treatments have not prevented the spread of ACP and it remains a major concern.
Aside from its use for the ACP eradication program, chlorpyrifos is a broad-spectrum insecticideused primarily for citricola scale management. However, chlorpyrifos resistance in citricola scalehas been documented and imidacloprid is increasingly being used to suppress these resistantpopulations. Imidacloprid use increased in 2015, continuing a trend since 2005 (Figures A-16 andA-17). Imidacloprid is also used in the required treatment of glassy-winged sharpshooter.
81

Figure 21: Acres of orange treated by all AIs in the major types of pesticides from 1995 to 2015.
Spinosad and spinetoram are relatively new insecticides and are primarily used in citrus tomanage citrus thrips (Figure 22). Both are very selective, allowing natural enemies to survive andmay eventually take over the market share of older insecticides. Of the two, spinetoram is moreeffective against citrus thrips populations that have developed resistance to carbamateinsecticides, and its persistence and effectiveness has resulted in the reduced use of spinosad.
Fenpropathrin is used to manage red mites, citrus thrips, Asian citrus psyllid, katydids, and othermiscellaneous pests. The insecticidal activity of fenpropathrin is largely interchangeable with thatof beta-cyfluthrin. Abamectin is used for thrips, mites, and citrus leafminer, and is preferredbecause it is inexpensive and has broad-spectrum and long residual activity, low worker risk, anda short pre-harvest interval. Dimethoate is used for a variety of pests such as scales and thrips. Itsdeclining use is likely due to the growing popularity of replacement insecticides such asspinetoram and the neonicotinoids imidacloprid and acetamiprid. Pyriproxyfen is used almostexclusively for California red scale. In the San Joaquin Valley, populations of armored scale showresistance to chlorpyrifos, methidathion, and carbaryl, and growers are encouraged to releaseparasitic wasps and use buprofezin, oil, pyriproxyfen, and spirotetramat.
Fungicides are used to prevent Phytophthora gummosis, Phytophthora root rot, and fruit diseasessuch as brown rot and Septoria spot. These diseases are exacerbated by wet, cool weather duringharvest. There was an increase in fungicide use in 2015, largely due to a substantial increase in
82

Figure 22: Acres of orange treated by the top 5 AIs of each AI type from 2011 to 2015.
83

the use of copper-based fungicides, the most widely used fungicides in oranges (Figures 21, 22,and A-16).
Weed management is important in citrus groves to prevent competition for nutrients and water,which affects tree growth and reduces yield. Excessive weed growth also impedes production andharvesting operations. Both preemergence and postemergence herbicides are used, as well asmechanical removal. Herbicide use decreased in 2015. Glyphosate, a postemergence herbicide,was the most-used herbicide. Simazine is widely used for pre- and post- emergence weedmanagement. Saflufenacil is a postemergence, burn-down herbicide that was first used in 2010and now replaces glyphosate for use on horseweed and fleabane due to resistance. Indaziflam is apreemergence herbicide, and its use has increased every year since it was first registered inCalifornia in 2011 (Figures 21, 22, and A-16).
Peach and nectarine
California grew 73 percent of all U.S. peaches (including 42 percent of fresh market peaches and97 percent of processed peaches) and 94 percent of nectarines in 2015. Most freestone peachesand nectarines are grown in Fresno, Tulare, and Kings counties in the central San Joaquin Valleyand sold on the fresh market. Clingstone peach, largely grown in the Sacramento Valley, isexclusively canned and processed into products such as baby food, fruit salad, and juice(Figure A-18). Peach and nectarine are discussed together because pest management issues forthe two crops are similar.
Table 25: Total reported pounds of all active ingredients (AI), acres treated, acres bearing, andprices for peach and nectarine each year from 2011 to 2015. Bearing acres and marketing yearaverage prices from 2011 to 2015 are from USDA(d), 2014-2016. Acres treated means cumulativeacres treated (see explanation p. 10).
2011 2012 2013 2014 2015
Pounds AI 4,569,629 4,018,666 3,735,901 3,615,539 4,388,377Acres Treated 1,338,479 1,370,963 1,351,003 1,397,501 1,466,231Acres Bearing 74,000 72,000 64,000 65,000 62,000Price/ton $ 451.35 $ 572.68 $ 527.72 $ 670.95 $ 669.56
The price per pound in Table 25 is an average of the prices of peach and nectarine, weighted bytheir respective acreages. Due to the wide variation in individual prices, it is best to consultUSDA and CDFA for specific prices.
Cumulative peach and nectarine acreage treated with insecticides and miticides increased 7percent in 2015 despite the decrease in bearing acreage (Figure 23). Mites, peach twig borer,
84

Figure 23: Acres of peach and nectarine treated by all AIs in the major types of pesticides from1995 to 2015.
85
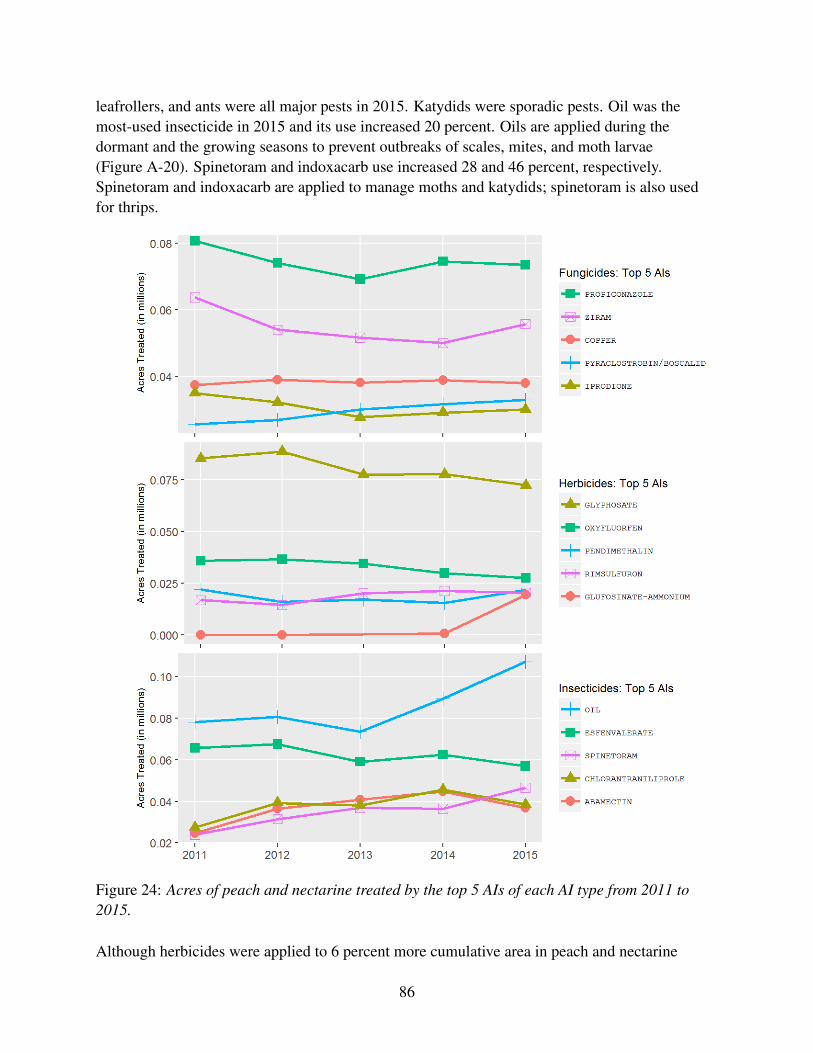
leafrollers, and ants were all major pests in 2015. Katydids were sporadic pests. Oil was themost-used insecticide in 2015 and its use increased 20 percent. Oils are applied during thedormant and the growing seasons to prevent outbreaks of scales, mites, and moth larvae(Figure A-20). Spinetoram and indoxacarb use increased 28 and 46 percent, respectively.Spinetoram and indoxacarb are applied to manage moths and katydids; spinetoram is also usedfor thrips.
Figure 24: Acres of peach and nectarine treated by the top 5 AIs of each AI type from 2011 to2015.
Although herbicides were applied to 6 percent more cumulative area in peach and nectarine
86
orchards, the planted acreage declined 4 percent (Figure 23). The area treated with glyphosatedeclined 7 percent. In contrast, pendimethalin was applied to 41 percent more area (Figures 24and A-19). Preemergence herbicides such as oxyfluorfen, pendimethalin, rimsulfuron, andindaziflam are applied to soil before the growing season to prevent weed sprouting.Postemergence herbicides such as glyphosate, 2,4-D, pyraflufen-ethyl, and paraquat kill existingweeds on contact. Glufosinate-ammonium was not used much in past years, but its use increaseddramatically in 2015. The use of glufosinate-ammonium, a broad-spectrum herbicide, may haveincreased in 2015 due to more west-coast availability of the AI in recent years and its ability tomanage glyphosate-resistant weed species.
Cumulative acres of peach and nectarine orchards treated with fungicides and sulfur during 2015increased 4 and 14 percent, respectively (Figure 23). Fungicide use increased while bearing acresdecreased, suggesting that disease pressure from brown rot, powdery mildew, scab, and rust mayhave increased. Sulfur is the standard treatment for preventing powdery mildew infection, but ithas no curative effect. Metconazole, a fungicide used to manage powdery mildew and brown rot,was used on a much larger scale than it has been in past years, possibly due to resistance of otherdemethylation inhibitor fungicides. Brown rot is the chief cause of postharvest fruit decay, butgray mold (known as Botrytis bunch rot when it infects grapes), Rhizopus rot (black bread mold),and sour rot can also pose significant problems.
Fumigant use increased 83 percent in 2015 (Figure 23). Fumigants are used in peach andnectarine orchards for rodent management and preplant soil treatments against arthropod pests,nematodes, pathogens, and weeds. Aluminum phosphide use decreased by 40 percent. Aluminumphosphide is used to manage rodents and works best in moist soils. Area treated with 1,3-D, themost widely used preplant soil fumigant, increased 79 percent and chloropicrin applicationincreased as well, indicating an uptick in orchard replanting. Field agricultural use of methylbromide is being phased out and has not been used since 2013. Changing relationships betweennematode infestations, pathogen infections, rootstock choices, and application patterns also affectfumigant selection and use from year to year.
A cumulative total of 1,338 acres of peaches and nectarines were treated with plant growthregulators in 2015. Gibberellins, plant hormones that regulate growth and development, wereapplied to 3 percent fewer acres. Amino ethoxy vinyl glycine hydrochloride, an ethylenesynthesis inhibitor, was applied to 219 acres. Both chemicals can enhance the firmness, size, andstorability of fruit. In many cultivars, gibberellins applied from May through July can reduce thepercentage of buds that produce flowers the following year. As a result, fruit numbers are reduced,resulting in less or no need for hand thinning and improved fruit quality. Increasing scarcity offield labor may have motivated some growers to experiment with plant growth regulators.
87

Pistachio
In 2015, California accounted for 233,000 bearing acres of pistachio, or about 98 percent of theU.S. crop (Table 26). The continuing drought, insufficient winter chilling hours, and warmweather during the bloom period combined to reduce the crop in California more than 47percent–from nearly 513 million pounds in 2014 to 271 million pounds in 2015. BecauseCalifornia produces the majority of pistachios nationally, the U.S. slipped as top producer in 2015to third place (24 percent) behind Iran (40 percent) and Turkey (28 percent).
Table 26: Total reported pounds of all active ingredients (AI), acres treated, acres bearing, andprices for pistachio each year from 2011 to 2015. Bearing acres and marketing year averageprices from 2011 to 2015 are from USDA(d), 2014-2016. Acres treated means cumulative acrestreated (see explanation p. 10).
2011 2012 2013 2014 2015
Pounds AI 4,047,461 3,971,860 4,742,470 4,850,489 7,822,331Acres Treated 2,364,014 2,779,239 3,369,690 3,765,680 4,308,556Acres Bearing 153,000 182,000 203,000 221,000 233,000Price/lb $ 1.98 $ 2.61 $ 3.48 $ 3.57 $ 2.48
Despite the bad year, pistachio acreage will continue to increase during the next few years due toa surge in planting around 2005. (Pistachio trees take 5 to 7 years to begin producing nuts andproduce optimally 15 years after planting.) Pistachio is grown in 22 counties, from SanBernardino County in the south to Tehama County in the north, with most grown in the SanJoaquin Valley counties of Kern, Madera, Fresno, and Tulare (Figure A-21). Pistachio treesusually alternate between high and low production each year and 2015 was projected to be alighter harvest.
In 2015, important arthropod pests of pistachio included mites, leaffooted plant bug, false chinchbug, stink bugs, and navel orangeworm, although pest populations were low in many areas.
Insecticide use, as measured by acres, increased 18 percent from 2014 to 2015, primarily due toadditional bearing acres, a later harvest, concern about early-season damage from Gill’smealybug, and possible late-season threats by leaffooted plant bug, stink bugs, and navelorangeworm (Figures 25, A-22, and A-23). Feeding by Gill’s mealybugs reduces carbohydratesavailable to pistachio trees, which results in poor development of the kernel. Growers applybuprofezin and imidacloprid early in the season to target immature crawlers moving to theclusters. In 2015, use of imidacloprid rose more than two-fold from April through July inresponse to Gill’s mealybug increasing in area and severity.
Feeding by leaffooted plant bugs can cause epicarp lesion to the nuts shortly after bloom and leadto kernel necrosis after shell hardening in June, darkening and ruining the flavor of the nutmeat.
88
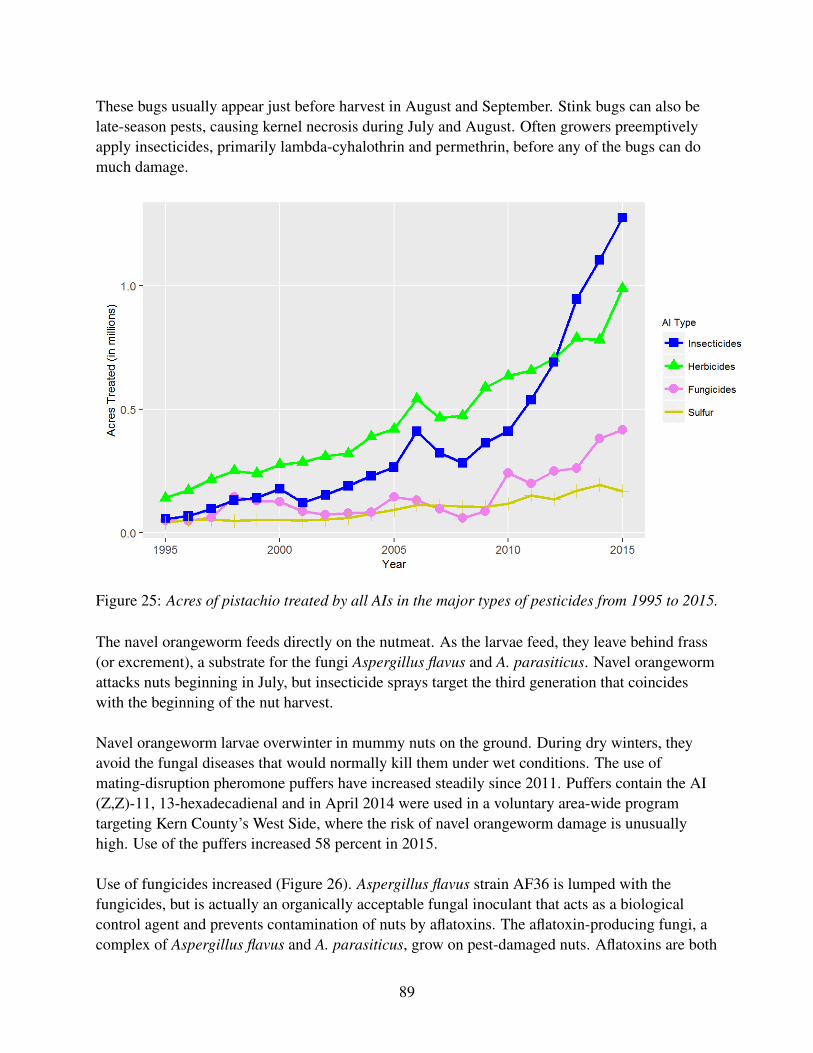
These bugs usually appear just before harvest in August and September. Stink bugs can also belate-season pests, causing kernel necrosis during July and August. Often growers preemptivelyapply insecticides, primarily lambda-cyhalothrin and permethrin, before any of the bugs can domuch damage.
Figure 25: Acres of pistachio treated by all AIs in the major types of pesticides from 1995 to 2015.
The navel orangeworm feeds directly on the nutmeat. As the larvae feed, they leave behind frass(or excrement), a substrate for the fungi Aspergillus flavus and A. parasiticus. Navel orangewormattacks nuts beginning in July, but insecticide sprays target the third generation that coincideswith the beginning of the nut harvest.
Navel orangeworm larvae overwinter in mummy nuts on the ground. During dry winters, theyavoid the fungal diseases that would normally kill them under wet conditions. The use ofmating-disruption pheromone puffers have increased steadily since 2011. Puffers contain the AI(Z,Z)-11, 13-hexadecadienal and in April 2014 were used in a voluntary area-wide programtargeting Kern County’s West Side, where the risk of navel orangeworm damage is unusuallyhigh. Use of the puffers increased 58 percent in 2015.
Use of fungicides increased (Figure 26). Aspergillus flavus strain AF36 is lumped with thefungicides, but is actually an organically acceptable fungal inoculant that acts as a biologicalcontrol agent and prevents contamination of nuts by aflatoxins. The aflatoxin-producing fungi, acomplex of Aspergillus flavus and A. parasiticus, grow on pest-damaged nuts. Aflatoxins are both
89

toxic and carcinogenic. About half of the strains of A. flavus found in the orchard areatoxigenic–that is, they do not produce aflatoxin. However, almost all A. parasiticus strainsproduce aflatoxins. When applied to orchards, the harmless, atoxigenic strain of Aspergillusflavus, AF36, crowds out aflatoxin-producing strains and drastically reduces aflatoxin levels in thenuts. In 2015, AF36 was used on more than 66 percent of all bearing trees. In 2014, A. flavussupplies were limited and the material was applied at a lower rate. The supply was restored in2015 and growers again applied it at the higher labeled rate.
Figure 26: Acres of pistachio treated by the top 5 AIs of each AI type from 2011 to 2015.
Sulfur, used as a low-risk miticide, is applied at several pounds per acre, and is used to manage
90

citrus flat mite. The mites feed on the stems of nut clusters as well as the nut hulls and nutsthemselves, which can lead to shell stain. As the weather warms up in June, mite populationsthrive and peak in late July and August. In 2015, growers began applying sulfur for mites in April,followed by lower-than-average amounts during June and July, and higher-than-average amountsduring September. Overall there was an average reduction from 2014 of 14 percent (Figure A-23).
Despite drought conditions during the growing season, use of all major herbicides increased, mostlikely in response to increased acreage (Figure 26). Often nonbearing trees, which lack shade todeter weed growth, require more herbicide than bearing trees. The postemergence herbicideglyphosate is applied year-round, but mostly during the summer months to manage weeds such asfield bindweed and cheeseweed. Under drought conditions both preemergence and postemergenceherbicides are needed to limit weed growth. Reducing competition from weeds extends limitedsupplies of irrigation water and protects young trees from the false chinch bug, which thrive onweeds next to the orchards.
Processing tomato
In 2015, processing tomato growers planted 299,000 acres, yielding 14.36 million tons, a 3percent yield increase from 2014. About 95 percent of U.S. processing tomatoes are grown inCalifornia. At 34 percent, the U.S. is the world’s top producer of processing tomatoes followed bythe European Union and China. California processing tomatoes, valued at $1.38 billion in 2015,are primarily grown in the Sacramento and San Joaquin valleys (Figure A-24). Fresno Countyleads the state in acreage with 31 percent (90,000 acres) of the statewide total, followed by YoloCounty (38,000 acres), Kings County (26,000 acres), and San Joaquin County (34,000 acres).Significant production also occurs in Merced, Colusa, Kern, Stanislaus, and Solano counties.
Table 27: Total reported pounds of all active ingredients (AI), acres treated, acres planted, andprices for processing tomato each year from 2011 to 2015. Planted acres and marketing yearaverage prices from 2011 to 2015 are from USDA(e), 2014-2016. Acres treated means cumulativeacres treated (see explanation p. 10).
2011 2012 2013 2014 2015
Pounds AI 14,051,151 13,458,272 13,891,438 15,007,034 15,210,646Acres Treated 3,118,947 2,991,155 3,432,076 3,701,016 4,042,172Acres Planted 255,000 260,000 263,000 292,000 299,000Price/ton $ 74.30 $ 75.00 $ 88.80 $ 98.60 $ 96.40
Overall, use of all pesticide AIs changed less than 1 percent in 2015 (Table 27). Total cumulativetreated acres of processing tomatoes increased 9 percent. Sulfur, metam-sodium,1,3-dichloropropene, and potassium N-methyldithiocarbamate (metam-potassium) accounted for87 percent of the total pounds of pesticide AIs applied, while sulfur, chlorothalonil, trifluralin,
91

azoxystrobin, glyphosate, s-metolachlor, and imidacloprid were applied to the most acreage. Themost-used type as measured by area treated was insecticides, which increased 13 percent(Figure 27). The most-used type as measured by amount AI applied was fungicide/insecticide(mostly sulfur and kaolin); use in this category decreased 3 percent.
Overall fungicide use, expressed as cumulative area treated, increased 18 percent and pounds ofAI increased 24 percent. Since 2009, use of difenoconazole and azoxystrobin has continuouslyincreased, likely because of increasingly severe powdery mildew outbreaks in the last few years.As a result of these outbreaks, growers must now apply preventive treatments instead of treatingpowdery mildew as it appears. Pyraclostrobin and fluxapyroxad use in 2015 increased by 4percent and 36 percent, respectively.
The acreage treated with herbicides increased 1 percent while the amount used was unchanged(Figure 27). Primary weeds of concern for processing tomatoes are nightshades and bindweed.Trifluralin and pendimethalin are used to manage bindweed and are often used in combinationwith metolachlor. The use of pendimethalin increased 9 percent, while trifluralin use decreased 4percent (Figures 28 and A-25). Glyphosate is commonly used for preplant treatments in latewinter and early spring; its use was unchanged (Figure A-26).
Figure 27: Acres of processing tomato treated by all AIs in the major types of pesticides from1995 to 2015.
Processing tomato growers primarily use three fumigants–metam-potassium, metam-sodium, and
92

Figure 28: Acres of processing tomato treated by the top 5 AIs of each AI type from 2011 to 2015.
93
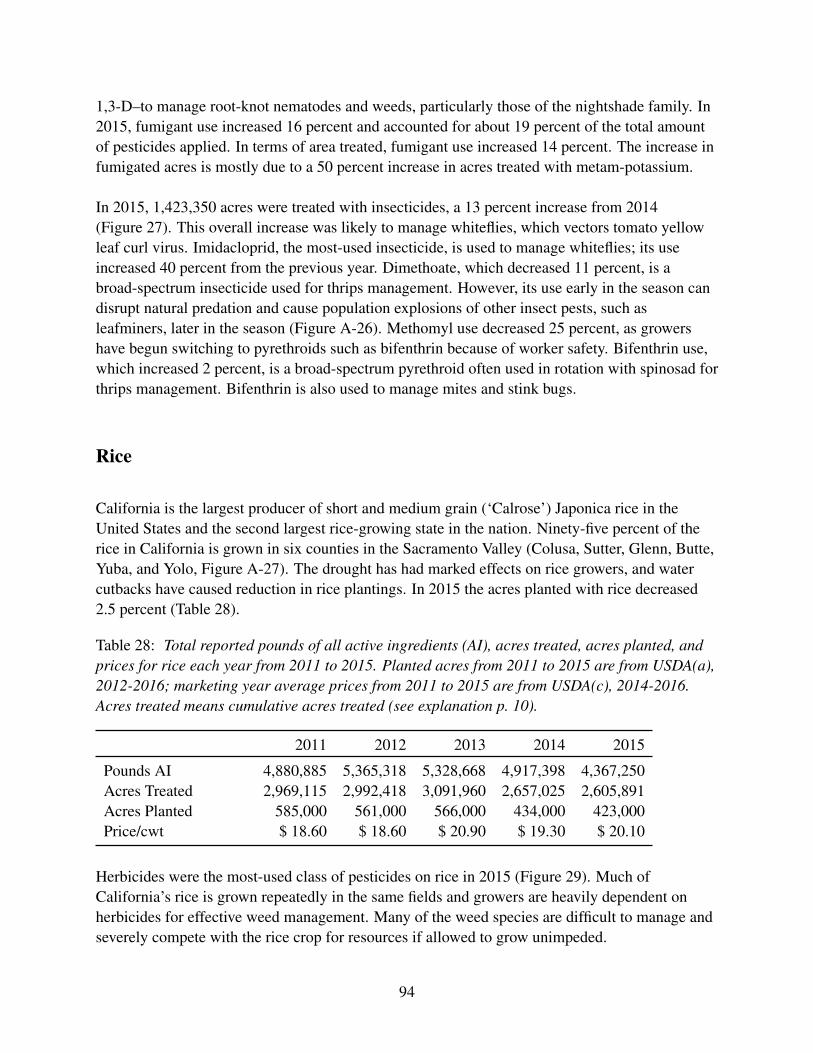
1,3-D–to manage root-knot nematodes and weeds, particularly those of the nightshade family. In2015, fumigant use increased 16 percent and accounted for about 19 percent of the total amountof pesticides applied. In terms of area treated, fumigant use increased 14 percent. The increase infumigated acres is mostly due to a 50 percent increase in acres treated with metam-potassium.
In 2015, 1,423,350 acres were treated with insecticides, a 13 percent increase from 2014(Figure 27). This overall increase was likely to manage whiteflies, which vectors tomato yellowleaf curl virus. Imidacloprid, the most-used insecticide, is used to manage whiteflies; its useincreased 40 percent from the previous year. Dimethoate, which decreased 11 percent, is abroad-spectrum insecticide used for thrips management. However, its use early in the season candisrupt natural predation and cause population explosions of other insect pests, such asleafminers, later in the season (Figure A-26). Methomyl use decreased 25 percent, as growershave begun switching to pyrethroids such as bifenthrin because of worker safety. Bifenthrin use,which increased 2 percent, is a broad-spectrum pyrethroid often used in rotation with spinosad forthrips management. Bifenthrin is also used to manage mites and stink bugs.
Rice
California is the largest producer of short and medium grain (‘Calrose’) Japonica rice in theUnited States and the second largest rice-growing state in the nation. Ninety-five percent of therice in California is grown in six counties in the Sacramento Valley (Colusa, Sutter, Glenn, Butte,Yuba, and Yolo, Figure A-27). The drought has had marked effects on rice growers, and watercutbacks have caused reduction in rice plantings. In 2015 the acres planted with rice decreased2.5 percent (Table 28).
Table 28: Total reported pounds of all active ingredients (AI), acres treated, acres planted, andprices for rice each year from 2011 to 2015. Planted acres from 2011 to 2015 are from USDA(a),2012-2016; marketing year average prices from 2011 to 2015 are from USDA(c), 2014-2016.Acres treated means cumulative acres treated (see explanation p. 10).
2011 2012 2013 2014 2015
Pounds AI 4,880,885 5,365,318 5,328,668 4,917,398 4,367,250Acres Treated 2,969,115 2,992,418 3,091,960 2,657,025 2,605,891Acres Planted 585,000 561,000 566,000 434,000 423,000Price/cwt $ 18.60 $ 18.60 $ 20.90 $ 19.30 $ 20.10
Herbicides were the most-used class of pesticides on rice in 2015 (Figure 29). Much ofCalifornia’s rice is grown repeatedly in the same fields and growers are heavily dependent onherbicides for effective weed management. Many of the weed species are difficult to manage andseverely compete with the rice crop for resources if allowed to grow unimpeded.
94
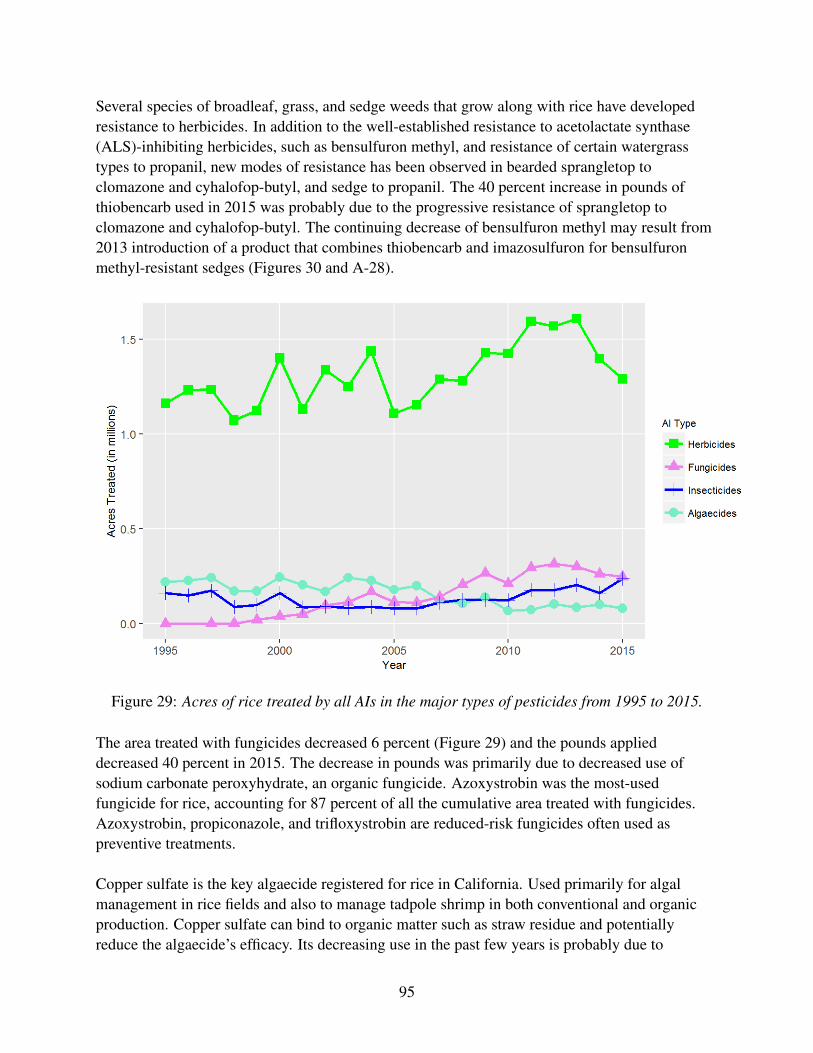
Several species of broadleaf, grass, and sedge weeds that grow along with rice have developedresistance to herbicides. In addition to the well-established resistance to acetolactate synthase(ALS)-inhibiting herbicides, such as bensulfuron methyl, and resistance of certain watergrasstypes to propanil, new modes of resistance has been observed in bearded sprangletop toclomazone and cyhalofop-butyl, and sedge to propanil. The 40 percent increase in pounds ofthiobencarb used in 2015 was probably due to the progressive resistance of sprangletop toclomazone and cyhalofop-butyl. The continuing decrease of bensulfuron methyl may result from2013 introduction of a product that combines thiobencarb and imazosulfuron for bensulfuronmethyl-resistant sedges (Figures 30 and A-28).
Figure 29: Acres of rice treated by all AIs in the major types of pesticides from 1995 to 2015.
The area treated with fungicides decreased 6 percent (Figure 29) and the pounds applieddecreased 40 percent in 2015. The decrease in pounds was primarily due to decreased use ofsodium carbonate peroxyhydrate, an organic fungicide. Azoxystrobin was the most-usedfungicide for rice, accounting for 87 percent of all the cumulative area treated with fungicides.Azoxystrobin, propiconazole, and trifloxystrobin are reduced-risk fungicides often used aspreventive treatments.
Copper sulfate is the key algaecide registered for rice in California. Used primarily for algalmanagement in rice fields and also to manage tadpole shrimp in both conventional and organicproduction. Copper sulfate can bind to organic matter such as straw residue and potentiallyreduce the algaecide’s efficacy. Its decreasing use in the past few years is probably due to
95
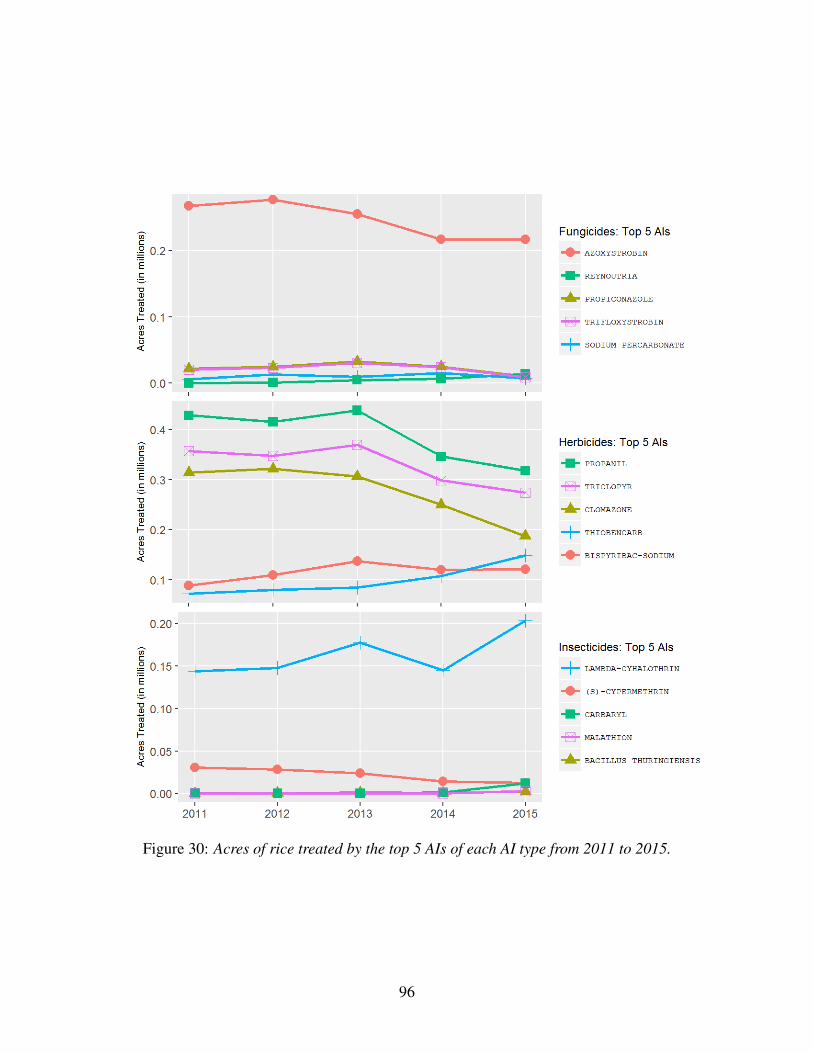
Figure 30: Acres of rice treated by the top 5 AIs of each AI type from 2011 to 2015.
96
increases in price, inconsistency of supply, and variability in efficacy. Sodium carbonateperoxyhydrate was registered as an alternative to copper sulfate to manage algae. However, it hasnever displaced the use of copper sulfate (Figure A-28).
Usually there is little insect pressure on California rice and insecticides are used on relatively fewacres (Figure 29). However, insect problems were high in 2015 and use of insecticides increasedin area and pounds applied. Armyworms have a naturally occurring level of tolerance toinsecticides. In 2015, no registered insecticide was effective in managing the significant outbreak.Multiple applications of different pesticides, predominantly pyrethroids and carbaryl, had littleeffect on the pest. An emergency exemption was issued for a methoxyfenozide-containingproduct. Rice water weevil is the major insect pest on California rice, but tadpole shrimp arebecoming more problematic, and in some areas they are the main pest of rice during the seedlingstage. Growers often rely on lambda-cyhalothrin, copper sulfate pentahydrate, and carbaryl,applied soon after flooding, to manage tadpole shrimp. Pyrethroids have been used intensivelyover the last 15 years for rice water weevil and manage this pest less effectively now (Figures 30and A-29).
Strawberry
In 2015 California produced 2.9 billion pounds of strawberries valued at more than $2.6 billion.Market prices determine how much of the crop goes to fresh market and how much is processed,and in 2015, about 78 percent of the crop went to fresh market. About 40,500 acres of strawberrywere planted and harvested in 2015, primarily along the Central and Southern Coast, with smallerbut significant production in the Central Valley (Table 29).
Table 29: Total reported pounds of all active ingredients (AI), acres treated, acres planted, andprices for strawberry each year from 2011 to 2015. Planted acres and marketing year averageprices from 2011 to 2015 are from USDA(d), 2014-2016. Acres treated means cumulative acrestreated (see explanation p. 10).
2011 2012 2013 2014 2015
Pounds AI 12,099,341 13,845,597 12,038,503 12,283,547 11,765,557Acres Treated 1,975,589 2,210,233 2,564,533 2,820,704 2,685,413Acres Planted 38,000 39,000 41,500 41,500 40,500Price/cwt $ 75.20 $ 77.10 $ 79.80 $ 88.40 $ 66.50
The major insect pests of strawberry are lygus bugs and larvae of moths and beetles, especially inthe Central and South Coast growing areas. Until recently, lygus bugs were not considered aproblem in the South Coast, but have become a serious threat probably due to warmer, drierwinters and increased diversity in the regional crop complex that supports this pest. Flonicamid
97

and acetamiprid, insecticides used to manage lygus bugs, ware applied to 36 and 27 percent moreacres in 2015, respectively (Figures 32, A-31, and A-32).
Figure 31: Acres of strawberry treated by all AIs in the major types of pesticides from 1995 to2015.
Herbicide use in 2015 decreased 14 percent. The biggest contributor to this decrease was a 29percent decrease in oxyfluorfen use.
Fungicides continue to be the most-used pesticides in 2015, as measured by area treated. Overall,fungicide use was relatively unchanged in 2015, with many AIs showing a slight decrease in use(Figure 31).
Strawberry production relies on several fumigants. Fumigants accounted for about 80 percent (asmeasured by pounds applied) of all pesticide AIs applied to strawberry in 2015, but less than twopercent of the planted total cumulative acreage was treated. However, most strawberry fields arefumigated. The area treated with fumigants in 2015 decreased 1 percent (Figures 32 and A-31).Methyl bromide use increased 18 percent; metam-sodium, 149 percent; and 1,3-dichloropropene,8 percent. Chloropicrin use decreased 5 percent. Methyl bromide is used primarily to managepathogens and nutsedge. Metam-sodium more effectively manages weeds, but is less effectivethan 1,3-dichloropropene or 1,3-dichloropropene plus chloropicrin against soil-borne diseases andnematodes. Fumigants are applied at higher rates than other pesticide types, such as fungicidesand insecticides, in part because they treat a volume of space rather than a surface, such as leaves
98

Figure 32: Acres of strawberry treated by the top 5 AIs of each AI type from 2011 to 2015.
99
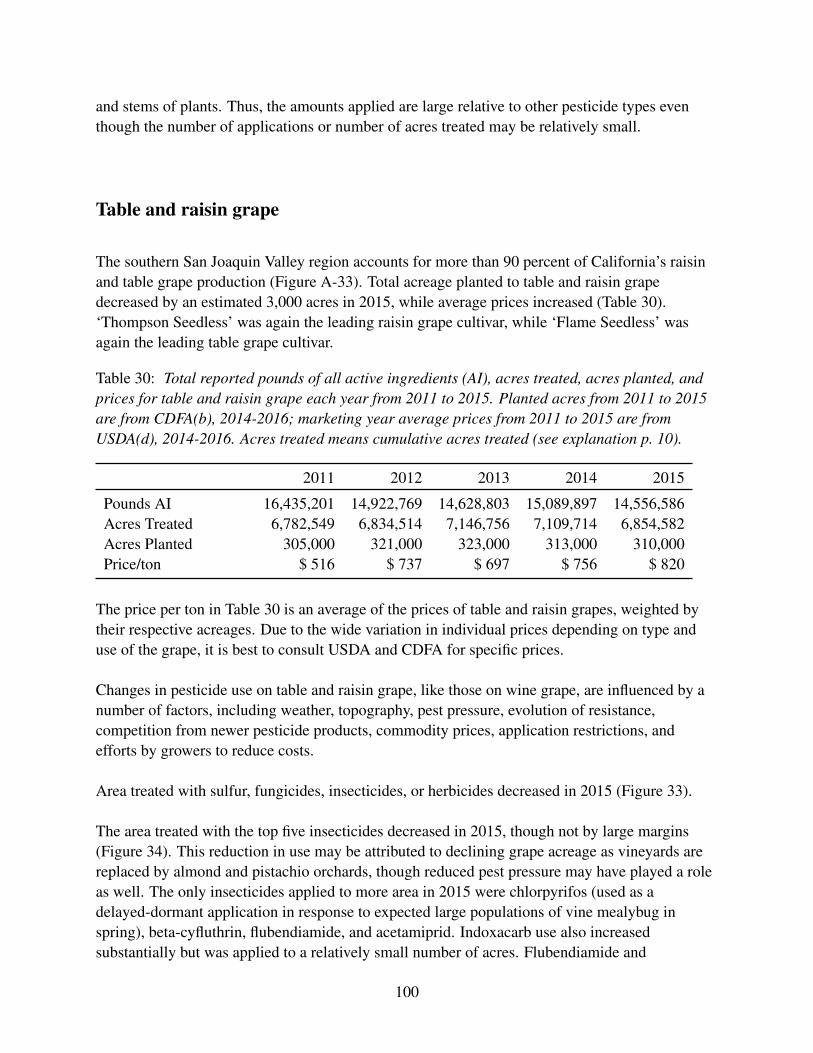
and stems of plants. Thus, the amounts applied are large relative to other pesticide types eventhough the number of applications or number of acres treated may be relatively small.
Table and raisin grape
The southern San Joaquin Valley region accounts for more than 90 percent of California’s raisinand table grape production (Figure A-33). Total acreage planted to table and raisin grapedecreased by an estimated 3,000 acres in 2015, while average prices increased (Table 30).‘Thompson Seedless’ was again the leading raisin grape cultivar, while ‘Flame Seedless’ wasagain the leading table grape cultivar.
Table 30: Total reported pounds of all active ingredients (AI), acres treated, acres planted, andprices for table and raisin grape each year from 2011 to 2015. Planted acres from 2011 to 2015are from CDFA(b), 2014-2016; marketing year average prices from 2011 to 2015 are fromUSDA(d), 2014-2016. Acres treated means cumulative acres treated (see explanation p. 10).
2011 2012 2013 2014 2015
Pounds AI 16,435,201 14,922,769 14,628,803 15,089,897 14,556,586Acres Treated 6,782,549 6,834,514 7,146,756 7,109,714 6,854,582Acres Planted 305,000 321,000 323,000 313,000 310,000Price/ton $ 516 $ 737 $ 697 $ 756 $ 820
The price per ton in Table 30 is an average of the prices of table and raisin grapes, weighted bytheir respective acreages. Due to the wide variation in individual prices depending on type anduse of the grape, it is best to consult USDA and CDFA for specific prices.
Changes in pesticide use on table and raisin grape, like those on wine grape, are influenced by anumber of factors, including weather, topography, pest pressure, evolution of resistance,competition from newer pesticide products, commodity prices, application restrictions, andefforts by growers to reduce costs.
Area treated with sulfur, fungicides, insecticides, or herbicides decreased in 2015 (Figure 33).
The area treated with the top five insecticides decreased in 2015, though not by large margins(Figure 34). This reduction in use may be attributed to declining grape acreage as vineyards arereplaced by almond and pistachio orchards, though reduced pest pressure may have played a roleas well. The only insecticides applied to more area in 2015 were chlorpyrifos (used as adelayed-dormant application in response to expected large populations of vine mealybug inspring), beta-cyfluthrin, flubendiamide, and acetamiprid. Indoxacarb use also increasedsubstantially but was applied to a relatively small number of acres. Flubendiamide and
100

Figure 33: Acres of table and raisin grape treated by all AIs in the major types of pesticides from1995 to 2015.
101

indoxacarb are used to manage moth larvae, particularly the western grapeleaf skeletonizer andcutworms. Two of these insecticides, chlorpyrifos and flubendiamide, have been underreevaluation by the U.S. EPA, which has proposed to revoke all tolerances for chlorpyrifos, and in2016 canceled registration of all flubendiamide products.
The areas treated with sulfur and other fungicides decreased marginally (Figure 33). Fungicideswith the greatest area treated were the same as in 2014 (Figure 34and A-34). Notable increases inuse were observed for fenhexamid and tetraconazole. Most applications were made in spring toearly summer, likely for powdery mildew, which posed a moderate problem early in the season in2015 (Figure A-35). Much of the pattern of fungicide use across years can be explained byrotation of fungicides as part of a resistance management program.
With drought continuing into the fourth year, weed growth may have been inhibited to someextent. The area treated with herbicides decreased again, a trend that has continued since thedrought began in 2012 (Figure 33). Glyphosate use decreased again while use ofglufosinate-ammonium increased substantially. Glufosinate-ammonium is an attractive alternativeto glyphosate, and after a period of unavailability, growers are likely shifting to this AI to reduceselection for glyphosate-resistant weeds. There were reductions in the area treated with all otherherbicides, except flazasulfuron, which was applied to a relatively small number of acres (lessthan 6,000). Flazasulfuron was registered in 2012 so its use might be expected to increase for aperiod. The area treated with fumigants in 2015 decreased by nearly half. Most of the decreasewas accounted for by reduced application of aluminum phosphide, an AI for rodent control. Thearea treated with 1,3-D increased by 30 percent.
The area treated with plant growth regulators (PGRs) decreased modestly in 2015. Gibberellinswere again used far more than other PGRs, followed by ethephon and hydrogen cyanamide,which has been increasingly used since 2009. Hydrogen cyanamide is applied after pruning topromote bud break.
102

Figure 34: Acres of table and raisin grape treated by the top 5 AIs of each AI type from 2011 to2015.
103

Walnut
California produces 99 percent of the walnuts grown in the United States. The California walnutindustry has more than 4,000 growers who farmed approximately 300,000 bearing acres in 2015(Table 31 and Figure A-36). Mild temperatures led to faster crop development and an earlierharvest despite a lack of chilling hours and the ongoing drought crisis. Walnut production wasestimated at 603,000 tons in 2015, an increase of about 6 percent from the previous year. Theprice per ton decreased almost 50 percent while bearing acreage increased 3 percent. Thedramatic price drop has been attributed to a combination of decreased demand due to stabilizingconsumption rates and an increase in foreign walnut supplies. The amount of applied pesticidesincreased 21 percent and area treated increased 20 percent. In general, pesticide use followedsimilar patterns seen in 2014, with increases in fungicides, insecticides, and herbicides, thoughoverall fumigant use was nearly unchanged. (Figure 35).
Table 31: Total reported pounds of all active ingredients (AI), acres treated, acres bearing, andprices for walnut each year from 2011 to 2015. Bearing acres and marketing year average pricesfrom 2011 to 2015 are from USDA(d), 2014-2016. Acres treated means cumulative acres treated(see explanation p. 10).
2011 2012 2013 2014 2015
Pounds AI 3,956,526 4,284,105 5,044,526 5,706,158 6,914,676Acres Treated 2,351,894 2,981,857 3,496,708 4,030,560 4,824,696Acres Bearing 245,000 270,000 280,000 290,000 300,000Price/ton $ 2,900 $ 3,030 $ 3,710 $ 3,340 $ 1,620
The area treated with insecticides, which includes miticides, increased 14 percent (Figure 35).Reasons include increased acreage and relatively warm temperatures throughout the growingseason, especially in the spring, which allowed insects to mature faster and shorten the timebetween generations. Pressure from walnut husk fly and navel orangeworm continued to increase.Abamectin, a miticide, remained the most-used insecticide/miticide because of its low cost andcontinued efficacy, while another miticide, hexythiazox, saw a large increase in area treated.Drought and hot weather conditions may have contributed to increased mite pressure.Additionally, bifenthrin, acetamiprid, chlorantraniliprole, and imidacloprid use increased(Figures 36 and A-37).
The 22 percent increase in area treated with herbicides reflects the increase in walnut acreage,especially in younger plantings, where weeds thrive until tree canopies are capable of shadingorchard floors (Figure 35). In addition, a dry winter adversely impacted or even prevented the useof preemergence herbicide programs and may have contributed to increased postemergenceherbicide use. A combination of price and good management of most broadleaf weeds, includingglyphosate-resistant hairy fleabane in the San Joaquin Valley, are likely contributors to the
104
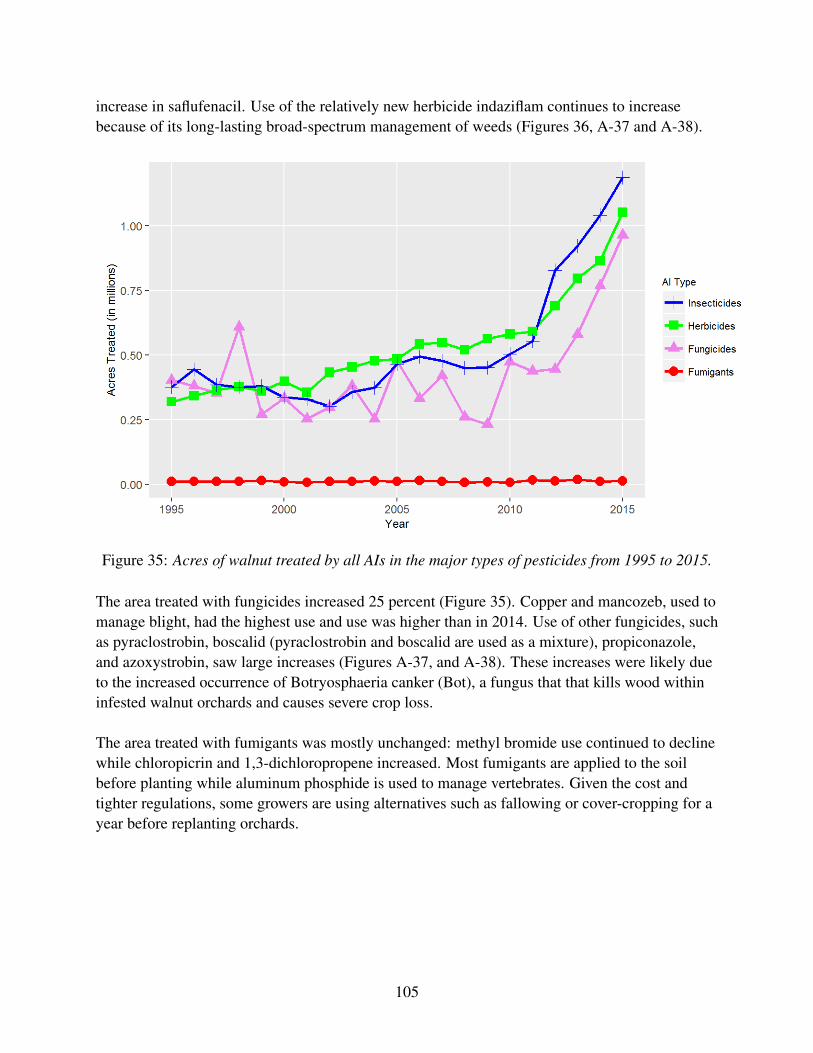
increase in saflufenacil. Use of the relatively new herbicide indaziflam continues to increasebecause of its long-lasting broad-spectrum management of weeds (Figures 36, A-37 and A-38).
Figure 35: Acres of walnut treated by all AIs in the major types of pesticides from 1995 to 2015.
The area treated with fungicides increased 25 percent (Figure 35). Copper and mancozeb, used tomanage blight, had the highest use and use was higher than in 2014. Use of other fungicides, suchas pyraclostrobin, boscalid (pyraclostrobin and boscalid are used as a mixture), propiconazole,and azoxystrobin, saw large increases (Figures A-37, and A-38). These increases were likely dueto the increased occurrence of Botryosphaeria canker (Bot), a fungus that that kills wood withininfested walnut orchards and causes severe crop loss.
The area treated with fumigants was mostly unchanged: methyl bromide use continued to declinewhile chloropicrin and 1,3-dichloropropene increased. Most fumigants are applied to the soilbefore planting while aluminum phosphide is used to manage vertebrates. Given the cost andtighter regulations, some growers are using alternatives such as fallowing or cover-cropping for ayear before replanting orchards.
105

Figure 36: Acres of walnut treated by the top 5 AIs of each AI type from 2011 to 2015.
106

Wine grape
There are four major wine grape production regions: North Coast (Lake, Mendocino, Napa,Sonoma, and Solano counties); Central Coast (Alameda, Monterey, San Luis Obispo, SantaBarbara, San Benito, Santa Cruz, and Santa Clara counties); northern San Joaquin Valley (SanJoaquin, Calaveras, Amador, Sacramento, Merced, Stanislaus, and Yolo counties); and southernSan Joaquin Valley (Fresno, Kings, Tulare, Kern, and Madera counties). (Figure A-39). Pest anddisease pressure may differ among these regions. The pooled figures in this report may not reflectdifferences in pesticide use patterns between production regions.
Changes in pesticide use on wine grape are influenced by a number of factors, including weather,topography, pest pressure, evolution of resistance, competition from newer pesticide products,commodity prices, application restrictions, efforts by growers to reduce costs, and increasedemphasis on sustainable farming.
Table 32: Total reported pounds of all active ingredients (AI), acres treated, acres planted, andprices for wine grape each year from 2011 to 2015. Planted acres from 2011 to 2015 are fromCDFA(b), 2014-2016; marketing year average prices from 2011 to 2015 are from USDA(d),2014-2016. Acres treated means cumulative acres treated (see explanation p. 10).
2011 2012 2013 2014 2015
Pounds AI 29,522,748 26,867,158 26,749,046 26,800,350 29,465,382Acres Treated 9,751,786 9,333,489 10,258,480 10,102,683 10,757,619Acres Planted 543,000 588,000 610,000 615,000 608,000Price/ton $ 637 $ 773 $ 753 $ 759 $ 679
The total amount of pesticides applied in 2015 and the cumulative area treated increased from2014 values (Table 32).All the major types of pesticides–sulfur, fungicides, herbicides, andinsecticides–increased in 2015, a recurring trend for all pesticide types except herbicides, whichtend to fluctuate more annually (Figure 37).
Vine mealybug continued to be a concern for growers. It has now been found throughout most ofthe grape-growing regions of California. The warm winters since 2012 have allowed vinemealybug populations to build up early in the season. In the North Coast region, a new pest, theVirginia creeper leafhopper, continued to cause substantial damage in some locations, as did thewestern grape leafhopper. While there is effective biological control for western grape leafhopper,Virginia creeper leafhopper infestations require insecticide applications. On the positive side, theEuropean grapevine moth was nearing eradication, which was officially declared in August 2016.
Oil, chlorpyrifos, thiamethoxam, clothianidin, chlorantraniliprole, fenpyroximate, and to a lesserextent imidacloprid were applied to more area than in 2014. Three of these insecticides(thiamethoxam, clothianidin, imidacloprid) are neonicotinoids used to manage mealybugs,
107

Figure 37: Acres of wine grape treated by all AIs in the major types of pesticides from 1995 to2015.
108

leafhoppers, and sharpshooters, and one is a miticide (fenproximate). Chlorantraniliprole is usedto manage moth larvae. The number of acres treated with spirotetramat, used on similar pests tothose treated with the neonicotinoids, differed little from 2014 but the number of pounds appliedincreased greatly, suggesting that it was being applied at the higher rates (Figures 38,A-40, andA-41).
Large vine mealybug populations in the southern San Joaquin Valley in 2015 sparked anappreciable increase in chlorpyrifos use. Chlorpyrifos is used as postharvest or delayed dormanttreatments to prevent spring buildup of vine mealybug populations. This increase comes at a timewhen the U.S. EPA has proposed a revocation of all tolerances for this insecticide.
Fungicide use increased slightly in 2015 (Figure 37), despite the dry conditions of the droughtthat generally do not favor fungal reproduction. Difenoconazole, cyflufenamid, potassiumbicarbonate, fenhexamid, and fluopyram had the largest increases in area treated. The top fivefungicides applied to the largest cumulative treated area changed little from 2014 (Figure 38). It islikely that growers were rotating AIs to slow the evolution of resistance.
Despite the drought’s potential inhibitory effect on weed growth, herbicide use increased in 2015(Figure 37). There was a decrease in use of herbicides in 2014, attributed in part to droughtconditions. The largest increases in 2015 were in the use of glufosinate-ammonium andflumioxazin (Figure 38), but notable increases occurred in 2,4-D and indaziflam as well.Indaziflam was registered in 2012. Glufosinate-ammonium, an herbicide that was difficult toacquire in the West a few years ago, is an attractive alternative to glyphosate. The large increasein its use did not come with a corresponding decrease in glyphosate use, however (Figure 38).
Fumigant use continued a decreasing trend that has been observed over the past four years, withthe exception of an increase in area treated with 1,3-D and to a lesser extent sodiumtetrathiocarbonate, the latter of which had been used on only 4 acres over the past two years. Theoverall decrease in fumigant use was due to fewer applications of aluminum phosphide for rodentmanagement.
Use of gibberelins decreased in 2015, though they were by far the most commonly applied plantgrowth regulator (PGR). Use of other PGRs was negligible in 2015.
109

Figure 38: Acres of wine grape treated by the top 5 AIs of each AI type from 2011 to 2015.
110

Sources of InformationAdaskaveg, J., D. Gubler and T. Michailides. 2013. Fungicides, bactericides, and biologicals for
deciduous tree fruit, nut, strawberry, and vine crops. UC Davis Dept. of Plant Pathology, UCKearney Agricultural Center, UC Statewide IPM Program. 53 pp.<http://www.ipm.ucdavis.edu/PDF/PMG/fungicideefficacytiming.pdf>
Adaskaveg, J. E., H. Forster, D. Thompson, D. Felts and K. Day. 2012. Epidemiology andManagement of Pre- and Post-Harvest Diseases of Fresh Market Stone Fruits. Annualresearch report submitted to the California Tree Fruit Agreement for 2010. 22 pp.<http://ucce.ucdavis.edu/files/repositoryfiles/CTFA2010 22.pdf-92530.pdf>
CDFA(a). 2016. California Department of Food and Agriculture - National Agricultural StatisticsService. 2015 California Almond Acreage Report. April 27, 2016. 8pp.<www.nass.usda.gov/Statistics by State/California/Publications/Acreage/index.php>
CDFA(a). 2015. California Department of Food and Agriculture - National Agricultural StatisticsService. 2014 California Almond Acreage Report. May 4, 2015. 8pp.<www.nass.usda.gov/Statistics by State/California/Publications/Acreage/index.php>
CDFA(a). 2014. California Department of Food and Agriculture - National Agricultural StatisticsService. 2013 California Almond Acreage Report. April 24, 2014. 8pp.<www.nass.usda.gov/Statistics by State/California/Publications/Acreage/index.php>
CDFA(a). 2013. California Department of Food and Agriculture - National Agricultural StatisticsService. 2012 California Almond Acreage Report. April 25, 2013. 8pp.<www.nass.usda.gov/Statistics by State/California/Publications/Acreage/index.php>
CDFA(b). 2016. California Department of Food and Agriculture - National Agricultural StatisticsService. California Grape Acreage Report 2015 Crop. April 14, 2016. 74 pp.<www.nass.usda.gov/Statistics by State/California/Publications/Acreage/index.php>
CDFA(b). 2015. California Department of Food and Agriculture - National Agricultural StatisticsService. California Grape Acreage Report 2014 Crop. April 16, 2015. 65 pp.<www.nass.usda.gov/Statistics by State/California/Publications/Acreage/index.php>
CDFA(b). 2014. California Department of Food and Agriculture - National Agricultural StatisticsService. California Grape Acreage Report 2013 Crop. April 15, 2014. 59 pp.<www.nass.usda.gov/Statistics by State/California/Publications/Acreage/index.php>
California Farm Bureau. Ag Alert. Various issues. <http://www.agalert.com/>
111

Ogawa, J.M. and H. English. 1991. Diseases of Temperate Zone Tree Fruit and Nut Crops. UCANR, Oakland, Calif. Pub. 3345. 461 pp.
University of California Agricultural and Natural Resources Field Notes.
University of California Integrated Pest Management (UC IPM). Pest Management Guidelines.<http://ipm.ucanr.edu/>.
USDA. United States Department of Agriculture - National Agricultural Statistics Service. CropProgress and Condition Reports. California Crop Weather. (weekly bulletins)<www.nass.usda.gov/Statistics by State/California/Publications/Crop Progress & Condition/>.
USDA. United States Department of Agriculture - National Agricultural Statistics Service(USDA). Quick Stats. <http://quickstats.nass.usda.gov>.
USDA(a). 2016. United States Department of Agriculture - National Agricultural StatisticsService. Acreage. June 30, 2016. 47 pp.<http://usda.mannlib.cornell.edu/usda/nass/Acre//2010s/2016/Acre-06-30-2016.pdf>
USDA(a). 2015. United States Department of Agriculture - National Agricultural StatisticsService. Acreage. June 30, 2015. 42 pp.<http://usda.mannlib.cornell.edu/usda/nass/Acre//2010s/2015/Acre-06-30-2015.pdf>
USDA(a). 2014. United States Department of Agriculture - National Agricultural StatisticsService. Acreage. June 30, 2014. 42 pp.<http://usda.mannlib.cornell.edu/usda/nass/Acre//2010s/2014/Acre-06-30-2014.pdf>
USDA(a). 2013. United States Department of Agriculture - National Agricultural StatisticsService. Acreage. June 28, 2013. 42 pp.<http://usda.mannlib.cornell.edu/usda/nass/Acre//2010s/2013/Acre-06-28-2013.pdf>
USDA(a). 2012. United States Department of Agriculture - National Agricultural StatisticsService. Acreage. June 29, 2012. 42 pp.<http://usda.mannlib.cornell.edu/usda/nass/Acre//2010s/2012/Acre-06-29-2012.pdf>
USDA(b). 2016. United States Department of Agriculture - National Agricultural StatisticsService. Citrus Fruits 2016 Summary. September 12, 2016. 36 pp.<http://usda.mannlib.cornell.edu/usda/nass/CitrFrui//2010s/2016/CitrFrui-09-12-2016.pdf>
USDA(b). 2015. United States Department of Agriculture - National Agricultural StatisticsService. Citrus Fruits 2015 Summary. September 17, 2015. 34 pp.<http://usda.mannlib.cornell.edu/usda/nass/CitrFrui//2010s/2015/CitrFrui-09-17-2015.pdf>
112

USDA(b). 2014. United States Department of Agriculture - National Agricultural StatisticsService. Citrus Fruits 2014 Summary. September 18, 2014. 36 pp.<http://usda.mannlib.cornell.edu/usda/nass/CitrFrui//2010s/2014/CitrFrui-09-18-2014.pdf>
USDA(b). 2013. United States Department of Agriculture - National Agricultural StatisticsService. Citrus Fruits 2013 Summary. September 19, 2013. 36 pp.<http://usda.mannlib.cornell.edu/usda/nass/CitrFrui//2010s/2013/CitrFrui-09-19-2013.pdf>
USDA(c). 2016. United States Department of Agriculture - National Agricultural StatisticsService. Crop Values 2015 Summary. February 24, 2016. 49 pp.<http://usda.mannlib.cornell.edu/usda/nass/CropValuSu//2010s/2016/CropValuSu-02-24-2016.pdf>
USDA(c). 2015. United States Department of Agriculture - National Agricultural StatisticsService. Crop Values 2014 Summary. February 24, 2015. 49 pp.<http://usda.mannlib.cornell.edu/usda/nass/CropValuSu//2010s/2015/CropValuSu-02-24-2015 correction.pdf>
USDA(c). 2014. United States Department of Agriculture - National Agricultural StatisticsService. Crop Values 2013 Summary. February 14, 2014. 49 pp.<http://usda.mannlib.cornell.edu/usda/nass/CropValuSu//2010s/2014/CropValuSu-02-14-2014.pdf>
USDA(d). 2016. United States Department of Agriculture - National Agricultural StatisticsService. Noncitrus Fruits and Nuts 2015 Summary. July 6, 2016. 107 pp.<http://usda.mannlib.cornell.edu/usda/nass/NoncFruiNu//2010s/2016/NoncFruiNu-07-06-2016.pdf>
USDA(d). 2015. United States Department of Agriculture - National Agricultural StatisticsService. Noncitrus Fruits and Nuts 2014 Summary. July 17, 2015. 98 pp.<http://usda.mannlib.cornell.edu/usda/nass/NoncFruiNu//2010s/2015/NoncFruiNu-07-17-2015.pdf>
USDA(d). 2014.United States Department of Agriculture - National Agricultural StatisticsService. Noncitrus Fruits and Nuts 2013 Summary. July 17, 2014. 79 pp.<http://usda.mannlib.cornell.edu/usda/nass/NoncFruiNu//2010s/2014/NoncFruiNu-07-17-2014 revision.pdf>
USDA(e). 2016. United States Department of Agriculture - National Agricultural StatisticsService. Vegetables 2015 Summary. February 4, 2016. 75 pp.<http://usda.mannlib.cornell.edu/usda/nass/VegeSumm//2010s/2016/VegeSumm-02-04-2016.pdf>
113

USDA(e). 2015. United States Department of Agriculture - National Agricultural StatisticsService. Vegetables 2014 Summary. January 29, 2015. 83 pp.<http://usda.mannlib.cornell.edu/usda/nass/VegeSumm//2010s/2015/VegeSumm-01-29-2015.pdf>
USDA(e). 2014. United States Department of Agriculture - National Agricultural StatisticsService. Vegetables 2013 Summary. March 27, 2014. 83 pp.<http://usda.mannlib.cornell.edu/usda/nass/VegeSumm//2010s/2014/VegeSumm-03-27-2014.pdf>
Varela, Lucia G.; Rhonda J. Smith; and Glenn T. McGourty. 2013. Sonoma County Farm News,July.
Weksler, A., A. Dagar, H. Friedman and S. Lurie. 2009. The effect of gibberellin on firmness andstorage potential of peaches and nectarines. Proceedings of the VII International PeachSymposium. International Society for Horticultural Science Acta Horticulturae 962.<http://www.actahort.org/books/962/962 80.htm>
Western Farm Press. Various issues. <http://www.westernfarmpress.com/>
And many thanks to all the contributions and expertise from County Agricultural Commissioners,growers, University of California Cooperative Extension Area Integrated Pest ManagementAdvisors and Farm Advisors, pest control advisors, commodity marketing boards, and Universityof California researchers.
114

Appendix
115
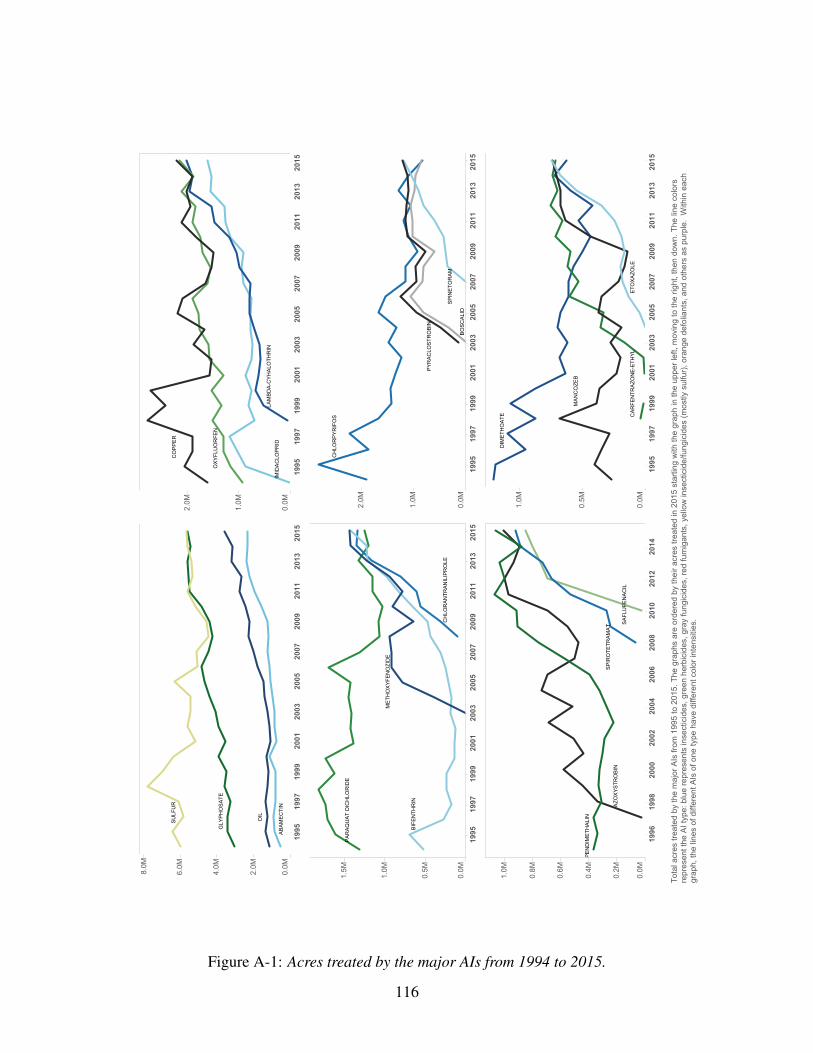
1995
1997
1999
2001
2003
2005
2007
2009
2011
2013
2015
0.0M
2.0M
4.0M
6.0M
8.0M
ABAMECTIN
OIL
GLYPHOSATE
SULFUR
1995
1997
1999
2001
2003
2005
2007
2009
2011
2013
2015
0.0M
1.0M
2.0M
IMIDACLOPRID
LAMBDA-CYHALOTHRIN
OXYFLUORFEN
COPPER
1995
1997
1999
2001
2003
2005
2007
2009
2011
2013
2015
0.0M
0.5M
1.0M
1.5M
PARAQUAT DICHLORIDE
CHLORANTRANILIPROLE
BIFENTHRIN
METHOXYFENOZIDE
1995
1997
1999
2001
2003
2005
2007
2009
2011
2013
2015
0.0M
1.0M
2.0M
CHLORPYRIFOS
BOSCALID
SPINETORAM
PYRACLOSTROBIN
1996
1998
2000
2002
2004
2006
2008
2010
2012
2014
0.0M
0.2M
0.4M
0.6M
0.8M
1.0M
SAFLUFENACIL
SPIROTETRAMAT
AZOXYSTROBIN
PENDIMETHALIN
1995
1997
1999
2001
2003
2005
2007
2009
2011
2013
2015
0.0M
0.5M
1.0M
DIMETHOATE CARFENTRAZONE-ETHYL
MANCOZEB
ETOXAZOLE
Total acres treated by the major AIs from 1995 to 2015. The graphs are ordered by their acres treated in 2015 starting with the graph in the upper left, moving to the right, then down. The line colors
represent the AI type: blue represents insecticides, green herbicides, gray fungicides, red fumigants, yellow insecticide/fungicides (mostly sulfur), orange defoliants, and others as purple. Within each
graph, the lines of different AIs of one type have different color intensities.
Figure A-1: Acres treated by the major AIs from 1994 to 2015.
116

Figure A-2: Acres treated by the major AIs and crops in 2015.
117
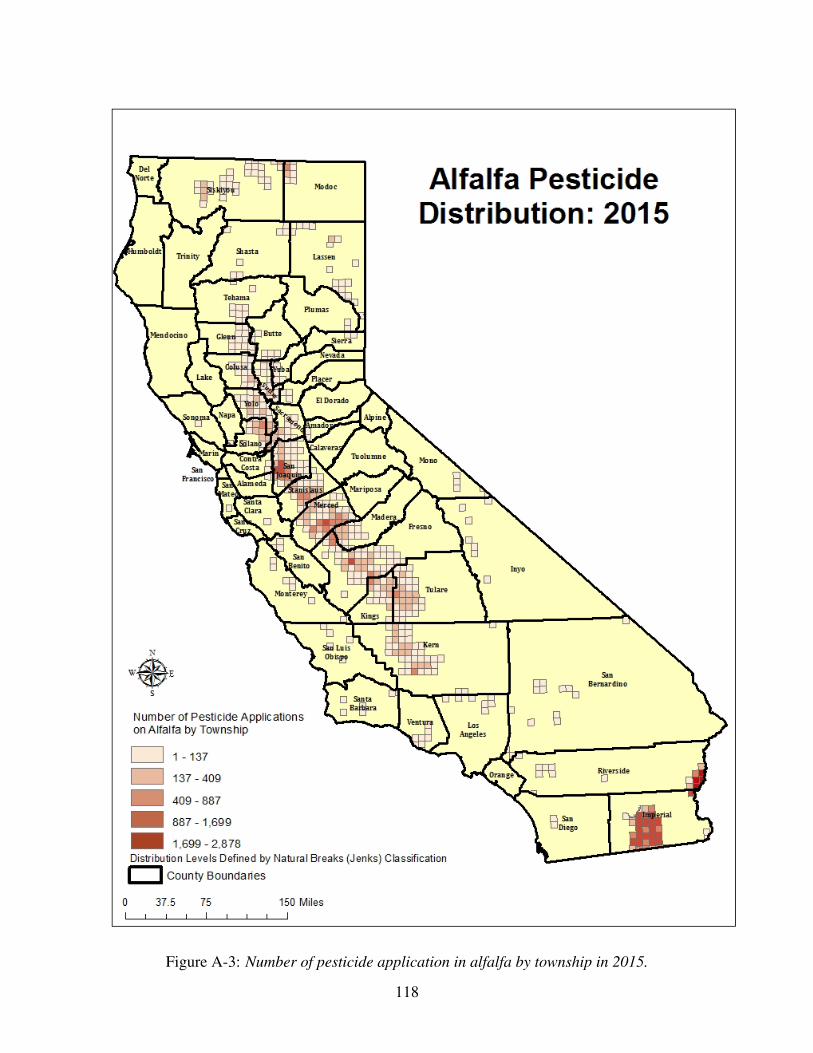
Figure A-3: Number of pesticide application in alfalfa by township in 2015.
118

1995
1997
1999
2001
2003
2005
2007
2009
2011
2013
2015
0K
200K
400K
GLYPHOSATE
DIMETHOATE
PENDIMETHALIN
LAMBDA-CYHALOTHRIN
1995
1997
1999
2001
2003
2005
2007
2009
2011
2013
2015
0K
200K
400K
600K
INDOXACARB
PARAQUAT DICHLORIDE CLETHODIM
CHLORPYRIFOS
1995
1997
1999
2001
2003
2005
2007
2009
2011
2013
2015
0K
100K
200K
300K
FLUBENDIAMIDE
HEXAZINONE
TRIFLURALIN
IMAZAMOX, AMMONIUM SALT
1995
1997
1999
2001
2003
2005
2007
2009
2011
2013
2015
0K50K
100K
150K
BETA-CYFLUTHRIN FLUMIOXAZIN
METHOXYFENOZIDE
(S)-CYPERMETHRIN
1995
1997
1999
2001
2003
2005
2007
2009
2011
2013
2015
0K50K
100K
150K
200K
FLONICAMID
PERMETHRIN
MALATHION
IMAZETHAPYR, AMMONIUM SAL
1995
1997
1999
2001
2003
2005
2007
2009
2011
2013
2015
0K50K
100K
150K
200K
ALUMINUM PHOSPHIDE
DIURON
EPTC
FLUPYRADIFURONE
Alfalfa acres treated by the major AIs from 1995 to 2015. The graphs are ordered by the acres treated in 2015 starting with the largest amount in the upper left, moving to the right, then down. The line
colors represent the AI type: blue represents insecticides, green herbicides, gray fungicides, red fumigants, insecticide/fungicides yellow, defoliants orange, and others purple. Within each graph, the lines
of different AIs of one type have different color intensities
Figure A-4: Acres of alfalfa treated by the major AIs from 1994 to 2015.
119

AI 2012 2013 2014 2015
JANUARY
FEBRUARY
MARCH
APRIL
MAY
JUNE
JULY
AUGUST
SEPTEMB..
OCTOBER
NOVEMBER
DECEMBER
JANUARY
FEBRUARY
MARCH
APRIL
MAY
JUNE
JULY
AUGUST
SEPTEMB..
OCTOBER
NOVEMBER
DECEMBER
JANUARY
FEBRUARY
MARCH
APRIL
MAY
JUNE
JULY
AUGUST
SEPTEMB..
OCTOBER
NOVEMBER
DECEMBER
JANUARY
FEBRUARY
MARCH
APRIL
MAY
JUNE
JULY
AUGUST
SEPTEMB..
OCTOBER
NOVEMBER
DECEMBER
LAMBDA-CYHALOTHRIN
PENDIMETHALIN
DIMETHOATE
GLYPHOSATE
CHLORPYRIFOS
CLETHODIM
PARAQUAT DICHLORIDE
INDOXACARB
IMAZAMOX, AMMONIUMSALT
TRIFLURALIN
HEXAZINONE
FLUBENDIAMIDE
(S)-CYPERMETHRIN
METHOXYFENOZIDE
FLUMIOXAZIN
0K
100K
200K
300K
0K
100K
200K
300K
0K
100K
200K
300K
0K
100K
200K
300K
0K
100K
200K
300K
0K
100K
200K
300K
0K
100K
200K
300K
0K
100K
200K
300K
0K
100K
200K
300K
0K
100K
200K
300K
0K
100K
200K
300K
0K
100K
200K
300K
0K
100K
200K
300K
0K
100K
200K
300K
0K
100K
200K
300K
AI TYPEHERBICIDEINSECTICIDE
Figure A-5: Acres of alfalfa treated by the major AIs by month and AI type from 2011 to 2015.
120

Figure A-6: Number of pesticide application in almond by township in 2015.
121
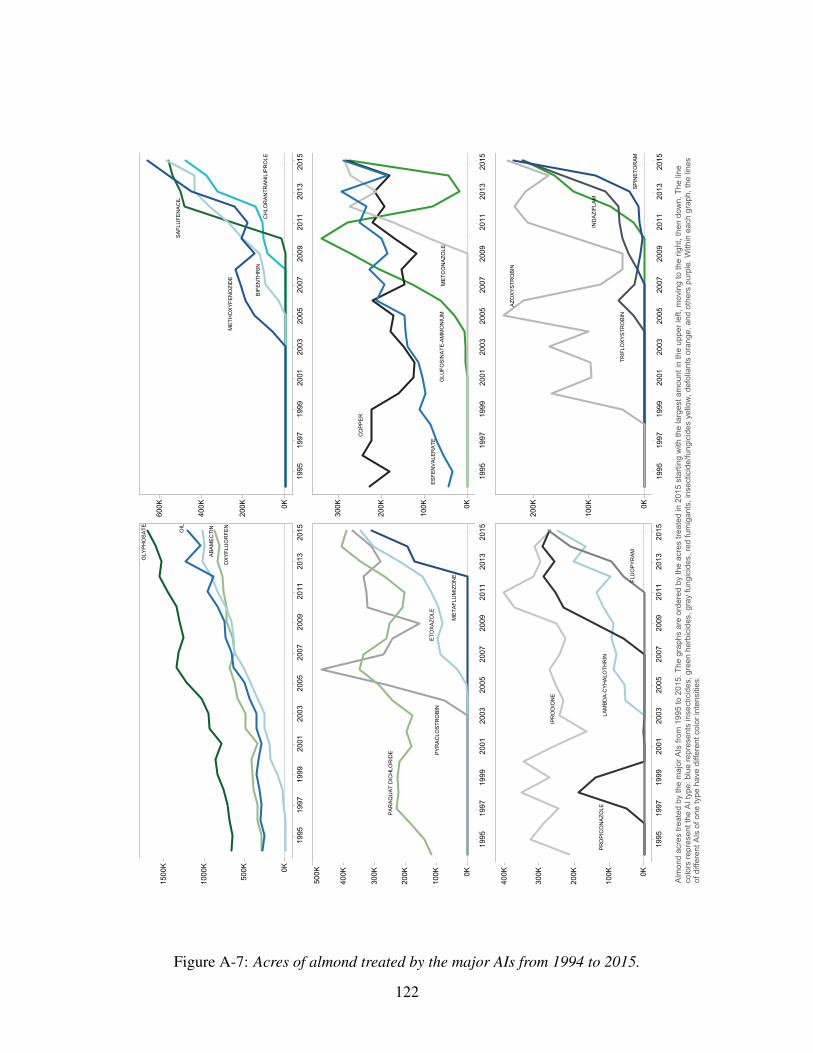
1995
1997
1999
2001
2003
2005
2007
2009
2011
2013
2015
0K
500K
1000K
1500K
OXYFLUORFEN
ABAMECTINOIL
GLYPHOSATE
1995
1997
1999
2001
2003
2005
2007
2009
2011
2013
2015
0K
200K
400K
600K
CHLORANTRANILIPROLE
SAFLUFENACIL
BIFENTHRIN
METHOXYFENOZIDE
1995
1997
1999
2001
2003
2005
2007
2009
2011
2013
2015
0K
100K
200K
300K
400K
500K
METAFLUMIZONE
ETOXAZOLE
PYRACLOSTROBIN
PARAQUAT DICHLORIDE
1995
1997
1999
2001
2003
2005
2007
2009
2011
2013
2015
0K
100K
200K
300K
GLUFOSINATE-AMMONIUM
COPPER
METCONAZOLE
ESFENVALERATE
1995
1997
1999
2001
2003
2005
2007
2009
2011
2013
2015
0K
100K
200K
300K
400K
LAMBDA-CYHALOTHRIN
IPRODIONE
PROPICONAZOLE
FLUOPYRAM
1995
1997
1999
2001
2003
2005
2007
2009
2011
2013
2015
0K
100K
200K
INDAZIFLAM
TRIFLOXYSTROBIN
SPINETORAM
AZOXYSTROBIN
Almond acres treated by the major AIs from 1995 to 2015. The graphs are ordered by the acres treated in 2015 starting with the largest amount in the upper left, moving to the right, then down. The line
colors represent the AI type: blue represents insecticides, green herbicides, gray fungicides, red fumigants, insecticide/fungicides yellow, defoliants orange, and others purple. Within each graph, the lines
of different AIs of one type have different color intensities.
Figure A-7: Acres of almond treated by the major AIs from 1994 to 2015.
122

AI 2012 2013 2014 2015
JANUARY
FEBRUARY
MARCH
APRIL
MAY
JUNE
JULY
AUGUST
SEPTEMB..
OCTOBER
NOVEMBER
DECEMBER
JANUARY
FEBRUARY
MARCH
APRIL
MAY
JUNE
JULY
AUGUST
SEPTEMB..
OCTOBER
NOVEMBER
DECEMBER
JANUARY
FEBRUARY
MARCH
APRIL
MAY
JUNE
JULY
AUGUST
SEPTEMB..
OCTOBER
NOVEMBER
DECEMBER
JANUARY
FEBRUARY
MARCH
APRIL
MAY
JUNE
JULY
AUGUST
SEPTEMB..
OCTOBER
NOVEMBER
DECEMBER
GLYPHOSATE
OIL
ABAMECTIN
OXYFLUORFEN
METHOXYFENOZIDE
BIFENTHRIN
SAFLUFENACIL
CHLORANTRANILIPROLE
PARAQUAT DICHLORIDE
PYRACLOSTROBIN
ETOXAZOLE
METAFLUMIZONE
ESFENVALERATE
METCONAZOLE
COPPER
0K
200K
400K
0K
200K
400K
0K
200K
400K
0K
200K
400K
0K
200K
400K
0K
200K
400K
0K
200K
400K
0K
200K
400K
0K
200K
400K
0K
200K
400K
0K
200K
400K
0K
200K
400K
0K
200K
400K
0K
200K
400K
0K
200K
400K
AI TYPEFUNGICIDEHERBICIDEINSECTICIDE
Figure A-8: Acres of almond treated by the major AIs by month and AI type from 2011 to 2015.
123

Figure A-9: Number of pesticide application in carrot by township in 2015.
124

1995
1997
1999
2001
2003
2005
2007
2009
2011
2013
2015
0K50K
100K
COPPER
MEFENOXAM
LINURON
SULFUR
1995
1997
1999
2001
2003
2005
2007
2009
2011
2013
2015
0K10K
20K
30K
FLUAZIFOP-P-BUTYL
AZOXYSTROBIN
PENDIMETHALIN
PYRACLOSTROBIN
1995
1997
1999
2001
2003
2005
2007
2009
2011
2013
2015
0K10K
20K
30K
40K
50K
TRIFLURALIN
QST 713 STRAIN OF DRIED B
BOSCALID
PAECILOMYCES LILACINUS ST
1995
1997
1999
2001
2003
2005
2007
2009
2011
2013
2015
0K10K
20K
30K
POTASSIUM N-METHYLDITHIOC
CHLOROTHALONIL
CYAZOFAMID
ESFENVALERATE
1995
1997
1999
2001
2003
2005
2007
2009
2011
2013
2015
0K20K
40K
60K
80K
1,3-DICHLOROPROPENE
IPRODIONE
CLETHODIM
FENAMIDONE
1995
1997
1999
2001
2003
2005
2007
2009
2011
2013
2015
0K10K
20K
30K
40K
METAM-SODIUM
PROPICONAZOLE
EPTC
IMIDACLOPRID
Carrot acres treated by the major AIs from 1995 to 2015. The graphs are ordered by the acres treated in 2015 starting with the largest amount in the upper left, moving to the right, then down. The line
colors represent the AI type: blue represents insecticides, green herbicides, gray fungicides, red fumigants, insecticide/fungicides yellow, defoliants orange, and others purple. Within each graph, the lines
of different AIs of one type have different color intensities.
Figure A-10: Acres of carrot treated by the major AIs from 1994 to 2015.
125

AI 2012 2013 2014 2015
JANUARY
FEBRUARY
MARCH
APRIL
MAY
JUNE
JULY
AUGUST
SEPTEMB..
OCTOBER
NOVEMBER
DECEMBER
JANUARY
FEBRUARY
MARCH
APRIL
MAY
JUNE
JULY
AUGUST
SEPTEMB..
OCTOBER
NOVEMBER
DECEMBER
JANUARY
FEBRUARY
MARCH
APRIL
MAY
JUNE
JULY
AUGUST
SEPTEMB..
OCTOBER
NOVEMBER
DECEMBER
JANUARY
FEBRUARY
MARCH
APRIL
MAY
JUNE
JULY
AUGUST
SEPTEMB..
OCTOBER
NOVEMBER
DECEMBER
SULFUR
LINURON
MEFENOXAM
PYRACLOSTROBIN
PENDIMETHALIN
CYAZOFAMID
AZOXYSTROBIN
QST 713 STRAIN OF DRIEDBACILLUS SUBTILIS
COPPER
BOSCALID
FLUAZIFOP-P-BUTYL
CHLOROTHALONIL
TRIFLURALIN
ESFENVALERATE
PAECILOMYCESLILACINUS STRAIN 251
0K
5K
10K
15K
0K
5K
10K
15K
0K
5K
10K
15K
0K
5K
10K
15K
0K
5K
10K
15K
0K
5K
10K
15K
0K
5K
10K
15K
0K
5K
10K
15K
0K
5K
10K
15K
0K
5K
10K
15K
0K
5K
10K
15K
0K
5K
10K
15K
0K
5K
10K
15K
0K
5K
10K
15K
0K
5K
10K
15K
AI TYPEFUNGICIDEHERBICIDEINSECTICIDE
Figure A-11: Acres of carrot treated by the major AIs by month and AI type from 2011 to 2015.
126

Figure A-12: Number of pesticide application in cotton by township in 2015.
127

1995
1997
1999
2001
2003
2005
2007
2009
2011
2013
2015
0K
200K
400K
600K
800K
1000K
DIURONMEPIQUAT CHLORIDE
FLONICAMID
GLYPHOSATE
1995
1997
1999
2001
2003
2005
2007
2009
2011
2013
2015
0K
200K
400K
600K
800K
1000K
PYRAFLUFEN-ETHYL
ABAMECTIN
ETHEPHON
THIDIAZURON
1995
1997
1999
2001
2003
2005
2007
2009
2011
2013
2015
0K
100K
200K
300K
400K
BIFENTHRIN
UREA DIHYDROGEN SULFATE
PARAQUAT DICHLORIDE
ACETAMIPRID
1995
1997
1999
2001
2003
2005
2007
2009
2011
2013
2015
0K50K
100K
150K
200K
DIMETHOATE
IMIDACLOPRID
NOVALURON
1995
1997
1999
2001
2003
2005
2007
2009
2011
2013
2015
0K50K
100K
150K
200K
OXYFLUORFEN
LAMBDA-CYHALOTHRIN
ACEPHATE
1995
1997
1999
2001
2003
2005
2007
2009
2011
2013
2015
0K
100K
200K
300K
FLUBENDIAMIDE
BUPROFEZIN
INDOXACARB
500K
1000K
1500K
BIFENTHRIN
PARAQUAT DICHLORIDE
500K
1000K
1500K
CHLORPYRIFOS
300K
400K
500K
600K
NALED
OXYFLUORFEN
300K
350K
400K
450K
500K
INDOXACARB
TRIFLURALIN
Cotton acres treated by the major AIs from 1995 to 2015. The graphs are ordered by the acres treated in 2015 starting with the largest amount in the upper left, moving to the right, then down. The line
colors represent the AI type: blue represents insecticides, green herbicides, gray fungicides, red fumigants, insecticide/fungicides yellow, defoliants orange, and others purple. Within each graph, the lines
of different AIs of one type have different color intensities.
Figure A-13: Acres of cotton treated by the major AIs from 1994 to 2015.
128

AI 2012 2013 2014 2015
JANUARY
FEBRUARY
MARCH
APRIL
MAY
JUNE
JULY
AUGUST
SEPTEMB..
OCTOBER
NOVEMBER
DECEMBER
JANUARY
FEBRUARY
MARCH
APRIL
MAY
JUNE
JULY
AUGUST
SEPTEMB..
OCTOBER
NOVEMBER
DECEMBER
JANUARY
FEBRUARY
MARCH
APRIL
MAY
JUNE
JULY
AUGUST
SEPTEMB..
OCTOBER
NOVEMBER
DECEMBER
JANUARY
FEBRUARY
MARCH
APRIL
MAY
JUNE
JULY
AUGUST
SEPTEMB..
OCTOBER
NOVEMBER
DECEMBER
GLYPHOSATE
FLONICAMID
MEPIQUAT CHLORIDE
THIDIAZURON
DIURON
ETHEPHON
ABAMECTIN
PYRAFLUFEN-ETHYL
ACETAMIPRID
PARAQUAT DICHLORIDE
UREA DIHYDROGENSULFATE
BIFENTHRIN
NOVALURON
CHLORPYRIFOS
IMIDACLOPRID
0K
100K
200K
0K
100K
200K
0K
100K
200K
0K
100K
200K
0K
100K
200K
0K
100K
200K
0K
100K
200K
0K
100K
200K
0K
100K
200K
0K
100K
200K
0K
100K
200K
0K
100K
200K
0K
100K
200K
0K
100K
200K
0K
100K
200K
AI TYPEHARVEST_AIDHERBICIDEINSECTICIDE
Figure A-14: Acres of cotton treated by the major AIs by month and AI type from 2011 to 2015.
129

Figure A-15: Number of pesticide application in orange by township in 2015.
130

1995
1997
1999
2001
2003
2005
2007
2009
2011
2013
2015
0K
100K
200K
300K
400K
2,4-D
COPPER
GLYPHOSATE
OIL
1995
1997
1999
2001
2003
2005
2007
2009
2011
2013
2015
0K50K
100K
ABAMECTIN
SPIROTETRAMAT
THIAMETHOXAM
SPINETORAM
1995
1997
1999
2001
2003
2005
2007
2009
2011
2013
2015
0K20K
40K
60K
GIBBERELLINS
INDAZIFLAM
IMIDACLOPRID
PYRIPROXYFEN
1995
1997
1999
2001
2003
2005
2007
2009
2011
2013
2015
0K20K
40K
60K
METALDEHYDE
SAFLUFENACIL
RIMSULFURON
BETA-CYFLUTHRIN
1995
1997
1999
2001
2003
2005
2007
2009
2011
2013
2015
0K50K
100K
BACILLUS THURINGIENSIS
(S)-CYPERMETHRIN
FENPROPATHRIN
CHLORPYRIFOS
1995
1997
1999
2001
2003
2005
2007
2009
2011
2013
2015
0K50K
100K
SIMAZINE
ACETAMIPRID
DIFLUBENZURON
DIURON
Orange acres treated by the major AIs from 1995 to 2015. The graphs are ordered by the acres treated in 2015 starting with the largest amount in the upper left, moving to the right, then down. The line
colors represent the AI type: blue represents insecticides, green herbicides, gray fungicides, red fumigants, insecticide/fungicides yellow, defoliants orange, and others purple. Within each graph, the lines
of different AIs of one type have different color intensities.
Figure A-16: Acres of orange treated by the major AIs from 1994 to 2015.
131

AI 2012 2013 2014 2015
JANUARY
FEBRUARY
MARCH
APRIL
MAY
JUNE
JULY
AUGUST
SEPTEMB..
OCTOBER
NOVEMBER
DECEMBER
JANUARY
FEBRUARY
MARCH
APRIL
MAY
JUNE
JULY
AUGUST
SEPTEMB..
OCTOBER
NOVEMBER
DECEMBER
JANUARY
FEBRUARY
MARCH
APRIL
MAY
JUNE
JULY
AUGUST
SEPTEMB..
OCTOBER
NOVEMBER
DECEMBER
JANUARY
FEBRUARY
MARCH
APRIL
MAY
JUNE
JULY
AUGUST
SEPTEMB..
OCTOBER
NOVEMBER
DECEMBER
OIL
GLYPHOSATE
COPPER
2,4-D
SPINETORAM
THIAMETHOXAM
SPIROTETRAMAT
ABAMECTIN
PYRIPROXYFEN
IMIDACLOPRID
INDAZIFLAM
GIBBERELLINS
BETA-CYFLUTHRIN
RIMSULFURON
SAFLUFENACIL
0K20K
40K
60K
80K
0K20K
40K
60K
80K
0K20K
40K
60K
80K
0K20K
40K
60K
80K
0K20K
40K
60K
80K
0K20K
40K
60K
80K
0K20K
40K
60K
80K
0K20K
40K
60K
80K
0K20K
40K
60K
80K
0K20K
40K
60K
80K
0K20K
40K
60K
80K
0K20K
40K
60K
80K
0K20K
40K
60K
80K
0K20K
40K
60K
80K
0K20K
40K
60K
80K
AI TYPEFUNGICIDEHERBICIDEINSECTICIDEPLANT_GROWTH_REGULATOR
Figure A-17: Acres of orange treated by the major AIs by month and AI type from 2011 to 2015.
132

Figure A-18: Number of pesticide application in peach and nectarine by township in 2015.
133

1995
1997
1999
2001
2003
2005
2007
2009
2011
2013
2015
0K50K
100K
150K
SULFUR
GLYPHOSATE
PROPICONAZOLE
OIL
1995
1997
1999
2001
2003
2005
2007
2009
2011
2013
2015
0K20K
40K
60K
80K
100K
CHLORANTRANILIPROLE
SPINETORAM
ZIRAM
ESFENVALERATE
1995
1997
1999
2001
2003
2005
2007
2009
2011
2013
2015
0K20K
40K
60K
80K
100K
BOSCALID
PYRACLOSTROBIN
ABAMECTIN
COPPER
1995
1997
1999
2001
2003
2005
2007
2009
2011
2013
2015
0K50K
100K
150K
E-8-DODECENYL ACETATE
OXYFLUORFEN
LAMBDA-CYHALOTHRIN
IPRODIONE
1995
1997
1999
2001
2003
2005
2007
2009
2011
2013
2015
0K10K
20K
30K
40K
RIMSULFURON
PENDIMETHALIN
Z-8-DODECENYL ACETATE
Z-8-DODECENOL
1995
1997
1999
2001
2003
2005
2007
2009
2011
2013
2015
0K20K
40K
60K
METHOXYFENOZIDE
MYCLOBUTANIL
INDOXACARBGLUFOSINATE-AMMONIUM
Peaches and Nectarine acres treated by the major AIs from 1995 to 2015. The graphs are ordered by their acres treated in 2015 starting with the graph in the upper left, moving to the right, then down.
The line colors represent the AI type: blue represents insecticides, green herbicides, gray fungicides, red fumigants, insecticide/fungicides (mostly sulfur) yellow, defoliants orange, and others as purple.
Within each graph, the lines of different AIs of one type have different color intensities.
and
and
Figure A-19: Acres of peach and nectarine treated by the major AIs from 1994 to 2015.
134
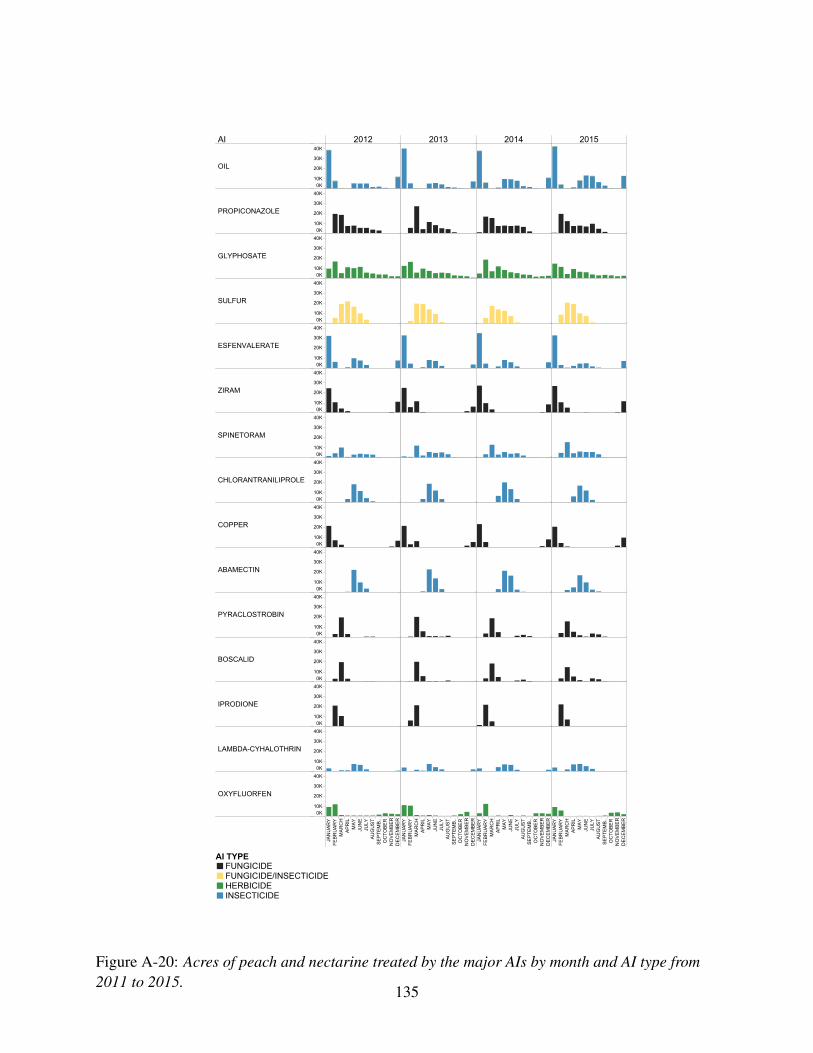
AI 2012 2013 2014 2015
JANUARY
FEBRUARY
MARCH
APRIL
MAY
JUNE
JULY
AUGUST
SEPTEMB..
OCTOBER
NOVEMBER
DECEMBER
JANUARY
FEBRUARY
MARCH
APRIL
MAY
JUNE
JULY
AUGUST
SEPTEMB..
OCTOBER
NOVEMBER
DECEMBER
JANUARY
FEBRUARY
MARCH
APRIL
MAY
JUNE
JULY
AUGUST
SEPTEMB..
OCTOBER
NOVEMBER
DECEMBER
JANUARY
FEBRUARY
MARCH
APRIL
MAY
JUNE
JULY
AUGUST
SEPTEMB..
OCTOBER
NOVEMBER
DECEMBER
OIL
PROPICONAZOLE
GLYPHOSATE
SULFUR
ESFENVALERATE
ZIRAM
SPINETORAM
CHLORANTRANILIPROLE
COPPER
ABAMECTIN
PYRACLOSTROBIN
BOSCALID
IPRODIONE
LAMBDA-CYHALOTHRIN
OXYFLUORFEN
0K10K
20K
30K
40K
0K10K
20K
30K
40K
0K10K
20K
30K
40K
0K10K
20K
30K
40K
0K10K
20K
30K
40K
0K10K
20K
30K
40K
0K10K
20K
30K
40K
0K10K
20K
30K
40K
0K10K
20K
30K
40K
0K10K
20K
30K
40K
0K10K
20K
30K
40K
0K10K
20K
30K
40K
0K10K
20K
30K
40K
0K10K
20K
30K
40K
0K10K
20K
30K
40K
AI TYPEFUNGICIDEFUNGICIDE/INSECTICIDEHERBICIDEINSECTICIDE
Figure A-20: Acres of peach and nectarine treated by the major AIs by month and AI type from2011 to 2015.
135
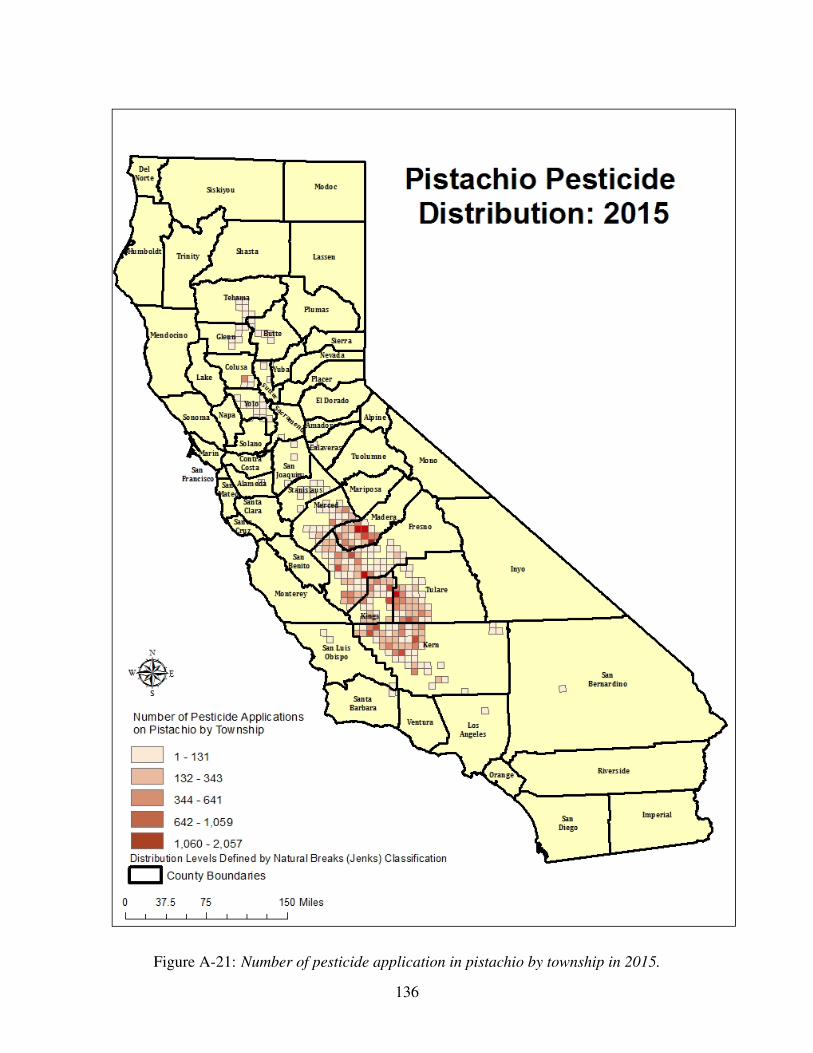
Figure A-21: Number of pesticide application in pistachio by township in 2015.
136
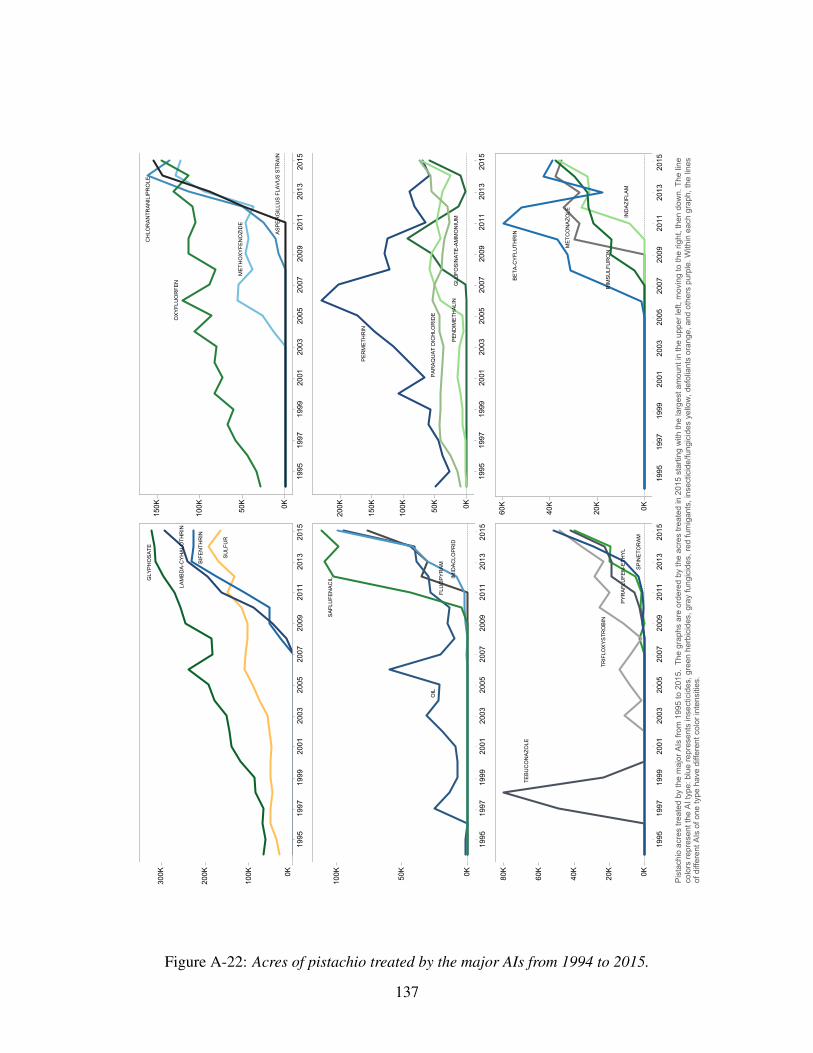
1995
1997
1999
2001
2003
2005
2007
2009
2011
2013
2015
0K
100K
200K
300K
SULFUR
BIFENTHRIN
LAMBDA-CYHALOTHRIN
GLYPHOSATE
1995
1997
1999
2001
2003
2005
2007
2009
2011
2013
2015
0K50K
100K
150K
METHOXYFENOZIDE
CHLORANTRANILIPROLE
OXYFLUORFEN
ASPERGILLUS FLAVUS STRAIN
1995
1997
1999
2001
2003
2005
2007
2009
2011
2013
2015
0K50K
100K
FLUOPYRAM
OIL
IMIDACLOPRID
SAFLUFENACIL
1995
1997
1999
2001
2003
2005
2007
2009
2011
2013
2015
0K50K
100K
150K
200K
GLUFOSINATE-AMMONIUM
PERMETHRIN
PENDIMETHALIN
PARAQUAT DICHLORIDE
1995
1997
1999
2001
2003
2005
2007
2009
2011
2013
2015
0K20K
40K
60K
80K
PYRAFLUFEN-ETHYL
TEBUCONAZOLE
TRIFLOXYSTROBIN
SPINETORAM
1995
1997
1999
2001
2003
2005
2007
2009
2011
2013
2015
0K20K
40K
60K
METCONAZOLE
INDAZIFLAM
RIMSULFURON
BETA-CYFLUTHRIN
Pistachio acres treated by the major AIs from 1995 to 2015. The graphs are ordered by the acres treated in 2015 starting with the largest amount in the upper left, moving to the right, then down. The line
colors represent the AI type: blue represents insecticides, green herbicides, gray fungicides, red fumigants, insecticide/fungicides yellow, defoliants orange, and others purple. Within each graph, the lines
of different AIs of one type have different color intensities.
Figure A-22: Acres of pistachio treated by the major AIs from 1994 to 2015.
137
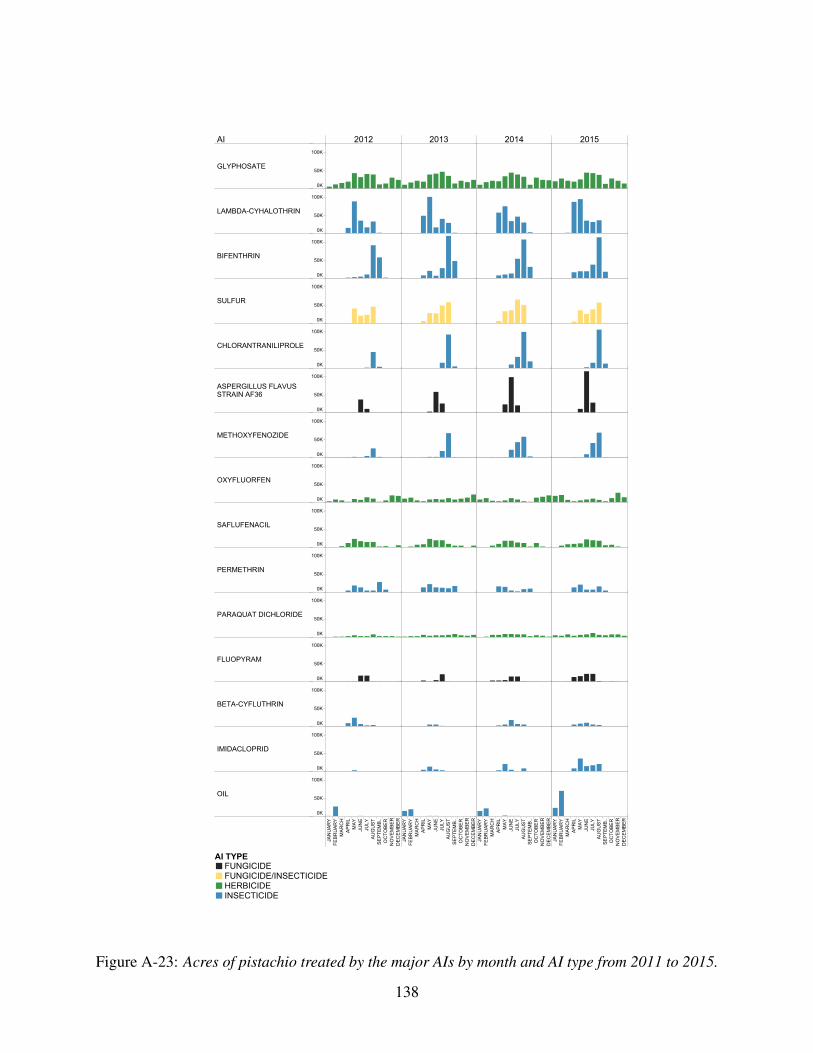
AI 2012 2013 2014 2015
JANUARY
FEBRUARY
MARCH
APRIL
MAY
JUNE
JULY
AUGUST
SEPTEMB..
OCTOBER
NOVEMBER
DECEMBER
JANUARY
FEBRUARY
MARCH
APRIL
MAY
JUNE
JULY
AUGUST
SEPTEMB..
OCTOBER
NOVEMBER
DECEMBER
JANUARY
FEBRUARY
MARCH
APRIL
MAY
JUNE
JULY
AUGUST
SEPTEMB..
OCTOBER
NOVEMBER
DECEMBER
JANUARY
FEBRUARY
MARCH
APRIL
MAY
JUNE
JULY
AUGUST
SEPTEMB..
OCTOBER
NOVEMBER
DECEMBER
GLYPHOSATE
LAMBDA-CYHALOTHRIN
BIFENTHRIN
SULFUR
CHLORANTRANILIPROLE
ASPERGILLUS FLAVUSSTRAIN AF36
METHOXYFENOZIDE
OXYFLUORFEN
SAFLUFENACIL
PERMETHRIN
PARAQUAT DICHLORIDE
FLUOPYRAM
BETA-CYFLUTHRIN
IMIDACLOPRID
OIL
0K
50K
100K
0K
50K
100K
0K
50K
100K
0K
50K
100K
0K
50K
100K
0K
50K
100K
0K
50K
100K
0K
50K
100K
0K
50K
100K
0K
50K
100K
0K
50K
100K
0K
50K
100K
0K
50K
100K
0K
50K
100K
0K
50K
100K
AI TYPEFUNGICIDEFUNGICIDE/INSECTICIDEHERBICIDEINSECTICIDE
Figure A-23: Acres of pistachio treated by the major AIs by month and AI type from 2011 to 2015.
138

Figure A-24: Number of pesticide application in processing tomato by township in 2015.
139

1995
1997
1999
2001
2003
2005
2007
2009
2011
2013
2015
0K
100K
200K
300K
400K
AZOXYSTROBIN
CHLOROTHALONIL
IMIDACLOPRID
SULFUR
1995
1997
1999
2001
2003
2005
2007
2009
2011
2013
2015
0K50K
100K
150K
200K
BIFENTHRIN
S-METOLACHLOR
DIFENOCONAZOLE
TRIFLURALIN
1995
1997
1999
2001
2003
2005
2007
2009
2011
2013
2015
0K50K
100K
THIAMETHOXAM
LAMBDA-CYHALOTHRIN
CHLORANTRANILIPROLE
FLUBENDIAMIDE
1995
1997
1999
2001
2003
2005
2007
2009
2011
2013
2015
0K50K
100K
150K
ABAMECTIN
DIMETHOATE
PYRACLOSTROBIN
GLYPHOSATE
1995
1997
1999
2001
2003
2005
2007
2009
2011
2013
2015
0K
100K
200K
300K
RIMSULFURON
COPPER
FLUXAPYROXAD
CARBARYL
1995
1997
1999
2001
2003
2005
2007
2009
2011
2013
2015
0K50K
100K
CLOTHIANIDIN
ESFENVALERATE
METOLACHLOR
METHOXYFENOZIDE
Processing tomato acres treated by the major AIs from 1995 to 2015. The graphs are ordered by the acres treated in 2015 starting with the largest amount in the upper left, moving to the right, then down.
The line colors represent the AI type: blue represents insecticides, green herbicides, gray fungicides, red fumigants, insecticide/fungicides yellow, defoliants orange, and others purple. Within each graph,
the lines of different AIs of one type have different color intensities.
Figure A-25: Acres of processing tomato treated by the major AIs from 1994 to 2015.
140

AI 2012 2013 2014 2015
JANUARY
FEBRUARY
MARCH
APRIL
MAY
JUNE
JULY
AUGUST
SEPTEMB..
OCTOBER
NOVEMBER
DECEMBER
JANUARY
FEBRUARY
MARCH
APRIL
MAY
JUNE
JULY
AUGUST
SEPTEMB..
OCTOBER
NOVEMBER
DECEMBER
JANUARY
FEBRUARY
MARCH
APRIL
MAY
JUNE
JULY
AUGUST
SEPTEMB..
OCTOBER
NOVEMBER
DECEMBER
JANUARY
FEBRUARY
MARCH
APRIL
MAY
JUNE
JULY
AUGUST
SEPTEMB..
OCTOBER
NOVEMBER
DECEMBER
SULFUR
IMIDACLOPRID
CHLOROTHALONIL
AZOXYSTROBIN
TRIFLURALIN
DIFENOCONAZOLE
S-METOLACHLOR
BIFENTHRIN
FLUBENDIAMIDE
CHLORANTRANILIPROLE
LAMBDA-CYHALOTHRIN
THIAMETHOXAM
GLYPHOSATE
PYRACLOSTROBIN
DIMETHOATE
0K
50K
100K
150K
0K
50K
100K
150K
0K
50K
100K
150K
0K
50K
100K
150K
0K
50K
100K
150K
0K
50K
100K
150K
0K
50K
100K
150K
0K
50K
100K
150K
0K
50K
100K
150K
0K
50K
100K
150K
0K
50K
100K
150K
0K
50K
100K
150K
0K
50K
100K
150K
0K
50K
100K
150K
0K
50K
100K
150K
AI TYPEFUNGICIDEFUNGICIDE/INSECTICIDEHERBICIDEINSECTICIDE
Figure A-26: Acres of processing tomato treated by the major AIs by month and AI type from2011 to 2015.
141

Figure A-27: Number of pesticide application in rice by township in 2015.
142

1995
1997
1999
2001
2003
2005
2007
2009
2011
2013
2015
0K
100K
200K
300K
400K
LAMBDA-CYHALOTHRIN
AZOXYSTROBIN
TRICLOPYR, TRIETHYLAMINEPROPANIL
1995
1997
1999
2001
2003
2005
2007
2009
2011
2013
2015
0K
100K
200K
300K
PENOXSULAM
BISPYRIBAC-SODIUM
THIOBENCARB
CLOMAZONE
1995
1997
1999
2001
2003
2005
2007
2009
2011
2013
2015
0K
100K
200K
300K
400K
CARFENTRAZONE-ETHYL
CYHALOFOP-BUTYL
BENSULFURON METHYL
COPPER
1995
1997
1999
2001
2003
2005
2007
2009
2011
2013
2015
0K10K
20K
30K
40K
50K
CARBARYL
CARBARYL
(S)-CYPERMETHRIN
REYNOUTRIA SACHALINENSIS
IMAZOSULFURON
1995
1997
1999
2001
2003
2005
2007
2009
2011
2013
2015
0K10K
20K
30K
TRIFLOXYSTROBIN
HALOSULFURON-METHYL
PENDIMETHALIN
PROPICONAZOLE
1995
1997
1999
2001
2003
2005
2007
2009
2011
2013
2015
0K5K10K
15K
20K
MALATHION
ORTHOSULFAMURON
GLYPHOSATE
SODIUM CARBONATE PEROXYHY
20K
30K
40K
50K
GLYPHOSATE
Rice acres treated by the major AIs from 1995 to 2015. The graphs are ordered by the acres treated in 2015 starting with the largest amount in the upper left, moving to the right, then down. The line
colors represent the AI type: blue represents insecticides, green herbicides, gray fungicides, red fumigants, insecticide/fungicides yellow, defoliants orange, and others purple. Within each graph, the lines
of different AIs of one type have different color intensities.
Figure A-28: Acres of rice treated by the major AIs from 1994 to 2015.
143

AI 2012 2013 2014 2015
FEBRUARY
APRIL
MAY
JUNE
JULY
AUGUST
SEPTEMB..
OCTOBER
MARCH
APRIL
MAY
JUNE
JULY
AUGUST
SEPTEMB..
OCTOBER
FEBRUARY
MARCH
APRIL
MAY
JUNE
JULY
AUGUST
SEPTEMB..
OCTOBER
FEBRUARY
MARCH
APRIL
MAY
JUNE
JULY
AUGUST
SEPTEMB..
OCTOBER
DECEMBER
PROPANIL
TRICLOPYR,TRIETHYLAMINE SALT
AZOXYSTROBIN
LAMBDA-CYHALOTHRIN
CLOMAZONE
THIOBENCARB
BISPYRIBAC-SODIUM
PENOXSULAM
COPPER
BENSULFURON METHYL
CYHALOFOP-BUTYL
CARFENTRAZONE-ETHYL
IMAZOSULFURON
REYNOUTRIASACHALINENSIS
(S)-CYPERMETHRIN
0K100K
200K
300K
0K100K
200K
300K
0K100K
200K
300K
0K100K
200K
300K
0K100K
200K
300K
0K100K
200K
300K
0K100K
200K
300K
0K100K
200K
300K
0K100K
200K
300K
0K100K
200K
300K
0K100K
200K
300K
0K100K
200K
300K
0K100K
200K
300K
0K100K
200K
300K
0K100K
200K
300K
AI TYPEALGAECIDEFUNGICIDEHERBICIDEINSECTICIDE
Figure A-29: Acres of rice treated by the major AIs by month and AI type from 2011 to 2015.
144

Figure A-30: Number of pesticide application in strawberry by township in 2015.
145

1995
1997
1999
2001
2003
2005
2007
2009
2011
2013
2015
0K
100K
200K
CAPTAN, OTHER RELATED
NOVALURON
CAPTAN
SULFUR
1995
1997
1999
2001
2003
2005
2007
2009
2011
2013
2015
0K20K
40K
60K
80K
100K
FLUDIOXONIL
CYPRODINIL
BACILLUS THURINGIENSIS
PYRACLOSTROBIN
1995
1997
1999
2001
2003
2005
2007
2009
2011
2013
2015
0K20K
40K
60K
80K
MYCLOBUTANIL
BOSCALID
BIFENTHRIN FLONICAMID
1995
1997
1999
2001
2003
2005
2007
2009
2011
2013
2015
0K20K
40K
60K
ACETAMIPRID
SPINETORAM
FENHEXAMID
QUINOXYFEN
1995
1997
1999
2001
2003
2005
2007
2009
2011
2013
2015
0K20K
40K
60K
ABAMECTIN
AZADIRACHTIN
TRIFLUMIZOLE
BIFENAZATE
1995
1997
1999
2001
2003
2005
2007
2009
2011
2013
2015
0K20K
40K
60K
80K
CHLORANTRANILIPROLE
PYRETHRINS
PENTHIOPYRAD
MALATHION
Strawberry acres treated by the major AIs from 1995 to 2015. The graphs are ordered by the acres treated in 2015 starting with the largest amount in the upper left, moving to the right, then down. The line
colors represent the AI type: blue represents insecticides, green herbicides, gray fungicides, red fumigants, insecticide/fungicides yellow, defoliants orange, and others purple. Within each graph, the lines
of different AIs of one type have different color intensities.
and
Figure A-31: Acres of strawberry treated by the major AIs from 1994 to 2015.
146

AI 2012 2013 2014 2015
JANUARY
FEBRUARY
MARCH
APRIL
MAY
JUNE
JULY
AUGUST
SEPTEMB..
OCTOBER
NOVEMBER
DECEMBER
JANUARY
FEBRUARY
MARCH
APRIL
MAY
JUNE
JULY
AUGUST
SEPTEMB..
OCTOBER
NOVEMBER
DECEMBER
JANUARY
FEBRUARY
MARCH
APRIL
MAY
JUNE
JULY
AUGUST
SEPTEMB..
OCTOBER
NOVEMBER
DECEMBER
JANUARY
FEBRUARY
MARCH
APRIL
MAY
JUNE
JULY
AUGUST
SEPTEMB..
OCTOBER
NOVEMBER
DECEMBER
SULFUR
CAPTAN
NOVALURON
CAPTAN, OTHER RELATED
PYRACLOSTROBIN
BACILLUS THURINGIENSIS
CYPRODINIL
FLUDIOXONIL
FLONICAMID
BIFENTHRIN
BOSCALID
MYCLOBUTANIL
QUINOXYFEN
FENHEXAMID
SPINETORAM
0K10K
20K
30K
40K
0K10K
20K
30K
40K
0K10K
20K
30K
40K
0K10K
20K
30K
40K
0K10K
20K
30K
40K
0K10K
20K
30K
40K
0K10K
20K
30K
40K
0K10K
20K
30K
40K
0K10K
20K
30K
40K
0K10K
20K
30K
40K
0K10K
20K
30K
40K
0K10K
20K
30K
40K
0K10K
20K
30K
40K
0K10K
20K
30K
40K
0K10K
20K
30K
40K
AI TYPEFUNGICIDEINSECTICIDE
Figure A-32: Acres of strawberry treated by the major AIs by month and AI type from 2011 to2015.
147

Figure A-33: Number of pesticide application in table and raisin grape by township in 2015.
148

1995
1997
1999
2001
2003
2005
2007
2009
2011
2013
2015
0M1M2M3M
IMIDACLOPRID
GIBBERELLINS
COPPER
SULFUR
1995
1997
1999
2001
2003
2005
2007
2009
2011
2013
2015
0K
100K
200K
300K
400K
SPIROTETRAMAT
QUINOXYFEN
MYCLOBUTANIL
GLYPHOSATE
1995
1997
1999
2001
2003
2005
2007
2009
2011
2013
2015
0K50K
100K
150K
GLUFOSINATE-AMMONIUM
PYRACLOSTROBIN
BOSCALID
TRIFLOXYSTROBIN
1995
1997
1999
2001
2003
2005
2007
2009
2011
2013
2015
0K50K
100K
150K
OXYFLUORFEN
ABAMECTIN
CYPRODINIL
TEBUCONAZOLE
1995
1997
1999
2001
2003
2005
2007
2009
2011
2013
2015
0K50K
100K
150K
SPINETORAM
KRESOXIM-METHYL
PARAQUAT DICHLORIDE
METHOXYFENOZIDE
1995
1997
1999
2001
2003
2005
2007
2009
2011
2013
2015
0K50K
100K
150K
BACILLUS THURINGIENSIS
TETRACONAZOLE
TRIFLUMIZOLE
BUPROFEZIN
Table and raisin grape acres treated by the major AIs from 1995 to 2015. The graphs are ordered by the acres treated in 2015 starting with the largest amount in the upper left, moving to the right, then
down. The line colors represent the AI type: blue represents insecticides, green herbicides, gray fungicides, red fumigants, insecticide/fungicides yellow, defoliants orange, and others purple. Within each
graph, the lines of different AIs of one type have different color intensities.
and
Figure A-34: Acres of table and raisin grape treated by the major AIs from 1994 to 2015.
149

AI 2012 2013 2014 2015
JANUARY
FEBRUARY
MARCH
APRIL
MAY
JUNE
JULY
AUGUST
SEPTEMB..
OCTOBER
NOVEMBER
DECEMBER
JANUARY
FEBRUARY
MARCH
APRIL
MAY
JUNE
JULY
AUGUST
SEPTEMB..
OCTOBER
NOVEMBER
DECEMBER
JANUARY
FEBRUARY
MARCH
APRIL
MAY
JUNE
JULY
AUGUST
SEPTEMB..
OCTOBER
NOVEMBER
DECEMBER
JANUARY
FEBRUARY
MARCH
APRIL
MAY
JUNE
JULY
AUGUST
SEPTEMB..
OCTOBER
NOVEMBER
DECEMBER
SULFUR
COPPER
GIBBERELLINS
IMIDACLOPRID
GLYPHOSATE
MYCLOBUTANIL
QUINOXYFEN
SPIROTETRAMAT
TRIFLOXYSTROBIN
BOSCALID
PYRACLOSTROBIN
GLUFOSINATE-AMMONIUM
TEBUCONAZOLE
CYPRODINIL
ABAMECTIN
0K
200K
400K
600K
0K
200K
400K
600K
0K
200K
400K
600K
0K
200K
400K
600K
0K
200K
400K
600K
0K
200K
400K
600K
0K
200K
400K
600K
0K
200K
400K
600K
0K
200K
400K
600K
0K
200K
400K
600K
0K
200K
400K
600K
0K
200K
400K
600K
0K
200K
400K
600K
0K
200K
400K
600K
0K
200K
400K
600K
AI TYPEFUNGICIDEFUNGICIDE/INSECTICIDEHERBICIDEINSECTICIDEPLANT_GROWTH_REGULATOR
Figure A-35: Acres of table and raisin grape treated by the major AIs by month and AI type from2011 to 2015.
150
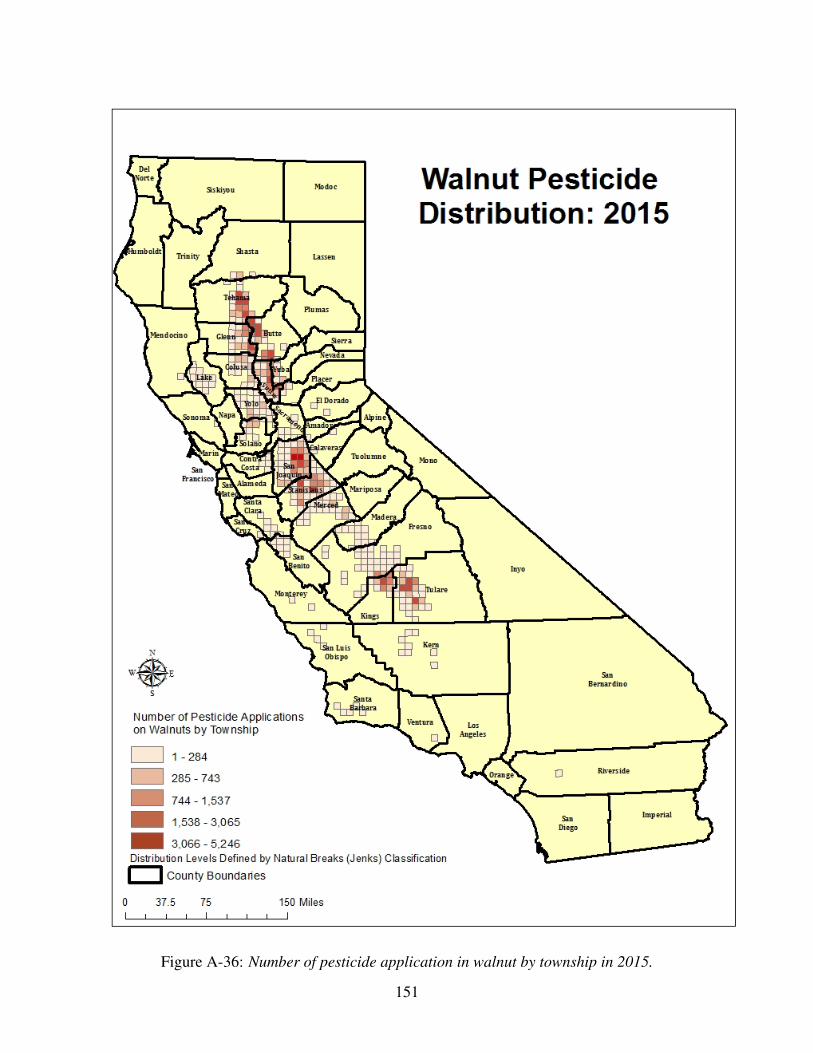
Figure A-36: Number of pesticide application in walnut by township in 2015.
151

1995
1997
1999
2001
2003
2005
2007
2009
2011
2013
2015
0K
100K
200K
300K
400K
OXYFLUORFEN MANCOZEB
GLYPHOSATE
COPPER
1995
1997
1999
2001
2003
2005
2007
2009
2011
2013
2015
0K50K
100K
150K
ACETAMIPRID
ETHEPHON
BIFENTHRIN
ABAMECTIN
1995
1997
1999
2001
2003
2005
2007
2009
2011
2013
2015
0K20K
40K
60K
80K
IMIDACLOPRID
SAFLUFENACIL
CHLORANTRANILIPROLE
PARAQUAT DICHLORIDE
1995
1997
1999
2001
2003
2005
2007
2009
2011
2013
2015
0K50K
100K
METHOXYFENOZIDE
GLUFOSINATE-AMMONIUM
CHLORPYRIFOS
PYRACLOSTROBIN
1995
1997
1999
2001
2003
2005
2007
2009
2011
2013
2015
0K20K
40K
60K
PROPICONAZOLE
INDAZIFLAM
HEXYTHIAZOX
LAMBDA-CYHALOTHRIN
1995
1997
1999
2001
2003
2005
2007
2009
2011
2013
2015
0K20K
40K
60K
PENDIMETHALIN SPIROTETRAMAT
ETOXAZOLE
AZOXYSTROBIN
Walnut acres treated by the major AIs from 1995 to 2015. The graphs are ordered by the acres treated in 2015 starting with the largest amount in the upper left, moving to the right, then down. The line
colors represent the AI type: blue represents insecticides, green herbicides, gray fungicides, red fumigants, insecticide/fungicides yellow, defoliants orange, and others purple. Within each graph, the lines
of different AIs of one type have different color intensities.
Figure A-37: Acres of walnut treated by the major AIs from 1994 to 2015.
152
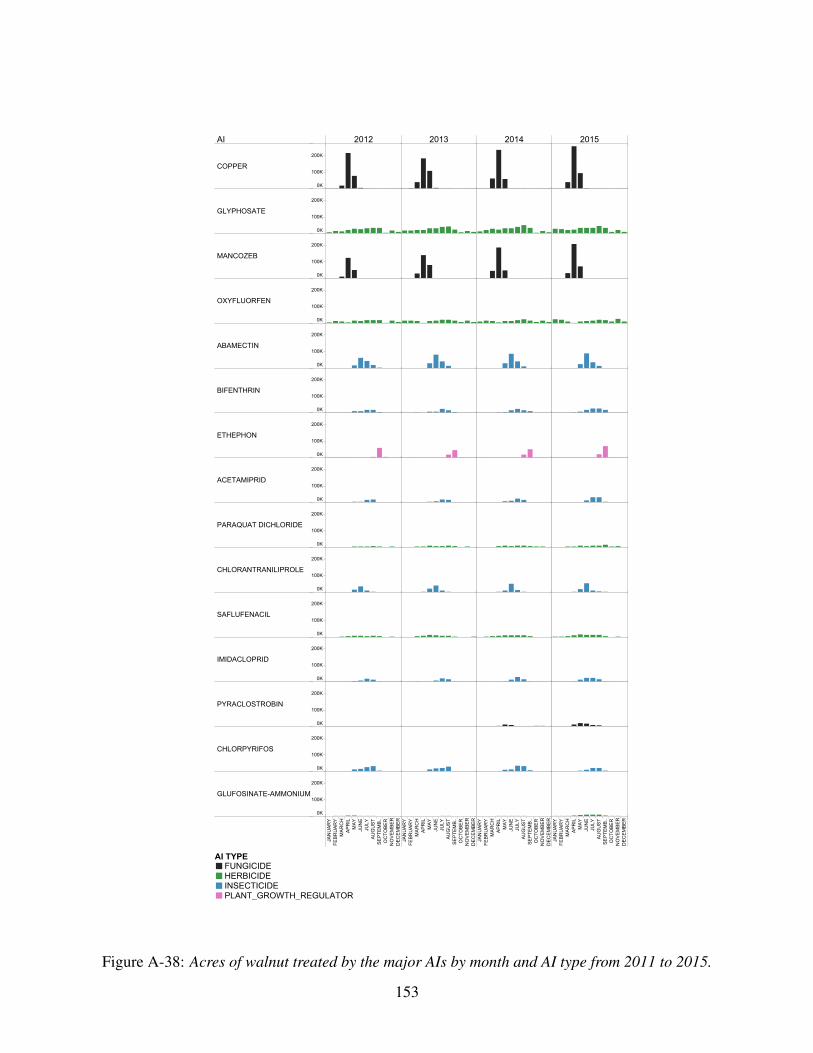
AI 2012 2013 2014 2015
JANUARY
FEBRUARY
MARCH
APRIL
MAY
JUNE
JULY
AUGUST
SEPTEMB..
OCTOBER
NOVEMBER
DECEMBER
JANUARY
FEBRUARY
MARCH
APRIL
MAY
JUNE
JULY
AUGUST
SEPTEMB..
OCTOBER
NOVEMBER
DECEMBER
JANUARY
FEBRUARY
MARCH
APRIL
MAY
JUNE
JULY
AUGUST
SEPTEMB..
OCTOBER
NOVEMBER
DECEMBER
JANUARY
FEBRUARY
MARCH
APRIL
MAY
JUNE
JULY
AUGUST
SEPTEMB..
OCTOBER
NOVEMBER
DECEMBER
COPPER
GLYPHOSATE
MANCOZEB
OXYFLUORFEN
ABAMECTIN
BIFENTHRIN
ETHEPHON
ACETAMIPRID
PARAQUAT DICHLORIDE
CHLORANTRANILIPROLE
SAFLUFENACIL
IMIDACLOPRID
PYRACLOSTROBIN
CHLORPYRIFOS
GLUFOSINATE-AMMONIUM
0K
100K
200K
0K
100K
200K
0K
100K
200K
0K
100K
200K
0K
100K
200K
0K
100K
200K
0K
100K
200K
0K
100K
200K
0K
100K
200K
0K
100K
200K
0K
100K
200K
0K
100K
200K
0K
100K
200K
0K
100K
200K
0K
100K
200K
AI TYPEFUNGICIDEHERBICIDEINSECTICIDEPLANT_GROWTH_REGULATOR
Figure A-38: Acres of walnut treated by the major AIs by month and AI type from 2011 to 2015.
153

Figure A-39: Number of pesticide application in wine grape by township in 2015.
154

1995
1997
1999
2001
2003
2005
2007
2009
2011
2013
2015
0M1M2M3M4M
COPPER
OIL
GLYPHOSATE
SULFUR
1995
1997
1999
2001
2003
2005
2007
2009
2011
2013
2015
0K
100K
200K
300K
BOSCALID
IMIDACLOPRID
OXYFLUORFEN
QUINOXYFEN
1995
1997
1999
2001
2003
2005
2007
2009
2011
2013
2015
0K
100K
200K
ABAMECTIN
ABAMECTIN
GLUFOSINATE-AMMONIUM
TEBUCONAZOLE
PYRACLOSTROBIN
1995
1997
1999
2001
2003
2005
2007
2009
2011
2013
2015
0K
100K
200K
300K
400K
500K
FLUOPYRAM
SPIROTETRAMAT
MYCLOBUTANIL
TRIFLOXYSTROBIN
1995
1997
1999
2001
2003
2005
2007
2009
2011
2013
2015
0K50K
100K
150K
200K
METRAFENONE
CYPRODINIL
METHOXYFENOZIDE
DIFENOCONAZOLE
1995
1997
1999
2001
2003
2005
2007
2009
2011
2013
2015
0K50K
100K
150K
200K
FLUMIOXAZIN
PARAQUAT DICHLORIDE
TRIFLUMIZOLE
TETRACONAZOLE
Wine grape acres treated by the major AIs from 1995 to 2015. The graphs are ordered by their acres treated in 2015 starting with the graph in the upper left, moving to the right, then down. The line colors
represent the AI type: blue represents insecticides, green herbicides, gray fungicides, red fumigants, insecticide/fungicides (mostly sulfur) yellow, defoliants orange, and others as purple. Within each
graph, the lines of different AIs of one type have different color intensities.
Figure A-40: Acres of wine grape treated by the major AIs from 1994 to 2015.
155

AI 2012 2013 2014 2015
JANUARY
FEBRUARY
MARCH
APRIL
MAY
JUNE
JULY
AUGUST
SEPTEMB..
OCTOBER
NOVEMBER
DECEMBER
JANUARY
FEBRUARY
MARCH
APRIL
MAY
JUNE
JULY
AUGUST
SEPTEMB..
OCTOBER
NOVEMBER
DECEMBER
JANUARY
FEBRUARY
MARCH
APRIL
MAY
JUNE
JULY
AUGUST
SEPTEMB..
OCTOBER
NOVEMBER
DECEMBER
JANUARY
FEBRUARY
MARCH
APRIL
MAY
JUNE
JULY
AUGUST
SEPTEMB..
OCTOBER
NOVEMBER
DECEMBER
SULFUR
GLYPHOSATE
OIL
COPPER
QUINOXYFEN
OXYFLUORFEN
IMIDACLOPRID
BOSCALID
PYRACLOSTROBIN
TEBUCONAZOLE
GLUFOSINATE-AMMONIUM
ABAMECTIN
TRIFLOXYSTROBIN
MYCLOBUTANIL
SPIROTETRAMAT
0K
100K
200K
300K
0K
100K
200K
300K
0K
100K
200K
300K
0K
100K
200K
300K
0K
100K
200K
300K
0K
100K
200K
300K
0K
100K
200K
300K
0K
100K
200K
300K
0K
100K
200K
300K
0K
100K
200K
300K
0K
100K
200K
300K
0K
100K
200K
300K
0K
100K
200K
300K
0K
100K
200K
300K
0K
100K
200K
300K
AI TYPEFUNGICIDEFUNGICIDE/INSECTICIDEHERBICIDEINSECTICIDE
Figure A-41: Acres of wine grape treated by the major AIs by month and AI type from 2011 to2015.
156