Embed Size (px)
Citation preview

SUMMARY OF OPERATIONS AT THE CONOWINGO DAM EAST FISH PASSAGE FACILITY SPRING 2013 August 2013

SUMMARY OF OPERATIONS AT THE CONOWINGO DAM EAST FISH PASSAGE FACILITY
SPRING 2013
Prepared for
EXELON GENERATION COMPANY, LLC 2569 Shures Landing Road
Darlington, Maryland 21034-1503
Prepared by
NORMANDEAU ASSOCIATES, INC. 1921 River Road
Drumore, Pennsylvania 17518
Normandeau Associates’ Project Number 22755.001
August 2013

2013 Operations Summary for Conowingo Dam East Fish Passage Facility
EXECUTIVE SUMMARY
Operation of the Conowingo East Fish Lift (EFL) began April 1, 2013 although the water temperature was below the season start trigger value of 50°F (47.1°F actual water temperature on April 1). The first two American shad were passed on April 11 at a water temperature of 57.2°F. The EFL operated for 60 days in 2013 with everyday operation starting on April 8 and continuing to the end of the season. EFL operations were terminated on June 3 in concurrence with the resource agencies. The 2013 fish passage season marks the twenty-third season of overall operation and the seventeenth year of volitional passage operation at the Conowingo EFL.
The EFL passed 1,094,526 fish of 27 species. Gizzard shad (1,076,048), American shad (12,733), quillback (2,725) and channel catfish (1,594), dominated the catch, and comprised nearly 100% of the total fish collected and passed. Gizzard shad alone accounted for 98% of the total fish collected and passed.
A total of 12,733 American shad were passed. The highest daily passage of American shad occurred on May 2 when 1,758 shad were passed upstream. On 4 of the 60 days of operation, American shad passage exceeded 1,000 fish. On a daily basis, overall shad passage was strongest through the fishway between 1400 hours and 1859 hours during which 76% of all shad passage occurred.
Fishway operations were conducted at water temperatures ranging from 46.9°F to 75.6°F and river flows between 20,700 and 98,100 cfs. Spillage occurred on 1 of the 60 days of operation, (April 15). Generally, river flows declined and remained stable after April 23.
In 2013, the EFL was not shut down due to spill. Based on information gained in previous years, the standard operating procedure when spill conditions are in effect is to cease operation of the EFL if more than two spill gates are open. This SOP was not put into effect because of the limited nature of the one spill event.
Prior to the start of EFL operations in 2013, and in addition to routine preseason maintenance activities, the operating system for the hopper door (air hoses, pneumatic cylinder, etc.) was re-engineered to improve reliability of the facility and minimize any fish passage delays due to mechanical issues. The hopper door performed flawlessly and decreased the number of mechanical issues specific to the hopper air hoses addressed in 2013 as compared to those that occurred during the 2012 fish passage season.
For most of the season, water clarity was adequate, allowing the viewing technicians to identify American shad with attached Maryland DNR floy tags. The number of floy tags observed at the Conowingo EFL in 2013 was 23 pink tags (all from this year’s tagging efforts).
Future operations of the EFL will build on the past seventeen years of operation experience.

2013 Operations Summary for Conowingo Dam East Fish Passage Facility
TABLE OF CONTENTS
1.0 INTRODUCTION ............................................................................................................1
2.0 CONOWINGO OPERATION...........................................................................................1
2.1 Project Operation ...........................................................................................................1
2.2 Fishway Operation .........................................................................................................1
2.3 Fish Counts....................................................................................................................2
3.0 RESULTS.........................................................................................................................2
3.1 Relative Abundance .......................................................................................................2
3.2 American Shad Passage .................................................................................................2
3.3 Gizzard Shad Passage ....................................................................................................3
3.4 Other Alosids ................................................................................................................3
3.5 Maryland tag-recapture ..................................................................................................3
4.0 SUMMARY .....................................................................................................................3
5.0 RECOMMENDATIONS...................................................................................................4
6.0 LITERATURE CITED......................................................................................................4
TABLES AND FIGURES
LIST OF TABLES AND FIGURES
Table 1 Summary of the daily number of fish passed by the Conowingo Dam East Fish Passage Facility in 2013.
Table 2 Summary of American shad catch, Maryland DNR recaptures, daily average river flow (as measured at USGS Gauge Marietta), water temperature, turbidity, unit operation, entrance gates utilized, attraction flow, and project water elevations during operation of the Conowingo Dam East Fish Passage Facility in 2013.
Table 3 Hourly summary of American shad passage at the Conowingo Dam East Fish Passage Facility in 2013.
Table 4 Summary information for Conowingo EFL volitional passage 1997-2013.
Table 5 Summary of selected operation and fish catch statistics at the Conowingo Dam East Fish Passage Facility, 1991 to 2013.
Table 6 Summary of American shad passage counts and percent passage values at Susquehanna River dams, 1997-2013.
Figure 1 A plot of river flow (USGS Gauge Marietta) and water temperature in relation to the daily American shad catch at the Conowingo Dam EFL Facility, spring 2013.
Figure 2 A plot of river flow (USGS Gauge Marietta) and water temperature in relation to the percent cumulative American shad catch at the Conowingo Dam EFL, spring 2013.

2013 Operations Summary for Conowingo Dam East Fish Passage Facility
ConoEFL2013Finalrpt–Aug 2013 Normandeau Associates,
Inc.
1
1.0 INTRODUCTION
Exelon Generation Company, LLC, formerly the Susquehanna Electric Company (SECO), has operated a fish passage facility (West lift) at its Conowingo Hydroelectric Station since 1972. Lift operations are part of a cooperative private, state, and federal effort to restore American shad (Alosa sapidissima) and other migratory fishes to the Susquehanna River. In accordance with the restoration plan, the operational goal had been to monitor fish populations below Conowingo Dam and transport pre-spawned migratory fishes upriver.
In 1988, the former PECO Energy Company negotiated an agreement with state and federal resource agencies and private organizations to enhance restoration of American shad and other anadromous species to the Susquehanna River. A major element of this agreement was for PECO Energy Company to construct an East Fish Lift Passage Facility (EFL) at Conowingo Dam. Construction of the EFL commenced in April 1990 and it was operational by spring 1991.
With the completion of fishways at Holtwood, Safe Harbor, and York Haven dams, the EFL has been operated to pass fish directly into Conowingo Pond since spring 1997.
Objectives of 2013 operation were: (1) monitor passage of migratory and resident fishes through the fishway; and (2) assess fishway and trough effectiveness and make modifications as feasible.
2.0 CONOWINGO OPERATION
2.1 Project Operation
The Conowingo Hydroelectric Station, built in 1928, is located at river mile 10 on the Susquehanna River (RMC 1992). The powerhouse has a peaking generating capacity of 549.5 MW and a hydraulic capacity of approximately 85,000 cfs. Flows in excess of station draft are spilled through two regulating and 50 crest gates. The powerhouse contains seven vertical Francis (numbered 1 through 7) and four Kaplan (numbered 8 through 11) turbines. The seven Francis units have been equipped with aeration systems that permit a unit to draw air into the unit (vented mode) or operate conventionally (unvented mode). The four original Kaplan turbines installed in 1964 were replaced over a period of four years (1992 to 1996), with more efficient mixed-flow Kaplan type turbines.
Minimum flow releases from the station during the spring spawning and fishway operating season follow the schedule outlined in the settlement agreement. Minimum flows of 10,000 cubic feet per second (cfs) or natural river flow, whichever is less, as measured at the United States Geological Survey (USGS) gauge at Marietta, PA were maintained for the period 1 to 30 April. A minimum flow of 7,500 cfs or natural river flow (as previously noted) was maintained for the period 1 to 31 May. A minimum flow of 5,000 cfs or natural river flow (as previously noted) is maintained when fish lift operations occur in June.
2.2 Fishway Operation
The start of operation for the EFL in 2013 began on April 1, 2013. The first American shad (2) were passed on April 11(Table 1). Every other day operation was in effect until April 8 with everyday operation beginning on April 9, and continued through June 3. On June 3, operations were terminated with concurrence from the Resource Agencies. The EFL operated a total of 60 days during the 2013 season.
Daily operation times were planned during optimal fish passage parameters. This year, operational methodologies were influenced by natural river flow, water temperature, generation and spill conditions, and daily/hourly fish passage numbers. EFL operation was conducted by a staff of three people: a lift operator, a supervising biologist, and a biological technician.

2013 Operations Summary for Conowingo Dam East Fish Passage Facility
ConoEFL2013Finalrpt–Aug 2013 Normandeau Associates,
Inc.
2
The mechanical aspects of EFL operation in 2013 were similar to those described in RMC (1992) and Normandeau Associates, Inc. (1999). Fishing time and/or lift frequency was determined by fish abundance, but the hopper was generally cycled once an hour throughout the day. The method of lift operation was also influenced by fish abundance. When a large number of fish were in the fishing channel, the crowder was not operated; instead the crowder screen was raised and then lowered trapping fish over the hopper. This mode of operation, called “fast fish”, involved leaving the crowder in the normal fishing position and raising the hopper frequently to remove fish that accumulated in the holding channel.
The specific entrance(s) used to attract fishes was dictated by the station discharge and which turbine units were operating. For example, when Kaplan turbine units 8, 9, 10, and 11 or any combination of Kaplan turbines were operating, entrance C was the primary entrance used to attract fishes. Under these conditions the attraction flow through the other entrances is negated or disrupted. Depending on river flow and/or generation, entrance A or C was utilized throughout the 2013 season to attract fishes.
2.3 Fish Counts
Fish that were lifted and sluiced into the trough were guided by a series of fixed screens. The fixed screens directed the fish to swim up and through a 3 ft wide channel and past a 4 ft by 10 ft counting window located on the west wall of the trough. Fish passing the counting window were identified to species and enumerated by a biologist and/or technician. Passage of fish by the window and out of the trough system was controlled by a set of gates located downstream of the counting window. During periods of peak passage, two people were used to identify and count fish.
At the end of each hour, fish passage data were recorded on data sheets and entered into a Microsoft Excel worksheet on a Personal Computer. Data processing and reporting were PC based and accomplished by program scripts, or macros, created within Microsoft Excel software. After the technician verified the correctness of the raw data, a daily summary of fish passage was produced and distributed in hard copy to plant personnel. Each day’s data were backed up to a diskette and stored off site. Daily reports and weekly summaries of fish passage were electronically distributed to plant personnel and other cooperators.
3.0 RESULTS
3.1 Relative Abundance
The number of fishes collected and passed by the Conowingo Dam EFL is presented in Table 1. A total of 1,094,526 fish of 27 species passed upstream into Conowingo Pond. Gizzard shad (1,076,048), American shad (12,733), quillback (2,725) and channel catfish (1,594), dominated the catch, and comprised nearly 100% of the total fish collected and passed. Gizzard shad alone accounted for 98% of the total fish collected and passed. Peak passage occurred on 13 May when 65,438 fish, (99% gizzard shad), were passed.
3.2 American Shad Passage
The EFL collected and passed 12,733 American shad (Table 1). The first 2 American shad passed on April 11. Collection and passage of shad varied daily with 0.3% (43) of the shad passed from 1 April to 19April, 58% (7,384) passed from 20 April to 4 May, 29.4% (3,738) passed from 5 May to 19 May, and 12.3% (1,568) passed from 20 May to 3 June (Figures 1and 2). On 4 of the 60 days of operation, American shad passage exceeded 1,000 fish. The largest number of American shad passed at the EFL in 2013 occurred on May 2 (1,758).
American shad were collected and passed at water temperatures ranging from 57.2°F to 75.6°F and river flows between 20,700 and 93,800 cfs (Table 2, and Figure 1). The average daily river flow on

2013 Operations Summary for Conowingo Dam East Fish Passage Facility
ConoEFL2013Finalrpt–Aug 2013 Normandeau Associates,
Inc.
3
those days when American shad passage exceeded 1,000 fish was approximately 36,925 cfs. The average daily river flow during the operational season was 40,595 cfs.
The hourly passage of American shad at the EFL is given in Table 3. On a daily basis, overall shad passage was strongest through the fishway between 1400 hours and 1859 hours during which 76% of shad passage occurred. The highest hourly passage rate occurred from 1500 to 1559 hours.
3.3 Gizzard Shad Passage
The EFL collected and passed 1,076,048 Gizzard shad in 2013 (Tables 1 and 4). Gizzard shad accounted for 98% of the total fish collected and passed. On 11 of 60 days of operation, Gizzard shad passage exceeded 30,000 fish. Table 4 provides the ratio of American shad to Gizzard shad for the years of volitional passage (1997-2013). In years when American shad passage exceeds 50,000 fish, the ratio ranges from 1:2 – 1:14 (Am. shad/gizzard shad). For those years when American shad passage is less than 50,000 fish, the ratio ranges from 1:16 – 1:85. The year 2011 is an exception to this because of the agency requested shutdown on May 19, 2011 which ended EFL operations earlier than previous years.
3.4 Alosids
A small number of river herring, (7 blueback herring) were passed during the 2013 season. One hickory shad was also passed in spring 2013.
3.5 Maryland tag-recapture
During the 2013 season, the EFL passed American shad that were captured, floy-tagged and released downstream of Conowingo dam by the Maryland DNR. This year, the Maryland DNR tagged a total of 297 American shad (246 from boat angling; 51 from shoreline anglers). The number of floy tags observed at the Conowingo EFL in 2013 was 23 pink tags (all from this year’s tagging efforts).
4.0 SUMMARY
EFL operation was initiated on April 1 although river water temperature was less than 50°F (47.1°F). The first 2 American shad passed on April 11 at a water temperature of 57.2°F. The EFL passed 12,733 American shad from April 11 through June 3. The total number of American shad passed during the 2013 season was the lowest passage value recorded since volitional passage began in 1997, (Tables 4, 5, and 6). It is also the seventh consecutive year in which the EFL passed less than 50,000 American shad.
Modifications made to the fish trough, particularly the valve grating and hopper trough chute since 1999 have diminished the potential for the valve grating to clog with various types of debris and have decreased the number of American shad lift mortalities observed throughout the last several fish passage seasons. Since the valve grating was modified prior to the start of the 2000 season, loss of water flow in the trough has not occurred, particularly during high river flow periods when large amounts of debris may enter the trough through the fish exit area. An aeration system was also installed prior to the 2000 passage season to diminish low dissolved oxygen levels when the American shad population is heavy in the trough. Prior to fishway operations in 2002, a 30 inch diameter fiberglass elbow was attached to the hopper extension chute, which had been installed in 2001. The modification allows fish to enter the trough center stream, instead of being directed toward the east

2013 Operations Summary for Conowingo Dam East Fish Passage Facility
ConoEFL2013Finalrpt–Aug 2013 Normandeau Associates,
Inc.
4
trough wall. A decrease in lift mortalities has also been observed since the fiberglass elbow was installed. A total of 136 American shad lift mortalities, (1% of the total shad passed), was observed in 2013, within the range observed in recent years (0.2% to 1.0%) and less than values observed during trap and transport operations (1.5% to 10.5%).
Prior to the start of EFL operations in 2013, and in addition to routine maintenance activities, the operating system for the hopper door (air hoses, pneumatic cylinder, etc.) was re-engineered to improve reliability of the facility and minimize any fish passage delays due to mechanical issues. The hopper door performed flawlessly and decreased the number of mechanical issues specific to the hopper air hoses addressed in 2013 as compared to those that occurred during the 2012 fish passage season.
5.0 RECOMMENDATIONS
1) Continue to operate the EFL at Conowingo Dam per annual guidelines developed and approved by the Susquehanna River Technical Committee. Lift operation should adhere to the guidelines; however, flexibility must remain with operating personnel to maximize fishway performance and fish passage.
2) Continue the use of two fish counters during periods of increased fish passage to accurately reflect the number of fish that pass through the EFL.
3) Continue to inspect cables, limit switches, and lift components to enhance season operability, and continue to evaluate effectiveness of fish trough and hopper door modifications.
6.0 LITERATURE CITED
RMC. 1992. Summary of the operations of the Conowingo Dam fish passage facilities in spring 1991. Prepared for Susquehanna Electric Company, Darlington, MD.
Normandeau Associates, Inc. 1999. Summary of the operations at the Conowingo Dam East fish passage facility in spring, 1998. Prepared for Susquehanna Electric Company, Darlington, MD.

TABLES AND FIGURES

Table 1
Summary of the daily number of fish passed by the Conowingo Dam East Fish Passage Facility in 2013.
Date: 4/1 4/2 4/3 4/4 4/5 4/6 4/7 4/8
Start Fishing Time: 8:00 9:00 10:00 9:00
End Fishing Time: 16:00 17:00 18:00 17:00
Hours of Operation: 8.0 8.0 8.0 8.0
Number of Lifts: 9 9 8 8
Water Temperature (°F): 47.1 46.9 49.1 50.2
AMERICAN SHAD 0 0 0 0
BLUEBACK HERRING 0 0 0 0
GIZZARD SHAD 2 62 51 190
HICKORY SHAD 0 0 0 0
STRIPED BASS 0 0 0 0
SEA LAMPREY 0 0 0 0
RAINBOW TROUT 0 0 0 0
BROWN TROUT 0 0 0 0
MUSKELLUNGE 0 0 0 0
CARP 0 0 0 0
QUILLBACK 0 0 0 0
WHITE SUCKER 0 0 0 0
S. REDHORSE 1 0 0 1
BROWN BULLHEAD 0 0 0 0
CHANNEL CATFISH 0 0 0 0
WHITE PERCH 0 0 0 0
ROCK BASS 0 0 0 0
REDBREAST SUNFISH 0 0 0 0
BLUEGILL 0 0 0 1
SMALLMOUTH BASS 0 0 0 0
LARGEMOUTH BASS 2 0 0 0
YELLOW PERCH 0 0 0 0
WALLEYE 0 0 0 0
AMERICAN EEL 0 0 0 0
COMELY SHINER 16 2 0 0
SPOTTAIL SHINER 0 0 0 0
BROOK TROUT 0 0 0 0
Total 21 0 64 0 51 0 0 192

Table 1
Continued.
Date: 4/9 4/10 4/11 4/12 4/13 4/14 4/15 4/16
Start Fishing Time: 8:00 8:00 8:00 8:00 7:50 8:00 8:00 8:00
End Fishing Time: 16:00 16:00 17:00 16:00 16:00 16:00 16:00 16:00
Hours of Operation: 8.0 8.0 9.0 8.0 8.2 8.0 8.0 8.0
Number of Lifts: 8 8 9 8 8 9 10 11
Water Temperature (°F): 51.4 53.1 57.2 57.7 58.1 60.3 57.9 55.9
AMERICAN SHAD 0 0 2 34 6 1 0 0
BLUEBACK HERRING 0 0 0 0 0 0 0 0
GIZZARD SHAD 12 28 129 719 3,602 7,035 18,807 11,344
HICKORY SHAD 0 1 0 0 0 0 0 0
STRIPED BASS 0 0 0 0 0 0 0 0
SEA LAMPREY 0 0 0 0 0 0 0 0
RAINBOW TROUT 0 0 0 0 0 0 0 0
BROWN TROUT 0 0 0 0 0 0 0 0
MUSKELLUNGE 0 0 0 0 0 0 0 0
CARP 0 0 1 0 0 1 1 0
QUILLBACK 2 1 337 151 37 25 0 0
WHITE SUCKER 0 0 12 8 0 2 1 0
S. REDHORSE 0 0 14 1 19 8 3 2
BROWN BULLHEAD 0 0 0 0 0 0 0 0
CHANNEL CATFISH 0 0 0 0 3 4 51 46
WHITE PERCH 0 0 0 0 0 0 0 0
ROCK BASS 0 0 0 0 0 0 0 0
REDBREAST SUNFISH 0 0 0 0 0 0 0 0
BLUEGILL 0 0 0 0 0 0 1 0
SMALLMOUTH BASS 1 2 3 7 7 11 15 0
LARGEMOUTH BASS 0 0 0 0 0 0 0 0
YELLOW PERCH 0 0 0 0 0 0 0 0
WALLEYE 0 0 1 2 1 5 14 12
AMERICAN EEL 0 0 0 0 0 0 0 0
COMELY SHINER 0 0 0 0 0 0 0 0
SPOTTAIL SHINER 0 2 0 0 0 0 0 0
BROOK TROUT 0 0 0 0 0 0 0 0
Total 15 34 499 922 3,675 7,092 18,893 11,404

Table 1
Continued.
Date: 4/17 4/18 4/19 4/20 4/21 4/22 4/23 4/24
Start Fishing Time: 8:00 9:00 8:00 8:00 8:00 8:00 8:00 8:00
End Fishing Time: 16:00 17:00 16:00 16:00 16:00 16:00 16:00 16:30
Hours of Operation: 8.0 8.0 8.0 8.0 8.0 8.0 8.0 8.5
Number of Lifts: 9 9 9 9 10 13 11 12
Water Temperature (°F): 56.3 56.3 56.3 56.5 56.3 56.3 56.3 56.3
AMERICAN SHAD 0 0 0 0 1 0 11 2
BLUEBACK HERRING 0 0 0 0 0 0 0 0
GIZZARD SHAD 10,700 7,709 8,586 10,197 8,946 11,998 12,771 13,580
HICKORY SHAD 0 0 0 0 0 0 0 0
STRIPED BASS 0 0 0 0 0 0 0 0
SEA LAMPREY 0 0 1 0 0 0 0 1
RAINBOW TROUT 0 0 0 0 0 0 0 0
BROWN TROUT 1 0 0 0 0 0 0 0
MUSKELLUNGE 0 0 0 0 0 0 0 0
CARP 1 0 1 0 0 0 1 0
QUILLBACK 0 0 0 0 0 0 0 0
WHITE SUCKER 0 0 0 0 0 0 0 0
S. REDHORSE 5 0 3 0 0 2 3 1
BROWN BULLHEAD 0 0 0 0 0 0 0 0
CHANNEL CATFISH 157 2 1 0 0 1 2 4
WHITE PERCH 0 0 0 0 0 0 0 0
ROCK BASS 0 0 0 0 0 0 0 0
REDBREAST SUNFISH 0 0 0 0 0 0 0 0
BLUEGILL 1 0 1 1 0 0 0 0
SMALLMOUTH BASS 1 0 2 1 0 3 2 2
LARGEMOUTH BASS 0 0 0 0 0 0 0 0
YELLOW PERCH 0 0 0 0 0 0 0 0
WALLEYE 8 2 0 3 3 0 3 1
AMERICAN EEL 0 0 0 0 0 0 0 0
COMELY SHINER 0 0 0 0 0 0 0 0
SPOTTAIL SHINER 0 0 0 0 0 0 0 0
BROOK TROUT 0 0 0 0 0 0 0 0
Total 10,874 7,713 8,595 10,202 8,950 12,004 12,793 13,591

Table 1
Continued.
Date: 4/25 4/26 4/27 4/28 4/29 4/30 5/1 5/2
Start Fishing Time: 8:00 8:00 8:00 8:00 9:30 8:00 8:00 8:00
End Fishing Time: 16:30 18:30 19:30 19:00 19:00 19:00 18:30 20:00
Hours of Operation: 8.5 10.5 11.5 11.0 9.5 11.0 10.5 12.0
Number of Lifts: 14 23 23 22 21 24 21 32
Water Temperature (°F): 57.2 58.1 59.2 61.2 61 60.3 61.2 61.7
AMERICAN SHAD 92 1,724 1,247 830 755 65 7 1,758
BLUEBACK HERRING 0 0 0 0 4 0 0 1
GIZZARD SHAD 15,504 26,067 25,609 16,750 23,361 29,864 39,659 36,162
HICKORY SHAD 0 0 0 0 0 0 0 0
STRIPED BASS 0 0 2 0 1 4 1 1
SEA LAMPREY 0 0 1 0 0 2 2 9
RAINBOW TROUT 0 0 0 0 0 1 0 0
BROWN TROUT 0 0 1 0 0 0 0 0
MUSKELLUNGE 1 0 0 0 0 0 0 0
CARP 3 3 0 2 2 1 0 3
QUILLBACK 0 2 9 53 2 0 2 9
WHITE SUCKER 0 0 0 0 0 5 0 0
S. REDHORSE 0 3 12 24 0 23 3 2
BROWN BULLHEAD 0 0 0 0 0 0 0 0
CHANNEL CATFISH 7 8 2 2 17 11 1 3
WHITE PERCH 0 0 0 0 0 0 0 1
ROCK BASS 0 0 0 0 0 0 0 1
REDBREAST SUNFISH 0 0 0 0 0 0 0 0
BLUEGILL 3 0 0 3 2 0 0 0
SMALLMOUTH BASS 2 6 5 1 3 17 3 8
LARGEMOUTH BASS 0 0 0 0 0 0 0 1
YELLOW PERCH 0 0 0 0 0 0 0 0
WALLEYE 4 0 0 1 2 14 2 1
AMERICAN EEL 0 0 0 0 0 0 1 0
COMELY SHINER 3 0 0 0 0 0 0 3
SPOTTAIL SHINER 0 0 0 10 0 0 0 0
BROOK TROUT 0 0 0 0 0 0 0 0
Total 15,619 27,813 26,888 17,676 24,149 30,007 39,681 37,963

Table 1
Continued.
Date: 5/3 5/4 5/5 5/6 5/7 5/8 5/9 5/10
Start Fishing Time: 8:00 8:00 8:00 8:00 8:00 8:00 8:00 8:00
End Fishing Time: 19:30 19:00 19:00 19:40 19:00 19:00 19:00 19:00
Hours of Operation: 11.5 11.0 11.0 11.7 11.0 11.0 11.0 11.0
Number of Lifts: 23 23 22 23 18 20 22 21
Water Temperature (°F): 63.9 64.4 64.4 65.3 65.5 65.3 66.2 68.9
AMERICAN SHAD 551 341 606 1,207 350 436 285 147
BLUEBACK HERRING 1 0 0 0 0 0 0 0
GIZZARD SHAD 21,123 24,908 24,331 24,288 24,326 32,393 39,130 38,264
HICKORY SHAD 0 0 0 0 0 0 0 0
STRIPED BASS 1 0 1 2 0 2 5 6
SEA LAMPREY 3 2 3 2 2 0 1 5
RAINBOW TROUT 1 0 0 0 0 0 0 0
BROWN TROUT 0 0 0 0 0 1 3 0
MUSKELLUNGE 0 0 0 0 0 0 0 0
CARP 4 1 1 3 0 1 6 23
QUILLBACK 78 40 34 32 12 18 11 89
WHITE SUCKER 0 0 2 0 0 0 2 0
S. REDHORSE 6 5 25 5 0 2 4 3
BROWN BULLHEAD 0 0 0 0 0 0 0 0
CHANNEL CATFISH 2 1 9 9 12 7 3 15
WHITE PERCH 0 0 0 0 0 0 0 0
ROCK BASS 0 0 0 0 0 0 0 0
REDBREAST SUNFISH 0 0 0 0 0 0 0 0
BLUEGILL 0 0 0 0 0 0 0 0
SMALLMOUTH BASS 5 6 1 0 5 4 7 0
LARGEMOUTH BASS 0 1 4 1 0 0 0 0
YELLOW PERCH 1 0 0 0 0 0 0 0
WALLEYE 1 1 2 4 5 6 5 5
AMERICAN EEL 0 0 0 1 0 0 0 0
COMELY SHINER 0 0 1 0 0 0 0 1
SPOTTAIL SHINER 0 0 0 0 0 0 0 0
BROOK TROUT 0 0 0 0 1 0 0 0
Total 21,777 25,306 25,020 25,554 24,713 32,870 39,462 38,558

Table 1
Continued.
Date: 5/11 5/12 5/13 5/14 5/15 5/16 5/17 5/18
Start Fishing Time: 8:00 8:00 8:00 8:00 9:30 8:00 8:00 8:00
End Fishing Time: 19:00 19:00 18:00 18:00 19:00 18:00 18:00 18:00
Hours of Operation: 11.0 11.0 10.0 10.0 9.5 10.0 10.0 10.0
Number of Lifts: 19 25 26 15 17 19 18 15
Water Temperature (°F): 68.9 67.5 68.4 66.9 65.3 65.3 63.5 65.3
AMERICAN SHAD 421 135 6 4 7 23 20 60
BLUEBACK HERRING 0 0 1 0 0 0 0 0
GIZZARD SHAD 32,107 51,156 65,413 32,815 18,950 29,748 28,492 21,437
HICKORY SHAD 0 0 0 0 0 0 0 0
STRIPED BASS 3 2 2 5 4 5 3 2
SEA LAMPREY 0 0 0 1 0 0 4 0
RAINBOW TROUT 0 0 0 0 0 0 0 1
BROWN TROUT 1 0 0 0 0 0 0 1
MUSKELLUNGE 0 0 0 0 0 0 0 0
CARP 25 21 5 2 1 2 1 0
QUILLBACK 32 52 0 0 2 1 0 2
WHITE SUCKER 0 0 0 0 0 0 0 0
S. REDHORSE 1 0 1 4 0 1 0 0
BROWN BULLHEAD 0 0 0 0 0 0 2 0
CHANNEL CATFISH 108 16 5 41 17 11 16 4
WHITE PERCH 0 0 0 0 1 0 0 0
ROCK BASS 0 0 0 0 0 1 0 0
REDBREAST SUNFISH 0 0 0 0 0 0 0 0
BLUEGILL 0 0 0 18 0 1 0 0
SMALLMOUTH BASS 4 6 1 1 1 0 0 1
LARGEMOUTH BASS 0 0 0 0 1 0 0 0
YELLOW PERCH 0 0 0 0 0 0 0 0
WALLEYE 7 0 4 4 8 1 0 7
AMERICAN EEL 0 0 0 1 0 0 0 0
COMELY SHINER 225 0 0 0 0 0 1 0
SPOTTAIL SHINER 0 0 0 0 0 0 0 0
BROOK TROUT 0 0 0 0 0 0 0 0
Total 32,934 51,388 65,438 32,896 18,992 29,794 28,539 21,515

Table 1
Continued.
Date: 5/19 5/20 5/21 5/22 5/23 5/24 5/25 5/26
Start Fishing Time: 8:00 8:00 8:00 8:00 8:00 8:00 8:00 8:00
End Fishing Time: 18:00 19:00 18:00 19:00 18:00 18:00 18:00 18:00
Hours of Operation: 10.0 11.0 10.0 11.0 10.0 10.0 10.0 10.0
Number of Lifts: 19 21 18 20 17 16 14 13
Water Temperature (°F): 65.3 65.8 68.2 69.3 72.5 72.5 69.3 68
AMERICAN SHAD 31 459 88 93 191 75 73 33
BLUEBACK HERRING 0 0 0 0 0 0 0 0
GIZZARD SHAD 20,573 32,451 21,492 30,470 22,954 5,597 6,762 8,404
HICKORY SHAD 0 0 0 0 0 0 0 0
STRIPED BASS 7 5 10 7 12 6 5 1
SEA LAMPREY 2 1 1 0 1 2 1 1
RAINBOW TROUT 0 0 0 0 2 0 0 0
BROWN TROUT 0 0 0 0 0 0 0 0
MUSKELLUNGE 0 0 0 0 0 0 0 0
CARP 5 11 6 22 4 7 4 0
QUILLBACK 9 64 109 84 111 831 4 1
WHITE SUCKER 1 0 0 0 0 0 0 0
S. REDHORSE 0 7 0 3 4 1 0 0
BROWN BULLHEAD 2 0 0 2 0 0 0 0
CHANNEL CATFISH 13 26 44 96 51 141 27 14
WHITE PERCH 0 0 0 0 0 0 0 0
ROCK BASS 0 0 0 0 0 0 0 0
REDBREAST SUNFISH 0 0 0 0 0 0 1 0
BLUEGILL 0 0 0 1 3 7 5 0
SMALLMOUTH BASS 1 0 0 2 3 0 0 0
LARGEMOUTH BASS 0 0 0 0 0 0 0 0
YELLOW PERCH 0 0 0 0 0 0 0 0
WALLEYE 3 1 1 8 9 4 1 0
AMERICAN EEL 0 0 0 0 0 0 0 0
COMELY SHINER 0 0 0 0 0 0 0 0
SPOTTAIL SHINER 0 0 0 0 0 0 0 0
BROOK TROUT 0 0 0 0 0 0 0 0
Total 20,647 33,025 21,751 30,788 23,345 6,671 6,883 8,454

Table 1
Continued.
Date: 5/27 5/28 5/29 5/30 5/31 6/1 6/2 6/3 Season
Start Fishing Time: 8:00 8:00 8:00 8:00 8:00 8:00 8:00 8:00 Total
End Fishing Time: 18:45 18:00 18:00 18:00 18:00 18:00 18:00 14:00
Hours of Operation: 10.8 10.0 10.0 10.0 10.0 10.0 10.0 6.0 575.6
Number of Lifts: 12 13 12 11 14 13 11 8 925
Water Temperature (°F): 67.5 70.5 71.2 70.7 72.5 73.4 75.2 75.6
AMERICAN SHAD 113 72 56 56 44 176 25 14 12,733
BLUEBACK HERRING 0 0 0 0 0 0 0 0 7
GIZZARD SHAD 7,813 10,108 18,783 13,655 12,578 9,047 3,865 3,171 1,076,048
HICKORY SHAD 0 0 0 0 0 0 0 0 1
STRIPED BASS 4 15 15 5 23 7 20 6 200
SEA LAMPREY 0 0 1 0 1 1 0 0 51
RAINBOW TROUT 0 0 0 0 0 1 0 0 6
BROWN TROUT 0 0 0 0 0 0 0 0 8
MUSKELLUNGE 0 0 0 0 0 0 0 1 2
CARP 1 1 3 0 0 0 0 0 180
QUILLBACK 74 277 11 18 6 1 30 62 2,725
WHITE SUCKER 0 0 0 0 0 0 0 0 33
S. REDHORSE 0 0 0 0 0 0 1 0 203
BROWN BULLHEAD 0 0 0 0 4 0 3 4 17
CHANNEL CATFISH 7 77 64 75 141 111 85 24 1,594
WHITE PERCH 0 0 0 0 0 0 0 0 2
ROCK BASS 0 0 0 0 0 0 0 0 2
REDBREAST SUNFISH 0 0 0 0 0 1 0 0 2
BLUEGILL 1 0 0 0 0 9 0 0 58
SMALLMOUTH BASS 0 1 0 0 0 0 0 0 151
LARGEMOUTH BASS 0 0 0 0 0 0 0 0 10
YELLOW PERCH 0 0 0 0 0 0 0 0 1
WALLEYE 2 5 1 7 10 13 18 2 224
AMERICAN EEL 0 0 0 0 0 0 0 0 3
COMELY SHINER 0 0 0 0 0 0 0 0 252
SPOTTAIL SHINER 0 0 0 0 0 0 0 0 12
BROOK TROUT 0 0 0 0 0 0 0 0 1
Total 8,015 10,556 18,934 13,816 12,807 9,367 4,047 3,284 1,094,526

Table 2.
Summary of American shad catch, Maryland DNR recaptures, daily average river flow, water temperature, turbidity (secchi),
unit operation, entrance gates utilized, attraction flow, and project water elevations during operation of the Conowingo Dam East
Fish Passage Facility in 2013.
American Marietta Water Maximum Entrance Tailrace Forebay
Shad MD DNR River Temp. Secchi Units in Gates Attraction Elevation Elevation Crest
Date Catch Recaptures* Flow (cfs) (°F) (in) Operation Utilized Flow (cfs) (ft) (ft) Gates
4/1 0 34,400 47.1 33 9 C/A 310 20.8 106.4
4/2 0 35,900
4/3 0 39,400 46.9 33 10 C/A 310 21.1 105.8
4/4 0 44,600 310
4/5 0 47,900 49.1 36 11 C/A 310 20.9 107.0
4/6 0 44,500 310
4/7 0 40,600 310
4/8 0 37,600 50.2 36 11 C/A 310 20.0 106.5
4/9 0 35,500 51.4 36 11 C/A/C 310 21.3 107.7
4/10 0 34,000 53.1 36 8 C 310 22.8 106.3
4/11 2 33,400 57.2 36 9 A/C 310 21.6 108.0
4/12 34 38,100 57.7 36 11 C/A/C 310 21.2 107.7
4/13 6 60,700 58.1 36 11 C 310 22.6 106.2
4/14 1 93,800 60.3 36 11 C 310 24.2 108.3
4/15 0 98,100 57.9 30 11 C 310 24.5 108.5 1 Gate Open
4/16 0 87,100 55.9 18 11 C 310 24.0 107.0
4/17 0 74,900 56.3 20 11 C 310 23.4 105.7
4/18 0 65,200 56.3 20 11 C 310 23.2 106.1
4/19 0 60,500 56.3 26 11 C 310 21.6 107.2
4/20 0 61,900 56.5 26 11 C 310 23.5 107.4
4/21 1 65,600 56.3 26 11 C 310 23.0 106.7
4/22 0 67,500 56.3 26 11 C 310 24.0 106.8
4/23 11 64,500 56.3 26 10 C 310 23.3 105.7
4/24 2 57,800 56.3 28 11 C 310 22.6 106.7
4/25 92 51,200 57.2 24 11 C/A/C 310 22.3 106.5
4/26 1724 47,200 58.1 30 11 C/A/C 310 23.5 106.2
4/27 1247 44,200 59.2 30 11 C/A 310 20.9 106.3
4/28 830 41,400 61.2 32 11 C/A/C 310 20.5 107.6
4/29 755 38,900 61.0 25 11 C/A 310 20.9 107.2
4/30 65 36,400 60.3 28 10 C/A 310 21.5 106.5
5/1 7 34,700 61.0 30 8 C/A 310 20.5 107.3
5/2 1758 32,200 61.7 30 7 C/A/A 310 21.4 108.5
5/3 551 29,800 63.9 30 11 C/A 310 20.3 106.7
5/4 341 28,000 64.4 30 11 A/C/A/C 310 20.1 106.6
5/5 606 26,300 64.4 30 11 A/C/A/C 310 20.7 106.3
5/6 1207 3 pink 24,100 65.3 28 9 A/C/A/C 310 20.6 106.6
5/7 350 1 pink 22,700 65.5 27 7 A/C/A/C 310 18.2 106.8

Table 2.
Continued.
American Marietta Water Maximum Entrance Tailrace Forebay
Shad MD DNR River Temp. Secchi Units in Gates Attraction Elevation Elevation Crest
Date Catch Recaptures* Flow (cfs) (°F) (in) Operation Utilized Flow (cfs) (ft) (ft) Gates
5/8 436 1 pink 22,000 65.30 26 11 A/C/A/C 310 20.9 108.4
5/9 285 1 pink 26,000 66.20 30 7 C/A 310 20.2 106.5
5/10 147 32,600 68.9 30 7 A/C 310 21.3 107.4
5/11 421 3 pink 36,500 68.9 34 11 C/A/C 310 19.8 107.1
5/12 135 40,200 67.5 34 11 C/A/C 310 21.4 107.4
5/13 6 47,200 68.4 27 11 C 310 23.4 107.5
5/14 4 48,000 66.9 33 11 C 310 23.0 107.8
5/15 7 43,600 65.3 24 11 C 310 22.9 107.5
5/16 23 38,900 65.3 24 11 A/C 310 21.8 108.0
5/17 20 34,900 63.5 24 11 A/C 310 21.5 107.3
5/18 60 31,500 65.3 27 10 A/C 310 21.3 107.7
5/19 31 28,300 65.3 28 6 A/C 310 20.2 107.8
5/20 459 4 pink 25,900 65.8 28 10 A/C 310 20.9 107.8
5/21 88 2 pink 23,800 68.2 36 10 A/C 310 20.7 107.5
5/22 93 69.3 36 10 A/C 310 20.8 107.2
5/23 191 1 pink 20,900 72.5 28 5 A/C 310 19.3 106.6
5/24 75 1 pink 20,700 72.5 34 6 A/C 310 20.6 107.3
5/25 73 1 pink 21,700 69.3 29 7 A/C 310 18.2 108.2
5/26 33 20,700 68.0 30 5 A/C 310 19.4 108.1
5/27 113 1 pink 21,900 67.5 28 7 A/C 310 18.0 108.2
5/28 72 24,100 70.5 28 11 A/C 310 20.6 107.7
5/29 56 2 pink 23,300 71.2 30 11 A 310 21.0 108.3
5/30 56 1 pink 23,000 70.7 24 11 A/C 310 20.0 107.8
5/31 44 27,500 72.5 30 11 A/C 310 21.0 108.0
6/1 176 1 pink 29,100 73.4 29 11 A/C 310 21.3 108.3
6/2 25 30,300 75.2 30 11 A/C 310 21.4 108.3
6/3 14 34,300 75.6 28 11 A/C 310 21.0 108.1

Table 3
Hourly summary of American shad passage at the Conowingo Dam East Fish Passage Facility in 2013.
Date: 1-Apr 2-Apr 3-Apr 4-Apr 5-Apr 6-Apr 7-Apr 8-Apr 9-Apr 10-Apr 11-Apr 12-Apr
Observation Time-Start: 8:00 10:00 11:00 9:30 8:00 8:10 8:00 8:00
Observation Time-End: 16:10 17:15 18:15 17:15 16:15 16:15 17:15 16:20
Military Time (hrs)
0600 to 0659
0700 to 0759
0800 to 0859 0 0 0 0 0
0900 to 0959 0 0 0 0 0 1
1000 to 1059 0 0 0 0 0 0 0
1100 to 1159 0 0 0 0 0 0 0 0
1200 to 1259 0 0 0 0 0 0 0 0
1300 to 1359 0 0 0 0 0 0 0 2
1400 to 1459 0 0 0 0 0 0 0 5
1500 to 1559 0 0 0 0 0 0 0 25
1600 to 1659 0 0 0 0 0 0 2 1
1700 to 1759 0 0 0
1800 to 1859 0
1900 to 1959
2000 to 2059
Total 0 0 0 0 0 0 0 0 0 0 2 34
Date: 13-Apr 14-Apr 15-Apr 16-Apr 17-Apr 18-Apr 19-Apr 20-Apr 21-Apr 22-Apr 23-Apr 24-Apr
Observation Time-Start: 8:00 8:10 8:00 8:15 8:00 9:00 8:00 8:00 8:00 8:00 8:00 8:20
Observation Time-End: 16:15 16:20 16:15 16:20 16:15 17:00 16:20 16:20 16:15 16:15 16:15 16:45
Military Time (hrs)
0600 to 0659
0700 to 0759
0800 to 0859 4 0 0 0 0 0 0 0 0 0 0
0900 to 0959 2 0 0 0 0 0 0 0 0 0 0 0
1000 to 1059 0 0 0 0 0 0 0 0 0 0 0 0
1100 to 1159 0 0 0 0 0 0 0 0 0 0 1 0
1200 to 1259 0 0 0 0 0 0 0 0 0 0 0 0
1300 to 1359 0 0 0 0 0 0 0 0 0 0 1 1
1400 to 1459 0 0 0 0 0 0 0 0 0 0 1 0
1500 to 1559 0 1 0 0 0 0 0 0 1 0 5 1
1600 to 1659 0 0 0 0 0 0 0 0 0 0 3 0
1700 to 1759
1800 to 1859
1900 to 1959
2000 to 2059
Total 6 1 0 0 0 0 0 0 1 0 11 2

Table 3 Continued.
Date: 25-Apr 26-Apr 27-Apr 28-Apr 29-Apr 30-Apr 1-May 2-May 3-May 4-May 5-May 6-May
Observation Time-Start: 8:00 8:00 8:05 8:00 9:00 8:10 8:00 8:00 8:15 8:00 8:00 8:10
Observation Time-End: 16:45 18:45 19:45 19:15 19:30 19:20 19:00 20:15 19:50 19:15 19:15 20:00
Military Time (hrs)
0600 to 0659
0700 to 0759
0800 to 0859 1 8 53 14 17 2 0 102 5 8 14
0900 to 0959 0 2 21 4 2 6 0 1 49 2 31 18
1000 to 1059 0 1 2 8 25 1 0 2 4 3 0 24
1100 to 1159 5 0 13 5 3 7 1 2 2 8 4 7
1200 to 1259 18 1 1 1 5 1 0 9 13 155 1 15
1300 to 1359 9 1 15 55 4 4 0 77 3 78 4 10
1400 to 1459 13 30 406 289 192 6 0 201 112 26 217 14
1500 to 1559 30 514 240 219 300 10 2 345 148 19 157 20
1600 to 1659 16 653 278 100 135 6 1 365 64 23 123 32
1700 to 1759 336 136 52 66 3 0 206 27 14 41 600
1800 to 1859 178 55 58 20 3 1 233 14 8 15 407
1900 to 1959 27 25 3 1 257 13 0 5 46
2000 to 2059 60
Total 92 1,724 1,247 830 755 65 7 1,758 551 341 606 1,207
Date: 7-May 8-May 9-May 10-May 11-May 12-May 13-May 14-May 15-May 16-May 17-May 18-May
Observation Time-Start: 8:00 8:15 8:00 8:15 8:00 8:00 8:00 8:00 9:15 8:00 8:00 8:00
Observation Time-End: 19:15 19:20 19:15 19:20 19:15 19:15 18:10 18:20 19:15 18:15 18:15 18:15
Military Time (hrs)
0600 to 0659
0700 to 0759
0800 to 0859 4 18 10 3 17 12 3 0 0 2 0
0900 to 0959 9 5 0 11 7 4 2 0 1 11 5 19
1000 to 1059 14 13 2 1 3 2 0 0 0 6 0 6
1100 to 1159 8 4 1 4 0 6 0 0 2 3 2 1
1200 to 1259 6 10 0 7 1 0 1 0 2 0 1 9
1300 to 1359 4 1 1 3 97 0 0 0 0 0 4 11
1400 to 1459 85 10 42 9 184 42 0 0 0 0 2 8
1500 to 1559 149 24 165 16 76 52 0 1 0 0 1 3
1600 to 1659 28 224 47 27 12 6 0 2 0 1 2 2
1700 to 1759 25 110 10 24 5 2 0 1 0 1 1 1
1800 to 1859 14 12 4 24 17 9 0 1 1 0 0
1900 to 1959 4 5 3 18 2 0 1
2000 to 2059
Total 350 436 285 147 421 135 6 4 7 23 20 60

Table 3 Continued
Date: 19-May 20-May 21-May 22-May 23-May 24-May 25-May 26-May 27-May 28-May 29-May 30-May
Observation Time-Start: 8:00 8:00 8:00 8:00 8:00 8:00 8:10 8:00 8:00 8:00 8:00 8:00
Observation Time-End: 18:15 19:20 18:15 19:15 18:15 18:15 18:15 18:15 19:00 18:15 18:15 18:15
Military Time (hrs)
0600 to 0659
0700 to 0759
0800 to 0859 3 16 8 9 7 1 6 5 3 4 8 1
0900 to 0959 6 68 15 7 73 3 7 4 2 22 10 0
1000 to 1059 3 184 11 6 28 9 4 0 4 6 4 1
1100 to 1159 3 65 4 8 12 28 3 0 3 10 2 6
1200 to 1259 0 43 8 25 12 13 0 3 1 1 9 0
1300 to 1359 6 49 7 18 16 2 5 5 9 6 8 0
1400 to 1459 3 12 9 12 12 8 7 0 11 4 4 6
1500 to 1559 4 12 13 1 22 4 6 12 20 1 6 26
1600 to 1659 0 4 9 3 7 3 4 2 33 8 1 7
1700 to 1759 1 3 3 3 0 0 26 1 9 4 3 5
1800 to 1859 2 3 1 1 2 4 5 1 18 6 1 4
1900 to 1959 0 0
2000 to 2059
Total 31 459 88 93 191 75 73 33 113 72 56 56
Date: 31-May 1-Jun 2-Jun 3-Jun
Observation Time-Start: 8:00 8:00 8:00 8:00
Observation Time-End: 18:15 18:15 18:15 14:30
Military Time (hrs)
0600 to 0659 0
0700 to 0759 0
0800 to 0859 6 0 0 0 374
0900 to 0959 9 102 9 6 556
1000 to 1059 2 51 4 1 435
1100 to 1159 4 11 0 1 249
1200 to 1259 5 3 5 3 388
1300 to 1359 3 2 3 1 525
1400 to 1459 9 3 0 2 1,996
1500 to 1559 5 3 2 2,661
1600 to 1659 0 1 0 2,235
1700 to 1759 1 0 1 1,721
1800 to 1859 0 0 1 1,123
1900 to 1959 410
2000 to 2059 60
Total 44 176 25 14 12,733
Season
Total

Table 4.
Summary Information for Conowingo EFL Volitional Passage, 1997 through 2013.
Year #Days of Ops #Hrs of Ops Total # of Lifts # Fish passed # Am. shad # Gizzard shad # Herring Avg.#fish/lift Ratio A.S./Gizz
1997 64 640 652 719,297 90,971 344,332 242,815 1,103 1/4
1998 50 433 460 712,993 39,904 654,575 706 1,550 1/16
1999 52 467 610 1,184,101 69,712 950,500 130,639 1,941 1/14
2000 45 368 570 493,955 153,546 317,753 14,965 866 1/2
2001 43 360 559 921,916 193,574 429,461 292,379 1,649 1/2
2002 49 440 560 656,894 108,001 513,794 2,111 1,173 1/5
2003 44 416 645 589,177 125,135 459,634 551 913 1/4
2004 44 390 590 715,664 109,360 602,677 190 1,212 1/6
2005 52 434 541 377,762 68,926 305,378 4 698 1/4
2006 61 430 619 714,918 56,899 655,990 0 1,154 1/12
2007 39 335 479 539,203 25,464 508,627 889 1,125 1/20
2008 51 409 483 943,838 19,914 919,975 5 1,954 1/46
2009 57 495 618 915,417 29,272 876,412 231 1,481 1/30
2010 59 526 685 857,263 37,757 813,429 5 1,251 1/22
2011 15 142 259 289,453 20,571 257,522 19 1,117 1/13
2012 62 633 1,230 1,109,911 22,143 1,070,672 52 902 1/48
2013 60 575.6 925 1,094,526 12,733 1,076,048 7 1,183 1/85

Table 5
Summary of selected operation and fish catch statistics at the Conowingo Dam East Fish Passage Facility, 1991 to 2013.
Number of
Days Number of Operating Catch Number of American Blueback
Year Operated Lifts Time (hrs) (millions) Species shad herring Alewife Hickory shad
1991 60 1168 647.2 0.651 42 13,897 13,149 323 0
1992 49 599 454.1 0.492 35 26,040 261 3 0
1993 42 848 463.5 0.530 29 8,203 4,574 0 0
1994 55 955 574.8 1.062 36 26,715 248 5 1
1995 68 986 706.2 1.796 36 46,062 4,004 170 1
1996 49 599 454.1 0.492 35 26,040 261 3 0
1997 64 652 640.0 0.719 36 90,971 242,815 63 0
1998 50 652 640.0 0.713 33 39,904 700 6 0
1999 52 610 467.0 1.184 31 69,712 130,625 14 0
2000 45 570 367.8 0.494 30 153,546 14,963 2 0
2001 43 559 359.8 0.922 30 193,574 284,921 7,458 0
2002 49 560 440.7 0.657 31 108,001 2,037 74 6
2003 44 645 416.6 0.589 25 125,135 530 21 0
2004 44 590 390.3 0.716 30 109,360 101 89 0
2005 52 541 434.3 0.378 30 68,926 4 0 0
2006 61 619 429.8 0.715 32 56,899 0 0 4
2007 39 479 335.3 0.539 31 25,464 460 429 0
2008 51 483 407.0 0.944 29 19,914 1 4 0
2009 57 618 495.6 0.915 30 29,272 71 160 0
2010 59 685 526.2 0.857 38 37,757 4 1 0
2011 15 259 142.4 0.021 24 20,571 17 2 20
2012 62 1230 633.7 0.022 35 22,143 25 27 0
2013 60 925 575.6 0.013 27 12,733 7 0 1

Table 6
Summary of American shad passage counts and percent passage values at Susquehanna
River dams, 1997-2013.
Number % of C.E.L. Number % of Holt. Number % of S.H.
1997 90,971 28,063 30.8% 20,828 74.2% - -
1998 39,904 8,235 20.6% 6,054 73.5% - -
1999 69,712 34,702 49.8% 34,150 98.4% - -
2000 153,546 29,421 19.2% 21,079 71.6% 4,687 22.2%
2001 193,574 109,976 56.8% 89,816 81.7% 16,200 18.0%
2002 108,001 17,522 16.2% 11,705 66.8% 1,555 13.3%
2003 125,135 25,254 20.2% 16,646 65.9% 2,536 15.2%
2004 109,360 3,428 3.1% 2,109 61.5% 219 10.4%
2005 68,926 34,189 49.6% 25,425 74.4% 1,772 7.0%
2006 56,899 35,968 63.2% 24,929 69.3% 1,913 7.7%
2007 25,464 10,338 40.6% 7,215 69.8% 192 2.7%
2008 19,914 2,795 14.0% 1,252 44.8% 21 1.7%
2009 29,272 10,896 37.2% 7,994 73.4% 402 5.0%
2010 37,757 16,472 43.6% 12,706 77.1% 907 7.1%
2011 20,571 21 0.1% 8 38.1% 0 0.0%
2012 22,143 4,238 19.1% 3,089 72.9% 224 7.3%
2013 12,733 2,503 19.7% 1,927 77.0% 202 10.5%
York HavenConowingo
East
Holtwood Safe Harbor

Figure 1
A plot of river flow (x 1000 cfs) (Marietta Gauge) and water temperature (°F), in relationship to the daily American shad
catch at the Conowingo East Fish Lift, spring 2013.
0.0
10.0
20.0
30.0
40.0
50.0
60.0
70.0
80.0
90.0
100.0
110.0
0
200
400
600
800
1,000
1,200
1,400
1,600
1,8004
/14
/24
/34
/44
/54
/64
/74
/84
/94
/10
4/1
14
/12
4/1
34
/14
4/1
54
/16
4/1
74
/18
4/1
94
/20
4/2
14
/22
4/2
34
/24
4/2
54
/26
4/2
74
/28
4/2
94
/30
5/1
5/2
5/3
5/4
5/5
5/6
5/7
5/8
5/9
5/1
05
/11
5/1
25
/13
5/1
45
/15
5/1
65
/17
5/1
85
/19
5/2
05
/21
5/2
25
/23
5/2
45
/25
5/2
65
/27
5/2
85
/29
5/3
05
/31
6/1
6/2
6/3
Wate
r Temp
erature an
d R
iver Flow
x1000 cfs D
aily
Am
eric
an s
had
cat
ch
Date
Water Temperature
River Flow
Highest Daily American shad catch. May 2, 2013(1,758)
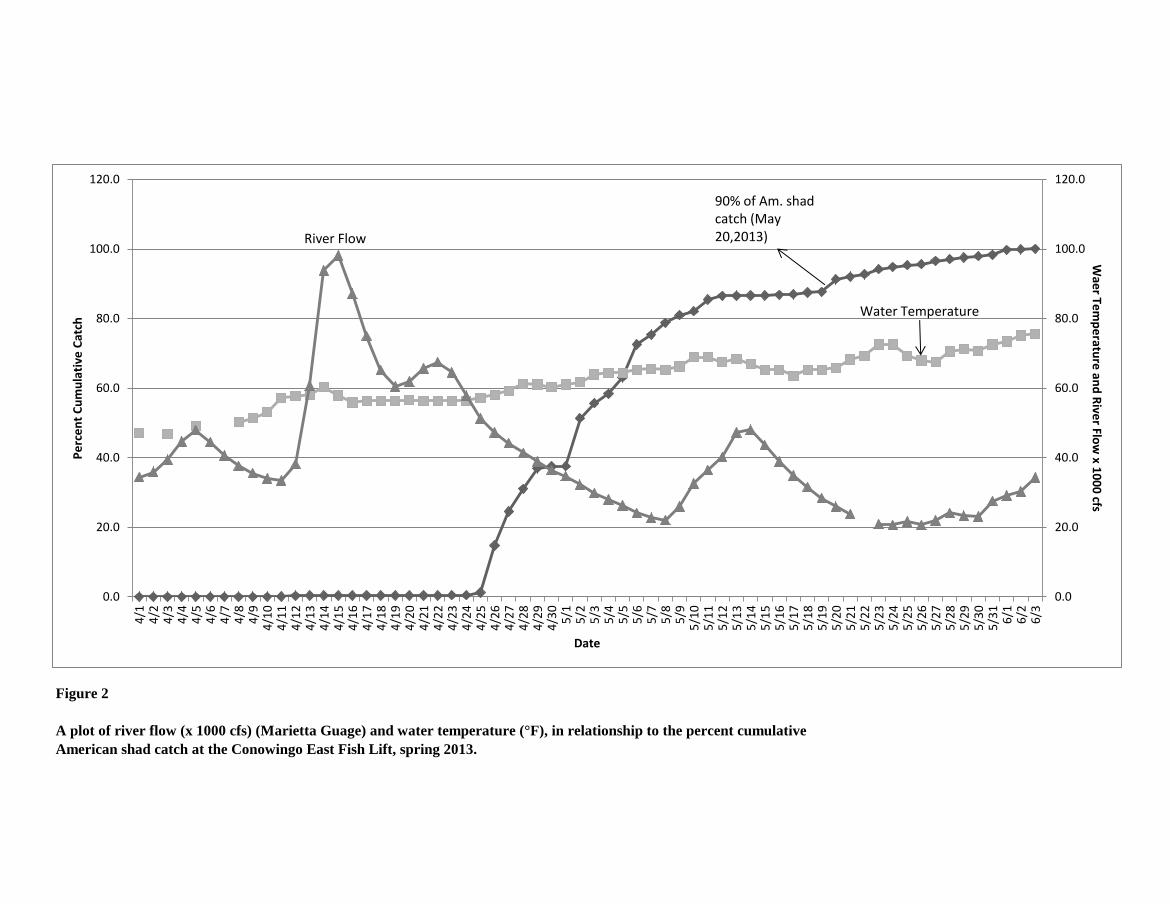
Figure 2
A plot of river flow (x 1000 cfs) (Marietta Guage) and water temperature (°F), in relationship to the percent cumulative
American shad catch at the Conowingo East Fish Lift, spring 2013.
0.0
20.0
40.0
60.0
80.0
100.0
120.0
0.0
20.0
40.0
60.0
80.0
100.0
120.0
4/1
4/2
4/3
4/4
4/5
4/6
4/7
4/8
4/9
4/1
04
/11
4/1
24
/13
4/1
44
/15
4/1
64
/17
4/1
84
/19
4/2
04
/21
4/2
24
/23
4/2
44
/25
4/2
64
/27
4/2
84
/29
4/3
05
/15
/25
/35
/45
/55
/65
/75
/85
/95
/10
5/1
15
/12
5/1
35
/14
5/1
55
/16
5/1
75
/18
5/1
95
/20
5/2
15
/22
5/2
35
/24
5/2
55
/26
5/2
75
/28
5/2
95
/30
5/3
16
/16
/26
/3
Wae
r Tem
pe
rature
and
Rive
r Flow
x 10
00
cfs P
erc
en
t C
um
ula
tive
Cat
ch
Date
90% of Am. shad catch (May 20,2013)
Water Temperature
River Flow