Embed Size (px)
Citation preview
1
Summary of
Impact Fee Study Report by
R.E. Pender, Inc.
A. Purpose of Impact Fees
Impact fees are used to fund capital-related costs (e.g., new buildings) incurred in
providing governmental service to "new" development. The basic philosophy behind impact
fees is that "new" development should bear the additional or "incremental" capital cost incurred
and necessary to provide service to the "new" development. This establishes a cost causation
or "nexus" requirement between the cost incurred in providing the service and those who
benefit from the service. To be clear however, impact fees are not intended to recover annual
operating expenses (e.g., utility costs) or to pay for capital expenditures related to the correction
of an existing deficiency in the service provided.
The Company currently imposes an impact fee on a request for a new connection or
additional service. This impact fee helps the pay a portion of the costs for the new system
improvements required to serve the new development. The Company has retained R.E. Pender,
Inc. to assist in developing an impact fee based on current conditions.
B. Method of Calculating Impact Fees
The Pender Report determines the allowable impact fee based on: (1) the projected
additional demand for electricity from the future growth and (2) the Company's cost of
constructing system improvements required to deliver this electricity to customers.
The additional demand for electricity is based on the Company's projection of future
growth in electricity sales caused by new customers added to the system. This projection is
consistent with the recent historical growth on the HLP system. The Pender Report uses
the Company's growth projections to determine the total, maximum annual demand for
electricity from all classes of customers and to determine that projected increase in demand for
electricity was 4,665.9 kW for the period 2015 through 2019; and 18,842.8 kW for the period
2015 through 2034.
The cost of system improvements required to serve this additional demand was provided
by the Company's Impact Fee Facilities Plan. The Pender Report divides these projected costs
by the projected increase in demand to determine the cost/kW of these system improvements.
This amount was adjusted by a utilization factor to reflect that typical customers typically use
less electric power than the size of a typical connection.
2
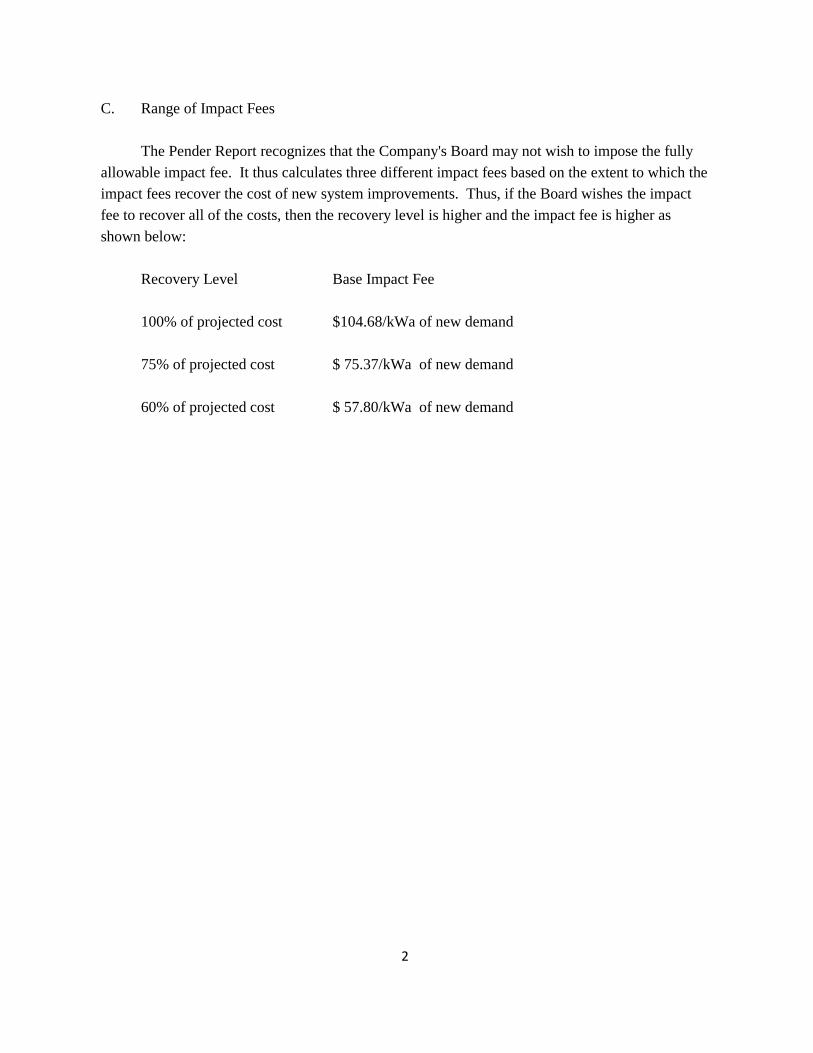
C. Range of Impact Fees
The Pender Report recognizes that the Company's Board may not wish to impose the fully
allowable impact fee. It thus calculates three different impact fees based on the extent to which the
impact fees recover the cost of new system improvements. Thus, if the Board wishes the impact
fee to recover all of the costs, then the recovery level is higher and the impact fee is higher as
shown below:
Recovery Level Base Impact Fee
100% of projected cost $104.68/kWa of new demand
75% of projected cost $ 75.37/kWa of new demand
60% of projected cost $ 57.80/kWa of new demand

HEBER LIGHT & POWER
2015 IMPACT FEE STUDY REPORT
BY:
eA XA cxÇwxÜ? \ÇvA
APRIL 24, 2015

TABLE OF CONTENTS
(i)
Section 1 – Introduction & Background Information ...................................................................... 1-1 1.1 – Introduction ........................................................................................................................ 1-1 1.2 – Impact Fees – General ....................................................................................................... 1-1 1.3 – Impact Fees – Utah ............................................................................................................ 1-3 1.4 – Heber Light & Power ......................................................................................................... 1-4 1.5 – Wasatch County. ................................................................................................................ 1-5 1.6 – R. E. Pender, Inc................................................................................................................. 1-5 1.7 – Electricity Supply & Demand. .......................................................................................... 1-6 1.7.1 – General ............................................................................................................................ 1-6 1.7.2 – Electricity Supply ............................................................................................................ 1-6 1.7.3 – Transmission of Electricity ............................................................................................. 1-8 1.7.4 – Distribution of Electricity ............................................................................................... 1-8
Section 2 – Impact Fee Facilities Plan .............................................................................................. 2-1 2.1 – General ................................................................................................................................ 2-1 2.2 – Level of Service Standards ................................................................................................ 2-1 2.3 – Demands Placed on Existing Facilities ............................................................................. 2-1 2.4 – Capital Projects and Costs ................................................................................................. 2-3 2.5 – Certification of the IFFP .................................................................................................... 2-5
Section 3 – Impact Fee Analysis ....................................................................................................... 3-1 3.1 – General ................................................................................................................................ 3-1 3.2 – Impact Fee Analysis ........................................................................................................... 3-1 3.3 – Impact Fee Charges – Present and Proposed .................................................................... 3-3 3.4 – Certification of the IFA ...................................................................................................... 3-4
Section 4 – Summary and Recommendations .................................................................................. 4-1 4.1 – Summary of Findings ........................................................................................................ 4-1 4.2 – Observations and Recommendations ................................................................................ 4-2
Figures Figure 1-1 – Illustration of a Typical Power Delivery System ................................................. 1-6 Figure 1-2 – Illustration of a Load Duration Curve with Unit Stacking ................................... 1-7
Tables Table 2-1 – Summary of the Increase in CP and NCP Demands ............................................. 2-2 Table 2-2 – General Description and Cost of Projects for New Development ........................ 2-4 Table 2-3 – Schedule of Expenditures for Projects Related to New Development ................. 2-4
Appendices Appendix A – Utah Statute U.C.A. 1953 § 11-36a-102 Appendix B – Impact Fee Facilities Plan, dated April 24, 2015 Appendix C – 2006 Impact Fee Calculation Worksheet
Exhibits Exhibit 1 – Analysis of Forecasted Customer and Load Data Exhibit 2 – Analysis of Impact Fee Projects and Costs Exhibit 3 – Calculation of the Proposed Base Impact Fee Exhibit 4 – Summary of Impact Fee Charges for Residential & Commercial Customers

SECTION 1 INTRODUCTION & BACKGROUND INFORMATION
HLP 2015 Impact Fee Study Report
1-1
1.1 INTRODUCTION
Heber Light & Power (“HLP” or the “Client”) engaged the firm of R. E. Pender, Inc. (hereinafter
“Consultant,” “firm,” “we” or “our”) to conduct certain studies and analyses related to the
development of Electric Power Impact Fees (“Impact Fees”) that will be considered for
implementation by HLP in the near future. The current HLP Impact Fees were implemented in 2005
following an impact fee study conducted by Electric Power Engineering Associates. An impact fee
study was also conducted in 2013 (the “2013 Study”), the results of which were conveyed to the HLP
Board (the “Board”) on September 25, 2013. At that time, the Board, at the recommendation of the
HLP management, voted to keep the then current impact fees in place.1 The work for the immediate
Impact Fee Study (the “2015 Study”) was conducted in accordance with a Consulting Agreement,
dated October 28, 2014 , between HLP and the Consultant ; and Utah Statute U.C.A. 1953 § 11-36a-
102.
In conducting the subject study, we relied on certain publicly available information, data supplied by
HLP and electronic spreadsheets developed specifically for this engagement. In reaching the
conclusions and recommendations discussed herein we made certain assumptions and considerations
regarding future events and circumstances that may affect the ultimate outcome of our findings. We
make no assurances or guarantees as to the actual outcome of any assumption or consideration made
in the development of our studies. However, we believe that all assumptions and considerations made
herein are appropriate and reasonable for purposes of the 2015 Study. In addition, certain information
was obtained by the firm and/or provided to the firm by other sources, all of which are believed to be
reliable and reasonable for the purpose of this undertaking.
1.2 IMPACT FEES - GENERAL
Generally speaking, impact fees are used by government agencies (e.g., city and county governments)
to fund certain capital-related costs (e.g., new buildings) incurred in providing governmental services
to “new” development as mandated by law or ordinance. The basic philosophy behind the
implementation of impact fees is that “new” development should bear the additional or “incremental”
capital cost incurred in order to provide services to the “new” development. This establishes a cost
causation or “nexus” requirement between the cost incurred in providing the service and those who
1 The Board’s action was prompted, in part, by the fact that the results of the 2013 Study showed only a slight increase in the impact fee was warranted, based on a 50 percent impact fee cost recovery scenario.

SECTION 1 INTRODUCTION & BACKGROUND INFORMATION
HLP 2015 Impact Fee Study Report
1-2
benefit from the service. To be clear however, impact fees are not intended to recover annual
operating expenses (e.g., utility costs) or to pay for capital expenditures related to the correction of an
existing deficiency in the service provided.
There are two generally recognized methods for calculating impact fees: the inductive method and the
deductive method.
Under the inductive method, the cost and capacity of a particular facility is identified and used as the
generic model for all future facilities. Take for example the cost of a new electrical substation having
a construction cost of $2,000,000 and sized to serve approximately 5,000 residential dwelling units
and 1,000,000 of commercial square feet. In this very simple example, assuming the capital cost is
recovered evenly (50% each) between residential and commercial loads, the impact fee would be
determined as follows:
Residential = $2,000,000 x .50 / 5,000 = $200 per dwelling unit
Commercial = $2,000,000 x .50 / 1,000,000 = $1.00 per sq. foot.
An advantage to this method is that it is fairly straightforward and easy to implement. It also is not
affected by changes to capital improvement plans or population estimates. The monies needed for the
future capital requirement (like the electrical substation above) will be available as soon as actual
growth reaches the design levels, which may be any number of years down the road. A disadvantage
of the inductive method is that the impact fee calculation is based on a generic model approach and,
therefore, may not address the special needs of the community. It also may fail to capture all of the
capital requirements associated with the project, including, for example the additional facilities that
will be needed to support the primary project (e.g., required increases to the capacity of administrative
support offices).
The deductive approach involves calculating the impact fee based on the anticipated additional
demand (e.g., number of new residential dwelling units) on a facility or infrastructure used in
providing services. Normally, the entity implementing the impact fee usually will have an established
level of service (“LOS”) standard for the particular service (e.g., 1 community park per 5,000
population) or alternatively, the current LOS (1 community park serving an existing population of
4,000) is used as the basis to determine the capital requirements underlying the impact fee calculation.

SECTION 1 INTRODUCTION & BACKGROUND INFORMATION
HLP 2015 Impact Fee Study Report
1-3
In either case, once the LOS standard is known, it is a matter of applying that standard to future
growth projections in population and/or commercial space as reflected in a master plan and/or capital
improvement plan to determine the new capital requirements.
An advantage of using the deductive method is that it will address the specific needs of the
community when determining the future capital requirements. The downside is that this method
requires much more detailed information to perform the calculations and must be updated periodically
as changes in population projections, master plans, etc. occur.
The inductive and deductive methods are both valid and the use of one or the other will depend largely
upon the information available and the specific circumstances of the community. In calculating the
subject impact fees for HLP we have employed only the deductive approach.
1.3 IMPACT FEES - UTAH
Almost all states have some form of impact fees and 26 of those states have statutes authorizing the
use of impact fees. In Utah, impact fees are governed by state statute, specifically U.C.A. 1953 § 11-
36a-102 (the “Statute”). A copy of the Statute is attached hereto as Appendix A.
Very generally, the Statute requires that each political subdivision imposing an impact fee shall, with
some exceptions, (1) prepare an Impact Fee Facilities Plan (§ 11-36a-301), (2) perform an Impact Fee
Analysis (§ 11-36a-303), (3) calculate the Impact Fee(s) (§ 11-36a-305) and (4) certify the Impact Fee
Facilities Plan (§ 11-36a-306).
According to the Statute, the “Impact Fee Facilities Plan (“IFFP”) shall identify (a) demands placed
upon existing public facilities by new development activity; and (b) the proposed means by which the
political subdivision will meet those demands.” The IFFP shall also generally consider all revenue
sources, including impact fees, used to finance impacts on system improvements.
The Impact Fee Analysis (“IFA”) portion of the Statute states that (1) “each local political subdivision
or private entity intending to impose an impact fee shall prepare a written analysis of each impact fee:”
and (2) “shall also prepare a summary of the impact fee analysis designed to be understood by a lay
person.” The requirements of the IFA include identifying the estimated impacts on existing capacity
and system improvements caused by the anticipated development activity. The political subdivision

SECTION 1 INTRODUCTION & BACKGROUND INFORMATION
HLP 2015 Impact Fee Study Report
1-4
must also estimate the proportionate share of (i) the costs of existing capacity that will be recouped
and (ii) the costs of the impacts on system improvements that are reasonably related to the new
development activity.
The calculation of the Impact Fee may include the following:
(a) The construction contract price;
(b) The cost of acquiring land, improvements, materials, and fixtures;
(c) The cost for planning, surveying, and engineering fees for services provided for and
directly related to the construction of the system improvements; and
(d) For a political subdivision, debt service charges, if the political subdivision might use
impact fees as a revenue stream to pay the principal and interest on bonds, notes or other
obligations issued to finance the costs of the system improvements.
Also, the Calculation of the Impact Fee must be based on realistic estimates and the assumptions
underlying such estimates must be disclosed in the IFA.2
Finally, a written certification shall be included in the IFFP and the IFA by the person or entity that
prepared those requirements.
1.4 HEBER LIGHT & POWER
Headquartered in Heber City, Utah, HLP is a municipal-owned electric utility that serves about
10,7003 customers in Wasatch County. The entire service area covers about 120 square miles in what is
referred to as the Heber Valley. The utility's service area spans east to the Uinta National Forest, west
to the entrance of Snake Creek Canyon in Midway City, south to the National Forest boundary and
north to Coyote Lane on Highway 40. Along with its electric distribution system, HLP owns and
operates three hydroelectric generators and three gas/diesel generating plants with an overall
generating capacity of some 17 megawatts. Prior to the current economic slowdown, annual customer
growth averaged a robust 15-25% per year; however, recently, the growth has been a very modest 2-3%
2 The assumptions used in the 2015 Study were based largely on actual historical data for the HLP system and/or industry data obtained from reliable public sources. 3 As of year-end 2014

SECTION 1 INTRODUCTION & BACKGROUND INFORMATION
HLP 2015 Impact Fee Study Report
1-5
per year. The customer base includes approximately 9,300 residential, 1,300 commercial and 100 street light
customers or accounts.
1.5 WASATCH COUNTY
Wasatch County is situated in north-central Utah about 40 miles to the east and south of Salt Lake City.
Heber City, the county seat, is the largest city in the county. Wasatch County is part of the Heber
Micropolitan Statistical Area as well as the Salt Lake City-Ogden-Clearfield Combined Statistical Area.
The total land and water area of the county is 1,209 square miles. As of the 2010 Census,
the county had a total population of 23,530 people and 4,743 households. The population
density in the county was 20 inhabitants per square mile. Geographically speaking, the
county lies between the Great Basin and the Unitah Basin. Elevations range from a low
point of 5,220 where the Provo River crosses the Utah County line to a high point of
nearly 10,800 feet near Murdock Mountain. Except for the Heber, Strawberry and Round valleys, the
county is mostly mountainous. Most county residents are within a 30 to 60 minute commute to a wide
range of employment opportunities. According to the Census, prior to 1970, only about 4 percent of the
work force commuted out of the county for employment. Thanks to improved roadways to Park City, Salt
Lake City and Utah County that number has increased to some 50 percent today. The increase in number of
commuters is partly due to people moving into the county for lifestyle reasons while keeping their jobs
along the Wasatch Front.4
1.6 R. E. PENDER, INC.
Located in the Orlando, Florida area, R. E. Pender, Inc. is solely-owned by Robert E. Pender, ASA.
The firm was founded in 2005 for the purpose of providing consulting services in the areas of
appraisals and valuations; wholesale and retail utility rate studies; impact fee studies; economic
feasibility studies; contract compliance reviews; and litigation support. Mr. Pender began his
consulting career with R. W. Beck, Inc., where he advanced to the position of Principal and Senior
Director. He has been recognized and qualified as an expert before the courts and regulatory
commissions in the areas of utility appraisals and utility rates and regulation. He has testified before
circuit courts, Federal District Court, the Federal Energy Regulatory Commission, arbitration panels
4 Sources: Wasatch County General Plan and en.wikipedia.org.

SECTION 1 INTRODUCTION & BACKGROUND INFORMATION
HLP 2015 Impact Fee Study Report
1-6
and utility regulatory commissions in the District of Columbia, New York, Ohio, New Mexico,
Pennsylvania and Kansas. Mr. Pender received his B.S. degree in Accounting and Business
Administration from Indiana State University in 1977. He has completed several valuation courses
through the American Society of Appraisers and is certified by that organization as an Accredited
Senior Appraiser – Public Utilities. Affiliations include the American Society of Appraisers, the
International Association of Assessing Officers, the American Water Works Association and
Government Finance Officers Association.
1.7 ELECTRICITY SUPPLY AND DEMAND
1.7.1 GENERAL
As illustrated in Figure 1-1 below, an electrical power delivery system is made up of three basic
components or functions: electric generators that produce the power; a transmission system to
deliver the power to the distribution system; and the distribution system which delivers the
power to the end-user.
Figure 1-1 Illustration of a Typical Power Delivery System
Source: en.Wikepedia.org
1.7.2 ELECTRICITY SUPPLY
In any electrical system, electricity (measured in kilowatt-hours) is produced by a number of
generation technologies, powered by a diversity of fuel resources. These generators may include
steam (nuclear, coal and oil); hydroelectric (run-of-river and pumped storage); combined-cycle

SECTION 1 INTRODUCTION & BACKGROUND INFORMATION
HLP 2015 Impact Fee Study Report
1-7
(natural gas and fuel oil); simple-cycle (natural gas and fuel oil) and internal combustion (diesel).
The utility may also utilize generation supplied by others in the form of purchased power
agreements, which can include firm power (long-term, interim and short-term); unit power (a
purchase out of a specific generating unit) and non-firm (usually short-term). The type and
amount of each generating resource that is utilized by the utility in meeting its hourly demand
(measured in megawatts) for electricity at any point in time will depend primarily on the amount
and duration of the demand, the availability of the generating units and the variable operating
cost of the generating unit(s). Very simply, in meeting the daily demand for electricity, each
available generating resource is stacked according to its operating cost (lowest to highest) and
subsequently dispatched to meet the demand for electricity in each hour of the day. This so-
called “merit” stacking/dispatch procedure can be illustrated as follows:
Figure 1-2 Illustration of a Load Duration Curve with Unit Stacking
0
5000
10000
15000
20000
25000
30000
Load Duration (0% - 100%)
Load
(M
W)
Load (MW)
The utility’s peak demand is the highest demand for electricity (measured in megawatts) recorded in
any one hour (based on a 15, 30 or 60 minute interval) and occurring within a specified time period
(day, week, month, year or seasonal (summer, winter). It is during these peak periods that a utility
will utilize its entire portfolio of generating resources including its peaking generating resources such
as combustion turbines. However, because of their relatively high operating costs, combustion

SECTION 1 INTRODUCTION & BACKGROUND INFORMATION
HLP 2015 Impact Fee Study Report
1-8
turbines are usually called upon for only a very short period of time – when the utility’s peak demands
are at the highest levels.
1.7.3 TRANSMISSION OF ELECTRICITY
Immediately after leaving the generator, electricity is transformed (i.e., stepped up to a higher voltage)
for delivery to the utility’s high-voltage (“H-V”) transmission system. Generally, the H-V
transmission system consists of the towers, conductor, substations and other equipment necessary to
deliver power from the various generating stations to the utility’s distribution system or to other
utilities interconnected with the H-V transmission system. H-V transmission system voltages
typically range from 115 kilovolts to 500 kilovolts. A power transmission system is sometimes
referred to colloquially as a "grid." Redundant paths and lines are provided so that power can be
routed from any power plant to any load center, through a variety of routes, based on the economics
and physical characteristics of the transmission path and the cost of power. Much analysis is done by
transmission system owners to determine the maximum reliable capacity of each line, which, due to
system stability considerations, may be less than the physical or thermal limit of the line. The H-V
transmission system is continually monitored for potential “over-loading” conditions and utilities will
sometimes be called upon to reduce/increase output at certain generating plants in order to relieve the
condition. The location of generating plants in relation to the electricity load on the H-V transmission
system is a very important consideration in utility planning. Needless-to-say, because of aesthetic,
environmental, political, regulatory and other factors, generating plants and the transmission lines
making up the “grid” can rarely be placed in the optimum location allowing for the for most efficient
utilization of electric system. Transmission bottlenecks or “constraints” as they are typically
referred to are sometimes created because the transmission grid is not configured or sized correctly to
allow for the uninterrupted flow of power from the generating plant to the load centers experiencing
the highest demand. Moreover, the level and duration of the constraint can vary depending on amount
of load on the system, unit outages, and events affecting the flow of power.
1.7.4 Distribution of Electricity
Electricity distribution is the final stage in the delivery of electricity to end-users. A distribution
system's network carries electricity from the transmission system and delivers it to consumers.
Generally, a typical electric distribution system would include medium-voltage (e.g., 12.46 kV -

SECTION 1 INTRODUCTION & BACKGROUND INFORMATION
HLP 2015 Impact Fee Study Report
1-9
46 kV) power lines, substations, switches, poles, transformers, service drops and metering. The
distribution system begins as the voltage is stepped down (e.g., 69 kV / 12.47 kV), via the
substation transformer(s) and ends as the secondary service enters the customer's meter socket.
Distribution circuits begin at the low-voltage side of the transformer located in the substation.
Conductors for the distribution delivery system are either located overhead on utility poles, or
buried underground in the case of urban, downtown areas or new developments. Urban and
suburban distribution is normally three-phase in order to serve all types of customers; residential,
commercial, and industrial.
Most electric customers are connected to a transformer (pole mounted or ground level protective
enclosure), which reduces the distribution voltage to the relatively low voltage used by lighting
and interior wiring systems. Each customer has an "electrical service" or "service drop"
connection and a meter for billing.

SECTION 2 IMPACT FEE FACILITIES PLAN
HLP 2015 Impact Fee Study Report 2-1
2.1 GENERAL
As discussed above, the Impact Fee Facilities Plan (“IFFP”) shall, in accordance with the Statute,
identify (a) demands placed on existing public utilities by new development activity; and (b) the
proposed means by which the local subdivision will meet those demands. In addition, each local
political subdivision shall generally consider the revenue sources that will be used to finance the
impacts on system improvements.
The IFFP, as discussed herein, is a summary presentation of the “Impact Fee Facilities Plan,” dated
April 24, 2015, prepared internally by the HLP staff. That report is attached hereto as Appendix B
and is incorporated herein by reference.
2.2 LEVEL OF SERVICE STANDARDS
As is the case with most any electric utility system, HLP plans, designs and operates its system based
on certain standards and criteria outlined in industry treatises such as the American National
Standards Institute (“ANSI”) and the Institute of Electrical and Electronics Engineers (“IEEE”)
Standards Association. These standards, which may be supplemented at the local level based on the
specific needs of the utility, typically address such things as:
• Transformer ratings under varying load levels and loading conditions;
• First contingency emergency situations;
• Distribution circuit loading criteria;
• Primary circuit voltage drop; and
• Distribution circuit reinforcement.
Using the above criteria, the utility will determine its future facility needs based on the amount of load
(i.e., demand) placed on the existing system over a pre-determined planning horizon (e.g., five years).
2.3 DEMANDS PLACED ON EXISTING FACILITIES
The demand placed on an electric system is typically measured in kilowatts (kW) or kilovolt-amperes
(kVa) and stated as either coincident-peak (“CP”) demand or non-coincident peak (“NCP”) demand.
The system CP demand is typically the maximum hourly demand for the entire system measured over
some time period (e.g., week, month, year); i.e., the point in time where the sum of all demands placed
SECTION 2 IMPACT FEE FACILITIES PLAN
HLP 2015 Impact Fee Study Report 2-2
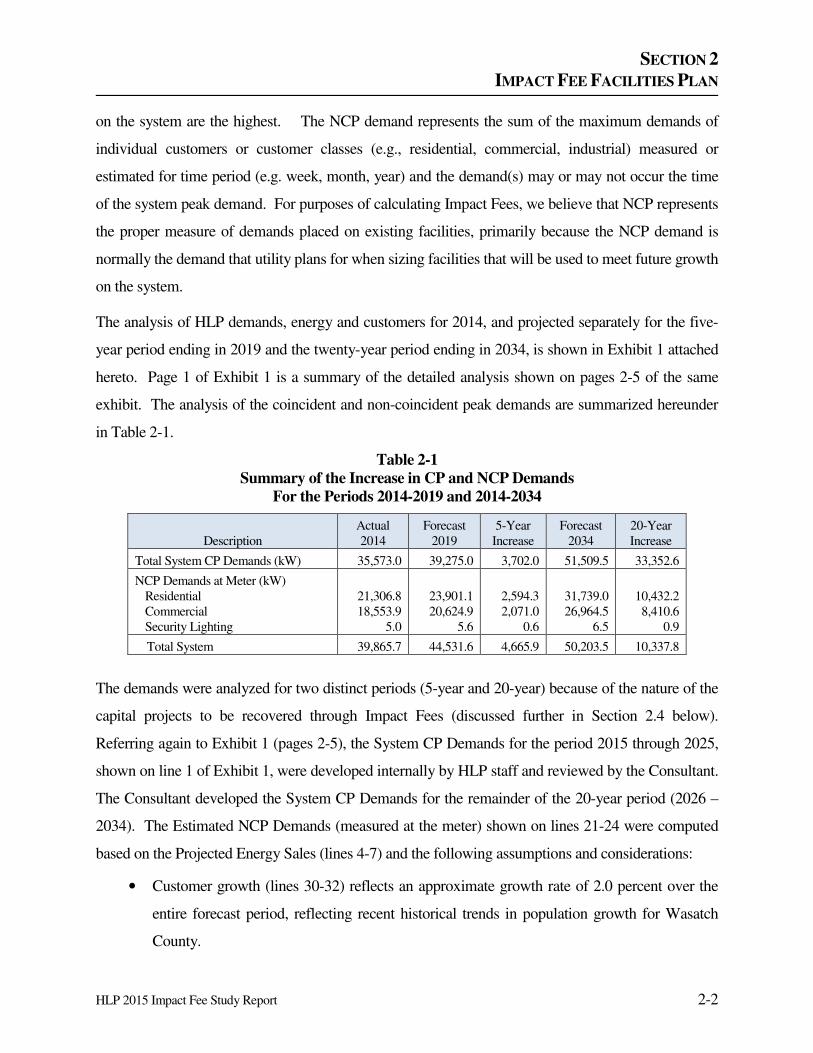
on the system are the highest. The NCP demand represents the sum of the maximum demands of
individual customers or customer classes (e.g., residential, commercial, industrial) measured or
estimated for time period (e.g. week, month, year) and the demand(s) may or may not occur the time
of the system peak demand. For purposes of calculating Impact Fees, we believe that NCP represents
the proper measure of demands placed on existing facilities, primarily because the NCP demand is
normally the demand that utility plans for when sizing facilities that will be used to meet future growth
on the system.
The analysis of HLP demands, energy and customers for 2014, and projected separately for the five-
year period ending in 2019 and the twenty-year period ending in 2034, is shown in Exhibit 1 attached
hereto. Page 1 of Exhibit 1 is a summary of the detailed analysis shown on pages 2-5 of the same
exhibit. The analysis of the coincident and non-coincident peak demands are summarized hereunder
in Table 2-1.
Table 2-1 Summary of the Increase in CP and NCP Demands
For the Periods 2014-2019 and 2014-2034
Description Actual 2014
Forecast 2019
5-Year Increase
Forecast 2034
20-Year Increase
Total System CP Demands (kW) 35,573.0 39,275.0 3,702.0 51,509.5 33,352.6
NCP Demands at Meter (kW) Residential Commercial Security Lighting
21,306.8 18,553.9
5.0
23,901.1 20,624.9
5.6
2,594.3 2,071.0
0.6
31,739.0 26,964.5
6.5
10,432.2 8,410.6
0.9
Total System 39,865.7 44,531.6 4,665.9 50,203.5 10,337.8
The demands were analyzed for two distinct periods (5-year and 20-year) because of the nature of the
capital projects to be recovered through Impact Fees (discussed further in Section 2.4 below).
Referring again to Exhibit 1 (pages 2-5), the System CP Demands for the period 2015 through 2025,
shown on line 1 of Exhibit 1, were developed internally by HLP staff and reviewed by the Consultant.
The Consultant developed the System CP Demands for the remainder of the 20-year period (2026 –
2034). The Estimated NCP Demands (measured at the meter) shown on lines 21-24 were computed
based on the Projected Energy Sales (lines 4-7) and the following assumptions and considerations:
• Customer growth (lines 30-32) reflects an approximate growth rate of 2.0 percent over the
entire forecast period, reflecting recent historical trends in population growth for Wasatch
County.

SECTION 2 IMPACT FEE FACILITIES PLAN
HLP 2015 Impact Fee Study Report 2-3
• Growth in Average Annual Usage per Customer (lines 17-19) for all customer classes was
assumed to be nil due to increases in appliance efficiencies and demand side management
programs.
• Estimated NCP Load Factors (lines 32-34) were assumed to be: Residential – 43.2%;
Commercial – 43.0% and Street Lights – 100.0%.
• The System Load Factor (line 3) was assumed to average approximately 53% over the
forecast period.
As discussed later in Section 3, it is the estimated change (i.e., increase) in the Total System NCP
Demand from 2014 to 2019 and 2014 to 2034 that is used as the basis for calculation of the Impact
Fees. As reflected in Table 2.1 above, the total combined increase in NCP Demand for Residential
and Commercial during 2014 – 2019 amounts to 4,465.3 kW; for 2014 – 2034 the combined increase
is 10,336.8 kW.
As noted in the IFFP (Appendix B), given the current demand level and existing capacity of the
system, HLP cannot serve the expected increase demand over the next five or twenty-year planning
horizons without increasing the capacity of the system. As discussed below, the increase in capacity
will be accomplished through a number of capital improvement projects undertaken over the next five
years.
2.4 CAPITAL PROJECTS AND COSTS
The Capital Projects that are needed to meet the increase in demand caused by new development
activity were determined from an internal analysis conducted by the HLP staff. HLP staff identified a
total of nine (9) capital projects that are all or partially related to new development activity. The types
of projects and related costs are summarized in the following Table 2-2.

SECTION 2 IMPACT FEE FACILITIES PLAN
HLP 2015 Impact Fee Study Report 2-4
Table 2-2 General Description and Cost of Projects
Fully or Partially Related to New Development
Description Total Cost
Percent Related to
New Develop.
Cost Assigned to
New Develop.
Partially-related Projects
Reconductor / Rebuild Projects (4) Additional Interconnection Substation (1)
$1,130,000 5,500,000
60% 50%
$678,000 $2,750,000
Fully-related Projects
Additional Circuits and Tie Line (3) Additional Transformer (1)
1,170,000 615,000
100% 100%
1,170,000 615,000
Totals $8,415,000 $5,213,000
All of the above projects are expected to be completed by Year 2019, with expenditures being made
during the period 2015 through 2019, as depicted in the following Table 2-3.
Table 2-3 Schedule of Expenditures
For Projects Related to New Development
Year Annual
Expenditures Percent of
Total Cumulative
Expenditures Percent of
Total
2015 $ 600,000 11.5% $ 600,000 11.5%
2016 1,233,000 23.6% 1,833,000 35.2%
2017 2,662,000 51.1% 4,495,000 86.2%
2018 520,000 10.0% 5,015,000 96.2%
2019 198,000 3.8% $5,213,000 100.0%
Total $5,213,000 100.0%
All of the above-described projects that are fully (100%) related to New Development activity are
expected to be funded fully or partially from the proposed Impact Fees (discussed below).

2.5 CERTIFICATION OF THE IFFP
I certify that the attached Impact Fee Facilities Plan:
1. includes only the costs of public facilities that are:
a. allowed under the Impact Fees Act; and
b. actually incurred; or
SECTION 2 IMPACT FEE FACILITIES PLAN
c. projected to be incurred or encumbered within six years after the day on which each
impact fee is paid;
2. does not include:
a. costs of operation and maintenance of public facilities;
b. costs for qualifying public facilities that will raise the level of service for facilities,
through impact fees, above the level of service that is supported by existing residents;
c. an expense for overhead, unless the expense is calculated pursuant to a methodology
that is consistent with generally accepted cost accounting practices and the
methodological standards set forth by the federal Office of Management and Budget
for federal grant reimbursement; and
3. complies in each and every relevant respect with the Impact Fees Act.
CERTIFIED By' Signature: ~/~~!:t::~U~JL-======:::::".-=--
Name: Jas --~----------------------
Title: General Manager
Date: April 24, 2015
HLP 2015 Impact Fee Study Report 2-5

SECTION 3 IMPACT FEE ANALYSIS
HLP 2015 Impact Fee Study Report 3-1
3.1 GENERAL
As discussed in Section 1, the IFA portion of the Statue requires that each local political subdivision
or private entity intending to impose an impact fee prepare a written analysis of each impact fee. It
also requires that IFA include a summary designed to be understood by a lay person. Additional
requirements include identifying the estimated impacts on existing capacity and system improvements
caused by the anticipated development activity. The political subdivision must also estimate the
proportionate share of (i) the costs of existing capacity that will be recouped and (ii) the costs of the
impacts on system improvements that are reasonably related to the new development activity.
3.2 IMPACT FEE ANALYSIS
The IFA is presented in the attached Exhibit 2 and Exhibit 3. Exhibit 2 shows the Impact Fee projects
(discussed above) by type and the year of construction; the Estimated Total Project Cost (column a);
the Percent Related to New Development (column b) and the Impact Fee Project Costs at Various
Recovery Levels (columns c, d and e). Three (3) distinct Impact Fee recovery levels were modeled –
100 percent, 75 percent and 60 percent. The various recovery levels are designed to allow the HLP
Board to consider the appropriate Impact Fee it wishes to implement, taking into account such things
as economic development goals and the residual effect on electric rates (i.e., the portion of project
costs that are not recovered from Impact Fees will need to be recovered through electric rates). The
60 percent recovery level is based on the HLP staff’s recommendation after considering the social and
competitive aspects of both Impact Fees and electric rates and seeking to achieve an appropriate
balance of the sharing of the subject project costs between ratepayers and new development. The
total Impact Fee project costs to be recovered under the three recovery levels are shown on line 11 of
Exhibit 2. Because of the manner in which one of the projects (i.e., the Additional Interconnection
Substation) will be funded, it was necessary to segregate this project from those that will be funded
directly from Impact Fees (see lines 11-13). It is anticipated that the Additional Interconnection
Substation will be funded from new debt that will be issued by HLP in the near future. Therefore, the
cost of this project to be recovered from Impact Fees (and electric rates) must take into account the
total debt service (i.e., principal and interest) that will ultimately be incurred by HLP over the life of
the bond(s) issued. The total costs for the remainder of the projects to be funded directly from Impact
Fees are shown on line 13. These remaining amounts were adjusted to take into account the current

SECTION 3 IMPACT FEE ANALYSIS
HLP 2015 Impact Fee Study Report 3-2
balance in the Impact Fee Fund (i.e., the unspent Impact Fee revenues associated with previously
completed Impact Fee projects). This credit adjustment produces the net balance of project costs to be
funded directly from Impact Fees (line 15).
The calculation of the proposed Impact Fee at various recovery levels is shown in Exhibit 3. As
discussed above, the analysis is bifurcated between two types of Impact Fee projects: (i) the “Direct
Recovery Projects” (see line 1) to be recovered over a 5-year period; and (ii) the single “Bonded
Project” (see line 2) that will be recovered over a 20-year period. The amounts shown for the Direct
Recovery Projects (column a, lines 4 – 6) were carried over from Exhibit 2. The amounts shown for
the Bonded Project (column b, lines 4-6) were separately calculated to reflect the total debt service on
this project that will incurred in the future (see pages 2 – 4 of Exhibit 3). The debt service
computations are based on the following assumptions:
• The term of the debt issue is 25 years;
• Debt issuance costs are 3.0 percent;
• The annual interest rate is 4.50 percent
The resulting amounts at the three assumed recovery levels are carried over to Exhibit 3, page 1.
Once the total cost under the assumed Impact Fee recovery levels was determined (line 2-4), the three
recovery amounts were then divided by the total Increase in Non-Coincident Peak Demand (line 9) to
determine the Base Impact Fee at the Various Recover Levels (lines 10-12). These amounts were
multiplied times an average customer electric panel utilization factor of 15 percent, which produced
the following Impact Fees (see column c, lines 13-15):
Recovery Impact Level Fee
100% $104.68
75% 75.37
60% 57.80
The 15% panel utilization factor was provided by HLP staff and is consistent with the like factor used
in the 2005 Impact Fee Study prepared for HLP. We believe that this factor is reasonable and
appropriate for the development of the subject Impact Fees.
We should note that all of costs to be recovered through the proposed Impact Fees are directly related
to new development activity; that is, none of the costs of existing facilities are proposed to be

SECTION 3 IMPACT FEE ANALYSIS
HLP 2015 Impact Fee Study Report 3-3
recovered through the new Impact Fees. Those costs will be borne by current and future ratepayers.
In addition, the HLP Board will ultimately decide which Impact Fee it wishes to implement. In
contemplation of their decision, we believe the Board will take into consideration the proportionate
sharing of costs between new development and utility ratepayers, as well as the overall effect on the
economic base of the area HLP serves.
3.3 IMPACT FEE CHARGES – PRESENT AND PROPOSED
A summary of Impact Fee charges for the Residential and Commercial customer classes is provided in
the attached Exhibit 4. The estimated charges, shown by the selected electric panel size, have been
calculated under each of the proposed Impact Fees as compared to the current Impact Fee. The
calculation of the Impact Fee charge, as set forth in HLP Service Rule No. 16, is based on the
following formula:
Main Panel Size (Amps)
X line to line voltage (kVa)
X 1 (1.732 for 3 phase service)
X Applied Impact Fee
= Impact Fee Payable
Charges under the currently effective Impact Fee, shown under column (a) of Exhibit 4, are calculated
using a base fee of $41.40. The worksheet that HLP uses to determine impact fees for new
connections is attached as Appendix C. Charges under each proposed impact fee is shown in columns
(b) through (d) of Exhibit 4. For example, based on an Impact Fee of $57.80 (at a 60% recovery
level), a new residential connection having panel rating of 200 amps would incur the following Impact
Fee charge:
200 x 240 / 1000 x $57.80 = $2,774
Similarly, a 3-phase commercial customer with a 2000 amp panel rating would incur the following
charge when a proposed Impact Fee of $57.80 is used:
2,000 x 208 / 1000 x $57.80 = $41,645
While we are of the opinion that the proposed Impact Fees at the 100 percent recovery level are just
and reasonable based on the analyses undertaken, the HLP Board must ultimately decide what level of
recovery is appropriate given proportionate sharing considerations, current socioeconomic conditions
and circumstances of the HLP service area.

SECTION 3 IMPACT FEE ANALYSIS
HLP 2015 Impact Fee Study Report 3-4
3.4 CERTIFICATION OF THE IFA
I certify that the attached Impact Fee Analysis:
1. includes only the costs of public facilities that are:
a. allowed under the Impact Fees Act; and
b. actually incurred; or
c. projected to be incurred or encumbered within six years after the day on which each
impact fee is paid;
2. does not include:
a. costs of operation and maintenance of public facilities;
b. costs for qualifying public facilities that will raise the level of service for facilities,
through impact fees, above the level of service that is supported by existing residents;
c. an expense for overhead, unless the expense is calculated pursuant to a methodology
that is consistent with generally accepted cost accounting practices and the
methodological standards set forth by the federal Office of Management and Budget
for federal grant reimbursement; and
3. offsets costs with grants or other alternate sources of payment; and
4. complies in each and every relevant respect with the Impact Fees Act.
CERTIFIED BY:
Signature
Name: Robert E. Pender, ASA
Title: President
Company: R. E. Pender, Inc.
Date: April 24, 2013

SUMMARY AND RECOMMENDATIONS
HLP 2015 Impact Fee Study Report 4-1
At the request of HLP, the Consultant has reviewed the HLP IFFP and completed an IFA; both
prepared in accordance with applicable Utah Statutes and collectively referred to as the 2015 Impact
Fee Study. In preparing the subject studies and analyses the Consultant has reached the following
findings and conclusions.
4.1 SUMMARY OF FINDINGS
Impact Fee Facilities Plan
• On a non-coincident peak basis, the demand placed on existing facilities is projected to be
44,531.6 kW in Year 2019 and 50,203.5 in Year 2034 (see Table 2-1). This represents an increase
of 4,665.9 kW during the 5-Year Recovery Period (2015 – 2019) and an increase of 10,337.8
during the 20-Year Recovery Period. The increase in demand over these two periods is entirely
due to new development that HLP will be required to serve.
• In order to meet the increase in demand from new development occurring over the 5-year and 20-
year recovery periods, the Consultant, in collaboration with the HLP staff, has identified nine (9)
projects that will need to be completed by year 2018. The total construction cost of these projects,
to be funded fully or partially through Impact Fee charges, amounts to $5,213 thousand.
Impact Fee Analysis
• The analysis of the proposed Impact Fees is shown in Exhibit 3. Proposed Impact Fees were
designed for two (2) distinct recovery periods (5-year and 20-year) at three (3) optional recovery
levels (100%, 75% and 60%) which will allow the HLP Board to consider the appropriate revenue
contribution levels from new development activity, electric rates and other potential funding
sources.
• The proposed base Impact Fees were calculated using (i) the total construction cost that will be
incurred for new development, segregated between eight (8) Direct Recovery Projects (i.e., to be
recovered directly from Impact Fees over a 5-year period) and one (1) Bonded Project to be
recovered through Impact Fees over a 20-year period. The total cost of the Direct Recovery
Projects was adjusted to reflect the current balance in the Impact Fee Fund. The total cost of the
Bonded Project was adjusted to reflect the financing costs associated with a new debt issue to fund
the project. The total adjusted cost for each category of projects was then divided by the total
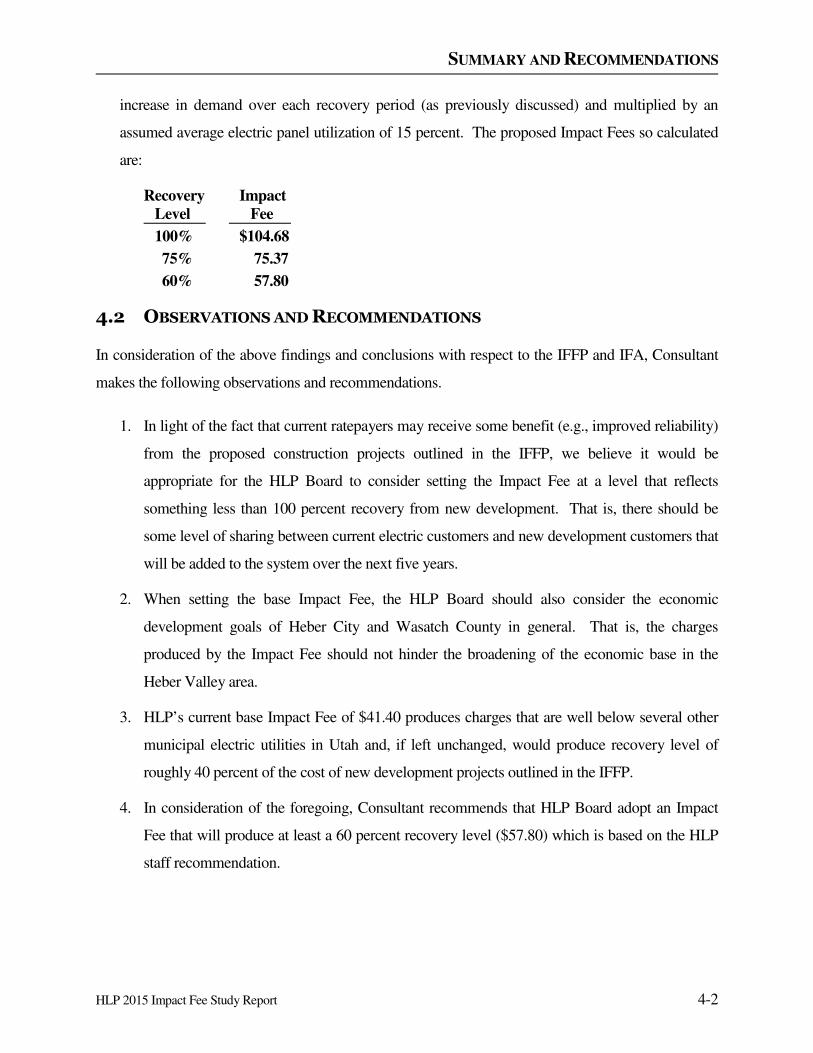
SUMMARY AND RECOMMENDATIONS
HLP 2015 Impact Fee Study Report 4-2
increase in demand over each recovery period (as previously discussed) and multiplied by an
assumed average electric panel utilization of 15 percent. The proposed Impact Fees so calculated
are:
Recovery Impact Level Fee
100% $104.68
75% 75.37
60% 57.80
4.2 OBSERVATIONS AND RECOMMENDATIONS
In consideration of the above findings and conclusions with respect to the IFFP and IFA, Consultant
makes the following observations and recommendations.
1. In light of the fact that current ratepayers may receive some benefit (e.g., improved reliability)
from the proposed construction projects outlined in the IFFP, we believe it would be
appropriate for the HLP Board to consider setting the Impact Fee at a level that reflects
something less than 100 percent recovery from new development. That is, there should be
some level of sharing between current electric customers and new development customers that
will be added to the system over the next five years.
2. When setting the base Impact Fee, the HLP Board should also consider the economic
development goals of Heber City and Wasatch County in general. That is, the charges
produced by the Impact Fee should not hinder the broadening of the economic base in the
Heber Valley area.
3. HLP’s current base Impact Fee of $41.40 produces charges that are well below several other
municipal electric utilities in Utah and, if left unchanged, would produce recovery level of
roughly 40 percent of the cost of new development projects outlined in the IFFP.
4. In consideration of the foregoing, Consultant recommends that HLP Board adopt an Impact
Fee that will produce at least a 60 percent recovery level ($57.80) which is based on the HLP
staff recommendation.

SUMMARY AND RECOMMENDATIONS
HLP 2015 Impact Fee Study Report 4-3
Respectfully Submitted:
R.E. PENDER, INC.
Robert E. Pender, President

APPENDICES

APPENDIX A
UTAH STATUTE U.C.A. 1953 § 11-36A-102

West's Utah Code Annotated CurrentnessTitle 11. Cities, Counties, and Local Taxing Units
Chapter 36A. Impact Fees ActPart 1. General Provisions
§ 11-36a-102. Definitions
As used in this chapter:
(1)(a) “Affected entity” means each county, municipality, local district under Title 17B, Limited Purpose LocalGovernment Entities--Local Districts, special service district under Title 17D, Chapter 1, Special Service Dis-trict Act, school district, interlocal cooperation entity established under Chapter 13, Interlocal Cooperation Act,and specified public utility:
(i) whose services or facilities are likely to require expansion or significant modification because of the fa-cilities proposed in the proposed impact fee facilities plan; or
(ii) that has filed with the local political subdivision or private entity a copy of the general or long-rangeplan of the county, municipality, local district, special service district, school district, interlocal cooperationentity, or specified public utility.
(b) “Affected entity” does not include the local political subdivision or private entity that is required underSection 11-36a-501 to provide notice.
(2) “Charter school” includes:
(a) an operating charter school;
(b) an applicant for a charter school whose application has been approved by a chartering entity as provided inTitle 53A, Chapter 1a, Part 5, The Utah Charter Schools Act; and
(c) an entity that is working on behalf of a charter school or approved charter applicant to develop or constructa charter school building.
(3) “Development activity” means any construction or expansion of a building, structure, or use, any change inuse of a building or structure, or any changes in the use of land that creates additional demand and need for pub-
U.C.A. 1953 § 11-36a-102 Page 1
© 2012 Thomson Reuters. No Claim to Orig. US Gov. Works.
lic facilities.
(4) “Development approval” means:
(a) except as provided in Subsection (4)(b), any written authorization from a local political subdivision thatauthorizes the commencement of development activity;
(b) development activity, for a public entity that may develop without written authorization from a local polit-ical subdivision;
(c) a written authorization from a public water supplier, as defined in Section 73-1-4, or a private water com-pany:
(i) to reserve or provide:
(A) a water right;
(B) a system capacity; or
(C) a distribution facility; or
(ii) to deliver for a development activity:
(A) culinary water; or
(B) irrigation water; or
(d) a written authorization from a sanitary sewer authority, as defined in Section 10-9a-103:
(i) to reserve or provide:
(A) sewer collection capacity; or
(B) treatment capacity; or
(ii) to provide sewer service for a development activity.
U.C.A. 1953 § 11-36a-102 Page 2
© 2012 Thomson Reuters. No Claim to Orig. US Gov. Works.

(5) “Enactment” means:
(a) a municipal ordinance, for a municipality;
(b) a county ordinance, for a county; and
(c) a governing board resolution, for a local district, special service district, or private entity.
(6) “Encumber” means:
(a) a pledge to retire a debt; or
(b) an allocation to a current purchase order or contract.
(7) “Hookup fee” means a fee for the installation and inspection of any pipe, line, meter, or appurtenance to con-nect to a gas, water, sewer, storm water, power, or other utility system of a municipality, county, local district,special service district, or private entity.
(8)(a) “Impact fee” means a payment of money imposed upon new development activity as a condition of devel-opment approval to mitigate the impact of the new development on public infrastructure.
(b) “Impact fee” does not mean a tax, a special assessment, a building permit fee, a hookup fee, a fee forproject improvements, or other reasonable permit or application fee.
(9) “Impact fee analysis” means the written analysis of each impact fee required by Section 11-36a-303.
(10) “Impact fee facilities plan” means the plan required by Section 11-36a-301.
(11)(a) “Local political subdivision” means a county, a municipality, a local district under Title 17B, LimitedPurpose Local Government Entities--Local Districts, or a special service district under Title 17D, Chapter 1,Special Service District Act.
(b) “Local political subdivision” does not mean a school district, whose impact fee activity is governed bySection 53A-20-100. 5.
(12) “Private entity” means an entity with private ownership that provides culinary water that is required to beused as a condition of development.
U.C.A. 1953 § 11-36a-102 Page 3
© 2012 Thomson Reuters. No Claim to Orig. US Gov. Works.

(13)(a) “Project improvements” means site improvements and facilities that are:
(i) planned and designed to provide service for development resulting from a development activity;
(ii) necessary for the use and convenience of the occupants or users of development resulting from a devel-opment activity; and
(iii) not identified or reimbursed as a system improvement.
(b) “Project improvements” does not mean system improvements.
(14) “Proportionate share” means the cost of public facility improvements that are roughly proportionate andreasonably related to the service demands and needs of any development activity.
(15) “Public facilities” means only the following impact fee facilities that have a life expectancy of 10 or moreyears and are owned or operated by or on behalf of a local political subdivision or private entity:
(a) water rights and water supply, treatment, and distribution facilities;
(b) wastewater collection and treatment facilities;
(c) storm water, drainage, and flood control facilities;
(d) municipal power facilities;
(e) roadway facilities;
(f) parks, recreation facilities, open space, and trails;
(g) public safety facilities; or
(h) environmental mitigation as provided in Section 11-36a-205.
(16)(a) “Public safety facility” means:
(i) a building constructed or leased to house police, fire, or other public safety entities; or
U.C.A. 1953 § 11-36a-102 Page 4
© 2012 Thomson Reuters. No Claim to Orig. US Gov. Works.

(ii) a fire suppression vehicle costing in excess of $500,000.
(b) “Public safety facility” does not mean a jail, prison, or other place of involuntary incarceration.
(17)(a) “Roadway facilities” means a street or road that has been designated on an officially adopted subdivisionplat, roadway plan, or general plan of a political subdivision, together with all necessary appurtenances.
(b) “Roadway facilities” includes associated improvements to a federal or state roadway only when the associ-ated improvements:
(i) are necessitated by the new development; and
(ii) are not funded by the state or federal government.
(c) “Roadway facilities” does not mean federal or state roadways.
(18)(a) “Service area” means a geographic area designated by a local political subdivision on the basis of soundplanning or engineering principles in which a defined set of public facilities provides service within the area.
(b) “Service area” may include the entire local political subdivision.
(19) “Specified public agency” means:
(a) the state;
(b) a school district; or
(c) a charter school.
(20)(a) “System improvements” means:
(i) existing public facilities that are:
(A) identified in the impact fee analysis under Section 11-36a-304; and
(B) designed to provide services to service areas within the community at large; and
U.C.A. 1953 § 11-36a-102 Page 5
© 2012 Thomson Reuters. No Claim to Orig. US Gov. Works.

(ii) future public facilities identified in the impact fee analysis under Section 11-36a-304 that are intended toprovide services to service areas within the community at large.
(b) “System improvements” does not mean project improvements.
CREDIT(S)
U.C.A. 1953 § 11-36a-102, UT ST § 11-36a-102
Current through 2011 Third Special Session.
(C) 2012 Thomson Reuters. No Claim to Orig. US Gov. Works.
END OF DOCUMENT
U.C.A. 1953 § 11-36a-102 Page 6
© 2012 Thomson Reuters. No Claim to Orig. US Gov. Works.

West's Utah Code Annotated CurrentnessTitle 11. Cities, Counties, and Local Taxing Units
Chapter 36A. Impact Fees ActPart 3. Establishing an Impact Fee
§ 11-36a-301. Impact fee facilities plan
(1) Before imposing an impact fee, each local political subdivision or private entity shall, except as provided inSubsection (3), prepare an impact fee facilities plan to determine the public facilities required to serve develop-ment resulting from new development activity.
(2) A municipality or county need not prepare a separate impact fee facilities plan if the general plan required bySection 10-9a-401 or 17-27a-401, respectively, contains the elements required by Section 11-36a-302.
(3)(a) A local political subdivision with a population, or serving a population, of less than 5,000 as of the lastfederal census need not comply with the impact fee facilities plan requirements of this part, but shall ensure that:
(i) the impact fees that the local political subdivision imposes are based upon a reasonable plan; and
(ii) each applicable notice required by this chapter is given.
(b) Subsection (3)(a) does not apply to a private entity.
CREDIT(S)
U.C.A. 1953 § 11-36a-301, UT ST § 11-36a-301
Current through 2011 Third Special Session.
(C) 2012 Thomson Reuters. No Claim to Orig. US Gov. Works.
END OF DOCUMENT
U.C.A. 1953 § 11-36a-301 Page 1
© 2012 Thomson Reuters. No Claim to Orig. US Gov. Works.
West's Utah Code Annotated CurrentnessTitle 11. Cities, Counties, and Local Taxing Units
Chapter 36A. Impact Fees ActPart 3. Establishing an Impact Fee
§ 11-36a-302. Impact fee facilities plan requirements--Limitations--School district or charterschool
(1) An impact fee facilities plan shall identify:
(a) demands placed upon existing public facilities by new development activity; and
(b) the proposed means by which the local political subdivision will meet those demands.
(2) In preparing an impact fee facilities plan, each local political subdivision shall generally consider all revenuesources, including impact fees and anticipated dedication of system improvements, to finance the impacts onsystem improvements.
(3) A local political subdivision or private entity may only impose impact fees on development activities whenthe local political subdivision's or private entity's plan for financing system improvements establishes that im-pact fees are necessary to achieve an equitable allocation to the costs borne in the past and to be borne in the fu-ture, in comparison to the benefits already received and yet to be received.
(4)(a) Subject to Subsection (4)(c), the impact fee facilities plan shall include a public facility for which an im-pact fee may be charged or required for a school district or charter school if the local political subdivision isaware of the planned location of the school district facility or charter school:
(i) through the planning process; or
(ii) after receiving a written request from a school district or charter school that the public facility be in-cluded in the impact fee facilities plan.
(b) If necessary, a local political subdivision or private entity shall amend the impact fee facilities plan to re-flect a public facility described in Subsection (4)(a).
(c)(i) In accordance with Subsections 10-9a-305(4) and 17-27a-305(4), a local political subdivision may not
U.C.A. 1953 § 11-36a-302 Page 1
© 2012 Thomson Reuters. No Claim to Orig. US Gov. Works.

require a school district or charter school to participate in the cost of any roadway or sidewalk.
(ii) Notwithstanding Subsection (4)(c)(i), if a school district or charter school agrees to build a roadway orsidewalk, the roadway or sidewalk shall be included in the impact fee facilities plan if the local jurisdictionhas an impact fee facilities plan for roads and sidewalks.
CREDIT(S)
U.C.A. 1953 § 11-36a-302, UT ST § 11-36a-302
Current through 2011 Third Special Session.
(C) 2012 Thomson Reuters. No Claim to Orig. US Gov. Works.
END OF DOCUMENT
U.C.A. 1953 § 11-36a-302 Page 2
© 2012 Thomson Reuters. No Claim to Orig. US Gov. Works.

West's Utah Code Annotated CurrentnessTitle 11. Cities, Counties, and Local Taxing Units
Chapter 36A. Impact Fees ActPart 3. Establishing an Impact Fee
§ 11-36a-303. Impact fee analysis
(1) Subject to the notice requirements of Section 11-36a-504, each local political subdivision or private entityintending to impose an impact fee shall prepare a written analysis of each impact fee.
(2) Each local political subdivision or private entity that prepares an impact fee analysis under Subsection (1)shall also prepare a summary of the impact fee analysis designed to be understood by a lay person.
CREDIT(S)
U.C.A. 1953 § 11-36a-303, UT ST § 11-36a-303
Current through 2011 Third Special Session.
(C) 2012 Thomson Reuters. No Claim to Orig. US Gov. Works.
END OF DOCUMENT
U.C.A. 1953 § 11-36a-303 Page 1
© 2012 Thomson Reuters. No Claim to Orig. US Gov. Works.

West's Utah Code Annotated CurrentnessTitle 11. Cities, Counties, and Local Taxing Units
Chapter 36A. Impact Fees ActPart 3. Establishing an Impact Fee
§ 11-36a-304. Impact fee analysis requirements
(1) An impact fee analysis shall:
(a) identify the anticipated impact on or consumption of any existing capacity of a public facility by the anti-cipated development activity;
(b) identify the anticipated impact on system improvements required by the anticipated development activityto maintain the established level of service for each public facility;
(c) subject to Subsection (2), demonstrate how the anticipated impacts described in Subsections (1)(a) and (b)are reasonably related to the anticipated development activity;
(d) estimate the proportionate share of:
(i) the costs for existing capacity that will be recouped; and
(ii) the costs of impacts on system improvements that are reasonably related to the new development activ-ity; and
(e) based on the requirements of this chapter, identify how the impact fee was calculated.
(2) In analyzing whether or not the proportionate share of the costs of public facilities are reasonably related tothe new development activity, the local political subdivision or private entity, as the case may be, shall identify,if applicable:
(a) the cost of each existing public facility that has excess capacity to serve the anticipated development res-ulting from the new development activity;
(b) the cost of system improvements for each public facility;
U.C.A. 1953 § 11-36a-304 Page 1
© 2012 Thomson Reuters. No Claim to Orig. US Gov. Works.
(c) other than impact fees, the manner of financing for each public facility, such as user charges, special as-sessments, bonded indebtedness, general taxes, or federal grants;
(d) the relative extent to which development activity will contribute to financing the excess capacity of andsystem improvements for each existing public facility, by such means as user charges, special assessments, orpayment from the proceeds of general taxes;
(e) the relative extent to which development activity will contribute to the cost of existing public facilities andsystem improvements in the future;
(f) the extent to which the development activity is entitled to a credit against impact fees because the develop-ment activity will dedicate system improvements or public facilities that will offset the demand for system im-provements, inside or outside the proposed development;
(g) extraordinary costs, if any, in servicing the newly developed properties; and
(h) the time-price differential inherent in fair comparisons of amounts paid at different times.
CREDIT(S)
U.C.A. 1953 § 11-36a-304, UT ST § 11-36a-304
Current through 2011 Third Special Session.
(C) 2012 Thomson Reuters. No Claim to Orig. US Gov. Works.
END OF DOCUMENT
U.C.A. 1953 § 11-36a-304 Page 2
© 2012 Thomson Reuters. No Claim to Orig. US Gov. Works.

West's Utah Code Annotated CurrentnessTitle 11. Cities, Counties, and Local Taxing Units
Chapter 36A. Impact Fees ActPart 3. Establishing an Impact Fee
§ 11-36a-305. Calculating impact fees
(1) In calculating an impact fee, a local political subdivision or private entity may include:
(a) the construction contract price;
(b) the cost of acquiring land, improvements, materials, and fixtures;
(c) the cost for planning, surveying, and engineering fees for services provided for and directly related to theconstruction of the system improvements; and
(d) for a political subdivision, debt service charges, if the political subdivision might use impact fees as a rev-enue stream to pay the principal and interest on bonds, notes, or other obligations issued to finance the costsof the system improvements.
(2) In calculating an impact fee, each local political subdivision or private entity shall base amounts calculatedunder Subsection (1) on realistic estimates, and the assumptions underlying those estimates shall be disclosed inthe impact fee analysis.
CREDIT(S)
U.C.A. 1953 § 11-36a-305, UT ST § 11-36a-305
Current through 2011 Third Special Session.
(C) 2012 Thomson Reuters. No Claim to Orig. US Gov. Works.
END OF DOCUMENT
U.C.A. 1953 § 11-36a-305 Page 1
© 2012 Thomson Reuters. No Claim to Orig. US Gov. Works.

West's Utah Code Annotated CurrentnessTitle 11. Cities, Counties, and Local Taxing Units
Chapter 36A. Impact Fees ActPart 3. Establishing an Impact Fee
§ 11-36a-306. Certification of impact fee analysis
(1) An impact fee facilities plan shall include a written certification from the person or entity that prepares theimpact fee facilities plan that states the following:
“I certify that the attached impact fee facilities plan:
1. includes only the costs of public facilities that are:
a. allowed under the Impact Fees Act; and
b. actually incurred; or
c. projected to be incurred or encumbered within six years after the day on which each impact fee is paid;
2. does not include:
a. costs of operation and maintenance of public facilities;
b. costs for qualifying public facilities that will raise the level of service for the facilities, through impactfees, above the level of service that is supported by existing residents;
c. an expense for overhead, unless the expense is calculated pursuant to a methodology that is consistentwith generally accepted cost accounting practices and the methodological standards set forth by the federalOffice of Management and Budget for federal grant reimbursement; and
3. complies in each and every relevant respect with the Impact Fees Act.”
(2) An impact fee analysis shall include a written certification from the person or entity that prepares the impactfee analysis which states as follows:
U.C.A. 1953 § 11-36a-306 Page 1
© 2012 Thomson Reuters. No Claim to Orig. US Gov. Works.

“I certify that the attached impact fee analysis:
1. includes only the costs of public facilities that are:
a. allowed under the Impact Fees Act; and
b. actually incurred; or
c. projected to be incurred or encumbered within six years after the day on which each impact fee is paid;
2. does not include:
a. costs of operation and maintenance of public facilities;
b. costs for qualifying public facilities that will raise the level of service for the facilities, through impactfees, above the level of service that is supported by existing residents;
c. an expense for overhead, unless the expense is calculated pursuant to a methodology that is consistentwith generally accepted cost accounting practices and the methodological standards set forth by the federalOffice of Management and Budget for federal grant reimbursement;
3. offsets costs with grants or other alternate sources of payment; and
4. complies in each and every relevant respect with the Impact Fees Act.”
CREDIT(S)
U.C.A. 1953 § 11-36a-306, UT ST § 11-36a-306
Current through 2011 Third Special Session.
(C) 2012 Thomson Reuters. No Claim to Orig. US Gov. Works.
END OF DOCUMENT
U.C.A. 1953 § 11-36a-306 Page 2
© 2012 Thomson Reuters. No Claim to Orig. US Gov. Works.

APPENDIX B
IMPACT FEE FACILITIES PLAN
1
Heber Light & Power Company
Impact Fee Facilities Plan
This Impact Fee Facilities Plan is intended to supplement and provide additional support
for the information found Section 2 of the Impact Fee Study Report by R.E. Pender, Inc., dated
April 2015 (“Pender Report”).
A. Background
Heber Light & Power Company is a Utah energy services interlocal entity created by
Heber City, Charleston, and Midway City. The Company provides service to more than 10,700
customers in a service area covering 120 square miles including most of the Heber Valley. The
Company owns and operates hydroelectric generators and thermal generating plants with an
overall generating capacity of 16.5 megawatts.
B. Need for System Improvements to Serve Demand From New Development
As part of its strategic planning process, the Company annually assesses historic growth
in energy sales and projects future anticipated increases in sales. Section 2 of the Pender Report
contains the Company’s projections and the assumptions on which the Company based its
projections.
In assessing what System Improvements are necessary to serve the demand from New
Development, it is important to recognize that HLP operates a single-integrated system which
must be viewed as a whole. It is not appropriate to view any component of the system in
isolation, for assessing the impact of new development on the system’s capacity. Rather, the
issue is whether the system, as a whole, has the capacity to serve the new development at HLP’s
existing level of service, not whether any isolated circuit within the system has the capacity to
serve the new development
HLP’s analysis of the system’s current load and existing capacity shows that HLP cannot
serve projected load growth without increasing the capacity of the system. Stated in other words,
the projected load growth exceeds the capacity of the facilities required to serve the load and thus
would compromise the Company’s current level of service. Therefore the system does not have
excess capacity to serve projected new load growth.
This conclusion is in part based upon the Electrical System Model Update and Analysis
date October 2011 by Intermountain Consumer Professional Engineers, Inc. (“System
Analysis”), attached hereto as Exhibit A and by the load growth projections on which the System
Analysis is based. It is worth noting that, in 2013-14, actual load growth exceeded these

2
projections. The System Analysis shows the additional facility capacity required to serve new
development at the Company’s current level of service. Although the 2011 System Analysis does
not include the analysis for the Second Point of Delivery, the Transmission System Impact Study
(“Transmission Impact Study”) dated April 2014 states the critical need to increase capacity at
the HLP Delivery Point.
The System Analysis and Transmission Impact Study identify the System Improvements
required to increase the system’s capacity to serve the load from projected new growth. These
system improvements include: (1) increasing capacity by installing additional distribution
feeders and tie circuits, (2) installing, upgrading, or reconductoring existing circuits and feeders
(3) installing additional substation breakers, and (4) installing new or upgraded substation
transformers and protective equipment (5) developing and installing all necessary equipment for
a Second Point of Delivery Substation. Examples of these types of System Improvements and
the cost of these System Improvements are summarized in Exhibit B. The Company’s cost
estimates are based on the Company’s standard method of estimating material and labor costs for
its projects. The Company intends to use impact fees to fund a portion of the cost of these types
of System Improvements; however the specific projects may vary depending on (1) the needs of
the system at the time that the funds are available or (2) the portions of the system most impacted
by new development.
C. Revenue Sources to Fund New System Improvements for Load Growth
HLP funds system improvements through (1) electric power revenues, (2) bonds, and (3)
impact fees. Electric power revenues, in part, cover debt service and system improvements.
Impact fees are used strictly to pay for system improvements for new load growth. Developers
ordinarily pay the costs of project specific improvements and do not pay for or provide system-
wide improvements. HLP has received small grants for street light refitting and emergency
planning but grants do not play a role in HLP’s capital plan. HLP does not receive interfund
transfers or loans from its members.
D. New Customers Future Contributions to System Improvements through Rates
The Company has no existing excess capacity to serve new customers and therefore the
revenue from the proposed Impact Fee does not fund excess capacity through existing System
Improvements. As to existing System Improvements funded through debt, new and existing
customers share equally this debt burden through future rates. These System Improvements
benefit all customers because the Company’s system is an integrated system. In addition, the
Company only recovers, through impact fees, a portion of the cost of the System Improvements
for projected future growth. Thus, existing customers as well as new customers pay for a portion
of these improvements for new development through electric rates.

I certify that the attached impact fee facilities plan:
1. Includes only the costs of public facilities that are:
a. allowed under the Impact Fees Act; and
b. actually incurred; or
c. projected to be incurred or encumbered within six years after the day on which each impact fee is paid;
2. Does not include:
3.
a. costs of operation and maintenance of public facilities;
b. costs for qualifying public facilities that will raise the level of service for the facilities, through impact fees, above the level of service that is
supported by existing residents;
c. an expense for overhead, unless the expense is calculated pursuant to a
methodology that is consistent with generally accepted cost accounting practices and the methodological standards set forth by the federal Office of Management and Budget for federal grant reimbursement; and
General Manager Heber Light & Power
3


4
Exhibit B
Impact Fee Projected Cost ($1,000)
Upcoming Projects Related % Start Finish Total Impact Fee
Distribution
Distribution Capacitors / VAR Control 0% 2015 2018 $80 $0
CL 401 Rebuild (Charleston Reconductor) 60% 2015 2018 $450 $270
Additional Circuits out of Jailhouse to the East 100% 2015 2018 $560 $560
Underground System Improvements 0% 2015 2019 $194 $0
Tie from 702 up to 500 East in Heber (HB304) 100% 2016 2016 $250 $250
Heber Sub to Cloyes Sub Distribution Rebuild 60% 2016 2017 $350 $210
North Distribution Line Rebuild (RMP Partnership - Phase 2) 0% 2016 2017 $1,240 $0
Heber Substation 2 Additional Circuits (South & West) 100% 2016 2018 $360 $360
Reconductor Center Street to 1200 South 60% 2019 2019 $150 $90
Reconductor Pine Canyon Road - Midway 60% 2019 2019 $180 $108
Substation
Gas Plant 2 Transformer Replacement 0% 2014 2015 $223 $0
Replacement Recloser for Joslyn Reclosers 0% 2015 2015 $25 $0
Heber Substation 2nd Transformer 100% 2015 2016 $615 $615
2nd Point of Interconnect Substation 50% 2015 2017 $5,500 $2,750
Midway Substation - High Side Rebuild 0% 2018 2018 $500 $0
Cloyes LTC Rebuild 0% 2019 2019 $40 $0
Generation
Lower Snake Creek Plant Upgrade 0% 2015 2016 $240 $0
Annual Generation Capital Improvements 0% 2015 2019 $271 $0
Unit Overhauls 0% 2015 2019 $556 $0
New Generator (3-6 MW) 0% 2019 2020 $9,000 $0
Systems & Technology
Annual Systems and Technology Upgrade 0% 2015 2019 $322 $0
Tools & Equipment
Annual Tool & Equipment Purchases 0% 2015 2019 $225 $0
Vehicle
Annual Vehicle Program 0% 2015 2019 $750 $0
Buildings
Operations Asphalt / Curb Improvements 0% 2015 2015 $103 $0
Generator Fire Suppression System 0% 2015 2015 $107 $0
Training Room Furniture 0% 2015 2015 $32 $0
Land Swap Residual Purchase 0% 2015 2015 $145 $0
New Office Building 0% 2018 2018 $1,000 $0
$23,388 $5,213
Project Duration
APPENDIX C
2006 IMPACT FEE CALCULATION
WORKSHEET (READOPTED BY THE HLP BOARD
ON SEPTEMBER 25, 2013)
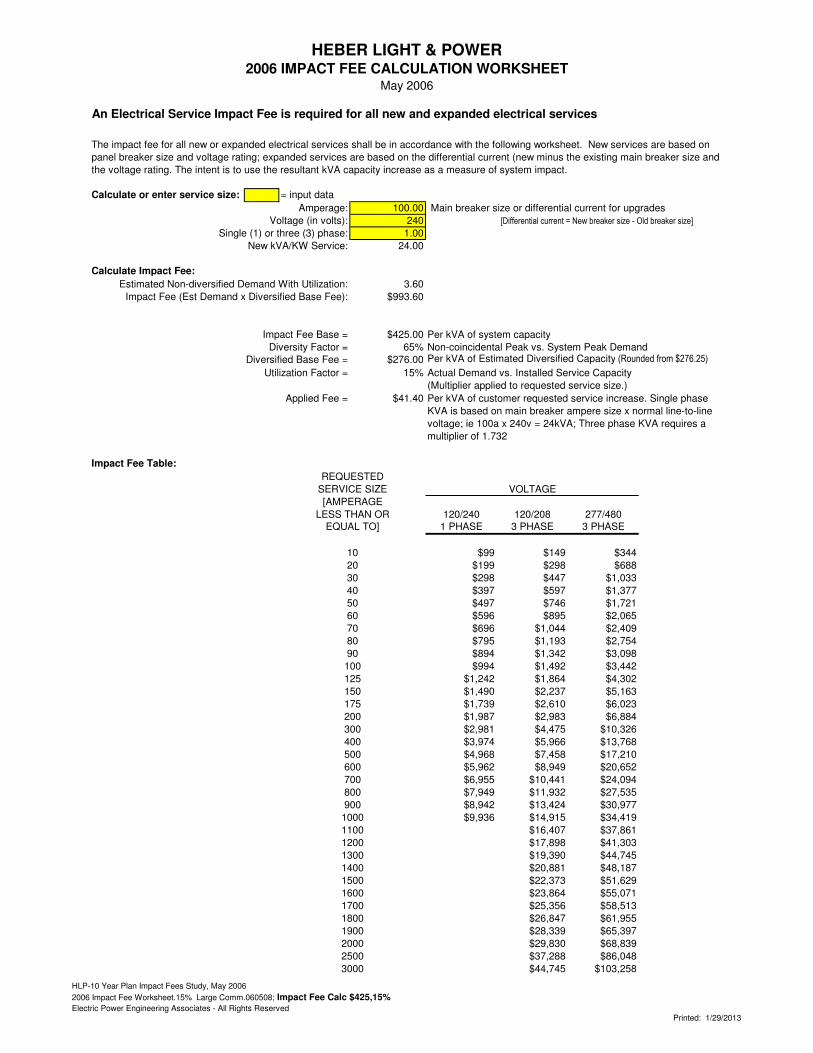
An Electrical Service Impact Fee is required for all new and expanded electrical services
Calculate or enter service size: = input data
Amperage: 100.00 Main breaker size or differential current for upgrades
Voltage (in volts): 240 [Differential current = New breaker size - Old breaker size]
Single (1) or three (3) phase: 1.00
New kVA/KW Service: 24.00
Calculate Impact Fee:
Estimated Non-diversified Demand With Utilization: 3.60
Impact Fee (Est Demand x Diversified Base Fee): $993.60
Impact Fee Base = $425.00 Per kVA of system capacity
Diversity Factor = 65% Non-coincidental Peak vs. System Peak Demand
Diversified Base Fee = $276.00 Per kVA of Estimated Diversified Capacity (Rounded from $276.25)
Utilization Factor = 15% Actual Demand vs. Installed Service Capacity
(Multiplier applied to requested service size.)
Applied Fee = $41.40
Impact Fee Table:
120/240 120/208 277/4801 PHASE 3 PHASE 3 PHASE
$99 $149 $344
$199 $298 $688
$298 $447 $1,033
$397 $597 $1,377
$497 $746 $1,721
$596 $895 $2,065
$696 $1,044 $2,409
$795 $1,193 $2,754
$894 $1,342 $3,098
$994 $1,492 $3,442
$1,242 $1,864 $4,302
$1,490 $2,237 $5,163
$1,739 $2,610 $6,023
$1,987 $2,983 $6,884
$2,981 $4,475 $10,326
$3,974 $5,966 $13,768
$4,968 $7,458 $17,210
$5,962 $8,949 $20,652
$6,955 $10,441 $24,094
$7,949 $11,932 $27,535
$8,942 $13,424 $30,977
$9,936 $14,915 $34,419
$16,407 $37,861
$17,898 $41,303
$19,390 $44,745
$20,881 $48,187
$22,373 $51,629
$23,864 $55,071
$25,356 $58,513
$26,847 $61,955
$28,339 $65,397
$29,830 $68,839
$37,288 $86,048
$44,745 $103,258
2000
2500
3000
VOLTAGE
1600
1700
1800
1900
1200
1300
1400
1500
800
900
1000
1100
700
EQUAL TO]
500
600
70
80
90
175
50
60
200
300
400
REQUESTED
SERVICE SIZE
[AMPERAGE
100
125
150
10
20
30
40
HEBER LIGHT & POWER
LESS THAN OR
Per kVA of customer requested service increase. Single phase
KVA is based on main breaker ampere size x normal line-to-line
voltage; ie 100a x 240v = 24kVA; Three phase KVA requires a
multiplier of 1.732
2006 IMPACT FEE CALCULATION WORKSHEETMay 2006
The impact fee for all new or expanded electrical services shall be in accordance with the following worksheet. New services are based on
panel breaker size and voltage rating; expanded services are based on the differential current (new minus the existing main breaker size and
the voltage rating. The intent is to use the resultant kVA capacity increase as a measure of system impact.
HLP-10 Year Plan Impact Fees Study, May 2006
2006 Impact Fee Worksheet.15% Large Comm.060508; Impact Fee Calc $425,15%Electric Power Engineering Associates - All Rights Reserved
Printed: 1/29/2013

EXHIBITS

EXHIBIT 1
ANALYSIS OF FORECASTED
CUSTOMER & LOAD DATA

Exhibit 1
Page 1 of 5
Annual
Line Actual Forecast Increase Forecast Increase Growth %
No. 2014 2019 2014-19 2034 2014-34 2014-34
(a) (b) (c) (d) (e) (f)
1 Coincident Peak Demand kW 35,573.0 39,275.0 3,702.0 51,599.5 16,026.5 1.88%
2 System Energy MWh 165,003.2 182,176.8 17,173.7 239,347.1 74,343.9 1.88%
3 System Load Factor % 53.0% 53.0% 53.0%
Non-Coincident Peak Demand
4 At Meter kW 39,865.7 44,531.6 4,665.9 58,711.4 18,845.7 1.95%
5 At Input to Distribution System kW 42,720.2 47,275.9 4,555.7 62,410.0 19,689.7 1.91%
6 System Coincidence Factor % 83.3% 83.1% 82.7%
7 Number of Customers (Avg.) # 10,713 12,004 1,291.0 15,919 5,206 2.00%
Note: Amounts shown include load associated with security lighting.
Description
Analysis of Forecasted Customer and Load DataSummary
2015 Impact Fee AnalysisHeber Light & Power
2015_Impact Fee Analysis_Final (4-9-15) 4/15/2015 eA XA cxÇwxÜ? \ÇvA

EXHIBIT 1
Page 2 of 5
Heber Light & Power
2015 Impact Fee Study
Analysis of Forecasted Customer & Load Data
Line Actual 1 2 3 4 5 6 7 8 9 10 11
No. Description 2014 2015 2016 2017 2018 2019 2020 2021 2022 2023 2024 2025
1 System Coincident Peak Demand [1] kW 35,573.0 36,284.0 37,010.0 37,750.0 38,505.0 39,275.0 40,060.0 40,862.0 41,679.0 42,512.0 43,363.0 44,230.0
2 Total System Load (Input to Distribution System) [1]MWh 165,003.2 168,303.2 171,669.3 175,102.7 178,604.7 182,176.8 185,820.4 189,536.8 193,327.5 197,194.1 201,137.9 205,160.7
3 System Load Factor % 53.0% 53.0% 53.0% 53.0% 53.0% 53.0% 53.0% 53.0% 53.0% 53.0% 53.0% 53.0%
Energy Sales at Meter [2]
4 Residential MWh 80,631.8 82,539.8 84,517.2 86,494.6 88,472.0 90,449.5 92,426.9 94,404.3 96,381.7 98,359.1 100,336.5 102,314.0
5 Commecial MWh 69,889.0 71,321.8 72,913.8 74,505.8 76,097.8 77,689.8 79,281.8 80,873.8 82,465.9 84,057.9 85,649.9 87,241.9
6 Yard / Security Lights MWh 43.4 43.4 44.7 46.0 47.3 48.7 50.0 51.3 52.6 53.9 55.2 56.6
7 Total MWh 150,564.2 153,905.0 157,475.7 161,046.5 164,617.2 168,188.0 171,758.7 175,329.4 178,900.2 182,470.9 186,041.6 189,612.4
Other Energy Usage
8 Donated Street Lights MWh 962.5 962.5 962.5 962.5 962.5 962.5 962.5 962.5 962.5 962.5 962.5 962.5
9 CUWCD MWh 2,451.1 2,451.1 2,451.1 2,451.1 2,451.1 2,451.1 2,451.1 2,451.1 2,451.1 2,451.1 2,451.1 2,451.1
10 Total MWh 3,413.6 3,413.6 3,413.6 3,413.6 3,413.6 3,413.6 3,413.6 3,413.6 3,413.6 3,413.6 3,413.6 3,413.6
11 Total Energy Consumption MWh 153,977.8 157,318.6 160,889.4 164,460.1 168,030.8 171,601.6 175,172.3 178,743.0 182,313.8 185,884.5 189,455.2 193,026.0
12 System Energy Loss Factor % 6.68% 6.53% 6.28% 6.08% 5.92% 5.80% 5.73% 5.69% 5.70% 5.74% 5.81% 5.91%
Estimated Average No. of Customers [3]
13 Residential # 9,297 9,517 9,745 9,973 10,201 10,429 10,657 10,885 11,113 11,341 11,569 11,797
14 Commecial # 1,317 1,344 1,374 1,404 1,434 1,464 1,494 1,524 1,554 1,584 1,614 1,644
15 Yard / Security Lights # 99 99 102 105 108 111 114 117 120 123 126 129
16 Total # 10,713 10,960 11,221 11,482 11,743 12,004 12,265 12,526 12,787 13,048 13,309 13,570
Average Annual Usage Per Customer
17 Residential kWh/Cust. 8,672.9 8,672.9 8,672.9 8,672.9 8,672.9 8,672.9 8,672.9 8,672.9 8,672.9 8,672.9 8,672.9 8,672.9
18 Commecial kWh/Cust. 53,066.8 53,066.8 53,066.8 53,066.8 53,066.8 53,066.8 53,066.8 53,066.8 53,066.8 53,066.8 53,066.8 53,066.8
19 Yard / Security Lights kWh/Cust. 438.4 438.4 438.4 438.4 438.4 438.4 438.4 438.4 438.4 438.4 438.4 438.4
20 Total kWh/Cust. 14,054.3 14,042.4 14,034.0 14,026.0 14,018.3 14,011.0 14,004.0 13,997.2 13,990.8 13,984.6 13,978.6 13,972.9
Estimated NCP Demand at Meter
21 Residential kW 21,306.8 21,811.0 22,333.5 22,856.1 23,378.6 23,901.1 24,423.6 24,946.2 25,468.7 25,991.2 26,513.8 27,036.3
22 Commecial kW 18,553.9 18,934.3 19,357.0 19,779.6 20,202.2 20,624.9 21,047.5 21,470.2 21,892.8 22,315.5 22,738.1 23,160.7
23 Street Lights kW 5.0 5.0 5.1 5.3 5.4 5.6 5.7 5.9 6.0 6.2 6.3 6.5
24 Total kW 39,865.7 40,750.3 41,695.6 42,640.9 43,586.2 44,531.6 45,476.9 46,422.2 47,367.5 48,312.8 49,258.2 50,203.5
25 System Coincidence Factor % 83.3% 83.2% 83.2% 83.1% 83.1% 83.1% 83.0% 83.0% 83.0% 82.9% 82.9% 82.9%
Average NCP Per Customer [4]
26 Residential kW/Cust. 2.3 2.3 2.3 2.3 2.3 2.3 2.3 2.3 2.3 2.3 2.3 2.3
27 Commecial kW/Cust. 14.1 14.1 14.1 14.1 14.1 14.1 14.1 14.1 14.1 14.1 14.1 14.1
28 Street Lights kW/Cust. 0.1 0.1 0.1 0.1 0.1 0.1 0.1 0.1 0.1 0.1 0.1 0.1
29 Total kW/Cust. 3.7 3.7 3.7 3.7 3.7 3.7 3.7 3.7 3.7 3.7 3.7 3.7
Forecast Period
2015_Impact Fee Analysis_Final (4-9-15) 2
eA XA cxÇwxÜ? \ÇvA
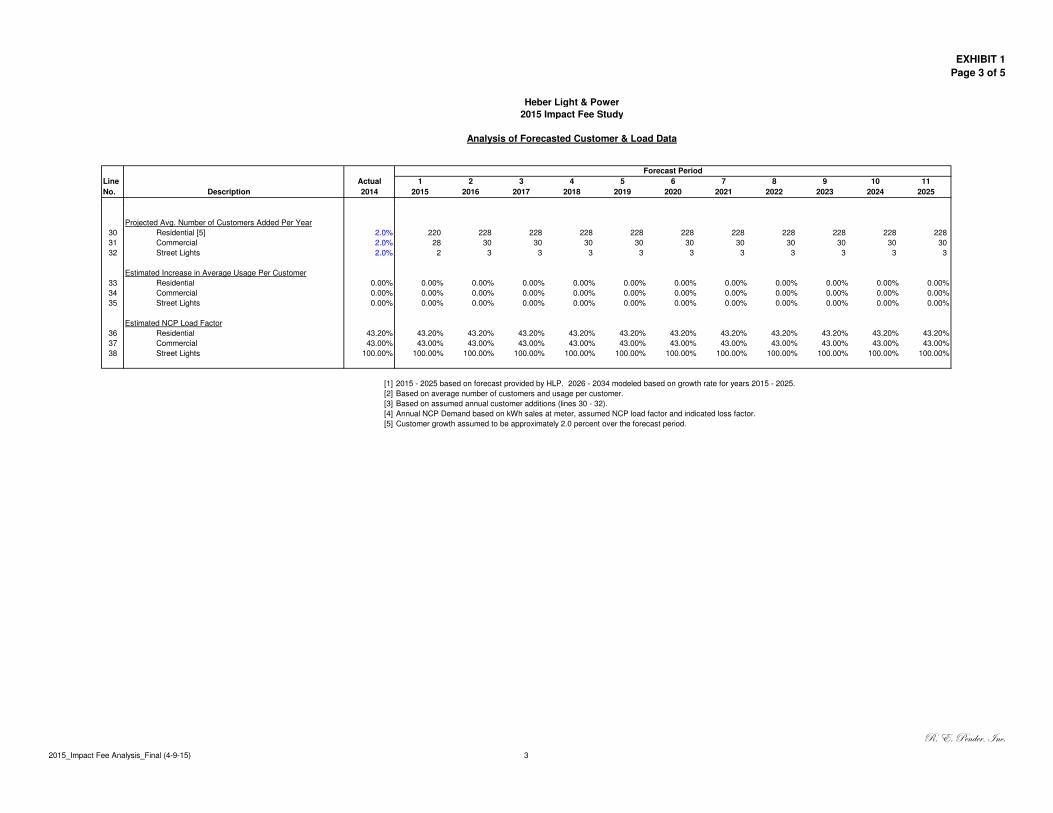
EXHIBIT 1
Page 3 of 5
Heber Light & Power
2015 Impact Fee Study
Analysis of Forecasted Customer & Load Data
Line Actual 1 2 3 4 5 6 7 8 9 10 11
No. Description 2014 2015 2016 2017 2018 2019 2020 2021 2022 2023 2024 2025
Forecast Period
Projected Avg. Number of Customers Added Per Year
30 Residential [5] 2.0% 220 228 228 228 228 228 228 228 228 228 228
31 Commercial 2.0% 28 30 30 30 30 30 30 30 30 30 30
32 Street Lights 2.0% 2 3 3 3 3 3 3 3 3 3 3
Estimated Increase in Average Usage Per Customer
33 Residential 0.00% 0.00% 0.00% 0.00% 0.00% 0.00% 0.00% 0.00% 0.00% 0.00% 0.00% 0.00%
34 Commercial 0.00% 0.00% 0.00% 0.00% 0.00% 0.00% 0.00% 0.00% 0.00% 0.00% 0.00% 0.00%
35 Street Lights 0.00% 0.00% 0.00% 0.00% 0.00% 0.00% 0.00% 0.00% 0.00% 0.00% 0.00% 0.00%
Estimated NCP Load Factor
36 Residential 43.20% 43.20% 43.20% 43.20% 43.20% 43.20% 43.20% 43.20% 43.20% 43.20% 43.20% 43.20%
37 Commercial 43.00% 43.00% 43.00% 43.00% 43.00% 43.00% 43.00% 43.00% 43.00% 43.00% 43.00% 43.00%
38 Street Lights 100.00% 100.00% 100.00% 100.00% 100.00% 100.00% 100.00% 100.00% 100.00% 100.00% 100.00% 100.00%
[1] 2015 - 2025 based on forecast provided by HLP. 2026 - 2034 modeled based on growth rate for years 2015 - 2025.
[2] Based on average number of customers and usage per customer.
[3] Based on assumed annual customer additions (lines 30 - 32).
[4] Annual NCP Demand based on kWh sales at meter, assumed NCP load factor and indicated loss factor.
[5] Customer growth assumed to be approximately 2.0 percent over the forecast period.
2015_Impact Fee Analysis_Final (4-9-15) 3
eA XA cxÇwxÜ? \ÇvA

EXHIBIT 1
Page 4 of 5
Line
No. Description
1 System Coincident Peak Demand [1] kW
2 Total System Load (Input to Distribution System) [1]MWh
3 System Load Factor %
Energy Sales at Meter [2]
4 Residential MWh
5 Commecial MWh
6 Yard / Security Lights MWh
7 Total MWh
Other Energy Usage
8 Donated Street Lights MWh
9 CUWCD MWh
10 Total MWh
11 Total Energy Consumption MWh
12 System Energy Loss Factor %
Estimated Average No. of Customers [3]
13 Residential #
14 Commecial #
15 Yard / Security Lights #
16 Total #
Average Annual Usage Per Customer
17 Residential kWh/Cust.
18 Commecial kWh/Cust.
19 Yard / Security Lights kWh/Cust.
20 Total kWh/Cust.
Estimated NCP Demand at Meter
21 Residential kW
22 Commecial kW
23 Street Lights kW
24 Total kW
25 System Coincidence Factor %
Average NCP Per Customer [4]
26 Residential kW/Cust.
27 Commecial kW/Cust.
28 Street Lights kW/Cust.
29 Total kW/Cust.
Heber Light & Power
2015 Impact Fee Study
Analysis of Forecasted Customer & Load Data
2014-34
12 13 14 15 16 17 18 19 20 Growth
2026 2027 2028 2029 2030 2031 2032 2033 2034 Rate
45,053.2 45,871.5 46,689.8 47,508.1 48,326.4 49,144.7 49,963.0 50,781.2 51,599.5 1.88%
208,981.7 212,777.3 216,573.0 220,368.7 224,164.4 227,960.1 231,755.7 235,551.4 239,347.1 1.88%
53.0% 53.0% 53.0% 53.0% 53.0% 53.0% 53.0% 53.0% 53.0%
104,291.4 106,268.8 108,246.2 110,223.6 112,201.0 114,178.5 116,155.9 118,133.3 120,110.7 2.01%
88,833.9 90,425.9 92,017.9 93,609.9 95,201.9 96,793.9 98,385.9 99,977.9 101,569.9 1.89%
57.9 59.2 60.5 61.8 63.1 64.4 65.8 67.1 68.4 2.30%
193,183.1 196,753.8 200,324.6 203,895.3 207,466.1 211,036.8 214,607.5 218,178.3 221,749.0 1.95%
962.5 962.5 962.5 962.5 962.5 962.5 962.5 962.5 962.5 0.00%
2,451.1 2,451.1 2,451.1 2,451.1 2,451.1 2,451.1 2,451.1 2,451.1 2,451.1 0.00%
3,413.6 3,413.6 3,413.6 3,413.6 3,413.6 3,413.6 3,413.6 3,413.6 3,413.6 0.00%
196,596.7 200,167.5 203,738.2 207,308.9 210,879.7 214,450.4 218,021.1 221,591.9 225,162.6 1.92%
5.93% 5.93% 5.93% 5.93% 5.93% 5.93% 5.93% 5.93% 5.93%
12,025 12,253 12,481 12,709 12,937 13,165 13,393 13,621 13,849 2.01%
1,674 1,704 1,734 1,764 1,794 1,824 1,854 1,884 1,914 1.89%
132 135 138 141 144 147 150 153 156 2.30%
13,831 14,092 14,353 14,614 14,875 15,136 15,397 15,658 15,919 2.00%
8,672.9 8,672.9 8,672.9 8,672.9 8,672.9 8,672.9 8,672.9 8,672.9 8,672.9 0.00%
53,066.8 53,066.8 53,066.8 53,066.8 53,066.8 53,066.8 53,066.8 53,066.8 53,066.8 0.00%
438.4 438.4 438.4 438.4 438.4 438.4 438.4 438.4 438.4 0.00%
13,967.4 13,962.1 13,957.0 13,952.1 13,947.3 13,942.7 13,938.3 13,934.0 13,929.8 -0.04%
27,558.8 28,081.3 28,603.9 29,126.4 29,648.9 30,171.5 30,694.0 31,216.5 31,739.0 2.01%
23,583.4 24,006.0 24,428.7 24,851.3 25,273.9 25,696.6 26,119.2 26,541.9 26,964.5 1.89%
6.6 6.8 6.9 7.1 7.2 7.4 7.5 7.7 7.8 2.30%
51,148.8 52,094.1 53,039.4 53,984.8 54,930.1 55,875.4 56,820.7 57,766.0 58,711.4 1.95%
82.9% 82.8% 82.8% 82.8% 82.8% 82.7% 82.7% 82.7% 82.7%
2.3 2.3 2.3 2.3 2.3 2.3 2.3 2.3 2.3
14.1 14.1 14.1 14.1 14.1 14.1 14.1 14.1 14.1
0.1 0.1 0.1 0.1 0.1 0.1 0.1 0.1 0.1
3.7 3.7 3.7 3.7 3.7 3.7 3.7 3.7 3.7
Forecast Period
2015_Impact Fee Analysis_Final (4-9-15) 4
eA XA cxÇwxÜ? \ÇvA

EXHIBIT 1
Page 5 of 5
Line
No. Description
Projected Avg. Number of Customers Added Per Year
30 Residential [5]
31 Commercial
32 Street Lights
Estimated Increase in Average Usage Per Customer
33 Residential
34 Commercial
35 Street Lights
Estimated NCP Load Factor
36 Residential
37 Commercial
38 Street Lights
Heber Light & Power
2015 Impact Fee Study
Analysis of Forecasted Customer & Load Data
2014-34
12 13 14 15 16 17 18 19 20 Growth
2026 2027 2028 2029 2030 2031 2032 2033 2034 Rate
Forecast Period
228 228 228 228 228 228 228 228 228
30 30 30 30 30 30 30 30 30
3 3 3 3 3 3 3 3 3
0.00% 0.00% 0.00% 0.00% 0.00% 0.00% 0.00% 0.00% 0.00%
0.00% 0.00% 0.00% 0.00% 0.00% 0.00% 0.00% 0.00% 0.00%
0.00% 0.00% 0.00% 0.00% 0.00% 0.00% 0.00% 0.00% 0.00%
43.20% 43.20% 43.20% 43.20% 43.20% 43.20% 43.20% 43.20% 43.20%
43.00% 43.00% 43.00% 43.00% 43.00% 43.00% 43.00% 43.00% 43.00%
100.00% 100.00% 100.00% 100.00% 100.00% 100.00% 100.00% 100.00% 100.00%
2015_Impact Fee Analysis_Final (4-9-15) 5
eA XA cxÇwxÜ? \ÇvA

EXHIBIT 2
IMPACT FEE PROJECTS AND COSTS
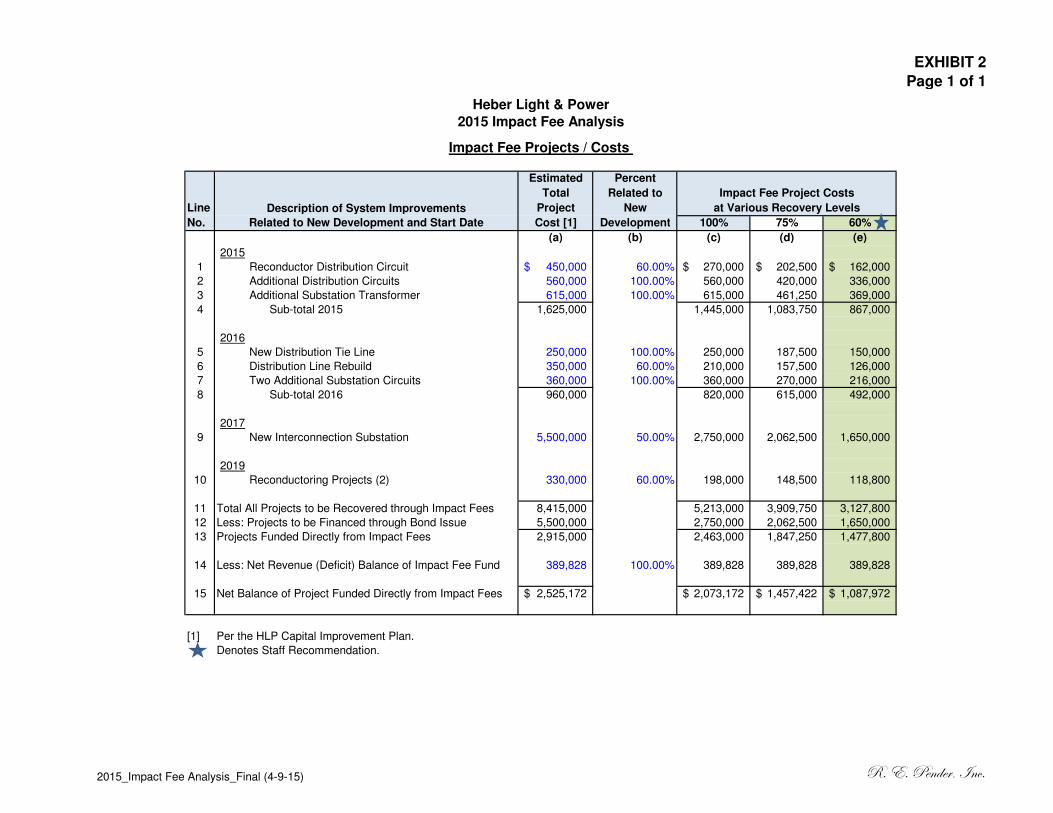
EXHIBIT 2
Page 1 of 1
Estimated Percent
Total Related to
Line Project New
No. Cost [1] Development 100% 75% 60%
(a) (b) (c) (d) (e)
2015
1 Reconductor Distribution Circuit 450,000$ 60.00% 270,000$ 202,500$ 162,000$
2 Additional Distribution Circuits 560,000 100.00% 560,000 420,000 336,000
3 Additional Substation Transformer 615,000 100.00% 615,000 461,250 369,000
4 Sub-total 2015 1,625,000 1,445,000 1,083,750 867,000
2016
5 New Distribution Tie Line 250,000 100.00% 250,000 187,500 150,000
6 Distribution Line Rebuild 350,000 60.00% 210,000 157,500 126,000
7 Two Additional Substation Circuits 360,000 100.00% 360,000 270,000 216,000
8 Sub-total 2016 960,000 820,000 615,000 492,000
2017
9 New Interconnection Substation 5,500,000 50.00% 2,750,000 2,062,500 1,650,000
2019
10 Reconductoring Projects (2) 330,000 60.00% 198,000 148,500 118,800
11 Total All Projects to be Recovered through Impact Fees 8,415,000 5,213,000 3,909,750 3,127,800
12 Less: Projects to be Financed through Bond Issue 5,500,000 2,750,000 2,062,500 1,650,000
13 Projects Funded Directly from Impact Fees 2,915,000 2,463,000 1,847,250 1,477,800
14 Less: Net Revenue (Deficit) Balance of Impact Fee Fund 389,828 100.00% 389,828 389,828 389,828
15 Net Balance of Project Funded Directly from Impact Fees 2,525,172$ 2,073,172$ 1,457,422$ 1,087,972$
[1] Per the HLP Capital Improvement Plan.
Denotes Staff Recommendation.
Heber Light & Power
2015 Impact Fee Analysis
Impact Fee Projects / Costs
Impact Fee Project Costs
at Various Recovery LevelsDescription of System Improvements
Related to New Development and Start Date
2015_Impact Fee Analysis_Final (4-9-15) eA XA cxÇwxÜ? \ÇvA

EXHIBIT 3
CALCULATION OF PROPOSED
BASE IMPACT FEE

Exhibit 3
Page 1 of 4
5-year 20-Year
Recovery Recovery
Line Period Period
No. 2015-2019 2015-2034 Totals
(a) (b) (c)
Growth-related Project Cost [1]
1 Direct Recovery Projects $ 2,073,172 - 2,073,172
2 Bonded Projects [2] $ - 4,776,369 4,776,369
3 Total $ 2,073,172 4,776,369 6,849,541
Assumed Impact Fee Recovery Levels
4 100% $ 2,073,172 4,776,369 6,849,541
5 75% $ 1,457,422 3,581,012 5,038,434
6 60% $ 1,087,972 2,866,159 3,954,130
Increase in NCP Demand at Meter [3]
7 Residential kW 2,594.3 10,432.2
8 Commecial kW 2,070.9 8,410.6
9 Total kW 4,665.3 18,842.8
Base Impact Fee at Various Recovery Levels
10 100% $/kW 444.39 253.49 697.87
11 75% $/kW 312.40 190.05 502.45
12 60% $/kW 233.21 152.11 385.32
Impact Fee at 15% Panel Utilization [4]
13 100% $/kVA 66.66 38.02 104.68
14 75% $/kVA 46.86 28.51 75.37
15 60% (Staff Recommendation) $/kVA 34.98 22.82 57.80
[1] Based on HLP's Five-Year Major Project Forecast for System Improvements.
[2] Bonded Projects (i.e., 2nd interconnection with RMP) assumed to be financed with 25-year bond
issue -- see attached analyses.
[3] See attached Analysis of Forecasted Load and Customer Data.
[4] Utilization factor based on 2005 Impact Fee Study.
Description
Heber Light & Power
2015 Impact Fee Study
Impact Fee Cost Analysis
(Includes Bonded Projects)
2015_Impact Fee Analysis_Final (4-9-15) eA XA cxÇwxÜ? \ÇvA

EXHIBIT 3
Page 2 of 4
1 Total Project Costs (Impact Fee Portion) 2,750,000$
2 Add: Debt Issuance Costs (3.0%) 82,500
3 Total Debt Issue 2,832,500
4 Recovery Level 100%
5 Total Principal Recovery 2,832,500$
6 Principal 2,833,000$
7 Term 25
8 Interest Rate 4.50%
1 2 3 4 5 6 7 8 9 10
Debt Service - Years 1-10
9 Interest Payment 1,129,389$ 127,485$ 124,624$ 121,635$ 118,511$ 115,247$ 111,835$ 108,270$ 104,545$ 100,652$ 96,584$
10 Principal Payment 781,159 63,570 66,430 69,420 72,544 75,808 79,219 82,784 86,510 90,403 94,471
11 Total 1,910,548$ 191,055$ 191,055$ 191,055$ 191,055$ 191,055$ 191,055$ 191,055$ 191,055$ 191,055$ 191,055$
11 12 13 14 15 16 17 18 19 20
Debt Service - Years 11-20
12 Interest Payment 697,432$ 92,333$ 87,890$ 83,248$ 78,397$ 73,327$ 68,029$ 62,493$ 56,708$ 50,662$ 44,345$
13 Principal Payment 1,213,115 98,722 103,164 107,807 112,658 117,728 123,025 128,562 134,347 140,392 146,710
14 Total 1,910,548$ 191,055$ 191,055$ 191,055$ 191,055$ 191,055$ 191,055$ 191,055$ 191,055$ 191,055$ 191,055$
21 22 23 24 25
Debt Service - Years 21-25
15 Interest Payment 116,548$ 37,743$ 30,844$ 23,634$ 16,100$ 8,227$
16 Principal Payment 838,726 153,312 160,211 167,421 174,955 182,828
17 Total 955,274$ 191,055$ 191,055$ 191,055$ 191,055$ 191,055$
Total Debt Service
18 Interest Payment 1,943,369$
19 Principal Payment 2,833,000
20 Total 4,776,369$
Heber Light & Power
2015 Impact Fee Analysis
Impact Fee Projects / Costs
Estimated Debt Service Requirements
100% Recovery
2015_Impact Fee Analysis_Final (4-9-15) eA XA cxÇwxÜ? \ÇvA

EXHIBIT 3
Page 3 of 4
Heber Light & Power
2015 Impact Fee Analysis
Impact Fee Projects / Costs
Estimated Debt Service Requirements
1 Total Project Costs (Impact Fee Portion) 2,750,000$
2 Add: Debt Issuance Costs (3.0%) 82,500
3 Total Debt Issue 2,832,500
4 Recovery Level 75%
5 Total Principal Recovery 2,124,375$
6 Principal 2,124,000$
7 Term 25
8 Interest Rate 4.50%
1 2 3 4 5 6 7 8 9 10
Debt Service - Years 1-10
9 Interest Payment 846,743$ 95,580$ 93,435$ 91,194$ 88,852$ 86,404$ 83,847$ 81,174$ 78,381$ 75,462$ 72,412$
10 Principal Payment 585,662 47,660 49,805 52,046 54,389 56,836 59,394 62,066 64,859 67,778 70,828
11 Total 1,432,405$ 143,240$ 143,240$ 143,240$ 143,240$ 143,240$ 143,240$ 143,240$ 143,240$ 143,240$ 143,240$
11 12 13 14 15 16 17 18 19 20
Debt Service - Years 11-20
12 Interest Payment 522,890$ 69,225$ 65,895$ 62,414$ 58,777$ 54,976$ 51,004$ 46,853$ 42,516$ 37,983$ 33,247$
13 Principal Payment 909,515 74,015 77,346 80,827 84,464 88,265 92,237 96,387 100,725 105,257 109,994
14 Total 1,432,405$ 143,240$ 143,240$ 143,240$ 143,240$ 143,240$ 143,240$ 143,240$ 143,240$ 143,240$ 143,240$
21 22 23 24 25
Debt Service - Years 21-25
15 Interest Payment 87,380$ 28,297$ 23,125$ 17,719$ 12,071$ 6,168$
16 Principal Payment 628,822 114,943 120,116 125,521 131,170 137,072
17 Total 716,202$ 143,240$ 143,240$ 143,240$ 143,240$ 143,240$
Total Debt Service
18 Interest Payment 1,457,012$
19 Principal Payment 2,124,000
20 Total 3,581,012$
75% Recovery
2015_Impact Fee Analysis_Final (4-9-15) eA XA cxÇwxÜ? \ÇvA
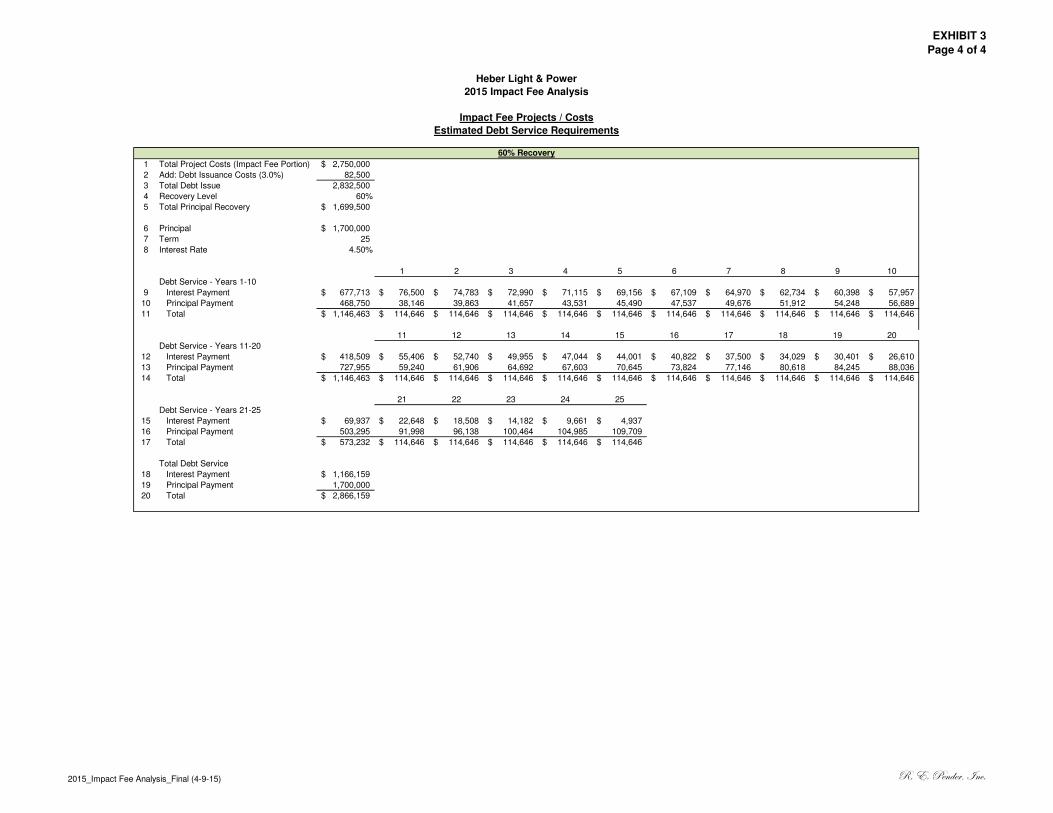
EXHIBIT 3
Page 4 of 4
Heber Light & Power
2015 Impact Fee Analysis
Impact Fee Projects / Costs
Estimated Debt Service Requirements
1 Total Project Costs (Impact Fee Portion) 2,750,000$
2 Add: Debt Issuance Costs (3.0%) 82,500
3 Total Debt Issue 2,832,500
4 Recovery Level 60%
5 Total Principal Recovery 1,699,500$
6 Principal 1,700,000$
7 Term 25
8 Interest Rate 4.50%
1 2 3 4 5 6 7 8 9 10
Debt Service - Years 1-10
9 Interest Payment 677,713$ 76,500$ 74,783$ 72,990$ 71,115$ 69,156$ 67,109$ 64,970$ 62,734$ 60,398$ 57,957$
10 Principal Payment 468,750 38,146 39,863 41,657 43,531 45,490 47,537 49,676 51,912 54,248 56,689
11 Total 1,146,463$ 114,646$ 114,646$ 114,646$ 114,646$ 114,646$ 114,646$ 114,646$ 114,646$ 114,646$ 114,646$
11 12 13 14 15 16 17 18 19 20
Debt Service - Years 11-20
12 Interest Payment 418,509$ 55,406$ 52,740$ 49,955$ 47,044$ 44,001$ 40,822$ 37,500$ 34,029$ 30,401$ 26,610$
13 Principal Payment 727,955 59,240 61,906 64,692 67,603 70,645 73,824 77,146 80,618 84,245 88,036
14 Total 1,146,463$ 114,646$ 114,646$ 114,646$ 114,646$ 114,646$ 114,646$ 114,646$ 114,646$ 114,646$ 114,646$
21 22 23 24 25
Debt Service - Years 21-25
15 Interest Payment 69,937$ 22,648$ 18,508$ 14,182$ 9,661$ 4,937$
16 Principal Payment 503,295 91,998 96,138 100,464 104,985 109,709
17 Total 573,232$ 114,646$ 114,646$ 114,646$ 114,646$ 114,646$
Total Debt Service
18 Interest Payment 1,166,159$
19 Principal Payment 1,700,000
20 Total 2,866,159$
60% Recovery
2015_Impact Fee Analysis_Final (4-9-15) eA XA cxÇwxÜ? \ÇvA
EXHIBIT 4
SUMMARY OF CHARGES
CURRENT AND PROPOSED IMPACT FEES

EXHIBIT 4
Page 1 of 1
Current
Line Impact 100% 75% 60%
No. Fee Recovery Recovery Recovery
(a) (b) (c) (d)
1 Impact Fees ($ per kVa) 41.40$ 104.68$ 75.37$ 57.80$
Impact Fee Charge for Applicable Panel Size
Residential (120/240, 1 phase)
2 100 Amp 994 2,512 1,809 1,387
3 200 Amp 1,987 5,025 3,618 2,774
4 400 Amp 3,974 10,049 7,235 5,549
Commercial (120/208, 3 phase)
5 100 Amp 1,492 3,771 2,715 2,082
6 200 Amp 2,983 7,542 5,430 4,164
7 400 Amp 5,966 15,085 10,861 8,329
Commercial (120/208, 3 phase)
8 2000 Amp 29,830 75,426 54,304 41,645
9 3000 Amp 44,745 113,139 81,456 62,467
Commercial (277/480, 3 phase)
10 1000 Amp 34,419 87,027 62,657 48,050
11 2000 Amp 68,839 174,055 125,314 96,101
12 3000 Amp 103,258 261,082 187,971 144,151
Denotes Staff recommendation.
Description / Panel Rating
Heber Light & Power2015 Impact Fee Study
Summary of Charges For Residential & Commercial CustomersCurrent and Proposed Impact Fee Levels
Proposed Impact Fee
2015_Impact Fee Analysis_Final (4-9-15) eA XA cxÇwxÜ? \ÇvA