Embed Size (px)
Citation preview

Summary of Consolidated Financial Results for the First Quarter of FY2009 (Unaudited)(January 1, 2009 - March 31, 2009) April 28, 2009
Company Name: Shimano Inc. Stock Exchanges: Tokyo and Osaka, First SectionsCode Number: 7309 URL: http://www.shimano.comPresident: Yozo ShimanoSenior Vice President, Accounting: Yoshihiro Hirata Telephone: +81-72-223-3254Date of submission of quarterly report to Ministry of Finance:Scheduled payment date for dividends: ―
(Amounts are rounded down to the nearest million yen.)1. Consolidated financial results for the First Quarter of FY2009 (January 1, 2009 - March 31, 2009)(1) Consolidated income information (The percentages represent the rates of increase (decrease) compared to the corresponding prior period.)
Million yen % Million yen % Million yen % Million yen %
First Quarter of FY2009First Quarter of FY2008
Yen YenFirst Quarter of FY2009 -
First Quarter of FY2008 -
Million yen Million yen % YenFirst Quarter of FY2009FYE2008(Reference) Shareholders' Equity First Quarter of FY2009: 167,750 million yen FYE2008: 165,088 million yen
2. Dividend informationDividend per Share
Record Date First Quarter Second Quarter Third Quarter Year-end TotalYen Yen Yen Yen Yen
FY2008 - 30.50 - 30.50 61.00FY2009 -
FY2009 (Forecast) 30.50 - 30.50 61.00(Note) There has been no change to the forecasted dividend announced on February 10, 2009.
3. Forecasted consolidated business results for FY2009 (January 1, 2009 - December 31, 2009)(The percentages represent the rates of increase (decrease) compared to the corresponding prior period.)
Million yen % Million yen % Million yen % Million yen % YenSecond Quarter of FY2009FY2009(Note) The forecasted consolidated business results announced on February 10, 2009, have been revised.
Ordinary income
91,500 - 8,500 -
Net sales
Operating income
―28.8
May 14, 2009
Net assets
165,768192,049
Quarterly net incomeper share (Basic)
193,238
Quarterly net incomeper share (Diluted)
15.9―
182.47(30.5)
Net income per share
-7,50017,500 (30.4)
78.20195,000 24,500 25,500(17.1) (35.2)
This document has been translated from the Japanese original for reference purposes only. In the event of any discrepancy between thistranslated document and the Japanese original, the original shall prevail. The Company assumes no responsibility for this translation orfor direct, indirect or any other forms of damages arising from the translation.
7,8917,116
8,7885,148
55,58645,092
Quarterly net income
14.7
(2) Consolidated balance sheet information
―5,3495,504
Net assets per share
87.3 1,749.12
Shareholders' equity ratio
―
168,447
-
85.4 1,721.36
Operating income
10,500
Ordinary income Net income
Net sales
Total assets
55.7457.40
11.0
1
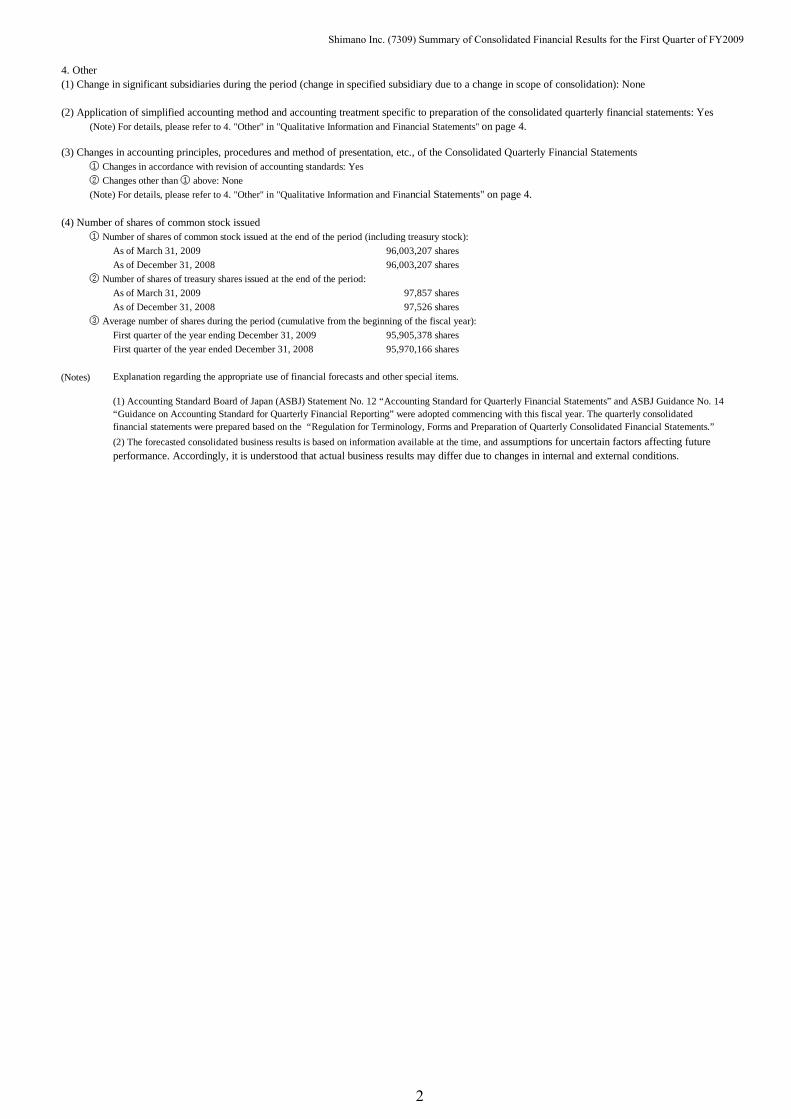
4. Other(1) Change in significant subsidiaries during the period (change in specified subsidiary due to a change in scope of consolidation): None
(2) Application of simplified accounting method and accounting treatment specific to preparation of the consolidated quarterly financial statements: Yes(Note) For details, please refer to 4. "Other" in "Qualitative Information and Financial Statements" on page 4.
(3) Changes in accounting principles, procedures and method of presentation, etc., of the Consolidated Quarterly Financial Statements① Changes in accordance with revision of accounting standards: Yes② Changes other than ① above: None(Note) For details, please refer to 4. "Other" in "Qualitative Information and Financial Statements" on page 4.
(4) Number of shares of common stock issued① Number of shares of common stock issued at the end of the period (including treasury stock):
As of March 31, 2009 96,003,207 sharesAs of December 31, 2008 96,003,207 shares
② Number of shares of treasury shares issued at the end of the period:As of March 31, 2009 97,857 sharesAs of December 31, 2008 97,526 shares
③ Average number of shares during the period (cumulative from the beginning of the fiscal year):First quarter of the year ending December 31, 2009 95,905,378 sharesFirst quarter of the year ended December 31, 2008 95,970,166 shares
(Notes) Explanation regarding the appropriate use of financial forecasts and other special items.
(1) Accounting Standard Board of Japan (ASBJ) Statement No. 12 “Accounting Standard for Quarterly Financial Statements” and ASBJ Guidance No. 14“Guidance on Accounting Standard for Quarterly Financial Reporting” were adopted commencing with this fiscal year. The quarterly consolidatedfinancial statements were prepared based on the “Regulation for Terminology, Forms and Preparation of Quarterly Consolidated Financial Statements.”(2) The forecasted consolidated business results is based on information available at the time, and assumptions for uncertain factors affecting futureperformance. Accordingly, it is understood that actual business results may differ due to changes in internal and external conditions.
Shimano Inc. (7309) Summary of Consolidated Financial Results for the First Quarter of FY2009
2
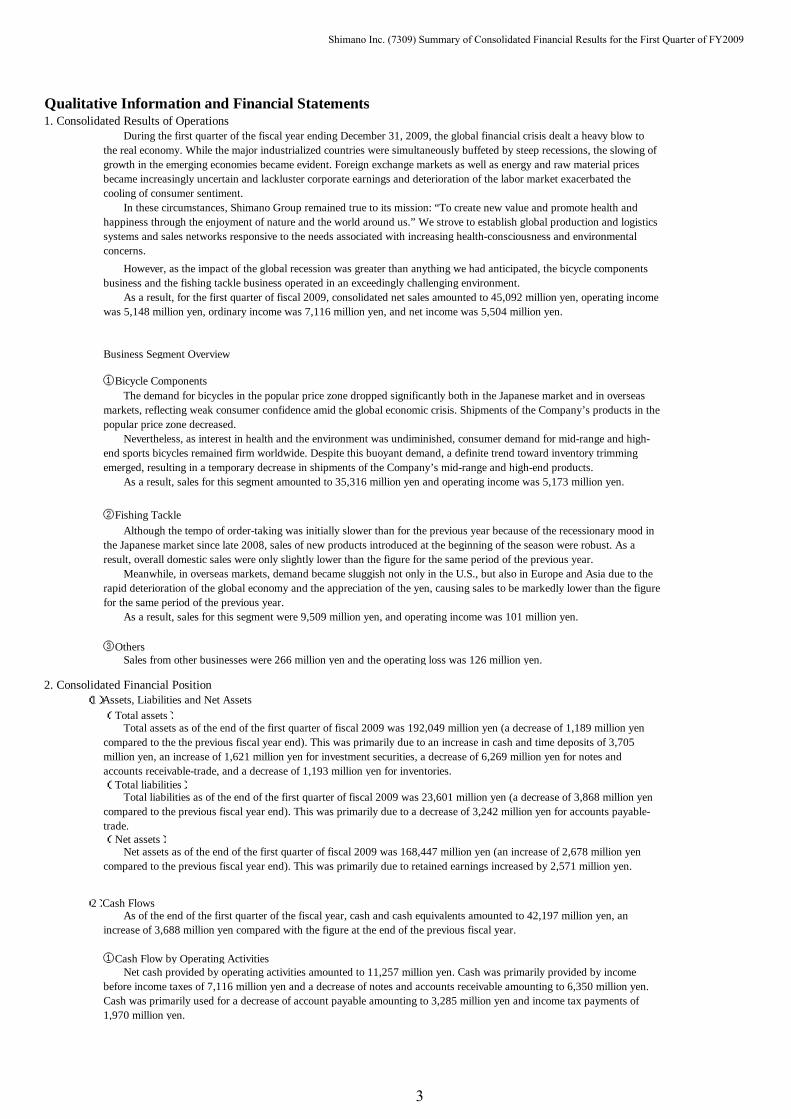
Qualitative Information and Financial Statements1. Consolidated Results of Operations
During the first quarter of the fiscal year ending December 31, 2009, the global financial crisis dealt a heavy blow tothe real economy. While the major industrialized countries were simultaneously buffeted by steep recessions, the slowing ofgrowth in the emerging economies became evident. Foreign exchange markets as well as energy and raw material pricesbecame increasingly uncertain and lackluster corporate earnings and deterioration of the labor market exacerbated thecooling of consumer sentiment. In these circumstances, Shimano Group remained true to its mission: “To create new value and promote health andhappiness through the enjoyment of nature and the world around us.” We strove to establish global production and logisticssystems and sales networks responsive to the needs associated with increasing health-consciousness and environmentalconcerns. However, as the impact of the global recession was greater than anything we had anticipated, the bicycle componentsbusiness and the fishing tackle business operated in an exceedingly challenging environment. As a result, for the first quarter of fiscal 2009, consolidated net sales amounted to 45,092 million yen, operating incomewas 5,148 million yen, ordinary income was 7,116 million yen, and net income was 5,504 million yen.
Business Segment Overview
①Bicycle Components The demand for bicycles in the popular price zone dropped significantly both in the Japanese market and in overseasmarkets, reflecting weak consumer confidence amid the global economic crisis. Shipments of the Company’s products in thepopular price zone decreased. Nevertheless, as interest in health and the environment was undiminished, consumer demand for mid-range and high-end sports bicycles remained firm worldwide. Despite this buoyant demand, a definite trend toward inventory trimmingemerged, resulting in a temporary decrease in shipments of the Company’s mid-range and high-end products. As a result, sales for this segment amounted to 35,316 million yen and operating income was 5,173 million yen.
②Fishing Tackle Although the tempo of order-taking was initially slower than for the previous year because of the recessionary mood inthe Japanese market since late 2008, sales of new products introduced at the beginning of the season were robust. As aresult, overall domestic sales were only slightly lower than the figure for the same period of the previous year. Meanwhile, in overseas markets, demand became sluggish not only in the U.S., but also in Europe and Asia due to therapid deterioration of the global economy and the appreciation of the yen, causing sales to be markedly lower than the figurefor the same period of the previous year. As a result, sales for this segment were 9,509 million yen, and operating income was 101 million yen.
③Others Sales from other businesses were 266 million yen and the operating loss was 126 million yen.
2. Consolidated Financial Position(1)Assets, Liabilities and Net Assets(Total assets) Total assets as of the end of the first quarter of fiscal 2009 was 192,049 million yen (a decrease of 1,189 million yencompared to the the previous fiscal year end). This was primarily due to an increase in cash and time deposits of 3,705million yen, an increase of 1,621 million yen for investment securities, a decrease of 6,269 million yen for notes andaccounts receivable-trade, and a decrease of 1,193 million yen for inventories.(Total liabilities) Total liabilities as of the end of the first quarter of fiscal 2009 was 23,601 million yen (a decrease of 3,868 million yencompared to the previous fiscal year end). This was primarily due to a decrease of 3,242 million yen for accounts payable-trade.(Net assets) Net assets as of the end of the first quarter of fiscal 2009 was 168,447 million yen (an increase of 2,678 million yencompared to the previous fiscal year end). This was primarily due to retained earnings increased by 2,571 million yen.
(2)Cash Flows As of the end of the first quarter of the fiscal year, cash and cash equivalents amounted to 42,197 million yen, anincrease of 3,688 million yen compared with the figure at the end of the previous fiscal year.
①Cash Flow by Operating Activities Net cash provided by operating activities amounted to 11,257 million yen. Cash was primarily provided by incomebefore income taxes of 7,116 million yen and a decrease of notes and accounts receivable amounting to 6,350 million yen.Cash was primarily used for a decrease of account payable amounting to 3,285 million yen and income tax payments of1,970 million yen.
Shimano Inc. (7309) Summary of Consolidated Financial Results for the First Quarter of FY2009
3

3. Forecast for the Fiscal Year Ending December 2009
4. Other
(2) Application of simplified accounting method and accounting treatment specific to preparation of the quarterly consolidated financial statements
②Cash Flow by Investment Activities
③Cash Flow by Financial Activities
Net cash used in investing activities amounted to 4,815 million yen. The main items included acquisitions of property,plant and equipment amounting to 2,543 million yen and acquisitions of investment securities amounting to 2,161 millionyen.
Net cash used in financing activities amounted to 2,597 million yen. The main item was cash dividend payments of2,921 million yen.
(1) Change in significant subsidiaries during the period (change in specified subsidiary due to a change in scope of consolidation):None
Economic turmoil and a decline in consumer confidence attributable to the slumping global economy are expected topersist for the time being. Consequently, a decisive recovery in demand is unlikely to materialize for some time either inJapan or overseas. In light of these circumstances, the Company revised the forecast of consolidated business results for fiscal 2009,announced on February 10, 2009, at the time of the announcement of the financial results for fiscal 2008. The revised forecastis as follows: net sales of 195,000 million yen, operating income of 24,500 million yen, ordinary income of 25,500 millionyen, and net income of 17,500 million yen. For details, please refer to the “Notice Concerning the Revision to the Forecast of Business Results” announced on April28, 2009. The above-mentioned forecast has been prepared based on the information currently available as of the date of issue ofthis document. Actual results may differ from the forecasted results due to various factors.
③ Method of calculation of depreciation of fixed assets
① Adoption of the “Accounting Standard for Quarterly Financial Reporting”
Depreciation expense for assets that are depreciated using the declining balance method are calculated by dividing theannual depreciation expense on pro rata basis.
④ Method of calculation of income taxes and deferred tax assets and liabilities Income taxes payable are calculated by limiting inclusion of additions and subtractions, and tax deductible items tosignificant items. The recoverability of deferred tax assets is assessed based on projections of future performance and tax planning usedfor the previous fiscal year because no significant change in the business environment or in the status of temporarydifferences was deemed to have occurred since the end of the previous fiscal year.
(3) Changes in accounting principles, procedures and method of presentation, etc.:
Effective from fiscal 2009, the Company has adopted the “Accounting Standard for Quarterly Financial Reporting”(ASBJ Statement No. 12) and the “Guidance on Accounting Standard for Quarterly Financial Reporting” (ASBJ GuidanceNo. 14). The quarterly consolidated financial statements were prepared based on the “Regulation for Terminology, Formsand Preparation of Quarterly Consolidated Financial Statements.”
② Adoption of the “Practical Solution on Unification of Accounting Policies Applied to Foreign Subsidiaries
① Method of calculation of estimated bad debt losses on general receivables Recognizing that no significant changes have arisen with regard to the bad debt loss ratios at the end of the firstquarter of fiscal 2009 and the previous fiscal year-end, the actual bad debt loss ratio at the previous fiscal year-end wasused to calculate estimated bad debt losses on general receivables.② Method of valuation of inventories For the computation of inventories at the end of the first quarter of fiscal 2009, the physical inventory count wasomitted and instead a rational computation method based on the physical inventory count at the previous fiscal year-endwas utilized. Regarding write-down of inventories, the carrying amount of inventories is reduced to the estimated net selling valueonly for inventories with clearly lowered realizability.
for Consolidated Financial Statements” Effective from the first quarter of fiscal 2009, the Company has adopted the “Practical Solution on Unification ofAccounting Policies Applied to Foreign Subsidiaries for Consolidated Financial Statements” (Practical Issues Task Force(PITF) No. 18). The impact of this change on the quarterly consolidated financial statements is immaterial.
Shimano Inc. (7309) Summary of Consolidated Financial Results for the First Quarter of FY2009
4

5. Quarterly Consolidated Financial Statements
(1) Quarterly Consolidated Balance Sheets (Millions of yen)
First Quarter of FY2009 FY2008
As of Mar. 31, 2009 As of Dec. 31, 2008
(Assets)
Current assets
¥46,019 ¥42,314
24,923 31,192
24,316 22,508
Work in process 13,691 16,560
Raw materials and supplies 4,885 5,017
2,129 1,957
2,946 3,293
(370) (352)
118,542 122,492
Fixed assets
Buildings and structures 16,463 16,502
Machinery and vehicles 10,665 10,349
Land 11,700 11,692
Construction in progress 1,741 880
Others 3,835 3,912
Total property, plant and equipment 44,407 43,337
Goodwill 3,770 3,816
Software 4,968 5,178
Construction in progress 39 113
Others 2,891 2,853
Total intangible assets 11,670 11,961
Investment securities 11,611 9,990
Long-term loans receivable 45 45
Deferred income taxes 3,781 3,346
Others 2,556 2,632
(566) (567)
Total investments and other assets 17,428 15,446
73,506 70,746
¥192,049 ¥193,238
Investments and other assets
Allowance for doubtful accounts
Cash and time deposits
Merchandise and finished goods
Deferred income taxes
Notes and accounts receivable-trade
Total fixed assets
Others
Allowance for doubtful accounts
Total current assets
Total assets
Property, plant and equipment
Intangible assets
Shimano Inc. (7309) Summary of Consolidated Financial Results for the First Quarter of FY2009
5

First Quarter of FY2009 FY2008
As of Mar. 31, 2009 As of Dec. 31, 2008
(Liabilities )
Current liabilities
¥3,526 ¥6,768
3,342 2,304
2,240 2,101
579 768
Accrued employee bonuses 1,283 937
Accrued officer bonuses 38 132
7,681 9,184
Total current liabilities 18,692 22,197
Long-term liabilities
1,623 2,019
691 675
1,365 1,347
1,167 1,140
61 89
Total long-term liabilities 4,909 5,272
Total liabilities 23,601 27,469
(Net assets )
Shareholders' equity
¥35,613 ¥35,613
5,823 5,823
139,575 137,004
(392) (391)
Total shareholders' equity 180,619 178,049
Valuation and translation adjustments
(2,082) (1,658)
(10,786) (11,302)
Total valuation and translation adjustments (12,868) (12,961)Minority interests 697 680
Total net assets 168,447 165,768
¥192,049 ¥193,238
Common stock
Total liabilities and net assets
Capital surplus
Retained earnings
Treasury stock
Unrealized gain (loss) on other securities
Foreign currency translation adjustments
Deferred income taxes
Employee retirement benefits
Others
Officer retirement benefits
Long-term loans payable
Others
Income taxes payable
Deferred income taxes
Accounts payable-trade
Short-term loans payable
Shimano Inc. (7309) Summary of Consolidated Financial Results for the First Quarter of FY2009
6
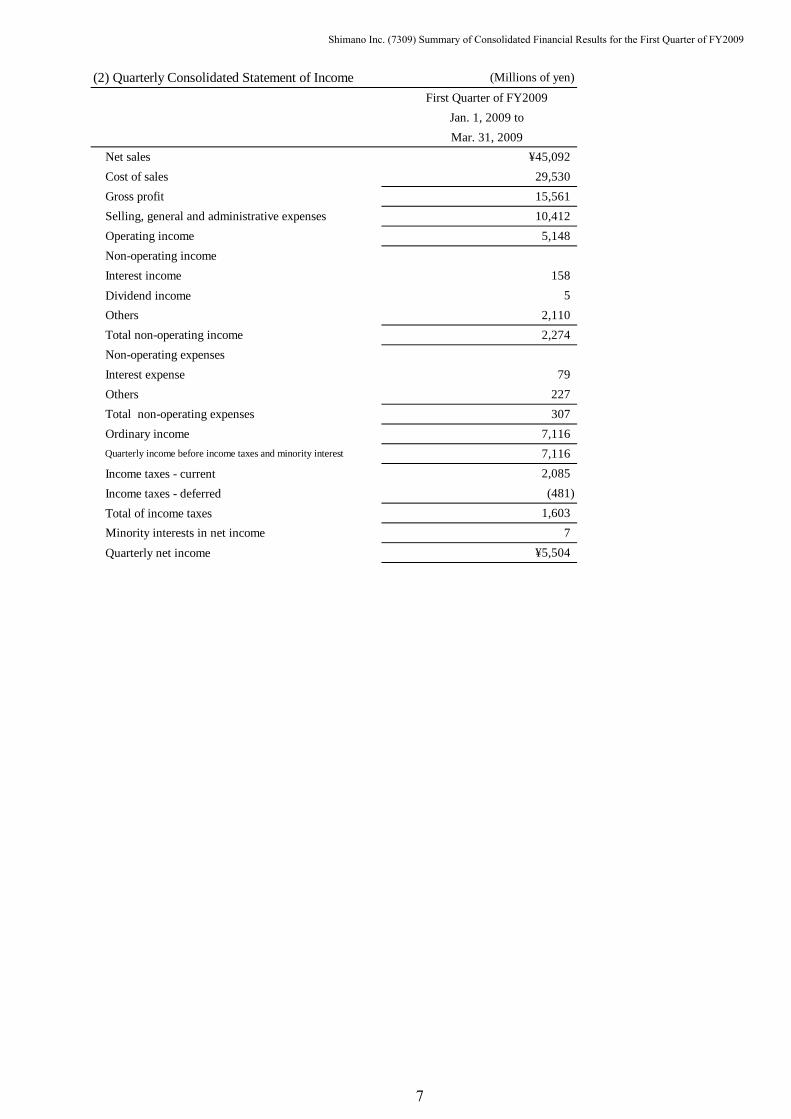
(2) Quarterly Consolidated Statement of Income (Millions of yen)First Quarter of FY2009
Jan. 1, 2009 toMar. 31, 2009
Net sales ¥45,092Cost of sales 29,530Gross profit 15,561Selling, general and administrative expenses 10,412Operating income 5,148Non-operating incomeInterest income 158Dividend income 5Others 2,110Total non-operating income 2,274Non-operating expensesInterest expense 79Others 227Total non-operating expenses 307Ordinary income 7,116Quarterly income before income taxes and minority interest 7,116Income taxes - current 2,085Income taxes - deferred (481)Total of income taxes 1,603Minority interests in net income 7Quarterly net income ¥5,504
Shimano Inc. (7309) Summary of Consolidated Financial Results for the First Quarter of FY2009
7
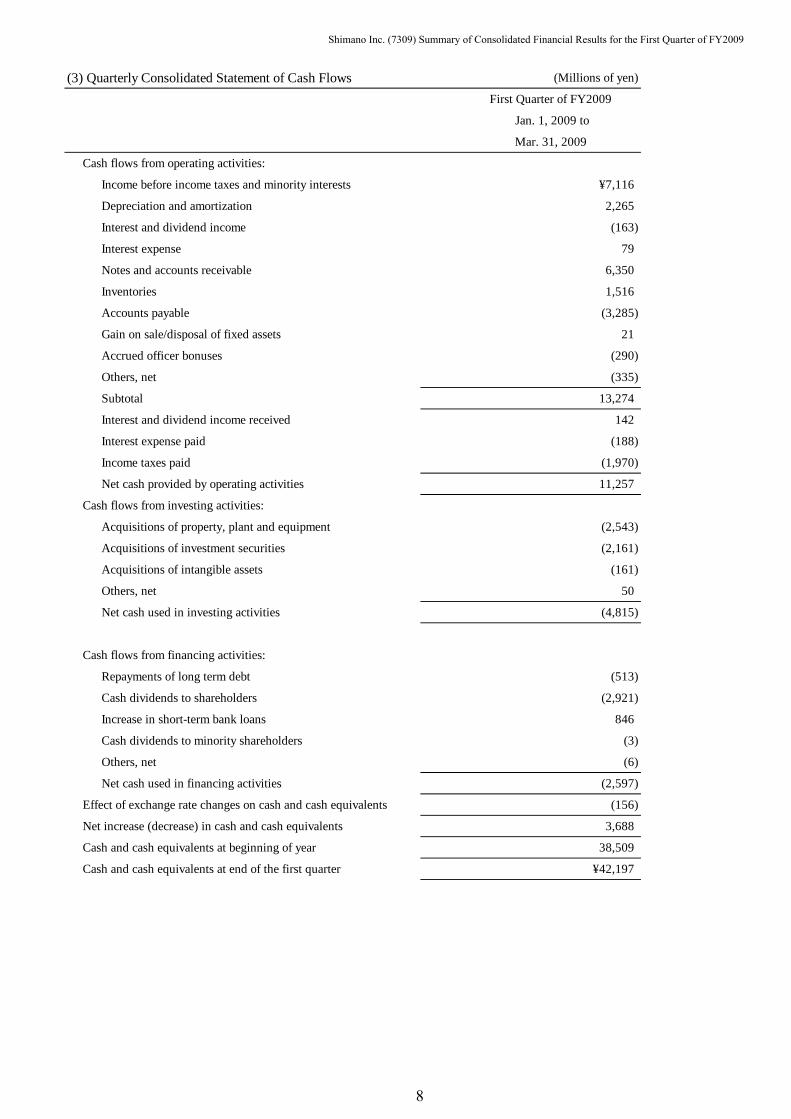
(3) Quarterly Consolidated Statement of Cash Flows (Millions of yen)
First Quarter of FY2009
Jan. 1, 2009 to
Mar. 31, 2009
Cash flows from operating activities:
Income before income taxes and minority interests ¥7,116
Depreciation and amortization 2,265
Interest and dividend income (163)
Interest expense 79
Notes and accounts receivable 6,350
Inventories 1,516
Accounts payable (3,285)
Gain on sale/disposal of fixed assets 21
Accrued officer bonuses (290)
Others, net (335)
Subtotal 13,274
Interest and dividend income received 142
Interest expense paid (188)
Income taxes paid (1,970)
Net cash provided by operating activities 11,257
Cash flows from investing activities:
Acquisitions of property, plant and equipment (2,543)
Acquisitions of investment securities (2,161)
Acquisitions of intangible assets (161)
Others, net 50
Net cash used in investing activities (4,815)
Cash flows from financing activities:
Repayments of long term debt (513)
Cash dividends to shareholders (2,921)
Increase in short-term bank loans 846
Cash dividends to minority shareholders (3)
Others, net (6)
Net cash used in financing activities (2,597)
Effect of exchange rate changes on cash and cash equivalents (156)
Net increase (decrease) in cash and cash equivalents 3,688
Cash and cash equivalents at beginning of year 38,509
Cash and cash equivalents at end of the first quarter ¥42,197
Shimano Inc. (7309) Summary of Consolidated Financial Results for the First Quarter of FY2009
8
(4) Note concerning assumption of going concern
Not applicable.
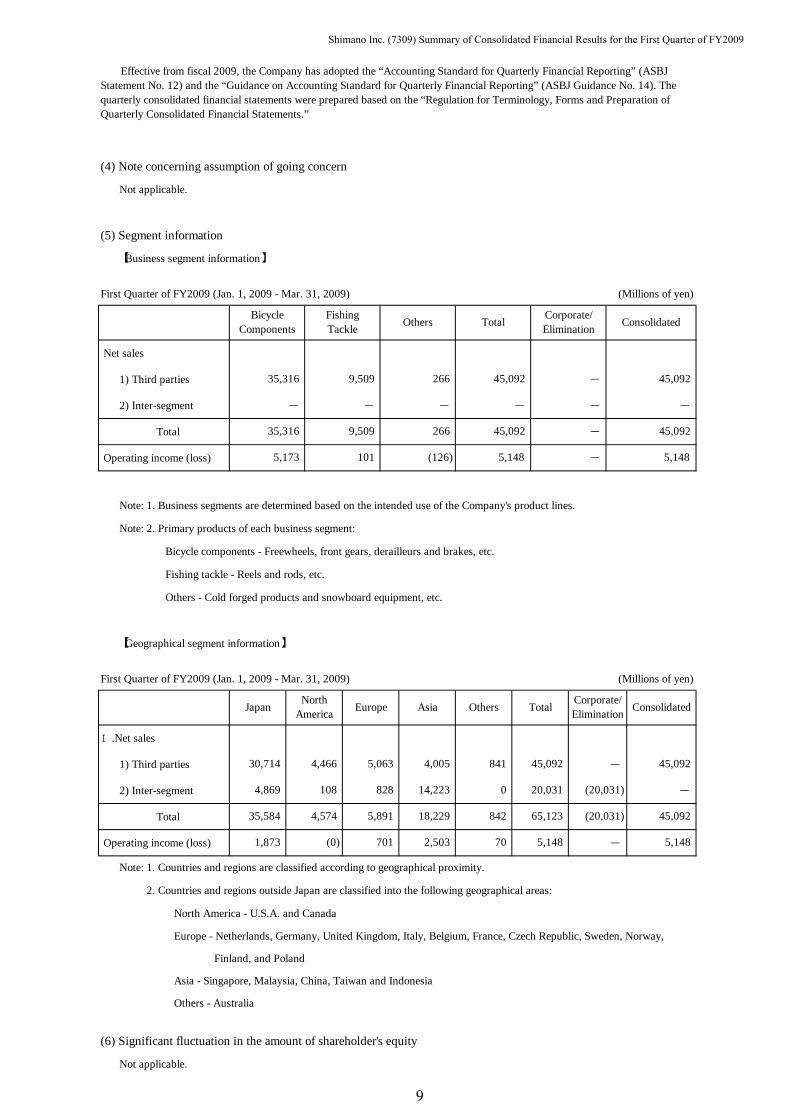
(5) Segment information
【Business segment information】
First Quarter of FY2009 (Jan. 1, 2009 - Mar. 31, 2009) (Millions of yen)
Net sales
1) Third parties
2) Inter-segment
Total
Operating income (loss)
Note: 1. Business segments are determined based on the intended use of the Company's product lines.
Note: 2. Primary products of each business segment:
Bicycle components - Freewheels, front gears, derailleurs and brakes, etc.
Fishing tackle - Reels and rods, etc.
Others - Cold forged products and snowboard equipment, etc.
【Geographical segment information】
First Quarter of FY2009 (Jan. 1, 2009 - Mar. 31, 2009) (Millions of yen)
Ⅰ.Net sales
1) Third parties
2) Inter-segment
Total
Operating income (loss)
Note: 1. Countries and regions are classified according to geographical proximity.
Note: 2. Countries and regions outside Japan are classified into the following geographical areas:
North America - U.S.A. and Canada
Europe - Netherlands, Germany, United Kingdom, Italy, Belgium, France, Czech Republic, Sweden, Norway,
Finland, and Poland
Asia - Singapore, Malaysia, China, Taiwan and Indonesia
Others - Australia
(6) Significant fluctuation in the amount of shareholder's equity
Not applicable.
Effective from fiscal 2009, the Company has adopted the “Accounting Standard for Quarterly Financial Reporting” (ASBJStatement No. 12) and the “Guidance on Accounting Standard for Quarterly Financial Reporting” (ASBJ Guidance No. 14). Thequarterly consolidated financial statements were prepared based on the “Regulation for Terminology, Forms and Preparation ofQuarterly Consolidated Financial Statements.”
5,148
Consolidated
45,092
5,148
45,092
-
Consolidated
45,092
-
45,092
5,148
Corporate/Elimination
-
(20,031)
(20,031)
-
Total
45,092
20,031
65,123
5,148
Corporate/Elimination
-
-
-
-
Total
45,092
-
45,092
18,229
2,503
Others
841
0
842
70
(126)
Asia
4,005
14,223
Others
266
-
266
4,574
(0)
Europe
5,063
828
5,891
701
101
NorthAmerica
4,466
108
FishingTackle
9,509
-
9,509
Japan
1,873
BicycleComponents
35,316
-
5,173
35,316
35,584
4,869
30,714
Shimano Inc. (7309) Summary of Consolidated Financial Results for the First Quarter of FY2009
9

(Reference)
Previous Quarterly Consolidated Financial Statements
(1) Quarterly Consolidated Statement of Income (Millions of yen)First Quarter of FY2008
Jan. 1, 2008 toMar. 31, 2008
AmountⅠ Net sales ¥55,586Ⅱ Cost of sales 36,183
19,403Ⅲ 10,614
8,788Ⅳ Non-operating income 510
42287
Ⅴ Non-operating expenses 1,407136
1,2717,8917,8912,019
48338
¥5,349
Selling, general and administrative expensesGross profit
Accounts
Ordinary income
Operating income
Others
Interest and dividend income
Interest expense
Others
Quarterly net income
Quarterly income before income taxes and minority interest
Income tax-currentIncome tax-deferredMinority interests in net income
Shimano Inc. (7309) Summary of Consolidated Financial Results for the First Quarter of FY2009
10
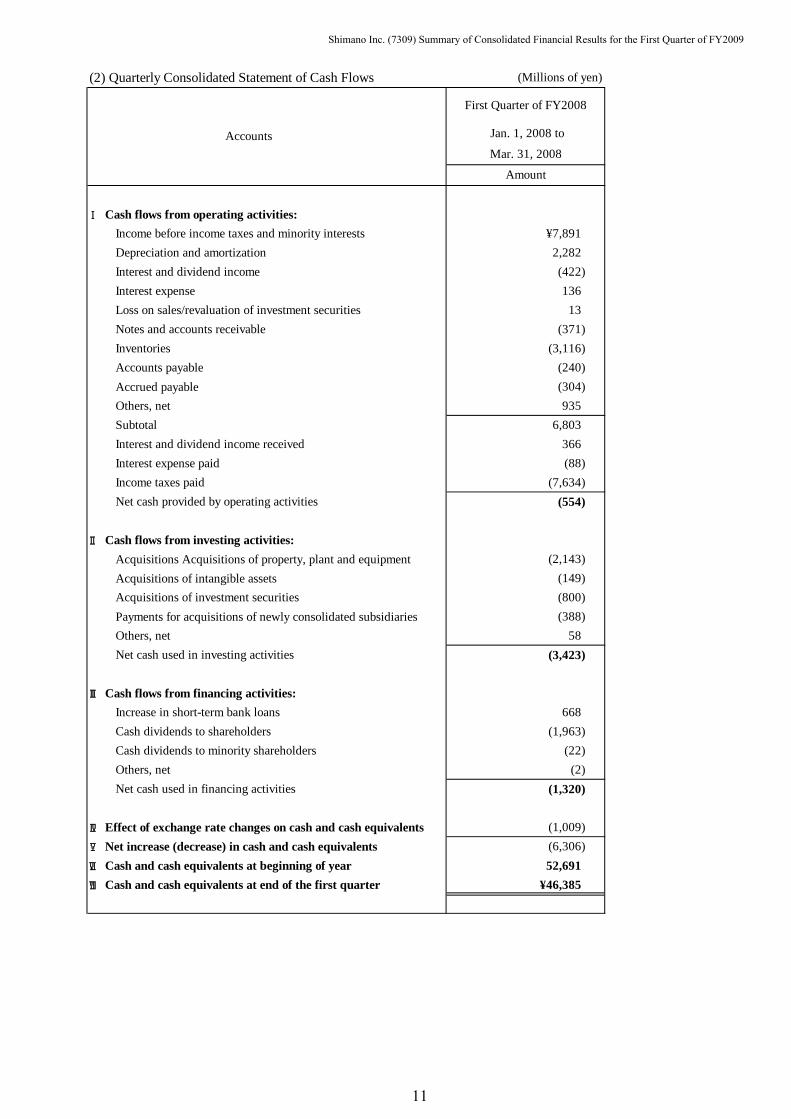
(2) Quarterly Consolidated Statement of Cash Flows (Millions of yen)
Ⅰ Cash flows from operating activities:Income before income taxes and minority interests ¥7,891Depreciation and amortization 2,282Interest and dividend income (422)Interest expense 136Loss on sales/revaluation of investment securities 13Notes and accounts receivable (371)Inventories (3,116)Accounts payable (240)Accrued payable (304)Others, net 935Subtotal 6,803Interest and dividend income received 366Interest expense paid (88)Income taxes paid (7,634)Net cash provided by operating activities (554)
Ⅱ Cash flows from investing activities:Acquisitions Acquisitions of property, plant and equipment (2,143)Acquisitions of intangible assets (149)Acquisitions of investment securities (800)Payments for acquisitions of newly consolidated subsidiaries (388)Others, net 58Net cash used in investing activities (3,423)
Ⅲ Cash flows from financing activities:Increase in short-term bank loans 668Cash dividends to shareholders (1,963)Cash dividends to minority shareholders (22)Others, net (2)Net cash used in financing activities (1,320)
Ⅳ Effect of exchange rate changes on cash and cash equivalents (1,009)Ⅴ Net increase (decrease) in cash and cash equivalents (6,306)Ⅵ Cash and cash equivalents at beginning of year 52,691Ⅶ Cash and cash equivalents at end of the first quarter ¥46,385
Accounts
First Quarter of FY2008
Jan. 1, 2008 to
Mar. 31, 2008
Amount
Shimano Inc. (7309) Summary of Consolidated Financial Results for the First Quarter of FY2009
11
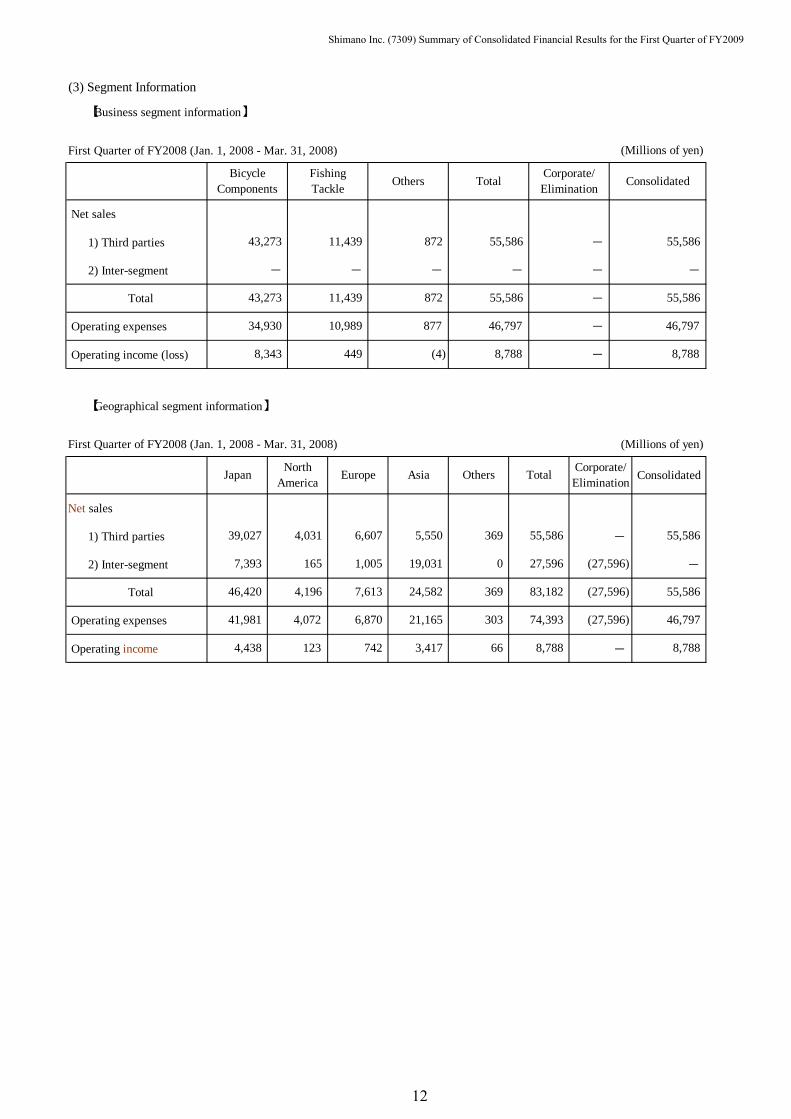
(3) Segment Information
【Business segment information】
First Quarter of FY2008 (Jan. 1, 2008 - Mar. 31, 2008) (Millions of yen)
Net sales
1) Third parties
2) Inter-segment
Total
Operating expenses
Operating income (loss)
【Geographical segment information】
First Quarter of FY2008 (Jan. 1, 2008 - Mar. 31, 2008) (Millions of yen)
Net sales
1) Third parties
2) Inter-segment
Total
Operating expenses
Operating income
74,393 (27,596) 46,797
877 46,797 - 46,797
(4)
Asia
5,550
Japan
4,438
34,930 10,989
41,981 4,072 6,870
46,420
7,393
39,027
BicycleComponents
43,273
-
8,343
43,273
FishingTackle
11,439
-
11,439
449
NorthAmerica
4,031
165
4,196
123
Europe
6,607
1,005
7,613
742
Others
872
-
872
19,031
24,582
3,417
Others
369
0
369
66
21,165 303
8,788
Corporate/Elimination
-
-
-
-
Total
55,586
-
55,586
8,788
Corporate/Elimination
-
(27,596)
(27,596)
-
Total
55,586
27,596
83,182
8,788
Consolidated
55,586
8,788
55,586
-
Consolidated
55,586
-
55,586
Shimano Inc. (7309) Summary of Consolidated Financial Results for the First Quarter of FY2009
12


![[Overview of the consolidated financial results]](https://img.dokumen.tips/doc/110x75/625607d48da2d95b740c726b/overview-of-the-consolidated-financial-results.jpg)


