Embed Size (px)
Citation preview

SUMMARY ANNUAL REPORTFor the Fiscal Year Ending December 31, 2016
Helping you build a brighter tomorrow.
CERFCounty EmployEEs’ REtiREmEnt Fund

COUNTY EMPLOYEES’RETIREMENT FUND
2016 Board of Trustees Jim Atchison – Board Member
Mark Bridges – Vice Chair
Conny Dover – Secretary
Gary Emerson – Board Member
Rosemary Gannaway – Board Member
Jim Platt – Board Member
Mark Price – Board Member
Tom Ruhl – Chair
Wayne Scharnhorst – Board Member
Sherry Shamel – Board Member
Vacant – Board Member
COUNTY EMPLOYEES’RETIREMENT FUND
CERF Pension Plan Information CERF Administrative Office Telephone: (573) 632-9203 2121 Schotthill Woods Drive Toll-Free: (877) 632-2373 Jefferson City, MO 65101 Facsimile: (573) 761-4404 Website: www.mocerf.org E-mail: [email protected]

ADMINISTRATIVE STRUCTURE
This Annual Report is distributed for informational purposes only. The full text of actuarial reports, financial statements and audit materials is available upon request pursuant to Missouri’s Open Records Law. To obtain any of these documents, you may send a written request to the plan administrator at:
CERF Plan Administrator2121 Schotthill Woods Drive
Jefferson City, MO 65101
The actual language of the statutes and rules and regulations creating and implementing the County Employees’ Retirement Fund controls and takes precedence over the material contained herein. In the event a member has any questions concerning the County Employees’ Retirement Fund, the member should look to the statutes codified at Section 50.1000, RSMo (1994) et. seq. for guidance. Members should not rely on this summary in place of the actual text of the law.
CERF BOARD OF DIRECTORS
Asset Consulting
GroupInvestment Consultant
Penman & Winton
Consulting Group, Inc.Legislative Consultant
MillimanActuary
Williams-Keepers LLC
Auditor
Bryan Cave LLPLegal Counsel
PrivateAdvisors, LLC
Fixed Alternative Manager
Baring Asset ManagementInternational
Growth Equity Manager
Burgundy AssetManagement
Ltd.Small-Cap Value
Manager
Loomis, Sayles & Company, L.P.
Core-Plus Fixed Income Manager
William Blair &Company;
Century CapitalSmall/Mid-Cap Growth Equity
Manager
BrownAdvisoryLarge Cap
Growth Equity Manager
TCWLarge Cap Value Equity Manager
Brandes Investment
Partners, L.P.Developed Markets International Value
Equity Manager
ABS InvestmentManagement
Equity Long/ShortManager
JP MorganAsset
ManagementReal Estate Manager
CERF Administrative Office
Sarah MaxwellExecutive Director
PortfolioAdvisors, LLCPrivate Equity
Manager

CERF Pension PlanEligibility
Participation
Contributions
Vesting
Prior Service
Early Retirement
Cost-of-Living Adjustment
Survivor Benefits
Full-time employees (scheduled to work at least 1,000 hours a year) are eligible to participate in the Pension Plan. Part-time and seasonal employees become eligible on January 1 or July 1 after completion of 1,000 hours of service in a calendar year, or upon transfer to full-time status.
Participation is mandatory for eligible employees. Full-time employees begin participating in the plan immediately upon their date of hire. Part-time and seasonal employees begin participating once they become eligible.
House Bill 1455 requires all participants hired on or after February 25, 2002, to contribute an additional 4% of gross salary to the plan, effective January 1, 2003. A non-LAGERS participant hired prior to February 25, 2002, contributes 2%; a non-LAGERS participant hired on or after February 25, 2002, contributes 6% to the plan. A LAGERS participant hired prior to February 25, 2002, is not required to make contributions; a LAGERS participant hired on or after February 25, 2002, contributes 4% to the plan. Nearly all of the funding for CERF comes from county receipts in the form of contributions, fees and penalties.
A participant is vested after eight years of continuous creditable service during which pay is earned and received for at least 1,000 hours in each of those eight years.
Employees who were employed on June 10, 1999, and remained employed through January 1, 2000, do not have to purchase prior service. (Specific rules apply in certain rehire circumstances.) Members who terminated vested or retired prior to January 1, 2000, must purchase any service accrued prior to August 28, 1994, in order to include that service in their retirement benefit.
Members have the option of retiring as early as age 55 (with eight years of continuous creditable service) and receiving an actuarially-reduced benefit. To be eligible for early retirement, a participant must terminate employment on or after January 1, 2000, and meet other eligibility requirements.
The Board may authorize a Cost-of-Living Adjustment (COLA) each year equal to 100% of the Consumer Price Index, up to 1%, for all members who have been receiving benefits for at least one year on the date the COLA becomes effective. COLAs will become effective on July 1 of each year.
ACTIVE EMPLOYEES: If a participant dies while actively employed, his or her named beneficiary will receive a lump-sum death benefit of $10,000. NON-VESTED MEMBERS: Senate Bill 625, effective August 28, 2012, allows a refund of contributions to the beneficiary(ies) of active members who die after December 31, 2002, and before becoming vested.MARRIED, VESTED MEMBERS: If a vested participant dies before his or her pension begins, his or her surviving spouse can apply for a 50% spousal pension benefit.SINGLE, VESTED MEMBERS: House Bill 795, effective August 28 2004, allows a refund of contributions to the beneficiary(ies) of a single, vested member who dies on or after August 28, 2004.RETIRED MEMBERS: Depending on which option the member chooses, the designated survivor will receive the appropriate amount of benefits under the survivor option selected on his or her benefit calculation. Members who terminated employment or retired on or after January 1, 2000, have the option to designate someone other than a spouse as the beneficiary of their retirement annuity.

Eligibility
Automatic Contributions
Voluntary Contributions
Matching Contributions
Vesting
Investment Options
Making Changes
Payment Options
Rollovers and Plan Transfers
Need More Information
A member must participate in the CERF Pension Plan in order to be eligible to participate in the CERF Savings Plan.
Effective January 1, 2000, a member who is not in LAGERS is required to contribute .7% to the CERF Savings Plan. This pre-tax deduction is deposited automatically in the member’s 401(a) account.
In 2016, participants may contribute up to the lesser of $18,000, or 100% of their includible compensation to the 457 component of the plan. This limit includes contributions to other 457 plans as well.
Each year, the Board of Directors will determine the amount available for a matching contribution to the Savings Plan (up to plan limits). This matching amount will be added to member accounts for those who contributed to the 457 Plan, earn and receive pay for at least 1,000 hours during the year, retire at age 62, or die while employed by the county. The match will be deposited into the 401(a) component of member accounts as soon as administratively feasible after the plan year has ended.
Members are always 100% vested in their automatic (.7%) and voluntary (457 plan) contributions, and are 100% vested in the matching contributions when they have 5 years of creditable service (from date of hire), or if they die during the plan year.
A broad range of investment options is available, including the option to pick individual funds or target date funds, or have your account managed for you.
Participants may change the amount of their contributions on a quarterly basis and can stop 457 plan deferrals completely at any time. Changes to investment options can be done at any time. Investment changes can be made on a same-day basis through either KeyTalk at 800-701-8255 or the website at www.empower-retirement.com. You will need to use your user ID and personal identification number (PIN) provided to you by Empower Retirement.
Payments from the 457 or 401(a) portion of the plan may be made through annuity payments, lump sum, or periodic distributions if the account balance is $5,000 or more.
Members who have other qualified 457, 401(a) or 401(k) plans may transfer or roll over money from those plans to the appropriate component of the CERF Savings Plan. Likewise, if a member leaves employment, he or she may transfer or roll over his or her CERF Savings Plan balance to another qualified plan or IRA.
For more information on the CERF Savings Plan, please call the CERF Administrative Office.
CERF Savings Plan

InvestmentsInvestments
Page 1
CERF Investment Portfolio Background and Objectives
CERF’s investment program’s main objective is to provide retirement income to the plan’s participants. The pension plan’s formal investment policy articulates the fund’s goals, objectives, and risk parameters, and states the importance of diversification, risk management and a long-term, strategic investment time horizon. The plan’s assets are invested in accordance with this policy.
Total Portfolio Asset Allocation
CERF’s investment portfolio is invested in each of the broad investment categories (stocks, bonds, and real estate), sub-asset classes (large cap stocks, small cap stocks, etc.) and geographic regions (US, non-US).
CERF’s investment program is overseen and monitored by the investment consultant, CERF’s internal staff, and its Board of Directors. The investment portfolio has a long-term focus, but it is adjusted, when appropriate, to reflect near-term risks and opportunities. Rebalancing takes place to keep allocations to various investments within the stated ranges defined in the investment policy. New assets classes are periodically added to the mix to enhance diversification.
The portfolio’s target asset allocation is 65% equity (stocks), 30% fixed income (bonds), and 5% real assets (real estate). The chart below depicts the pension fund’s asset allocation as of December 31, 2016:
Current Portfolio Allocation
Equity Investments
CERF invests in different types of equities (stocks) for the growth opportunities they provide. CERF’s portfolio currently has exposure to domestic stocks, international stocks, hedged equity funds, and private equity in different size categories (small, mid, and large capitalization), in different styles (value and growth) and with different investment management organizations.
Fixed Income Investments
CERF’s fixed income (bond) portfolio is in place to enhance diversification and provide liquidity and downside protection. The fixed income portfolio is also diversified and invested across the fixed income markets, with an emphasis on high quality bonds. The portfolio has exposure to various quality, sector, geography, and security types.
Real Assets Investments
Real estate investments provide an additional layer of diversification to the portfolio, as they behave differently than stocks and bonds.
CERF’s current allocation to real estate is achieved through a diversified real estate fund. The fund has exposure to different geographic locations and property types, while maintaining strict quality requirements for each property, including leverage limits and occupancy rates.
2016 Year in Review
2016 was a year of surprises. Financial market performance was shaped by unexpected changes in the global political landscape. The rising tide of global populism, increasing anti-trade sentiment, and unprecedented central bank monetary policy dominated the headlines. Behind the scenes, 2016 marked the seventh year of positive global economic growth. US markets outperformed non-US markets due to improving domestic economic activity and higher relative interest rates in the US. Although they lagged US markets, continued monetary support from global central banks helped the non-US markets deliver positive returns for the year.
In the US, both stocks and bonds advanced in 2016, driven by relatively low interest rates and a rebound in US corporate profits. The S&P 500 posted a record high in December as prices rose in anticipation of pro-growth policies promised by newly elected president Donald Trump. Mr. Trump’s focus on domestic spending and jobs spurred a rally in US small cap stocks with a domestic focus. Small cap stocks surged 14% following the November 8 election, resulting in a 21% gain for 2016, and making them the top performing asset class for the year.
Global markets closed out the year slightly higher, pressured by the strong US dollar. Emerging market assets advanced, posting their biggest rise since 2012, as China’s
Domestic Equity38%
International Equity14%
Long/Short Equity
9%
Private Equity
3%
Fixed Income
29%
Real Estate5%
Money Markets
2%
Domestic Equity International EquityLong/Short Equity Private EquityFixed Income Real EstateMoney Markets
Total Pension Fund Assets: $447,026,000
Investments
Page 1
CERF Investment Portfolio Background and Objectives
CERF’s investment program’s main objective is to provide retirement income to the plan’s participants. The pension plan’s formal investment policy articulates the fund’s goals, objectives, and risk parameters, and states the importance of diversification, risk management and a long-term, strategic investment time horizon. The plan’s assets are invested in accordance with this policy.
Total Portfolio Asset Allocation
CERF’s investment portfolio is invested in each of the broad investment categories (stocks, bonds, and real estate), sub-asset classes (large cap stocks, small cap stocks, etc.) and geographic regions (US, non-US).
CERF’s investment program is overseen and monitored by the investment consultant, CERF’s internal staff, and its Board of Directors. The investment portfolio has a long-term focus, but it is adjusted, when appropriate, to reflect near-term risks and opportunities. Rebalancing takes place to keep allocations to various investments within the stated ranges defined in the investment policy. New assets classes are periodically added to the mix to enhance diversification.
The portfolio’s target asset allocation is 65% equity (stocks), 30% fixed income (bonds), and 5% real assets (real estate). The chart below depicts the pension fund’s asset allocation as of December 31, 2016:
Current Portfolio Allocation
Equity Investments
CERF invests in different types of equities (stocks) for the growth opportunities they provide. CERF’s portfolio currently has exposure to domestic stocks, international stocks, hedged equity funds, and private equity in different size categories (small, mid, and large capitalization), in different styles (value and growth) and with different investment management organizations.
Fixed Income Investments
CERF’s fixed income (bond) portfolio is in place to enhance diversification and provide liquidity and downside protection. The fixed income portfolio is also diversified and invested across the fixed income markets, with an emphasis on high quality bonds. The portfolio has exposure to various quality, sector, geography, and security types.
Real Assets Investments
Real estate investments provide an additional layer of diversification to the portfolio, as they behave differently than stocks and bonds.
CERF’s current allocation to real estate is achieved through a diversified real estate fund. The fund has exposure to different geographic locations and property types, while maintaining strict quality requirements for each property, including leverage limits and occupancy rates.
2016 Year in Review
2016 was a year of surprises. Financial market performance was shaped by unexpected changes in the global political landscape. The rising tide of global populism, increasing anti-trade sentiment, and unprecedented central bank monetary policy dominated the headlines. Behind the scenes, 2016 marked the seventh year of positive global economic growth. US markets outperformed non-US markets due to improving domestic economic activity and higher relative interest rates in the US. Although they lagged US markets, continued monetary support from global central banks helped the non-US markets deliver positive returns for the year.
In the US, both stocks and bonds advanced in 2016, driven by relatively low interest rates and a rebound in US corporate profits. The S&P 500 posted a record high in December as prices rose in anticipation of pro-growth policies promised by newly elected president Donald Trump. Mr. Trump’s focus on domestic spending and jobs spurred a rally in US small cap stocks with a domestic focus. Small cap stocks surged 14% following the November 8 election, resulting in a 21% gain for 2016, and making them the top performing asset class for the year.
Global markets closed out the year slightly higher, pressured by the strong US dollar. Emerging market assets advanced, posting their biggest rise since 2012, as China’s
Domestic Equity38%
International Equity14%
Long/Short Equity
9%
Private Equity
3%
Fixed Income
29%
Real Estate5%
Money Markets
2%
Domestic Equity International EquityLong/Short Equity Private EquityFixed Income Real EstateMoney Markets
Total Pension Fund Assets: $447,026,000

Investments
Page 2
economy avoided a recession long feared by investors. Bonds eked out gains despite a rise in US Treasury yields and commodities advanced for the first time since 2010.
Total Portfolio Performance
The success of the investment program is defined by its adherence to the investment policy guidelines, and its performance compared to the stated return objectives and risk parameters.
The following chart shows the pension fund’s annualized performance and risk since its inception compared to the stated objectives:
Total Pension Fund Performance vs. Objectives
(December 31, 1994 – December 31, 2016)
Benchmark CERF
Return Objectives
At a minimum, it is the objective of CERF to exceed its actuarial interest rate assumption on an ongoing basis.
7.5% 8.6%
The pension fund's annualized total return should equal or exceed the annualized rate of inflation as indicated by the Consumer Price Index by 5%.
7.3% 8.6%
The pension fund's total return should exceed the total return of an index composed as follows:
65% S&P 500 Stock Index 35% Barclays Capital U.S. Aggregate
Bond Index
8.5% 8.6%
Risk Objective
The pension fund's level of risk, as measured by Standard Deviation, should be consistent with the risk of an index composed as follows:
65% S&P 500 Stock Index 35% Barclays Capital U.S. Aggregate
Bond Index
9.7% 9.6%
The following chart shows CERF’s investment performance compared to other public pension funds for the one, three, five, and ten year periods ending December 31, 2016*.
* InvestorForce Trust Fund Universe.
Ongoing Monitoring
CERF’s Board of Directors is responsible for the ongoing oversight of the investment program. The Board utilizes the support of their investment consultant and CERF’s staff to establish policies and procedures, make investment-related decisions, and monitor the investment program.
The Board, staff, and consultant meet formally each calendar quarter to review and discuss the investment portfolio in detail, with interim communication, as needed, between quarters.
The CERF Board’s objective is to develop, implement, and maintain an investment program that achieves the stated investment objectives in a prudent manner and over a long-term time horizon.
5.6
3.6
8.7
5.9
7.2
4.1
7.8
5.0
-5
0
5
10
15
20
1 Year 3 Years 5 Years 10 Years
Ra
te o
f R
etu
rn %
For the Periods Ending December 31, 2016
CERF Portfolio
Median Public Pension Fund
Total Portfolio Performance
Investments
Page 1
CERF Investment Portfolio Background and Objectives
CERF’s investment program’s main objective is to provide retirement income to the plan’s participants. The pension plan’s formal investment policy articulates the fund’s goals, objectives, and risk parameters, and states the importance of diversification, risk management and a long-term, strategic investment time horizon. The plan’s assets are invested in accordance with this policy.
Total Portfolio Asset Allocation
CERF’s investment portfolio is invested in each of the broad investment categories (stocks, bonds, and real estate), sub-asset classes (large cap stocks, small cap stocks, etc.) and geographic regions (US, non-US).
CERF’s investment program is overseen and monitored by the investment consultant, CERF’s internal staff, and its Board of Directors. The investment portfolio has a long-term focus, but it is adjusted, when appropriate, to reflect near-term risks and opportunities. Rebalancing takes place to keep allocations to various investments within the stated ranges defined in the investment policy. New assets classes are periodically added to the mix to enhance diversification.
The portfolio’s target asset allocation is 65% equity (stocks), 30% fixed income (bonds), and 5% real assets (real estate). The chart below depicts the pension fund’s asset allocation as of December 31, 2016:
Current Portfolio Allocation
Equity Investments
CERF invests in different types of equities (stocks) for the growth opportunities they provide. CERF’s portfolio currently has exposure to domestic stocks, international stocks, hedged equity funds, and private equity in different size categories (small, mid, and large capitalization), in different styles (value and growth) and with different investment management organizations.
Fixed Income Investments
CERF’s fixed income (bond) portfolio is in place to enhance diversification and provide liquidity and downside protection. The fixed income portfolio is also diversified and invested across the fixed income markets, with an emphasis on high quality bonds. The portfolio has exposure to various quality, sector, geography, and security types.
Real Assets Investments
Real estate investments provide an additional layer of diversification to the portfolio, as they behave differently than stocks and bonds.
CERF’s current allocation to real estate is achieved through a diversified real estate fund. The fund has exposure to different geographic locations and property types, while maintaining strict quality requirements for each property, including leverage limits and occupancy rates.
2016 Year in Review
2016 was a year of surprises. Financial market performance was shaped by unexpected changes in the global political landscape. The rising tide of global populism, increasing anti-trade sentiment, and unprecedented central bank monetary policy dominated the headlines. Behind the scenes, 2016 marked the seventh year of positive global economic growth. US markets outperformed non-US markets due to improving domestic economic activity and higher relative interest rates in the US. Although they lagged US markets, continued monetary support from global central banks helped the non-US markets deliver positive returns for the year.
In the US, both stocks and bonds advanced in 2016, driven by relatively low interest rates and a rebound in US corporate profits. The S&P 500 posted a record high in December as prices rose in anticipation of pro-growth policies promised by newly elected president Donald Trump. Mr. Trump’s focus on domestic spending and jobs spurred a rally in US small cap stocks with a domestic focus. Small cap stocks surged 14% following the November 8 election, resulting in a 21% gain for 2016, and making them the top performing asset class for the year.
Global markets closed out the year slightly higher, pressured by the strong US dollar. Emerging market assets advanced, posting their biggest rise since 2012, as China’s
Domestic Equity38%
International Equity14%
Long/Short Equity
9%
Private Equity
3%
Fixed Income
29%
Real Estate5%
Money Markets
2%
Domestic Equity International EquityLong/Short Equity Private EquityFixed Income Real EstateMoney Markets
Total Pension Fund Assets: $447,026,000

PLAN MEMBERSHIP AS OF JANUARY 1, 2016 Covered Payroll $391,801,920 Average Pay per Active Member $34,700
ACTUARIALLY DETERMINED CONTRIBUTION (ADC) Unfunded Actuarial Accrued Liability (UAAL) $191,615,641 Amortization of UAAL, with interest to mid-year* $ 17,230,362 Normal Cost, with interest to mid-year $ 21,516,004
Reduction in Normal Cost for Member Contributions $ 13,138,115
Annual Required Contributions $ 25,608,251 as a percent of payroll 6.54%
PLAN ASSETS Actuarial Value $448,784,038
Market Value $432,504,491 FUNDED STATUS
Entry Age Normal Actuarial Accrued Liability $640,399,679
Funded Ratios Funded Percentage on Actuarial Value of Assets 70% Funded Percentage on Market Value of Assets 68%
* Until July 1, 2011, the UAAL was being amortized as a level percentage of payroll over a 30-year period beginning January 1, 1995. As of July 1, 2011, the UAAL amortization was started fresh over a 20-year period. New components of the UAAL will be amortized over new 20-year periods as such components arise.
Actuarial
County Employees’

STATEMENT OF FIDUCIARY NET POSITIONDECEMBER 31, 2016
ASSETS
Cash $ 2,603,661
Receivables: Member contributions 436,858 Member prior service contributions 124,008 County contributions 2,841,169 Receivable for pending investment sales 2,741 Accrued interest and dividends 192,356 Total receivables 3,597,132
Investments, at fair value: Common stocks 163,005,692 Fixed income mutual funds 105,096,623 Hedge funds 65,363,779 International equities funds 63,867,125 Real estate fund 19,631,664 Private equity 13,537,091 Cash equivalents 13,397,836 Total investments 443,899,810
Invested securities lending collateral 54,540,361Other assets 2,001Capital assets, net of accumulated depreciation of $2,735,423 5,780,049
Total assets 510,423,014
LIABILITIES
Accounts payable 867,399Accrued defined contribution plan funding 3,133,484Other accrued expenses 89,027Unearned revenue 28,292Payable for pending investment purchases 349,637Collateral for securities on loan 55,185,126
Total liabilities 59,652,965
Net position – restricted for pension benefits $ 450,770,049
The notes to financial statements are an integral part of these statements and are available on CERF's website, or by contacting the CERF Administrative Office.
Retirement Fund
Financial Statements

STATEMENT OF CHANGES IN FIDUCIARY NET POSITIONFOR THE YEAR ENDED DECEMBER 31, 2016
ADDITIONS: Contributions: County receipts $ 20,329,625 By members 11,588,772 For members, paid by counties 2,142,332 Members, purchase of prior service 68,655
Total contributions 34,129,384
Investment income: Investing activities: Net appreciation in fair value of investments 17,194,233 Fixed income securities 2,534,327 Equity securities 3,999,849 Alternative investments 55,190 Other miscellaneous income 27,091 Total investment income 23,810,690 Investment expenses (2,452,505 )
Net income from investing activities 21,358,185
Securities lending activities: Income 450,323 Expenses, net (252,545) Net increase in fair value of re-invested collateral 10,745
Net income from securities lending activities 208,523
Total net investment income 21,566,708
Other income 5,287
Total additions 55,701,379
DEDUCTIONS: Benefits 28,423,305 Refunds of member contributions 3,037,078 Defined contribution plan matching contribution 3,133,484 Administrative expense 2,841,954
Total deductions 37,435,821
Net increase 18,265,558
Net position – restricted for pension benefits Beginning of year 432,504,491
End of year $ 450,770,049
The notes to financial statements are an integral part of these statements and are available on CERF's website, or by contacting the CERF Administrative Office.
Financial Statements
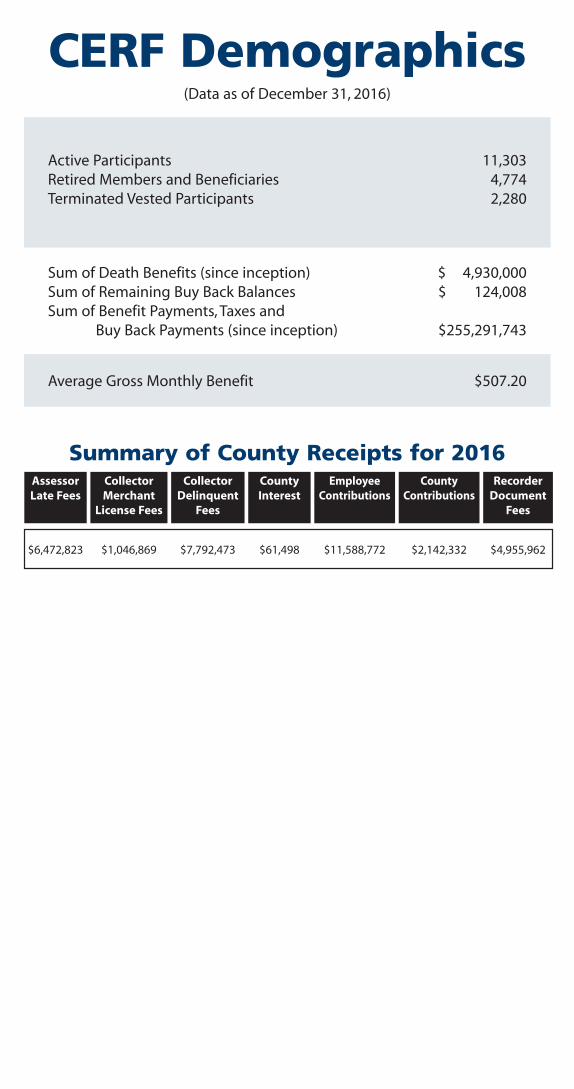
Sum of Death Benefits (since inception) $ 4,930,000Sum of Remaining Buy Back Balances $ 124,008Sum of Benefit Payments, Taxes and Buy Back Payments (since inception) $255,291,743
CERF Demographics(Data as of December 31, 2016)
Active Participants 11,303Retired Members and Beneficiaries 4,774Terminated Vested Participants 2,280
Average Gross Monthly Benefit $507.20
AssessorLate Fees
CollectorMerchant
License Fees
CollectorDelinquent
Fees
County Interest
Employee Contributions
County Contributions
RecorderDocument
Fees
Summary of County Receipts for 2016
$6,472,823 $1,046,869 $7,792,473 $61,498 $11,588,772 $2,142,332 $4,955,962