Embed Size (px)
Citation preview

Summary
This dissertation presents a cross-sectional survey exploring burnout in care staff working in dementia-registered residential homes in Cardiff. The aging population and anticipated prevalence of dementia makes this exploration of particular relevance. Stress and burnout among care staff working with people with dementia can result in greater sickness and worse care outcomes.
This survey analyses the responses of 163 staff to questions on dementia knowledge, attitudes and psychosocial stressors. The data are explored to reveal the underlying themes and concepts that are particular to this population.
These concepts are used to produce a model of burnout that has 3 facets, ‘Physical and Emotional Burnout’, ‘Work Burnout’ and ‘Resident Burnout’ and all 3 have ‘Stress’ as their core component. In addition, ‘Physical and Emotional Burnout’ is mediated through ‘Hopeful’ attitudes, while ‘Work Burnout’ and Resident Burnout’ are mediated through ‘Professional’ values.
Further variables associated with ‘Physical and Emotional Burnout’, include exposure to ‘Physical Violence’ in work and less ‘Time in Profession’. ‘Work Burnout’ was also associated with less ‘Time in Profession’ and ‘Resident Burnout’ was negatively associated with having ‘British Ethnicity/Nationality’.
The results of this survey indicate that stress is a central component to burnout as found in previous research. The factors found to mediate burnout also reflect current research on organisational engagement and positive psychological states.
The associations of ‘Time in Profession’, exposure to ‘Physical Violence’ and ‘British Ethnicity/Nationality’ are also relevant to this population and would benefit from further study to explore potential confounders.
Further research into burnout in this population, would benefit from assessment of the direction of causality for the above associations and this could be of use in evaluating interventions to improve these working environments.
Burnout remains an important concept to understand to improve the lives of both care staff and people living with dementia.


Dissertation
An Exploration into Burnout in Care Staff Working in
Dementia-Registered Residential Homes in Cardiff
Submitted by
David Mark Howells
2013
for
MSc Ageing, Health and Disease
Cardiff University
Cardiff, Wales
United Kingdom

Acknowledgement This dissertation has been the culmination of work that has involved a great number of people who have unconditionally offered their time, support and expertise. The origins of this work developed from the ‘Enhanced Dementia Care Project’, a Cardiff County Council-run scheme, funded through a ‘Promoting Independence and Well-being’ grant from the Welsh Assembly Government. Thanks should be given here to Jude Viney and her team for having the faith in my ability to evaluate the project and for providing support and guidance at every stage of the process of the survey development. Thanks should also be made to the project manager, Becky Vangasse for responding to my numerous e-mails on the minutiae of the questionnaire and care home engagement. The entire project team worked tirelessly to make the scheme a success and should be congratulated for maintaining their enthusiasm throughout. Thanks should also go out to the numerous key staff from the care homes that were enthusiastic for improving care for their residents and helped to design the questionnaire and distribute to their colleagues. Thanks also to those care staff responding to the survey, without whom, this evaluation would not have been possible. I hope this work helps you to understand your important role and the need to support each other in your very stressful occupation. Thanks to Dr Marion Gray and Dr Rhiannon Callaghan for their support and the opportunities to develop this project over more years than was originally envisaged! Thanks to Dr Stanley Zammit and Dr John Gallacher for their assistance in illuminating the dark arts of statistical analysis when this was most needed! A great deal of thanks go to my dissertation supervisor, Professor Antony Bayer who has given advice and clarity of thought on the project and provided direction for making the most of this experience. I would also like to thank Dr Win Tadd for suggesting this MSc course 5 years ago, while acting as celebrant for my daughter, Ariana’s naming ceremony. A big thank you to Ariana, who has ensured that my reading has not been too narrow over the course of the last few years. Also a special thank you to my wife, Samantha who has been a far greater support than either of us anticipated was needed and deserves special recognition for her wisdom and humour through a seemingly endless process. I do not know how I will repay you!

Dedication
To the centre of my world, Sam and Ari.

Contents
Chapter 1: Introduction 1
Chapter 2: Background 2
Introduction 2
Dementia 2
Dementia Demographics 3
Care Homes 4
Care Home Population of Older People 4
People Living with Dementia in Care Homes 4
Dementia Registered Care Homes 5
Difficulties in Care 6
Care Staff 7
Care Staff Characteristics 7
Care Staff Characteristics in Cardiff 9
Burnout 10
Consequences of Burnout 11
Factors Associated with Burnout 12
Demographics 12
Personality 14
Mental Health 15
Offensive Behaviour 16
Attitudes 17
Knowledge 18

Psychosocial/Organisational Factors 20
Preventing Burnout 23
Background Summary 25
Chapter 3: Aims and Research Hypothesis 26
Aims of Study 26
Research Hypothesis 28
Aims and Research Hypothesis Summary 28
Chapter 4: Methodology 29
Introduction 29
Design 29
Participants 30
Measures 30
Demographic Information 31
Copenhagen Burnout Inventory 31
Dementia Knowledge Questionnaire 32
Approaches to Dementia Questionnaire 33
Copenhagen Psychosocial Questionnaire 34
Data Analysis 35
Missing Data 35
Demographic Information 36
Descriptive Statistics 36
Exploratory Factor Analysis 36

CBI Associations 38
Logistic Regression 39
Ethical Approval 41
Methodology Summary 42
Chapter 5: Results 43
Introduction 43
Questionnaire Response 44
Demographic Variables 45
Psychometric Properties of Variables 47
Copenhagen Burnout Inventory (CBI) 47
CBI Descriptives 47
CBI Exploratory Factor Analysis 48
CBI Checking Assumptions 48
CBI Factor Extraction 49
CBI 3 Factor Model 50
CBI Summary 55
Dementia Knowledge Questionnaire (DKQ) 56
DKQ Descriptives 56
DKQ Exploratory Factor Analysis 57
DKQ Checking Assumptions 57
DKQ Factor Extraction 57
DKQ 2 Factor Model 58
DKQ Summary 62

Approaches to Dementia Questionnaire (ADQ) 63
ADQ Descriptives 63
ADQ Exploratory Factor Analysis 64
ADQ Checking Assumptions 64
ADQ Factor Extraction 65
ADQ 2 Factor Model 66
ADQ Summary 70
Copenhagen Psychosocial Questionnaire II (COPSOQ) 71
COPSOQ Exploratory Factor Analysis 71
COPSOQ Checking Assumptions 71
COPSOQ Factor Extraction 72
COPSOQ 3 Factor Model 73
COPSOQ: ‘Offensive Behaviour’ 77
COPSOQ Summary 78
Statistical Associations with CBI Factors 79
Demographic Associations 79
Covariate Associations 80
‘Offensive Behaviour’ Associations 81
Multivariate Analysis 82
Checking Assumptions 82
Logistic Regression Associations 83
Logistic Regression of CBI ‘Physical and Emotional Burnout’ 83
Logistic Regression of CBI ‘Work Burnout’ 87

Logistic Regression of CBI ‘Resident Burnout’ 90
Comparing Logistic Regression Burnout Models 93
Graphical Representations of the Burnout Models 94
CBI ‘Physical and Emotional’ Burnout Model 94
CBI ‘Work Burnout’ Model 96
CBI ‘Resident Burnout’ Model 98
Results Summary 101
Chapter 6: Discussion 102
Introduction 102
Critique of Background 102
Critique of Methodology 104
Copenhagen Burnout Inventory (CBI) 106
Dementia Knowledge Questionnaire (DKQ) 107
Approaches to Dementia Questionnaire (ADQ) 107
Copenhagen Psychosocial Questionnaire II (COPSOQ) 108
Demographic Information 109
Data Analysis 110
Critique of Results 111
Burnout as Determined by CBI 113
CBI Descriptives and Factor Analysis 114
Covariate Descriptives and Factor Analysis 117
Demographic Associations 119
Covariate Associations 120

Offensive Behaviour Associations 122
Explorations Using Logistic Regression 123
Logistic Regression of ‘Physical and Emotional Burnout’ 124
Logistic Regression of ‘Work Burnout’ 126
Logistic Regression of ‘Resident Burnout’ 127
Predicting Burnout 129
Discussion 130
Limitations of the Survey 130
Strengths of the Survey 132
Opportunities for Further Research 133
Implications for this Data 133
Implications for this Population 134
Implications for Research Theme 135
Discussion Summary 136
Chapter 7: Conclusion 137
Background 137
Methodology 137
Results: Descriptives 138
Results: Exploration 138
Results: Regression 140
Discussion of Burnout 142
Implications for Further Research 144

References 147
Appendix I 163
Questionnaire Information Leaflet 164
Questionnaire Booklet 167
Appendix II 187
Recoding Demographic Variables 188
Care Homes 189
Sex 189
Age 190
Marital Status 191
Children 192
Education 193
NVQ Level 194
Dementia Training 196
Job Status 197
Time in Current Job 198
Time in Profession 199
Shift Pattern 200
Hours Worked 202
Ethnicity/Nationality 204

Appendix III 205
COPSOQ: ‘Offensive Behaviours’ Frequency 206
Behaviour 207
Bullying: Frequency/Protagonist 207
Sexually Inappropriate: Frequency/Protagonist 208
Threats of Violence: Frequency/Protagonist 209
Physical Violence: Frequency/Protagonist 210

1
Chapter 1: Introduction
This dissertation will explore the concept of burnout of care staff working in dementia
registered residential homes in Cardiff, through a study involving a postal survey of
staff.
The importance of this subject area will be detailed in the background to this
exploration and will help to place the study within current understanding in this field.
The academic literature will be examined to understand the concepts likely to be
associated with burnout in this population and relevant key factors selected for
inclusion in the study. Difficulties in the measurement of these factors will also be
discussed along with the challenges faced in choosing appropriate psychometric
instruments to provide reliable estimates of the selected concepts.
The methodology for conducting the survey will be detailed and will additionally
describe the statistical methods used to assess the suitability of the instruments for
this purpose. The results obtained through following the above steps will enable a
greater understanding of the reliability and applicability of the instruments for each of
the desired concepts in this population.
The aim of this exploration is to produce a simple model to explain burnout, in terms
of the most significant concepts derived from a multivariate regression analysis. The
model of burnout resulting from this exploration will be assessed and the implications
for the participants and wider populations discussed.

2
Chapter 2: Background
Introduction
The background to this dissertation will detail the growing need for residential
dementia care due to ongoing demographic changes in the U.K. population. The
need for a highly skilled workforce in providing good quality dementia care will be
highlighted, including some of the difficulties experienced through caring for people
that may have behavioural difficulties.
The impact of these problems on care staff, including burnout, will be recognised as
well as the role that individual characteristics can play in modifying these. The
academic literature on burnout will be examined with key concepts identified that
influence burnout in comparable work environments.
Difficulties in implementing burnout interventions will be also be described, with
limited research having explored this area in general and this population in particular.
Dementia
Dementia is a term that is used to describe a pattern of neurological impairment,
typically involving deficits of cognition, not least memory. The term captures a
number of different diseases that affect the brain, with Alzheimer’s disease being the
most common, at an estimated 62% of cases (Knapp and Prince 2007). Many of
these illnesses become more prevalent with age, with 1 in 14 people over 65 and 1
in 6 people over 80 having some form of dementia (Knapp and Prince 2007).

3
Dementia Demographics
The ageing population in the U.K. has given rise to increased estimates of dementia,
with associated morbidity, mortality, carer stress and societal costs (Lakey et al.
2012). As the prevalence of dementia in Wales is anticipated to rise, changes in the
provision of services are needed to ensure optimal care for this vulnerable
population (See Figure 1. Knapp and Prince 2007). See also Figure 2. for U.K.
estimates of dementia prevalence from 2006 to 2051 (WAG 2009).

4
Care Homes
Care Home Population of Older People
In the U.K., around 400,000 people have their home as part of a residential complex,
(27,700 people in 1,164 care homes in Wales) equating to 2.8% of all people aged
over 65 years (BGS 2011; Knapp and Prince 2007). The reasons for living in a care
home are typically as a result of the individual needing increased support, a more
common occurrence with advancing age and co-morbid medical conditions. The
changing demographics of the U.K. population suggest that by 2031, 22% will be
aged over 65 and in the next 50 years, demand for care homes may increase by up
to 150% (BGS 2011).
People Living with Dementia in Care Homes
Cognitive impairment leading to difficulty with independent living has been viewed
as, “one of the biggest issues” in Wales (WAG 2011). It has been estimated that a
third to half of all people with dementia live in a care home and approximately 40% of
all care home residents have care needs as a result of dementia (BGS 2011; Knapp
and Prince 2007). Figure 3. illustrates the proportions of people in the UK with late
onset dementia living in residential care and in the community (Knapp and Prince
2007).

5
Dementia Registered Care Homes
The anticipated demands for residential accommodation suggest that increasing
numbers of people will have or develop dementia whilst in a care home. The ability
of these homes to meet the challenges of this population vary, however and 70% of
British geriatricians surveyed believed that management of dementia is sub-optimal
in care homes (BGS 2011).
In Wales, care homes that have a ‘dementia-registered’ status are expected to care
for residents with high levels of dementia-related morbidity (Cardiff County Council
2010). Many private care homes have been criticised as being unable to meet the
care needs of people with dementia, however, not least during episodes of
behavioural disturbance (Ballard et al. 2001).

6
Difficulties in Care
Complications of dementia can include both physical and psychological symptoms
that place significant demands on those carers looking after them. Some of the most
distressing and difficult to manage symptoms involve behavioural disturbance and
can include, “aggression… and psychosis… [with a] risk of 90% across the course of
the illness” (Banerjee 2009, p. 16-17).
The impact of these behaviours is considerable, with 65% of family carers reporting
being exposed to aggression and 16% of this occurring daily (O’Callaghan et al.
2010). It is significant cause of caregiver burden, distress and depression and can
directly result in institutionalisation (Black and Almeida 2004; De Vugt et al. 2005;
Miller et al. 2010).
In care homes, behavioural disturbance is estimated to be present in up to two thirds
of residents with dementia and in hospital, 73% of nursing staff on dementia wards
report having been assaulted (Boustani et al. 2005; O’Callaghan et al. 2010). It has
also been suggested that these behaviours adversely affect the health of care staff
and can increase the risk of burnout, however other studies have failed to find these
effects (Brodaty et al. 2003; Nagatomo et al. 2001; Schmidt et al. 2012)

7
Care Staff
Care Staff Characteristics
Caring for people with dementia is challenging and requires staff that have the
necessary skills to meet these complex demands. Care homes are usually privately-
run companies and vary in their environmental and organisational structure. They do
have common elements, however with care staff of varying grades and experience.
A care home will typically have a greater number of less qualified ‘junior’ staff (who
nonetheless may have extensive ‘hands-on’ experience), supervised by a more
qualified ‘senior’, not infrequently with a nursing background.
The nature and degree of dementia training of care staff is highly variable both within
and between care homes, however there are minimum standards and the care home
has a duty to prove to inspectorate services that they are capable of meeting their
residents’ needs (WAG 2004).
One description of the working conditions of ‘junior staff’ suggests that they, “work
long hours, are poorly paid, receive minimal benefits, and are prone to injury and
depression” and have insufficient training or support (Zimmerman et al. 2005, p. 96).
Other descriptions of assistants in nursing homes, have identified them as a
population particularly vulnerable to burnout, with high rates of turnover, low pay,
limited involvement in decisions and minimal autonomy (Gruss et al. 2004).

8
Greater stress has also been suggested for staff working with more cognitively
impaired residents as well as those on day shifts, where workload is high and with
part-time status (Brodaty et al. 2003). Increased care staff age and more experience
in nursing homes have also been associated with greater strain (relating to
behaviours associated with dementia) and greater age was also associated with
reduced job satisfaction in this sample (Brodaty et al. 2003).
Characteristics of the care homes associated with greater stress in workers include
larger size (greater than 16 beds) and specialised dementia care status, i.e. homes
likely to include people with greater needs relating to dementia (Zimmerman et al.
2005).

9
Care Staff Characteristics in Cardiff
The profiles of care staff and the care homes they work in are changing, not least
due to demographic, economic and service-driven needs. These profiles are also
changing considerably across Cardiff.
In 2008, there were 9 care homes registered for dementia care in Cardiff but with
only 151 of the 485 beds (31%) having the dementia registration (Cardiff County
Council 2008). A survey by Cardiff Local Authority noted wide variations of approach
in the delivery of dementia care, however all homes expressed the desire to develop
‘a person centred care’ model (Cardiff County Council 2008). Care homes in the
survey varied in their design and environment, with some being purpose-built and
others planning improvements and all had a unique mix of resident characteristics
and dementia care needs (Cardiff County Council 2008).
The survey recorded that 41% of care staff had NVQs (National Vocational
Qualifications) and 63% of these had NVQ level 2 (Cardiff County Council 2008).
30% of staff reported having had some form of dementia care training, however the
content of this varied from e-learning or in-house training to training from external
agencies (Cardiff County Council 2008). Staff turnover, consistency of approach
and openness to change were described as being heterogeneous between the
homes and 7 of the 9 Cardiff homes in the survey were specifically documented as
needing improvements in staff supervision (Cardiff County Council 2008).

10
Burnout
The care of people with dementia is recognised as being difficult and stressful,
particularly where behavioural problems are prevalent (Donaldson et al. 1996). For
informal or family carers, this is frequently termed ‘burden’, however in residential
settings, these stressors can contribute to a pattern of exhaustion, known as
‘burnout’ (Sorensen et al. 2006).
‘Burnout’ is considered to be a psychological response of a worker to chronic strain
in their job resulting in negative consequences for both employee and employer. It is
typically thought of as a state that affects people in the human service sector
(possibly as burnout was first described here) and inter-personal strain is placed
centrally to the concept (Borgogni et al. 2012).
Burnout, as described by Maslach (2003), is characterised by the worker
experiencing feelings of exhaustion, cynicism and inefficacy. These three
components are thought to arise through workplace stress, such as excessive
demands, interpersonal conflict and inadequate support (Maslach 2003). The result
is that workers reduce their efficiency to expend the minimum amount of physical
and psychological resources on their day to day tasks (Maslach 2003). The burnout
concept also allows for factors that reduce burnout, with ‘engagement’ being viewed
as key to initiatives that reduce work stress (Maslach 2011; Schaufeli and Salanova
2011).

11
The exact concept(s) that describe the phenomenon of ‘burnout’ are, however
variable, dependent on the model being used and continue to be in flux in the
academic literature on the subject (Cox et al. 2005). A central issue involves the
need to form a consensus on establishing burnout as a distinct concept specific to
employees and independent of exhaustion, stress or affective disorders (Cox et al.
2005). The need to establish burnout as a definitive state (i.e. present or absent) or
as a trait (present to varying degrees) is also outstanding (Cox et al. 2005).
Consequences of Burnout
Burnout has been suggested as predicting employee turnover, ill health and work
efficacy (Maslach et al. 2001). Severe burnout is estimated to be present in over 7%
of the working population in western countries and has major implications in terms of
social, psychological and economic costs (Shirom 2005).
One meta-analysis of studies showed correlations between employee burnout and
negative work performance, in particular relatiing to their role, the organisation and
customer satisfaction (Taris 2006). It has also been suggested that elements of
burnout can also be transferred between workers, through processes of ‘priming’ and
‘empathic identification’ (Bakker et al. 2007)

12
Factors Associated with Burnout
Burnout is believed arise out of an imbalance between the individual and their work
environment. Various models that have been used to understand burnout in the
work environment have examined factors relating to demands, autonomy, support,
justice and effort-reward imbalance (Borritz et al. 2010; Kristensen 2010). The
following sections summarise some of the factors thought to be relevant when
exploring burnout;
Demographics
Individual factors suggested as significant in burnout have included younger age,
male gender, single relationship status and working for less than 2 years (Maslach
2003; Milfont et al. 2008; Zimmerman et al. 2005). Other studies have considered
age to be a minor or inconsequential component in predicting burnout and female
gender to be associated with ‘personal’ burnout and male gender associated with
‘client-related’ burnout (on the Copenhagen Burnout Inventory or CBI scales,
comprising of ‘Personal’, ‘Work-Related’ and ‘Client-Related’ Burnout) (Borritz et al.
2005; Nagatomo et al. 2001; Shirom 2005).
Greater job satisfaction (negatively associated with burnout) has been reported for
those with greater training and in non-white care staff, although turnover is greater
for non-white workers (Rosen et al. 2011; Zimmerman et al. 2005).
Burnout has also shown some familial clustering, however twin studies have
favoured a shared environmental explanation, rather than genetic (Shirom 2005).

13
Other factors potentially related to burnout include ‘socio-economic status’
(supervisor status or advanced education), family status (cohabiting and children at
home), health related lifestyle (smoking, alcohol, exercise, weight) and illness
(Borritz et al. 2010).
Temporary workers have higher psychological distress and worse health outcomes
than permanent workers, as have shift workers compared with regular daytime
workers (Llorens et al. 2010). Working more than 40 hours per week and working
long (greater than 10 hour) shifts has been associated with affective disorders and
burnout (Albert et al. 2013; Llorens et al. 2010). Recovery time, both out of hours
and days off, has also been suggested as a protective factor for burnout (Sonnentag
2005).
Given the above research, including information on demographic factors and working
conditions in this survey may provide valuable information on burnout.

14
Personality
Personality factors have also been associated with burnout, particularly ‘neurotic’
personality traits, as well as those with less social and highly individualistic traits
(Gandoy-Crego et al. 2009; Shimizutani et al. 2008). Other associations with
burnout have included, “openness to changes and anxiety”, with non-burnt out staff
showing traits of, “emotional stability, liveliness, privateness and tension”
(Gustafsson et al. 2009).
The presence of personality traits acting as a confounder should be considered
however, as personality may influence the individual’s self-evaluation (of their
psychosocial work environment) rather than affecting ‘burnout’, such that people with
a negative outlook may hold more negative evaluations of their own coping and
health.
Neuroticism has also been considered a minor component in predicting burnout in
some studies, although this association was increased where the leadership was
based on an ‘autocratic’ style (De Hoogh and Den Hartog 2009; Shirom 2005). In
addition, those with a low ‘internal locus of control’ showed lower burnout where the
leadership style was ‘charismatic’ (De Hoogh and Den Hartog 2009).

15
Mental Health
Depression has been strongly associated with burnout and has also been suggested
as a potentially significant confounder in explaining many of its consequences
(Borritz et al. 2010; Shirom 2005). Taking account of this correlation when designing
burnout research studies has been recommended (Shirom 2005).
Of note, some psychometric instruments used to explore workplace psychosocial
factors (e.g. Copenhagen Psychosocial Questionnaire or COPSOQ (Long Version))
have recognised this confounder and include a section on ‘depressive symptoms’
and this has been significantly associated with sickness absence (Pejtersen et al.
2010).
Both the COPSOQ and the Copenhagen Burnout Inventory (or CBI) contain a
question based on ‘emotional exhaustion’ and this has also been associated with
depressive symptoms, while COPSOQ scales on ‘emotional demands’ were
positively associated and ‘meaning of work’ negatively associated with mental health
problems (Burr et al. 2010; Pejtersen et al. 2010). In other studies, organisational
injustice has been associated with depression (Andersen et al. 2010).
The direction of causality in these models suggest that workplace factors (notably
emotional exhaustion and job satisfaction) have stronger effects on mental health
than mental health does on workplace factors (De Lange et al. 2004).
A potential confounder for mental health problems and burnout, has been suggested
as workplace violence, with this predicting fatigue and emotional demands in
addition to depression (Burr et al. 2010).

16
Offensive Behaviour
Violence in the workplace is classed under a broad category of ‘Offensive
Behaviour’, which can be perpetrated by supervisors, colleagues, subordinates,
service users or other persons. These behaviours can be verbally or physically
aggressive, sexually inappropriate and/or bullying and are associated with greater
rates of turnover, sickness and reduced health and psychological well-being
(Clausen et al. 2012).
Offensive behaviour is reported as being more common in human service
occupations and particularly where the workforce is dominated by a majority of a
single gender, such as nursing (Clausen et al. 2012).
Nurses are an employee group that is frequently subject to verbal and physical
aggression and the frequency of these incidents are associated with burnout in
general, and with ‘depersonalisation’ (emotional distancing) in particular (Winstanley
and Whittington 2002).
One study of care home workers notes that the associations with turnover are
strongest for ‘bullying’ (commonly from colleagues and supervisors) but that these
effects are mediated to an extent by employee ‘well-being’ (Clausen et al. 2012).

17
Attitudes
Employee attitudes to their workplace is thought to have a number of aspects, not
least job satisfaction and organisational commitment, both of which are associated
with burnout (Clausen 2009; Judge and Kammeyer-Mueller 2012). Attitudes are also
viewed as having a good predictive value for intentions and subsequent actions,
proving a useful model for research into specific behaviours (Judge and Kammeyer-
Mueller 2012).
A concern for staff with burnout caring for people with dementia is that the elements
of depersonalization and cynicism could predispose to harmful attitudes that may
lead them to regard patients as objects (Lee et al. 2012). This psychological
distancing may be used as a coping strategy by the individual to protect themselves
against further stress, resulting in them performing tasks mechanically, rather than in
a person-centred manner, thereby avoiding therapeutic interactions, to the detriment
of both parties (Sonnentag 2005).
One study involving residential home care staff did not find associations between
depersonalisation or emotional exhaustion and the quantity or quality of staff-resident
interactions but did find improved interactions with greater ‘personal efficacy’ and
‘involvement in decisions’ (Jenkins and Allen 1998). Hopefully this suggests that the
potential outcome as described above, of cynicism and objectification of residents, is
an extreme and infrequent reaction.

18
Person-centred attitudes have been associated with job satisfaction, particularly
amongst, “staff working in newer facilities and those who feel better trained”
(Zimmerman et al. 2005, p. 102-3). It has also been noted, amongst informal carers
that hopeful attitudes have been associated with less burden and distress and
greater resiliency and social support (Cumming 2011).
Given the potentially important contribution to influencing both burnout and quality of
care, assessment of attitudes towards people with dementia should also be a key
component of this survey.
Knowledge
Dementia knowledge has been linked with attitudes to dementia and through this,
the behaviour of care staff towards people with dementia (Lintern 2001). Knowledge
about dementia has been shown to be highly variable between different grades and
occupations of healthcare employees as well as between specialties (Barrett et al.
1997).
Studies of informal carers have also shown that ‘irrational beliefs’ about dementia
predict depression in the carer, potentially through uncertainty about future
expectations of the illness (Graham et al. 1997). Carers with greater knowledge
were more likely to have reduced expectations of people with dementia and to make
positive comparisons, however they were also more likely to have increased anxiety
(Graham et al. 1997b).

19
The Dementia Knowledge Questionnaire (DKQ), used in the above studies has
received conflicting reports, with some studies failing to show either positive or
negative associations with carer stress (Goncalves-Pereira et al. 2010). Ethnic
differences in DKQ scores have also been seen, with older people of Indian origin
scoring lower on this test than a caucasian sample, in the general population
(Purandare et al. 2007).
Care staff working with people with dementia in care homes and day centres have
demonstrated better care and improved quality of life of their service users with
greater professional knowledge (Kazui et al. 2008). Educational support is
considered important in attaining this goal and educational interventions have been
shown to reduce burden, again in informal carers (Graham et al. 1997).
Knowledge of dementia is frequently assumed to be a vital component for any
professional training course into dementia care, however the evidence from
academic literature is somewhat weak. Dementia knowledge was therefore viewed
as an ‘intuitively’ important factor to include in exploring stress/burnout in care home
staff, however lacks an evidence base with which to anticipate outcomes.

20
Psychosocial/Organisational Factors
The strain of conflicts in employee ‘work-life balance’ has also been suggested as a
predictor of burnout, although the direction of causality may be bidirectional (Brauchli
et al. 2011). Stronger associations with burnout have been observed, however,
between the impact of demands of work on life, rather than life on work (Brauchli et
al. 2011; Fuz et al. 2008). Suggested interventions to address burnout may involve
changing work-related factors, such as reduced hours and increased flexibility and
autonomy over working patterns (Brauchli et al. 2011; Llorens et al. 2010).
Overall, workplace organisational factors, rather than individual characteristics have
been shown to be more significant in predicting burnout, and are thought to include,
“chronically difficult job demands, an imbalance between high demands and low
resources, and the presence of conflict” (Maslach 2003, p. 191).
This was also suggested through associations between stress and work intensity in
staff working in nursing homes, with protective effects described from ‘effective
coping strategies’ (Schmidt et al. 2012; Schmidt and Diestel 2013). Interviews with
nursing staff have also suggested that a source of stress may be related to
discrepancies between the work that staff felt was necessary and the resources that
they had been allocated to complete that work (Edberg et al. 2008).

21
High levels of burnout on all 3 of the CBI’s scales (‘Personal’, ‘Work-Related’ and
‘Client-Related’ Burnout) have been linked with ‘emotional’ and ‘quantitative
demands’, and ‘role conflicts’ and negatively associated with ‘meaning of work’
(Borritz et al. 2005). Elsewhere, ‘role conflicts’ were associated with increased
turnover, with ‘influence’ at work and ‘leadership quality’ reducing this risk (Clausen
et al. 2012).
Poor work ‘predictability’ has been correlated with high ‘Personal’ and ‘Work-Related’
burnout, while ‘emotional demands’ and reduced ‘role clarity’ were associated with
‘Work-Related’ and ‘Client-Related’ burnout (Borritz et al. 2005). Factors that have
been shown to be significant for only ‘Work-Related’ burnout include ‘work pace’,
poor ‘potential for development’, and poor ‘leadership’ (Ibid.).
Many of these factors represent a shift in understanding of organizational stressors
away from task and intensity related to that of inter-personal relationship based
understanding or ‘Social Capital’ (Kristensen 2010). Meaning at work, justice (or
equity) and job satisfaction are considered a key components of this concept and the
concept of ‘affective organisational commitment’, which has been negatively
associated with exhaustion and cynicism amongst nurses (Clausen 2009; Taris et al.
2002).
‘Affective organisational commitment’ has also been associated with employee well-
being, job performance and ability to cope with work stress and inversely associated
with turnover (Clausen 2009; Rosen et al. 2011). Interestingly, greater ‘meaning of
work’ and ‘quality of leadership’ have also been associated with greater ‘Personal’
burnout, potentially as a consequence of it being a protective factor for continuing
work despite higher levels of burnout (Borritz et al. 2005).

22
Leadership has been demonstrated as a vital component in the
psychosocial/organisational environment, with benefits suggested for styles that are,
‘participatory, supporting and/or fair’ and potential harms for styles that are, ‘laissez
faire, autocratic and/or abusive’ and this holds true for nursing homes (Castle and
Decker 2011; Wild et al. 2010; Llorens et al. 2010).
Nursing assistants in care homes that had ‘nonempowered environments’ described
more job-focused stressors than in ‘empowered environments’ and senior
supervision has been suggested as a key factor in retaining these staff (Bishop et al.
2008; Gruss et al. 2004). The benefits here also extended to the care home
residents with greater work commitment corresponding to improved quality of life and
greater satisfaction in their relationships with nursing staff (Bishop et al. 2008).
Further associations have been noted between nursing assistant job satisfaction and
having enough time to do their job, having a challenging role and having satisfactory
working hours (Bishop et al. 2009).
The psychosocial/organisational environment is therefore central to concepts of
workplace burnout and is to undergo further analysis in this project, although the
topic is substantially broad so as to require a clear focus.

23
Preventing Burnout
Some studies have noted that ‘burnout’ is changeable over time, suggesting that an
individual’s susceptibility to burnout is modifiable with the potential to improve well-
being and reduce sickness absence from appropriate interventions (Borritz et al.
2006).
Although research on interventions to reduce burnout is limited, it is suggested that a
combination of strategies to improve both personal and organisational characteristics
would be of greatest benefit (Maslach 2003). Other research has focused on
identifying individuals or even ‘clusters’ of workers at risk of burnout and of
developing targeted interventions based on their individual need (Maslach and Leiter
2008).
Maslach and Leiter (2008) distinguish between those with early warning signs
(significant exhaustion or cynicism), those at a ‘tipping point’ (significantly low
fairness scores) and those already in burnout (significant exhaustion and cynicism)
and makes suggestions for addressing these 3 states.

24
Many interventions have been shown to have no effect on burnout or to actually
have negative effects, particularly in workplace reorganisation where staff have no
active involvement (Anderson et al. 2010; Visser et al. 2008). Another study,
exploring the effects of an intervention in a large hospital, noted more negative
evaluations from staff, including of ‘leadership quality’, ‘supervisor support’ and
‘possibilities for development’ (Aust et al. 2010).
Another significant factor in this intervention, was of staff reporting reduced
‘emotional demands’, although this may be due to disengagement (a feature of
burnout) (Ibid.). The mechanism of these negative observations was considered as
a result of, ‘disappointing expectations’ (Ibid.).
Research into training and/or interventions for both burnout and dementia care is
sparse and very much needed, with some ‘positive psychology’ approaches showing
promise (Elliott et al. 2012; Meyers et al. 2012).

25
Background Summary
Dementia is becoming more prevalent in the U.K. due to the ageing population and
with it comes challenges for those caring for them, not least in care homes. The
amount of research literature on burnout in care staff is poorly representative of the
importance of this field given the morbidity and economic implications. There is
enough of a correlation, however between the available research in dementia care
homes and more generalised research on burnout, to be able to draw some
conclusions.
The academic research suggests that a combination of factors is involved in burnout,
with influence from both individual and organisational elements. This interaction of
factors can be difficult to disentangle and interventions to improve the workplace may
result in unintended negative consequences if inexpertly managed.

26
Chapter 3: Aims and Research Hypothesis
Aims of Study
Burnout of staff working in dementia-registered care homes has substantial
implications for maintaining a healthy and committed workforce, as well as for high
quality resident care. The aim of this study is to explore the burnout concept as it
relates to care staff working in dementia registered residential homes in Cardiff.
The academic literature, as described, identifies a number of individual and
organisational factors that have been linked to burnout. Some of these key factors
are used to examine burnout in this population, with selection based on their
importance to the burnout model and the burden on participants. The risk of
introducing ‘Type I’ statistical errors into the analysis due to excessive data collection
from limited participants is also acknowledged.
Demographic information of care staff has been linked to varying rates of burnout.
The aim for collecting this information is to explore these associations based on a
pragmatic ‘best-fit’ for responses to these questions, rather than theoretical
considerations.
The exploration of both burnout and the factors associated with burnout involves
identifying suitable, validated psychometric instruments to act as proxies for the
underlying concepts. As research in dementia-registered residential homes is
limited, the instruments selected may not have been validated for use in these
populations.

27
The instruments therefore need to be examined using exploratory statistical methods
to establish their factor (or subscale) construction, as determined by the participant
response patterns. These subscales are compared to those described in the
academic literature to assess the applicability of those concepts to this population.
The individual items within each of the subscales are also examined in order to
describe patterns that could reflect underlying concepts within the subscale. This
may be of particular relevance where subscale items for the population are divergent
from those expected to be found from the literature.
An examination of the instruments and demographic information relating to burnout
in this manner aims to provide an overview of the applicability of these factors to this
specific population. The main aim is to produce a burnout model (or models) that
best describe the burnout concept, using the demographic associations and the
derived factor constructs.
The aim of producing the burnout model (or models) is to explore the concept of
burnout through examining those factors found to reflect the underlying concepts for
burnout in this population. It is anticipated that this knowledge will be useful in
further understanding the burnout of care staff in dementia registered residential
homes in Cardiff. The strengths and limitations of the study will be acknowledged
and the information used to suggest further directions for burnout research in these
environments and for a more generalised population.

28
Research Hypothesis
The hypothesis of this research is that burnout, in care staff working in dementia
registered residential homes in Cardiff, varies with certain individual and
organisational factors. The academic literature suggests that dementia knowledge,
attitudes, job satisfaction, leadership, emotional demands and exhaustion are
associated with burnout, along with various demographic variables. This study will
explore the hypothesis that these factors are associated with burnout as described in
the literature and will produce a model (or models) that provide the most
parsimonious explanation of the variability of burnout with these associated factors.
Aims and Research Hypothesis Summary
The aim of this dissertation is to explore the concept of burnout as applicable to care
staff in dementia-registered residential homes in Cardiff. Selected demographic and
conceptual factors that have been suggested by the academic literature to be
associated with burnout will be examined to establish their applicability for use in this
population. These factors include dementia knowledge, attitudes, job satisfaction,
leadership, emotional demands and exhaustion, amongst others.
The hypothesis of this exploration is that through this process, a model will be
produced that explains the concept of burnout in terms of the most significantly
associated factors. The implications of the burnout model for this and other
populations will be discussed.

29
Chapter 4: Methodology
Introduction
This section will detail the methodology followed to explore the concept of burnout in
this population, as influenced by the academic literature on the subject. This will
include information on the design of the study and the process of recruitment, as well
as details of the measures felt to best reflect the variables under examination.
The construction of these measures will be explored to assess their validity and
reliability when used in previous research with comparable populations. The
statistical methods used in data analysis will also be described as this process is
central to understanding the data and its implications.
Design
The design of this observational study was a cross-sectional survey. The method
was a pseudoanonymised questionnaire to be returned by post.

30
Participants
The participants for this survey were care staff working in 18 dementia-registered
residential homes in Cardiff in 2010. Identification of the homes was through the
information resources available to Cardiff Local Authority (Cardiff County Council
2010). Engagement with the care home managers and/or senior staff was at events
organised as part of the ‘Enhanced Dementia Care’ project.
The recruitment of the participants took place in 2 phases, with ‘phase 1’ involving
recruitment from an initial 9 care homes and 6 months later, ‘phase 2’ involving a
further 9 care homes. This division was an artefact of the registration of dementia-
care status in the ‘phase 2’ residential homes only after the study had commenced.
Measures
The questionnaire used in the survey comprised of a number of validated
instruments that had shown good reliability in testing from previous research, as well
as selected demographic information. The outcome variable measuring ‘burnout’
was the ‘Copenhagen Burnout Inventory’. Co-variates used to explore the burnout
concept in this sample were the ‘Dementia Knowledge Questionnaire’, the
‘Approaches to Dementia Questionnaire’ and the ‘Copenhagen Psychosocial
Questionnaire II’.

31
Demographic Information
The demographic information requested from the participants included items that had
been suggested in the academic literature as being significant in assessing burnout
in care staff. The aim was to assess these variables further and to assist in adjusting
for confounding factors in later analysis.
Copenhagen Burnout Inventory
The Copenhagen Burnout Inventory or ‘CBI’ is a psychometric instrument designed
to explore the concept of ‘burnout’ in populations, with components that relate to
people in general (the ‘Personal’ burnout subscale), people in work (the ‘Work-
Related’ burnout subscale) and people in human service work (the ‘Client-Related’
burnout subscale) (Kristensen et al. 2005).
The CBI consists of 19 questions relating to ‘burnout’, answered on a 5-point likert
scale, scoring between 100 (‘Always’) and 0 (‘Never’) in 25-point increments, with 1
inversely scored question. ‘Personal’, ‘Work’ and ‘Resident’ burnout sub-scales
consist of 6, 7 and 6 questions, respectively (with Cronbach’s alpha scores of 0.87,
0.87 and 0.85), although answers have typically been positively skewed towards
lower burnout scores (Ibid.).
The core concept of ‘burnout’, as described by the CBI, relates to, ‘fatigue and
exhaustion’ (Ibid.). Using the CBI in a population of approximately 1900 workers
(with numerous professions in 7 different organisations and locations), both the
‘Personal’ and ‘Work’ burnout subscales show high correlations with a ‘Vitality’ scale
and good correlations with a ‘Mental health’ scale (Ibid.). .

32
All burnout sub-scales (but particularly ‘work’ related) were associated with job
satisfaction and also predicted frequency and duration of sickness absence, sleep
problems, intention to quit and use of painkillers (Ibid.). The greatest negative health
correlations have been found with ‘Personal’ burnout, while ‘Work-Related’ burnout
has had the greatest correlation with long term sickness absence (>9 days) (Borritz
2006; Borritz 2010). Of note, changes in burnout scores across time have also
predicted changes in sickness absence (Borritz 2006).
Dementia Knowledge Questionnaire
The Dementia Knowledge Questionnaire (DKQ) is a psychometric instrument
designed to test the knowledge that carers of people with dementia have about the
condition (Graham 1997). It consists of 4 sections relating to ‘Rudimentary
Knoweldge’, ‘Epidemiology’, ‘Aetiology’ and ‘Symptoms’, with maximum potential
scores of 3, 2, 6 and 8, respectively (Ibid.). The total score out of 19 can be sub-
divided into ‘Irrational Beliefs’ (for scores of 0 or 1 out of 3 on ‘Rudimentary
Knowledge’) and ‘General Knowledge’ (a total of the three other categories, out of
16) (Ibid.).
In interviews with 109 informal carers, higher scores on the ‘General Knowledge’
section of the DKQ was associated with, “lower levels of depression but… higher
rates of anxiety” (Graham 1997b, p. 934). Greater knowledge was also associated
with carer confidence and feelings of competence in care-giving (Graham 1997b).
Other significant carer attributes included having, ‘reduced expectations’ and making,
‘positive comparisons’ of the person with dementia (Graham 1997b, p. 933-934).

33
Approaches to Dementia Questionnaire
The Approaches to Dementia Questionnaire (ADQ) is a psychometric instrument
designed to explore the attitudes and behaviour of care staff towards people with
dementia (Lintern 2001). It consists of 2 scales, derived through factor analysis,
termed ‘Hope’ and ‘Personhood’, which require agreement/disagreement with
statements relating to dementia care, on a 5-point likert scale, scored 1 to 5 (Ibid.).
Total scores range from 19 to 95 and greater scores have been associated with
person-centred attitudes to dementia care style (Ibid.).
The ‘Hope Subscale’ consists of 8 statements (representing optimistic attitudes) and
the ‘Personhood Subscale’ consists of 11 statements (representing respect for
‘individual agency’), both with good internal reliability (Cronbach’s alpha of 0.76 and
0.85, respectively; total score 0.83) but with negative skewness i.e. greater numbers
of higher scores (Personhood > Hope) (Ibid.). Greater scores on the ‘Hope
Subscale’ have been linked with greater social engagement between staff and
residents with dementia, including, “purposeful activities” and “qualitatively better
physical care interventions” (Lintern 2001, p. 15).
There have also been associations between the ADQ and greater dementia
knowledge in staff, as well as observations of greater engagement with residents
(‘Hope Subscale’) and physical care (‘Personhood Subscale’) (Lintern 2001).

34
The ADQ questions were devised in consultation with, ‘experts in the field’ and were
piloted with 20 nurses/care assistants on a dementia care NHS ward before use with
123 care staff, of varying grade and experience, from 5 care homes across the U.K.
(Ibid.). This population is directly comparable to that under examination in Cardiff for
this survey and should therefore have good applicability.
Copenhagen Psychosocial Questionnaire
The Copenhagen Psychosocial Questionnaire II (COPSOQ) is a psychometric
instrument designed to explore the, ‘working conditions, health and well-being’ of
employees. It was developed and validated through surveying ‘representative’
samples of 1858 and 3517 Danish workers, respectively (Kristensen et al. 2002;
Pejtersen et al. 2010). The COPSOQ (Short version) consists of 40 questions,
covering 23 ‘dimensions’ that investigate job stress and satisfaction, and was
produced through reviews of existing questionnaires, theoretical discussions and
statistical analysis (Kristensen et al. 2002).
The questions typically consist of a 5 point likert scale, with responses scoring
between 0 and 4, with some scoring inverted. The dimensions were typically made
up of 2 questions on a particular subject, giving them a range of 0 to 8 points,
however the resulting scores for the 23 dimensions cannot be combined to make a
total score. Cronbach’s alpha scores for the dimensions were not provided for the
short version of the COPSOQ, apart from the work ‘predictability’ scale (0.74) (Ibid.).

35
COPSOQ has been used to explore sickness absence across 8000 randomly
selected Danish residents, with ‘Emotional Demands’ and ‘Role Conflicts’ at work
predicting greater incidence of annual sick leave of 3 or more weeks (Rugulies et al.
2010). Other studies using COPSOQ, in eldercare workers and nurses, have
shown that low scores on ‘Commitment to the Workplace’, ‘Meaning of Work’ and
greater ‘Emotional Demands’ are associated with greater long-term sickness and
intention to leave (Clausen et al. 2010; Li et al. 2010).
Data Analysis
Data collection, input and analysis were completed using SPSS Statistics package
versions 18 and 20.
Missing Data
The data from covariates and any associated subscales were included in the
analysis if the participant had completed at least half of the questions for the relevant
scale, otherwise the data from that section was considered missing. Where data
was missing, but accounted for less than half of the questions, the missing data was
computed using the participant’s mean score for the other questions in that section.

36
Demographic Information
Descriptive statistics were obtained for the demographic information in terms of
numbers and percentages of respondents. The information was then examined and
responders categorised into 2 or 3 divisions according to the most pragmatic split of
the data. This was to enable a sufficient number of participants in each category for
later analysis.
Descriptive Statistics
Descriptive statistics (mean, 95% CI, S.D.) were produced for the dependent (CBI)
and independent (ADQ, DKQ and COPSOQ) variables according to the original
instrument models to enable comparison to results from the academic literature.
Exploratory Factor Analysis
The variables (CBI, ADQ, DKQ and COPSOQ) were examined using exploratory
factor analysis, having first checked assumptions relating to the data including
correlations between items and communalities. Communality refers to the proportion
of the item’s variance that is shared with other variables in the model, with 0
representing no sharing and 1 representing complete sharing (Field 2005, p. 630).
The method of extraction and rotation for the exploratory factor analysis was chosen
based on the anticipated degree of correlation between the resulting factors, based
on descriptions from previous research on the variables.

37
Principle axis extraction with oblimin rotation was chosen where there was assumed
to be a significant correlation between the factors (e.g. for ‘burnout’) and principle
components extraction with varimax rotation was used where no correlation was
assumed.
Factor items that were low or double loaded on the pattern matrix of the analysis
were removed from the factor models. The final models were assessed using
Kaider-Meyer-Olkin (KMO) measure of sampling adequacy and Bartlett’s Test of
Sphericity to ensure that the factors were a good fit for the data. KMO values vary
between 0 and 1, with scores above 0.9 considered, “superb”, reflecting, “distinct
and reliable factors” (Field 2005, p. 640). Bartlett’s Test assesses the hypothesis
that there is no correlation between the items within the factors (i.e. making them
unreliable), with significant scores rejecting this hypothesis (Field 2005, p. 652).
The factors produced through this process were examined to assess for a coherent
underlying concept with each factor given a label to approximate this. Items that
comprised an extracted factor were used at a later stage of the analysis by
calculating the mean of the component items that corresponded to each factor at a
loading of > 0.4. This was done, rather than using factors derived from items
weighted according to loadings, due to the desire to have clearly identified factors
influenced only by items that strongly correlate. This method does increase the
degree of correlation between the non-weighted factors, however as they are not
being used in analysis to explain variance between each other, the potential for bias
is reduced.

38
The non-weighted factors’ properties were further assessed using Cronbach’s Alpha
to check for internal consistency (>0.7 being considered acceptable) within and
Spearman’s rho to check correlations between the factors (Field 2005, p. 668). This
was to ensure that the factors were suitable for further analysis of this population.
The normality of the factors’ data distributions were checked using the Shapiro-Wilk
test (a significant result confirming non-normal data), directing the statistical testing
that could be used for further analysis i.e. parametric or non-parametric.
CBI Associations
The statistical associations between the CBI factors and the other variables were
explored using non-parametric methods, namely Mann-Whitney U test for 2
categorical variables and the Kruskall-Wallis test for 3 categorical variables.
For the demographic and ‘Offensive Behaviour’ variables, associations were
explored using the 3 CBI factors, however for the covariates, the CBI factors were
transformed into bivariate variables. This was through classification of the factors
into ‘low’ or ‘high’ burnout based on roughly even numbers of responders in each
category and also enabled assessment of the burnout models using bivariate logistic
regression.

39
Logistic Regression
The statistical characteristics of the 3 CBI factors suggested that an appropriate
method of multivariate analysis would be logistic regression.
As logistic regression makes uses bivariate categorical values as the dependent
variable, the significantly associated categorical variables were cross-tabulated to
ensure a sufficient number of responders in each subsection (low numbers results in
large standard errors in the analysis) (Field 2005, p. 264).
The models were refined through an iterative process of ‘Backward: Likelihood Ratio’
logistic regression analysis to produce the most parsimonious model available (Field
2005, p. 227). The process involved retaining components that significantly
explained variance in the model and removing the items that were least statistically
significant one at a time.
The resulting models have a ‘B’ value and S.E., which are the ‘log-odds’ and
standard error for predicting the dependent variable form the independent variable.
The Wald (Chi-square) value and significance (2-tailed p value) tests the ‘null
hypothesis’ that the variable has no effect on the model. Exp(B) is the odds ratio of
the predictor and where the 95% C.I. (Confidence Interval) crosses 1, the reliability
of the variable is in question and its’ generalizability is limited (Field 2005, p. 254).
Classification tables for the logistic regression were produced, giving the
percentages of the ‘High’, ‘Low’ and ‘Overall’ burnout scores correctly predicted from
their respective model.

40
Once the final model had been established, outlying responses for ‘Standardized
Residuals’ and ‘Leverage’ were noted and a boxplot produced to represent the range
of values.
‘Standardized Residuals’ outliers represent responses in the logistic regression that
were a poor fit for the model, with values above 3 being of concern and those above
2.5 requiring closer examination (Field 2005, p. 246). ‘Leverage’ outliers represent
responses in the logistic regression that were excessively influential in the model,
with values greater than 0.03 (for 4 predictors in the model) or 0.025 (for 3
predictors) requiring closer examination (Ibid.). Further assessment or adjustment of
residual data was not attempted in this analysis.
The 3 burnout models, produced through logistic regression, were compared. The
‘Omnibus Test of Model Coefficient’ produced a Chi-squared statistic for each model
with a significance level, giving the probability of obtaining the statistic if the
combined influence of the independent variables had no predictive effect on the
dependent variables (Field 2005, p. 237). A significance of p<0.001 would be
considered highly significant, i.e. the null hypothesis would be highly unlikely.
The ‘Nagelkerke R Square’ values represent ‘pseudo R-square’ values to
approximate an explanation of variance that the independent variables have on the
model. The score ranges from 0 to 1, representing zero to a complete explanation of
the dependent variable by the model.
41
The 3 models were checked for multi-collinearity using the Tolerance test, (score
>0.1 excluding collinearity) to ensure that no one factor was having a
disproportionate effect on the regression model (Field 2005, p. 175). The goodness-
of-fit of the data was assessed using the Hosmer and Lemeshow Test with non-
significant scores suggesting that the model is a good fit for the data (Field 2005, p.
254).
The components of the burnout model were documented and the most significant
factors were represented graphically to enable observational assessment of the
relationships between the variables. Further graphical representations of key
variables from the model were shown where it was felt that this would help in
explaining the observed trends further.
Ethical Approval
Ethical approval was discussed during the initial stages and throughout the process
of designing the survey. The design was discussed with the Local Research Ethics
Committee who advised that this survey was part of a ‘Service Evaluation’ (as
opposed to research) and would therefore not require ethical approval. In addition,
the survey did not involve NHS personnel and only involved those willing and able to
complete the survey, with consent being implied by the returning of the questionnaire
booklet, clearly stating that the participant was under no obligation to do so (See
Appendix I.). The mandate for completing this survey was provided by the EDC
Project Group, who oversaw the progress of its design, production and delivery.

42
Methodology Summary
This section, on methodology has sought to describe the process used to explore the
concept of burnout in the population of care staff working in dementia-registered
residential homes in Cardiff. Demographic information on the responders has been
collected along with measures that have been demonstrated as being valid and
reliable for use in producing data on burnout and associated concepts.
The distributions and associations of these data were analysed as described and the
results of this analysis will be described in the following section.

43
Chapter 5: Results
Introduction
This section will detail the results of the survey in 3 broad sections; firstly respondent
characteristics, then factor analysis of psychometric instruments and finally
multivariate analysis using these variables to produce a prediction model of burnout.
Demographic information was collated, assessed and pragmatically split to form the
smallest number (typically 2) of roughly equal participant groups to aid later analysis.
Exploratory factor analysis was used to greater understand the psychometric
instrument properties by dividing the variable into independent (but frequently
correlated) factors based on groupings of questionnaire items. These derived
factors reflect underlying concepts from response patterns and it is because these
factors are highly specific to this population that they are used in later analysis.
A model for predicting burnout was then produced from further analysis of the
demographic information and covariate factors. This model explores the influence of
these factors according to those found to be most significant on logistic regression.

44
Questionnaire Response
Of the 531 questionnaires sent, 163 (31%) participants returned their questionnaires
in the pre-paid envelopes. Of these, 95 out of 235 (40%) were in ‘Phase 1’ and 68
out of 296 (23%) were in ‘Phase 2’. The response rates for individual care homes
ranged from 6% to 75% (2/34 to 18/24).
The majority of questionnaires were fully complete, although some responders did
miss individual items. Only 1 questionnaire was returned completely blank, however
some participants missed certain sections and these were treated as missing data.
45
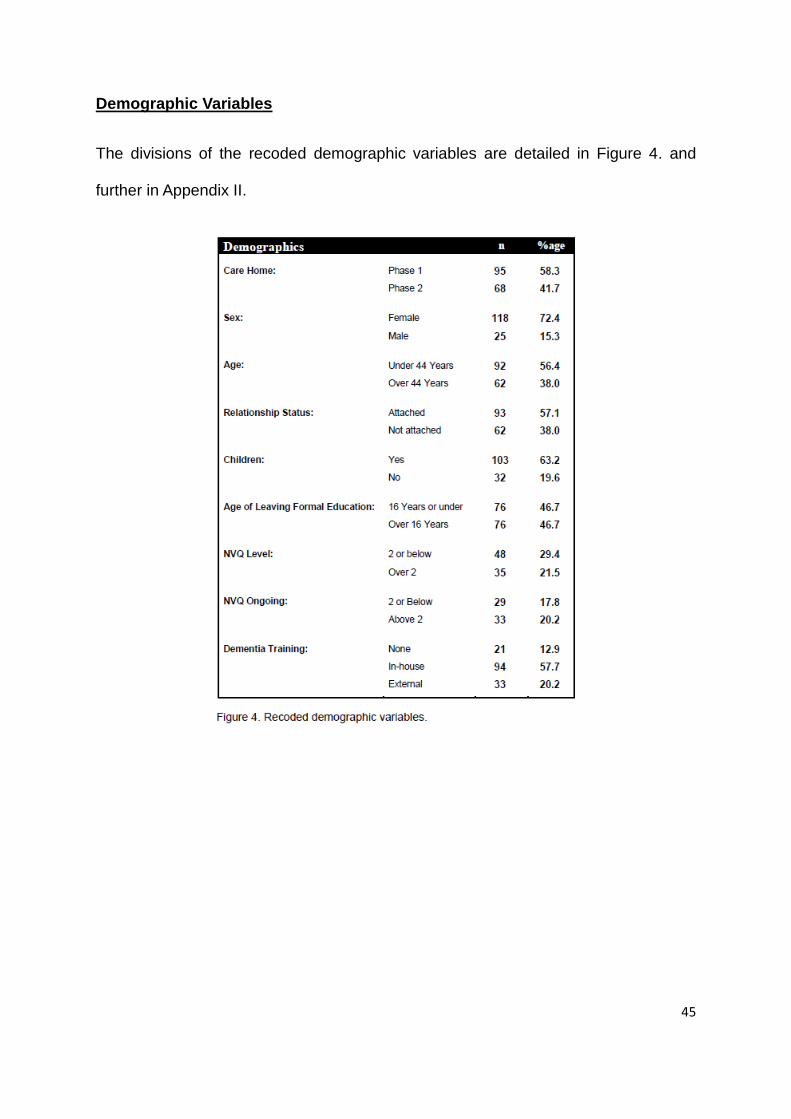
Demographic Variables
The divisions of the recoded demographic variables are detailed in Figure 4. and
further in Appendix II.

46
47
Psychometric Properties of Variables
Copenhagen Burnout Inventory (CBI)
The results from using the CBI to model participant burnout in this survey will be
explored. The descriptive statistics from an unmodified model of the CBI will initially
be detailed, with additional analysis being used to explore the concepts as applicable
to this population.
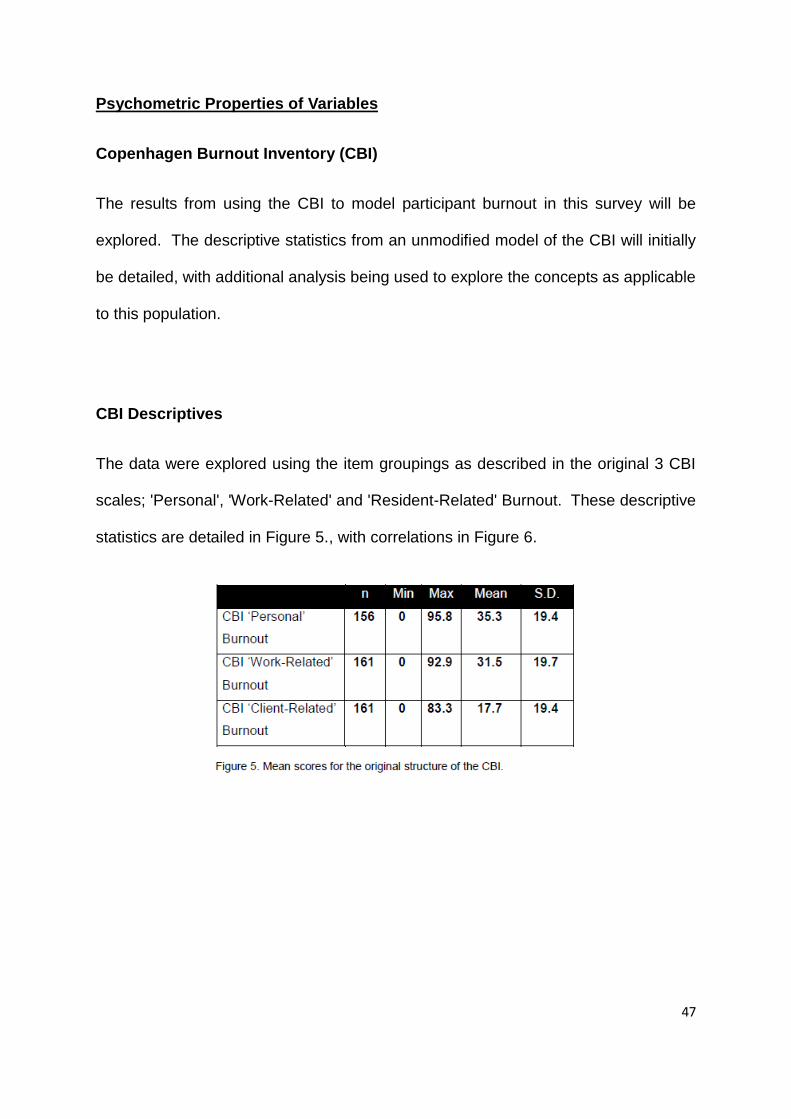
CBI Descriptives
The data were explored using the item groupings as described in the original 3 CBI
scales; 'Personal', 'Work-Related' and 'Resident-Related' Burnout. These descriptive
statistics are detailed in Figure 5., with correlations in Figure 6.

48
CBI Exploratory Factor Analysis
The conceptual dimensions underlying the CBI in this population were examined
using factor analysis, as it was felt that this would provide valuable information for
understanding burnout in this population. Exploratory factor analysis of the 19 CBI
items was performed using principle axis extraction with oblimin rotation.
CBI Checking Assumptions
Spearman’s rho correlations of the individual CBI items confirmed highly significant
(p<0.000) correlations between the majority of the items and all except one item
having significant (p<0.05) inter-item correlations. Communalities between the items
were all good (0.342 to 0.780) apart from one item (the same item as noted above),
scoring 0.141.

49
CBI Factor Extraction
The initial extraction of 3 factors was based on the 3 factor structure of the CBI,
using all 19 response categories giving a cumulative variance of 63.9%. Only one
category, ‘Resident’-related burnout, contained all the items corresponding to a factor
from the original research.
Further extraction was based on dimensions having eigenvalues greater than 1 and
the appropriateness of this method was checked using a scree plot (See Figure 7.)
as a visual tool to ensure this method did not over or under estimate the number of
applicable and relevant dimensions.
The components of the 3 dimensions were examined using a pattern matrix of the
extracted responses to identify items that had low loadings for all factors or dual
loadings greater than 0.4.

50
One of the response items (‘Do you have enough energy for family and friends
during leisure time?’) had a low loading on all of the 3 dimensions (highest value
0.261) and was the same item that did not fulfil the assumptions noted above and
was therefore excluded from the analysis.
This produced a pattern matrix that included an item (‘How often do you think: “I can’t
take it anymore”?’) that had a further item with low (<0.4) loadings and this was also
removed.
This resulted in a pattern matrix with one item (‘Do you feel that every working hour
is tiring for you?’) ‘dual-loading’ of >0.4 on 2 factors (0.455 for factor 1 and 0.428 for
factor 2) and this was removed.
Excluding these items increased the variance to 68.3% but increased the
correlations between factors (range: 0.419-0.556, compared with 0.356-0.547) (See
Figures 8. and 9.).
CBI 3 Factor Model
The final solution of 16 items in 3 dimensions proved to be a good model for the
data, as demonstrated by a Kaider-Meyer-Olkin measure of sampling adequacy of
0.914 and a Bartlett’s Test of Sphericity (Chi-Square) of 1502.235 (p< 0.000).
Factor 1 contained responses from 7 questions, comprised of 5 from ‘Personal’
Burnout’ and 2 from ‘Work-Related’ Burnout. Factor 2 contained all 6 questions from
‘Resident-Related burnout’ and factor 3 contained 3 questions from ‘Work-Related’
Burnout.

51
For ease of reference and as a summary of the components, factor 1 was labelled,
‘Physical and Emotional Burnout’ (or ‘P&E Burnout’); factor 2, ‘Resident Burnout’ and
factor 3, ‘Work Burnout’.

52
These 3 factors were used at a later stage of the analysis by calculating the mean of
the component items that corresponded to each factor at a loading of > 0.4 (See
Figures 10., 11., 12. and 13.).

53

54
The correlations between the weighted and non-weighted factors were examined,
showing excellent correlations (>0. 942) for the corresponding factors (See Figure
14.). Correlations between the 3 non-weighted factors were moderate to high,
reflecting the shared underlying concept of the 3 CBI factors.
Cronbach’s Alpha for the original 19 items of the CBI was 0.933 and for the 16 item
model, 0.929. For ‘Physical and Emotional Burnout’, Cronbach’s Alpha was 0.897;
for ‘Resident Burnout’, 0.882 and for ‘Work Burnout’, 0.837. These scores suggest
that the 3 factors have internally consistent responses and are therefore acceptable
to use in further analysis.

55
The distribution of the data was checked for normalcy through the Shapiro-Wilk test,
with all 3 of the CBI factors confirmed as having non-normally distributed data (See
Figure 15.). This pattern persisted despite transformation of the factors using log10,
square-root and reciprocal methods.
CBI Summary
The Copenhagen Burnout Inventory was assessed to explore its’ psychometric
properties, with 3 factors identified as being optimal through visual inspection of the
scree plot on exploratory factor analysis. Contributions to the 3 dimension model
were assessed and items removed for low or double loading.
The 3 dimensions were composed of a total of 16 items, explaining 68.3% of the
variance in responses and were labelled ‘Physical and Emotional Burnout’, ‘Resident
Burnout’ and ‘Work Burnout’. Questions highly loaded (>0.4) on each of the factors
were used to represent the factors in subsequent analysis.

56
Dementia Knowledge Questionnaire (DKQ)
The results from using the DKQ to assess the dementia knowledge of the
participants in this survey will be explored. The descriptive statistics from an
unmodified model of the DKQ scales will initially be detailed, with additional analysis
being used to explore the concepts as applicable to this population.
DKQ Descriptives
The data were explored using the item groupings as described in the original 2 DKQ
scales, 'Irrational Beliefs' and 'General Knowledge' (See Figures 16. and 17.).

57
DKQ Exploratory Factor Analysis
The conceptual dimensions underlying the DKQ in this population were examined
using factor analysis. Exploratory factor analysis of the 19 DKQ items was
performed using principle axis extraction with oblimin rotation.
DKQ Checking Assumptions
Correlations of the responses showed that most items had numerous significant
(p<0.05) correlations, however one item required exclusion due to lack of variance
(all participants correctly recognised poor memory as being a symptom of dementia).
DKQ Factor Extraction
The conceptual dimensions underlying the DKQ were examined using exploratory
factor analysis and extraction based on eigenvalues >1 suggested a 5 factor model.
The pattern matrix contained 4 ‘dual-loaded items’ however, and visual assessment
of the scree-plot strongly suggested a 2-factor solution (See Figure 18.).

58
The initial extraction of 2 factors, using all 18 response categories explained a
cumulative variance of 34.7% with factors divided broadly between causes and
symptoms of dementia. The component loadings of the 2 factors were examined to
exclude factors that had low or dual loadings, increasing the explained variance to
53.3% (See Figure 19.).
DKQ 2 Factor Model
The final solution consisting of 10 items in 2 dimensions proved to be a good model
for the data, as demonstrated by a Kaider-Meyer-Olkin measure of sampling
adequacy of 0.817 and a Bartlett’s Test of Sphericity (Chi-Square) of 494.332
(p<0.000)
All items from the ‘Irrational Beliefs’ subscale were excluded during the analysis
leaving factor 1 with responses from 6 items from the ‘General Dementia Knowledge’
subscale (1 item on epidemiology, and 5 items on symptoms).

59
Factor 2 contained 4 items from the ‘General Dementia Knowledge’ subscale (2
items on aeitiology and 2 items on symptoms). As the items of the extracted factors
had a slightly different emphasis on type of knowledge, factor 1 was labelled,
‘Symptom Factor’ and factor 2, ‘Aeitiology Factor’.
The correlation between the two factors was moderate to high (0.512) demonstrating
a small degree of independence between the underlying concepts of the factors.
The 2 extracted factors did not have underlying concepts that could easily be
identified to explain the division, however the pattern of responses suggests that the
‘Symptom Factor’ questions were more frequently answered correctly than the
‘Aeitiology Factor’ questions (See Figures 20., 21. and 22.).
The observation was made that the 2 factors may therefore represent a coherent
division in difficulty of knowledge, rather than the original division between ‘Irrational
beliefs’ and ‘General knowledge’.

60
The 2 factors were used at a later stage of the analysis by calculating the sum of the
component items that corresponded to each factor loading > 0.4.

61
The correlations between the weighted and non-weighted factors were examined,
showing high correlations (>0.902) between the corresponding factors (See Figure
23.). Correlation between the 2 non-weighted factors was moderate (0.543).
Cronbach’s Alpha for the original 19 items of the DKQ was 0.792 and for the 10 item
model, 0.827. For the ‘Symptom Factor’, Cronbach’s Alpha was 0.809 and for the
‘Aeitology Factor’, was 0.711. These scores suggest that the 2 factors have
internally consistent responses and would be considered acceptable to use in further
analysis.

62
The distribution of the data was checked for normalcy through the Shapiro-Wilk test,
with neither of the DKQ factors having statistically normally distributed data (See
Figure 24.).
DKQ Summary
The Dementia Knowledge Questionnaire was assessed to explore its’ psychometric
properties with 2 factors identified as being optimal through visual inspection of the
scree plot on exploratory factor analysis. Contributions to the 2 dimension model
were assessed and items removed where low or dual-loaded. The 2 dimensions
were composed of a total of 10 items, explaining 53.3% of the variance in responses
and were labelled ‘Symptom Factor and ‘Aeitiology Factor’. The 2 factors were not
clearly differentiated in their component items according to subject matter, but may
represent differences in the difficulty of the underlying question subsets. Questions
highly loaded (>0.4) on each of the factors were used to represent the factor in
subsequent analysis.

63
Approaches to Dementia Questionnaire (ADQ)
The results from using the ADQ to assess staff attitudes towards people with
dementia in this survey will be explored. The descriptive statistics from an
unmodified model of the ADQ scales will initially be detailed, with additional analysis
being used to further explore the concepts as applicable to this population.
ADQ Descriptives
The data were explored using the item groupings as described in the original 2 ADQ
scales, 'Hope' and 'Personhood'. These descriptive statistics are detailed in Figure
25. Spearman’s rho correlation between the two subscales was 0.243 (p=0.002,
n=155).

64
ADQ Exploratory Factor Analysis
The conceptual dimensions underlying the ADQ for this population were examined
using factor analysis. Exploratory factor analysis of the 19 items was performed
using principle components extraction with varimax rotation. This method was
chosen as previous research had demonstrated a low correlation between the
extracted factors, suggesting that the underlying concepts are largely independent of
each other.
ADQ Checking Assumptions
The independence of the dimensions was also noted when exploring correlations
between the items representing the suggested factors, with poorly significant
associations between many of the responses.

65
ADQ Factor Extraction
Extraction based on eigenvalues >1 suggested a 5 factor model, however the rotated
component matrix contained 4 ‘dual-loaded items’ and visual assessment of the
scree-plot strongly indicted a 2-factor solution (See Figure 26.).
The initial extraction of 2 factors, using all 19 response categories explained a
cumulative variance of 42.6%. The pattern of items corresponded to those
suggested by the authors apart from one item (‘It doesn’t matter what you say to
people with dementia as they forget anyway?’) that loaded more strongly on the
‘Hope’ subscale, than on the ‘Personhood’ subscale.
The component loadings of the 2 factors were examined using to exclude items that
had low loadings or dual loadings. 1 item was removed (‘It is important to have a
very strict routine when working with dementia sufferers’) for low loading (0.290),
increasing the explained variance to 44.0% (See Figure 27.).

66
ADQ 2 Factor Model
The final solution of 18 items in 2 dimensions proved to be a good model for the data
as demonstrated by a Kaider-Meyer-Olkin measure of sampling adequacy of 0.783
and a Bartlett’s Test of Sphericity (Chi-Square) of 861.73 (p<0.000).
Factor 1 contained 10 items, all from the ‘Personhood’ subscale, while factor 2
contained 7 of the 8 items from the ‘Hope’ subscale and 1 item from the
‘Personhood’ subscale. As the construction of the extracted factors broadly matches
the subscales as suggested by previous research, factor 1 will be labelled the
‘Personhood Factor’ and factor 2, the ‘Hope Factor’.
The correlation between the two factors was low (0.109) demonstrating a high
degree of independence between the underlying concepts of the factors.

67
The 2 factors were used at a later stage of the analysis by calculating the sum of the
component items that corresponded to each factor at a loading of > 0.4 (See Figure
28., 29. and 30.).

68

69
The correlations between the weighted and non-weighted factors, were examined,
showing high correlations (>0.982) between the corresponding factors (See Figure
31). Correlation between the 2 non-weighted factors was also low (0.185) and
indicates a good independence between the 2 factors.
Cronbach’s Alpha for the original 19 items of the ADQ was 0.799 and for the 18 item
model, 0.802. Cronbach’s Alpha for the ‘Hope Factor’ was 0.787 and for the
‘Personhood Factor’ was 0.818. These scores suggest that the 2 factors have
internally consistent responses and would therefore be considered acceptable to use
in further analysis.

70
The distribution of the data was checked for normalcy through the Shapiro-Wilk test,
with the ‘Hope Factor’ having statistically normally distributed data and the
‘Personhood Factor’ having non-normally distributed data (See Figure 32.).
ADQ Summary
The Approaches to Dementia Questionnaire was assessed to explore its’
psychometric properties with 2 factors identified as being optimal for exploratory
factor analysis. Contributions to the 2 dimensional model were assessed and 1 item
was removed due to a low individual loading. The 2 dimensions were composed of a
total of 18 items, explaining 44.0% of the variance in responses and were labelled,
‘Hope Factor’ and ‘Personhood Factor’. The factors had a low correlation,
suggesting the underlying concepts are likely to have a high degree of
independence. Questions highly loaded (>0.4) on each of the factors were used to
represent the factor in subsequent analysis.

71
Copenhagen Psychosocial Questionnaire II (Short Version) (COPSOQ)
The results from using the COPSOQ to explore the psychosocial work factors of the
participants in this survey will be explored. The descriptive statistics from an
unmodified model of the COPSOQ scales (covering 23 dimensions) will not be
detailed here as the results are poorly comparable with the additional analysis being
used to further explore the broad underlying concepts as applicable to this
population.
COPSOQ Exploratory Factor Analysis
The conceptual dimensions underlying the COPSOQ in this population were
examined using factor analysis. Exploratory factor analysis of the 40 COPSOQ
items was performed using principle axis extraction with oblimin rotation. This
method was chosen as there is assumed to be significant correlations between the
items given their ‘psycho-social’ content.
COPSOQ Checking Assumptions
Correlations of the items showed highly significant (p<0.001) associations between
many of the individual responses as well as numerous significant correlations
between the 23 dimensions.

72
COPSOQ Factor Extraction
An initial extraction of 23 factors was based on the 23 dimensions described in the
academic literature, using all 40 items. This model explained a cumulative variance
of 92.9%, however the 23 factors corresponded to the anticipated dimensions on a
small number of instances only and visual inspection of the scree plot from this
model suggested that a 3 factor model would be optimal.
Next, eigenvalues > 1 were used for extraction and resulted in a 10 factor model,
explaining 72.8% of the variance, but again the optimal model from visual inspection
of the scree plot was of 3 factors (See Figure 33.).
The 3 factor model, using all 40 items, explained 50% of the variance. Additional
analysis was performed to exclude items that had low or dual-loadings, increasing
the explained variance to 63.1% (See Figure 34.).

73
COPSOQ 3 Factor Model
The final solution consisting of 29 items in the 3 dimensions proved to be a good
model for the data, as demonstrated by a Kaider-Meyer-Olkin measure of sampling
adequacy of 0.917 and a Bartlett’s Test of Sphericity (Chi-Square) of 3393.709
(p<0.000). Factor 1 contained responses from 16 questions, factor 2, 8 questions
and factor 3, 5 questions. As a broad summary of the components, factor 1 was
labelled as, ‘Culture Factor’; factor 2 as, ‘Stress Factor’ and factor 3 as, ‘Professional
Factor’. The 3 factors showed a moderate degree of correlation, ranging from 0.179
to 0.416 (See Figure 35.).

74
The 3 factors were used at a later stage of the analysis by calculating the sum of the
component items that corresponded to each factor at a loading of > 0.4 (See Figures
36., 37., 38. and 39.).

75

76
The correlations between the weighted and non-weighted factors were examined,
showing excellent correlations (>0. 959) between the corresponding factors (See
Figure 40.). Correlations between the 3 non-weighted factors were variable
(between 0.299 and 0.660), indicating a limited degree of independence between the
underlying concepts.
Cronbach’s Alpha for the original 40 items of the COPSOQ II was 0.855 and for the
29 item model, 0.886. For ‘Culture Factor’, Cronbach’s Alpha was 0.957; ‘Stress
Factor’, 0.813 and ‘Professional Factor’, 0.855. These scores suggest that the 3
factors have internally consistent responses and would be considered acceptable to
use in further analysis.

77
The distribution of the data was checked for normalcy through the Shapiro-Wilk test,
with none of the COPSOQ factors having statistically normally distributed data (See
Figure 38.).
COPSOQ: ‘Offensive Behaviour’
COPSOQ II items relating to exposure to ‘Offensive Behaviour’ were not included in
the 3 factor model due to low loadings. The components of ‘Offensive Behaviour’,
(‘Sexually Inappropriate’, ‘Threats of Violence’, ‘Physical Violence’ and ‘Bullying’)
have been included here, however, due to their theoretical associations with burnout.
The majority of responses for all ‘Offensive Behaviour’ categories was either ‘No’ or
‘A few times’, indicating the behaviours are relatively rare, therefore the response
categories to exposure were classified as either, ‘No’ or ‘Yes’ (See Figure 42.). In
addition, approximately 90% of responders had never been exposed to bullying or
sexually inappropriate behaviour, such that further analysis may be compromised by
low numbers. See Appendix III. for a more comprehensive breakdown of results
relating to offensive behaviour.

78
COPSOQ Summary
The Copenhagen Psychosocial Questionnaire (Short Version II) was assessed to
explore its’ psychometric properties, with 3 factors identified as being optimal through
visual inspection of the scree plot on exploratory factor analysis. Contributions to the
3 dimension model were assessed and items removed where low or dual-loaded.
The 3 dimensions were composed of a total of 29 items, explaining 63.1% of the
variance in responses and were labelled, ‘Culture Factor’, ‘Stress Factor’ and
‘Professional Factor’. Questions highly loaded (>0.4) on each of the factors were
used to represent the factors in subsequent analysis.
Questions relating to ‘Offensive Behaviour’, whilst not included in the COPSOQ 3-
factor model, have been considered important in previous burnout research and
were therefore recognised as additional variables for inclusion in subsequent
analysis.

79
Statistical Associations with CBI Factors.
Demographic Associations
The 3 CBI-derived factors were explored for statistically significant differences
between the recoded groups of the demographic variables. Figure 43. details the
significance level of the associations and also lists the mean values of the burnout
factor according to the demographic group. The groups are termed ‘low’ or ‘high’
due to the differing terminology used for the groups in the demographic variables.

80
Covariate Associations
The 3 CBI-derived factors, were pragmatically divided into ‘high’ or ‘low’ scores to
facilitate exploring statistically significant differences between the factor-derived
scores for the covariates. As most (apart from ADQ ‘Hope Factor’) of the factors had
previously been demonstrated as being non-normal in distribution, Mann-Whitney U
tests were used throughout for a consistent and more conservative approach.
Figures 44. to 46. detail the significance level of the covariate associations and also
lists the mean values of the covariates according to the ‘high’ or ‘low’ burnout factor.

81
‘Offensive Behaviour’ Associations
Non-parametric tests of significance (Mann-Whitney U) using the presence or
absence of the COPSOQ: ‘Offensive Behaviours’ for each of the CBI factors was
performed. Figure 47. details the significance level of the associations and also lists
the mean values of the burnout factor according to the behaviour group.

82
Multivariate Analysis
Multiple regression analysis produced a model that best predicts care staff burnout.
The 3 CBI factors were used to construct 3 burnout models that had the most
‘parsimonious’ fit from the significantly associated variables.
Checking Assumptions
The 3 derived CBI factors, were used in turn as dependent variables. Assumptions
for using the 3 factors were checked, including the normalcy and homoscedasticity of
the spread of the data, such that linear regression could not be used for multivariate
analysis (Field 2005, p. 203). Logistic regression was therefore selected as an
appropriate method of analysis.

83
Logistic Regression Associations
Significant variables for each of the 3 CBI factors were used to estimate which
elements were likely to have a significant contribution to the logistic regression
models under exploration.
Logistic Regression of CBI ‘Physical and Emotional Burnout’
Figure 48. summarises the key variables associated with the CBI factor, ‘Physical
and Emotional Burnout’.

84
Figure 49. shows that there were an adequate number of responders according to
each category in the model, given that there were 3 categorical variables.
Figure 50. shows the logistic regression model for the CBI factor, ‘Physical and
Emotional Burnout’.

85
Figure 51. shows the classification table for this model in predicting ‘High’ or ‘Low’
CBI ‘P&E Burnout’.

86
Figures 52. and 53. show boxplots for Standardized Residuals and Leverage Values.

87
Logistic Regression of CBI ‘Work Burnout’
Figure 54. summarises the key variables associated with the CBI factor, ‘Work
Burnout’.
Figure 55. shows that there were an adequate number of responders according to
each category in the model, given that there were 2 categorical variables.

88
Figure 56. shows the logistic regression model for the CBI factor, ‘Work Burnout’.
Figure 57. shows the classification table for this model in predicting ‘High’ or ‘Low’
CBI ‘Work Burnout’.

89
Figures 58. and 59. show boxplots for Standardized Residuals and Leverage Values.

90
Logistic Regression of CBI ‘Resident Burnout’
Figure 60. summarises the key variables associated with the CBI factor, ‘Resident
Burnout’.
The categorical variables of ‘Welsh Nationality’, as well as ‘Sexually Inappropriate’
and ‘Bullying’ behaviours were excluded from further analysis due to low numbers of
responders in some of the subcategories. Figure 61. shows that there were an
adequate number of responders according to each category in the model, given that
there were 2 categorical variables.

91
Figure 62. shows the logistic regression model for the CBI factor, ‘Resident Burnout’.
Figure 63. shows the classification table for this model in predicting ‘High’ or ‘Low’
CBI ‘Resident Burnout’.

92
Figures 64. and 65. show boxplots for Standardized Residuals and Leverage Values.

93
Comparing Logistic Regression Burnout Models
The 3 models based on the CBI burnout factors and associated variables are
summarized in Figure 63.

94
Graphical Representations of the Burnout Models
CBI ‘Physical and Emotional Burnout’ Model
The CBI ‘Physical and Emotional Burnout’ model was explored graphically using the
variables previously found to be most influential in the model and these are shown in
Figures 67. to 69.

95

96
CBI ‘Work Burnout’ Model
The CBI ‘Work Burnout’ model was explored graphically using the variables
previously found to be most influential in the model and these are shown in Figures
70. to 72.

97
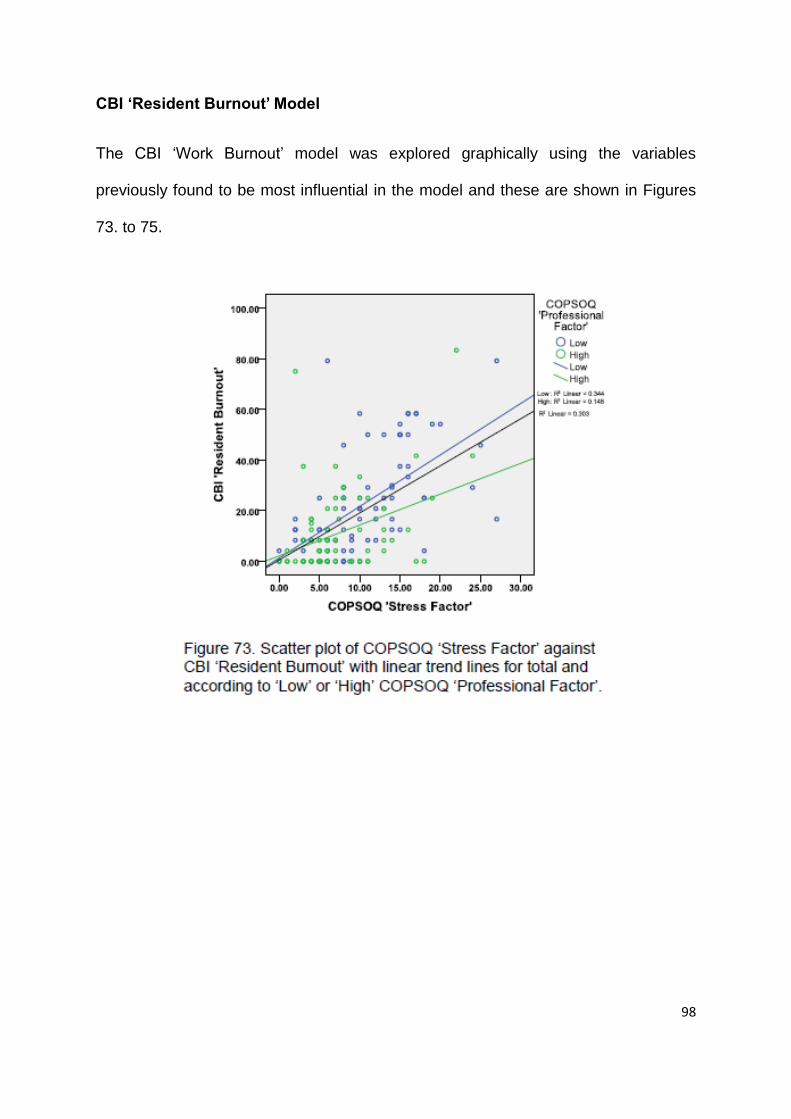
98
CBI ‘Resident Burnout’ Model
The CBI ‘Work Burnout’ model was explored graphically using the variables
previously found to be most influential in the model and these are shown in Figures
73. to 75.

99

100

101
Results Summary
The results section has described the analysis of data collected from a questionnaire
survey of care staff in dementia-registered care homes in Cardiff. The constructions
of the psychometric instruments have been explored and factors derived, based on
underlying concepts that are specific to this population.
The factors have included 3 separate measures of ‘burnout’ and these have been
analysed to establish significant associations with other factors and demographic
variables. These associations have been included in a process of logistic regression
to produce a ‘parsimonious’ explanatory model for each of the 3 burnout measures.
CBI ‘Physical and Emotional Burnout’ was best predicted by a model that included
covariate factors, COPSOQ ‘Stress Factor’ and ADQ ‘Hope Factor’, and the
variables, ‘Offensive Behaviour: Physical Violence’ and ‘Time in Profession’.
CBI ‘Work Burnout’ was best predicted by a model that included covariate factors,
COPSOQ ‘Stress Factor’ and COPSOQ ‘Professional Factor’ and demographic
variable, ‘Time in Profession’.
CBI ‘Resident Burnout’ was best predicted by a model that included covariate
factors, COPSOQ ‘Stress Factor’ and COPSOQ ‘Professional Factor’ and
demographic variable, ‘Ethnicity/Nationality’.
Further exploration was through identification of scatter-plot trends using the main
components detailed for the above logistic regression models.
The next section will discuss the implications of these results and reflect on the
process to guide further questioning for this population and beyond.

102
Chapter 6: Discussion
Introduction
This chapter discusses the aims, methodology and findings of the study, along with
an interpretation of how these results relate to the participating population. The
wider applicability of these findings will also be discussed and themes for further
research in this area suggested.
Critique of Background
The aims of this section were to identify in the academic literature, some of the
factors that have been associated with burnout in residential home staff caring for
people with dementia. Research into dementia in general and care home staff in
particular, however is sparse and under-represented given the impact of these issues
on both individuals and society.
The main outcome that this survey focused on was ‘burnout’. Consideration should
be given to this as a ‘difficult to define’ concept as reflected in the varying attempts at
its measurement. Many studies have examined burnout through psychological
testing, however an objective measure remains elusive. Both ‘trait’ and ‘state’
models of burnout have been used and both have been associated with negative
health and organisational outcomes.

103
Kristensen et al. (2005) have argued that the Maslach Burnout Inventory (the most
commonly used burnout measure), is made up of 3 independent elements (feelings
of ‘exhaustion’, ‘cynicism’ and ‘inefficacy’) and that these have differing antecedents
and consequences and do not measure the concept directly. In developing their
model of burnout (the Copenhagen Burnout Inventory), Kristensen et al. (2005)
used, ‘fatigue and exhaustion’ as the core concept, however this has been criticised
as being too narrow a focus.
In reviewing factors implicated in burnout from the academic literature, results were
frequently inconsistent or only indirectly applicable to this study population. Themes
relating to these burnout factors were incorporated into a theoretical model, and the
review highlighted a number of instruments that were suitable for use in the survey.

104
Critique of Methodology
The design of the study was a cross-sectional survey, using an anonymous postal
questionnaire, analysed through quantitative statistical methods. This methodology
has frequently been used to explore concepts in populations but it can also be
criticised for typically poor response rates. The cross-sectional nature also limits the
causal attributions of any significant associations.
Identifying information was not collected in the survey, possibly improving response
rates, but rendering follow-up and linkage of responses across time impossible.
Sufficient demographic information was requested, however, such that participants
might feel at risk of breach of confidentiality and exposure of responses, possibly
reducing response rates.
Collecting personally identifying information to follow participants over time, may in
this instance, have proved a greater incentive for response, providing a significantly
greater research benefit for comparatively little increased risk or burden.
The survey was part of a wider project (the ‘Enhanced Dementia Care (EDC)
Project’, run by Cardiff Council and funded by a Welsh Assembly Government grant)
evaluating staff in dementia registered residential homes in Cardiff. The population
was pre-selected and limited by the number and size of the eligible homes in Cardiff
alone. The survey methodology therefore represents a satisfactory compromise
between the needs of the EDC Project and those of this exploration of burnout.

105
The theory-based burnout model benefited from having a good selection of
demographic, psychosocial, attitudinal and knowledge-based questions, however
was not exhaustive. It lacked items specifically asking about mental health and
personality, both suggested in the literature as important (and potentially
confounding) variables. The model also lacked measures to capture the
organisational and environmental characteristics of the residential homes, including
the leadership style of senior staff.
Further assessment of the care homes, including objective measurements of care
staff behaviour, whilst desirable were impracticable due to issues of expense, time
and burden. The characteristics of the care homes were also changing rapidly over
the time of the survey, with potential issues of staff turnover and recruitment and
additional homes becoming registered for dementia care (and therefore becoming
eligible for inclusion, as demonstrated by the inclusion of ‘Phase 2’ care homes)
Another potential factor affecting response to the survey was the difference in
engagement with the care homes prior to issuing the questionnaire. This was also a
contributing feature of the EDC project, with some homes having attended a number
of meetings or additional training sessions prior to this survey, including collaboration
on the survey design. The method of survey dissemination may also have an
influence as the questionnaires were distributed through the care home managers.
Encouragement for staff to complete the survey would therefore differ between
homes, as would the staff response. No further prompts or reminders were issued
following distribution of the questionnaires. This process was followed due to
pragmatic reasons, however may have contributed to reduced response rates or
skewed the demographic/altered responses on the survey instruments.

106
Copenhagen Burnout Inventory (CBI)
The Copenhagen Burnout Inventory was designed by Kristensen et al. (2005),
through surveys of Danish workers, 40% of whom worked in institutions caring for
people with health needs, suggesting a comparable population.
Validated psychometric instruments to measure burnout are limited in number with
the CBI being selected as being desirable due to its 3 level construction that
addressed components of burnout based on the participant’s response to residents
as well as the work environment and more generalised stressors. It was felt that this
would result in an analysis that could differentiate the stress from working with
people with dementia from more generic work stress.
The CBI however, has been criticised for obscuring the difference between the
burnout concept and ‘simple’ fatigue (Schaufeli and Taris 2005). Also, whilst it is
based on a sound theoretical model, the CBI lacks validation through factor analysis.
Despite reservations with regard to all burnout measures, the CBI was used as a
suitable instrument with which to estimate burnout in this population.

107
Dementia Knowledge Questionnaire (DKQ)
The Dementia Knowledge Questionnaire was created by Graham et al. (1997), using
a population of informal carers in the U.K. The original research divided the 19 item
DKQ into 2 main components that corresponded to ‘Irrational Beliefs’ about dementia
and ‘General Knowledge’ of dementia, comprised of 3 and 16 items, respectively.
This division was achieved through examining correlations of carer responses, rather
than factor analysis and so the suitability for the DKQ to be used in this manner was
unconfirmed. The DKQ was also designed for informal carers, potentially limiting its
applicability, however it was felt to be a useful, short and acceptable instrument for
use in this context.
Approaches to Dementia Questionnaire (ADQ)
The Approaches to Dementia Questionnaire was created by Lintern (2001). It was
designed for staff working with people with dementia in care homes, therefore was
directly applicable to this survey population. The 2 original subscales of ‘Hope’ and
‘Personhood’ were derived through factor analysis of responses from dementia care
home staff and so were considered valid for the survey population. There is little
academic literature on the use of the ADQ to study burnout, however and this might
question its applicability in this context.

108
Copenhagen Psychosocial Questionnaire II (COPSOQ)
The Copenhagen Psychosocial Questionnaire was created by Kristensen et al.
(2002), using a generalised sample of the population in Denmark, across numerous
professions, including care staff working in residential and nursing homes.
The COPSOQ (Short Version) is comprised of 40 questions covering 23 dimensions,
however much of the published research has used the long version of the
questionnaire. The broad categories and many of the questions within the long and
short versions are identical and represent themes that are relevant for this study.
The use of a psychometric instrument of this complexity, along with other
instruments, in a survey of this size would lack the necessary power to have
confidence in the resulting outcomes, increasing the risk of a ‘Type I’ statistical error.
Factor analysis therefore provides an opportunity to reduce the dimensions to a
selection that can be both interpretable and reliably explain part of the variance in
responses.

109
Demographic Information
The demographic information requested on the questionnaire was a selection of
variables noted to be of interest from previous studies on burnout, during the
literature review. The large number (over 18) of these questions may be criticised as
being excessive, however the design of the study as an ‘exploration’ lends itself to
the inclusion of potentially non-significant variables.
Some questions may have been subject to unanticipated misinterpretation, resulting
in erroneous results; for example, the question on ‘number and ages of children’ was
repeatedly completed in an ambiguous fashion, suggesting the fault may lie with the
question itself (See Appendix I.). Questions that were not included, but might have
been useful were job title and characteristics of the work environment, however
these details may have been too intrusive in terms of participant identification.

110
Data Analysis
The choice of non-parametric statistical methods (Mann-Whitney U and Kruskall-
Wallis) for analysing associations, were appropriate given the non-normal distribution
of the CBI factors. Use of a logistic regression model, rather than parametric
alternatives, was also as a result of the non-normal distribution.
The CBI ‘Physical and Emotional Burnout’ factor most closely approximated normal
distribution and a greater number of participants might have demonstrated this,
enabling a multivariate linear regression model to be used. This model results in a
more accurate analysis of variance and would provide an improved model of
burnout.
The graphical representation of the factors in the regression model were used to aid
exploration of the factors only and were not statistically analysed and therefore
caution should be used before drawing conclusions from the observed patterns.

111
Critique of Results
The response rate for the questionnaire of 31% (range: 6% to 75% per home) was
low but not unexpected for a survey of this nature, with academic literature frequently
reporting response rates of below 50% (Borritz et al. 2005).
Engagement with the individual care homes was identified as a factor in encouraging
response and closer follow up and reminders may have increased these rates.
Engaging with the care staff directly, rather than through the care home manager,
may also have increased response rates, however the method used was selected
due to pragmatic factors.
Some care home characteristics in Cardiff had been collected in 2008, 2 years prior
to this survey and these can be compared to explore if the survey responses are
representative of this population (See Figure 77.). The results for NVQ levels 2 or 3
were comparable, however the percentage of staff trained in dementia care showed
marked improvements in 2010. This may highlight the growing recognition of the
need for dementia care training in care home staff over this time. It also illustrates
that the exploration of characteristics of care home staff is a ‘moving target’, with
differences not only within and between care homes, but also across time.

112
The response rates and actual numbers of responses for individual homes were
insufficient to provide enough data to enable comparisons between homes. Further
research exploring care home staff would benefit from a strategy to maximise the
number of responders.
Staff that did complete and return the questionnaires did not appear to have difficulty
in following the instructions and for the majority of responders were fully completed.
This indicates that the questionnaires were of a suitable complexity for this
population and were not too burdensome.
Most care staff were able and willing to disclose the requested demographic
information, although some questions received a low response rate, possibly due to
ambiguity in the interpretation of the question (e.g. number of children), non-
applicability (e.g. NVQ level working towards) or being visually unobtrusive (e.g.
Welsh Nationality).
The self-reported ethnicity/nationality of care staff was skewed towards a
predominantly British population, outnumbering the other nationalities at a ratio of
2:1 even when combined. This division for analysis was therefore based on
pragmatic, rather than theoretical factors and subsequent interpretation of the results
should take this into consideration. Further investigation of ethnicity as a factor in
care home research should involve a rigorous dissection of potential confounding
factors to avoid misinterpretation of findings.

113
Burnout as Determined by CBI
The CBI has been used in this survey as the dependent variable to measure
‘burnout’. It has been described as having ‘fatigue and exhaustion’ as its central
concept, and this has been variously viewed as its strength and weakness
(Kristensen et al. 2005; Schaufeli and Taris 2005). The literature does recognise
associations between the CBI and sickness frequency and duration, however the
construction of ‘burnout’ as a distinct entity remains elusive (Borritz 2006). For the
purposes of this survey, using the CBI as a proxy for ‘burnout’ is appropriate
although has limitations, as with all contemporary instruments.
The original research divided the 19 item CBI into 3 components that corresponded
to ‘Personal’, ‘Work-Related’ and ‘Client-Related' Burnout with a roughly equal
number of items in each category. The aim of this division was to produce 3
separate measures to explore burnout that could account for people that work in
different occupations or that do not have traditional models of employment. The
burnout sores derived from the original structure were initially calculated, however
the CBI items were later subject to exploratory factor analysis for the purpose of this
exploration.

114
CBI Descriptives and Factor Analysis
As noted in the academic literature, the response patterns for the CBI were skewed
towards positive (low burnout) responses and therefore demonstrated non-normal
distributions (Kristensen et al. 2005). Responses on the CBI scales for the survey
population were comparable to those for ‘Assistant Nurses’ in the literature for
‘Personal’ and ‘Work-Related’ Burnout, however the scores for ‘Client-Related’
Burnout were markedly reduced (See Figure 78.). This was an unexpected finding,
given the superficial similarities between the occupations of nursing assistants and
dementia care staff, however was a consistent finding across most of the 18
surveyed care homes and therefore should be considered valid.
It is plausible, that despite the intensive and demanding work by care staff in the
service of residents with complex needs, that staff do not attribute ‘working with
residents’ as being a source of their stress. The experience of stress for staff in
response to residents therefore warrants further exploration, however given that the
greatest degree of positive skew was found in ‘Client-Related’ Burnout, an
instrument with less of a ‘floor effect’ (i.e. a more normalised distribution of
responses) would be of benefit.

115
The ‘Client-Related’ Burnout scale was found, through exploratory factor analysis, to
be a valid construct with all 6 items found to contribute to the CBI factor. The
‘Personal’ Burnout scale increased to 9 items and the ‘Work-Related’ Burnout scale
was reduced to 3 items in their corresponding CBI factors. These changes reduced
the correlations between the old and new ‘Personal’ and ‘Work-Related’ Burnout
scales, suggesting that the new factors were describing more independent
underlying concepts than the original factors. The correlations were still in a range
that suggested a significant degree of overlap of the underlying burnout constructs,
however and were in-keeping with the academic literature.
The 3 new factors, labelled ‘Physical and Emotional Burnout’, ‘Resident Burnout’ and
‘Work Burnout’ demonstrated good internal reliability on Cronbach’s alpha, for use as
independent scales in further analysis.
It is notable that the ‘work-related’ questions included in ‘Work Burnout’ when
compared to the ‘work-related’ questions included in ‘Physical and Emotional
Burnout’ were more strongly associating ‘burnout’ during work as opposed to
‘burnout’ because of work (See Figure 8.). The category, ‘Work Burnout’ therefore
suggests a greater attribution of burnout to the work environment, potentially
explaining the differences in response to these items.

116
Forcing the components into a 2-factor model was considered and could be
achieved by combining most of the extra items into factor 1 and retaining the
‘Resident Burnout’ factor intact. This 2 factor model was not followed, however, as
the 3 factor model provided a greater explanation of the variance of responses
(68.3% versus 60.8%) and reduced correlations between factors, suggesting
additional insights into the dimensions of burnout in this population.
The analysis of the items showed that the underlying concept of ‘Physical and
Emotional Burnout’ was shared between the original categories of ‘Personal’ and
‘Work-Related’ Burnout. 3 of the questions in the original ‘Work-Related’ Burnout
dimension, however, did describe a concept independently of both the ‘Physical and
Emotional Burnout’ and ‘Resident Burnout’ categories.

117
Covariate Descriptives and Factor Analysis
Dementia attitude scores for total and original subscales (‘Hope’ and ‘Personhood’)
of the Approaches to Dementia Questionnaire were comparable between this
population and those used to validate the questionnaire. The derived factors from
the ADQ items were also very similar in structure, providing further evidence that the
questionnaire was an appropriate and valid instrument to use and response patterns
were in-keeping with previous research.
Scores on the Dementia Knowledge Questionnaire, with subscales as described in
the literature, for the care home staff were comparable to those informal carers in
contact with an Alzheimer’s support group. The care home staff scored higher
overall and on subscales than other informal carer groups.
Factor analysis resulted in a very different structure to the DKQ than that described
in the literature and this was understandable given the differing process of producing
the scales.
The scores for the Copenhagen Psychosocial Questionnaire for this population,
based on the original 23 dimensions, were not compared to those found in the
literature, due to the increased risks of statistical ‘Type I’ errors (i.e. false positive
comparisons).

118
The presence of the COPSOQ ‘Offensive Behaviours’ were noted however, with a
markedly higher prevalence in the study population than that from the original
research (See Figure 79.). This confirms the impression that care staff working in
dementia registered residential homes have exposure to ‘Offensive Behaviours’ that
is considerably above that expected for most occupations.

119
Demographic Associations
Non-parametric analysis was completed for the new CBI factors, according to the
recoded demographic variables. The outcomes were that;
‘Physical and Emotional Burnout’ was significantly associated with ‘Time in
Current Job’ (+ve association) and ‘Time in Profession’ (+ve).
‘Work Burnout’ was also significantly associated with ‘Time in Current Job’
(+ve) and ‘Time in Profession’ (+ve).
‘Resident Burnout’ was significantly associated with ‘Age of Leaving Formal
Education’ (+ve), ‘Time in Current Job’ (+ve), ‘Welsh Nationality’ (-ve). ‘British
Ethnicity/Nationality’ (-ve) and Dementia Training (+ve for in-house training).
These differing associations further support the view that the 3 derived factors are
describing different concepts that have different associations with the demographic
variables of this population. ‘Time in Current Job’ was a consistent association
across all 3 scales, however, suggesting that the general concept of burnout may be
more strongly related to duration exposed to a specific work environment, rather than
the occupation itself (i.e. ‘Time in Profession’).
Many of the demographic factors predicted to be significantly associated with
burnout from the academic literature were not shown to have this association in this
survey. These included age, gender, relationship status, general training, socio-
economic status (using ‘NVQ Level’ as a proxy) and working hours.

120
Demographic factors that were predicted to have associations with burnout and
could be viewed as having ‘connections’ to the above significant factors were
‘working for less than 2 years’ (‘Time in Job’ as a proxy), ‘non-white care staff’
(‘Ethnicity/Nationality’ as a proxy) and ‘advanced education’ (‘Age at Leaving Formal
Education’ as a proxy).
Demographic factors, predicted to be associated with burnout from the literature, that
were not explored in this survey were work-life balance conflict, health-related
lifestyle (smoking, alcohol, exercise and weight), illness and pay.
Covariate Associations
Non-parametric analysis was also completed for the derived covariate factors,
according to the 3 CBI factors, pragmatically divided into ‘High’ or ‘Low’ scores.
High ‘Physical and Emotional Burnout’ was significantly correlated with ADQ ‘Hope
Factor’ (-ve association), COPSOQ ‘Stress Factor’ (+ve), COPSOQ ‘Culture Factor’
(-ve) and COPSOQ ‘Professional Factor’ (-ve).
High ‘Work Burnout’ was significantly associated with ‘COPSOQ Stress Factor’ (+ve),
COPSOQ ‘Culture Factor’ (-ve) and COPSOQ ‘Professional Factor’ (-ve).
High ‘Resident Burnout’ was significantly associated with ADQ ‘Personhood Factor’
(-ve), COPSOQ ‘Stress Factor’ (+ve), COPSOQ ‘Culture Factor’ (-ve) and COPSOQ
‘Professional Factor’ (-ve).

121
Covariate factors anticipated to be associated with burnout from the academic
literature, that were not shown to have this association included the ‘dementia
knowledge’ scales from the DKQ.
Covariate factors that were predicted to have associations with burnout and could be
viewed as having ‘connections’ to the above were hopeful attitudes (ADQ ‘Hope
Factor’ as a proxy) and ‘meaning at work’ (COPSOQ ‘Professional Factor’ as a
proxy). ‘Professional Factor’ was decided on as a label for the COPSOQ factor,
however ‘Meaningfulness’ (of work) may also have been appropriate, but overlooks
the items from COPSOQ termed, ‘possibilities for development’.
Covariate factors, predicted to be associated with burnout from the literature, that
were not explored in this survey were personality (particularly ‘neurotic’ traits) and
mental health (particularly depression).
Other psychosocial characteristics that have been associated with burnout but not
specifically explored here include; organisational commitment, social capital, justice,
job satisfaction, involvement in decisions, autonomy and leadership style (although
the COPSOQ contains elements that are likely to be correlated with these concepts).

122
Offensive Behaviour Associations
Offensive behaviour is associated with workplace stress and is suggested as a factor
influencing burnout. Behaviours relating to this (‘Sexually Inappropriate’, ‘Bullying’,
‘Threats of Violence’ and ‘Physical Violence’) in the COPSOQ did not form part of the
derived factors but were variously shown to be associated with burnout on separate
analysis.
‘Physical and Emotional Burnout’ was positively associated with ‘Sexually
Inappropriate’ behaviours, ‘Threats of Violence’ and ‘Physical Violence’. ‘Work
Burnout’ was positively associated with all 4 forms of ‘Offensive Behaviour’, and
‘Resident Burnout’ was positively associated with ‘Sexually Inappropriate’ behaviours
and ‘Bullying’.

123
Explorations Using Logistic Regression
Binary logistic regression was completed for the 3 CBI factors, by comparing the half
of the responders scoring the lowest with those scoring highest on the particular CBI
scale. This method was followed due to the non-parametric response pattern for all
3 factors and was a pragmatic, rather than theoretical selection.
The associated demographic variables, covariate factors and ‘Offensive Behaviours’
were included in Backwards: Liklihood Ratio methods of regression and the least
significant items systematically removed to produce the most parsimonious model for
the data.

124
Logistic Regression of ‘Physical and Emotional Burnout’
Logistic regression of ‘Physical and Emotional Burnout’ with the associated variables
produced a model that included COPSOQ ‘Stress Factor’ and ADQ ‘Hope Factor’
contributing significant (p<0.05) items and ‘Physical Violence’ and ‘Time in
Profession’ contributing marginally significant (p<0.1) items. The predictive power of
this model was 83%.
Graphically exploring CBI ‘Physical and Emotional Burnout’ and COPSOQ ‘Stress
Factor’ with trend lines for high and low ADQ ‘Hope Factor’ (Figure 67.), shows a
slightly stronger association for those with high ‘Hope Factor’ scores. The pattern is
complicated by converging trend lines, however, with high ‘hope’ having lower
‘burnout’ scores for the equivalent ‘stress’.
Examining the pattern of correlation between ‘COPSOQ Stress’ and ‘ADQ Hope’
(Figure 68.), shows an overall inverse relationship, however this becomes a positive
correlation for those responders that were classified as being in the ‘high’ ‘Physical
and Emotional Burnout’ group.
This pattern, where factors anticipated to have a moderating effect on burnout
appear to correlate with increased stress, was also observed in some of the
academic literature where ‘meaning of work’ and ‘quality of leadership’ were
associated with ‘Personal Burnout’ on CBI. The suggestion was that these factors
help to maintain employees with high levels of burnout in work longer than expected,
resulting in this paradoxical effect. This concept of highly protective factors for
employees would be of significant interest for further study.

125
Figure 69. explores this relationship further, plotting ADQ ‘Hope Factor’ against CBI
‘Physical and Emotional Burnout’, with trend lines for pragmatically divided COPSOQ
‘Stress Factor’.
This shows a strong inverse correlation between ‘burnout’ and ‘hope’ for staff with
low ‘stress’, but negligible correlation for those with high ‘stress’. This may suggest
that ‘hope’ is no longer protective against burnout for highly stressed staff or that
those with low hope scores and high burnout scores do not continue in employment
and thereby skew the data.

126
Logistic Regression of ‘Work Burnout’
Logistic regression of ‘Work Burnout’ with the associated variables produced a model
that included COPSOQ ‘Stress Factor’ and COPSOQ ‘Professional Factor’
contributing significant (p<0.05) items and ‘Time in profession’ contributing a
marginally significant (p=0.053) item. The predictive power of this model was 79%.
Graphically exploring CBI ‘Work Burnout’ and COPSOQ ‘Stress Factor’ with trend
lines for high and low COPSOQ ‘Professional Factor’ (Figure 70.), shows a slightly
stronger association for those with low ‘Professional Factor’ scores.
Examining the associations between COPSOQ ‘Stress Factor’ and COPSOQ
‘Professional Factor’ (Figure 71.), shows an overall inverse correlation, with this
pattern being pronounced for those responders with higher levels of ‘Work Burnout’.
A similar pattern can be seen in Figure 72.
The above suggests that the moderating effect of ‘Professional’ values may have its
most significant effects for reducing stress in those employees most at risk of
burnout. The uncertainty with regard to the direction of causality for this assertion
should be taken into consideration, however.

127
Logistic Regression of ‘Resident Burnout’
Logistic regression of ‘Resident Burnout’ with the associated variables produced a
model that included COPSOQ ‘Stress Factor’, COPSOQ ‘Professional Factor’ and
‘British Ethnicity/Nationality’ contributing significant (p<0.05) items. The predictive
power of this model was 75%.
Graphically exploring CBI ‘Resident Burnout’ and COPSOQ ‘Stress Factor’ with trend
lines for high and low COPSOQ ‘Professional Factor’ (Figure 73.), shows a stronger
association for those with low ‘Professional Factor’ scores.
Examining the associations between COPSOQ ‘Stress Factor’ and COPSOQ
‘Professional Factor’ (Figure 74.), shows an overall inverse correlation, with this
pattern being greater for those responders with higher levels of ‘Resident Burnout’.
A similar pattern can be seen in Figure 75.
The above suggests that the moderating effect of ‘Professional’ themes may again
have its most significant effects for reducing stress in those employees most at risk
of burnout. The uncertainty with regard to the direction of causality for this assertion
should also be taken into consideration, however.
128
These charts do not account for the demographic variable, ‘British
Ethnicity/Nationality’, however. The categories were divided into ‘British’ or ‘Other’
due to the size of the ‘British’ category being more than double the size of all other
groups combined. This pragmatic step makes a gross generalization with regard to
characteristics of responders that were categorized as ‘Non-British’, however
dividing into smaller groups loses significance in statistical analysis.
Figure 76. compares CBI ‘Resident Burnout’ and COPSOQ ‘Stress Factor’ with trend
lines for ‘British’ or ‘Other Ethnicity/Nationality’ and shows a markedly stronger
association for those classed as having ‘Other Ethnicity/Nationality’.
Caution should be used when using a factor such as ‘ethnicity’ or ‘nationality’ to
directly compare measures of burnout, however as there may be cultural differences
in their perceptions and/or expression of stress (Liu et al. 2007). Given the diverse
ethnic backgrounds of the care home staff, these associations are likely to involve a
complex array of variables, and it would be a useful area for further research,
ensuring that clear objectives were set out for this topic.

129
Predicting Burnout
A frequent use of binary logistic regression analysis is in producing factorial models
that can be used to predict a certain outcome e.g. ‘low’ or ‘high’ burnout on the 3 CBI
scales. These results were not included in this discussion due to the questionable
validity and implications of such values. The 3 CBI scales were created as a highly
specific reflection of this population and therefore lacks evidence as to the predictive
value of having ‘low’ or ‘high’ burnout.

130
Discussion
Limitations of the Survey
The design of this exploration was a cross-sectional survey and as such takes a
‘snapshot’ at a specific time point without attempting to provide explanation or infer
causality. It also does not capture the ongoing changes in these organisations at a
time when care homes in Cardiff have been adapting to new challenges and
population demands.
The response rates to the survey were highly variable and more attention could have
been given to engaging staff directly, rather than via care home managers and also
in issuing reminders to all care homes. The responders may also have suffered from
selection bias in positively skewing the data, as those most engaged in the EDC
project may have been more likely to both respond to the questionnaire and have a
more optimistic outlook. This is an example of ‘common method variance’, which
acknowledges that confounders (such as negative outlook) can influence individual
responders to answer questions in a stereotypical manner. Also factors correlated
with burnout (e.g. exhaustion) may reduce responses from these groups or those
with high levels of burnout may have already left the workplace.
A greater response rate and therefore sample size may have enabled comparisons
between individual care homes, providing useful data on associations with burnout
and enabling greater correlation with environmental variables. Objective measures
of care would also have been of value in comparing levels of burnout with the
provision and quality of care. Qualitative methods could have been used to gain a

131
more subjective view of the issues relating to burnout and although the questionnaire
did have space for additional comments, this was only used by 5 responders.
The origins of this study (as part of the ‘Enhanced Dementia Care (EDC) Project’)
have also influenced the choice of survey population, the timeframe and the choice
of variables explored.
The survey design would have been more robust with a definitive hypothesis to test,
rather than as an exploration. The statistical analysis would therefore have used
techniques that assessed those assumptions in this population, rather than using the
data to produce a model of ‘best fit’. This analysis is therefore highly specific to this
population at this particular time and caution should be used when using this data to
make more generalised assumptions about similar populations.
Another difficulty in exploring burnout in organizations relates to the chronological
correlation of factors, given that even prospective studies tend to examine individuals
that already have significant exposure to the predicted stressors. Controlling for
baseline burnout has been criticised for this, as employees have potentially already
been exposed to the stressors and may have developed features of burnout as a
result with this effect being removed from the analysis (Borritz et al. 2005).
Without controlling for baseline burnout, more psychosocial variables reach the level
of significance but assumes that the factor had its greatest impact on burnout early
on in the individual’s work-life (Borritz et al. 2005). The exploration of burnout may
therefore require analysis across the entire course of individuals’ working lives to
decipher the interplay of psychosocial variables on burnout.

132
Strengths of this Survey
A strength of this study was the backing from the EDC project, without which the
survey would not have been possible. The EDC project was central in providing
opportunities to engage with the care home managers to authorise and distribute the
survey. The study attempted to provide a comprehensive overview of all care staff
that were employed in dementia-registered residential homes in Cardiff, therefore
this sample could be considered representative of this population at that time.
The number of variables under examination for this population was appropriate and
response rates were comparable with previous literature suggesting that it was not
excessively burdensome. Collection of demographic factors enabled further analysis
of the covariates and assisted in multivariate analysis of the data.

133
Opportunities for Further Research
This survey has contributed to research in this population, an area that has a notable
lack of attention given its importance for current and future care of people with
dementia. A productive and healthy workforce is vital for providing these much
needed services and this survey shows that while there are significant levels of
burnout and stress that need addressing, there are also factors that have a
modifying effect and may even enable staff with high levels of stress to continue
working. Comparing these factors between individuals provides hope that
appropriately targeted interventions may change burnout for the better.
Implications for this Data
The data collected through this project has been analysed through exploratory
statistical methods. This analysis has not been exhaustive, however and further
analysis may provide additional insights into this population. The ‘goodness of fit’ of
the covariate models produced through exploratory factor analysis could be
assessed through ‘confirmatory factor analysis’ and burnout patterns could be further
assessed using ‘cluster analysis’. Exploring the covariates further as dependent
variables may also provide interesting results for this population in general and
specifically for exploring those factors found to have associations with burnout.

134
Implications for this Population
This survey has provided an insight into burnout in care staff in Cardiff dementia-
registered residential homes and could serve as a pilot to further examine this
population, with a greater emphasis on improving response rates. Future studies
could continue to assess burnout across time, through longitudinal studies, linking
responses of individuals to assess change and infer causality.
Other elements that could be explored would involve attempts to further sub-divide
the covariate factors or include additional instruments to explore the components
within the factors that are most significant, particularly amongst the ‘Stress’-related
items.
This survey could also influence future investigations, by suggesting a reduced
number of demographic variables and covariates to refine the burnout models.
Other factors that would be valuable to include in analysis would be individual
personality and mental health factors as well as additional organisational factors for
the care homes.
135
Implications for Research Theme
Research into dementia care staff in care homes is under-represented and worthy of
further analysis. There are significant opportunities in this field to have more in-
depth analysis of specific populations, to expand analysis to more care homes
geographically or to include all staff within the homes e.g. administrative or domestic
staff. Expanding investigations to include other populations, outside of the dementia
care home sphere may provide more generalizable results, however may lose focus
on the improving the care of people with dementia, which was the starting point for
this survey and the EDC project.

136
Discussion Summary
This discussion has commented on the strengths and weaknesses of performing a
survey on this population and detailed some of the challenges that face further
research in this area. A critical analysis of the theoretical background to the study
has outlined the key factors that are thought to influence burnout, an often nebulous
concept. The theoretical and practical limitations have been discussed to explain the
choices made in following the methodology as described.
The results and outcomes of the data analysis have been examined to try to
understand the stress that faces care staff working in this demanding profession.
The potential for interventions to improve levels of burnout has been noted and some
of the key variables influencing this concept have been discussed. The case for
prioritising much-needed research has been raised and, given the projected
demands for care homes in the future, this would appear to be a worthwhile venture.

137
Chapter 7: Conclusion
Background
Caring for the ageing population is resulting in more people living in residential
accommodation with approximately 40% having dementia-related needs (BGS
2011). Care staff in residential homes are at high risk of work related strain and
burnout, potentially leading to poor health and care outcomes for both staff and
residents (Schmidt and Diestel 2013; Bishop et al. 2008).
The academic literature identifies a number of individual and organisational elements
that have been shown to correlate with or predict outcomes from burnout.
Methodology
The aim of this project was to explore selected factors that are associated with
burnout in populations of care staff working in dementia-registered residential homes
in Cardiff.
This was achieved through the analysis of anonymous questionnaires, using
psychometric instruments validated as providing reliable data in comparable
populations.
The instruments were chosen to balance a robust exploration of the chosen factors
with minimal burden and as such required a necessary compromise in the elements
under examination.

138
A key focus for the survey was related to the highly specific occupation that this
population was comprised of i.e. care staff in residential homes looking after people
living with dementia. The survey therefore included questions on dementia
knowledge and attitudes as well as more general questions on psychosocial
elements.
Results: Descriptives
Comparing the Copenhagen Burnout Inventory (CBI) scores (using the original 3
structures) for this population with the original research showed that scores for
‘Personal’ and ‘Work-Related’ Burnout were comparable. Scores for ‘Client-Related’
burnout were substantially lower for the study population in this survey. The reason
for this is uncertain. Results for the covariate measures were also comparable,
although high exposure to ‘Offensive Behaviours’ was noted.
Results: Exploration
Exploring the Copenhagen Burnout Inventory (CBI) in the Cardiff care staff
population showed that 3 broad concepts emerged; a general stress component
labelled ‘Physical and Emotional Burnout’, a work stress component, ‘Work Burnout’
and a resident specific component, ‘Resident Burnout’. Of note, only the ‘Resident
Burnout’ concept matched the classification as intended by the authors of the CBI.
The covariate instruments were explored in a similar manner. Dementia knowledge
could be divided into 2 factors, however no obvious pattern in the descriptions of the

139
questions could be determined. The factors were used in further analysis based on
an assumption that they represented a division in the difficulty of the questions.
The division of dementia attitudes into 2 concepts largely matched the components
described in the academic literature. Very strong correlations between the factor
scores and those based on the literature were also described, further demonstrating
the usefulness of the Approaches to Dementia Questionnaire for this population.
Psychosocial factors were shown to have 3 core elements on exploratory analysis.
These elements were labelled, ‘Culture Factor’, ‘Stress Factor’ and ‘Professional
Factor’. The COPSOQ (short version) describes 23 ‘dimensions’ made up from
combinations of the original 40 items, however the sample size of the Cardiff care
staff population used was deemed insufficient to power an analysis using this
number of variables. The 3 factors were therefore made up of 29 items that showed
a reasonable loading (>0.4) on the factors.
4 of the 11 COPSOQ items discarded in this process included those related to
‘Offensive Behaviour’, variables highlighted in the academic literature as having
significant impacts on burnout and present in up to 40% of this population. These
incidents were felt to be worthy of further investigation and were included in analysis,
although the less frequent behaviours were not included in the models due to low
numbers.

140
Results: Regression
Further analysis of burnout was through dividing the survey population according to
those scoring in the upper or lower range of values on the outcome variables (the 3
derived CBI factors). Each variable underwent logistic regression using associated
demographic information, covariates and ‘Offensive Behaviours’ to produce the most
parsimonious model to explain the variance.
‘Physical and Emotional Burnout’ was found to be positively associated with ‘Stress’
and negatively with ‘Hopeful’ attitudes towards people with dementia. Having less
experience in the profession (<5 years) and being exposed to physical violence were
also predictive variables for ‘Physical and Emotional Burnout’.
‘Work Burnout’ was also found to be positively associated with ‘Stress’ and
negatively with ‘Professional’ values. Also of note was that having less experience in
the profession (<5 years) was also a predictive variable for ‘Work Burnout’.
‘Resident Burnout’ was again found to be positively associated with ‘Stress’ and
negatively with ‘Professional’ values. Also of note here, was that being ‘British’ was
negatively associated with ‘Resident Burnout’.

141
Of the 3 regression models, the variables explaining ‘Physical and Emotional
Burnout’ had the greatest predictive power followed by ‘Work Burnout’, then
‘Resident Burnout’.
This pattern was noted through the ‘Nagelkerke R Square’ score (approximate
variances of 62%, 44% and 39%, respectively), as well as the percentage scores
correctly predicted (83%, 79% and 75%, respectively). The ‘Hosmer and Lemeshow
Test’ demonstrated that the models were a good fit for the data and the ‘Collinearity
Statistic’ indicated that none of the variables in the models were disproportionately
influential.

142
Discussion of Burnout
Burnout on all 3 of the components, identified through factor analysis of the CBI, was
significantly associated with physical and emotional ‘Stress’. This finding is in
keeping with the literature on burnout, where the concept has been variously termed
‘strain’, ‘exhaustion’ or ‘fatigue’ (Kristensen et al. 2005; Masalach 2003; Borgogni et
al. 2012). Current opinion on burnout also recognises the influence of modifying
factors and each of the CBI components demonstrated this phenomenon.
‘Physical and Emotional Burnout’ was reduced through ‘Hopeful’ attitudes on the
Approaches to Dementia Questionnaire (ADQ) and may broadly correlate with
engagement (cynicism having been negatively associated with this) (Maslach 2011;
Schaufeli and Salanova 2011). Increasing ‘Hope’ was also, counter-intuitively
associated with higher levels of burnout and stress. This may be explained in some
cases, by staff continuing to work despite high levels of burnout due to the protective
effects of ‘hope’, as described with other positive psychological states (Borritz et al.
2005; Clausen 2009). It is also uncertain if these associations result from an
individual’s generally ‘hopeful’ attitude or is specific to attitudes towards people living
with dementia only and the effects limited to this particular survey population.

143
Both ‘Work Burnout’ and ‘Resident Burnout’ were reduced through positive
‘Professional’ values on the Copenhagen Psychosocial Questionnaire II (COPSOQ).
This corresponds to the positive effects of ‘meaning of work’, ‘commitment to the
workplace’ and ‘possibilities for development’ (Bishop et al. 2008; Borritz 2006;
Clausen 2009; Taris et al. 2002). Interestingly, the demographic variable, ‘Time in
Profession’ (< 5 years) was positively associated with both ‘Physical and Emotional
Burnout’ and ‘Work Burnout’ in the regression model but negatively in the
demographic associations. Greater experience has variously been described in the
literature as suggesting increased or reduced burnout (Brodaty et al 2003;
Zimmerman et al. 2005).

144
Implications for Further Research
This survey has demonstrated, through exploratory analysis, that the CBI can be
divided into 3 subscales or ‘facets’ of burnout that may help to explain this complex
phenomenon. The main finding of regression analysis was that the items comprising
the ‘Stress’ factor of the COPSOQ were the dominating factors associated with
burnout in each of the 3 facets explored.
This strong association with burnout, however was in each case mediated by
alternate associations (although noting that commentary on the direction of causality
is not supported by evidence from this study). These mediating ‘forces’ differed in
their composition between the 3 facets of burnout, giving further weight to the
suggestion that the ‘facets’ represent valid constructs and have the potential for
understanding burnout in the ‘real world’. It is notable that ‘Stress’ was the most
common and significant of the associations with all burnout scores, but that there
were differing modifying factors, indicating an exploration of ‘positive psychology’
influences may be beneficial for future research (Meyers et al. 2012).
These elements in the burnout models remain insufficient to fully explain the concept
of burnout in this population, however. There are a number of individual factors
highlighted by the academic literature that were not included in the model, such as
mental health and personality, and these may prove valuable in explaining these
concepts further. There are also likely to be a number of organizational and/or
environmental factors contributing to burnout, such as leadership style, present
across the care home sector, and these would benefit from further study also.

145
A further concept worthy of deeper exploration is that of the individual components of
the ‘Stress Factor’, to ascertain which items are of particular relevance for each of
the 3 burnout subscales.
The practical applications from exploring these concepts further may be through
workforce management or designing and implementing interventions. Research
may also have use in identifying individuals or care homes that have ‘outlying’
burnout characteristics (positive or negative) for guiding interventions and monitoring
change.
Ensuring a resilient and professional workforce to care for people with dementia in
residential homes is both necessary and desirable. Burnout brings with it
disadvantages in terms of cost and quality of resident care.
This exploration has re-iterated the themes from previous research that burnout is
highly linked with physical and emotional exhaustion and can, to a certain degree be
modified in staff members through hope and professionalism. Other elements
implicated in burnout from this study have been the length of time in profession,
exposure to physical violence and non-British nationality and all of these areas would
benefit from further exploration (see Figure 80.).

146

147
References
Albert N, Bryant J and Stimpfel A. 2013. Study: Long nursing shifts linked to burnout,
job dissatisfaction, negative patient assessments. Ed Management Feb, pp. 20-22.
Andersen I, Borritz M, Christensen K and Diderichsen F. 2010. Changing job-related
burnout after intervention – A quasi-experimental study in six human service
organizations. Journal of Occupational and Environmental Medicine 52:3, pp. 318-
323.
Aust B, Rugulies R, Finken A and Jensen C. 2010. When workplace interventions
lead to negative effects: Learning from failures. Scandinavian Journal of Public
Health 38:S3, pp. 106-119.
Bakker A, Westman M and Schaufeli W. 2007. Crossover of burnout: An
experimental design. European Journal of Work and Organizational Psychology
16:2, pp. 220-239.
Ballard C, Fossey J, Chithramohan R, Howard R, Burns A, Thompson P, Tadros G
and Fairbairn A. 2001. Quality of care in private sector and NHS facilities for people
with dementia: cross sectional survey. British Medical Journal 323, pp. 426-427.

148
Banerjee S. 2009. The use of antipsychotic medication for people with dementia:
Time for action. London: DoH.
Barrett J, Haley W, Harrell L and Powers R. 1997. Knowledge about Alzheimer
disease among primary care physicians, psychologists, nurses, and social workers.
Alzheimer’s Disease and Associated Disorders 11:2, pp. 99-106.
BGS. 2011. Report of a joint working party inquiry into the quality of healthcare
support for older people in care homes: A call for leadership, partnership and quality
improvement. London: British Geriatric Society.
Bishop C, Squillace M, Meagher J, Anderson W and Wiener J. 2009. Nursing home
work practices and nursing assistants’ job satisfation. The Gerontologist 49:5, pp.
611-622.
Bishop C, Weinberg D, Leutz W, Dossa A, Pfefferle S and Zincavage R. 2008.
Nursing assistants’ job commitment: effect of nursing home organisational factors
and impact on resident well-being. The Gerontologist 48:S1, pp. 36-45.
Black W and Almeida O. 2004. A systematic review of the association between the
behavioral and psychological symptoms of dementia and burden of care.
International Psychogeriatrics 16(3), pp. 295–315.

149
Borgogni L, Consiglio C, Alessandri G and Schaufeli W. 2012. “Don’t throw the baby
out with the bathwater!” Interpersonal strain at work and burnout. European Journal
of Work and Organizational Psychology 21:6, pp. 875-898.
Borritz M, Bultmann U, Rugulies R, Christensen K, Villadsen E and Kristensen T.
2005. Psychosocial work characteristics as predictors for burnout: Findings from 3-
year follow up of the PUMA study. Journal of Occupational and Environmental
Medicine 47:10, pp. 1015-1025.
Borritz M. 2006. Burnout in human service work – Causes and consequences. PhD
Thesis, National Institute of Occupational Health, Denmark.
Borritz M, Rugulies R, Christensen K, Villadsen E and Kristensen T. 2006. Burnout
as a predictor of self-reported sickness absence among human service workers:
Prospective findings from three year follow up of the PUMA study. Occupational and
Environmental Medicine 63, pp. 98-106.
Borritz M, Christensen K, Bultmann U, Rugulies R, Lund T, Andersen I, Villadsen E,
Diderichsen F and Kristensen T. 2010. Impact of burnout and psychosocial work
characteristics on future long-term sickness absence. Prospective results of the
Danish PUMA study among human service workers. Journal of Occupational and
Environmental Medicine 52:10, pp. 964-970.

150
Boustani M, Zimmerman S, Williams C, Gruber-Baldini A, Watson L, Reed P and
Sloane P. 2005. Characteristics associated with behavioural symptoms related to
dementia in long-term care residents. The Gerontologist 45:S1, pp. 56-61.
Brauchli R, Bauer G and Hammig O. 2011. Relationship between time-based work-
life conflict and burnout: A cross-sectional study among employees in four large
Swiss enterprises. Swiss Journal of Psychology 70:3, pp. 165-174.
Brodaty H, Green A and Koschera A. 2003. Meta-analysis of psychosocial
interventions for caregivers of people with dementia. Journal of the American
Geriatric Society 51, pp. 657-664.
Burr H, Albertsen K, Rugulies R and Hannerz H. 2010. Do dimensions from the
Copenhagen Psychosocial Questionnaire predict vitality and mental health over and
above the job strain and effort-reward imbalance models? Scandinavian Journal of
Public Health 38:S3, pp. 59-68.
Cardiff County Council. 2008. Enhanced Dementia Care Review. Cardiff, Local
Authority.

151
Cardiff County Council. 2010. Care Services Directory 2011-2012. Cardiff, Local
Authority.
Castle N and Decker F. 2011. Top management leadership style and quality of care
in nursing homes. The Gerontologist 51:5, pp. 630-642.
Clausen T. 2009. A study of the antecedents and consequences of affective
organizational commitment and experience of meaning at work. PhD Thesis,
University of Copenhagen.
Clausen T, Christensen K and Borg V. 2010. Positive work-related states and long-
term sickness absence: A study of register-based outcomes. Scandinavian Journal of
Public Health 38:S3, pp. 51-58.
Clausen T, Hogh A, Carneiro I and Borg V. 2012. Does psychological well-being
mediate the association between experiences of acts of offensive behaviour and
turnover among care workers? A longitudinal analysis. Journal of Advanced Nursing
doi: 10.1111/j.1365-2648.2012.06121.x.
Cox T, Tisserand M and Taris T. 2005. The conceptualization and measurement of
burnout: Questions and directions. Work & Stress 19:3, pp. 187-191.

152
Cumming J. 2011. Statistical modeling of caregiver burden and distress among
informal caregivers of individuals with amylotrophic lateral sclerosis, Alzheimer’s
disease, and cancer. PhD Thesis, Colorado State University.
De Hoogh A and Den Hartog D. 2009. Neuroticism and locus of control as
moderators of the relationships of charismatic and autocratic leadership with
burnout. Journal of Applied Psychology 94:4, pp. 1058-1067.
De Lange A, Taris T, Kompier M, Houtman I and Bongers P. 2004. The relationships
between work characteristics and mental health: Examining normal, reversed and
reciprocal relationships in a 4-wave study. Work & Stress 18:2, pp. 149-166.
De Vugt M, Stevens F, Aalten P, Lousberg R, Jaspers N and Verhey F. 2005. A
prospective study of the effects of behavioural symptoms on the institutionalization of
patients with dementia. International Psychogeriatrics 17:4, pp. 577-589.
Donaldson C, Tarrier N and Burns A. 1996. The impact of the symptoms of dementia
on caregivers. British Journal of Psychiatry 170, pp. 62-68.

153
Edberg A, Bird M, Richards D, Woods R, Keeley P and Davis-Quarrell V. 2008.
Strain in nursing care of people with dementia: Nurses’ experience in Australia,
Sweden and United Kingdom. Aging & Mental Health 12:2, pp. 236-243.
Elliott K, Scott J, Stirling C, Martin A and Robinson A. 2012. Building capacity and
resilience in the dementia care workforce: A systematic review of interventions
targeting worker and organizational outcomes. International Psychogeriatrics 24:6,
pp. 882-894.
Field A. 2005. Discovering statistics using SPSS: Second edition. London: Sage
Publications.
Fuz I, Nubling M, Hasselhorn H, Schwappach D and Rieger M. 2008. Working
conditions and work-family conflict in German hospital physicians: Psychosocial and
organisational predictors and consequences. BMC Public Health 8:353
doi:10.1186/1471-2458-8-353.
Gandoy-Crego M, Clemente M, Mayan-Santos J and Espinosa P. 2009. Personal
determinants of burnout in nursing staff at geriatric centres. Archives of Gerontology
and Geriatrics 48, pp. 246-249.

154
Goncalves-Pereira M, Carmo I, Alves da Silva J, Papoila A, Mateos R and Zarit S.
2010. Caregiving experiences and knowledge about dementia in Portuguese clinical
outpatient settings. International Psychogeriatrics 22:2, pp. 270-280.
Graham C, Ballard C and Sham P. 1997. Carers’ knowledge of dementia and their
expressed concerns. International Journal of Geriatric Psychiatry 12, pp. 470-473.
Graham C, Ballard C and Sham P. 1997b. Carers’ knowledge of dementia, their
coping strategies and morbidity. International Journal of Geriatric Psychiatry 12, pp.
931-936.
Gruss V, McCann J, Edelman P and Farran C. 2004. Job stress among nursing
home certified nursing assistants: Comparison of empowered and nonempowered
work environments. Alzheimer’s Care Quarterly 5:3, pp. 207-216.
Gustafsson G, Persson B, Eriksson S, Norberg A and Strandberg G. 2009.
Personality traits among burnt out and non-burnt out health-care personnel at the
same workplaces: A pilot study. International Journal of Mental Health Nursing 18,
pp. 336-348.

155
Jenkins H and Allen C. 1998. The relationship between staff burnout/distress and
interactions with residents in two residential homes for older people. International
Journal of Geriatric Psychiatry 13, pp. 466-472.
Judge T and Kammeyer-Mueller. 2012. Job attitudes. Annual Review of Psychology
63, pp. 341-367.
Kazui H, Harada K, Eguchi Y, Tokunaga H, Endo H and Takeda M. 2008. Association
between quality of life of demented patients and professional knowledge of care
workers. Journal of Geriatric Psychiatry and Neurology 21:1, pp. 72-78.
Knapp M and Prince M. 2007. Dementia UK: A report into the prevalence and cost of
dementia. London: Alzheimer’s Society.
Kristensen T, Borg V and Hannerz H. 2002. Socioeconomic status and psychosocial
work environment: Results from a Danish national study. Scandinavian Journal of
Public Health 30, pp. 41-48.
Kristensen T, Borritz M, Villadsen E and Christensen K. 2005. The Copenhagen
Burnout Inventory: A new tool for the assessment of burnout. Work & Stress 19:3, pp.
192-207.

156
Kristensen T. 2010. A questionnaire is more than a questionnaire. Scandinavian
Journal of Public Health 38:S3, pp. 149-155.
Lakey L, Chandaria K, Quince C et al. 2012. Dementia 2012: A national challenge.
London: Alzheimer’s Society.
Lee H, Chien T and Yen M. 2012. Examining factor structure of Maslach Burnout
Inventory among nurses in Taiwan. Journal of Nursing Management doi:
10.1111/j.1365-2834.2012.01427.x.
Li J, Fu H, Hu Y, Shang L, Wu Y, Kristensen T, Mueller B and Martin H. 2010.
Psychosocial work environment and intention to leave the nursing profession:
Results from the longitudinal Chinese NEXT study. Scandinavian Journal of Public
Health 38:S3, pp. 69-80.
Liu C, Spector P and Shi L. 2007. Cross-national job stress: A quantitative and
qualitative study. Journal of Organizational Behaviour 28, pp. 209-239.
Lintern T. 2001. Quality in dementia care: Evaluating staff attitudes and behaviour.
PhD Thesis, University of Wales, Bangor.

157
Llorens C, Alos R, Cano E, Font A, Jodar P, Lopez V, Navarro A, Sanchez A, Utzel M
and Moncada S. 2010. Psychosocial risk exposures and labour management
practices. An exploratory approach. Scandinavian Journal of Public Health 38:S3,
pp. 125-136.
Maslach C, Schaufeli W and Leiter M. 2001. Job burnout. Annual Reviews in
Psychology 52, pp. 397-422.
Maslach C. 2003. Job burnout: New directions in research and intervention. Current
Directions in Psychological Science 12:5, pp. 189-192.
Maslach C and Leiter M. 2008. Early predictors of job burnout and engagement.
Journal of Applied Psychology 93:3, pp. 498-512.
Maslach C. 2011. Engagement research: Some thoughts from a burnout perspective.
European Journal of Work and Organizational Psychology 20:1, pp. 47-52.
Meyers M, van Woerkom M and Bakker A. 2012. The added value of the positive: A
literature review of positive psychology interventions in organizations. European
Journal of Work and Organizational Psychology doi:10.1080/1359432X.2012.694689

158
Milfont T, Denny S, Ameratunga S, Robinson E and Merry S. 2008. Burnout and
wellbeing: Testing the Copenhagen Burnout Inventory in New Zealand teachers.
Social Indicators Research 89, pp. 169-177.
Miller E, Rosenheck R and Schneider L. 2010. Caregiver burden, health utilities, and
institutional service costs among community-dwelling patients with Alzheimer
disease. Alzheimer’s Disease and Associated Disorders 24, pp. 380-389.
Nagatomo I, Akasaki Y, Tominaga M, Hashiguchi W, Uchida M and Takigawa M.
2001. Abnormal behaviour of residents in a long-term care facility and the associated
stress of care staff members. Archives of Gerontology and Geriatrics 33, pp. 203-
210.
O’Callaghan C, Richman A and Majumdar B. 2010. Violence in older people with
mental illness. Advances in Psychiatric Treatment 16, pp. 339-348.
Pejtersen J, Kristensen T, Borg V and Bjorner J. 2010. The second version of the
Copenhagen Psychosocial Questionnaire. Scandinavian Journal of Public Health
38:S3, pp. 8-24.

159
Purandare N, Luthra V, Swarbrick C and Burns A. 2007. Knowledge of dementia
among South Asian (Indian) older people in Manchester, UK. International Journal of
Geriatric Psychiatry 22, pp. 777-781.
Rosen J, Stiehl E, Mittal V and Leana C. 2011. Stayers, leavers, and switchers
among certified nursing assistants in nursing homes: A longitudinal investigation of
turnover intent, staff retention, and turnover. The Gerontologist 51:5, pp. 597-609.
Rugulies R, Aust B and Pejtersen J. 2010. Do psychosocial work environment
factors measured with scales from the Copenhagen Psychosocial Questionnaire
predict register-based sickness absence of 3 weeks or more in Denmark?
Scandinavian Journal of Public Health 38:S3, pp. 42-50.
Schaufeli W and Salanova M. 2011. Work engagement: On how to better catch a
slippery concept. European Journal of Work and Organizational Psychology 20:1,
pp. 39-46.
Schaufeli W and Taris T. 2005. The conceptualization and measurement of burnout:
Common ground and worlds apart. Work & Stress 19:3, pp. 256-262.

160
Schmidt S, Dichter M, Palm R and Hasselhorn H. 2012. Distress experienced by
nurses in response to the challenging behaviour of residents – evidence from
German nursing homes. Journal of Clinical Nursing 21:22, pp. 3134-3142.
Schmidt K and Diestel S. 2013. Job demands and personal resources in their
relations to indicators of job strain among nurses for older people. Journal of
Advanced Nursing doi: 10.1111/jan.12082.
Shimizutani M, Odagiri Y, Ohya Y, Shimomitsu T, Kristensen T, Maruta T and Iimori
M. 2008. Relationship of nurse burnout with personality characteristics and coping
behaviors. Industrial Health 46, pp. 326-335.
Shirom A. 2005. Reflections on the study of burnout. Work & Stress 19:3, pp. 263-
270.
Sonnentag S. 2005. Burnout research: Adding an off-work and day-level perspective.
Work & Stress 19:3, pp. 271-275.
Sorensen S, Duberstein P, Gill D and Pinquart M. 2006. Dementia care: Mental
health effects, intervention strategies, and clinical implications. Lancet: Neurology 5,
pp. 961-973.

161
Taris T, Kalimo R and Schaufeli W. 2002. Inequity at work: its measurement and
association with worker health. Work & Stress 16:4, pp. 287-301.
Taris T. 2006. Is there a relationship between burnout and objective performance? A
critical review of 16 studies. Work & Stress 20:4, pp. 316-334.
Visser S, Mccabe M, Hudgson C, Buchanan G, Davison T and George K. 2008.
Managing behavioural symptoms of dementia: Effectiveness of staff education and
peer support. Aging & Mental Health 12:1, pp. 47-55.
Welsh Assembly Government. 2004. National Minimum Standards for Care Homes
for Older People. Cardiff: WAG.
Welsh Assembly Government. 2009. National Dementia Action Plan for Wales.
Cardiff: WAG.
Welsh Assembly Government. 2011. National Dementia Vision for Wales. Cardiff:
WAG.

162
Wild D, Szczepura A and Nelson S. 2010. Residential care home workforce
development: The rhetoric and reality of meeting older residents’ future care needs.
Bristol: University of the West of England.
Winstanley S and Whittington R. 2002. Anxiety, burnout and coping styles in general
hospital staff exposed to workplace aggression: a cyclical model of burnout and
vulnerability to aggression. Work & Stress 16:4, pp. 302-315.
Zimmerman S, Williams C, Reed P, Boustani M, Preisser J, Heck E and Sloane P.
2005. Attitudes, stress, and satisfaction of staff who care for residents with dementia.
The Gerontologist 45:S1, pp.96-105.

163
Appendix I
Questionnaire Information Leaflet
Questionnaire Booklet

164
Questionnaire Information Leaflet

165

166

167
Questionnaire Booklet

168

169

170

171

172

173

174

175

176

177

178

179

180

181

182

183

184

185

186

187
Appendix II
Recoding Demographic Variables
Care Homes
Sex
Age
Marital Status
Children
Education
NVQ Level
Dementia Training
Job Status
Time in Job
Time in Profession
Shift Pattern
Hours Worked
Nationality/Ethnicity

188
Recoding Demographic Variables
In order to make best statistical use of the demographic variables, a pragmatic
approach to analysis was followed. The individual variables were examined and
separate groups clustered into the optimal number of items within each variable.
This number was typically 2 or 3 groups and was stratified in order to accommodate
the maximum number of responses in each grouping. This was to enable greater
statistical power when using the variables in multivariate analysis.

189
Care Homes
The division of care homes between ‘Phase 1’ (n=95) and ‘Phase 2’ (n=68) was kept
for the analysis. This was done on the assumption that the care homes in ‘Phase 1’
might be expected to have greater experience of dementia care, given that they had
been registered for dementia care for longer and a greater number of their key staff
had received additional training as part of the ‘EDC Project’ prior to the survey.
Care Home Frequency Percent
Phase 1 95 58.3
Phase 2 68 41.7
Sex
The divisions of sex between male (n=25) and female (n=118) were kept for the
analysis as they already represented a dichotomous variable.
Sex Frequency Percent
Female 118 72.4
Male 25 15.3

190
Age
The classification of age was stratified above or below 44 years, with 92 participants
aged 44 years and below and 62 participants aged above 44 years.
Age Frequency Percent
Under 44 92 56.4
Over 44 62 38.0
Age Frequency Percent
16-20 8 4.9
21-29 39 23.9
30-44 46 28.2
45-59 51 31.3
60+ 10 6.1
No Response 9 5.5

191
Marital Status
Marital status was classified as either attached (married or in a long term
relationship) (n=93) versus single (never married, divorced or widowed) (n=62)
status.
Marital Status Frequency Percent
Attached 93 57.1
Not attached 62 38.0
Marital Status Frequency Percent
Long Term Relationship 39 23.9
Married 55 33.7
Single, Divorced 21 12.9
Single, Never Married 33 20.2
Single, Widowed 7 4.3
No Response 8 4.9

192
Children
Participants were stratified according to if they did (n=102) or did not (n=32) state
that they had children.
Children Frequency Percent
Yes 103 63.2
No 32 19.6
No Response 28 17.2

193
Education
Participants were stratified according to whether they had formal education up to
(n=76) or beyond (n=76) 16 years old.
Age of leaving formal
education
Frequency Percent
16 or under 76 46.7
Over 16 76 46.7
Age of leaving formal
education
Frequency Percent
<15 Years 19 11.7
15-16 Years 57 35.0
17-18 Years 30 18.4
19-21 Years 20 12.3
22+ Years 26 16.0
No Response 11 6.7

194
NVQ Level
Participants were stratified as having obtained upto (n=48) or greater (n=35) than
NVQ level 2.
Current NVQ Level Frequency Percent
2 or below 48 29.4
Over 2 35 21.5
Current NVQ Level Frequency Percent
1 4 2.5
2 44 27.0
3 24 14.7
4 4 2.5
>4 6 3.7
No Response 81 49.7
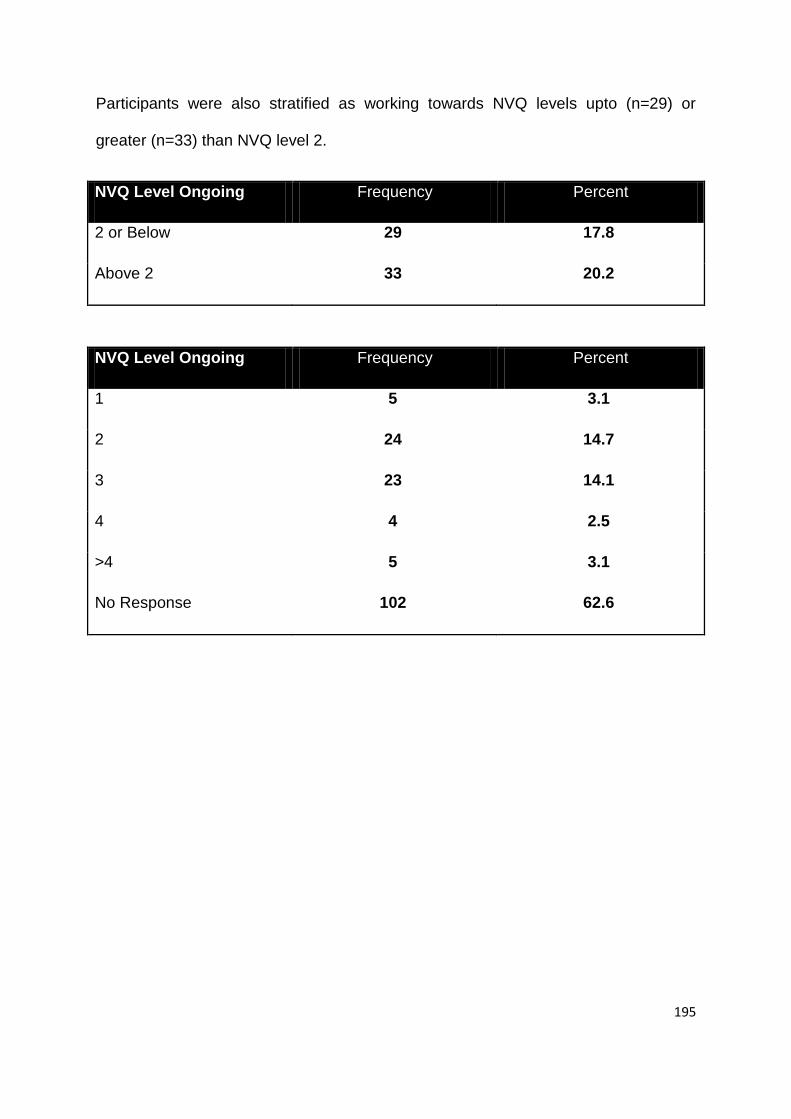
195
Participants were also stratified as working towards NVQ levels upto (n=29) or
greater (n=33) than NVQ level 2.
NVQ Level Ongoing Frequency Percent
2 or Below 29 17.8
Above 2 33 20.2
NVQ Level Ongoing Frequency Percent
1 5 3.1
2 24 14.7
3 23 14.1
4 4 2.5
>4 5 3.1
No Response 102 62.6

196
Dementia Training
Participants were stratified as having had no (n=21), internal only (n=94) or external
(n=33) dementia training.
Dementia Training Frequency Percent
None 21 12.9
In-house 94 57.7
External 33 20.2
Dementia Training Frequency Percent
None 21 12.9
In-house 95 58.3
In-house & external 17 10.4
External 10 6.1
Other Qualification 5 3.1
No Response 81 9.2

197
Job Status
The status of participants jobs were categorized as full-time (n=104) or part-time
(n=43) with permanent contracts only, as other options received few responses
(n=7).
Job Status Frequency Percent
Full-Time Permanent 104 63.8
Part-Time Permanent 43 26.4
Job Status Frequency Percent
Casual 1 0.6
Full-Time Temporary 6 3.7
Part-Time Permanent 43 26.4
Full-Time Permanent 104 63.8
Other 1 0.6
No Response 8 4.9

198
Time in Current Job
The length of time participants had been in their current job was divided into 3
categories, < 1 year (n=43), between 1 and 5 years (n=73) and 6 or more years
(n=40).
Time in Job Frequency Percent
Less than 1 year 43 26.4
Greater than 1 year 113 69.3
Time in Job Frequency Percent
Less than 1 year 43 26.4
1 to 5 years 74 45.4
6 to 10 years 19 11.7
11 to 20 years 14 8.6
20+ years 6 3.7
No Response 7 4.3

199
Time in Profession
The length of time participants had been in the profession was divided into 2
categories, 5 and under (n=74) or over 5 (n=80) years.
Time in Profession Frequency Percent
Less than 5 years 75 46.0
Over 5 years 79 48.5
Time in Profession Frequency Percent
Less than 1 year 20 12.3
1 to 5 years 55 33.7
6 to 10 years 17 10.4
11 to 20 years 33 20.2
20+ years 29 17.8
No Response 9 5.5

200
Shift Pattern
The shift patterns that participants worked were divided into 3 categories, permanent
day shifts (n= 51), permanent evening/night shifts (n=30) and other shifts (n=24)
(including rotating 8 and 12 hour shifts and ‘other’). Shift changes were categorised
as changing > weekly (n=85), < weekly (n=18) or never changing (n=32).
Shifts Frequency Percent
Permanent Day 52 31.3
Permanent Eve/Night 30 18.4
Other 24 14.7
Shifts Frequency Percent
Permanent Day 52 31.9
Permanent Eve/Night 30 18.4
Rotating 12 Hour Shifts 7 4.3
Rotating 8 Hour Shifts 6 3.7
Other 11 6.7
No Response 57 35.0

201
Shift Change Frequency Percent
More than weekly 85 52.1
Less than weekly 50 29.6
Shift Change Frequency Percent
Greater than Weekly 85 52.1
1-2 Weekly 5 3.1
3-8 Weekly 7 4.3
8+ Weekly 6 3.7
Never 32 19.6
No Response 28 17.2

202
Hours Worked
The basic hours worked by participants was stratified as above 35 hours (n=90) or
35 hours and below (n=64).
Basic Hours Worked Frequency Percent
Less than 35 64 39.3
More than 35 90 55.2
Basic Hours Worked Frequency Percent
Less than 15 Hours 5 3.1
16-25 Hours 26 16.0
26-35 Hours 33 20.2
36-44 Hours 75 46.0
Greater than 44 Hours 15 9.2
No Response 9 5.5

203
Overtime Worked Frequency Percent
Less than 5 hours 50 30.7
More than 5 hours 63 38.7
Overtime Worked Frequency Percent
Less than 5 Hours 51 3.1
5-10 Hours 41 14.7
11-15 Hours 15 14.1
16-20 Hours 3 2.5
Greater than 20 Hours 3 3.1
No Response 50 30.7
Other Job Frequency Percent
None 106 3.1
1-10 Hours 2 14.7
11-15 Hours 3 14.1
16-20 Hours 2 2.5
Greater than 20 Hours 1 3.1
No Response 49 30.1

204
Ethnicity/Nationality
Participants were initially divided according to if they considered themselves Welsh
(n=40) or not (n=15).
Welsh Nationality Frequency Percent
Yes 40 24.5
No 15 9.2
No Response 108 66.3
Additional questions on ethnicity were divided into British (n=104) or not British
(n=46), including various combinations of ‘Asian’ (n=18), ‘Afro-Caribbean’ (n=17) and
‘European’ (n=12) ethnicities.
Ethnicity Frequency Percent
British 104 63.8
Other 46 28.2
Ethnicity Frequency Percent
British 103 63.2
Asian 18 11.0
Afro-Caribbean 17 10.4
European 13 8.0
No Response/Other 12 (9/3) 7.4

205
Appendix III
COPSOQ: ‘Offensive Behaviours’ Frequency
Behaviour
Bullying: Frequency
Bullying: Protagonist
Sexually Inappropriate: Frequency
Sexually Inappropriate: Protagonist
Threats of Violence: Frequency
Threats of Violence: Protagonist
Physical Violence: Frequency
Physical Violence: Protagonist

206
COPSOQ: ‘Offensive Behaviours’ Frequency
Behaviour No A Few x Monthly Weekly Daily No
Response
Sexually
Inappropriate
150
(92%)
11 (6.7%) 0 1 (0.6%) 0 1 (0.6%)
Threats
Violence
97
(59.5%)
55
(33.7%)
2 (1.2%) 2 (1.2%) 4 (2.5%) 3 (1.8%)
Physical
Violence
100
(61.3%)
53
(32.5%)
5 (3.1) 0 3 (1.8%) 2 (1.2%)
Bullying 146
(89.6%)
12 (7.4%) 1 (0.6%) 1 (0.6%) 2 (1.2%) 1 (0.6%)

207
Behaviour
Bullying: Frequency
Bullying: Protagonist

208
Sexually Inappropriate: Frequency
Sexually Inappropriate: Protagonist

209
Threats of Violence: Frequency
Threats of Violence: Protagonist

210
Physical Violence: Frequency
Physical Violence: Protagonist