Embed Size (px)
Citation preview

SULFUR IMPREGNATION OF ACTIVATED CARBONTHROUGH
HYDROGEN SULFIDE OXIDATION
By
Xiaozhou You
B.S. in Chemistry and Environmental Engineering,Beijing Polytechnic University, Beijing, P.R. China, 1998
Submitted to the Graduate Faculty of
the School of Engineering in partial fulfillment
of the requirements for the degree of
Master of Science
University of Pittsburgh
2002

iiii
UNIVERSITY OF PITTSBURGH
School of Engineering
This thesis was presented
By
Xiaozhou You
It was defended on
March 19th, 2002
And approved by
Radisav D. Vidic, Associate Professor, Department of Civil and Environmental Engineering
Frederick G. Pohland, Professor, Department of Civil and Environmental Engineering
Leonard W. Casson, Associate Professor, Department of Civil and Environmental Engineering
Thesis advisor: Radisav D. Vidic, Associate Professor, Department of Civil and EnvironmentalEngineering

iiiiii
ACTIVATED CARBON SULFUR IMPREGNATION THROUGHHYDROGEN SULFIDE OXIDATION
Xiaozhou You, M.S.
University of Pittsburgh, 2002
Activated carbon adsorption is a most promising technology for reducing mercury
emissions from coal-fired power plants (CFPPs) because of its high efficiency to remove gas-
phase mercury, especially when activated carbon is impregnated with elemental sulfur.
The present study provides preliminary information about activated carbon impregnation
with sulfur through H2S oxidation. Impregnation conducted in the temperature range of 20-
200°C showed that the maximum sulfur loading can be achieved at 100°C (up to 27% after 10
minutes), but the reaction at room temperature achieved 13% sulfur loading, which is also
considered sufficient for enhanced mercury uptake. Sulfur loading increased with prolonged
reaction time in the range from 5 to 30 minutes. 10 minutes was found to be sufficient to achieve
substantial sulfur deposition using 25% H2S in the influent. The presence of excess oxygen is
essential to promote the reaction and can increase sulfur loading up to 3 times at room
temperature. Furthermore, sulfur content of impregnated carbon increased with the increase in
H2S concentration from 2.5% to 25%. However, impregnation with low H2S concentration
(2.5%) resulted in more efficient conversion.
iivv
Carbons impregnated under all experimental conditions investigated in this study
exhibited high thermal stability below 210°C, which demonstrates the potential of these sorbents
to be applied for mercury adsorption under realistic process conditions. Sulfur deposited on
activated carbon through H2S oxidation can be completely removed by heat treatment above
400°C.
Hydrogen treatment was found to substantially remove acidic functional groups from
BPL carbon surface and inhibit active sites from catalyzing H2S oxidation at room temperature.
Other surface modifications such as oxidation and acid washing showed limited impact on H2S
oxidation.
Performances of five virgin carbons tested in this study (BPL, PCB, F400, BD, and
Centaur) varied greatly with the highest sulfur loading at room temperature achieved by Centaur
(above 40%) and the lowest by BD (below 5%). No direct relationship was found between
sulfur loading and surface properties, such as total acidity, functional group types, basicity, and
total surface area.
DESCRIPTORS
Activated Carbon Adsorption
Sulfur Impregnation Hydrogen Sulfide
Coal-Fired Power Plants Mercury

vv
ACKNOWLEDGEMENTS
I am especially grateful to my research advisor, Dr. Radisav Vidic, for his guidance and
help throughout this study. His wise direction and broad knowledge are instrumental to this
research work, and his persistent research style always gives me great encouragement.
I am sincerely thankful to my parents for providing me with their endless love and
support.
I would also like to thank the Department of Civil and Environmental Engineering at the
University of Pittsburgh for providing support to my study.

vvii
TABLE OF CONTENTS
Page
COMMITTEE MEMBERSHIP PAGE………………………………………………………...…ii
ABSTRACT…………………………………………………………………………….…….….iii
ACKNOWLEGEMENT…………………………………………………………………………..v
LIST OF FIGURES…………………………………………………………………………….…x
LIST OF TABLES…………………………………………………………………………...…..xii
1.0 INTRODUCTION……………………………………………………………………………1
2.0 LITERATURE REVIEW…………………………………………………………………….3
2.1 Activated Carbon Based Mercury Control Technologies……..…………………………3
2.1.1 Mercury Emissions..………………………………………………………………3
2.1.2 Mercury Control Technologies..…………………………………………………..5
2.1.3 Fixed-Bed GAC Adsorber and PAC Injection……………………..…….………..6
2.1.4 Sulfur Impregnated Carbon Adsorbents …………………………..…...………..8
2.1.4.1 Advantage over Virgin Activated Carbon……………………….………..8
2.1.4.2 Impregnation of Activated Carbon
with Elemental Sulfur…………………………………………………….9
2.1.4.3 Impregnation of Activated Carbon
through H2S Oxidation………………………………………………….10
2.2 Hydrogen Sulfide Emissions…………………………………..……………………….11

vviiii
Page
2.2.1 Hydrogen Sulfide Emission Sources……………………………..………..…….11
2.2.1.1 Natural Gas Processing…………………………………………………..12
2.2.1.2 Petroleum Refining………………………………………………………13
2.2.1.3 Sulfur Recovery………………………………….………………………14
2.2.1.4 Kraft Pulping………………………………………………….………….15
2.2.1.5 Coke Production………………………………………………………….15
2.2.1.6 Minor Sources……………………………………………………………16
2.2.2 Hydrogen Sulfide Control Technologies………………………….……………..18
2.2.2.1 Amine Process……………………………………………...……………19
2.2.2.2 Incineration and Flaring………………………………………………….20
2.2.2.3 Scrubbing Process………………………………………………………..20
2.2.2.4 Other Technologies………………………………………………………21
2.2.3 Possible Applications of Carbon Impregnation
Using Waste Stream H2S…………………………………………...……………22
2.3 Activated Carbon Adsorption of Hydrogen Sulfide……………………...…………….24
2.3.1 Physical and Chemical Adsorption of Hydrogen Sulfide ……...………………..24
2.3.2 Kinetics of Hydrogen Sulfide Chemical Adsorption…………………………….25
2.3.3 Side Reactions and By-Products…………………………………………………27
2.3.4 Impact of Surface Chemistry…………………………………………………….28
2.3.4.1 Acidic Oxygen-Containing Functional Groups……...………………….28
2.3.4.2 Metal, Metal Oxides and Promoters…………...………………………..31
2.3.5 Impact of Surface Texture and Particle Size……………………………………32

vviiiiii
Page
2.3.6 Impact of Water Vapor………………………………………………………….33
3.0 MATERIALS AND METHODS………… …………………………………………………34
3.1 Materials……………………………………………………………………….………..34
3.1.1 Reaction Gases…………………………………………………………………..34
3.1.2 Virgin Carbons….……………………………………………………………….34
3.1.3 Modified BPL Carbons………………………………………………………….35
3.1.4 Deionized Water…………………………………………………...……………36
3.2 Methods………………………………………………………………………………….37
3.2.1 Sulfur Impregnation……………………………………………………………..37
3.2.1.1 Experimental Set-Up……………………………………………………..37
3.2.1.2 Selection of Impregnation Conditions………………………...…………37
3.2.1.3 H2S Impregnation Procedure…………………………………………….38
3.2.2 Sulfur Content Determination….………………………………………………..39
3.2.3 Thermogravimetric Analysis……………………………………………………40
3.2.4 Surface Functional Group Measurements……………………………………….41
3.2.4.1 Acidic Functional Groups………………………………………………..41
3.2.4.2 Basic Functional Groups…………………………………………………43
3.2.5 pH Measurement……………………….………………………………………..43
3.2.6 Ash Content Measurement…………………………………………...………….44
3.2.7 Carbon Bed Temperature Measurement….……………………………………..44
3.2.8 Leakage Tests in the System…………………………………………………….44
iixx
Page
4.0 RESULTS AND DISCUSSION………………………………………………………….....45
4.1 Impact of Reaction Temperature……………………………………………………….45
4.2 Impacts of H2S Concentration and Reaction Time…………………………....………..47
4.3 Impact of Oxygen Input………………………………………………………...………49
4.4 Impact of Particle Size………………………………………………………………….51
4.5 Thermal Stability of H2S Impregnated Activated Carbons…………………………….52
4.6 Impact of Surface Modification of BPL Carbon……………………………………….53
4.6.1 Hydrogen Gas Treatment………………………………………………………..53
4.6.2 Nitric Acid Treatment…………………………………………………………...55
4.6.3 Acid Washing Treatment………………………………………………………..56
4.7 Performances of Different Commercial Available Virgin Carbons...………………….56
5.0 SUMMARY AND CONCLUSIONS…………………………………………..…………...59
5.1 Summary………………………………………………………………………………...59
5.2 Conclusions…………………………………………………………………….………..62
6.0 SUGGESTIONS FOR FUTURE WORK……………………………………………………65
APPENDIX…………...………………………………………………………………………….66
BIBLIOGRAPHY………………………………………………………………………………..87

xx
LIST OF FIGURES
Figure No. Page
2.1 Comparison of Mercury Removal Efficiencies of Conventional APCDs………………………………................………….…........66
2.2 Possible H2S Emissions and Impregnation Points inSeveral Industrial Processes...................................………………………………67
2.3 Typical Claus Sulfur Recovery Units..............................................................…..68
3.1 H2S Oxidation Experimental Set-Up…………………………..................................................................................................69
3.2 Linear Range of Sulfur Determinator...……………………..................................................................................................70
3.3 Carbon Bed Temperature Measurement…………………………………………71
4.1 Impact of Reaction Temperature and Time on SulfurLoading through H2S Oxidation in the Presence of 25% O2 ............................…72
4.2 Actual Bed Temperature for Impregnation Using Different H2S Concentrations (25% O2 in the in the influent, set temperature = 20°C)................……………………………………….........…73
4.3 Impact of H2S Concentration and Reaction Time on Sulfur Loading and H2S Conversion......................................................…………74
4.4 Impact of Oxygen Concentration on Sulfur Loading through H2S Oxidation (reaction time = 10 min)..........................................……75
4.5 DTA Profiles for Pure Sulfur and Carbon Impregnated with Sulfur in the Presence and Absence of Oxygen (25% H2S in the influent, reaction temperature = 100°C)......................………...76
4.6 Impact of Particle Size on Sulfur Loading (25% H2S and 25% O2 in the influent, reaction temperature = 100°C).........................……........77

xxii
Figure No. Page
4.7 Comparison of TGA and Sulfur Measurement for CarbonsImpregnated with Sulfur at Different Temperatures(25% H2S and 25% O2 in the influent)........................................…………...…...78
4.8 Thermal Stability of H2S Impregnated Carbons(25% H2S and 25% O2 in the influent, reaction time = 10min).............…………79
4.9 Impact of Surface Modification on BPL PerformanceIn H2S Impregnation (25% H2S and 25% O2 in the influent,reaction time = 10min)..…………………………………………………........….80
4.10 DTA Profiles for Virgin and Modified BPL Carbons...............………...........….81
4.11 Performances of Different Virgin Carbons in H2S Impregnation (25% H2S and 25% O2 in the influent, reaction time = 10min)……………..…...82
4.12 Impact of Total Acidity on H2S Impregnation (25% H2S and 25% O2 in the influent)……………......................................……83
4.13 Impact of Basicity on H2S Impregnation (25% H2S and 25% O2 in the influent)……………......................................……84
4.14 Impact of Ash Content on H2S Impregnation (25% H2S and 25% O2 in the influent)……………......................................……85
4.15 Impact of Surface Area on H2S Impregnation (25% H2S and 25% O2 in the influent)……………......................................……86

xxiiii
LIST OF TABLES
Table No. Page
2.1 H2S Emission Sources………………………………...…........................17
3.1 Reaction Gases…………………………………………..........................34
3.2 Virgin and Modified Activated Carbons…………...................................35
3.3 Targeted Functional Groups and Reaction SolutionsUsed in Boehm Titration…………………………..............................….43
4.1 Surface Properties of Virgin and Modified BPL Carbons........................54
4.2 Surface Properties of Virgin Carbons…………………….......................57
5.1 Summary of Reaction Conditions……………………………………….63

11
1.0 INTRODUCTION
On December 14th 2000, EPA announced its determination to propose regulations for
mercury emissions from power plants by December 2003. Extensive mercury emission studies
identified coal-fired power plants (CFPPs) as the largest single source of anthropogenic Hg
emissions in the United States, not only because they account for about one-third of total
anthropogenic emissions, but also because mercury exists mainly in the metallic form in these
flue gas streams. Existing control technologies, such as wet scrubbers, fabric filters, and
electrostatic precipitators are not effective in removing metallic mercury. Therefore, there is a
need of highly efficient mercury control technologies in order to meet the more stringent
regulations expected in the near future.
Activated carbon based adsorption has been intensively studied and proven to be a
promising technology to effectively remove gas-phase mercury from CFPPs. Powdered activated
carbon (PAC) injection as well as granular activated carbon (GAC) fluidized bed systems have
been evaluated in pilot-scale studies.
Activated carbon impregnated with sulfur through H2S oxidation is of particular interest
in this research, because hydrogen sulfide is also a hazardous air pollutant (HAP) emitted from a
number of industries, such as: natural gas processing facilities, oil refineries, and sulfur recovery

22
plants. Currently applied H2S control devices include: amine process system and scrubbers.
However, tail gas after these devices can still cause environmental problems if it is directly
discharged or incompletely flared. In recent years, activated carbon has also been used in these
industries as tail-gas sorbent or pretreatment filter material to remove H2S and other constituents.
Studies on H2S oxidation over activated carbon surface have revealed that chemisorption
can enhance the capacity of activated carbon to adsorb hydrogen sulfide. Furthermore, carbon
performance for H2S uptake is dependent on impregnation conditions and is also influenced by
carbon base material and surface properties.
The purpose of this study was to evaluate the impacts of reaction conditions on H2S
oxidation catalyzed by activated carbon surface. Reaction temperature and time, H2S
concentration, O2 concentration and particle size have been varied to compose an experimental
matrix to investigate the influence of each factor. Sulfur content and thermal stability were
measured for carbons impregnated under different conditions. The effects of hydrogen treatment,
nitric acid treatment, and acid washing were studied for BPL carbon. Furthermore, impacts of
surface properties such as: surface functional groups, ash content, and total surface area were
also investigated using several commercially available carbons.

33
2.0 LITERATURE REVIEW
2.1 Activated Carbon Based Mercury Control Technologies
2.1.1 Mercury Emissions
Mercury is of particular importance as a result of the Clean Air Act Amendments of 1990
(CAAA). Mercury and mercury compounds are included in the Title III list of hazardous air
pollutants (HAPs) and will be subject to standards established under Section 112 [b][1],
including maximum achievable control technology (MACT). Most concerns for the lack of
balance in the global mercury cycle are related to anthropogenic emissions. The total nationwide
anthropogenic mercury emissions were estimated at 140 Mg (154 tons) per year from major
sources(1). According to EPA 1997 Mercury Report Study To Congress(2), approximately 87% of
anthropogenic mercury emission is from combustion point sources, 10% is from manufacturing
point sources, 2% is from area sources, and 1% is from miscellaneous sources. Four major
categories of combustion sources are: utility boilers (33%), municipal waste combustion (19%),
commercial/industrial boilers (18%), and medical waste incinerators (10%).
Prior to 1995, municipal waste combustors (MWCs) and medical waste incinerators
(MWIs) were the largest identifiable sources of mercury emissions to the atmosphere. Several
studies reported that the flue gases from municipal waste combustors have 1 to 3 orders of
magnitude higher mercury concentrations (100-1000µg/m3 of mercury at 177-299°C) than those
from coal-fired power plants (CFPPs), which usually contain 1-10µg/m3 of mercury at 121-
177°C(3-6). Final regulations for MWCs and MWIs, when fully implemented, will reduce
emissions by 90% when compared to year 1995’s levels.

44
Current emission estimates indicate that utility boilers are the single largest emission
source (51.8 tons/yr). About 81% of the total energy consumption in utility boilers resulted from
coal combustion (51.6 tons/yr)(2). Almost all of the coal burned in the U.S. (95%) are bituminous
and sub-bituminous coals(7). Although mercury is present in very small quantities in coal (0.02 to
0.25 ppm with an average of 0.09 ppm)(2), large volume of flue gas generated by coal-fired
power plants can contain an unacceptable amount of mercury.
The primary source of mercury from CFPPs is the combustion stack. Because the
combustion zone in boilers operates at temperatures above 1000°C (2000°F), mercury in the coal
is vaporized and emitted as a gas. Some of the gas may cool and condense as it passes through
the boiler and the air pollution control devices (APCDs). The current understanding is that, Hg0
is not so well collected in PM or SO2 control systems, while Hg2+ is collected to a greater or
lesser degree depending on the characteristics of each control device(8).
Future trends in mercury emissions from coal combustion sources are largely dependent
on both the nation’s future energy needs and the fuel chosen to meet those needs. Another factor
is the nature of actions the utility industry may take in the future to meet other air quality
requirements under the Clean Air Act. On December 14th, 2000, the EPA announced that it
intends to develop mercury regulations for CFPPs under the Section 112. A proposal of emission
standards will be completed before December 15th of 2003, with promulgation launched before
December 15th of 2004 and full compliance expected by 2007(9, 10).

55
2.1.2 Mercury Control Technologies
The primary types of control devices used for coal-fired utility boilers include
electrostatic precipitators (ESPs), wet scrubbers, fabric filters (FFs) or bag houses. Mercury
removal efficiencies of these APCDs without activated carbon injection are shown in Figure
2.1(3).
ESPs are the most widely used particulate control device by the fossil fuel-fired electric
utility industry. Because mercury in electric utility flue gas is predominantly in the vapor
phase(11) with only about 5% to 15% in the fly ash(12), ESPs are relatively ineffective at removing
mercury compounds from flue gases. Cold-side ESPs (CS-ESPs), located after the air preheater
have a median removal efficiency of 14.7% and a maximum removal efficiency of 82.4%.
Fabric filters are more effective than ESPs at collecting fine particles. This performance
may be important in achieving better mercury removal. Also, the mercury may adsorb onto the
fly ash cake that is collected on the fabric and allow more residence time for mercury removal.
FFs have a median mercury removal efficiency of 8%, with a range from no control (zero
percent removal) to 73%.
Scrubbers or flue gas desulfurization (FGD) units for coal-fired plants are generally used
as devices for the removal of acid gases (mainly SO2 emissions). Most utility boilers have an
ESP or a FF before the wet FGD units to collect the majority of PM. FGD units have a median
mercury removal efficiency of about 22.6%, with a maximum of 61.7% removal.

66
A spray dryer adsorber (SDA) is a dry scrubbing system followed by a particulate control
device. A lime/water slurry is sprayed into the flue gas stream and the resulting dried solids are
collected by an ESP or a FF. Tests conducted on a SDA/FF system had a median mercury
removal efficiency of 24%, with a maximum of 55% removal.
Mechanical collectors typically have very low PM collection efficiencies, often lower
than 20% for particles less than or equal to 1µm in size. Venturi scrubbers can be effective for
particulate control, but require high pressure drops (more than 50 or 60 inches of water) for small
particles. These two devices are not expected to provide effective mercury removal, especially
for those mercury compounds concentrated in the sub-micron PM fractions and in the vapor
phase.
As can be observed in Figure 2.1, none of the APCDs described above are able to achieve
a median mercury removal efficiency of more than 30 percent. In 1999, the APCDs installed on
existing units captured 43% of the mercury in these as-burned fuels and 43 tons of mercury was
emitted to the atmosphere from coal-fired utility power plants(13).
2.1.3 Fixed-Bed GAC Adsorber and PAC Injection
Fixed-bed GAC adsorption has been wildly used for the control of vapor phase emissions
from a variety of industrial processes. Several advantages of this approach for mercury control
are worth mentioning: (1) nearly no loss of activated carbon will occur in the adsorber; (2) it
allows the mercury-contaminated activated carbon to be isolated from the fly ash waste stream,

77
which increases the potential for by-product utilization programs instigated by many CFPPs; (3)
it also permits carbon regeneration and mercury recovery from the carbon; (4) the carbon
utilization is maximized since the fixed-bed adsorber is located downstream of other air pollution
control devices; and (5) the fixed-bed adsorber results in a longer reaction time between the
mercury and carbon relative to PAC injection. However, fixed-bed adsorption also has major
disadvantage due to significant pressure loss across the adsorption bed.
On the other hand, PAC injection process involves direct injection of activated carbon
into the plant’s flue gas stream. Activated carbon captures vapor-phase mercury and is collected
in the downstream particulate control equipment, such as a fabric filter or ESP. However, Young
et al.(14), Lowe and St. John(15) suggested that PAC injection applied to a CFPP with an inlet
mercury concentration of 20µg/m3 would only contribute 5% to the overall mercury removal by
air pollution control devices. The authors also indicated that PAC injection will not provide
significant mercury control for the flue gas conditions representative of CFPPs.
The effectiveness of PAC injection in removing trace levels of mercury from flue gases at
various coal-fired power plant facilities can vary considerably depending on the following
factors: flue gas composition and temperature, coal type, mercury speciation, activated carbon
properties, injection rate, and other plant operating conditions(7). Besides, PAC injection has
some disadvantages such as: it can decrease ESP performance, reduce ash salability due to
excess carbon and mercury contamination, and can also cause waste disposal problems because
mercury may volatilize from the landfills where saturated activated carbon is deposited.

88
According to a technical memorandum released by EPA(13), annualized costs of mercury
control using powdered activated carbon injection will be high only for the plants using hot-side
ESPs (HS-ESPs). This document also suggested that the costs of mercury control will
dramatically diminish if retrofit hardware and sorbents are employed for the control of other
pollutants, such as: NOx, SO2, or fine particulates. Despite the disadvantages and varied
efficiency of PAC injection, it is still the most commonly applied technology for mercury
containing tail gas clean up because of its operational simplicity.
Recent study(16) of powder sorbent injection approach utilized fixed-bed adsorption data
in a predictive model to estimate performance of sorbent injection for mercury removal. It was
found that the difference between the laboratory and field results can be attributed to differences
in the flue gas compositions and operating conditions. It was also suggested that the laboratory
measurements may be well suited to simulate field results if direct field tests and sufficient
information on flue gas components can be obtained.
2.1.4 Sulfur Impregnated Carbon Adsorbents
2.1.4.1 Advantage over Virgin Activated Carbon.
Virgin PAC injection is much more effective in removing oxidized mercury forms than
elemental mercury. MWC tests using PAC injection showed that although the mercury
speciation was 67% oxidized and 33% elemental upstream of the baghouse, the mercury
discharged from the stack was 100% elemental mercury(17). This test result suggests that
injection of virgin PAC would not be effective in removing mercury from the flue gases of coal-

99
fired power plants which tend to have larger fractions of elemental mercury than MWCs. Sinha
and Walker(18) showed that virgin carbon adsorb significantly less mercury at ambient
temperature compared with sulfur impregnated carbon. A previous study on comparison of BPL
virgin carbon and sulfur impregnated carbon also found that BPL carbon displayed significantly
less ability to remove mercury, either in terms of the adsorption kinetics or the overall mercury
uptake(19). Sulfur impregnated GAC showed much greater elemental mercury adsorption,
especially in the temperature range of 25-90°C. This effectiveness of sulfur impregnated carbon
is due to the enhanced chemisorption involving mercury reaction with elemental sulfur to form
nearly non-soluble mercuric sulfide(20).
2.1.4.2 Impregnation of Activated Carbon with Elemental Sulfur.
Mercury adsorption performance of HGR (commercial available sulfur impregnated
carbon, Calgon Carbon corporation, Pittsburgh, PA) and BPL-S (lab-produced elemental sulfur
impregnated carbon) were compared by Korpiel and Vidic(21). These two carbons had similar
sulfur loads and BET surface area, but HGR showed lower mercury removal at higher reaction
temperature. Such behavior was explained with hypothesis that BPL-S has more reactive S2
chains, which not only have stronger bonding to the carbon matrix, but also are also less
voluminous and located deeper inside the carbon particles. On the other hand, S8 is the
predominant sulfur form in HGR, which is mainly located on the external surface and its ring
structure makes it less reactive. Furthermore, pore size distribution and available surface area are
also essential for effective mercury capture on activated carbon(22). Based on further kinetic
studies with these two carbons(23), it was concluded that BPL-S is more suitable for direct
1100
powdered activated carbon injection in CFPPs because of favorable kinetics and better
performance at higher temperatures. On the other hand, HGR would be a better choice for fixed-
bed activated carbon application or for removing higher mercury concentrations, which are
typically found in MWCs.
2.1.4.3 Impregnation of Activated Carbon through H2S Oxidation.
Preliminary studies showed that sulfur deposition on the surface of activated carbon can
be accomplished through H2S oxidation by oxygen(24). Thermogravimatric analysis showed that
this method of sulfur impregnation resulted in lower thermal stability of sulfur deposits when
compared with impregnation with elemental sulfur. However, the latter sorbent was produced at
600°C while the former utilized reaction temperature of 150°C.
Impregnation with elemental sulfur requires elemental sulfur as the raw material and also
requires more energy input because of higher impregnation temperature. On the other hand, H2S
is commonly found in numerous industrial waste streams. Utilizing H2S from these streams will
be beneficial to reduce the total sulfur emissions from these industries and could also lower the
cost of producing effective mercury adsorbents.

1111
2.2 Hydrogen Sulfide Emissions
2.2.1 Hydrogen Sulfide Emission Sources
Hydrogen sulfide is produced in nature primarily through anaerobic decomposition of
proteinaceous material by bacteria. It also occurs as a constituent of natural gas, petroleum,
sulfur deposits, and numerous volcanic gases and sulfur springs. Background air concentrations
of hydrogen sulfide due to the natural sources have been estimated between 0.15-0.46 µg/m3,
which is well below the threshold odor levels and the concentrations at which deleterious effects
are known to occur(25).
The major H2S emission point sources include: natural gas processing, petroleum
refineries, petrochemical plant complexes, kraft mills, and coke ovens(25-27). The H2S emissions
related to coal burning are relatively insignificant and incineration usually converts these H2S to
SO2, which is vented directly to the atmosphere. Production of sour natural gas and the refining
of higher sulfur-content crude oil are the major concerns for H2S emissions in the world today.
H2S contents in the gas streams (including raw gas and waste gas streams) of these facilities vary
from 0-60% by volume, while some facilities with even higher hydrogen sulfide contents have
also been reported(27). Possible H2S emission sources (industries and processes), concentrations
and flue gas characteristics are summarized in Table 2.1(26, 28-33). Figure 2.2 and 2.3 illustrate
some of these processes and possible sulfur impregnation points(29-33).
The need to reduce H2S and SO2 from these sources and the economical potential of
recovered sulfur compounds lead to various sulfur recovery technologies. The most commonly
applied sulfur recovery technology is the Claus process, which has been successfully serving

1122
these industries for over 100 years due to its relatively high recovery efficiency(28). However,
with the more stringent regulations promulgated in recent years, the Claus process is considered
to be a potential major air polluter, since the process typically recovers only 95-97% of the
hydrogen sulfide fed to it. Tail gas clean-up processes are required to treat the exhaustion of the
Claus process to achieve the overall sulfur recovery up to 99%.
2.2.1.1 Natural Gas Processing.
The average H2S concentration in raw natural gas has a range of 0.055-4% by volume in
different Air Quality Control Regions. However, it is also recorded that H2S contents of some
deposits can reach as high as 23% in Wyoming, 63% in Michigan(29), and 50% in Alberta,
Canada(25). According to the regulation promulgated by the Department for Natural Resources,
hydrogen sulfide emission from any combustion process including natural gas burning, should
not exceed 165 ppm by volume(34).
Sweetening with amine is used to remove H2S(35) from raw natural gas followed by the
recovery of H2S. The recovered H2S undergoes the following treatments: (1) vented, (2) flared in
waste gas flares or modern smokeless flares, (3) incinerated, or (4) utilized for the production of
elemental sulfur or sulfuric acid. Emissions will result from gas sweetening plants only if the
acid waste gas from the amine process is flared or incinerated(29). Otherwise, the acid waste gas
is used as feedstock in nearby sulfur recovery plants or sulfuric acid plants. The emission of
sulfur recovery plants will be introduced in the following sessions.

1133
2.2.1.2 Petroleum Refining.
At an average level, approximately 50 tons of hydrogen sulfide is formed for each 20,000
barrels of crude oil with high sulfur content processed(30). The main sources of H2S emissions in
refineries are untreated gas stream leaks, vapors from crude oil and raw distillates, and
condensate sewers.
One of the major operations in a refinery to produce H2S is the atmospheric distillation
process, which separates the crude oil into its various boiling point fractions. After initial
distillation, light non-condensable fuel gas (hydrocarbons such as: CH4) with hydrogen sulfide
and ammonia are typically sent back as furnace fuel to heat the distillation system. Temperature
of this mixture gas discharged from distillation column is up to 400°C(30). Air emissions of
hydrocarbons, CO2, H2S, SO2, and other constituents during atmospheric distillation arise from
the combustion of fuels in the distillation furnace, process vents and fugitive emissions. The
quantity of these emissions depends on the size of the unit, the type of the feedstock, and the
cooling water temperature.
Other process units that release hydrogen sulfide include: vacuum distillation, thermal
cracking, coking, and catalytic hydrocracking. The catalytic hydrocracking process is designed to
make different products (for instance: gasoline), in which hydrogen is used to break heavy
distillates produced from the atmospheric distillation process into lighter hydrocarbons.
However, impurities such as sulfur and nitrogen bounded with hydrocarbons will be released to
form hydrogen sulfide and ammonia, which not only cause poisoning of the catalysts but also

1144
lead to hydrogen sulfide and ammonia emissions. Usually, feedstock of hydrocracking process
need to be hydrogenated first to remove sulfur and nitrogen, and is then sent to the catalytic bed.
2.2.1.3 Sulfur Recovery.
There are several applications of Claus processes in sulfur recovery plants that were
classified according to the H2S concentrations in the feedstock. These concentrations have ranges
of <10%, <20%, 20-50% and >50% as recorded in EPA documents(36). Usually, H2S
concentration below 20% is not suitable for the Claus process because the furnace cannot be self-
sustained under such condition(37, 38).
In the Claus process, one third of the H2S feedstock is combusted with oxygen or air in
the furnace to produce SO2 at temperature up to 980-1540°C. The rest two third of the H2S
feedstock is sent to the thermal zone (temperature is about 650°C) to react with the SO2 produced
in the furnace. Approximately 70% H2S can be converted to elemental sulfur and removed as
sulfur liquid without scrubbing system. The remaining sour gases can further go through a series
of re-heating, catalytic conversion and cooling/condensing steps to yield an overall recovery of
up to 95-97%, depending upon the number of catalytic reaction stages and the type of reheat
methods used. Temperature of this catalytic reaction is about 200-315°C. Usually 2 to 3 stages
(or 2 to 3 beds) will be installed to ensure high sulfur recovery efficiency, which is normally as
high as 96-97.5%. A schematic layout of the Claus process is illustrated in Figure 2.3(36).

1155
In addition to main reactions (i.e., oxidation of H2S to SO2 and the reaction of SO2 with
H2S in the reaction furnace), many other side reactions occur to form other compounds, such as:
COS, CS2, and CO2. Typical tail gas from the Claus plant still contains 0.8% to 1.5% total sulfur,
including 0.22% H2S. Other constituents in the tail gas may also include: N2, CO2, Argon, and
H2. An existing New Source Performance Standard (NSPS) limits sulfur emissions from some
Claus sulfur recovery plants at below 0.025% by volume(38). Accordingly, technologies are
required to reduce H2S emission from the Claus process tail gas, which involve one or more of
the following processes: (1) extending the number of reaction stages, (2) adding scrubbing
processes or, (3) incineration.
2.2.1.4 Kraft Pulping.
Hydrogen sulfide and organic sulfides are produced and released to the atmosphere from
kraft mills in a number of locations. These emissions impart the characteristic odor in the vicinity
of kraft paper mills and has been the cause of considerable air pollution problems. The major
sources of hydrogen sulfide emission in kraft mills are the stack gases from the recovery furnace,
the stack gases from the lime kilns, the non-condensables from the digester relief, the blow tank,
and the multi-effect evaporator(25). H2S concentration from these sources ranges from 0-0.11%
by volume (up to 1080ppm). The current control technology is to reduce H2S by process
modifications and improved operating conditions. Several new mills have incorporated recovery
systems (Table 2.1) that replace the conventional direct-contact evaporators so that H2S emission
can be reduced by more than 99%(31).

1166
2.2.1.5 Coke Production.
The sulfur emissions in coke production can occur in the form of hydrogen sulfide and
carbon disulfide. Hydrogen sulfide is produced in the coking operation at the rate of about 6.7
pounds per ton of coal charged. H2S concentration is about 4-13ppm in non-purified gas, 1-4ppm
in partially desulfurized gas, and 0 ppm in municipal gas or pipeline gas(25). The recovery of coal
chemicals is an economical necessity for modern coke ovens as they equal approximately 35% of
the value of the coal. After the removal of water vapor, tar, light oils, particulate, and carbon
compounds, the coke oven coal gas goes through a series of recovery processes, where ammonia,
part of the light oils, and hydrogen sulfide are separated. In this case, H2S recovery is normally
done in a scrubbing tower containing a solution of ethanolamine(32).
2.2.1.6 Minor Sources.
H2S emissions can also be found in other sources, such as: coal mining, chemical
processing industries, dye manufacturers, viscose rayon manufacturers, sulfur productions,
manufacturers of sulfur-containing chemicals, iron and metal smelters, food processing plants,
and tanneries(25-27). Sour gases produced in some of these industries (e.g., sulfur production) may
have very high H2S content. However, these sour gases are usually sent to sulfur recovery plants
for further treatment. Some sulfuric acid plants burn spent acid and hydrogen sulfide as raw
materials, where H2S can be completely converted to SO3 in the oxidation process. Hydrogen
sulfide emissions from these plants are usually negligible(33).

1177
Table 2.1 H2S Emission Sources(26, 28-33)
EmissionSource
H2SConcentration (%)
Temperature(°°C)
OtherConstituents
Type ofControl
Vented gasfrom natural
gasprocessing
N/A (very low) Ambient SO2, andhydrocarbons
Untreated
Tail gasfrom natural
gassweetening
N/A Ambient SO2 andhydrocarbons
Flared
Off-gasfrom
refinerydistillator
N/A 400 Lighthydrocarbons
and NH3
Flared or fedback to
distillationfurnace
Off-gasfrom
refinerysour gas
sweetening
N/A Ambient Flared orreused
Off-gasfrom
refineryhydro-
cracking
N/A (high) N/A H2,hydrocarbons
and NH3
Sent to sourgas treatment
unit:sweetening
processTail gas
from cokingproduction
0-13ppm Ambient Coke oven gas N/A
Tail gasfrom kraft
pulpingevaporator
0-0.11%(6 kg/ton pulp)
N/A Steam andCH3SH
Untreated,Venturi
scrubber, ESP,or Auxiliary
ScrubberTail gas
from kraftpulping
condenser
0-0.11% Ambient CH3SH,CH3SCH3, and
non-condensables
Untreated

1188
Table 2.1 (Continued)
EmissionSource
H2SConcentration (%)
Temperature(°°C)
OtherConstituents
Type ofControl
Stack gasfrom kraft
pulping
0-0.11% N/A CH3SH,CH3SCH3, and
highercompounds
Untreated
Tail gasfrom Claus
plant
0.22 200-315 SO2, sulfurvapor, N2,
CO2, Ar, H2,COS, SO2, and
CS2
Extendedscrubbingprocess, orincineration
Exhaust gasfrom
incompleteflaring
N/A N/A CO2, PM, SO2,NO2, and
steam
Untreated
N/A: Information is not available.
2.2.2 Hydrogen Sulfide Control Technologies
Generally, if the H2S concentration in a stream is fairly low, it is usually vented or
incinerated. Hydrogen sulfide in H2S-emitting industries (natural gas processing, oil refineries,
coke ovens, and pulp factories) is removed as a waste by sweetening process or other tail gas
clean-up devices. If recoverable, this formerly wasted H2S is sent to H2S-consumming industries
(sulfur recovery or chemical production) as a raw material. A number of control technologies
have been applied for H2S emissions, such as: amine process, scrubbers, and incineration.

1199
2.2.2.1 Amine Process.
Since 1930’, attention has been turned to approaches that not only remove waste stream
H2S, but also recover sulfur for commercial use. The first was the Girbotol process(35), which has
become the most widely used for removing H2S even in the present time. Girbotol process is the
major step of sour gas sweetening and its principle is also adopted by several H2S scrubbing
systems. This process is based on the fact that the amines can react with hydrogen sulfide at low
temperatures to form salts, which dissociate readily upon heating.
Where: R = mono, di, or tri-ethanol
The hydrogen sulfide-bearing gas enters the base of the contacting tower or absorber and
flows up through the tower countercurrent to the absorbing solution. The purified gas leaves at
the top of the tower. Then the adsorbed solution rich in hydrogen sulfide enters the reactivator
where the solution is heated and stripped of hydrogen sulfide by steam. Regenerated H2S is sent
to a condenser where the water is removed from the gas and returned to the system or discarded.
The hydrogen sulfide-rich gas is then available for further use.
A disadvantage of the Girbotol process has been the inability of amines to adsorb H2S in
the presence of other impurities, such as: tars and oxygen. Numbers of improvements in the use
of amines for gas purification have been made to improve the performance of this process,
including the use of different amine combinations, super-atmospheric pressure, or split flow.
SHRNH2Heat
S)RNH(2223
+ →
S)RNH(SHRNH22323
→+
( )2
( )1

2200
These improvements not only avoid process difficulties caused by impurities, but also increase
the removal efficiency.
2.2.2.2 Incineration and Flaring.
Most H2S emission related plants employ elevated smokeless flares or tail gas
incinerators for complete combustion of all waste gas constituents, including virtually 100
percent conversion of H2S to SO2. However, some plants still use older and less efficient waste
gas flares which usually operate at temperatures lower than necessary for complete combustion
(in order to properly remove the sulfur, incinerators must operate at a temperature of 650°C or
higher to ensure 100% H2S conversion). As a result, larger emissions of H2S, hydrocarbons and
particulates may occur(39). Although the estimate of these emissions is not readily available, the
disadvantages of flaring and incineration include considerable H2S emission, especially for large
capacity plants.
2.2.2.3 Scrubbing Process.
The current available scrubbing processes include two alternatives: oxidation type
(converting total sulfur to SO2) and reduction type(36). Reduction type of scrubbing process
involves hydrogenation of total sulfur to H2S, cooling and removal of moisture, and then
followed by scrubbing processes. There are at least four reduction scrubbing processes
developed for sulfur removal from the tail-gas of the Claus process: Beavon, MDEA, SCOT and
ARCO. In the Beavon process, H2S is converted to sulfur outside the Claus units undergoing a

2211
lean H2S-to-sulfur reaction. The other three processes utilize conventional amine scrubbing and
regeneration to recycle H2S back to the Claus process.
2.2.2.4 Other Technologies.
Other H2S removal technologies include: (1) caustic soda adsorption and the Seaboard
process which uses sodium carbonate, (2) the Shell phosphate process and phenolate process,
and (3) the Thylox process(35).
Dry processes for removing hydrogen sulfide include: iron oxide and activated carbon
adsorption. The former process is based on direct contact and reaction between iron oxides and
hydrogen sulfide to form non-soluble sulfides. However, the use of this process on the large
industrial scale is not looked upon favorably because of its slow kinetics and higher operational
cost(40).
Activated carbon adsorption has great advantages in several applications, such as
deodorization of air, removal of traces of organic impurities, purification of carbon dioxide, and
the filtration of gas streams to remove sulfur compounds. Although this process is not usually
utilized in refining industries, numerous studies have been carried out to investigate the nature of
H2S adsorption over activated carbons under conditions that are similar to refining waste streams
(Section 2.3). Moreover, it was shown that activated carbons have the potential to remove H2S
from sewer gases(41).

2222
2.2.3 Possible Applications of Carbon Impregnation Using Waste Stream H2S
Based on the above summary, it seems that there are two types of H2S streams that can be
used to impregnate activated carbon for the purpose of producing mercury adsorbents (possible
application points are illustrated in Figures 2.2 and 2.3). The first application can be for the tail
gases containing H2S, such as vents from natural gas processing, coking production scrubber tail
gas, the Claus plant tail gas, and the gas from kraft mill stacks, condensers and evaporators. As
shown in Table 2.1, these streams also contain SO2, hydrocarbons, inert gases, and steam. The
Claus plant emissions even contain sulfur vapor, which could serve to increase the sulfur loading
on the carbon. Temperature of these streams may vary from ambient temperature to 100°C, and
above 300°C for the Claus plant. Hydrogen sulfide concentration is very low in these cases (e.g.,
1% in the tail gas from the reduction scrubbers in the Claus plants). The advantage of adsorbing
low H2S streams is that activated carbon may help to achieve complete removal of H2S, given
sufficient bed depth and reasonable flow rate.
The other possible application is to utilize H2S produced during several unit processes.
For example, the gases from refinery hydrocracking and coking processes contain H2S and H2 at
a temperature up to 400°C, which may be suitable for physical adsorption of H2S by carbon.
Because the H2S concentration in this gas stream is not very high, physical adsorption may be
sufficient for complete removal. Also, coke oven foul gas after removing other impurities can be
used for activated carbon impregnation. The problem for this application is that the stream
contains a certain amount of light oil, which may foul activated carbon and prevent efficient H2S
adsorption. Therefore, more effective pretreatment of oil constituent or several stages of carbon
bed may be required. Sour natural gas that is to be directly distributed to chemical plants and the

2233
raw gas from coal gasifiers(42) in coal conversion plants can also be utilized for carbon
impregnation. Moreover, activated carbon beds can be installed before any flares and
incinerators to adsorb H2S. However, interference by particulates, SO2 and NOx may need to be
considered in these cases.

2244
2.3 Activated Carbon Adsorption of Hydrogen Sulfide
Activated carbon is known to be suitable for the removal of hydrogen sulfide from
natural, synthesis or other product gases(43). The performance of activated carbon is dependent on
the physical properties of base materials and the methods of activation. Other factors which have
a considerable influence on the adsorption process include the following: flue gas velocity and
pressure, temperature, concentration of the adsorbates, concentration of other gas constituents,
moisture content, carbon grain size and bed depth(40).
2.3.1 Physical and Chemical Adsorption of Hydrogen Sulfide
Physical adsorption is the adsorption process in which activated carbon adsorbs H2S
predominantly by Van der Waals forces, while chemical reaction with the adsorbate is
negligible. Although activated carbon has significant amount of total surface area, the available
active sites that can effectively capture H2S from the gas stream are limited. Moreover, the H2S
bound to these sites can readily desorb upon temperature increase. These facts result in the
relatively slow kinetics and low sulfur loadings on the carbon when only physical adsorption
occurs. Mikhalovsky and Zaitsev(44) revealed that the carbon achieved a sulfur content of only up
to 6% at steady state in a static system under inert atmosphere (Argon). When air was used
instead of Argon, sulfur loading of the same carbon increased to 95%. Bandosz(45) stated that the
capacities obtained in physical sorption tests are much less than chemical sorption capacities.
The highest sulfur content in H2S chemical sorption with air can be as high as 120% by
weight(43).

2255
Many studies(43, 46-48) have suggested the possible mechanisms of H2S chemical sorption
over activated carbon in the presence of oxygen. The common knowledge of this process can be
summarized as follows: first, H2S and O2 diffuse to the internal surface of the catalyst particle;
O2 is then chemically adsorbed and dissociated into atoms while H2S adsorption is physical in
nature; the reaction between these two adsorbed molecules is the next step; sulfur is formed and
adsorbed at the internal surface leading to self-poisoning of the catalyst thereby influencing the
reaction course. The key factors for this reaction involves partial pressure of both O2 and H2S,
reaction temperature and the sulfur loading(43).
2.3.2 Kinetics of Hydrogen Sulfide Chemical Adsorption
The major reaction in hydrogen sulfide chemical adsorption involves the H2S oxidation
by oxygen to form elemental sulfur and water:
An investigation of H2S oxidation rate has been provided by Klein and Henning(47). It
was summarized that the rate varies from 0-1 and from 0.5-1 in terms of O2 and H2S respectively
at relatively low H2S concentrations. The existence of a steady state was found by
Sreeramamurthy and Menon(49), who reported that the molten sulfur flows down the catalyst bed
at temperatures above 120°C and the catalyst can remain active for days or weeks if the molten
sulfur is removed from the system. Ghosh and Tollefson(48) agreed with the above finding and
the authors also pointed out that one must consider the vaporization of sulfur from the pores,
pore size distribution and pore geometry in order to predict the rate of reaction at steady state.
SHSOSH2222
+→+ ( )3

2266
Blayden and Patrick(50) studied the impact of increasing reaction temperature on H2S
adsorption. They found that lower sulfurisation temperature resulted in higher sulfur retention,
while the sulfur retained on activated carbon rarely exceeded 5% at temperature from 300-
500°C. However, the carbons sulfurized at low temperature tended to be desorbed more readily
than that produced at higher temperatures. On the other hand, Coskun and Tollefson(43) showed
that sulfur loading increased with the increase in reaction temperature from 24°C to 152°C.
Sreeramamurthy and Menon(49) found that bed temperature usually rises about 10°C due
to H2S oxidation process. Using more carbon and higher H2S concentration can increase the bed
temperature to about 250% of the originally set temperature. Tests were also carried out using
6.25% H2S and furnace temperature was set to 65-100°C, in which bed temperature increased
from 23% to 34%. Both reaction rate and the maximum bed temperature appeared at about 8-10
minutes from the starting point. And the carbon bed cooled back to the original temperatures
only after two hours or even longer time.
The impact of H2S pressure in the stream was studied by Lee and Reucroft(51). They
showed that the sulfur loading increased with increasing H2S relative pressure. However, this
study was carried out only for H2S concentrations below 2%. However, it was also found that the
degree of temperature increase was independent of the preset temperature level.
Since the substantial sulfur build-up can reduce the surface area and the number of active
sites on the carbon, some studies suggested that further reaction might be catalyzed by the
reaction product other than active sites. Steijns and Mars(52) showed that hydrogen sulfide

2277
oxidation was catalyzed by molten sulfur at low rates at temperatures above 130°C (sulfur
melting point is 119°C). This result is in perfect agreement with that of Iwasawa and
Ogasawara(53). On the other hand, Sreeramamurthy and Menon(49) found out that sulfur has no
catalytic effect at temperature between 65°C and 100°C and that no SO2 formed under these
conditions. Other studies investigated possible H2S conversion catalyzed by (43, 49, 54) and it was
concluded that sulfur deposited in the carbon pores has no catalytic ability below 115°C.
2.3.3 Side Reactions and By-Products
Several side reactions also occur on the carbon surface during H2S oxidation, which
produce sulfur compounds other than elemental sulfur(47):
Ghosh and Tollefson(48) suggested that the predominant reaction: H2S + ½O2 → H2O + S
can be carried out completely in the presence of activated carbon at temperatures below 200°C,
while SO2 and SOx will be produced substantially at the reaction temperatures above 200°C.
According to Mikhalovsky and Zaitsev(44), about 1% SOx was produced at 102°C, 5% SOx was
produced at 152°C, and 10% SOx was produced at 177°C. It was also concluded that high
oxygen/hydrogen sulfide ratio improved the formation of SOx. Moreover, Walker et al.(55)
2222SO2OH2O3SH2 +→+
4222SOHO2SH →+
S3OH2SOSH2222
+→+
22242SO2OH2SSHSOH ++→+
22881 SOOS →+
( )4
( )7
( )6
( )5
( )8
2288
revealed that chemisorption of SO2, and/or its dissociation products, was small between 50-
300°C (amounting to about 1% of the total surface area).
Bandosz(45) suggested that at temperatures below 100°C, where most water can be
retained, H2S can be converted to SO2 and further to H2SO4 in the water film. H2S impregnated
carbon was found to have a pH value of 2, which the author suggested was due to the acidity of
sulfuric acid formed. On the other hand, Mikhalovsky and Zaitsev(44) found that no acidic
products were formed when 15% H2S in argon was adsorbed on carbon at 20°C. Sulfur was
measured through photoelectron spectra as S0, SIV and SVI, which the authors attributed to the
formation of elemental sulfur, C=S, C-S-H and C-S-C. Moreover, Blayden and Patrick(50)
concluded that sulphurization by heating a carbon in the presence of H2S vapor favors the
formation of surface complexes through surface reactions only at temperatures above 300°C.
2.3.4 Impact of Surface Chemistry
2.3.4.1 Acidic Oxygen-Containing Functional Groups.
Long-term exposure to air or heating in oxygen leads to the formation of acidic oxygen-
containing functional groups on activated carbon. Boehm et al.(56, 57) and Coughlin and Ezra(58)
concluded that the “Free valences” at the edges of graphitic layer planes of microcrystalline
carbon are very reactive and can form compounds with any suitable foreign atoms present.
Therefore, functional groups or surface compounds can be expected almost exclusively at the
layer edges. Coughlin and Ezra(58) also suggested that foreign atoms and molecules which do not

2299
covalently bound to the graphite edges can only be weakly bounded to the basal faces by means
of graphitic π electron system.
The effect of acidic functional groups in carbon adsorption was reported differently when
different adsorbates were taken into concern. Vidic et al.(59) concluded that the presence of acidic
surface functional groups hindered the ability of activated carbon to adsorb phenolic compounds.
This result was also reported in another study on the adsorption of phenol and nitrobenzene
molecules from aqueous solution(58). On the other hand, it seems that the functional groups tend
to enhance gas phase H2S adsorption. Bandosz et al.(45, 60) concluded that carbon with large
number of acidic sites (including all types of functional groups) has better performance in H2S
adsorption. However, this better performance of carbon as indicated by the author is not the
result of single influence of functional groups. Other factors such as: water uptake, basic groups
and large number of pores larger than 30D also have their roles in the reaction. Cariaso and
Walker(46) also suggested that chemisorption is strongly sensitive to the geometry of the carbon
surface and that activation in O2 at 300°C creates a template susceptive to subsequent oxygen
chemisorption. In their study, the oxidation rate was significantly higher for the O2-activated
carbon than for the CO2-activated carbon (CO2 activation was conducted at 900°C).
Furthermore, Mikhalovsky and Zaitsev(44) pointed out that both pre-sorbed oxygen and oxygen
from the feed gas are involved in the H2S oxidation and carbon surface functional groups
contributed significantly to the formation of SOx.
Boehm et al.(56, 57) utilized an acid/base titration method to classify acidic functional
groups into four major groups which include: carboxyl, lactonic, phenol, and carbonyl groups.

3300
These groups can evolve as CO or CO2 from the carbon surface upon heating to different
temperatures. The decomposition temperatures for these groups are as follows: carboxyl groups
(200-400°C)(60) < lactonic groups (250-600°C)(59) < hydroxyl groups (500-600°C)(59) < phenol
and carbonyl groups (500-900°C)(59, 61). It was also suggested by Papirer et al.(62) that carboxyl,
lactonic and phenol groups can be broken at 400°C to form ether-type structures while carbonyl
groups resists pyrolysis.
Quantitative measurement of these four groups (as well as basic groups) by Boehm
titration(56, 57) is based on the fact that each type has different acidity that can be neutralized by
different basic groups. However, as was also pointed out by the authors, the functional groups
detected by this method account for only 50% of the analytically determined oxygen content.
Moreover, acid/base titration technique does not differentiate between acidic groups and other
acidic impurities, nor does it differentiate between basic functional groups and delocalized
electrons.
Radovic et al.(63, 64) suggested that H2 treatment at elevated temperatures stabilizes carbon
surface and maintains the carbon basicity, because H2 not only removes most of the acidic
functional groups from carbon surface sites but also stabilizes these sites to avoid re-adsorption
of oxygen. This behavior is due to the formation of stable C-H bonds. It is also possible that
increasing the basicity can increase the hydrophobicity of the carbon surface and increase
electron-withdrawing ability of the constituents on the aromatic ring.

3311
2.3.4.2 Metal, Metal Oxides and Promoters.
All the virgin activated carbons contain certain amount of metals and metal oxides that
originally existed in the base materials or were formed during the activation processes. Some of
these impurities are believed to promote the adsorption efficiency of the carbon. It was reported
that the presence of promoters (impurities or additional catalysts) can reduce the activation
energy of H2S oxidation reaction by 12-20 kJ/mol(47).
It has been already known that oxides of iron, zinc, and copper are used in industry as
absorbents or catalysts for H2S removal from different gaseous media at 20-200°C. The H2S
removal at low temperatures mainly occurs due to gas-solid reactions in a thin hydrated lattice of
metal oxides, which leads to the formation of sulfides. Carbonates of calcium and magnesium
also have high affinity for H2S adsorption in wet condition due to neutralization reactions(41).
According to Bandosz et al.(41), sludge-derived adsorbents which are rich in Fe, Zn, Cu, and
aluminum oxides that have weight losses between 20-30% after acid washing also have much
better performances for H2S removal.
Other promoters such as: sodium and iron(46), potassium iodide, silver iodide, steam at
temperatures below 100°C(47), vanadium-grafted catalyst at sulfur melting point(44), and caustic
soda(61), have also been proven to improve the carbon performance for H2S uptake.
3322
2.3.5 Impact of Surface Texture and Particle Size
Surface texture of activated carbon includes several aspects, such as: total surface area,
pore size distribution, and pore geometry. These properties are mainly governed by the carbon
base material and activation process.
Lee and Reucroft(51) compared H2S uptake by coal-based (activated with KOH) and
wood-based (activated with H3PO4) carbons at low pressure range (<2%) and found that coal-
based carbon achieved over 12% sulfur loading compared to less than 7% for wood-based
carbon. Activated carbons with lower surface area generally adsorbed more H2S than those with
higher surface area when H2S pressure was below 1%. The authors concluded that the degree of
surface area development and the limiting micropore volume generally control the adsorption
process in the high relative pressure range through the micropore filling mechanism. This
conclusion is consistent with results of Bandosz(45), which showed that predominantly
microporous materials with high surface areas does not necessarily give better performance. The
author suggested that because H2S is a small molecule (diameter = 4.2 D), microporous materials
should be favorable for physical adsorption due to the enhancement of the adsorption potential.
On the other hand, adsorbents with large portions of mecopores and relatively small surface area
may favor the creation of water film that can facilitate H2S chemi-sorption and higher sulfur
deposition(45).
Cariaso and Walker(46) showed that mass transport resistance within the carbon particles
has a negligible effect on reaction rate when carbon particle size was reduced from 28×48 mesh

3333
to 150×250 mesh. The authors suggested that particle size reduction to 150×250 mesh size would
not be sufficient to reduce average micropore length.
2.3.6 Impact of Water Vapor
As mentioned before, steam promotes the formation of sulfuric acid at temperatures
below 100°C. Kaliva and Smith(65) observed that humidity promotes H2S oxidation at room
temperature: the oxidation rate increased by a factor of 6 for an increase in relative humidity by a
factor of 3. Bandosz(45) suggested that H2S breakthrough capacity is dependent on water uptake.
On the other hand, Ghosh and Tollefson(48) showed that the sorption of water is negligible at
125-200°C. Moreover, Steijns and Mars(52) observed a significant decrease in H2S conversion at
200°C when water vapor was added to the feed stream at the level twice that produced by H2S
oxidation.
The mostly commonly cited mechanism for the impact of water vapor on the reaction is
through the formation of a water film on the internal carbon surface at low temperatures that
facilitates the dissociation of O2 and H2S(61). The presence of oxygen-containing groups is
favorable for water sorption through hydrogen bonds with water at the edge of carbon
crystallites. Water molecules tend to adsorb firstly on oxygen-containing groups and then on the
water which was already adsorbed to finally become water clusters (condensation or water
film)(58).

3344
3.0 MATERIALS AND METHODS
3.1 Materials
3.1.1 Reaction Gases
Gases that were used to study H2S oxidation reaction are listed in Table 3.1 together with
information about manufacturers and purities.
Table 3.1 Reaction Gases
Reaction Gases Manufacturer Purity
H2S Matheson Gas Products, Pittsburgh, PA 99.99%
H2S (in N2) Praxair, Inc., Los Angeles, CA 5%±2%
N2 Praxair, Inc., Pittsburgh PA 99%
O2 Praxair, Inc., Pittsburgh PA 99.99%
3.1.2 Virgin Carbons
Five virgin activated carbons: BPL, F400, PCB, BD, and Centaur (Calgon Carbon
Corporation, Pittsburgh, PA) were used in this study as received. Two uniform particle sizes,
namely 10×16 (16×20 for Centaur) and 170×200 U.S. mesh size, were obtained by grinding and
sieving the granular carbons. All the virgin carbon samples were thoroughly washed to remove
fines and dried in an oven at 120°C. Dried carbons were stored in a dessicator until use. The
research designation, base material, manufacturer, trade name, and particle size for each carbon
sample are given in Table 3.2.
3355
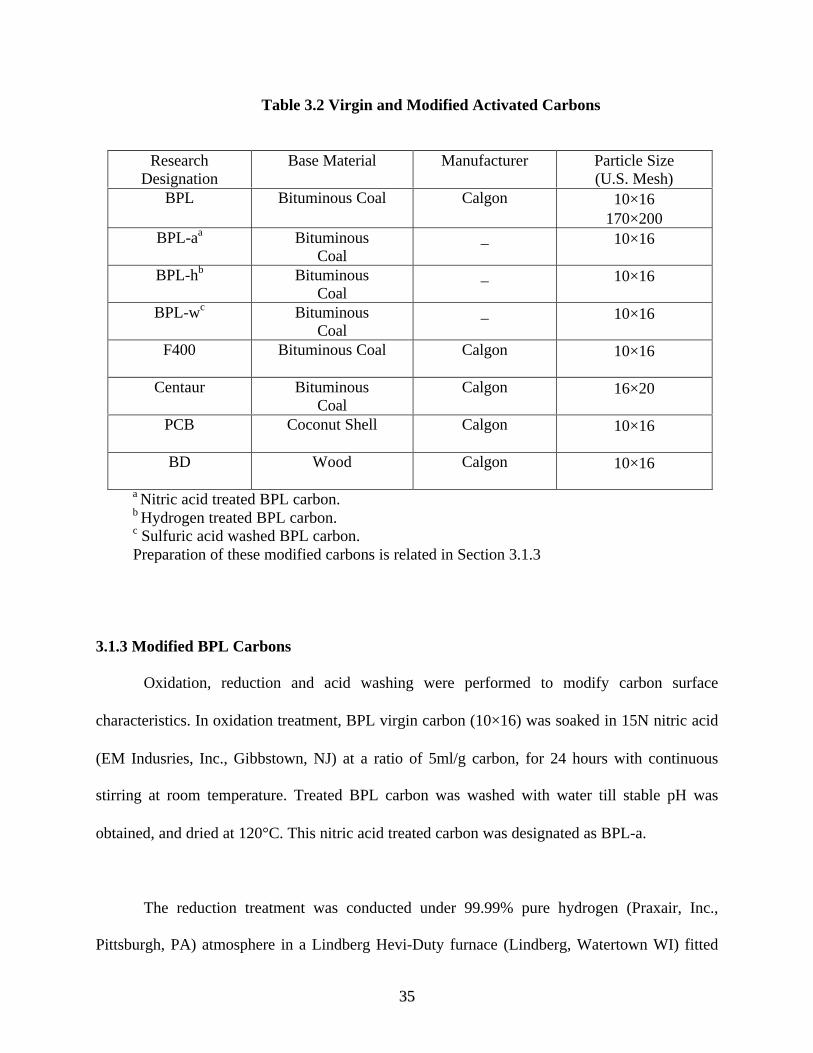
Table 3.2 Virgin and Modified Activated Carbons
ResearchDesignation
Base Material Manufacturer Particle Size(U.S. Mesh)
BPL Bituminous Coal Calgon 10×16170×200
BPL-aa BituminousCoal
_ 10×16
BPL-hb BituminousCoal
_ 10×16
BPL-wc BituminousCoal
_ 10×16
F400 Bituminous Coal Calgon 10×16
Centaur BituminousCoal
Calgon 16×20
PCB Coconut Shell Calgon 10×16
BD Wood Calgon 10×16
a Nitric acid treated BPL carbon. b Hydrogen treated BPL carbon. c Sulfuric acid washed BPL carbon. Preparation of these modified carbons is related in Section 3.1.3
3.1.3 Modified BPL Carbons
Oxidation, reduction and acid washing were performed to modify carbon surface
characteristics. In oxidation treatment, BPL virgin carbon (10×16) was soaked in 15N nitric acid
(EM Indusries, Inc., Gibbstown, NJ) at a ratio of 5ml/g carbon, for 24 hours with continuous
stirring at room temperature. Treated BPL carbon was washed with water till stable pH was
obtained, and dried at 120°C. This nitric acid treated carbon was designated as BPL-a.
The reduction treatment was conducted under 99.99% pure hydrogen (Praxair, Inc.,
Pittsburgh, PA) atmosphere in a Lindberg Hevi-Duty furnace (Lindberg, Watertown WI) fitted

3366
with a mollite tube. BPL virgin carbon (10×16) in the sealed mollite tube was flashed with 99%
nitrogen for 30 minutes at room temperature to remove air. Nitrogen was then replaced by pure
hydrogen with a flow rate of 0.2L/min. The carbon was then heated at a rate of 200°C/hr to a
maximum temperature of 900°C, followed by outgassing the sample at the maximum
temperature for another 10 hours before cooling back to room temperature at a rate of 200°C/hr.
The carbon was used immediately after preparation to reduce oxygen chemical adsorption which
normally occurs during storage. This carbon was designated as BPL-h.
BPL virgin carbon (10×16) was also treated with 10N sulfuric acid (Aldrich Chemical
Company, Milwaukee, WI) at a ratio of 5mL/g carbon to remove metal and metal oxides from
the carbon surface. This treatment was carried out for 24 hours with continuous stirring. The
carbon was then washed and dried in the same way as BPL-a sample. This sulfuric acid washed
BPL carbon was designated as BPL-w.
3.1.4 Deionized Water
The water used in experiments has been purified using reverse osmosis (RO Pure LP,
Sybron/Barnstead Inc., Boston, MA) and deionization (Nanopure II, Sybron Barnstead Inc.,
Boston, MA).

3377
3.2 Methods
3.2.1 Sulfur Impregnation
3.2.1.1 Experimental Set-Up.
Figure 3.1 illustrates the experimental setup of sulfur impregnation through hydrogen
sulfide oxidation over carbon catalyst. Pure N2 served as an inert carrier gas and was mixed with
O2 and H2S entering the carbon bed. Flow rate of each gas stream was controlled by a needle
valve. A total gas flowrate of 0.2L/min was maintained for all the experimental runs. The
reaction was carried out in a ¾-inch inner diameter stainless steel reaction column charged with
1g of activated carbon sample. A 200 U.S. Mesh size stainless steel sieve was placed
downstream in the column to support the carbon sample. The column was placed in a laboratory
oven (Cole Palmer Model 05015, Cole Parmer Instrument Co., Niles, IL) in order to maintain
stable temperature during the reaction. Exhaust gases were sent to a sodium chloride (NaCl)
solution to remove the remaining hydrogen sulfide and then were vented into the fume hood.
3.2.1.2 Selection of Impregnation Conditions.
Bench-scale fixed-bed H2S oxidation over activated carbons was previously investigated
in some research(45-48, 50, 52) in which different H2S impregnation procedures and parameters were
chosen to study the nature of this reaction. The following is a brief summary of experimental
parameters that have been utilized in these studies:
§ Total gas flow rate: 0.2-0.5L/min
§ Carbon particle size: Granular, 20×40(43), 70×90, and 150×250(46) U.S.
3388
mesh size
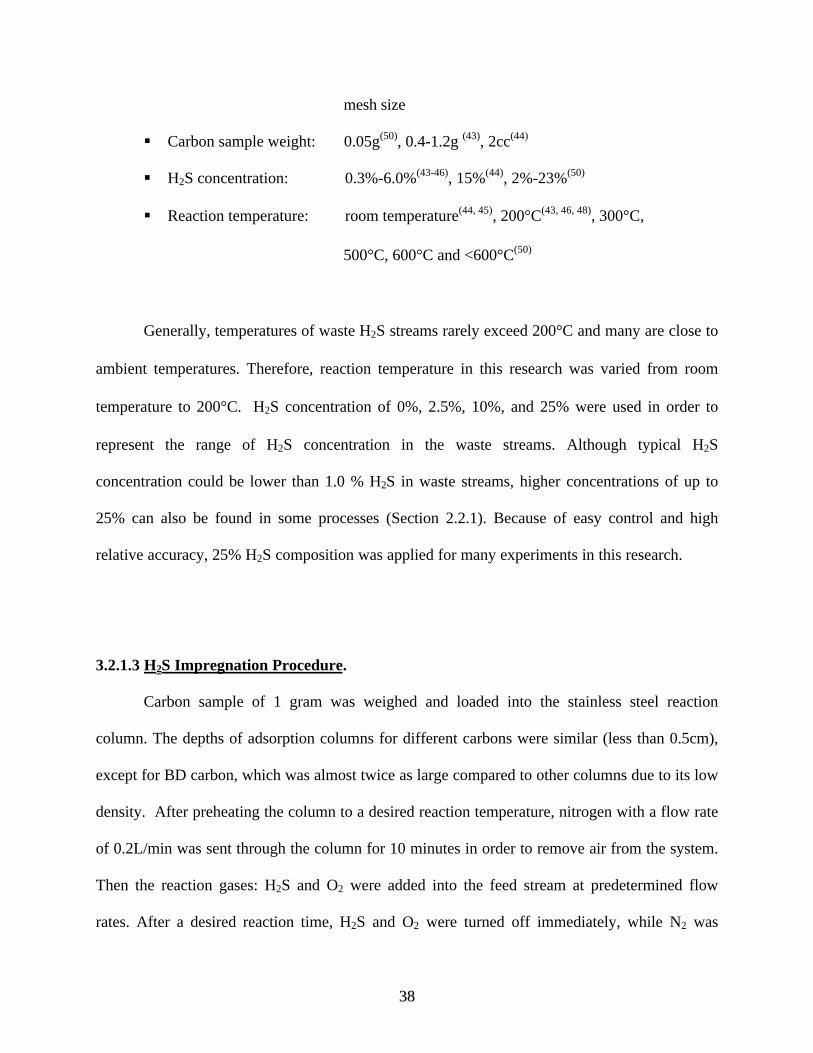
§ Carbon sample weight: 0.05g(50), 0.4-1.2g (43), 2cc(44)
§ H2S concentration: 0.3%-6.0%(43-46), 15%(44), 2%-23%(50)
§ Reaction temperature: room temperature(44, 45), 200°C(43, 46, 48), 300°C,
500°C, 600°C and <600°C(50)
Generally, temperatures of waste H2S streams rarely exceed 200°C and many are close to
ambient temperatures. Therefore, reaction temperature in this research was varied from room
temperature to 200°C. H2S concentration of 0%, 2.5%, 10%, and 25% were used in order to
represent the range of H2S concentration in the waste streams. Although typical H2S
concentration could be lower than 1.0 % H2S in waste streams, higher concentrations of up to
25% can also be found in some processes (Section 2.2.1). Because of easy control and high
relative accuracy, 25% H2S composition was applied for many experiments in this research.
3.2.1.3 H2S Impregnation Procedure.
Carbon sample of 1 gram was weighed and loaded into the stainless steel reaction
column. The depths of adsorption columns for different carbons were similar (less than 0.5cm),
except for BD carbon, which was almost twice as large compared to other columns due to its low
density. After preheating the column to a desired reaction temperature, nitrogen with a flow rate
of 0.2L/min was sent through the column for 10 minutes in order to remove air from the system.
Then the reaction gases: H2S and O2 were added into the feed stream at predetermined flow
rates. After a desired reaction time, H2S and O2 were turned off immediately, while N2 was

3399
continuously purged through the carbon bed for another 10 minutes to remove unreacted gases.
Then the impregnated sample was collected from the reaction column and cooled down to room
temperature, followed by immediate sulfur content measurement and thermogravimetric analysis
(TGA). Carbon impregnation under each set of reaction condition was conducted at least 3 times
and the average value of experimental results is reported in all cases.
3.2.2 Sulfur Content Determination
Sulfur content of impregnated samples was determined using a Leco Model SC-132
Sulfur Determinator (Leco Co., St. Joseph, MI). After preheating the furnace of the determinator
to a temperature of 1200°C, a ceramic boat containing about 100mg of sample was placed inside
the furnace. Sulfur in the carbon sample is oxidized with oxygen (Praxair Inc., Pittsburgh, PA) to
sulfur dioxide and the evolved SO2 is measured by an infrared (IR) detector. Calculated results
are displayed in terms of percent sulfur. Standard sample (Leco Co., St. Joseph, MI) of known
sulfur content (3.87%±0.06%) was used for the calibration of the sulfur determinator.
In order to define the linear range of sulfur measurement, a series of samples composed
of sand and a known amount of sulfur were measured using sulfur determinator. Experimentally
measured sulfur content of these samples as a function of theoretical sulfur content is displayed
in Figure 3.2. The results revealed that sulfur measurement has good linear relationship within a
range of 0-7%, suggesting that a sample with sulfur content higher than 7% needs proper dilution
in order to be measured accurately. Therefore, samples with high sulfur content were accurately
weighed, ground if they were granular carbons, and mixed with sand (sulfur content of the sand

4400
is less than 0.005%) in order to dilute actual sample concentration into a linear instrument range.
Each sample was measured at least 3 times and the average sulfur content was reported in all
cases.
3.2.3 Thermogravimetric Analysis
Thermogravimetric Analysis (TGA) was conducted using a Thermogravimetric Analyzer
TGA7 (Perkin-Elmer Corporation, Norwalk, CT) to investigate thermal stability of carbon
samples. Each sample was first heated from room temperature to 120°C at a rate of 10°C/min,
where it was kept for 10 minutes to remove moisture. Then the temperature was raised to 460°C
at a rate of 17°C/min, where it remained for another 10 minutes to remove sulfur (sulfur boiling
point is 445°C). The sample weight was measured during the whole heating process and was
reported as a percent of the initial sample weight.
Prior to thermogravimetric analysis, both weight and temperature calibrations of TGA7
were conducted to ensure data reliability. Weight calibration was accomplished within a range of
0-100mg using a 100mg standard provided by the manufacturer (Perkin-Elmer Corporation,
Norwalk, CT). Temperature calibration was conducted within a range of 20-900°C. (The actual
sample weight used in this study was from 20-30mg and the actual temperature was from 20-
460°C.)
Differential Thermogravimetric Analysis (DTA), was also performed on several samples
by calculating differential sample weight loss as a function of time. Similar initial sample

4411
weights were used for different samples and differential weight loss of these samples was
divided by the initial sample weights to give DTA profiles for better comparison among these
samples:
DTA (min-1) = Differential Weight Loss (mg/min) ÷ initial sample weight (mg)
3.2.4 Surface Functional Group Measurement
To classify and quantify oxygen-containing acidic functional groups (acidic groups) and
basic groups existing on the carbon surface, Boehm titration(56, 57) was performed on several
carbon samples. Targeted functional groups and related reaction agents are listed in Table 3.3.
Standard methods (Method 2310B and 2320B)(66) were used to measure the original
concentrations of prepared basic and acidic reaction agents: 0.25N and 0.05N NaOH, 0.05N
NaHCO3, 0.05N Na2CO3, and 0.05N HCl. Standardization of 0.05N NaOH solution was
conducted using 0.05N Potassium Hydrogen Phthalate (KHP) solution by titrating the solution to
pH 4.5. The standardized NaOH solution was then used to determine the concentration of 0.05N
HCl by titrating the solution to pH 7. The standardized HCl was then used to measure other
carbonate solutions by titrating these solutions to pH 7 also.
3.2.4.1 Acidic Functional Groups.
Two grams of carbon sample was accurately weighed and soaked in 100ml of appropriate
solutions in 160 mL glass vials. Teflon stoppers and aluminum caps were used to seal the vials in

4422
order to prevent interference of carbon dioxide in the air. The vials were placed in a rotator and
rotated end over end for 24 hours. The reaction solution was separated by filtration through a
0.45 µm nylon membrane and titrated to determine the remaining acid or base. Reaction
solutions without carbon sample were also treated and titrated using the same procedure to
provide control blanks.
After removing carbon from the solution, the amount of remaining base was titrated to
pH 7 using 0.05N HCl solution. Base consumed by the acidic functional groups on the carbon
surface was calculated as the difference between the amount of acid required to titrate the
remaining base in the filtrate and the amount of acid required to titrate the control blank to the
same endpoint (pH 7). The amount of acidic sites for a specific group were calculated under the
assumption that 0.25N NaOH neutralizes total acidity; 0.05N NaOH neutralizes carboxyl,
phenolic, and lactonic groups; Na2CO3 neutralizes phenolic and lactonic groups; and NaHCO3
only reacts with phenolic groups.
The phenolic group content on the carbon surface was determined as the amount of
0.05N NaHCO3 consumed by the carbon sample. Lactonic group content was calculated as the
difference between the amounts of 0.05N Na2CO3 and 0.05N NaHCO3 consumed by the carbon.
Carboxyl group content was obtained by subtracting the amount of 0.05N Na2CO3 consumed by
the carbon from the amount of 0.05N NaOH consumed. Finally, carbonyl group content was
calculated as the difference between the amounts of 0.25N NaOH and 0.05N NaOH reacted with
the carbon.

4433
Table 3.3 Targeted Functional Groupsand Reaction Solutions Used in Boehm Titration
Functional group to be neutralized Reaction solution
Total acidic groupsa 0.25N NaOH
Carboxyl, lactonic and phenolic groups 0.05N NaOH
Lactonic and phenolic groups 0.05N Na2CO3
Phenolic groups 0.05N NaHCO3
Basic groups 0.05N HCl
a. Total acidic groups include: carbonyl, carboxyl, lactonic and phenolic groups
3.2.4.2 Basic Functional Group.
Basic group content was evaluated by reacting the carbon in 0.05N HCl solution using
the similar procedure as that for acidic groups. At equilibrium, the filtrate was separated from
carbon and was titrated to pH 7 using 0.05N NaOH solution. The basic group content was
calculated as the additional NaOH required to reach the endpoint for the filtrate as compared to
the control blank.
3.2.5 pH Measurement
The pH of the carbon sample was measured by placing two grams of carbon in 100ml de-
ionized water (DI water). After the sample was rotated for 24 hours, the filtrate pH was measured
using a pH meter (Accument pH meter 25, Fisher Scientific, Pittsburgh, PA).

4444
3.2.6 Ash Content Measurement
Ash content was determined by combusting the carbon sample in a muffle furnace (Type
F62730, Barnstead/Thermolyne, Dubuque, IA). After preheating the furnace to 500°C, tare-
weighed crucibles with known amount of carbon samples were placed in the furnace and the
furnace temperature was maintained at 500°C for 10 hours before the samples were cooled down
to room temperature and transferred to a desiccator. The sample residuals were carefully
weighed and calculated in terms of percent ash content. Each sample was measured at least 3
times and the average ash content value is presented in this report.
3.2.7 Carbon Bed Temperature Measurement
A K type thermocouple (nickel-chromium vs. nickel-aluminum) was installed to measure
the actual temperature changes in the carbon bed. As illustrated in Figure 3.3, the tip of the
thermocouple was inserted into the carbon sample from the effluent side through the supporting
screen and the thermocouple signal was measured by a digital thermometer (Type 2168A,
Omega Engineering, Inc., Stamford, CT).
3.2.8 Leakage Tests in the System
A soap bubble test on joints in the H2S impregnation system was conducted regularly to
ensure that no leaks developed during the experiments. Inlet and outlet flow rates of the feeding
gas were measured using a rotameter and showed no detectable difference.

4455
4.0 RESULTS AND DISCUSSIONS
4.1 Impact of Reaction Temperature
The impact of reaction temperature on H2S oxidation with 25% O2 in the feed stream can
be observed from Figure 4.1. Generally, at temperatures below 100°C, sulfur content increases
with an increase in temperature. The change in sulfur deposition from room temperature to
100°C tends to increase when higher H2S concentrations are applied. This behavior indicates that
temperature change of the system may have more impact for higher H2S concentrations than for
the lower.
Almost all the samples exhibited slight decrease in sulfur loading when the reaction
temperature increased from 100°C to 200°C. The reason for this deactivation can be attributed to
the generation of sulfur oxides, which usually occurs when oxygen reacts with H2S or elemental
sulfur at higher reaction temperature. It was already demonstrated that the reaction:
can be carried out to completion at temperatures below 200°C(43, 49). On the other hand, at
reaction temperatures above 200°C, SO2 and SOx will be produced at a significant rate.
Michalovsky and Zaitsev(44) observed that 1% SOx can be produced at 102°C, 5% at 152°C and
10% at 177°C. Moreover, Walker et al.(55) found that SO2 adsorption on activated carbon
decreases sharply from 3% to 0.3% with an increase in temperature from 50°C to 150°C, and
that SO2 adsorption is negligible above 250°C. Therefore, the decrease in sulfur content above
SOHOSH222
12
+→+( )3

4466
100°C on Figure 4.1 is due to some H2S or sulfur being converted to SOx that can not be
retained on the carbon surface.
Previous study showed that high oxygen to hydrogen sulfide ratio favors the production
of SOx(46), which could be one of the reasons for low sulfur deposition in experiments with low
H2S concentrations when oxygen pressure remained at excess level (25%).
Since the H2S oxidation is a highly exothermic reaction with heat generation of up to 53
kcal/mole, it is important to investigate the actual temperature of the reaction bed during H2S
oxidation with 25% O2. Tests with 25% and 2.5% H2S in the feed stream were conducted at
room temperature and the actual temperature measurement as a function of time is shown in
Figure 4.2. When comparing reactions with high and low H2S concentrations in the feed stream,
it is clear that the high H2S concentration reacts more dramatically. The maximum bed
temperature reached above 70°C at 8-11 minutes and then dropped to about 45-50°C, where it
remained throughout the rest of the experiment. Sharp and early temperature increase observed
for 25% H2S stream is due to fast H2S transfer through the pore structure and the heat release that
subsequently accelerates further H2S oxidation. This result is in agreement with conclusion of
Sreeramamurthy and Menon(49) that the catalytic activity has the same trend as the temperature of
the catalyst with both of them showing a steep maximum within a short period of time from the
start of the reaction. Reaction conducted using 2.5% H2S in the feed stream, on the other hand, is
limited by relatively low mass transfer rate. Mild temperature increase from 19-24°C may be too
small to overcome the effect of low diffusion in order to accelerate the reaction to a higher rate.

4477
Ghosh and Tollefson(48) also reported that actual bed temperature usually increases about
10°C above the “set temperature”. Sreeramamurthy and Menon(49) observed a 250% temperature
increase when pure H2S stream was treated at 100°C using a 10g carbon bed. Temperature
increase is high in the present study (approximately 250% increase using 1g carbon) probably
because the reaction was conducted at low temperature 20°C, where the same energy generated
by the reaction would cause a dramatic temperature increase. It is also possible to deduce that
when the “set temperature” is high, other reactions, such as: SO2 generation (which is
endothermic and requires high energy for initiation), the evaporation of sulfur, water and/or
gaseous by-products, can also consume part of the reaction-produced heat. Thus, less bed
temperature increase is more likely to be observed at high initial temperature conditions. Since
the degree of temperature increase is directly dependent on H2S concentration, initial
temperature, and the carbon weight, the combined effects of these parameters should be taken
into consideration in order to utilize reaction heat and provide operation safety in large-scale
applications.
4.2 Impact of H2S Concentration and Reaction Time
Figure 4.1 also shows the impact of H2S concentration on sulfur loading. In general,
sulfur loading increases with an increase in H2S concentration. This increasing trend is easy to
understand because H2S oxidation initiates from the physical sorption of H2S. Therefore, more
H2S in the feed gas means more reactant specie can be transferred onto the carbon inner surface
so that higher amount of sulfur will be formed.

4488
Sulfur loading and sulfur conversion ratio (sulfur loading/sulfur input) as the function of
reaction time are illustrated in Figure 4.3. It can be observed that sulfur loading increases with
prolonged reaction time for both high and low H2S concentrations. Previous work(24) showed that
over 50% sulfur loading can be achieved by reacting H2S with oxygen over carbon catalyst for
about 2 hours at 150°C. In the present study with higher H2S concentration (25%) impregnation,
10 minutes reaction time was found to be sufficient to accomplish 13% sulfur loading at room
temperature.
It can also be seen in Figure 4.3 that the conversion ratio (sulfur loading/sulfur input)
decreases after the sulfur loading reaches a certain level. In addition, conversion ratio is much
lower for high H2S concentration than that for low H2S concentration, although the former
conditions resulted in much higher sulfur loading for the same time period. These results indicate
that the activity of carbon catalyst is dependent on the sulfur coverage because the reaction may
be hindered after available active sites were partially blocked by elemental sulfur. As can be seen
from Figure 4.3, higher sulfur deposit results in lower conversion rate. Direct comparison of
these two cases shows that the conversion ratio for high H2S concentration starts to decrease
when sulfur content reaches as high as 27%, while for the low H2S concentration conversion
ratio declines from the early stages of the reaction when the sulfur content is below 5%.
Nevertheless, lower influent H2S concentrations would be more desirable for practical
applications because they would result in lower sulfur emission from this type of air pollution
control system.

4499
According to Iwasawa and Ogasawara(53), first deposition of sulfur tends to fill
mesopores with radii ranging from 40-150D. Further deposition tends to fill pores ranging from
7D to 25D, which represent the major part of the total pore volume. Jankowska et al.(67)
suggested that deposited sulfur will also form new porous structure (transient pores), thereby
converting mesopores into numerous micropores. High H2S concentration may help to quickly
reach the point when most of the porosity is present in the form of micropores that facilitates
condensation of sulfur and its effective deposition. However, diffusion of H2S into small pores
becomes slower, which causes the reaction rate to decrease. On the other hand, low H2S
concentration never makes a big impact on the apparent pore size distribution but the low driving
force for sulfur diffusion prevents significant sulfur conversion inside carbon particles.
As can be seen on Figure 4.2, the heat produced in the case of low H2S concentration is
too small to have an impact on the kinetics of the reaction, while high temperature increase in the
case of the high H2S concentration certainly improves the reaction rate. In their investigation of
the conversion of low H2S concentration (0-2%) by activated carbon, Lee and Reucroft(51)
concluded that the key factors appeared to be the surface chemistry and/or micropore size.
4.3 Impact of Oxygen Input
Figure 4.4 compares sulfur content of BPL carbon exposed to 25% H2S in the feed gas in
the presence and absence of oxygen. It is apparent that sulfur content increases dramatically
throughout the whole temperature range by adding 25% oxygen into the feed stream. Addition of
oxygen increases carbon capacity from 4% to 13% even at room temperature because H2S is

5500
more readily oxidized to sulfur in the presence of sufficient electron acceptor (oxygen). On the
other hand, the reactions with no oxygen in the feed stream still achieved a little sulfur loading
from 2% to 4%. This sulfur may be a result of H2S physisorption as well as chemisorption
involving oxygen-containing functional groups.
Differential weight loss represents the rate of weight loss as a function of time.
Normalization of the differential weight loss profiles is accomplished by dividing differential
weight loss with initial sample weight so that reactions performed with different sample sizes can
be compared. Figure 4.5 compares derivative weight losses of pure sulfur (in sand) and carbons
exposed to 25% H2S at 100°C and without oxygen in the feed stream. Carbon produced with
25% oxygen in the feed stream has 27.1% sulfur and it exhibited initiation of the weight loss at
the same temperature (200°C) as the sample containing 3.4% of pure sulfur mixed with sand.
This similar thermal stability indicates that pores of the impregnated carbon are saturated with
pure sulfur that is most likely located close to the external surface of the carbon particles.
It can also be observed from Figure 4.5 that the carbon impregnated without oxygen input
started weight loss at higher temperature than pure sulfur sample, although both have similar
sulfur content (3.05% vs. 3.4%). The higher thermal stability of this impregnated carbon is most
likely due to the fact that the sulfur is deposited deeper inside the carbon pores, which results in
slower diffusion of sulfur vapor out of the pore structure and requires higher energy to facilitate
the process. This result also suggests that the acidic oxygen-containing functional groups on the
carbon surface can serve as electron acceptors for H2S oxidation.

5511
It is also seen in Figure 4.5 that the carbon exposed to H2S in the absence of oxygen
exhibited significant weight loss below 100°C where no measurable weight loss was observed
for the carbon impregnated with sulfur in the presence of oxygen. This weight loss at
temperature below 100°C can be attributed to physically adsorbed H2S because humidity build-
up is negligible at the reaction temperature (100°C). Therefore, it seems that H2S chemisorption
is the predominant process on the activated carbon in the presence of excess oxygen.
4.4 Impact of Particle Size
Figure 4.6 shows the sulfur contents of PAC and GAC carbons when the reactions were
conducted at 100°C. It can be seen that GAC showed higher adsorption capacity than PAC for all
reaction times evaluated in this study.
Particle size decrease from 4×10 to 170×200 mesh size increases the external area by
only 0.05m2/g, which is a tiny number compared with the original total surface area of 1050-
1150m2/g (GAC, type BPL 4×10, Calgon Corporation, Pittsburgh, PA). Furthermore, the
diameter of PAC particle is at least 4 orders of magnitude larger than micropores. Therefore,
breaking particles to 170×200 mesh size is not sufficient to destroy micropores and affect the
total surface area. Moreover, no significant difference in carbon bed depth was found between
these two carbons, which indicates that Empty Bed Contact Time (EBCT) is similar for GAC
and PAC. Therefore, it seems that neither the total surface area nor the EBCT is the key reason
to cause the low capacity of PAC.

5522
One possibility is that the destruction of large particles can affect pore structures, namely
the presence of long transport pores. These pores have wide openings connected to the particle
surface, and are winding into the particle to connect with micropores. When destroyed, these
pores may fail to facilitate diffusion of the reacting species into micropores where most
adsorption and reaction is believed to occur. Since the number of available micropores is
essential for the carbon capacity, reducing the access to these micropores may eventually reduce
the sulfur loading.
4.5 Thermal Stability of H2S Impregnated Activated Carbons
The sulfur content of impregnated carbon was measured by a Leco Sulfur Analyzer.
Sulfur content and TGA weight loss obtained for BPL carbons impregnated at different reaction
temperatures are compared in Figure 4.7. It is obvious that weight losses of all the samples
caused by heating in TGA apparatus are in agreement with the amount of sulfur measured by
Leco analyzer. It is also important to note that in all cases, all of the sulfur was removed from the
carbon surface upon heating to 400°C. Further increase in temperature to 460°C resulted in
negligible weight change of these samples.
One major concern about the application of activated carbons impregnated with
elemental sulfur through H2S oxidation for mercury control will be the thermal stability of these
adsorbents. According to Chang and Offen(7), typical Hg containing flue gas from a coal-fired
power plant has the temperature from 121-177°C. Energy & Environmental Research Center
(University of North Dakota) also reported that most mercury control devices would not

5533
significantly change the flue gas temperature(10). The only exception is the hot-side ESP, whose
operational temperature can reach 250-400°C. Therefore, the derivative weight losses of
impregnated carbons from room temperature to the sulfur dew point (20-460°C) were measured
and compared in Figure 4.8. Similar results were found for the samples produced at different
reaction temperatures. All three samples experienced weight loss at temperatures above 210°C,
which is higher than the realistic process temperatures. Therefore, nearly no sulfur loss from
these adsorbents would occur in full-scale applications even if they were produced through low
temperature impregnation processes.
4.6 Impact of Surface Modification of BPL Carbon
4.6.1 Hydrogen Gas Treatment
Three surface treatments were applied to BPL virgin carbon in order to evaluate the
impact of total acidity, basicity and ash contents of the carbon on the uptake of H2S. Because the
ability of acidic functional groups to influence adsorption by activated carbon was demonstrated
in some cases(41, 45, 68), it is important to find out their impact on H2S adsorption. Therefore, BPL
virgin carbon was treated in H2 gas at 900°C for 10 hours and this BPL carbon is denoted as
BPL-h. Surface properties of BPL-h carbon are shown in Table 4.1.
As can be seen in Table 4.1, hydrogen treatment at 900°C is capable of eliminating most
of the acidic groups from the carbon surface. Measurement of specific types of surface functional
groups shows that no carboxyl or lactonic groups were left after hydrogen treatment because

5544
these types of surface groups decompose at lower temperature when compared to other acidic
groups.
Table 4.1 Surface Properties of Virgin and Modified BPL Carbons
Carbons Total Aciditya
(µeq/g)Basicity(µeq/g)
PH Ash(%)
BPL 249 456 6.6 6.83
BPL-h 54 507 9.3 7.2
BPL-a 1317 141 3.2 6.28
BPL-w 425 385 7.2 4.37
Performance of BPL-h carbon for H2S sorption is shown in Figure 4.9. It is clear that
BPL-h achieved much lower sulfur content when compared to BPL. H2 treatment not only
reduces the number of functional groups, but also terminates most reactive edge sites resulting in
deactivation of carbon surface for further catalysis. The mechanism of deactivation of surface
sites is due to the reaction between highly active carbon atoms with H2 to form C-H bonds,
which fixes the free electrons(65).
However, BPL-h carbon gradually regained its capacity to promote H2S oxidation as the
reaction temperature increased from 20°C to 200°C. This finding is in agreement with Radovic et
al.(63), who showed that re-adsorption of oxygen takes place at a high rate at 150°C, but is
negligible at room temperature. Therefore, it seems that some of the inhibited surface sites on
BPL-h carbon can be reactivated at elevated temperature. As a consequence, the impact of H2
treatment diminished for the higher H2S oxidation temperatures.
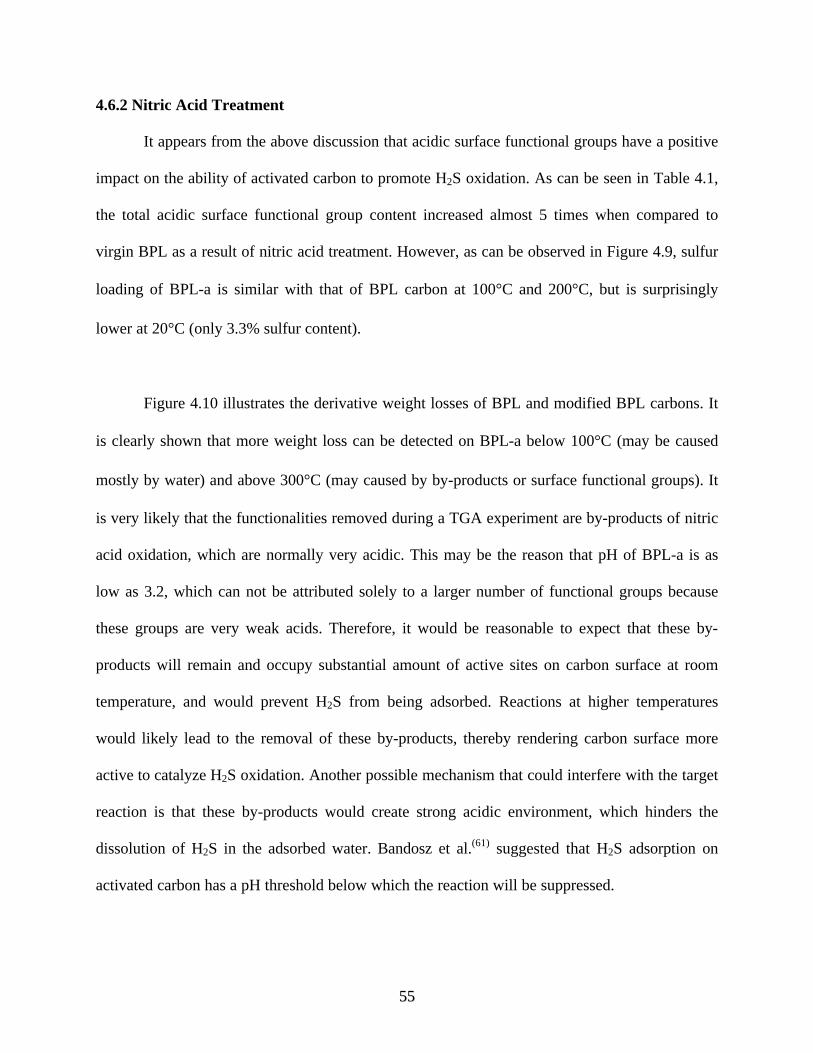
5555
4.6.2 Nitric Acid Treatment
It appears from the above discussion that acidic surface functional groups have a positive
impact on the ability of activated carbon to promote H2S oxidation. As can be seen in Table 4.1,
the total acidic surface functional group content increased almost 5 times when compared to
virgin BPL as a result of nitric acid treatment. However, as can be observed in Figure 4.9, sulfur
loading of BPL-a is similar with that of BPL carbon at 100°C and 200°C, but is surprisingly
lower at 20°C (only 3.3% sulfur content).
Figure 4.10 illustrates the derivative weight losses of BPL and modified BPL carbons. It
is clearly shown that more weight loss can be detected on BPL-a below 100°C (may be caused
mostly by water) and above 300°C (may caused by by-products or surface functional groups). It
is very likely that the functionalities removed during a TGA experiment are by-products of nitric
acid oxidation, which are normally very acidic. This may be the reason that pH of BPL-a is as
low as 3.2, which can not be attributed solely to a larger number of functional groups because
these groups are very weak acids. Therefore, it would be reasonable to expect that these by-
products will remain and occupy substantial amount of active sites on carbon surface at room
temperature, and would prevent H2S from being adsorbed. Reactions at higher temperatures
would likely lead to the removal of these by-products, thereby rendering carbon surface more
active to catalyze H2S oxidation. Another possible mechanism that could interfere with the target
reaction is that these by-products would create strong acidic environment, which hinders the
dissolution of H2S in the adsorbed water. Bandosz et al.(61) suggested that H2S adsorption on
activated carbon has a pH threshold below which the reaction will be suppressed.

5566
Moreover, the weight loss for BPL-a above 300°C can also be attributed to the
decomposition of functional groups. A number of literature references(59, 61, 69) reported that
carboxylic acids and lactonic groups decompose above 200°C, especially when carbon was
oxidized at 20-150°C. Substantial amount of acidic groups produced in nitric acid treatment
could block active sites for H2S catalysis at room temperature, or completely occupy micropores
where most of the adsorption is supposed to take place.
4.6.3 Acid Washing
As shown in Table 4.1, acid washing in diluted sulfuric acid reduced the ash content of
BPL carbon by 36% compared with the original BPL. However, this acid washed BPL carbon
(BPL-w) did not show any significant changes in terms of sulfur loading when compared with
BPL-a except of low impregnation temperature (Figure 4.9). This indicates that the ash content
of BPL carbon could play an important part in promoting the H2S oxidation only at low
temperature while it does not contribute to catalytic properties of activated carbon at higher
temperatures. Based on all the results shown in Figure 4.9, it can be concluded that while the
presence of acidic groups and surface metals (ash) may be important for catalytic properties of
the carbon at room temperature, they become less relevant at higher reaction temperatures.
4.7 Performances of Different Commercial Available Virgin Carbons
Several commercially available virgin carbons were also tested for their surface
properties and the results are listed in Table 4.2. Capacity of these carbons to adsorb H2S after 10
minutes of reaction time at different reaction temperatures are shown in Figure 4.11.
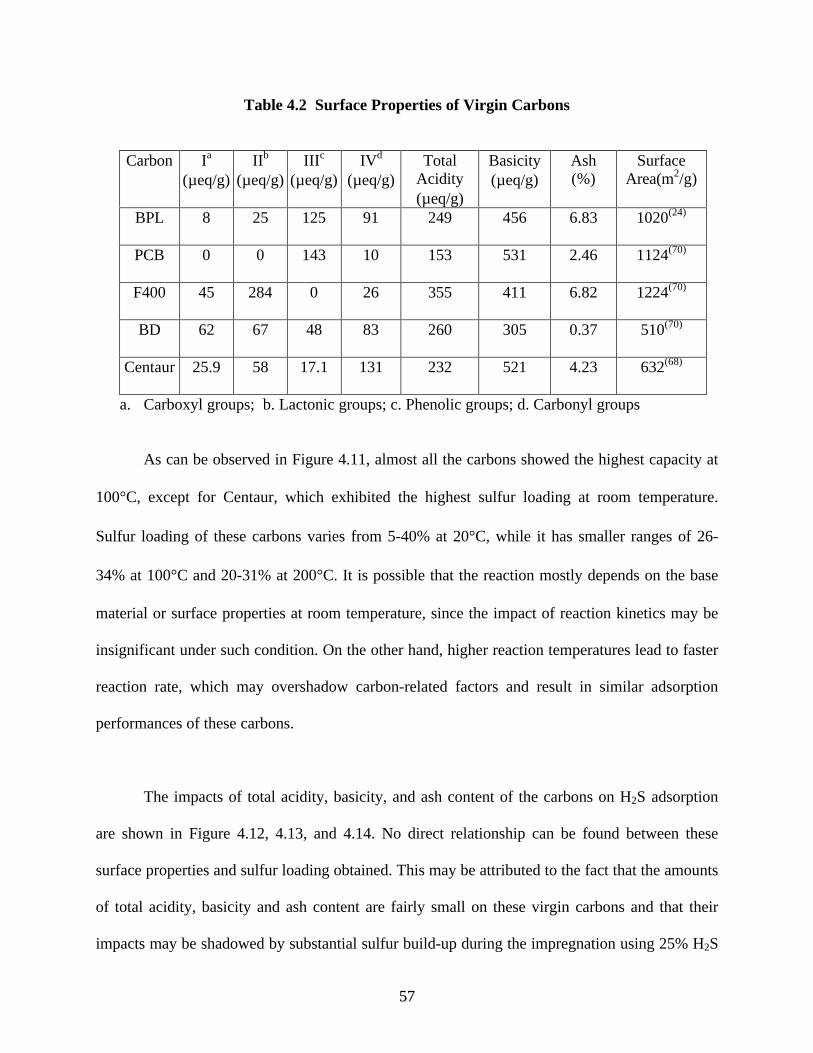
5577
Table 4.2 Surface Properties of Virgin Carbons
Carbon Ia
(µeq/g)IIb
(µeq/g)IIIc
(µeq/g)IVd
(µeq/g)Total
Acidity(µeq/g)
Basicity(µeq/g)
Ash(%)
SurfaceArea(m2/g)
BPL 8 25 125 91 249 456 6.83 1020(24)
PCB 0 0 143 10 153 531 2.46 1124(70)
F400 45 284 0 26 355 411 6.82 1224(70)
BD 62 67 48 83 260 305 0.37 510(70)
Centaur 25.9 58 17.1 131 232 521 4.23 632(68)
a. Carboxyl groups; b. Lactonic groups; c. Phenolic groups; d. Carbonyl groups
As can be observed in Figure 4.11, almost all the carbons showed the highest capacity at
100°C, except for Centaur, which exhibited the highest sulfur loading at room temperature.
Sulfur loading of these carbons varies from 5-40% at 20°C, while it has smaller ranges of 26-
34% at 100°C and 20-31% at 200°C. It is possible that the reaction mostly depends on the base
material or surface properties at room temperature, since the impact of reaction kinetics may be
insignificant under such condition. On the other hand, higher reaction temperatures lead to faster
reaction rate, which may overshadow carbon-related factors and result in similar adsorption
performances of these carbons.
The impacts of total acidity, basicity, and ash content of the carbons on H2S adsorption
are shown in Figure 4.12, 4.13, and 4.14. No direct relationship can be found between these
surface properties and sulfur loading obtained. This may be attributed to the fact that the amounts
of total acidity, basicity and ash content are fairly small on these virgin carbons and that their
impacts may be shadowed by substantial sulfur build-up during the impregnation using 25% H2S

5588
in the influent. Furthermore, no relevance was found when each of the acidic groups was
compared with sulfur loading (data not shown).
Figure 4.15 shows the relationship between sulfur loading and surface area of the carbons
used in this study. As can be observed, sulfur loading increases with surface area at room
temperature while it decreases at 200°C. The only exception to this trend is the Centaur carbon
that was produced using a proprietary process to enhance its catalytic ability at room
temperature. When reaction was conducted at 100°C, sulfur content seems more independent of
surface area. These trends may be due to the fact that most sulfur deposits on the carbon surface
may be in the liquid form at 100°C, which may alter the pore structure and change the adsorption
behavior of these carbons.
As shown in Figure 4.11, Centaur has the highest potential to catalyze H2S conversion at
room temperature (40% sulfur by weight). The reason for this better performance is not obvious,
because surface properties of Centaur are within the range of these observed for other carbons
used in this study. One possible explanation can be that the micropore volume of Centaur is high
(83% of its total pore volume as reported by Bandosz et al.(68)) which effectively adsorbs H2S
and retains more sulfur. Despite of its larger fraction of micropores, Centaur has a relatively
small surface area among all the carbons used (632 m2/g as shown in Table 4.2). It seems that
pore size distribution or pore geometry is much more important for H2S uptake than total surface
area. Unfortunately, the pore size distributions of other carbons are not available to compare with
that of Centaur. Therefore, it is not possible to fully explain the significance of pore size
distribution on this reaction.

5599
5.0 SUMMARY AND CONCLUSIONS
5.1 Summary
For higher H2S concentrations in the feed stream, it appears that, room temperature is
sufficient to achieve high sulfur loading. On the other hand, slight heating along with prolonged
reaction time should be used for low H2S concentrations in the feed streams. However,
temperatures above 100°C are not desirable since they will cause other pollutants, such as SOx
and SO2, to form and will reduce sulfur loading on the carbon surface. Actual catalyst bed
temperature increases during the reaction and the degree of increase varies with different H2S
concentrations in the influent gases. This behavior should be taken into account when
considering practical applications.
In general, reaction time and H2S concentration in the feed stream that are needed to
achieve sufficient sulfur content approximately of 10%, which was shown to be adequate for
mercury removal, can be broadly classified as follows: 10 minutes reaction time is enough when
high H2S concentration (e.g., 25%) is applied, while low H2S concentrations (e.g., 2.5%) require
longer time, but no more than 30 minutes. In terms of H2S conversion rate, the activated carbon
is more effective in removing low H2S concentrations than the highly concentrated streams.
Mechanisms of H2S oxidation under different H2S pressures differ for high and low H2S
concentrations. It seems that high H2S concentration in the feed stream initiates the reaction
quickly by providing large driving force for faster diffusion to inner pores. As a result, sulfur
loading increases quickly and is accompanied with significant heat generation. This generated
heat, in turn, will accelerate the degree of reaction rate until some degree of pore saturation is

6600
achieved. Although, the sulfur loading may still increase after significant micropore saturation is
accomplished, the rate of sulfur conversion decreases to the point that it makes the sorbent
unattractive for practical applications.
On the other hand, reaction with low H2S concentration in the feed stream starts slowly
and generates insufficient heat to improve the rate of reaction. As the reaction proceeds, small
amount of sulfur is formed steadily and the initial pore structure is altered by deposited sulfur.
This conversion of the pore structure towards micropores reduces the rate of mass transfer and
reduces the reaction rate. Heat generated by the reaction is fairly small to cause appreciable
temperature change in the reactor. Pore filling with deposited sulfur causes similar effect to that
already discussed for high H2S concentrations in the feed stream. However, it will take much
longer to reduce the reaction rate than with high H2S concentration because the carbon is still far
from saturation. By using longer EBCT or lower H2S concentration in the feed gas, conversion
rate would be maintained at higher level for a longer period of time
Surface oxygen that exist on the carbon surface in the form of acidic groups can react
with H2S to form elemental sulfur, but the sulfur loading will be limited to below 4%. Sulfur
loading can be greatly increased even at room temperature by adding excess oxygen to the
influent. Because the surface oxygen is located in the inner pores of the carbon particle, the
sulfur produced by this reaction has high thermal stability since steric blockage will prevent it
from easily diffusing out of the carbon particle. H2S oxidation without oxygen would result only
in physical sorption of H2S and low sulfur conversion that is not desirable for real applications.

6611
Performance of PAC for the conversion of H2S was observed in the present study to be
somewhat below that of a GAC. Surface area change from GAC to PAC is not very significant
and its influence was addressed in this study. Modified pore structure resulting in the increase of
transport pores could be the most possible reason for the lower capacity of PAC and further
study of the impact of pore size distribution is needed to fully explain these results.
Activated carbons impregnated with sulfur under all experimental conditions possess
good thermal stability. Even adsorbents produced at room temperatures will not loose sulfur at
temperatures below 210°C. Due to the existence of impurities and different sulfur molecular
structures, impregnated sulfur evaporates at temperature below the sulfur boiling point.
Information on the major sulfur structures or impurities could be helpful to better understand
more about sulfur reaction with activated carbon surface. This information can be perhaps
obtained using more sophisticated surface science techniques like Fourier Transform Infrared
Spectroscopy (FTIR) and Atomic Force Microscopy (AFM).
Sulfur deposited on carbon in impregnation below 200°C can be removed by heating the
sorbents to more than 400°C.
Hydrogenation of activated carbon surface is effective in reducing or even eliminating
acidic functional groups on the surface because it deactivates surface sites. As a result, the ability
of the carbon surface to convert H2S to sulfur is diminished. Nitric acid treatment causes total
acidity of the surface to increase greatly but it does not facilitate better performance in H2S
conversion, especially at room temperature. This ineffectiveness can be attributed to the

6622
combined effects of excess functional groups and acidic impurities. Unfortunately, the single
effect of acidic groups cannot be determined at this stage. Acid washing can cause the ash
content to decrease in BPL carbon. This treatment exerts the impact on the ability of activated
carbon to catalyze H2S oxidation only at room temperature.
The present study was not successful in identifying those surface properties that are
chiefly responsible for H2S oxidation to elemental sulfur in the presence of oxygen. This is not
so surprising because the catalytic surface used in this study is that of activated carbon, which is
known to possess multitude of properties, both chemical and morphological, that can catalyze
numerous reactions. In such situation, it is almost impossible to separate any single property and
evaluate its impact on a given reaction. To accomplish this goal, one would have to start with a
surface with much simpler chemical and morphological properties, such as highly oriented
pyrolytic graphite.
5.2 Conclusions
q Reaction conditions that achieve sufficient sulfur loading on BPL carbon for enhanced
mercury control (sulfur content is approximate 10%) are summarized in Table 5.1. In terms
of H2S conversion rate, activated carbon is more effective in removing H2S from low-level
waste streams than from highly concentrated streams. Actual catalyst bed temperature
increases during the reaction and the degree of increase varies with influent H2S
concentration. This behavior should be taken into account when considering practical
applications.

6633
Table 5.1 Summary of Reaction Conditions
H2S% ReactionTemperature
ReactionTime
O2% SulfurConversion
BedTemperature
High25%
RoomTemperature
10min 25% Low (up to 40%) High (250%)
Low2.5%
<100°C Up to 30min 25% High (up to 67%) Low (31%)
q High hydrogen sulfide concentration is more suitable for the impregnation process, if the
goal is to obtain high sulfur loading on activated carbon. On the other hand, higher
conversion rate can be achieved by using lower H2S concentration or longer EBCT (Empty
Bed Contact Time).
q H2S oxidation in the absence of oxygen is not desirable not only because it results in low
sulfur content on the carbon (below 4%), but also because physically adsorbed H2S can be re-
emitted from the sorbent during handling. Addition of oxygen in the feed gas can greatly
increase sulfur loading on BPL carbon.
q Activated carbons impregnated with sulfur under all experimental conditions are suitable for
enhanced mercury control under realistic process temperatures because of the thermal
stability of sulfur deposits. Sulfur deposited on activated carbon can only be removed by
heating the adsorbents to more than 400°C.
q Surface modifications (i.e., reduction, oxidation, acid washing) do not have much practical
relevance because their impact on the ability of activated carbon to catalyze H2S oxidation is
minimal.

6644
q Sulfur loading on activated carbons is not related to base material or surface properties, such
as total acidity, individual acidic functional group type, basicity, ash content, and total
surface area. Centaur is the best sorbent to achieve the highest sulfur loading at room
temperature.
6655
6.0 SUGGESTIONS FOR FUTURE WORK
q Mercury removal needs to be studied using H2S impregnated carbons produced under
different conditions to investigate the impact of different impregnation procedure on mercury
up-take.
q Because most H2S waste streams also contain a great amount of other constituents, such as
moisture, CO2, SO2, H2, N2, NH3, hydrocarbons, light oil or particulates, impacts of these
impurities on H2S oxidation over activated carbon surface are worth studying when
considering industrial application of this process.
q Impact of oxygen feeding scheme (i.e., continuous vs. pulsed) on reaction kinetics, sulfur
loading and bed temperature changes.
q To scale up impregnation system, some considerations have to be studied such as: carbon
load for maximum treatability, flow pattern of the feed gases, heat generation, and pressure
drop, in order to design reactors to achieve both high H2S conversion and sufficient sulfur
loading.
q Influence of carbon pore size distribution and pore structure on reaction kinetics to choose
better particle size, base material and carbon activation method.
q Sulfur speciation deposited on carbon should be studied to better understand kinetics, impact
of side reactions and effect of surface functional groups in catalyzing H2S oxidation.

APPENDIX

66
Figure 2.1 Comparison of Mercury Removal Efficiencies of Conventional APCDs(4)
FGD SDA FF CS-ESP (Coal) CS-ESP (Oil)
(%)
Mer
cury
Rem
oval
0
20
40
60
80
100
MaximumMeanMinimum
FGD: Flue gas desulfurization system SDA: Spray dryer adsorber FF: Fabric filters CS-ESP (Coal): Cold-side electrostatic presipitators (Coal fired)
CS-ESP (Oil): Cold-side electrostatic precipitators (Oil fired)

67
Figure 2.2 Possible H2S Emissions and Impregnation Points in Several Industrial Processes(30-34)
RawOil
Other Processes
Flares
Flares
Stack
H2SScrubb-ingTower
Tar, ammonia,light oils, etc.
FoulGas
CokeProducts
PM, VOCs,SO2, and CO2
Air
OtherProcesses
Ifsweet
If gas issour
LiquidGas Well
Flares
SulfurRecoveryPlant
ChemicalPlant
Distillator
Sweetening
Hydro-carcking
Coking
Furnace
SeparatorGasDistribution andUtilization
Furnace
Evaporator
HeatExchanger
Condenser
CokeOven
Possible H2SImpregnation Point
Wood chips, sulfur,air, water, Na2SO4,Na2S, Na2CO3,CaCO3, and NaOH
Raw coal,oil, and water
DirectContactEvaporator
RefineryKraft Mill
Natural Gas processing Facility Coke Production Facility
FlaresGas
Sweetening

68
Figure 2.3 Typical Claus Sulfur Recovery Units(37)
Condenser
Condenser
CatalyticConverter
CatalyticConverter
Tail Gas
Sulfur
Condenser Condenser
Condenser
Reaction Furnace
CatalyticConverter
CatalyticConverter
Tail Gas
Sulfur
Feed stock
Air
Possible H2SImpregnation Point

69
Figure 3.1 H2S Oxidation Experimental Set-Up
StainlessSteelColumn
Carbon
Oven
N2 99% O2
99.99%H2S
99.99%H2S 5%
Rotameter Dryer: CaSO4 Rotameter
NaClSolution

70
Figure 3.2 Linear Range of Sulfur Determinator
Theoretical Sulfur Content (%)
0 1 2 3 4 5 6 7 8 9 10
Mea
sure
d S
ulfu
r C
onte
nt (
%)
0
1
2
3
4
5
6
7
8
9
10
R-square=0.99183

71
Stainless SteelReaction Column
Thermocouple
Plastic Sleeve
PackingMaterial
CoarseScreen
Connected to aDigital Thermometer
Carbon
InletTube
OutletTube
Figure 3.3 Carbon Bed Temperature Measurement
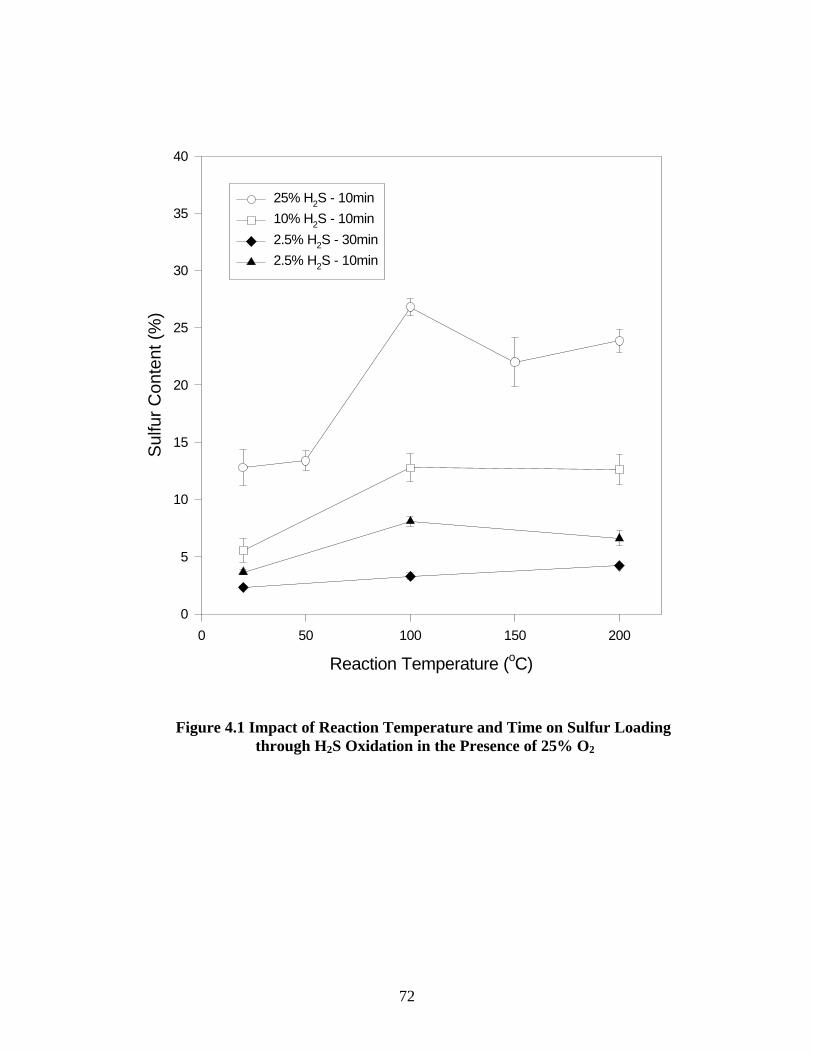
72
Figure 4.1 Impact of Reaction Temperature and Time on Sulfur Loading through H2S Oxidation in the Presence of 25% O2
Reaction Temperature (oC)
0 50 100 150 200
Sul
fur
Con
tent
(%
)
0
5
10
15
20
25
30
35
40
25% H2S - 10min
10% H2S - 10min
2.5% H2S - 30min
2.5% H2S - 10min

73
Figure 4.2 Actual Bed Temperature for Impregnation Using Different H2S Concentrations (25% O2 in the influent, set temperature = 20°°C)
Time (min)
0 5 10 15 20 25 30 35 40
Bed
Tem
pera
ture
(o C
)
20
30
40
50
60
70
80
90
100
25% H2S
2.5% H2S
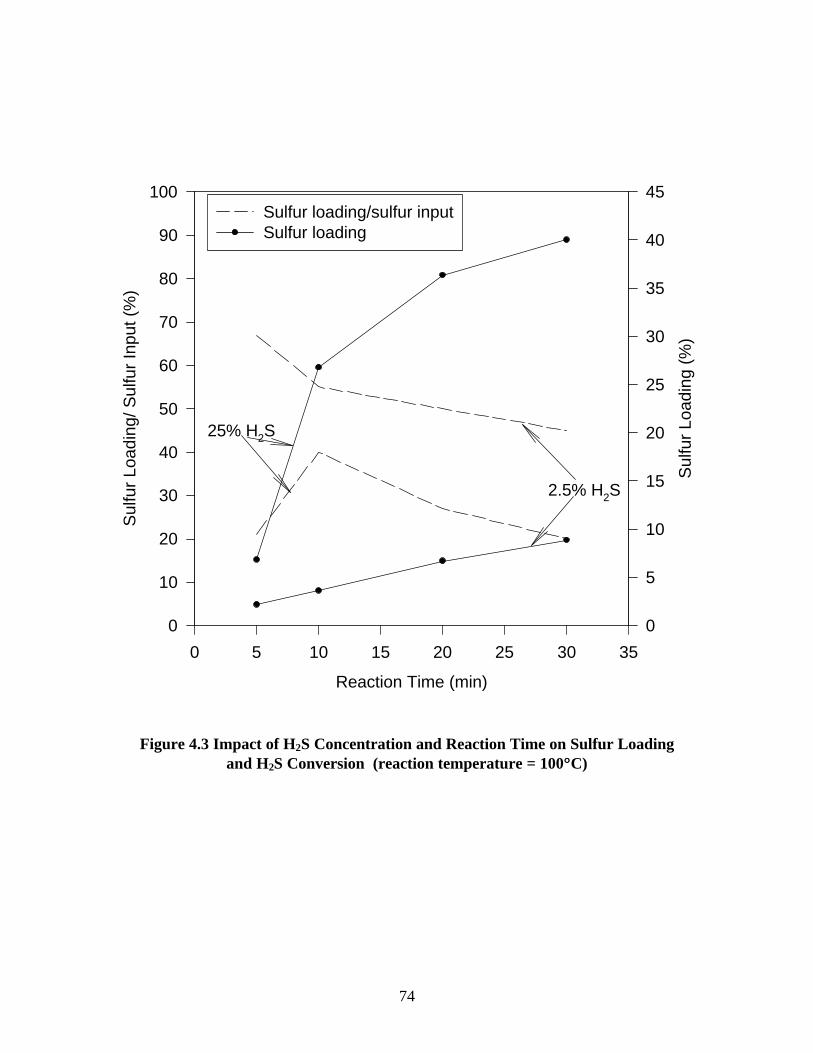
74
Figure 4.3 Impact of H2S Concentration and Reaction Time on Sulfur Loadingand H2S Conversion (reaction temperature = 100°°C)
Reaction Time (min)
0 5 10 15 20 25 30 35
Sul
fur
Load
ing/
Sul
fur
Inpu
t (%
)
0
10
20
30
40
50
60
70
80
90
100
Sul
fur
Load
ing
(%)
0
5
10
15
20
25
30
35
40
45Sulfur loading/sulfur inputSulfur loading
25% H2S
2.5% H2S

75
Figure 4.4 Impact of Oxygen Concentration on Sulfur Loading through H2S Oxidation (reaction time = 10 min)
Reaction Temperature (o
C)
0 50 100 150 200
Su
lfu
r C
on
ten
t (%
)
0
5
10
15
20
25
30
25% Oxygen0% Oxygen

76
Figure 4.5 DTA Profile for Pure Sulfur and Carbon Impregnatedwith Sulfur in the Presence and Absence of Oxygen
(25% H2S in the influent, reaction temperature = 100°°C)
Time (min)
0 10 20 30 40 50 60
DT
A (
min
-1)
0.00
0.01
0.02
0.03
0.04
Tem
per
atu
re (o
C)
0
100
200
300
400
500
25% Oxygen%S = 27.1%0% Oxygen%S = 3.05%Sulfur 3.4% in Sand
Temperature

77
Figure 4.6 Impact of Particle Size on Sulfur Loading (25% H2S and 25% O2 in the influent, impregnation temperature = 100°°C)
Time (min)
0 5 10 15 20 25 30 35
Su
lfu
r C
on
ten
t (%
)
0
5
10
15
20
25
30
35
40
45
GACPAC

78
Figure 4.7 Comparison of TGA and Sulfur Measurement forCarbons Impregnated with Sulfur at Different Temperatures
(25% H2S and 25% O2 in the influent)
Time (min)
0 10 20 30 40 50 60
Tem
per
atu
re (
C)
0
100
200
300
400
500
Wei
gh
t L
oss
% (
%)
70
75
80
85
90
95
100
105
Temperature
20oC 12.8% 13%
200oC 23.8% 22.5%100oC 26.8% 25.5%
Reaction Sulfur TGA temperature content weight loss
BPL virgin carbon

79
Figure 4.8 Thermal Stability of H2S Impregnated Carbons(25%H2S and 25% O2 in the influent, reaction time = 10 min)
Time (min)
0 10 20 30 40 50 60
Tem
pera
ture
(oC
)
0
100
200
300
400
500
DT
A (
min
-1)
-0.01
0.00
0.01
0.02
0.03
0.04
0.05
0.06
0.07
0.08
200oC
100oC
20oC
Temperature

80
Figure 4.9 Impact of Surface Modification on BPL Performance in H2S Impregnation (25% H2S and 25% O2 in the influent, reaction time = 10min)
Temperature (oC)0 50 100 150 200
Su
lfu
r co
nte
nt
(%)
0
5
10
15
20
25
30
BPL-aBPL-hBPLBPL-w

81
Figure 4.10 DTA Profiles for Virgin and Modified Carbons
Time (min)
0 20 40 60
Tem
pera
ture
(o C
)
0
100
200
300
400
500
DT
A (
min
-1)
0.000
0.005
0.010
0.015
BPL-aBPL-wBPL-hBPL
Temperature

82
Figure 4.11 Performances of Different Virgin Carbons in H2S Impregnation (25% H2S and 25% O2 in the influent, reaction time = 10 min)
Reaction Temperature (oC)
0 50 100 150 200
Sul
fur
Con
tent
(%
)
0
5
10
15
20
25
30
35
40
45
BPLF400PCBBDCentaur

83
Figure 4.12 Impact of Total Acidity on H2S Impregnation(25% H2S and 25% O2 in the influent)
Total Acidity (ueq/g)
100 150 200 250 300 350 400
Sul
fur
Con
tent
(%
)
0
5
10
15
20
25
30
35
40
45
20oC100oC
200oC

84
Figure 4.13 Impact of Basicity on H2S Impregnation (25% H2S and 25% O2 in the influent)
Basicity (ueq/g)
250 300 350 400 450 500 550
Sul
fur
Con
tent
(%
)
0
5
10
15
20
25
30
35
40
45
20oC100oC200oC

85
Figure 4.14 Impact of Ash Content on H2S Impregnation (25% H2S and 25% O2 in the influent)
Ash Content (%)
0 1 2 3 4 5 6 7 8
Sul
fur
Con
tent
(%
)
0
5
10
15
20
25
30
35
40
45
20oC100oC200oC

86
4.15 Impact of Surface Area on H2S Impregnation(25% H2S and 25% O2 in the influent)
Surface Area (m 2 /g)
400 500 600 700 800 900 1000 1100 1200 1300
Sul
fur
cont
ent (
%)
0
5
10
15
20
25
30
35
40
45
20 oC100 oC200 oC
Centaur
B D
BPL
P C BF400

BIBLIOGRAPHY

8877
BIBLIOGRAPHY
1. Locating and Estimating Air Emissions from Sources of Mercury and MercuryCompounds, EPA-454/R-97-012, U.S. Environmental Protection Agency, Office of AirQuality Planning and Standards (Research Triangle Park, NC), 1997
2. Mercury Study Report to congress, Vol. II: "An Inventory of Anthropogenic MercuryEmissions in the United States", EPA-452/R-97-004, U.S. Environmental ProtectionAgency, Office of Air Quality Planning and Standards and Office of Research andDevelopment (Research Triangle Park, NC), December 1997
3. Brooks, G., Estimating Air Toxics Emissions from Coal and Oil Combustion Sources,450/2-89-001, U.S. Environmental Protection Agency (Research Triangle Park, NC)
4. Proceedings of 1994 Pittsburgh Coal Conference, Pittsburgh, PA, September 1994, "ANew Survey of Mercury in U.S. Coals, by Bloom, N.S. and Prestbo, E.M.", Vol. 1,pp.563-568
5. Douglas, J., "Mercury in the Environment", EPRI Journal, Vol. 16, No. 8, (December,1991) pp. 4-11
6. Germani, M.S. and Zoller, W.H., "Vapor-Phase Concentrations of Arsenic, Selenium,Bromine, Iodine, and Mercury in the Stack of a Coal-Fired Power Plant", EnvironmentalScience and Technology, Vol. 22, No. 9, (1988) pp. 1079-1085
7. Chang, R. and Offen, G., "Mercury Emission Control Technologies: An EPRI Synopsis",Power Engineering, Vol. 99, No. 11, (1995) pp. 51-57
8. Srivastava, R.K., Sedman, C.B., and Kilgroe, J.D., Performance and Cost of MercuryEmission Control Technology Applications on Electric Utility Boilers, EPA-600/R-00-083, U.S. Environmental Protection Agency, Office of Research and Development, andNational Risk Management Research Laboratory (Research Triangle Park, NC),September 2000
9. Sloss, L.L., "Emissions and Effects of Air Toxic from Coal Combustion: An Overview",(Second International Conference on Managing Hazardous Air Pollutants, Washington,DC, 1993)

8888
10. University of North Dakota Energy & Environmental Center, "EPA Decision DirectsMercury Research", Center for Air Toxic Metals Newsletter, Vol. 7, Issue 1, (2000)
11. Noblett, Jr., J.G., Meserole, F.B., Seeger, D.M., and Owens, D.R., Control of Air Toxicsfrom Coal-Fired Power Plants Using FGD Technology, (Second International Conferenceon Manaing Hazardous Air Pollutants, Washington, DC, 1993)
12. EPA to Regulate Mercury and Other Air Toxics Emissions from Coal- and Oil-FiredPower Plants, Fact Sheet, U.S. Environmental Protection Agency (Research TrianglePark, NC), 14th December, 2000
13. Kilgroe, J.D., Srivastava, R.K., Sedman, C.B., and Thorneloe, S.A., Control of MercuryEmissions from Coal-Fired Electric Utility Boilers, Technical Memorandum, U.S.Environmental Protection Agency, National Risk Management Research Laboratory, AirPollution Prevention and Control Division (Research Triangle Park, NC), 25th October,2000
14. Proceedings of 1994 Pittsburgh coal Conference, Pittsburgh, PA, September, 1994,"Carbon Sorption of Trace Mercury Species, by Yong, B.C., Miler, S.J., and Laudal,D.L", Vol. 1, pp.575-580,
15. Lowe, P.A. and St. John, B., Activated Carbon Injection to Control Flue Gas MercuryEmissions, INTECH, Inc., (Potomac, MD)
16. Carey, T.R., Richardson, C.F., Change, R., Meserole, F.B., Rostam-Abadi, M., and Chen,S., "Assessing Sorbent Injection Mercury Control Effectiveness", prepared forpresentation at the 1999 AIChE Spring National Meeting, Houston, TX, March 14-18,(Unpublished)
17. Krishnan, S.V., Gullett, B.K., and Jozewicz, W., "Sorption of Elemental Mercury byActivated Carbons", Environmental Science and Technology, Vol. 28, (1994) pp. 1506-1512
18. Sinha, R.K. and Walker, P.L., "Removal of Mercury by Sulfurized Carbons", Carbon,Vol. 10, (1972) pp. 754-756
19. Vidic, R.D., Chang, M.T., and Thrunau, R.C, "Kinetics of Vapor-Phase Mercury Uptakeby Virgin and Sulfur Impregnated Activated Carbons", Journal of Air and WasteManagement Association, Vol. 48, (1998) pp. 247-255
20. Vidic, R.D. and McLaughlin, J.B., "Uptake of Elemental Mercury Vapors by ActivatedCarbons", Journal of the Air and Waste Management Association, Vol. 46, (March 1996)pp. 241-250

8899
21. Vidic, R.D. and Korpiel, J.A., "Effect of Sulfur Impregnation Method on ActivatedCarbon Uptake of Gas-Phase Mercury", Environmental Science and Technology, Vol.31, (1997) pp. 2319-2325
22. Liu, W., Vidic, R.D., and Brown, T.D., "Optimization of Sulfur Impregnation Protocolfor Fixed-Bed Application of Activated Carbon-Based Sorbents for Gas-Phase MercuryRemoval", Environmental Science and Technology, Vol. 32, (1998) pp. 531-538
23. Chang, M.T., M.S. Thesis, "Kinetics of Vapor-Phase Mercury Uptake by Virgin and Sulfur Impregnated Activated Carbons", civil and Environmental Engineering Department, University of Pittsburgh, Pittsburgh, PA. 1996
24. Kwon, S.J., M.S. Thesis, "Evaluation of Sulfur Impregnation Processes on DifferentSubstracts for the Production of Elemental Mercury Sorbents", Civil and EnvironmentalEngineering Department, University of Pittsburgh, Pittsburgh, PA. 1999
25. Sitting, M., Environmental Sources and Emissions Handbook, (New Jersey: Noyes DataCorporation), pp.66-72.
26. Graede, T.E., Haukins, D.T., and Claxton, L.D., Atmospheric Chemical CompoundsSources, Occurrence, and Bioassay, (New York: Academic Press), pp.66-68.
27. Health Effects of Low-Level Hydrogen Sulfide in Ambient Air, A Science Report toGovernor John Engler, by Michigan Environmental Science Board, Hydrogen SulfideInvestigation Panel (Knapps Center, Lansing, Michigan), August 2000
28. Goar, G.B., "Sulfur Recovery Technology", Energy Process, Vol. 6, No. 2, (June, 1986)pp. 71-75
29. Compilation of Air Pollutant Emission Factors, Public Number AP-42, Fifth Edition,Vol. I, Chapter 5.3: Natural Gas Processing, U.S Environmental Protection Agency(Research Triangle Park, NC), 1995
30. Compilation of Air Pollutant Emission Factors, Public Number AP-42, Fifth Edition,Vol. I, Chapter 5: Petroleum Industry, U.S. Environmental Protection Agency (ResearchTriangle Park, NC), 1995
31. Compilation of Air Pollutant Emission Factors, Public Number AP-42, Fifth Edition,Vol. I, Chapter 10: Wood Products Industry, U.S. Environmental Protection Agency(Research Triangle Park, NC), 1995
32. Compilation of Air Pollutant Emission Factors, Public Number AP-42, Fifth Edition,Vol. I, Chapter 12: Metallurgical Industry, U.S. Environmental Protection Agency(Research Triangle Park, NC), 1995

9900
33. Sulfuric Acid: Background Report, Public Number AP-42, Fifth Edition, Vol. I, Chapter5.17, OAQPS/TSD/EIB, Pacific Environmental Services, Inc. (Research Triangle Park,NC), prepared for U.S. Environmental Protection Agency (Research Triangle Park, NC),December 1992
34. Existing Process Gas Streams, KRS Chapter 224, 401 KAR 61:035, Department forNatural Resources, Division of Air Pollution (1986)
35. Reed, R.M. and Updegraff, N.C., "Removal of Hydrogen Sulfide from Industrial Gases",Industrial and Engineering Chemistry, Vol. 42, No. 11, (1950) pp. 2269-2277
36. Sulfur Recovery: Background Report, Public Number AP-42, Fifth Edition, Vol. I,Chapter 5.18, OAQPS/TSD/EIB, U.S. Environmental Protection Agency (ResearchTriangle Park, NC) 1995
37. Brown, F.C. and Harvey, W.W., Control of Hydrogen Sulfide Emission from GeothermalPower Plants, Department of Energy, Division of Geothermal Energy, (Washington,D.C), 1976
38. Review of New Source Performance Standards for Petroleum Refinery Claus SulfurRecovery Plants, from NTIS, U.S. Environmental Protection Agency (Research TrianglePark, NC)
39. Mullins, B.J., Atmospheric Emissions Survey of the Sour Gas Processing Industry, EPA-450/3-75-076, U.S. Environmental Protection Agency (Research Triangle Park, NC),October 1975
40. Nonhebel, G., Gas Purification Processes, (Cleveland, OH: CRC Press, the ChemicalRubber Co.), pp.243-274, 275-276, 338-339.
41. Bagreev, A., Bashkova, S., Locke, D.C., and Bandosz, T.J., "Sewage Sludge-DerivedMaterials as Efficient Adsorbents for Removal of Hydrogen Sulfide", EnvironmentalScience and Technology, Vol. 35, (2000) pp. 1537-1543
42. Compilation of Air Pollutant Emission Factors, Public Number AP-42, Fifth Edition,Vol. I, Chapter 11: Mineral Products Industry, U.S. Environmental Protection Agency(Research Triangle Park, NC), 1995
43. Coskun, I. and Tollefson, E.L., "Oxidation of Low Concentrations of Hydrogen Sulfideover Activated Carbon", The Canadian Journal of Chemical engineering, Vol. 58, (1980)pp. 72-76
44. Mikhalovsky, S.V. and Zaitsev. Y.P., "Catalytic Properties of Activated Carbons I. Gas-Phase Oxidation of Hydrogen Sulfide", Carbon, Vol. 35, No. 9, (1997) pp. 1367-1374
9911
45. Bandosz, T.J., "Effect of Pore Structure and Surface Chemistry of Virgin ActivatedCarbons on Removal of Hydrogen Sulfide", Carbon, Vol. 37, No. , (1999) pp. 483-491
46. Cariaso, O.C. and Walker, P.L, "Oxidation of Hydrogen Sulfide over MicroporousCarbons", Carbon, Vol. 13, (1975) pp. 233-239
47. Klein, J. and Henning, K., "Catalytic Oxidation of Hydrogen Sulphide on ActivatedCarbons", Fuel, Vol. 63, (August, 1984) pp. 1064-1067
48. Ghosh, T.K. and Tollefson, E.L., "Kinetics and Reaction Mechanism of HydrogenSulfide Oxidation over Activated Carbon in the Temperature Range of 125-200°C", TheCanadian Journal of Chemical Engineering, Vol. 64, (1986) pp. 969-976
49. Sreeramamurthy, R. and Menon, P.G., "Oxidation of H2S on Active Carbon Catalyst",Journal of Catalysis, Vol. 37, (1974) pp. 287-296
50. Blayden, H.E. and Patrick, J.W., "Solid Complexes of Carbon and Sulfur - I. SulphurisedPolymer Carbons", Carbon, Vol. 5, (1967) pp. 533-544
51. Lee, W.H. and Reucroft, P.J., "Vapor Adsorption on Coal- and Wood-Based ChemicallyActivated Carbons (III) NH
3 and H
2S Adsorption in the Low Relative Pressure Range",
Carbon, Vol. 37, (1999) pp. 21-26
52. Steijns, M. and Mar, P., "Catalytic Oxidation of Hydrogen Sulfide: Influence of PoreStructure and Chemical Composition of Various Porous Substances", Industrial andEngineering Chemistry Product Research and Development, Vol. 16, (1977) pp. 35-41
53. Iwasawa, Y. and Ogasawara, S., "Catalytic Oxidation of Hydrogen Sulfide onPolynaphthoquinone", Journal of Catalysis, Vol. 46, (1977) pp. 132-142
54. Steijns M. and Mars, P., "The Role of sulfur Trapped in Micropores in the CatalyticPartial Oxidation of Hydrogen Sulfide with Oxygen", Journal of Catalysis, Vol. 35,(1974) pp. 11-17
55. Stacy, W.O., Vastola, F.J., and Walker, P.L., "Interaction of Sulfur Dioxide with ActiveCarbon", Carbon, Vol. 6, (1968) pp. 917-923
56. Boehm, H.P., "Functional Groups on the Surfaces of Solids", Angewandte ChemieInternational Edtion, Vol. 5, No. 6, (1966) pp. 533-622
57. Boehm, H.P., Diehl, E., Heck, W., and Sappok, R., "Surface Oxides of Carbon",Angewandte Chemie International Edition, Vol. 3, No. 10, (1964) pp. 669-677
58. Couphlin, R.W. and Ezra, F.S., "Role of Surface Acidity in the Adsorption of OrganicPollutants on the Surface of Carbon", Environmental Science and Technology, Vol. 2,No. 4, (1968) pp. 291-297

9922
59. Tessmer, C.H., Vidic, R.D., and Uranowski, L.J., "Impact of Oxygen-Containing SurfaceFunctional Groups on Activated Carbon Adsorption of Phenols", Environmental Scienceand Technology, Vol. 31, (1997) pp. 1872-1878
60. Asib, F., Bagreev, A., and Bandosz, T.J., "Analysis of the Relationship between H2S
Removal Capacity and Surface Properties of Unimpregnated Activated Carbons",Environmental Science and Technology, Vol. 34, (2000) pp. 686-692
61. Bandosz, T.J., Bagreev, A., Adib, F., and Turk, A., "Unmodified versus Caustics-Impregnated Carbons for Control of Hydrogen Sulfide Emissions from SewageTreatment Plants", Environmental Science and Technology, Vol. 34, (2000) pp. 1069-1074
62. Papirere, E., Li, S., and Donnet, J.B., "Contribution to the Study of Basic Surface Groupson Carbons", Carbon, Vol. 25, No. 2, (1987) pp. 1069-1074
63. Menendez, J.A., Phillips, J., Xia, B., and Radovic, L.R., "On the Modification andCharacterization of Chemical Surface Properties of Activated Carbon: Microcalorimetric,Electrochemical, and Thermal Desorption Probes", Langmuir, Vol. 13, (1997) pp. 3414-3421
64. Menendez, J.A., Phillips, J., Xia, B., and Radovic, L.R., "On the Modification andCharacterization of Chemical Surface Properties of Activated Carbon: In the Search ofCarbons with Stable Basic Properties", Langmuir, Vol. 12, (1996) pp. 4404-4410
65. Kaliva, A.N. and Smith, J.W., "Oxidation of Low Concentrations of Hydrogen Sulfideby Air on a Fixed Activated Carbon Bed", The Canadian Journal of ChemicalEngineering, Vol. 61, (April 1983) pp. 208-212
66. APHA-AWWA-WPCF, Standard Methods, (17th, Washington, DC: American PublicHealth Association), pp.230-239.
67. Jankowska, H., Gajewski, M., Zieteck, S., and Swiatkowski, A., "Carbon-SulphurCompounds on the Surface of Carbon Blank and Activated Carbons. III. AdsorptionProperties of Carbon Having a Suphur-Modified Surface", International Polymer Scienceand Technology, Vol. 5, No. 10, (1978) pp. T44-T48
68. Bagreev, A. and Bandosz, T.J., "Study of Hydrogen Sulfide Adsorption on ActivatedCarbons Using Inverse Gas Chromatography at Infinite Dilution", Journal of Physics andChemistry, Vol. 104, (2000) pp. 8841-88847
69. Stohr, B. and Boehm, H.P., "Enhancement of the Catalytic Activity of ActivatedCarbons in Oxidation Reactions by Thermal Treatment with Ammonia or HydrogenCyanide and Observation of a Superoxide Species as a Possible Intermediate", Carbon,Vol. 29, No. 6, (1991) pp. 707-720

9933
70. Uranowski, L.J., Tessmer, C.H., and Vidic, R.D., "The Effect of Surface Metal Oxides onActivated Carbon Adsorption of Phenolics", Water Research, Vol. 32, No.6 (1997)pp.1841-1851