Embed Size (px)
Citation preview

Ž .Geoderma 102 2001 41–59www.elsevier.nlrlocatergeoderma
Sulfur fractions in particle-size separates of thesub-humid Ethiopian highlands as influenced by
land use changes
D. Solomon a,), J. Lehmann a, M. Tekalign b, F. Fritzsche a,W. Zech a
a Institute of Soil Science and Soil Geography, UniÕersity of Bayreuth, UniÕersitatsstr. 30,¨D-95440 Bayreuth, Germany
b Ethiopian Agricultural Research Organization, Debre Zeit Agricultural Research Center,P.O. Box 32, Debre Zeit, Ethiopia
Received 21 February 2000; received in revised form 24 August 2000; accepted 2 October 2000
Abstract
Extensive deforestation of natural forests in the Ethiopian highlands and their conversion tolow-input agriculture and plantations have caused severe soil degradation and significant changesin the ecosystem. We investigated the influence of land use changes on the amount, form and
Ž .distribution of sulfur S in bulk soils and size separates of the sub-humid highlands of southernŽ .Ethiopian. Surface soil samples 0–10 cm were collected from natural forest, tea plantation and
25 years cultivated fields at Wushwush and from Podocarpus dominated natural forest, Cupressusplantation and 30 years cultivated fields at Munesa sites. The total S contents ranged from 635 to1082 mg kgy1 soil and from 520 to 1040 mg kgy1 soil at Wushwush and Munesa, respectively.Organic S represented on the average 98% of the total S, while inorganic SO –S accounted for4
only 2%. C-bonded S was the dominant organic S fraction at both sites comprising 77–84% of thetotal organic S pool, whereas ester SO –S constituted merely for 16–23%. Total S and C-bonded4
Ž . Ž .S were highly significantly correlated P-0.001 with soil organic C SOC and N. However,correlation between ester SO –S and total S, SOC and N were weak. The CrS and NrS ratios4
ranged from 58 to 99 and from 5.7 to 7.9, respectively, and decreased generally in the order:sand)silt)clay. Continuous cropping resulted in 41% and 50% depletion of total S at
Ž . Ž .Wushwush and Munesa, respectively. In contrast, losses from the tea 34% and Cupressus 13%Žplantations were low. Sulfur depletions due to cultivation were lower than losses from SOC 55%,
. Ž .Wushwush; 63%, Munesa and N 52%, Wushwush; 60%, Munesa , suggesting that S was more
) Corresponding author. Tel.: q49-921-552248; fax: q49-921-552246.Ž .E-mail address: [email protected] D. Solomon .
0016-7061r01r$ - see front matter q2001 Elsevier Science B.V. All rights reserved.Ž .PII: S0016-7061 00 00103-8
( )D. Solomon et al.rGeoderma 102 2001 41–5942
resistant to mineralization compared to SOC and N. C-bonded S accounted for 88% and 73% ofthe total S depletion, whereas ester SO –S accounted only for 11% and 26% at Wushwush and4
Munesa, respectively. These results indicate that most of the S depletion occurred from C-bondedS. Based on our results, it is possible to conclude that S deficiency might occur in a foreseeablefuture, if the current depletion rate of SOM continues. Therefore, integrated soil and cropmanagement practices have to be developed, which involve the use of organic materials of farmand non-farm origins and inorganic fertilizers to combat the ongoing nutrient depletion in thesub-humid highlands agroecosystems of southern Ethiopia. q 2001 Elsevier Science B.V. Allrights reserved.
Keywords: C-bonded S; Deforestation; Ester SO –S; Plantation; Tropical agroecosystem4
1. Introduction
Ž .Sulfur S is highly reactive, existing in six oxidation states and movingamong the lithosphere, hydrosphere and atmosphere. Within the biosphere, it isfound in numerous chemical combinations and serves multiple biochemicalfunctions. As a result, the pathways of S in any ecosystem are complex and
Ž .intertwined with those of other elements Janzen and Ellert, 1998 .Agriculture has claimed a large share of productive terrestrial environment in
the tropics and sub-tropics by deforestation of natural forests. The concern overrapid deforestation has prompted studies to determine how the tropical ecosys-tem responds to this disturbance. These have included topics such as climate,hydrology, primary production as well as decomposition of soil organic matterŽ . Ž .SOM and nutrient cycling Odum and Pigeon, 1970; Zech et al., 1996 . Anoften neglected essential nutrient in these studies has been S. Although someresearchers attempted to determine the status and form of S in tropical soilsŽNeptune et al., 1975; Acquaye and Kang, 1987; Stanko-Golden and Fitzgerald,
.1991 , almost all the information on S in soils have been derived fromŽinvestigations of soils from temperate regions Tabatabai and Bremner, 1972;
.Bettany et al., 1980; Zucker and Zech, 1985 .Extensive deforestation of natural forests from the Ethiopian highlands and
their subsequent conversion into low-input agriculture has caused extensive soilŽ .degradation physical, chemical and biological , and thereby a decline in
agricultural land productivity. Moreover, the recent introduction of plantationcrops such as tea further aggravated the destruction of remnant natural forests inthe southwestern parts of the country resulting in significant changes in theecosystem. Almost no quantitative information is available on the impact ofsuch land use changes on the amount, form and transformation of organic andinorganic S species in bulk soils and particle-size separates of these sub-humidtropical highland agroecosystems. Soils of the tropics generally have low total Scontents because of low S containing parent materials or extreme weathering
Ž .and leaching losses Acquaye and Kang, 1987 . In addition, even soils thatinherently contain sufficient S can often develop deficiencies after a period of

( )D. Solomon et al.rGeoderma 102 2001 41–59 43
intensive cultivation due to crop removal, SOM depletion, leaching and erosionŽlosses and by the use of low-S containing fertilizers Biederbeck, 1978; Acquaye
.and Kang, 1987 . The changes in management practices imposed on agriculturallands affect S dynamics, not only within agroecosystems, but also among other
Ž .terrestrial biomes Janzen and Ellert, 1998 . Therefore, there is a need toconduct a comparative study between the different land use systems in order tounderstand S pool sizes and transformations within these pools in tropical soils.
ŽA number of methods exist for fractionation of soil S Lowe and DeLong,. Ž .1963; Tabatabai, 1982 . Recently, Kowalenko 1993a,b introduced a faster and
Žmore versatile method for fractionation of soil S into organic S C-bonded and.ester SO –S and inorganic SO –S forms using hydriodic acid reduction of4 4
SO2y. Physical fractionation of soil according to particle-size separates com-4
bined with degradative chemical techniques offers a significant potential forŽevaluating the influence of land use changes on SOM Anderson et al., 1981;
.Zech et al., 1996; Solomon et al., 2000 . Thus, soil S fractionation combinedwith particle-size fractionation may permit to identify the nature, distributionand forms of S and follow S dynamics in tropical soils.
The objectives of this study were, therefore, to assess the impact of land usechanges on the amount, form and distribution of organic and inorganic Sfractions in bulk soils and particle-size separates in the sub-humid tropicalhighland ecosystems of southern Ethiopia.
2. Materials and methods
2.1. Site description
Ž .The study was conducted at the southwestern highlands Wushwush and theŽ .southern Rift Valley escarpment Munesa of Ethiopia. Wushwush is located at
7819XN and 36807XE. The altitude of the area is 1900 m above sea level. Meanannual temperature is 188C with an average annual precipitation of 1800 mm.Geologically, the area is associated with Jimma volcanics with abundant rhyo-
Žlites and trachybasalts. Soils of the area are classified as Plinthic Alisols FAO,.1997 , with clayey texture and dark reddish brown color. The Wushwush natural
Ž . Žforest is mainly composed of Olea africana Mill. , Syzygium guineense Guill.. Ž . Žand Perr. Gmel. , Cordia africana Lam. , Croton macrostachys Hochst. ex
. Ž . XRich. and Ficus Õasta Hayne. . The Munesa site is located at 7835 N and38845’E. Mean annual temperature is 198C with an average annual precipitationof 1250 mm. Parent materials of the Munesa area are of volcanic origin,principally trachytes and basalts with ignimbrites and pumices at the rift valleyfloor. The escarpment extends from about 2100–3200 m and the plain descendsgradually to the Rift Valley lakes at about 1600 m above sea level. The soils of
Ž .the area are classified as Humic Nitisols FAO, 1997 , with clayey texture and

( )D. Solomon et al.rGeoderma 102 2001 41–5944
very dark reddish brown color. Basic physical and chemical characteristics ofthe soils at both sites are shown in Table 1. The natural vegetation of the
Ž .Munesa forest ranges from the Arundinaria alpina Schun. , Hagenia abyssinicaŽ . Ž .J.F. Gmel. , Croton macrostachys Hochst. ex Rich. , Podocarpus falcatusŽ . Ž .Thunb. Mirb. , Olea hochstetteri Baker. dominated forest on the escarpment
Ž Ž . Žto Acacia woodlands Acacia tortilis Hayne , Acacia abyssinica Hochst. ex. Ž .Benth. and Acacia seyal Delile in the semi-arid lowlands.
The land use systems studied at the Wushwush site were natural forest, teaŽ . Ž .plantations Camellia sinensis O. Kuntze 35 years old and fields cultivated
for 25 years, while at the Munesa site, Podocarpus dominated natural forest,Ž . Ž .Cupressus plantations Cupressus lusitanica Mill. 25 years old and 30 years
cultivated fields were investigated. At the Wushwush site, land preparation forcultivation or establishment of the tea plantations was done by clear-cutting ofthe indigenous forest, whereas at the Munesa site, clear-cutting was accompa-
Ž .nied by burning. In the cultivated fields of both sites, maize Zea mays L. wasgrown without fertilizer inputs. However, during the intermittent dry periods,
Ž .sorghum Sorghum bicolor L. Moench was grown at Munesa. Crop residueswere normally collected and used as animal feed.
We used a core sampler and collected composite samples in three replicatesfrom the upper 10 cm of the different land use systems in April, 1998. Weselected three representative sites from each land use and collected three
Ž 3 .sub-samples 200 cm core volume at each sub-site in a radial sampling schemeŽ .Wilding, 1985 . The three sub-samples were then bulked into one sample. Thespacing between the sub-sites on the radii ranged from 5 to 10 m depending on
Ž .the size of the patches. The samples were air-dried and sieved -2 mm prior tofractionation and chemical analysis.
2.2. Particle-size fractionation
Ž .Particle-size fractionation was done on -2 mm material bulk soil accord-Ž .ing to Amelung et al. 1998 . After removing visible root remnants, 30 g of soil
was ultrasonically treated with an energy input of 60 J mly1 using a probe typeŽ . Ž .sonicator Branson Sonifier W-450 in a soilrwater ratio of 1:5 wrv . The
Ž .coarse sand fraction 250–2000 mm was isolated by wet sieving. In order tocompletely disperse the remaining material in the -250 mm suspension,ultrasound was again applied with an energy input of 440 J mly1 in a soilrwater
Ž . Ž .ratio of 1:10 wrv . The clay fraction -2 mm was separated from the siltŽ . Ž .2–20 mm and fine sand 20–250 mm fractions by repeated centrifugation.The silt fraction was separated from the fine sand fractions by wet sieving.Coarse and fine sand fractions were combined and all fractions were dried at408C before grinding them for chemical analysis. The recovery of size separatesafter ultrasonic dispersion, wet sieving and centrifugation ranged from 968 to
y1 Ž .979 g kg of the initial soil mass Table 1 .

()
D.Solom
onet
al.rG
eoderma
1022001
41–
5945
Table 1Ž .Selected physical and chemical characteristics of surface soils 0–10 cm in the sub-humid highlands of southern Ethiopia
a b c d c dLand use Sand Silt Clay Bulk pH SOC N CrN CEC BS Fe Fe Al Ald o d oŽ Ž .density cmol %y1 y1 y1Ž . Ž . Ž . Ž . Ž .g kg soil H O KCl g kg soil g kg soil2y3 y1Ž .Mg m kg
.soilWushwushNatural forest 103 327 570 0.69 6.4 5.5 82 7.7 10.8 37.0 69 6.7 0.60 0.96 0.25Tea plantation 102 330 568 0.87 5.7 4.5 42 4.0 10.4 24.7 35 6.5 0.70 0.97 0.32Cultivation 70 337 593 0.89 5.7 4.7 38 3.7 10.2 26.4 46 5.8 0.83 0.77 0.30
MunesaNatural forest 130 347 523 0.62 7.6 6.8 98 7.9 12.6 52.2 98 2.5 0.30 0.38 0.15Cupressus 231 326 443 0.77 7.4 6.6 71 7.1 10.0 40.4 96 2.5 0.36 0.32 0.18plantationCultivation 229 285 486 1.04 5.6 4.5 38 3.3 11.8 26.5 51 3.4 0.71 0.40 0.21
aSOC, soil organic C.bBS, base saturation.cFe and Al , dithionite–citrate–bicarbonate extractable Fe and Al.d ddFe and Al , oxalate extractable Fe and Al.o o
( )D. Solomon et al.rGeoderma 102 2001 41–5946
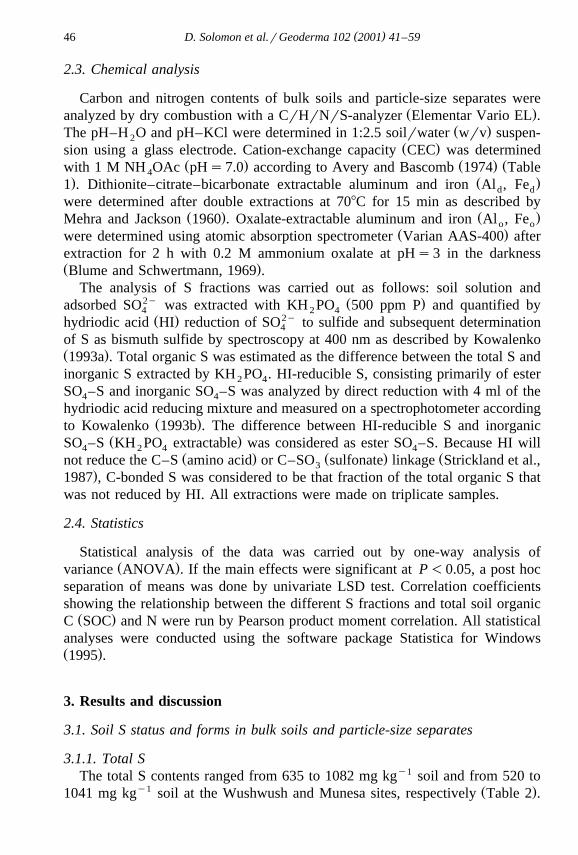
2.3. Chemical analysis
Carbon and nitrogen contents of bulk soils and particle-size separates wereŽ .analyzed by dry combustion with a CrHrNrS-analyzer Elementar Vario EL .
Ž .The pH–H O and pH–KCl were determined in 1:2.5 soilrwater wrv suspen-2Ž .sion using a glass electrode. Cation-exchange capacity CEC was determined
Ž . Ž . Žwith 1 M NH OAc pHs7.0 according to Avery and Bascomb 1974 Table4. Ž .1 . Dithionite–citrate–bicarbonate extractable aluminum and iron Al , Fed d
were determined after double extractions at 708C for 15 min as described byŽ . Ž .Mehra and Jackson 1960 . Oxalate-extractable aluminum and iron Al , Feo o
Ž .were determined using atomic absorption spectrometer Varian AAS-400 afterextraction for 2 h with 0.2 M ammonium oxalate at pHs3 in the darknessŽ .Blume and Schwertmann, 1969 .
The analysis of S fractions was carried out as follows: soil solution and2y Ž .adsorbed SO was extracted with KH PO 500 ppm P and quantified by4 2 4Ž . 2yhydriodic acid HI reduction of SO to sulfide and subsequent determination4
of S as bismuth sulfide by spectroscopy at 400 nm as described by KowalenkoŽ .1993a . Total organic S was estimated as the difference between the total S andinorganic S extracted by KH PO . HI-reducible S, consisting primarily of ester2 4
SO –S and inorganic SO –S was analyzed by direct reduction with 4 ml of the4 4
hydriodic acid reducing mixture and measured on a spectrophotometer accordingŽ .to Kowalenko 1993b . The difference between HI-reducible S and inorganic
Ž .SO –S KH PO extractable was considered as ester SO –S. Because HI will4 2 4 4Ž . Ž . Žnot reduce the C–S amino acid or C–SO sulfonate linkage Strickland et al.,3
.1987 , C-bonded S was considered to be that fraction of the total organic S thatwas not reduced by HI. All extractions were made on triplicate samples.
2.4. Statistics
Statistical analysis of the data was carried out by one-way analysis ofŽ .variance ANOVA . If the main effects were significant at P-0.05, a post hoc
separation of means was done by univariate LSD test. Correlation coefficientsshowing the relationship between the different S fractions and total soil organic
Ž .C SOC and N were run by Pearson product moment correlation. All statisticalanalyses were conducted using the software package Statistica for WindowsŽ .1995 .
3. Results and discussion
3.1. Soil S status and forms in bulk soils and particle-size separates
3.1.1. Total SThe total S contents ranged from 635 to 1082 mg kgy1 soil and from 520 to
y1 Ž .1041 mg kg soil at the Wushwush and Munesa sites, respectively Table 2 .

()
D.Solom
onet
al.rG
eoderma
1022001
41–
5947
Table 2Amounts of the different S forms, ester SO –S and C-bonded S as the proportion of total organic S and CrS and NrS ratios in bulk soils of different4
land use systems
Land Use Total S Inorganic S Organic S HI-reducible S Ester S C-bonded S Ester S C-bonded S CrS NrSy1 y1 y1 y1 y1 y1Ž . Ž . Ž . Ž . Ž . Ž . Ž . Ž .mg kg soil mg kg soil mg kg soil mg kg soil mg kg soil mg kg soil % %
WushwushaNatural forest 1082a 17a 1065a 191a 174a 891a 16 84 78 7.2
Tea Plantation 719b 14a 705b 175a 161a 544b 23 77 58 5.7Cultivation 635b 11b 624b 133b 122b 502b 20 80 60 5.9
MunesaNatural forest 1041a 16a 1025a 237a 221a 804a 22 78 99 7.9Cupressus plantation 903b 11b 892b 191b 180b 712a 20 80 79 7.9Cultivation 520c 11b 509c 95c 84c 425b 17 83 74 6.3
aWithin one site, different letters along the column indicate significant differences between the mean values of S fractions of the different land useŽ .systems at P-0.05 ns3 .
( )D. Solomon et al.rGeoderma 102 2001 41–5948
These results are inline with the ranges reported for tropical soils by Stanko-Ž . Ž y1 .Golden and Fitzgerald 1991 from Puerto Rico 353–1231 mg kg soil .
However, these values are higher compared to ranges reported by Kang et al.Ž . Ž y1 .1981 for forest zones of Nigerian 117–489 mg kg soil and by Acquaye
Ž . Ž y1 .and Kang 1987 for Ghanaian soils 44–281 mg kg soil . The differencebetween these soils may be attributed to differences in SOM levels resultingfrom differences in vegetation, climate, depth of sampling and soil type. Forexample, the amounts of SOM at our sites were two to four times higher thanthe amounts reported for Nigerian and Ghanaian soils.
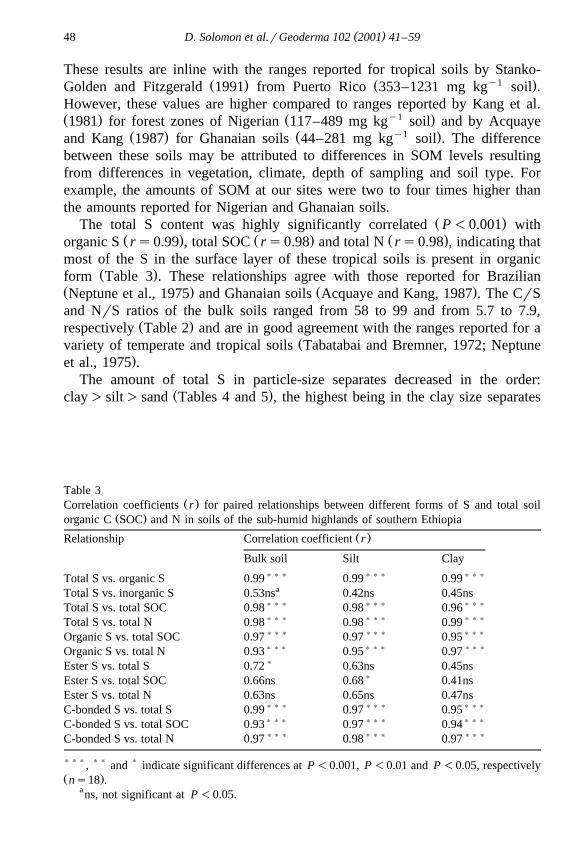
Ž .The total S content was highly significantly correlated P-0.001 withŽ . Ž . Ž .organic S rs0.99 , total SOC rs0.98 and total N rs0.98 , indicating that
most of the S in the surface layer of these tropical soils is present in organicŽ .form Table 3 . These relationships agree with those reported for Brazilian
Ž . Ž .Neptune et al., 1975 and Ghanaian soils Acquaye and Kang, 1987 . The CrSand NrS ratios of the bulk soils ranged from 58 to 99 and from 5.7 to 7.9,
Ž .respectively Table 2 and are in good agreement with the ranges reported for aŽvariety of temperate and tropical soils Tabatabai and Bremner, 1972; Neptune
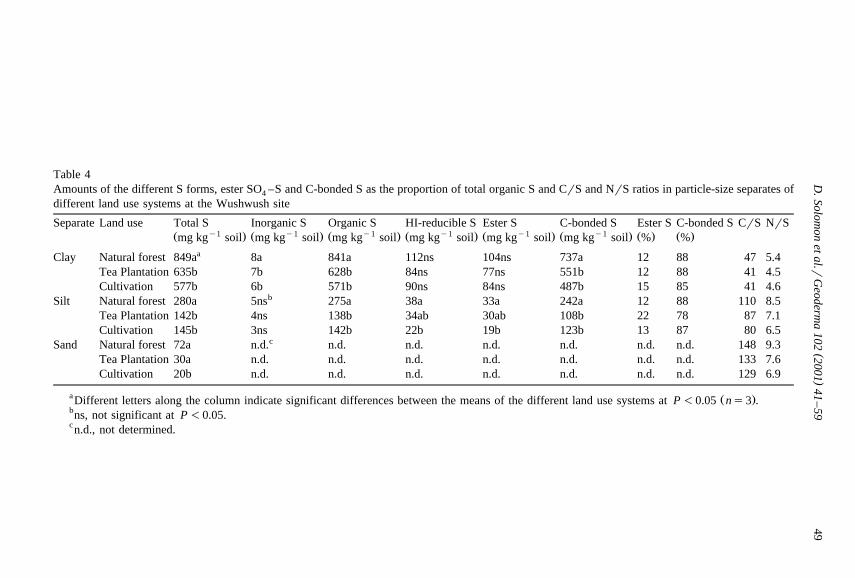
.et al., 1975 .The amount of total S in particle-size separates decreased in the order:
Ž .clay)silt)sand Tables 4 and 5 , the highest being in the clay size separates
Table 3Ž .Correlation coefficients r for paired relationships between different forms of S and total soil
Ž .organic C SOC and N in soils of the sub-humid highlands of southern Ethiopia
Ž .Relationship Correlation coefficient r
Bulk soil Silt Clay))) ))) )))Total S vs. organic S 0.99 0.99 0.99
aTotal S vs. inorganic S 0.53ns 0.42ns 0.45ns))) ))) )))Total S vs. total SOC 0.98 0.98 0.96))) ))) )))Total S vs. total N 0.98 0.98 0.99))) ))) )))Organic S vs. total SOC 0.97 0.97 0.95))) ))) )))Organic S vs. total N 0.93 0.95 0.97)Ester S vs. total S 0.72 0.63ns 0.45ns
)Ester S vs. total SOC 0.66ns 0.68 0.41nsEster S vs. total N 0.63ns 0.65ns 0.47ns
))) ))) )))C-bonded S vs. total S 0.99 0.97 0.95))) ))) )))C-bonded S vs. total SOC 0.93 0.97 0.94))) ))) )))C-bonded S vs. total N 0.97 0.98 0.97
))), )) and ) indicate significant differences at P-0.001, P-0.01 and P-0.05, respectivelyŽ .ns18 .
ans, not significant at P-0.05.
()
D.Solom
onet
al.rG
eoderma
1022001
41–
5949
Table 4Amounts of the different S forms, ester SO –S and C-bonded S as the proportion of total organic S and CrS and NrS ratios in particle-size separates of4
different land use systems at the Wushwush site
Separate Land use Total S Inorganic S Organic S HI-reducible S Ester S C-bonded S Ester S C-bonded S CrS NrSy1 y1 y1 y1 y1 y1Ž . Ž . Ž . Ž . Ž . Ž . Ž . Ž .mg kg soil mg kg soil mg kg soil mg kg soil mg kg soil mg kg soil % %
aClay Natural forest 849a 8a 841a 112ns 104ns 737a 12 88 47 5.4Tea Plantation 635b 7b 628b 84ns 77ns 551b 12 88 41 4.5Cultivation 577b 6b 571b 90ns 84ns 487b 15 85 41 4.6
bSilt Natural forest 280a 5ns 275a 38a 33a 242a 12 88 110 8.5Tea Plantation 142b 4ns 138b 34ab 30ab 108b 22 78 87 7.1Cultivation 145b 3ns 142b 22b 19b 123b 13 87 80 6.5
cSand Natural forest 72a n.d. n.d. n.d. n.d. n.d. n.d. n.d. 148 9.3Tea Plantation 30a n.d. n.d. n.d. n.d. n.d. n.d. n.d. 133 7.6Cultivation 20b n.d. n.d. n.d. n.d. n.d. n.d. n.d. 129 6.9
a Ž .Different letters along the column indicate significant differences between the means of the different land use systems at P-0.05 ns3 .bns, not significant at P-0.05.cn.d., not determined.

()
D.Solom
onet
al.rG
eoderma
1022001
41–
5950
Table 5Amounts of the different S forms, ester SO –S and C-bonded S as the proportion of total organic S and CrS and NrS ratios in particle-size separates of4
different land use systems at the Munesa site
Separate Land use Total S Inorganic S Organic S HI-reducible S Ester S C-bonded S Ester S C-bonded S CrS NrSy1 y1 y1 y1 y1 y1Ž . Ž . Ž . Ž . Ž . Ž . Ž . Ž .mg kg soil mg kg soil mg kg soil mg kg soil mg kg soil mg kg soil % %
a bClay Natural forest 991a 7ns 983a 117a 110a 873a 11 89 41 4.5Cupressus 882a 6ns 876a 115a 109a 767a 12 88 36 4.4plantationCultivation 560b 7ns 553b 44b 37b 516b 7 93 40 4.1
Silt Natural forest 356a 5ns 351a 33b 28b 323a 8 92 146 8.8Cupressus 333a 4ns 329a 48a 44a 285a 13 87 95 7.8plantationCultivation 174b 4ns 170b 21b 17b 153b 6 94 106 7.1
cSand Natural forest 50a n.d. n.d. n.d. n.d. n.d. n.d. n.d. 173 7.6Cupressus 25b n.d. n.d. n.d. n.d. n.d. n.d. n.d. 105 6.1plantationCultivation 13c n.d. n.d. n.d. n.d. n.d. n.d. n.d. 132 6.7
a Ž .Different letters along the column indicate significant differences between the means of the different land use systems at P-0.05 ns3 .bns, not significant at P-0.05.cn.d., not determined.
( )D. Solomon et al.rGeoderma 102 2001 41–59 51
with the largest SOC and N contents and with the lowest CrS, NrS and CrNŽ .ratios CrN data not presented .
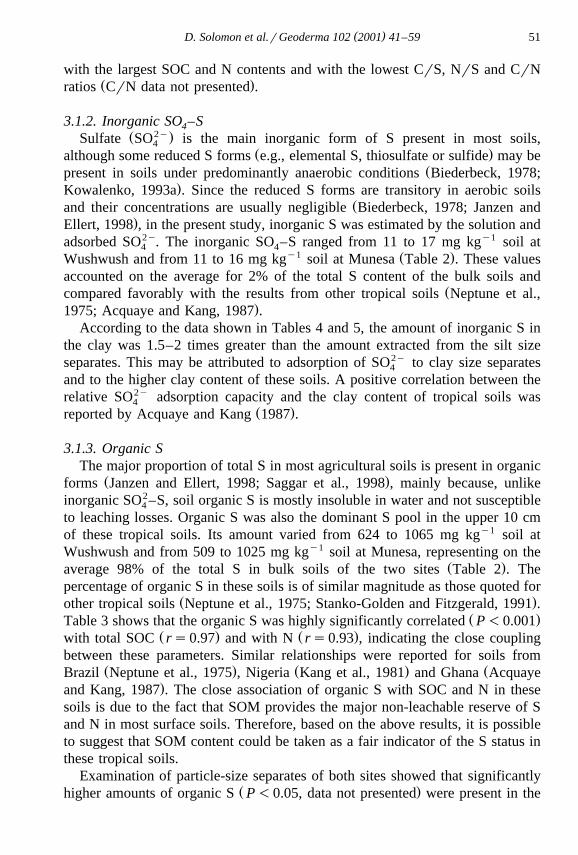
3.1.2. Inorganic SO –S4Ž 2y.Sulfate SO is the main inorganic form of S present in most soils,4
Ž .although some reduced S forms e.g., elemental S, thiosulfate or sulfide may beŽpresent in soils under predominantly anaerobic conditions Biederbeck, 1978;
.Kowalenko, 1993a . Since the reduced S forms are transitory in aerobic soilsŽand their concentrations are usually negligible Biederbeck, 1978; Janzen and
.Ellert, 1998 , in the present study, inorganic S was estimated by the solution andadsorbed SO2y. The inorganic SO –S ranged from 11 to 17 mg kgy1 soil at4 4
y1 Ž .Wushwush and from 11 to 16 mg kg soil at Munesa Table 2 . These valuesaccounted on the average for 2% of the total S content of the bulk soils and
Žcompared favorably with the results from other tropical soils Neptune et al.,.1975; Acquaye and Kang, 1987 .
According to the data shown in Tables 4 and 5, the amount of inorganic S inthe clay was 1.5–2 times greater than the amount extracted from the silt sizeseparates. This may be attributed to adsorption of SO2y to clay size separates4
and to the higher clay content of these soils. A positive correlation between therelative SO2y adsorption capacity and the clay content of tropical soils was4
Ž .reported by Acquaye and Kang 1987 .
3.1.3. Organic SThe major proportion of total S in most agricultural soils is present in organic
Ž .forms Janzen and Ellert, 1998; Saggar et al., 1998 , mainly because, unlikeinorganic SO2–S, soil organic S is mostly insoluble in water and not susceptible4
to leaching losses. Organic S was also the dominant S pool in the upper 10 cmof these tropical soils. Its amount varied from 624 to 1065 mg kgy1 soil atWushwush and from 509 to 1025 mg kgy1 soil at Munesa, representing on the
Ž .average 98% of the total S in bulk soils of the two sites Table 2 . Thepercentage of organic S in these soils is of similar magnitude as those quoted for
Ž .other tropical soils Neptune et al., 1975; Stanko-Golden and Fitzgerald, 1991 .Ž .Table 3 shows that the organic S was highly significantly correlated P-0.001
Ž . Ž .with total SOC rs0.97 and with N rs0.93 , indicating the close couplingbetween these parameters. Similar relationships were reported for soils from
Ž . Ž . ŽBrazil Neptune et al., 1975 , Nigeria Kang et al., 1981 and Ghana Acquaye.and Kang, 1987 . The close association of organic S with SOC and N in these
soils is due to the fact that SOM provides the major non-leachable reserve of Sand N in most surface soils. Therefore, based on the above results, it is possibleto suggest that SOM content could be taken as a fair indicator of the S status inthese tropical soils.
Examination of particle-size separates of both sites showed that significantlyŽ .higher amounts of organic S P-0.05, data not presented were present in the

( )D. Solomon et al.rGeoderma 102 2001 41–5952
Ž .clay than in the silt size separates Tables 4 and 5 . The values of the clay sizeseparates were two to three times greater than the values of silt size separates.This was also demonstrated by the CrS and NrS ratios, which were markedlylower in the clay than in the silt size separates. The observed pattern of organicS distribution in particle-size separates of these tropical soils is similar to the
Ž .pattern observed in temperate soils by Anderson et al. 1981 .Organic S originates mainly from plant and animal residues, which are
subsequently decomposed and remetabolized by soil microorganisms. The mainforms of organic S in soils include sulfonates, in which S is directly bonded to CŽ . Ž .C–SO , S-containing amino acids C–S and the esters of sulfuric acid3Ž . yC–O–S , where S is bonded to oxygen in the form of C–O–SO linkages.3
Sulfamates may also be found in soils where S occurs in the form of N–O–SOy3
y Ž .and N–SO groups Saggar et al., 1998 .3Ž .Biederbeck 1978 reported that in most mineral soils of temperate and
tropical ecosystems, ester SO –S is the dominant form of organic S, constituting4
between 33% and 78% of total soil organic S. However, the distribution of thedifferent organic forms of S shown in Tables 2, 4 and 5 indicate that C-bondedS was the largest constituent of the total organic S pool compared to esterSO –S in bulk soils and size separates of these sub-humid tropical highland4
ecosystems. It accounted for 77–84%, whereas ester SO –S constituted merely4
for 16–23% of the organic S pool in bulk soils of both sites. The dominance ofC-bonded S in forest-derived tropical soils was also reported by Stanko-Golden
Ž .and Fitzgerald 1991 . Ester SO –S is generated predominantly through bio-4
chemical processes by soil microflora, which metabolize organic residues and iscontrolled by supply of S. On the contrary, C-bonded S is directly derived from
Ž .leaf litter and root inputs sulfonate-S , as well as microbial protein synthesisŽ . Ž . Ž .amino acid-S Saggar et al., 1998 . Stanko-Golden and Fitzgerald 1991demonstrated that sulfonates are the dominant components of C-bonded S poolrepresenting as much as 68% of the total S content of soils from Puerto Rico.Thus, the abundance of C-bonded S in these forest-derived surface soils may beattributed to the higher amount of SOM and increased microbial activity underthe sub-humid tropical environment.
Comparisons of organic S fractions in particle-size separates indicate thatŽ .significantly higher P-0.05, data not presented amounts of both C-bonded S
and ester SO –S fractions were found in the clay than in the silt size separates4Ž .Tables 4 and 5 . This could be ascribed to stabilization of organic S compoundsand microbial metabolites produced during decomposition of SOM by the clay
Ž .size separates. C-bonded S was highly significantly P-0.001 correlated withthe total S, SOC and N in bulk soils and size separates further indicating the
Ž .close link between C-bonded S and SOM Table 3 . In contrast, the correlationbetween the ester SO –S and total S, SOC and N were generally weak. These4
results might also explain the prevalence of C-bonded S over ester SO –S in4
these tropical soils.
( )D. Solomon et al.rGeoderma 102 2001 41–59 53
3.2. Land use effects on the status and forms of S in bulk soils and particle-sizeseparates
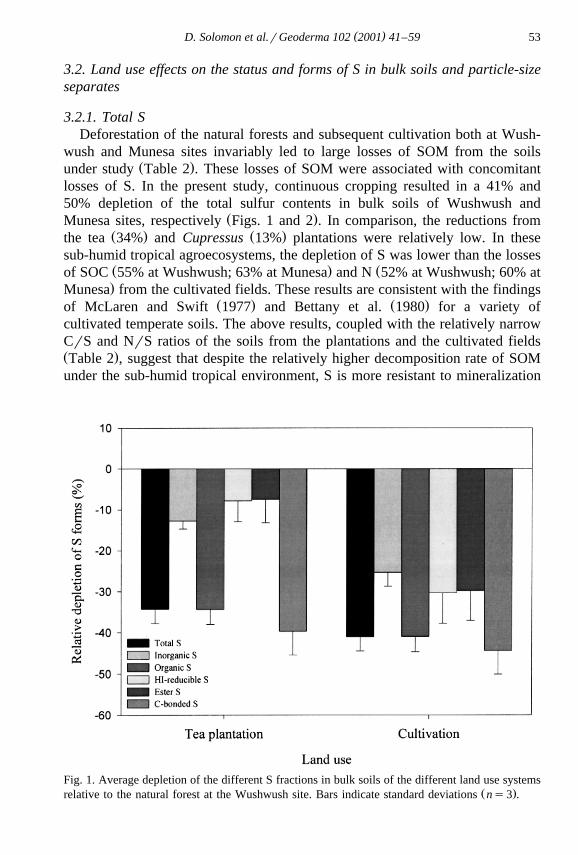
3.2.1. Total SDeforestation of the natural forests and subsequent cultivation both at Wush-
wush and Munesa sites invariably led to large losses of SOM from the soilsŽ .under study Table 2 . These losses of SOM were associated with concomitant
losses of S. In the present study, continuous cropping resulted in a 41% and50% depletion of the total sulfur contents in bulk soils of Wushwush and
Ž .Munesa sites, respectively Figs. 1 and 2 . In comparison, the reductions fromŽ . Ž .the tea 34% and Cupressus 13% plantations were relatively low. In these
sub-humid tropical agroecosystems, the depletion of S was lower than the lossesŽ . Žof SOC 55% at Wushwush; 63% at Munesa and N 52% at Wushwush; 60% at.Munesa from the cultivated fields. These results are consistent with the findings
Ž . Ž .of McLaren and Swift 1977 and Bettany et al. 1980 for a variety ofcultivated temperate soils. The above results, coupled with the relatively narrowCrS and NrS ratios of the soils from the plantations and the cultivated fieldsŽ .Table 2 , suggest that despite the relatively higher decomposition rate of SOMunder the sub-humid tropical environment, S is more resistant to mineralization
Fig. 1. Average depletion of the different S fractions in bulk soils of the different land use systemsŽ .relative to the natural forest at the Wushwush site. Bars indicate standard deviations ns3 .

( )D. Solomon et al.rGeoderma 102 2001 41–5954
Fig. 2. Average depletion of the different S fractions in bulk soils of the different land use systemsŽ .relative to the natural forest at the Munesa site. Bars indicate standard deviations ns3 . Cup.
plantation, Cupressus plantation.
than SOC and N. Alternatively, the higher retention of S relative to the SOC orN may also reflect the lower susceptibility of S to losses from the ecosystem.
The amount of total S in particle-size separates consistently decreased in theŽ .order: natural forest)plantations)cultivated fields Tables 4 and 5 . The CrS
and NrS ratios of size separates of the natural forests were higher than the CrSand NrS ratios from corresponding plantations and cultivated field. Theseresults indicate that S losses from the size separates due to soil disturbancecaused by land use changes were lower than the depletions of SOC and N.
3.2.2. Inorganic SO –S4
In arable ecosystems, significant amount of inorganic SO –S is removed by4
crops. However, much of the S assimilated by the crops is retained in the systemŽin fields where crop residues are effectively incorporated into the soil Janzen
.and Ellert, 1998 . Removal or burning of crop residues, which is usuallypracticed in the cultivated fields of the southwestern Ethiopia, appreciablyincreases the loss of inorganic SO –S from the agroecosystem.4
Ž .In the soils under study, a significantly higher P-0.05 amount of inor-ganic SO –S was found in bulk soils of the natural forests compared to the4

( )D. Solomon et al.rGeoderma 102 2001 41–59 55
Ž .corresponding cultivated fields Table 2 . According to Figs. 1 and 2, therelative losses of inorganic SO –S from bulk soils of the cultivated fields were4
higher than from soils of the corresponding plantations. Depletion of inorganicŽ .SO –S as a result of cultivation was also reported by Bettany et al. 1980 for4
Ž .Canadian soils and by Tracy et al. 1990 for soils from North America. Tracy etŽ .al. 1990 demonstrated that in addition to crop removal, in areas of high
precipitation, leaching could also cause a substantial amount of inorganic SO –S4
depletion in conventionally cultivated fields. However, with the exception ofclay size separates from the Wushwush sites, a pronounced difference in theinorganic S fractions of the different land use systems was not observed in thefiner particle-size separates. This indicates that leaching of inorganic SO –S4
from the finer separates may not be a very serious problem in these soils.Therefore, the differences in the amount of inorganic SO –S in the bulk soils4
might be attributed to losses from coarse size separates as a result of continuouscropping.
3.2.3. Organic SContinuous cultivation under arable management breaks up soil clods and
Žexposes previously inaccessible SOM to microbial attack Haynes and Williams,.1992 . As a result, organic matter contents considerably decline in cropped
fields. Any change in SOM is likely to be reflected as a change in S status sincemore than 90% of S in most noncalcareous soils is present in organic formŽ .Biederbeck, 1978 . Clear-cutting and subsequent cultivation resulted in signifi-
Ž .cantly higher P-0.05 depletion of organic S in the bulk soils of these tropicalŽ .agroecosystems Table 2 . These results are in line with the results of Bettany et
Ž . Ž .al. 1980 for arable Canadian soils and Haynes and Williams 1992 forcultivated soils from New Zealand. According to Figs. 1 and 2, the relativedepletion of organic S fractions as a result of continuous cropping were higher at
Ž . Ž .the Munesa 50% than at the Wushwush site 41% . This could be attributed tothe initial burning of forest-derived organic matter after clear-cutting of thenatural forests, to the relative difference in duration of cultivation and to theslightly lower clay content of the cultivated than the natural forest soils.Compared to the cultivated fields, lower losses of organic S were observed at
Ž . Ž .the tea 34% and Cupressus 13% plantations. This may be ascribed to bettercrop residue management through the use of pruned tea plant parts as a mulch atthe tea plantations and to the surface litter accumulation after senescenceobserved at the Cupressus plantations, which helps to return S removed by thecrops to the soils. In addition, pumping-up and recycling of S from the lowersoil layer to the surface soil through the relatively deep rooted tea plants andCupressus trees may also contribute to the lower loss of S observed at theplantation sites.
Although several researchers have observed qualitative changes in soil or-ganic S as a result of cultivation, no consistent trends with regard to the

( )D. Solomon et al.rGeoderma 102 2001 41–5956
Žinterchange between different organic forms of S are yet apparent Saggar et al.,.1998 . There is a conflicting evidence on the globally dominant labile form of
Ž .organic S fraction. In mineralization studies using Canadian soils, Lowe 1964considered C-bonded S to be of little value as a source of mineralizable S. In
Ž .contrast, Ghani et al. 1991 using New Zealand soils, found that most of theSO2y generated from soil incubation studies originated from C-bonded S.4
Ž .Freney et al. 1975 , also showed that over 9 months, most of the available SŽ .60% removed by plants in a pot experiment came from C-bonded S, althoughthere were changes in all organic fractions. In the present study, cultivation ofthe native forests at the Wushwush site resulted in a 41% and 30% reduction of
Ž .C-bonded S and ester SO –S, respectively Figs. 1 and 2 . At the Munesa site,4
47% of the C-bonded S and 62% of the ester SO –S were lost as a result of4
converting the natural forest to cultivated fields. However, when the depletionsof the two organic S fractions were expressed as proportions of the total S, thelosses of C-bonded S accounted for 88% and 73% of the total S depletion frombulk soils of the Wushwush and Munesa, while the depletions in ester SO –S4
accounted only for 11% and 26% of the total S reduction observed at the twoŽ .sites, respectively. McLaren and Swift 1977 also demonstrated that C-bonded
S contributed to 75% of S loss, while only 25% of this loss derived from theester SO –S due to cultivation of Scottish soils. Compared to the cultivated4
fields, the relative depletions of both C-bonded and ester SO –S were lower at4Ž .the two plantation sites Figs. 1 and 2 . The results of the present study show
that most of the soil S depletion in these sub-humid tropical highland agroe-cosystems occurred from the C-bonded S than the ester SO –S, supporting the4
Ž . Ž .results of Freney et al. 1975 , McLaren and Swift 1977 and Ghani et al.Ž . Ž . Ž .1991 . McLaren and Swift 1977 , McGill and Cole 1981 and Saggar et al.Ž .1998 suggested that ester SO –S has a more transitory nature and its mobiliza-4
tion is controlled by the end-product supply. On the other hand, since C-bondedS is mineralized as a result of C oxidation to provide energy, the increasedmicrobial activity associated with cultivation of soils could result in an acceler-ated transformation of the C-bonded S, which passes through ester SO –S prior4
to release as inorganic SO –S. This mechanism would tend to maintain the level4
of ester SO –S fraction in these soils, while the C-bonded fraction being4
continually diminished.Comparisons of the particle-size separates from different land use systems
indicate that highest amounts of both C-bonded and ester SO –S were generally4Ž .found in clay and silt size separates of the natural forests Tables 4 and 5 .
Cultivation resulted in 34% and 19% depletions of C-bonded S and ester SO –S4
in clay size separates of the Wushwush site, while the losses of these organic Sfractions from the silt size separates were 49% and 42%, respectively. AtMunesa, the clay separate lost 41% and 66% of C-bonded and ester SO –S,4
whereas losses from the silt separate were 53% and 39%, respectively. Theresults of the size separates also indicate that among the two organic S fractions,
( )D. Solomon et al.rGeoderma 102 2001 41–59 57
generally higher losses as a result of continuous cultivation occurred from theC-bonded S than the ester SO –S. The losses of C-bonded S and ester SO –S4 4
from clay and silt size separates of the two plantations were generally low. Thiscould be associated to the higher input of plant residue, thus increasing the SOMlevels of soils at the tea and Cupressus plantations.
4. Conclusions
In southern Ethiopia, deforestation of the natural forests and subsequentcultivation or establishment of plantations resulted in significant S depletionfrom bulk soils and particle-size separates. The reduction was associated withthe improved aeration and microbial activity, which led to accelerated decompo-sition of the native SOM following clear-cutting and cultivation. Lower losses ofS were observed from the plantations compared with those from the continu-ously cultivated fields. This indicates the importance of better crop residuemanagement and recycling of S from the sub-soil to the surface layer by therelatively deep rooted plantation crops in minimizing S-losses from thesetropical agroecosystems.
The lower depletion of S compared to SOC and N coupled with narrow CrSand NrS ratios of soils from the cultivated fields and plantations suggest thatdespite the higher decomposition rate of SOM under sub-humid tropical envi-ronments, S is more resistant to mineralization compared to SOC and N.Alternatively, the higher retention of S relative to SOC or N may also reflect thelower susceptibility of S to losses from the ecosystem.
C-bonded S was the dominant organic S fraction compared to ester SO –S4
both in bulk soils and size separates in these forest-derived tropical soils. Inaddition, most of organic S depletion from bulk soils and size separates due toland use changes occurred from C-bonded S than ester SO –S.4
Based on our results, it is possible to conclude that S deficiency might occurin a foreseeable future, if the current depletion rate of SOM continues, sinceorganic matter is the major source of S in the region. Therefore, integrated cropand soil management practices have to be developed which involve the use oforganic materials of farm and non-farm origins as well as inorganic fertilizers tocombat the ongoing nutrient depletion in these sub-humid tropical highlandagroecosystems of southern Ethiopia.
Acknowledgements
We wish to express our gratitude for the German Academic Exchange ServiceŽ .DAAD for providing a fellowship for D. Solomon and for the Wushwush Teaand Munesa Forest Enterprises for their co-operation in providing the research

( )D. Solomon et al.rGeoderma 102 2001 41–5958
sites. The authors would like also to thank D.L. Sparks, M.A. Tabatabai and theunanimous reviewer for their valuable comments and suggestions, which helpedto improve this manuscript.
References
Acquaye, D.F., Kang, B.T., 1987. Sulfur status and forms in some surface soils of Ghana. SoilSci. 144, 43–52.
Amelung, W., Zech, W., Zhang, X., Follett, R.F., Tiessen, H., Knox, E., Flach, K.W., 1998.Carbon, nitrogen and sulfur pools in particle size fractions as influenced by climate. Soil Sci.Soc. Am. J. 62, 172–181.
Anderson, D.W., Saggar, S., Bettany, J.R., Stewart, J.W.B., 1981. Particle size fractions and theiruse in studies of soil organic matter: I. The nature and distribution of forms of carbon, nitrogenand sulfur. Soil Sci. Soc. Am. J. 45, 767–772.
Avery, B.W., Bascomb, C.L., 1974. Soil survey laboratory methods. Soil Survey TechnologyMonograph, No. 6, Harpenden, pp. 19–25.
Bettany, J.R., Saggar, S., Stewart, J.W.B., 1980. Comparison of the amounts and forms of sulfurin soil organic matter fractions after 65 years of cultivation. Soil Sci. Soc. Am. J. 44, 70–75.
Ž .Biederbeck, V.O., 1978. Soil organic sulfur and fertility. In: Schnitzer, M., Khan, S.M. Eds. ,Soil Organic Matter. Elsevier, Amsterdam, pp. 273–310.
Blume, H.P., Schwertmann, U., 1969. Genetic evaluation of profile distribution of aluminum, ironand manganese oxides. Soil Sci. Soc. Am. J. 33, 438–444.
FAO, 1997. FAO-Unesco Soil Map of the World, Revised Legend with Corrections and Updates.World Soil Resources, Rep. 60, ISRIC, Wageningen.
Freney, J.R., Melville, G.E., Williams, C.H., 1975. Soil organic matter fractions as sources ofplant-available sulfur. Soil Biol. Biochem. 22, 1163–1165.
Ghani, A., McLaren, R.G., Swift, R.S., 1991. Sulfur mineralization in some New Zealand soils.Biol. Fertil. Soils 11, 68–74.
Haynes, R.J., Williams, P.H., 1992. Accumulation of soil organic matter and the forms, mineral-ization potential and plant-availability of accumulated organic sulfur: effect of pasture im-provement and intensive cultivation. Soil Biol. Biochem. 24, 209–217.
Janzen, H.H., Ellert, B.H., 1998. Sulfur dynamics in cultivated temperate agroecosystems. In:Ž .Maynard, D.G. Ed. , Sulfur in the Environment. Dekker, New York, pp. 11–43.
Kang, B.T., Okoro, E., Acquaye, D., Osiname, O.A., 1981. Sulfur status of some Nigerian soilsfrom the savanna and forest zone. Soil Sci. 132, 220–227.
Ž .Kowalenko, C.G., 1993a. Extraction of available sulfur. In: Carter, M.R. Ed. , Soil Sampling andMethods of Analysis. Lewis Pub., Boca Raton, FL, pp. 65–74.
Ž .Kowalenko, C.G., 1993b. Total and fractions of sulfur. In: Carter, M.R. Ed. , Soil Sampling andMethods of Analysis. Lewis Pub., Boca Raton, FL, pp. 231–246.
Lowe, L.E., 1964. An approach to the study of the sulfur status of soils and its application toselected Quebec soils. Can. J. Soil Sci. 44, 176–179.
Lowe, L.E., DeLong, W.A., 1963. Carbon-bonded sulfur in selected Quebec soils. Can. J. SoilSci. 43, 151–155.
McGill, W.B., Cole, C.V., 1981. Comparative aspects of cycling of organic C, N, S and P throughsoil organic matter. Geoderma 26, 267–286.
McLaren, R.G., Swift, R.S., 1977. Changes in soil organic sulfur fractions due to the long termcultivation of soils. J. Soil Sci. 28, 445–453.

( )D. Solomon et al.rGeoderma 102 2001 41–59 59
Mehra, O.P., Jackson, M.L., 1960. Iron oxide removal from soils and clays by a dithionite-citratesystem buffered with sodium bicarbonate. Clays Clay Min. 7, 317–327.
Neptune, A.M.L., Tabatabai, M.A., Hanway, J.J., 1975. Sulfur fractions and carbon-nitrogen-phosphorus-sulfur relationship in some Brazilian and Iowa soils. Soil Sci. Soc. Am. Proc. 39,51–55.
Odum, H.T., Pigeon, R.F., 1970. Summary: an emerging view of the ecological system at ElŽ .Verde, Porto Rico. In: Odum, H.T., Pigeon, R.F. Eds. , A Tropical Rain Forest: Study of
Irradiation and Ecology at El Verde, Porto Rico. Atomic Energy Commission, Springfield, pp.1–238.
Saggar, S., Hedley, M.J., Phimsarn, S., 1998. Dynamics of Sulfur transformations in grazedŽ .pastures. In: Maynard, D.G. Ed. , Sulfur in the Environment. Dekker, New York, pp. 45–94.
Solomon, D., Lehmann, J., Zech, W., 2000. Land use effects on soil organic matter properties ofchromic Luvisols in semiarid northern Tanzania: carbon, nitrogen, lignin and carbohydrates.Agric. Ecosyst. Environ. 78, 203–213.
Stanko-Golden, K.M., Fitzgerald, J.W., 1991. Sulfur transformation and pool size in tropicalforest soils. Soil Biol. Biochem. 23, 1053–1058.
1995. Statistica for windows. General Convention and Statistics. 2nd edn. StatSoft, Tulsa, USA.Strickland, T.C., Fitzgerald, W.J., Ash, J.T., Swank, W.T., 1987. Organic sulfur transformations
and sulfur pool sizes in soil and litter from a southern Appalachian hardwood forest. Soil Sci.143, 453–458.
Ž .Tabatabai, M.A., 1982. Sulfur. In: Black, C.A. Ed. , Methods of Soil Analysis, Part 2, Chemicaland Microbial Properties. Agronomy Monograph, No. 9, ASA-SSSA, Madison, pp. 501–538.
Tabatabai, M.A., Bremner, J.M., 1972. Forms of sulfur and carbon, nitrogen and sulfur relation-ships in Iowa soils. Soil Sci. 114, 380–386.
Tracy, P.W., Westfall, D.G., Elliott, E.T., Peterson, G.A., 1990. Tillage influence on soil sulfurcharacteristics in winter wheat-summer fallow systems. Soil Sci. Soc. Am. J. 54, 457–461.
Wilding, L.G., 1985. Spatial variability: its documentation, accommodation and implication to soilŽ .survey. In: Nielsen, D.R., Bauma, J. Eds. , Soil Spatial Variability. Proceedings of ISSS and
SSSA, Wageningen, pp. 166–187.Zech, W., Guggenberger, G., Haumaier, L., Pohhacker, R., Schafer, D., Amelung, W., Miltner,¨ ¨
A., Kaiser, K., Ziegler, F., 1996. Organic matter dynamics in forest soils of temperate andŽ .tropical ecosystems. In: Piccolo, A. Ed. , Humic Substances in Terrestrial Ecosystems.
Elsevier, Amsterdam, pp. 101–170.Zucker, A., Zech, W., 1985. Sulfur status of four uncultivated soil profiles in northern Bavaria.
Geoderma 36, 229–240.