Embed Size (px)
Citation preview

SuiteAnalytics Workbook
February 26, 2020 2020.1

Copyright © 2005, 2019, Oracle and/or its affiliates. All rights reserved.
This software and related documentation are provided under a license agreement containing restrictionson use and disclosure and are protected by intellectual property laws. Except as expressly permittedin your license agreement or allowed by law, you may not use, copy, reproduce, translate, broadcast,modify, license, transmit, distribute, exhibit, perform, publish, or display any part, in any form, or by anymeans. Reverse engineering, disassembly, or decompilation of this software, unless required by law forinteroperability, is prohibited.
The information contained herein is subject to change without notice and is not warranted to be error-free. If you find any errors, please report them to us in writing.
If this is software or related documentation that is delivered to the U.S. Government or anyone licensing iton behalf of the U.S. Government, then the following notice is applicable:
U.S. GOVERNMENT END USERS: Oracle programs, including any operating system, integrated software,any programs installed on the hardware, and/or documentation, delivered to U.S. Government endusers are "commercial computer software" pursuant to the applicable Federal Acquisition Regulationand agency-specific supplemental regulations. As such, use, duplication, disclosure, modification, andadaptation of the programs, including any operating system, integrated software, any programs installedon the hardware, and/or documentation, shall be subject to license terms and license restrictionsapplicable to the programs. No other rights are granted to the U.S. Government.
This software or hardware is developed for general use in a variety of information managementapplications. It is not developed or intended for use in any inherently dangerous applications, includingapplications that may create a risk of personal injury. If you use this software or hardware in dangerousapplications, then you shall be responsible to take all appropriate fail-safe, backup, redundancy, and othermeasures to ensure its safe use. Oracle Corporation and its affiliates disclaim any liability for any damagescaused by use of this software or hardware in dangerous applications.
Oracle and Java are registered trademarks of Oracle and/or its affiliates. Other names may be trademarksof their respective owners.
Intel and Intel Xeon are trademarks or registered trademarks of Intel Corporation. All SPARC trademarksare used under license and are trademarks or registered trademarks of SPARC International, Inc.AMD, Opteron, the AMD logo, and the AMD Opteron logo are trademarks or registered trademarks ofAdvanced Micro Devices. UNIX is a registered trademark of The Open Group.
This software or hardware and documentation may provide access to or information about content,products, and services from third parties. Oracle Corporation and its affiliates are not responsible for andexpressly disclaim all warranties of any kind with respect to third-party content, products, and servicesunless otherwise set forth in an applicable agreement between you and Oracle. Oracle Corporation andits affiliates will not be responsible for any loss, costs, or damages incurred due to your access to or useof third-party content, products, or services, except as set forth in an applicable agreement between youand Oracle.
If this document is in public or private pre-General Availability status:
This documentation is in pre-General Availability status and is intended for demonstration and preliminaryuse only. It may not be specific to the hardware on which you are using the software. Oracle Corporationand its affiliates are not responsible for and expressly disclaim all warranties of any kind with respect tothis documentation and will not be responsible for any loss, costs, or damages incurred due to the use ofthis documentation.
If this document is in private pre-General Availability status:
The information contained in this document is for informational sharing purposes only and should beconsidered in your capacity as a customer advisory board member or pursuant to your pre-GeneralAvailability trial agreement only. It is not a commitment to deliver any material, code, or functionality, and

should not be relied upon in making purchasing decisions. The development, release, and timing of anyfeatures or functionality described in this document remains at the sole discretion of Oracle.
This document in any form, software or printed matter, contains proprietary information that is theexclusive property of Oracle. Your access to and use of this confidential material is subject to the termsand conditions of your Oracle Master Agreement, Oracle License and Services Agreement, OraclePartnerNetwork Agreement, Oracle distribution agreement, or other license agreement which hasbeen executed by you and Oracle and with which you agree to comply. This document and informationcontained herein may not be disclosed, copied, reproduced, or distributed to anyone outside Oraclewithout prior written consent of Oracle. This document is not part of your license agreement nor can it beincorporated into any contractual agreement with Oracle or its subsidiaries or affiliates.
For information about Oracle's commitment to accessibility, visit the Oracle Accessibility Program websiteat http://www.oracle.com/pls/topic/lookup?ctx=acc&id=docacc
Oracle customers that have purchased support have access to electronic support through My OracleSupport. For information, visit http://www.oracle.com/pls/topic/lookup?ctx=acc&id=info or visit http://www.oracle.com/pls/topic/lookup?ctx=acc&id=trs if you are hearing impaired.
Sample Code
Oracle may provide sample code in SuiteAnswers, the Help Center, User Guides, or elsewhere throughhelp links. All such sample code is provided "as is” and “as available”, for use only with an authorizedNetSuite Service account, and is made available as a SuiteCloud Technology subject to the SuiteCloudTerms of Service at www.netsuite.com/tos.
Oracle may modify or remove sample code at any time without notice.
No Excessive Use of the Service
As the Service is a multi-tenant service offering on shared databases, Customer may not use the Servicein excess of limits or thresholds that Oracle considers commercially reasonable for the Service. If Oraclereasonably concludes that a Customer’s use is excessive and/or will cause immediate or ongoingperformance issues for one or more of Oracle’s other customers, Oracle may slow down or throttleCustomer’s excess use until such time that Customer’s use stays within reasonable limits. If Customer’sparticular usage pattern requires a higher limit or threshold, then the Customer should procure asubscription to the Service that accommodates a higher limit and/or threshold that more effectively alignswith the Customer’s actual usage pattern.
Beta Features
Oracle may make available to Customer certain features that are labeled “beta” that are not yet generallyavailable. To use such features, Customer acknowledges and agrees that such beta features are subjectto the terms and conditions accepted by Customer upon activation of the feature, or in the absence ofsuch terms, subject to the limitations for the feature described in the User Guide and as follows: The betafeature is a prototype or beta version only and is not error or bug free and Customer agrees that it willuse the beta feature carefully and will not use it in any way which might result in any loss, corruption orunauthorized access of or to its or any third party’s property or information. Customer must promptlyreport to Oracle any defects, errors or other problems in beta features to [email protected] orother designated contact for the specific beta feature. Oracle cannot guarantee the continued availabilityof such beta features and may substantially modify or cease providing such beta features withoutentitling Customer to any refund, credit, or other compensation. Oracle makes no representations orwarranties regarding functionality or use of beta features and Oracle shall have no liability for any lostdata, incomplete data, re-run time, inaccurate input, work delay, lost profits or adverse effect on theperformance of the Service resulting from the use of beta features. Oracle’s standard service levels,warranties and related commitments regarding the Service shall not apply to beta features and they maynot be fully supported by Oracle’s customer support. These limitations and exclusions shall apply until thedate that Oracle at its sole option makes a beta feature generally available to its customers and partnersas part of the Service without a “beta” label.
Send Us Your FeedbackWe'd like to hear your feedback on this document.
Answering the following questions will help us improve our help content:
■ Did you find the information you needed? If not, what was missing?
■ Did you find any errors?
■ Is the information clear?
■ Are the examples correct?
■ Do you need more examples?
■ What did you like most about this document?
Click here to send us your comments. If possible, please provide a page number or section title to identifythe content you're describing.
To report software issues, contact NetSuite Customer Support.

Table of ContentsSuiteAnalytics Workbook Overview . . . . . . . . . . . . . . . . . . . . . . . . . . . . . . . . . . . . . . . . . . . . . . . . . . . . . . . . . . . . . . . . . . . . . . . . . . . . . . . . . . . . . . . . . . . . 1
Enabling SuiteAnalytics Workbook in Your NetSuite Account . . . . . . . . . . . . . . . . . . . . . . . . . . . . . . . . . . . . . . . . . . . . . . . . . . . . . . 2The Analytics Administrator Permission . . . . . . . . . . . . . . . . . . . . . . . . . . . . . . . . . . . . . . . . . . . . . . . . . . . . . . . . . . . . . . . . . . . . . . . . . . . . . . . . . . 3Accessing and Sharing Workbooks and Datasets . . . . . . . . . . . . . . . . . . . . . . . . . . . . . . . . . . . . . . . . . . . . . . . . . . . . . . . . . . . . . . . . . . . . . 4Data Refresh in SuiteAnalytics Workbook . . . . . . . . . . . . . . . . . . . . . . . . . . . . . . . . . . . . . . . . . . . . . . . . . . . . . . . . . . . . . . . . . . . . . . . . . . . . . . . 6
Understanding Data Caching in Charts and Pivot Tables . . . . . . . . . . . . . . . . . . . . . . . . . . . . . . . . . . . . . . . . . . . . . . . . . . . . . . . 6Clearing the Cache for Pivot Tables and Charts . . . . . . . . . . . . . . . . . . . . . . . . . . . . . . . . . . . . . . . . . . . . . . . . . . . . . . . . . . . . . . . . . . . 7
Known Limitations in SuiteAnalytics Workbook . . . . . . . . . . . . . . . . . . . . . . . . . . . . . . . . . . . . . . . . . . . . . . . . . . . . . . . . . . . . . . . . . . . . . . . . 8Analytics Data Source Overview . . . . . . . . . . . . . . . . . . . . . . . . . . . . . . . . . . . . . . . . . . . . . . . . . . . . . . . . . . . . . . . . . . . . . . . . . . . . . . . . . . . . . . . . . . . . . . . . 9
SuiteQL . . . . . . . . . . . . . . . . . . . . . . . . . . . . . . . . . . . . . . . . . . . . . . . . . . . . . . . . . . . . . . . . . . . . . . . . . . . . . . . . . . . . . . . . . . . . . . . . . . . . . . . . . . . . . . . . . . . . . . . . . . . . 9SuiteQL Syntax and Examples . . . . . . . . . . . . . . . . . . . . . . . . . . . . . . . . . . . . . . . . . . . . . . . . . . . . . . . . . . . . . . . . . . . . . . . . . . . . . . . . . . . . . . . . . 10SuiteQL Limitations and Exceptions . . . . . . . . . . . . . . . . . . . . . . . . . . . . . . . . . . . . . . . . . . . . . . . . . . . . . . . . . . . . . . . . . . . . . . . . . . . . . . . . . 11Using SuiteQL . . . . . . . . . . . . . . . . . . . . . . . . . . . . . . . . . . . . . . . . . . . . . . . . . . . . . . . . . . . . . . . . . . . . . . . . . . . . . . . . . . . . . . . . . . . . . . . . . . . . . . . . . . . . . . 11
Available Record Types . . . . . . . . . . . . . . . . . . . . . . . . . . . . . . . . . . . . . . . . . . . . . . . . . . . . . . . . . . . . . . . . . . . . . . . . . . . . . . . . . . . . . . . . . . . . . . . . . . . . . . 20Analytics Data Source Changes . . . . . . . . . . . . . . . . . . . . . . . . . . . . . . . . . . . . . . . . . . . . . . . . . . . . . . . . . . . . . . . . . . . . . . . . . . . . . . . . . . . . . . . . . . . 21
Open Sales Orders Lines . . . . . . . . . . . . . . . . . . . . . . . . . . . . . . . . . . . . . . . . . . . . . . . . . . . . . . . . . . . . . . . . . . . . . . . . . . . . . . . . . . . . . . . . . . . . . . . 22Number of Fulfillments . . . . . . . . . . . . . . . . . . . . . . . . . . . . . . . . . . . . . . . . . . . . . . . . . . . . . . . . . . . . . . . . . . . . . . . . . . . . . . . . . . . . . . . . . . . . . . . . . . 25Journal Entry to Approve . . . . . . . . . . . . . . . . . . . . . . . . . . . . . . . . . . . . . . . . . . . . . . . . . . . . . . . . . . . . . . . . . . . . . . . . . . . . . . . . . . . . . . . . . . . . . . . 27
Guidelines for Joining Record Types in SuiteAnalytics Workbook . . . . . . . . . . . . . . . . . . . . . . . . . . . . . . . . . . . . . . . . . . . . . . . 28Data Duplication Based on Record Joins . . . . . . . . . . . . . . . . . . . . . . . . . . . . . . . . . . . . . . . . . . . . . . . . . . . . . . . . . . . . . . . . . . . . . . . . . . . 28Joining Transaction Line and Transaction Accounting Line in a Dataset . . . . . . . . . . . . . . . . . . . . . . . . . . . . . . . . . . 32Join Order in SuiteAnalytics Workbook . . . . . . . . . . . . . . . . . . . . . . . . . . . . . . . . . . . . . . . . . . . . . . . . . . . . . . . . . . . . . . . . . . . . . . . . . . . . . 33
Custom Workbooks and Datasets . . . . . . . . . . . . . . . . . . . . . . . . . . . . . . . . . . . . . . . . . . . . . . . . . . . . . . . . . . . . . . . . . . . . . . . . . . . . . . . . . . . . . . . . . . . 35Defining a Dataset . . . . . . . . . . . . . . . . . . . . . . . . . . . . . . . . . . . . . . . . . . . . . . . . . . . . . . . . . . . . . . . . . . . . . . . . . . . . . . . . . . . . . . . . . . . . . . . . . . . . . . . . . . . . 36
Editing a Dataset . . . . . . . . . . . . . . . . . . . . . . . . . . . . . . . . . . . . . . . . . . . . . . . . . . . . . . . . . . . . . . . . . . . . . . . . . . . . . . . . . . . . . . . . . . . . . . . . . . . . . . . . . . 37Formula Fields . . . . . . . . . . . . . . . . . . . . . . . . . . . . . . . . . . . . . . . . . . . . . . . . . . . . . . . . . . . . . . . . . . . . . . . . . . . . . . . . . . . . . . . . . . . . . . . . . . . . . . . . . . . . . 38Sample Formulas . . . . . . . . . . . . . . . . . . . . . . . . . . . . . . . . . . . . . . . . . . . . . . . . . . . . . . . . . . . . . . . . . . . . . . . . . . . . . . . . . . . . . . . . . . . . . . . . . . . . . . . . . . 43Hierarchical Fields . . . . . . . . . . . . . . . . . . . . . . . . . . . . . . . . . . . . . . . . . . . . . . . . . . . . . . . . . . . . . . . . . . . . . . . . . . . . . . . . . . . . . . . . . . . . . . . . . . . . . . . . 49Advanced Sorting Options . . . . . . . . . . . . . . . . . . . . . . . . . . . . . . . . . . . . . . . . . . . . . . . . . . . . . . . . . . . . . . . . . . . . . . . . . . . . . . . . . . . . . . . . . . . . . 52Joining Records Types in a Dataset . . . . . . . . . . . . . . . . . . . . . . . . . . . . . . . . . . . . . . . . . . . . . . . . . . . . . . . . . . . . . . . . . . . . . . . . . . . . . . . . . . 53Currency Conversion in Datasets and Workbooks . . . . . . . . . . . . . . . . . . . . . . . . . . . . . . . . . . . . . . . . . . . . . . . . . . . . . . . . . . . . . . 53
Dataset Criteria Filters . . . . . . . . . . . . . . . . . . . . . . . . . . . . . . . . . . . . . . . . . . . . . . . . . . . . . . . . . . . . . . . . . . . . . . . . . . . . . . . . . . . . . . . . . . . . . . . . . . . . . . . 56Filter Types . . . . . . . . . . . . . . . . . . . . . . . . . . . . . . . . . . . . . . . . . . . . . . . . . . . . . . . . . . . . . . . . . . . . . . . . . . . . . . . . . . . . . . . . . . . . . . . . . . . . . . . . . . . . . . . . . . 57Grouping Filters . . . . . . . . . . . . . . . . . . . . . . . . . . . . . . . . . . . . . . . . . . . . . . . . . . . . . . . . . . . . . . . . . . . . . . . . . . . . . . . . . . . . . . . . . . . . . . . . . . . . . . . . . . . 58
Creating a Workbook . . . . . . . . . . . . . . . . . . . . . . . . . . . . . . . . . . . . . . . . . . . . . . . . . . . . . . . . . . . . . . . . . . . . . . . . . . . . . . . . . . . . . . . . . . . . . . . . . . . . . . . . 59Workbook Table Views . . . . . . . . . . . . . . . . . . . . . . . . . . . . . . . . . . . . . . . . . . . . . . . . . . . . . . . . . . . . . . . . . . . . . . . . . . . . . . . . . . . . . . . . . . . . . . . . . . 61Workbook Pivot Tables . . . . . . . . . . . . . . . . . . . . . . . . . . . . . . . . . . . . . . . . . . . . . . . . . . . . . . . . . . . . . . . . . . . . . . . . . . . . . . . . . . . . . . . . . . . . . . . . . . 62Pivot Table Customization . . . . . . . . . . . . . . . . . . . . . . . . . . . . . . . . . . . . . . . . . . . . . . . . . . . . . . . . . . . . . . . . . . . . . . . . . . . . . . . . . . . . . . . . . . . . . . 63Pivot-based Portlets . . . . . . . . . . . . . . . . . . . . . . . . . . . . . . . . . . . . . . . . . . . . . . . . . . . . . . . . . . . . . . . . . . . . . . . . . . . . . . . . . . . . . . . . . . . . . . . . . . . . . . 67
Workbook Charts . . . . . . . . . . . . . . . . . . . . . . . . . . . . . . . . . . . . . . . . . . . . . . . . . . . . . . . . . . . . . . . . . . . . . . . . . . . . . . . . . . . . . . . . . . . . . . . . . . . . . . . . . . . . . . 67Chart Types . . . . . . . . . . . . . . . . . . . . . . . . . . . . . . . . . . . . . . . . . . . . . . . . . . . . . . . . . . . . . . . . . . . . . . . . . . . . . . . . . . . . . . . . . . . . . . . . . . . . . . . . . . . . . . . . . 68Chart-based Portlets . . . . . . . . . . . . . . . . . . . . . . . . . . . . . . . . . . . . . . . . . . . . . . . . . . . . . . . . . . . . . . . . . . . . . . . . . . . . . . . . . . . . . . . . . . . . . . . . . . . . . 69
Workbook Component Filters . . . . . . . . . . . . . . . . . . . . . . . . . . . . . . . . . . . . . . . . . . . . . . . . . . . . . . . . . . . . . . . . . . . . . . . . . . . . . . . . . . . . . . . . . . . . . 70Workbook and Dataset Templates . . . . . . . . . . . . . . . . . . . . . . . . . . . . . . . . . . . . . . . . . . . . . . . . . . . . . . . . . . . . . . . . . . . . . . . . . . . . . . . . . . . . . . . . . . . 74
Dataset Templates . . . . . . . . . . . . . . . . . . . . . . . . . . . . . . . . . . . . . . . . . . . . . . . . . . . . . . . . . . . . . . . . . . . . . . . . . . . . . . . . . . . . . . . . . . . . . . . . . . . . . . . . . . . . 74Workbook Templates . . . . . . . . . . . . . . . . . . . . . . . . . . . . . . . . . . . . . . . . . . . . . . . . . . . . . . . . . . . . . . . . . . . . . . . . . . . . . . . . . . . . . . . . . . . . . . . . . . . . . . . . 75
Workbook-based Portlets . . . . . . . . . . . . . . . . . . . . . . . . . . . . . . . . . . . . . . . . . . . . . . . . . . . . . . . . . . . . . . . . . . . . . . . . . . . . . . . . . . . . . . . . . . . . . . . . . . . . . . . 76Displaying Chart and Pivot Data in the Analytics Portlets . . . . . . . . . . . . . . . . . . . . . . . . . . . . . . . . . . . . . . . . . . . . . . . . . . . . . . . . . 76
SuiteAnalytics Workbook Tutorial . . . . . . . . . . . . . . . . . . . . . . . . . . . . . . . . . . . . . . . . . . . . . . . . . . . . . . . . . . . . . . . . . . . . . . . . . . . . . . . . . . . . . . . . . . . . 77Step 1: Select a Root Record Type . . . . . . . . . . . . . . . . . . . . . . . . . . . . . . . . . . . . . . . . . . . . . . . . . . . . . . . . . . . . . . . . . . . . . . . . . . . . . . . . . . . . . . . 77Step 2: Add Fields and Join Record Types . . . . . . . . . . . . . . . . . . . . . . . . . . . . . . . . . . . . . . . . . . . . . . . . . . . . . . . . . . . . . . . . . . . . . . . . . . . . . 77Step 3: Filter Your Dataset . . . . . . . . . . . . . . . . . . . . . . . . . . . . . . . . . . . . . . . . . . . . . . . . . . . . . . . . . . . . . . . . . . . . . . . . . . . . . . . . . . . . . . . . . . . . . . . . . 81Step 4: Create a Workbook Based on Your Dataset . . . . . . . . . . . . . . . . . . . . . . . . . . . . . . . . . . . . . . . . . . . . . . . . . . . . . . . . . . . . . . . . 83

Step 5: Pivot Your Dataset Query Results . . . . . . . . . . . . . . . . . . . . . . . . . . . . . . . . . . . . . . . . . . . . . . . . . . . . . . . . . . . . . . . . . . . . . . . . . . . . . 83Step 6: Chart Your Dataset Query Results . . . . . . . . . . . . . . . . . . . . . . . . . . . . . . . . . . . . . . . . . . . . . . . . . . . . . . . . . . . . . . . . . . . . . . . . . . . . . 87
Navigating SuiteAnalytics Workbook . . . . . . . . . . . . . . . . . . . . . . . . . . . . . . . . . . . . . . . . . . . . . . . . . . . . . . . . . . . . . . . . . . . . . . . . . . . . . . . . . . . . . . . . 90Analytics Home Page . . . . . . . . . . . . . . . . . . . . . . . . . . . . . . . . . . . . . . . . . . . . . . . . . . . . . . . . . . . . . . . . . . . . . . . . . . . . . . . . . . . . . . . . . . . . . . . . . . . . . . . . 90Dataset Tab . . . . . . . . . . . . . . . . . . . . . . . . . . . . . . . . . . . . . . . . . . . . . . . . . . . . . . . . . . . . . . . . . . . . . . . . . . . . . . . . . . . . . . . . . . . . . . . . . . . . . . . . . . . . . . . . . . . . . 91Table Tab . . . . . . . . . . . . . . . . . . . . . . . . . . . . . . . . . . . . . . . . . . . . . . . . . . . . . . . . . . . . . . . . . . . . . . . . . . . . . . . . . . . . . . . . . . . . . . . . . . . . . . . . . . . . . . . . . . . . . . . . 94Pivot Tab . . . . . . . . . . . . . . . . . . . . . . . . . . . . . . . . . . . . . . . . . . . . . . . . . . . . . . . . . . . . . . . . . . . . . . . . . . . . . . . . . . . . . . . . . . . . . . . . . . . . . . . . . . . . . . . . . . . . . . . . . 96Chart Tab . . . . . . . . . . . . . . . . . . . . . . . . . . . . . . . . . . . . . . . . . . . . . . . . . . . . . . . . . . . . . . . . . . . . . . . . . . . . . . . . . . . . . . . . . . . . . . . . . . . . . . . . . . . . . . . . . . . . . . . . 99

SuiteAnalytics Workbook Overview 1
SuiteAnalytics Workbook OverviewSuiteAnalytics Workbook is a new analytical tool available in NetSuite. To watch a high-level overview ofthe newest features available in SuiteAnalytics Workbook, click here.
With SuiteAnalytics Workbook, you can create highly customizable workbooks that combine datasets,pivot tables, and charts using a single tool that leverages the new Analytics Data Source. The AnalyticsData Source is designed to ensure that fields are consistently exposed in SuiteAnalytics Workbook, withconsistent results across all components of the workbook. Additionally, support for multilevel joins hasbeen added to SuiteAnalytics Workbook, enabling you to author workbooks and datasets using fielddata from multiple record types, including custom records. Custom formula fields are also supportedin SuiteAnalytics Workbook, so you can create and add fields with dynamically calculated values to yourworkbooks. Finally, SuiteAnalytics Workbook also offers multiple display options for hierarchical fields, soyou can easily view data for fields with parent-child relationships.
The SuiteAnalytics Workbook user interface has been designed so that even users with limited knowledgeof record schemas and query language can still create complex workbooks and datasets through actionssuch as drag and drop editing. For example, when you define a dataset you can scroll through all theavailable record types and fields that you have access to in the Records and Fields lists. To save timeduring the authoring process, you can also create a workbook based on any of the existing datasets thatyou have access to in your account. Additionally, the interface makes SuiteAnalytics Workbook ideal forad-hoc diagnostic analysis, with options for instant formula validation, data refresh, and drilling downthrough query results. A range of customization options have also been added to the interface to enablerich formatting, filtering, and visualizations of your data.
The latest iteration of SuiteAnalytics Workbook enables you to create workbooks and datasets for a varietyof record types. You can also use analytical record types created specifically for SuiteAnalytics Workbook,such as the Sales (Invoiced) record.
To help familiarize yourself with SuiteAnalytics Workbook, see the following topics:
Important: SuiteAnalytics Workbook is currently not supported by SuiteBundler. To avoidinstallation errors with your bundles, do not include SuiteAnalytics Workbook objects. For moreinformation about SuiteBundler, see the help topic SuiteBundler Overview.
■ SuiteAnalytics Workbook uses the new Analytics Data Source which might require different fields,record types, joins, or formulas to replicate your existing saved searches. Review the Analytics DataSource Overview for more information, including a downloadable list of available record types,guidelines for joining record types, and steps for authoring sample workbooks.
■ To learn how to create your own custom workbooks or datasets, see Custom Workbooks and Datasets.This section includes steps for defining, filtering, and pivoting your workbook source data, as wellprocedures for how to create custom formula fields and charts.
■ SuiteAnalytics Workbook supports multiple predefined workbook and dataset templates, some ofwhich are in a beta state. For more information, see Workbook and Dataset Templates.
■ For information about how to add workbook-based portlets to your NetSuite dashboards, seeWorkbook-based Portlets.
■ Complete the SuiteAnalytics Workbook Tutorial to walkthrough the creation of a sample Transactionworkbook.
■ For information about the elements of the SuiteAnalytics Workbook user interface, see NavigatingSuiteAnalytics Workbook.
■ There are some known limitations with the current iteration of SuiteAnalytics Workbook. For moreinformation, see Known Limitations in SuiteAnalytics Workbook.
SuiteAnalytics Workbook

Enabling SuiteAnalytics Workbook in Your NetSuite Account 2
Enabling SuiteAnalytics Workbook in Your NetSuiteAccountBy default, the SuiteAnalytics Workbook feature is enabled in all NetSuite accounts. If you do not see theAnalytics tab in the NetSuite navigation menu, complete the following steps to verify that the feature hasbeen enabled in your account.
To verify that SuiteAnalytics Workbook is enabled in your account:
1. Log in to your NetSuite account as an administrator.
2. Go to Setup > Company > Enable Features, and click the Analytics subtab.
3. Ensure that the SuiteAnalytics Workbook box is checked.
4. Click Save.
With the feature enabled, all standard roles have access to SuiteAnalytics Workbook except for thefollowing roles:
■ Customer Center
■ Employee Center
■ Vendor Center
■ Partner Center
■ Advanced Partner Center
■ NetSuite Support Center
■ NetSuite Support Center (Basic)
■ Publisher Center
To provide SuiteAnalytics Workbook access to users assigned to a custom role, add the SuiteAnalyticsWorkbook permission to the role and set the access level to Edit on the Reports subtab of thePermissions tab.
To enable users to edit and monitor workbooks created by other users in your account, add the AnalyticsAdministrator permission to the user’s role on the Setup subtab of the Permissions tab. Alternatively, toenable the Analytics Administrator permission for individual users, add the Analytics Administrator globalpermission to the employee record.
For more information about customizing roles, see the help topic Customizing or Creating NetSuite Roles.
SuiteAnalytics Workbook

Enabling SuiteAnalytics Workbook in Your NetSuite Account 3
For more information about the Analytics Administrator permission, see The Analytics AdministratorPermission.
The Analytics Administrator PermissionThe Analytics Administrator permission enables users to delete, share, and edit the workbooks anddatasets created in your account. Users with this permission can also track changes to workbooks anddatasets using the Audit Trail and Execution Log record types. Additionally, the Analytics Administratorpermission enables users to define the audience for workbook and dataset templates.
The minimum access level for the permission is Full, and by default it is enabled for accountadministrators. The permission can be assigned to a role on the Setup subtab of the Permissions tab,or as a global permission on an employee record. Deleted workbooks and datasets are irretrievablehowever, so the permission should only be enabled for a small number of users in your account.Additionally, while users with the Analytics Administrator permission can delete workbooks and datasetscreated by other users, they can still only view the fields and records that they have access to based ontheir NetSuite permissions. Users with the Analytics Administrator permission are also not automaticallygiven access to SuiteAnalytics Workbook and must be assigned to a role with the SuiteAnalytics Workbookpermission to access the tool.
Editing Employee Workbooks and DatasetsUsers with the Analytics Administrator permission have access to every workbook and dataset in youraccount through the Analytics Home page.
■ To view workbooks and datasets created by other users, select Employee Workbooks or EmployeeDatasets in the drop down list of the respective subtab.
■ To change the properties of a workbook or dataset without opening it, click the Edit icon next toName, Description, or Owner fields. You can also share or delete workbooks and datasets using theicons in the Actions column. Currently, notifications are not sent when workbooks are deleted, shared,or assigned to new owners.
Auditing Workbooks and DatasetsTo monitor the use of SuiteAnalytics Workbook, users with Analytics Administrator permission have accessto the Audit Trail and Execution Log record types. There is a version of each record type for workbooksand datasets, which you can differentiate using the Record ID. The dataset Audit Trail and Execution Logrecord types both contain ‘Ds’ in the Record ID. You can use these record types to create datasets thatshow you the data being accessed through SuiteAnalytics Workbook and to track changes to the savedworkbooks and datasets in your account.
Record Type Description Fields
Audit Trail Displays changes made to each saved workbook or dataset in youraccount, including the date the change was saved and the user whosaved it. Records for each saved workbook and dataset are storedindefinitely, or until the workbook or dataset is deleted.
■ To view the most recent saved changes, join fields from theChange Audit Change record type to the Audit Trail dataset.
■ To view the details of each saved change in a workbook ordataset, including the fields that were changed and the new andoriginal values, join the New Value and Old Value fields from theDetail Audit Detail record type to the Audit Trail dataset.
Date/Time, ID, User, SavedWorkbook
SuiteAnalytics Workbook

The Analytics Administrator Permission 4
Execution Log Displays all workbooks and datasets that were created in the past30 days, including those that were not saved. For each workbook ordataset listed, the Execution Log displays the following data:
■ All fields used on the dataset
■ The base record type
■ The date the workbook or dataset was run
■ The name of the user who ran the workbook or dataset
■ If a component of the workbook or dataset was exported
■ Any formulas used
■ If applicable, the name of the associated saved workbook
Base Record Type, Date/Time,Export, Expression, Fields,Formulas, ID, User Name, SavedWorkbook
Defining the Audience for Workbook and DatasetTemplatesSuiteAnalytics Workbook offers many predefined workbook and dataset templates. For a detailedlist including summaries of the content within each workbook or dataset, see Workbook and DatasetTemplates.
Some of these templates are in a beta or demo state and should be used for test purposes only.
To provide access to these templates, users with the Analytics Administrator permission can sharemost templates with specific users or roles directly from the Analytics Home page. If the Share icon isunavailable for a workbook or dataset, users with the Analytics Administrator permission must open theworkbook or dataset and save and share a copy of it. For more information about sharing workbooks anddatasets, see Sharing Workbooks and Datasets.
Accessing and Sharing Workbooks and DatasetsImportant: Workbooks created prior to 20.1 now exist as two separate workbook and datasetobjects. Consequently, any users that you shared a workbook with prior to this release now haveaccess to both the workbook and the associated dataset. However, because changes to a datasetare automatically propagated to any associated workbooks, recipients cannot edit a shareddataset unless they save their own versions. For more information, see Custom Workbooks andDatasets.
When you first click the Analytics tab from the NetSuite navigation menu, you are presented with allthe workbooks and datasets that you have access to on the Analytics Home page. This includes anyworkbooks or datasets that you own and any that have been shared with you. If you have the AnalyticsAdministrator permission, you can also open workbooks and datasets created by other users and accessor share the predefined workbook and dataset templates in your account. For more information aboutthe Analytics Administrator permission, see The Analytics Administrator Permission.
The record types and fields displayed in each workbook or dataset are based on the features enabledin your account and the permissions assigned to the role you use to login to NetSuite. For example, toview fields and data from the Invoice record type or to create a dataset based on the Invoice record type,you must have the Invoice permission assigned to your role. Additionally, certain actions in SuiteAnalyticsWorkbook are controlled by your NetSuite permissions. For example, to export a dataset to a CSV file, youmust have the Exports Lists permission at the Create level or higher.
For more information about specific record type and field access in SuiteAnalytics Workbook, downloadthe following worksheet: NetSuitePermissionsUsage.xls. If you do not see a specific record type or field
SuiteAnalytics Workbook

Accessing and Sharing Workbooks and Datasets 5
that you need to access, contact your system administrator. Also, keep in mind that you can only accesscertain workbooks and datasets such as the Sales (Invoiced) Workbook, if they are shared with you byother users in your account. For more information, see Sharing Workbooks and Datasets.
Sharing Workbooks and DatasetsYou can share workbooks and datasets with individual users or groups of users on a role by role basis.To prevent data discrepancies in workbooks that use the same dataset, recipients of a shared workbookcannot edit the associated dataset. For example, if you share a workbook with users assigned to theAccountant role, all users assigned to that role can access and save their own versions of the workbook ordataset, but they cannot edit the original dataset.
Any user with access to SuiteAnalytics Workbook can share a workbook or dataset, however users canonly view the record types and fields they have permissions for in shared content. Record types and fieldsthat a user does not have access to are simply not displayed in the shared workbook or dataset.
Shared workbooks include all components of the workbook, including any selections made on the TableView, Pivot, or Charts tabs. Shared datasets contain all the join record types, fields, and criteria filters usedto define the dataset. If you have the export lists permission and you only want to share your workbooksource data, click the Export icon in the dataset to download a CSV file of the Data Grid which you candistribute to other users.
To share a workbook:
Note: If you have the Analytics Administrator permission and you want to share workbook ordataset templates such as Open Sales Orders Lines or Number of Fulfillments, you must follow thesteps in this procedure. These templates cannot be shared from the Analytics Home page.
1. Click Share from anywhere within the workbook or dataset.
The Share Workbook window appears.
2. Select the roles or users you want to share the workbook with, then click the right arrow to addthem to the distribution list.
SuiteAnalytics Workbook

Accessing and Sharing Workbooks and Datasets 6
3. Click Share.
The object is shared and will appear on the Analytics Home page for the selected recipients.Currently, notifications are not sent when a workbook is shared with a user.
Important: You cannot save or share datasets that contain fields that are in a beta state.These fields are for test purposes only and are subject to change. If your dataset containsfields that are in a beta state or your workbook is based on a dataset that contains betafields, remove the fields before you attempt to save.
Data Refresh in SuiteAnalytics WorkbookIn SuiteAnalytics Workbook, by default the data presented in pivot tables and charts tab is cached every60 minutes. This caching process provides better performance by returning results faster. However, theseresults might not display the most current data.
To find out when the data was last refreshed in your workbook, verify the time displayed in the Lastupdated field, in the upper-right corner of the Viewer. To better understand the default caching processand how to clear the cache manually, see the following topics:
■ Understanding Data Caching in Charts and Pivot Tables
■ Clearing the Cache for Pivot Tables and Charts
Understanding Data Caching in Charts and Pivot TablesThe data that is displayed in each tab of a workbook varies depending on the following scenarios:
■ Creating and modifying pivot tables and charts in an existing workbook
■ Saving and re-opening a workbook before 60 minutes have elapsed
■ Saving and re-opening a workbook after 60 minutes have elapsed
■ Working with the Analytics Portlet
Creating and modifying pivot tables and charts in an existingworkbookAfter you set the layout of a new pivot table or chart, click the Refresh icon to apply the changes andupdate the results. If you make changes to a pivot table directly from the Pivot Table Viewer, the resultsare automatically displayed.
When you create or modify your pivot tables and charts, SuiteAnalytics Workbook creates a backendquery. This backend query definition retrieves the results for the defined pivot tables and charts, andenables you to see the results in the Viewer. If there are pivot tables and charts that share the samebackend query definition, the data used for the refresh can vary:
■ If the backend query was refreshed less than 60 minutes ago from either the pivot or chart tab, thedata from the cache is used for the refresh.
■ If the backend query was refreshed more than 60 minutes ago from either the pivot or chart tab, themost current data is used for the refresh.
You can verify the time of the last refresh in the upper-right corner of the pivot table or chart viewer.
SuiteAnalytics Workbook

Data Refresh in SuiteAnalytics Workbook 7
Saving and re-opening a workbook before 60 minutes haveelapsedWhen you re-open a saved workbook before 60 minutes have elapsed and open a pivot table or chart, bydefault the Viewer displays cached data. The time of the last refresh appears in the upper-right corner ofthe Viewer. To retrieve the most current data, click the Refresh icon.
Saving and re-opening a workbook after 60 minutes haveelapsedWhen you re-open a saved workbook after 60 minutes have elapsed, the cached data has expired.Consequently, when you open a pivot table or chart, the Viewer automatically displays the most currentresults.
Working with the Analytics PortletThe pivot tables and charts in the Analytics portlet display the same data as their correspondingworkbooks. However, you can retrieve the most current results by clicking the Refresh icon .
For more information about how to clear the cache manually, see Clearing the Cache for Pivot Tables andCharts.
Clearing the Cache for Pivot Tables and ChartsThe Clear cache option clears cached data from workbook pivot tables and charts so that you canretrieve the most current results. You can verify when the data was last updated by checking the date andtime displayed in the upper-right corner of the pivot table or chart Viewer. The following steps describehow you can clear the cache for your open pivot tables and charts.
To clear the cache for pivot tables and charts:
1. On the Pivot or Chart tab, click the menu icon in the upper right corner of the Viewer.
A popup message appears asking if you want to clear the cache.
2. Choose how you want to proceed:
■ Clear cache - Clears the cache for the entire workbook. The time and date in the upper-rightcorner of the Viewer is updated to reflect when the data was updated.
■ Cancel - The cache is not cleared. Data is updated following the default caching process.
3. If you clear the cache, a popup message appears asking you to refresh all pivot tables and chartsand an icon is displayed next to each pivot table and chart in the workbook. There are threeavailable icons:
■ Warning icon - The displayed results are not up to date according to the date and timeshown in the Last updated field. To retrieve the most current results, click the Refresh icon .
■ Loading icon - The data is currently being updated according to the date and time shown inthe Last updated field. After the refresh is completed, the icon changes to either the pivot orchart icon.
■ Pivot and Chart icons - The data displayed is up to date according to the date and timeshown in the Last updated field.
SuiteAnalytics Workbook

Data Refresh in SuiteAnalytics Workbook 8
4. To retrieve the most current results in each open pivot table and chart, click the Refresh icon ineach tab.
For more information about the Pivot table and Chart tabs, see Pivot Tab and Chart Tab.
To better understand the caching process of SuiteAnalytics Workbook, see Understanding Data Cachingin Charts and Pivot Tables.
Known Limitations in SuiteAnalytics WorkbookThe following features and interactions in SuiteAnalytics Workbook have known limitations that arecurrently being addressed by our development teams:
■ On the Pivot tab, you cannot apply measure-based filters to fields that contain date or text valueswhen the aggregation types for those fields are set to Min or Max.
For more information about measure-based filters, see Workbook Component Filters.
■ Some ad blocker plug-ins can prevent you from creating pivot tables or charts. To avoid errors withthe Pivot or Chart tabs, deactivate these plug-ins and mark NetSuite as an exception. For moreinformation about NetSuite browser support, see the help topic Supported Browsers for NetSuite.
■ If you define a criteria filter that is invalidated based on changes to the field used in the filter condition,you are currently unable to edit the filter.
■ Users assigned to the Employee Center or Partner Center roles who have permission to accessSuiteAnalytics Workbook might not see the Analytics option in the NetSuite navigation menu.
■ Filters that you create on the Dataset tab based on custom duration values currently do not work asexpected.
■ When you query the Analytics Data Source using SuiteScript, you currently cannot filter data usingrecordTypes such as Invoice.
■ If you add multiple pivot tables or charts in a workbook, the user interface does not always displayarrows so that you can switch between each table and chart.
■ Certain ad blocking software can prevent data from loading in your workbook pivot tables.
■ The search field on the Dataset tab searches across record types that are one join away from the rootrecord type. To find record types that are more than one join away, click Show more results.
SuiteAnalytics Workbook

Analytics Data Source Overview 9
Analytics Data Source OverviewFor every NetSuite account, all data is stored using a single database. The data sources used to exposethis data through Saved Searches and Reports however, are slightly unique. For some record types, theseunique data sources have resulted in inconsistent field naming and data exposure between the two tools.
In SuiteAnalytics Workbook, fields and record types are exposed using a new Analytics Data Source thatis designed to display consistent data across the workbook application. Fields created in support of newNetSuite features are exposed to SuiteAnalytics Workbook using the Analytics Data Source, as of 2019.1.
The location, names, and IDs of some fields and record types might be different in the Analytics DataSource. Additionally, some record types and fields have not been ported to the Analytics Data Source.This includes fields that contain calculated values for certain record types. Consequently, you might needto use different record types and fields, or create new joins and custom formula fields to recreate yourexisting saved searches using SuiteAnalytics Workbook.
To help you navigate the Analytics Data Source, see the following topics:
■ The Analytics Data Source supports hundreds of record types and fields. For more information,including a complete list of all currently supported record types and fields, see Available Record Types.
■ The location and names of some fields in the Analytics Data Source might be different from theirSearch and Report counterparts. Additionally, some fields such as fields with calculated values havenot yet been ported to the Analytics Data Source. For more information about differences in the newdata source, see Analytics Data Source Changes.
■ After you select a root record type for a custom dataset or open a saved or shared dataset, all relatedrecord types that you have access to are displayed in the Records list. For more information aboutusing the Dataset tab to select and join related record types, see Defining a Dataset.
■ You can use SuiteQL to run queries against the Analytics Data Source through SuiteAnalytics Connect.For more information, see SuiteQL.
■ SuiteAnalytics Workbook supports multilevel joins, however there are certain functions andinteractions that you should be cautious of when adding specific record types or fields to a dataset.For more information, see Guidelines for Joining Record Types in SuiteAnalytics Workbook.
SuiteQLSuiteQL is a query language based on the SQL-92 revision of the SQL database query language. Itprovides advanced query capabilities you can use to access your NetSuite records and data.
SuiteQL is currently available for querying the new data source through SuiteAnalytics Connect only.
Some benefits of using SuiteQL include the following:
■ Support for the new data source: SuiteQL lets you query the new data source. The new datasource enhances the capabilities of querying your NetSuite data. The exposed data is consistent withSuiteAnalytics Workbook, which resolves previous data exposure inconsistencies in saved searchesand reports. For more information, see Analytics Data Source Overview.
■ Improved security: SuiteQL enforces the same role-based access restrictions used in SuiteAnalyticsWorkbook. This means that SuiteQL lets you query the same data you can access in the SuiteAnalyticsWorkbook user interface, which helps to increase security. SuiteQL also includes a list of supportedSQL functions and does not allow you to use unsupported SQL functions in your query, which preventsSQL injection.
SuiteQL supports the syntax for both SQL-92 and Oracle SQL. However, you cannot use both syntaxes inthe same query.
To help you understand how to use SuiteQL, see the following help topics:
SuiteAnalytics Workbook

SuiteQL 10
■ SuiteQL Syntax and Examples■ SuiteQL Limitations and Exceptions■ Using SuiteQL
SuiteQL Syntax and ExamplesSuiteQL supports the syntax for both SQL-92 and Oracle SQL, but you cannot use both syntaxes in thesame query. To learn about these syntaxes, see the following help topics:
■ SQL-92 Language Reference■ Oracle Database SQL Language Reference
The following sections show you how to create queries using SuiteQL and the new data source.
Simple QueriesThis section demonstrates how to perform simple queries using SuiteQL.
Field Values from RecordsThis string queries for entityid, firstname, and lastname field values in all employeerecords. By default, field values use the RAW field context. For more information, see the help topicquery.FieldContext.
SELECT employee.entityid AS entityidRAW, employee.firstname AS firstnameRAW, employee.lastname AS lastnameRAW FROM employee
Field Values with ConditionsThis string queries for entityid field values in employee records where the expenselimit of theemployee is greater than or equal to 5000.
SELECT employee.entityid AS entityidRAW FROM employee WHERE employee.expenselimit >= 5000
This string queries for entityid field values in employee records where the expenselimit of the employee isgreater than or equal to 5000 or the employee is a sales representative.
SELECT employee.entityid AS entityidRAW FROM employee WHERE employee.expenselimit >= 5000 OR employee.issalesrep = 'T'
Joined RecordsThis string queries for paytype and payrate field values in employee records joined to employeeearning records where the employee is the same on both records:
SELECT paytype, payrate FROM employeeEarning earning, employee WHERE earning.employee = employee.id
Advanced QueriesThe following strings demonstrate advanced queries using SuiteQL.
/* set operations */SELECT * FROM transactions UNION SELECT * FROM transactions /* ODBC 2.0 Extended */;
SuiteAnalytics Workbook

SuiteQL 11
/* top n */SELECT TOP 10 * FROM transactions /* OpenAccess, not in ODBC 2.0, Syntax taken from SYBASE/Access */;SELECT TOP 1 id FROM transactions UNION SELECT TOP 1 id FROM transactions /* TOP in set operations: allegedly unsupported in OpenAccess, but accepted. Not in ODBC 2.0 */;
/* select list */SELECT DISTINCT email FROM transactions /* DISTINCT in select list: ODBC 2.0 Minimal */;SELECT (SELECT MAX(1) FROM transactions) AS one FROM transactions /* Subquery in select list: OpenAccess only, not in ODBC 2.0 */;SELECT COUNT(DISTINCT 1+id) FROM transactions /* expression in COUNT: OpenAccess only, not in ODBC 2.0 */;SELECT COALESCE(email, id, 'some value', 1 + 1) FROM transactions /* not in ODBC 2.0, OpenAccess and SQL-92 only */;
/* from */SELECT * FROM transactions, transactionLine /* ODBC 2.0 Minimal */;SELECT * FROM (SELECT * FROM transactions) a INNER JOIN ((SELECT * FROM transactions UNION SELECT * FROM transactions) b INNER JOIN (SELECT * FROM transactions) c ON 1=1) ON 1=1 /* OpenAccess only, not in ODBC 2.0 */;SELECT * FROM (SELECT id, COUNT(*) cnt FROM transactionLine GROUP BY id) WHERE cnt > 2 /* OpenAccess only, not in ODBC 2.0 */;
/* where */SELECT * FROM transactions t WHERE id IN (SELECT id FROM transactions WHERE id = t.id UNION SELECT -1 FROM transactions) /* Correlated subquery with set operations: unsupported in OpenAccess */;SELECT * FROM transactions WHERE 1 = (SELECT MAX(1) FROM transactions) /* subquery as right operand: ODBC 2.0 Core */;SELECT * FROM transactions WHERE EXISTS(SELECT 1 FROM transactions) /* ODBC 2.0 Core */;SELECT * FROM transactions WHERE id IN ((SELECT MAX(1) FROM transactions), 2+1) /* OpenAccess only, not in ODBC 2.0 */;
/* having */SELECT email, COUNT(*), MAX(create_date) FROM transactions GROUP BY email HAVING COUNT(*) > 2 /* ODBC 2.0 Core */;
SuiteQL Limitations and ExceptionsThe following are known limitations and exceptions when using SuiteQL:
■ SuiteQL is currently supported by SuiteAnalytics Connect only. To learn how to use SuiteQL withSuiteAnalytics Connect, see Using SuiteQL with the Connect Service.
■ You can create SuiteQL queries using the syntax for either SQL-92 or Oracle SQL, but you cannot useboth syntaxes in the same query. To learn about SuiteQL syntax and grammar, see SuiteQL Syntax andExamples.
■ There is no dedicated browser for the new data source yet. To find all record types and fields that arecurrently available for the new data source schema, you can download a spreadsheet that includes allavailable records.To access the spreadsheet and download it, go to Available Record Types.
Using SuiteQLSuiteQL lets you query your NetSuite data using advanced query capabilities. SuiteQL includes a list ofsupported SQL functions and does not allow you to use unsupported SQL functions in your query, whichprevents SQL injection and other unauthorized access to data.
SuiteAnalytics Workbook

SuiteQL 12
Important: Currently, you can use SuiteQL with SuiteAnalytics Connect only.
To learn how to use SuiteQL, see the following help topics:
■ Finding Record Type and Field Names
■ Using SuiteQL with the Connect Service
Finding Record Type and Field NamesSuiteQL queries include references to record types and fields. For example, the following SuiteQL stringqueries for entityid field values that are included in employee records:
SELECT employee.entityid AS entityidRAW FROM employee
To create a query using SuiteQL, you must know the names of the record types and fields that you wantto use in your query. You can find these names using several methods:
■ Using the SuiteAnalytics Workbook UI
■ Using the Available Records Spreadsheet
Using the SuiteAnalytics Workbook UI
You can use the SuiteAnalytics Workbook UI to find record type and field names. SuiteAnalytics Workbookuses the same data source that SuiteQL does, so you can use the SuiteAnalytics Workbook UI to explorethe available record types and fields before you create your query.
To find record type and field names using the SuiteAnalytics Workbook UI:
1. In your NetSuite account, click the Analytics tab in the NetSuite navigation menu.
2. On the Workbooks page, click New Workbook.
3. Search for the record type that you want to use as the root record of your query.
The name of each supported record type is listed in the Record ID column. You can use this pageto find all supported record type names, but you cannot use this page to find field names. If youneed to find field names, continue to step 4.
4. Click a record type. A workbook is created with the selected record type as the root record.
SuiteAnalytics Workbook

SuiteQL 13
The left column lists the record types that you can join with the root record. The middle columnlists the fields that are available on the selected record.
5. In the middle column, find the field that you want to use in your query. Hover over the field, andclick the information button.
Information about the field is displayed. The field name is listed under Field ID. You can also seethe type of data that the field contains (text, date, boolean, and so on).
If you want to find field names for fields that are on a different root record, repeat this procedure fromstep 2 and choose a new root record. To learn more about creating workbooks, see SuiteAnalyticsWorkbook Tutorial.
Using the Available Records Spreadsheet
Record type and field names are listed in a spreadsheet that you can use when you create your SuiteQLquery. This spreadsheet also indicates whether a record or field is available in different contexts (suchas in SuiteAnalytics Workbook or SuiteAnalytics Connect) and lists the features and permissions that arerequired to use the record or field.
SuiteAnalytics Workbook

SuiteQL 14
To access this spreadsheet, go to Available Record Types and download it using the download link.
To find record type and field names using the Available Records spreadsheet:
1. Download and open the spreadsheet.2. In the Record Label column, find the record type that you want to use in your query.
The spreadsheet includes the following columns related to records:
■ Record ID: The record type name to use in your query■ Record Label: The display name or friendly name of the record■ Record Feature: The NetSuite feature that must be enabled to use the record (for more information,
see the help topic Enabling Features)■ Record Permission: The NetSuite permission that your role must have to use the record (for more
information, see the help topic NetSuite Permissions Overview)■ Workbook Enabled, Connect Enabled, SuiteScript Enabled: Whether the record is available in
different contexts, such as in SuiteAnalytics Workbook or SuiteAnalytics Connect
The spreadsheet also includes the following columns related to fields:
■ Field ID: The field name to use in your query■ Field Label: The display name or friendly name of the field■ Field Feature: The NetSuite feature that must be enabled to use the field■ Field Permission: The NetSuite permission that your role must have to use the record■ Field Workbook Enabled, Field Connect Enabled, Field SuiteScript Enabled: Whether the field is
available in different contexts, such as in SuiteAnalytics Workbook or SuiteAnalytics Connect
Using SuiteQL with the Connect ServiceYou can use SuiteQL to query your NetSuite data through the Connect Service. To do so, you mustconsider the following:
■ Syntax Requirements■ Querying the New Data Source■ Supported Functions■ Unsupported Functions■ Unsupported Features in SQL-92
Syntax RequirementsAs you create queries using SuiteQL and the Connect Service, consider the following syntax requirements:
■ For string concatenation, you cannot use the + operator. You should use the || operator instead. Thisrestriction applies to both field and literal concatenation.
■ You cannot use more than 1000 arguments in a single IN clause.■ You cannot use date literals. You must encapsulate dates using the to_date() function.■ When using Oracle SQL syntax, you cannot use right outer joins. For example, the following Oracle
SQL is not valid in SuiteQL:
select a1.id from account a1, account a2 where a1.id (+) = a2.id
For more information, see the help topic SQL Compliance.
SuiteAnalytics Workbook

SuiteQL 15
Querying the New Data Source
There is no dedicated browser for the new data source yet. To find all record types and fields that arecurrently available for the new data source schema, you can do the following:
■ Use the Available Records spreadsheet that lists the available record types and fields. To download thespreadsheet, go to Available Record Types.
■ Use the OA_COLUMNS, OA_TABLES, and OA_FKEYS database tables. To learn about the tables, see thehelp topic SuiteAnalytics Connect System Tables.
Note: The OA_FKEYS table does not provide information about foreign keys forNetSuite2.com data source. The table provides primary keys only.
The new data source is not accessible for the following roles: Administrator, Full Access (Deprecated),roles requiring Two-Factor Authentication (2FA), and roles accessing the Connect Service with IPrestrictions. For more information, see the help topic Role-based Permissions for the New Data Source.
Supported Functions
The following table outlines the list of functions you can use when you run queries using SuiteQL with theConnect Service.
Supported Function Description
ABS returns the absolute value of n
ACOS returns the arc cosine of n
ADD_MONTHS returns the date date plus integer months
APPROX_COUNT_DISTINCT returns the approximate number of rows that contain distinct values of expr
ASCII returns the decimal representation in the database character set of the first characterof char
ASCIISTR takes as its argument a string, or an expression that resolves to a string, in anycharacter set and returns an ASCII version of the string in the database character set
ASIN returns the arc sine of n
ATAN returns the arc tangent of n
ATAN2 returns the arc tangent of n1 and n2
AVG returns the average value of expr
BFILENAME returns a BFILE locator that is associated with a physical LOB binary file on the serverfile system
BITAND computes an AND operation on the bits of expr1 and expr2
CEIL returns smallest integer greater than or equal to n
CHARTOROWID converts a value from CHAR, VARCHAR2, NCHAR, or NVARCHAR2 datatypeto ROWIDdatatype
CHR returns the character having the binary equivalent to n as a VARCHAR2 value
COALESCE returns the first non-null expr in the expression list
SuiteAnalytics Workbook

SuiteQL 16
Supported Function Description
COMPOSE takes as its argument a string, or an expression that resolves to a string, in anydatatype, and returns a Unicode string in its fully normalized form in the samecharacter set as the input
CONCAT concatenates char1 and char2 into one string
CORR returns the coefficient of correlation of a set of number pairs
CORR_K calculates the Kendall's tau-b correlation coefficient
CORR_S calculates the Spearman's rho correlation coefficient
COS returns the cosine of n (an angle expressed in radians)
COSH returns the hyperbolic cosine of n
COUNT returns the number of rows returned by the query
COVAR_POP returns the population covariance of a set of number pairs
COVAR_SAMP returns the sample covariance of a set of number pairs
CURRENT_DATE returns the current date in the session time zone, in a value in the Gregorian calendarof datatype DATE
CURRENT_TIMESTAMP returns the current date and time in the session time zone
DECODE compares expr to each search value one by one. If expr is equal to a search, then theOracle database returns the corresponding result
DECOMPOSE takes as its argument a string in any datatype and returns a Unicode string afterdecomposition in the same character set as the input
DENSE_RANK computes the rank of a row in an ordered group of rows and returns the rank asa NUMBER
EMPTY_BLOB returns an empty LOB locator
EMPTY_CLOB returns an empty LOB locator
EXP returns e raised to the nth power
FLOOR returns largest integer equal to or less than n
FROM_TZ converts a timestamp value and a time zone to a TIMESTAMP WITH TIME ZONE value
GREATEST returns the greatest of a list of one or more expressions
INITCAP returns char, with the first letter of each word in uppercase, all other letters inlowercase
INSTR searches string for substring
LAST_DAY returns the date of the last day of the month that contains date
LEAST returns the least of the list of exprs
LENGTH returns the length of char
LENGTH2 returns the length of the specified string, using UCS2 code points
LENGTH4 returns the length of the specified string, using UCS4 code points
SuiteAnalytics Workbook

SuiteQL 17
Supported Function Description
LENGTHB returns the length of the specified string, using bytes instead of characters
LENGTHC returns the length of the specified string, using Unicode complete characters
LN returns the natural logarithm of n, where n is greater than 0
LOCALTIMESTAMP returns the current date and time in the session time zone in a value ofdatatype TIMESTAMP
LOG computes the logarithm of an expression
LOWER returns char, with all letters in lowercase
LPAD returns expr1, left-padded to length n characters with the sequence of charactersin expr2
LTRIM removes from the left end of char all of the characters contained in set
MAX returns the maximum value of expr
MEDIAN is an inverse distribution function that assumes a continuous distribution model. Ittakes a numeric or datetime value and returns the middle value or an interpolatedvalue that would be the middle value once the values are sorted
MIN returns the minimum value of expr
MOD returns the remainder of n2 divided by n1. Returns n2 if n1 is 0
MONTHS_BETWEEN returns the number of months between date1 and date2
NANVL useful only for floating-point numbers of type BINARY_FLOAT or BINARY_DOUBLE.This function is useful for mapping NaN values to NULL
NEW_TIME returns the date and time in time zone timezone2 when date and time in timezone timezone1 are date
NEXT_DAY returns the date of the first weekday named by char that is later than the date
NLSSORT returns the string of bytes used to sort char
NLS_INITCAP returns char, with the first letter of each word in uppercase, all other letters inlowercase
NLS_LOWER returns char, with all letters in lowercase
NLS_UPPER returns char, with all letters in uppercase
NULLIF compares expr1 and expr2. If they are equal, then the function returns null. If they arenot equal, then the function returns expr1
NVL lets you replace null (returned as a blank) with a string in the results of a query
NVL2 lets you determine the value returned by a query based on whether a specifiedexpression is null or not null
ORA_HASH computes a hash value for a given expression
POWER returns n2 raised to the n1 power
RANK calculates the rank of a value in a set of values
REGEXP_INSTR extends the functionality of the INSTR function by letting you search a string for aregular expression pattern
SuiteAnalytics Workbook

SuiteQL 18
Supported Function Description
REGEXP_REPLACE extends the functionality of the REPLACE function by letting you search a string for aregular expression pattern
REGEXP_SUBSTR extends the functionality of the SUBSTR function by letting you search a string for aregular expression pattern
REMAINDER returns the remainder of n2 divided by n1
REPLACE returns char with every occurrence of search_string replaced with replacement_string
ROUND returns n rounded to integer places to the right of the decimal point
ROW_NUMBER analytic function that assigns a unique number to each row to which it is applied
RPAD returns expr1, right-padded to length n characters with expr2, replicated as manytimes as necessary
RTRIM removes from the right end of char all of the characters that appear in set
SIGN returns the sign of n
SIN returns the sine of n (an angle expressed in radians)
SINH returns the hyperbolic sine of n
SOUNDEX returns a character string containing the phonetic representation of char
SQRT returns the square root of n
SUBSTR returns a portion of char, beginning at character position, substring_length characterslong
SUM returns the sum of values of expr. You can use it as an aggregate or analytic function
SYS_EXTRACT_UTC extracts the UTC from a datetime value with time zone offset or time zone regionname
TAN returns the tangent of n (an angle expressed in radians)
TANH returns the hyperbolic tangent of n
TO_BINARY_DOUBLE returns a double-precision floating-point number
TO_BINARY_FLOAT returns a single-precision floating-point number
TO_CHAR (number) converts n to a value of VARCHAR2 datatype
TO_CLOB converts NCLOB values in a LOB column or other character strings to CLOB values
TO_DATE converts char of CHAR, VARCHAR2, NCHAR, or NVARCHAR2 datatype to a valueof DATE datatype
TO_MULTI_BYTE TO_MULTI_BYTE returns char with all of its single-byte characters converted to theircorresponding multibyte characters
TO_NCHAR converts a character string, CHAR, VARCHAR2, CLOB, or NCLOB value to the nationalcharacter set
TO_NCLOB converts CLOB values in a LOB column or other character strings to NCLOB values
TO_NUMBER converts expr to a value of NUMBER datatype
SuiteAnalytics Workbook

SuiteQL 19
Supported Function Description
TO_SINGLE_BYTE returns char with all of its multibyte characters converted to their correspondingsingle-byte characters
TO_TIMESTAMP converts char of CHAR, VARCHAR2, NCHAR, or NVARCHAR2 datatype to a valueof TIMESTAMP datatype
TO_TIMESTAMP_TZ converts char of CHAR, VARCHAR2, NCHAR, or NVARCHAR2 datatype to a valueof TIMESTAMP WITH TIME ZONE datatype
TRANSLATE returns expr with all occurrences of each character in from_string replaced by itscorresponding character in to_string
TRUNC (number) returns n1 truncated to n2 decimal places
TZ_OFFSET returns the time zone offset corresponding to the argument based on the date thestatement is executed
UNISTR takes as its argument a text literal or an expression that resolves to character dataand returns it in the national character set
UPPER returns char, with all letters in uppercase
VSIZE returns the number of bytes in the internal representation of expr
WIDTH_BUCKET lets you construct equiwidth histograms, in which the histogram range is divided intointervals that have identical size
Unsupported Functions
The following table provides a list of functions that are not supported when you run queries using SuiteQLwith the Connect Service. It also provides an alternative function you can use for each unsupportedfunction, if available.
Unsupported Function Alternative Function (If Available)
BIT_LENGTH
CEILING CEIL
CHAR
CHARINDEX INSTR
CHAR_LENGTH LENGTH
CHARACTER_LENGTH LENGTH
CONVERT
COT
DATEDIFF
LCASE LOWER
LEFT
LOCATE INSTR
POSITION
SuiteAnalytics Workbook

SuiteQL 20
Unsupported Function Alternative Function (If Available)
REPEAT
RIGHT
SUBSTRING SUBSTR
UCASE UPPER
Unsupported Features in SQL-92
When using SQL-92 syntax, there are several features that are not supported, including embedded nullvalues in CHAR fields, DEFAULT clauses for column values, and subqueries in SELECT lists.
For a full list of unsupported features, see Non-Supported SQL-92 functionality.
Available Record TypesSuiteAnalytics Workbook supports hundreds of record types available through the Analytics Data Source.This includes most of the record types used throughout NetSuite, plus analytical record types currentlyin development for SuiteAnalytics Workbook, such as the Sales Analytical record type. These analyticalrecord types are in a beta state and are subject to change. The data displayed within these record typesare also subject to change and should be used for test purposes only.
The following link provides access to a Microsoft Excel worksheet that lists every record type and field thatis currently available in SuiteAnalytics Workbook. Custom fields and record types are not included in theworksheet. You can use this list to search for specific record types by name, or for specific fields using thefield ID when you create a new dataset.
To access the worksheet, click this link: WorkbookDataSource19_2.xlsx.
Alternatively, click New Dataset on the Analytics Home page to view each record type that you have accessto in your account. The record category and ID for each record type is displayed. Record types are dividedinto three categories:
■ Standard – record types that are included in each account of your NetSuite implementation and areavailable through all NetSuite data sources. For example, the Transaction record type.
■ Analytical – record types that have been created specifically for use with SuiteAnalytics Workbook.These record types are based on standard record types but contain a unique set of fields. Forexample, the Sales Analytical record type.
■ Custom – record types created by users in your company, that are unique to your NetSuite account.These record types are not included in the WorkbookDataSource19_2.xlsx spreadsheet.
Important: As fields and record types are continually added to the Analytics Data Source, thecontents of the SuiteAnalyticsWorkbookDataSource.xls file are subject to change. Make sure youdownload the most recent version of the worksheet to view the most current data.
Access to record types and fields in SuiteAnalytics Workbook is dependent on the same permissions usedin the NetSuite Saved Search application. For example, to access sales order data through the Transactionrecord type using SuiteAnalytics Workbook, you need to have the Sales Order permission assigned toyour role. Analytical record types such as the Sales (Invoiced) record type are only accessible to users with
SuiteAnalytics Workbook
Available Record Types 21
the Analytics Administrator permission. Additionally, some record types are only available in SuiteAnalyticsWorkbook if you have specific features enabled in your account. For information about permissions—related access to record types and fields in the Analytics Data Source, download the following worksheet:NetSuitePermissionsUsage.xls
After you select a root record type for a dataset or open an existing dataset, the Records list on theDataset tab shows all the related record types that you have access to. If you cannot find a record typethat you think you should have access to, contact your administrator.
Note: The search field on the DataSet tab searches across record types that are one join awayfrom the root record type. To find record types or fields within record types that are more thanone join away, click Show more results.
Analytics Data Source ChangesThe Analytics Data Source is different than the data sources used by the NetSuite Saved Search andReport applications. In the Analytics Data Source, concrete record types that have a corresponding entryform in NetSuite remain mostly unchanged and use the same field labels. For example, the Employeerecord type in SuiteAnalytics Workbook contains mostly all the of fields that are on the NetSuite employeeform, with the same field labels that are used in saved searches and reports. Generic record types that donot have a single corresponding form in NetSuite, such as the Transaction, Entity, and Item record types,use generic field labels. This is because generic record types are representative of multiple concreterecord types. Additionally, some fields in the Analytics Data Source are accessible through different recordtypes than in saved searches and reports.
The design of the Analytics Data Source means that the names of some record types and fields havechanged or appear differently than on NetSuite forms, saved searches, and reports. Some fields, suchas those with calculated values, have also not been ported to the data source and other fields are onlyaccessible by joining specific record types. Furthermore, the Analytics Data Source includes some recordtypes and fields that have been created specifically for SuiteAnalytics Workbook and are not availablethrough saved searches and reports. These record types and fields are in a beta state and should be usedfor test purposes only.
To help you navigate the Analytics Data Source, the following resources are available in the SuiteAnalyticsWorkbook user interface and the NetSuite Help Center:
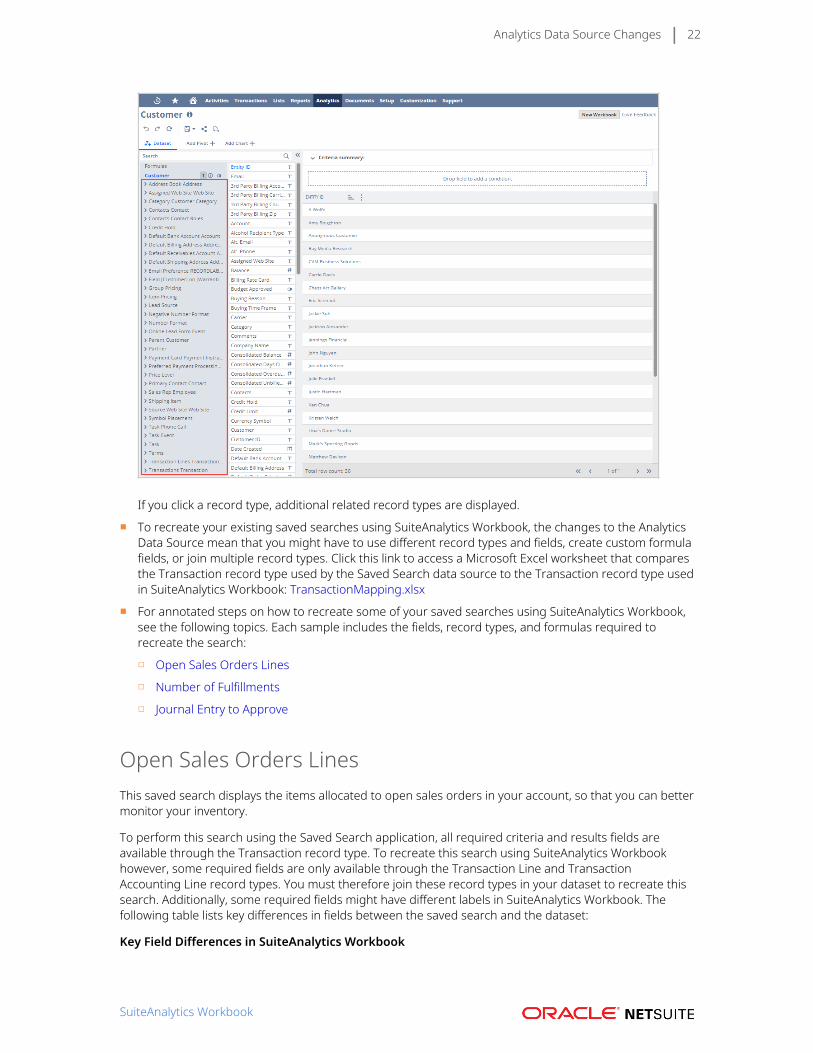
■ To view the record types and fields that you have access to, use the Records list on any dataset. Bydefault, datasets display all joinable record types and fields based on the root record type selectedand the permissions assigned to the role you use to log in to NetSuite. For example, if you select theCustomer record type for your dataset, the following joinable record types are available:
SuiteAnalytics Workbook
Analytics Data Source Changes 22
If you click a record type, additional related record types are displayed.
■ To recreate your existing saved searches using SuiteAnalytics Workbook, the changes to the AnalyticsData Source mean that you might have to use different record types and fields, create custom formulafields, or join multiple record types. Click this link to access a Microsoft Excel worksheet that comparesthe Transaction record type used by the Saved Search data source to the Transaction record type usedin SuiteAnalytics Workbook: TransactionMapping.xlsx
■ For annotated steps on how to recreate some of your saved searches using SuiteAnalytics Workbook,see the following topics. Each sample includes the fields, record types, and formulas required torecreate the search:
□ Open Sales Orders Lines
□ Number of Fulfillments
□ Journal Entry to Approve
Open Sales Orders LinesThis saved search displays the items allocated to open sales orders in your account, so that you can bettermonitor your inventory.
To perform this search using the Saved Search application, all required criteria and results fields areavailable through the Transaction record type. To recreate this search using SuiteAnalytics Workbookhowever, some required fields are only available through the Transaction Line and TransactionAccounting Line record types. You must therefore join these record types in your dataset to recreate thissearch. Additionally, some required fields might have different labels in SuiteAnalytics Workbook. Thefollowing table lists key differences in fields between the saved search and the dataset:
Key Field Differences in SuiteAnalytics Workbook
SuiteAnalytics Workbook
Analytics Data Source Changes 23
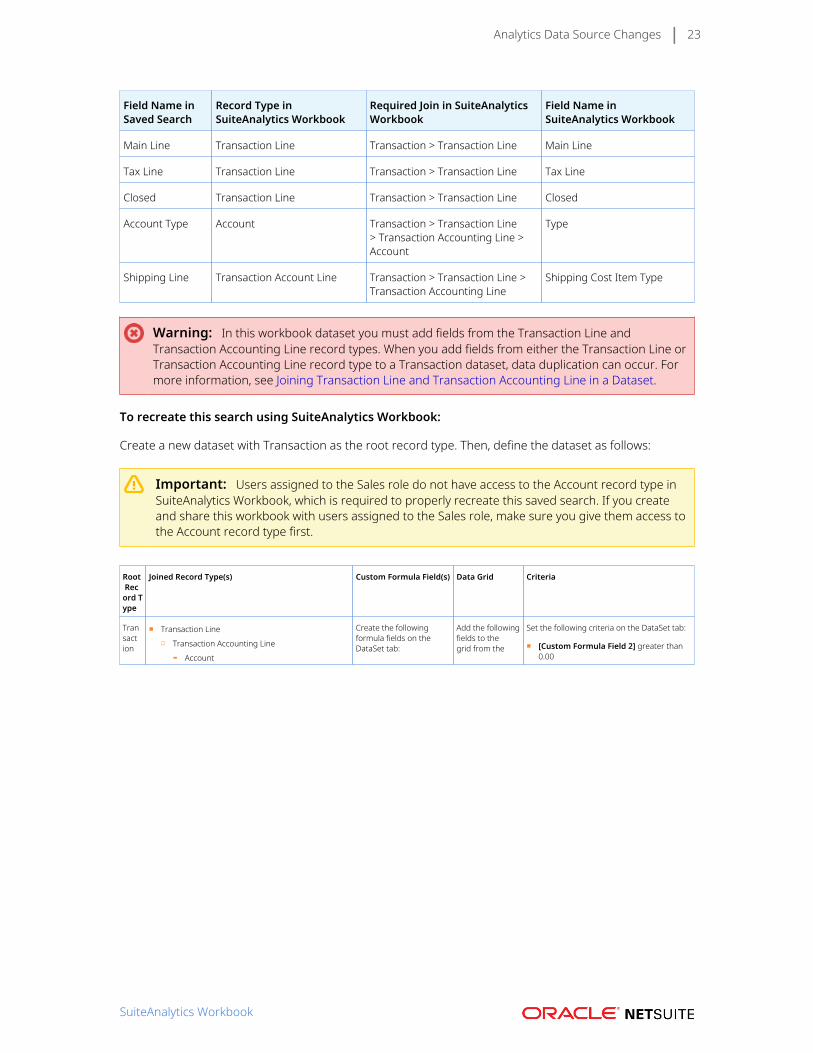
Field Name inSaved Search
Record Type inSuiteAnalytics Workbook
Required Join in SuiteAnalyticsWorkbook
Field Name inSuiteAnalytics Workbook
Main Line Transaction Line Transaction > Transaction Line Main Line
Tax Line Transaction Line Transaction > Transaction Line Tax Line
Closed Transaction Line Transaction > Transaction Line Closed
Account Type Account Transaction > Transaction Line> Transaction Accounting Line >Account
Type
Shipping Line Transaction Account Line Transaction > Transaction Line >Transaction Accounting Line
Shipping Cost Item Type
Warning: In this workbook dataset you must add fields from the Transaction Line andTransaction Accounting Line record types. When you add fields from either the Transaction Line orTransaction Accounting Line record type to a Transaction dataset, data duplication can occur. Formore information, see Joining Transaction Line and Transaction Accounting Line in a Dataset.
To recreate this search using SuiteAnalytics Workbook:
Create a new dataset with Transaction as the root record type. Then, define the dataset as follows:
Important: Users assigned to the Sales role do not have access to the Account record type inSuiteAnalytics Workbook, which is required to properly recreate this saved search. If you createand share this workbook with users assigned to the Sales role, make sure you give them access tothe Account record type first.
Root Record Type
Joined Record Type(s) Custom Formula Field(s) Data Grid Criteria
Transaction
■ Transaction Line
□ Transaction Accounting Line
▬ Account
Create the followingformula fields on theDataSet tab:
Add the followingfields to thegrid from the
Set the following criteria on the DataSet tab:
■ [Custom Formula Field 2] greater than0.00
SuiteAnalytics Workbook

Analytics Data Source Changes 24
Important: Make sure you jointhe Transaction Accounting Line recordtype from the Transaction Line record type.If you join both the Transaction Line andTransaction Accounting Line record typesdirectly from the Transaction record, it canduplicate or otherwise skew your data. Formore information, see Joining TransactionLine and Transaction Accounting Line in aDataset.
■ Name: UnfulfilledItems
Output Type: Float
Definition: -{transactionlines.quantity}-NVL({transactionlines.quantitycommitted},0)-NVL({transactionlines.quantityshiprecv},0)
Use this formula toreplace null values inthe Transaction LineQuantity and Quantitycommitted fields with0.00.
■ Name: Positive ItemQuantity
Output Type: Float
Definition: -{transactionlines.quantity}
Use this formula todisplay your itemquantities as positivevalues.
Transactionrecord type:
■ Transaction
■ Status
■ PostingPeriod
■ Entity
Add the followingfields to thegrid from theTransaction Linerecord type:
■ Item
■ Location
■ Quantity
■ Committed
■ QuantityShipped/Received/Picked Up
Add the followingcustom formulafields to the grid:
■ CustomFormula Field1 (UnfulfilledItems)
■ CustomFormula Field2 (PositiveItem Quantity)
■ Type is Sales Order
■ Status any of Sales Order : PartiallyFulfilled and Sales Order : PendingFulfillment and Sales Order : PendingBilling/Partially Fulfilled
■ Transaction Line: Main Line is false
■ Transaction Line: Tax Line is false
■ Transaction Line: Item Type none ofShipping Cost Item
■ Account: Type is income
Note: If the Multi-BookAccounting feature is enabled inyour account, you can use theAccounting Book field in a criteriafilter to view data for specificaccounting books. To access theAccounting Book field, use thejoin path Transaction>TransactionLine> Transaction Accounting Line.
Open Sales Orders Lines Pivot Tables
Create a new workbook using the Open Sales Order Lines dataset you created, and set the followingfields to the appropriate dimensions for each pivot table:
■ Open Sales Orders by Date
Rows: Item
Columns: Date (Quarter)
Values: [Custom Formula Field 2] (Sum)
■ Open Sales Orders by Location and Date
Rows: Location, Item
Columns: Date (Quarter)
Values: [Custom Formula Field 2] (Sum)
■ Open Sales Orders by Customer and Date
Rows: Entity, Item
Columns: Date (Quarter)
Values: [Custom Formula Field 2] (Sum)
After you set each field to the appropriate table dimension, click the Refresh icon to generate the table.
You can also customize the table and add totals and grand totals, or rename each table. For moreinformation, see Pivot Table Customization.
SuiteAnalytics Workbook

Analytics Data Source Changes 25
Open Sales Orders Lines ChartsBy recreating this saved search using SuiteAnalytics Workbook, you can also chart your source data tovisualize the information using different chart types.
Create the following charts by dragging the listed fields from the Dataset panel to the correspondingsection of the Layout panel, and select the chart type.
■ Open Sales by Item
X-Axis: Item
Series: N/A
Values: Total Amount (Sum)
Chart type: Column chart
■ Open Sales by Date
X-Axis: Date (Quarter)
Series: Item
Values: Total Amount (Sum)
Chart type: Line chart
After you set each field and the chart type, click the Refresh icon to generate the chart. You can alsofilter values, add a title and subtitle, and rename each axis. For more information, see Workbook Charts.
Number of FulfillmentsNote: NetSuite Administrators can view a predefined version of this workbook by clickingNumber of Fulfillments (DEMO) in the Standard Workbooks list on the Workbook Listing Page.For more information, see Workbook and Dataset Templates.
This saved search shows the number of items which have been fulfilled.
To perform this search using the Saved Search application, all required criteria and results fields areavailable through the Transaction record type. To recreate this search using SuiteAnalytics Workbookhowever, some required fields are only available through the Transaction Line record type. You musttherefore join this record type to your dataset to recreate this search. Additionally, some required fieldsmight have different labels in SuiteAnalytics Workbook. The following table lists key differences in fieldsbetween the saved search and the dataset:
Key Field Differences in SuiteAnalytics Workbook
Field Name inSaved Search
Record Type inSuiteAnalytics Workbook
Required Join inSuiteAnalytics Workbook
Field Name in SuiteAnalyticsWorkbook
Name Transaction Line Transaction > Transaction Line Entity
Period Transaction NA Posting Period
Amount Transaction Line Transaction > Transaction Line Amount (Net)
Main Line Transaction Line Transaction > Transaction Line Main Line
To recreate this search using SuiteAnalytics Workbook:
Create a new dataset and select Transaction as the root record type. Then, define the dataset as follows:
SuiteAnalytics Workbook
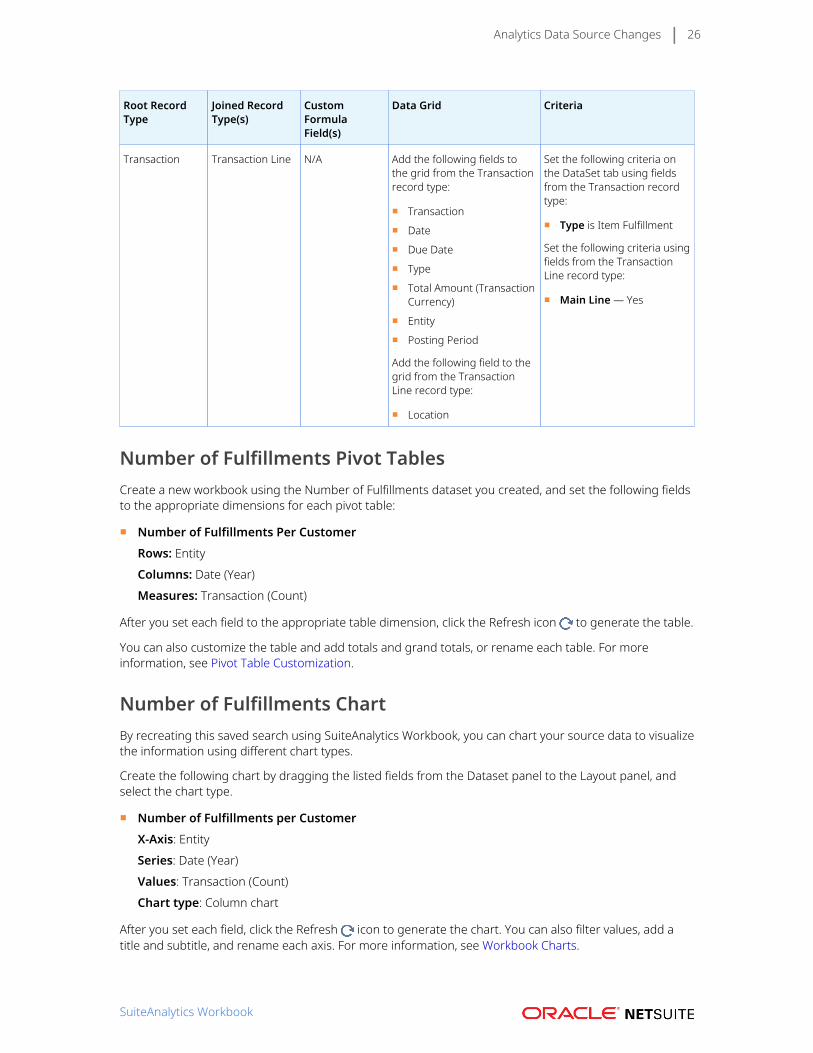
Analytics Data Source Changes 26
Root RecordType
Joined RecordType(s)
CustomFormulaField(s)
Data Grid Criteria
Transaction Transaction Line N/A Add the following fields tothe grid from the Transactionrecord type:
■ Transaction
■ Date
■ Due Date
■ Type
■ Total Amount (TransactionCurrency)
■ Entity
■ Posting Period
Add the following field to thegrid from the TransactionLine record type:
■ Location
Set the following criteria onthe DataSet tab using fieldsfrom the Transaction recordtype:
■ Type is Item Fulfillment
Set the following criteria usingfields from the TransactionLine record type:
■ Main Line — Yes
Number of Fulfillments Pivot TablesCreate a new workbook using the Number of Fulfillments dataset you created, and set the following fieldsto the appropriate dimensions for each pivot table:
■ Number of Fulfillments Per CustomerRows: EntityColumns: Date (Year)Measures: Transaction (Count)
After you set each field to the appropriate table dimension, click the Refresh icon to generate the table.
You can also customize the table and add totals and grand totals, or rename each table. For moreinformation, see Pivot Table Customization.
Number of Fulfillments ChartBy recreating this saved search using SuiteAnalytics Workbook, you can chart your source data to visualizethe information using different chart types.
Create the following chart by dragging the listed fields from the Dataset panel to the Layout panel, andselect the chart type.
■ Number of Fulfillments per CustomerX-Axis: EntitySeries: Date (Year)Values: Transaction (Count)Chart type: Column chart
After you set each field, click the Refresh icon to generate the chart. You can also filter values, add atitle and subtitle, and rename each axis. For more information, see Workbook Charts.
SuiteAnalytics Workbook
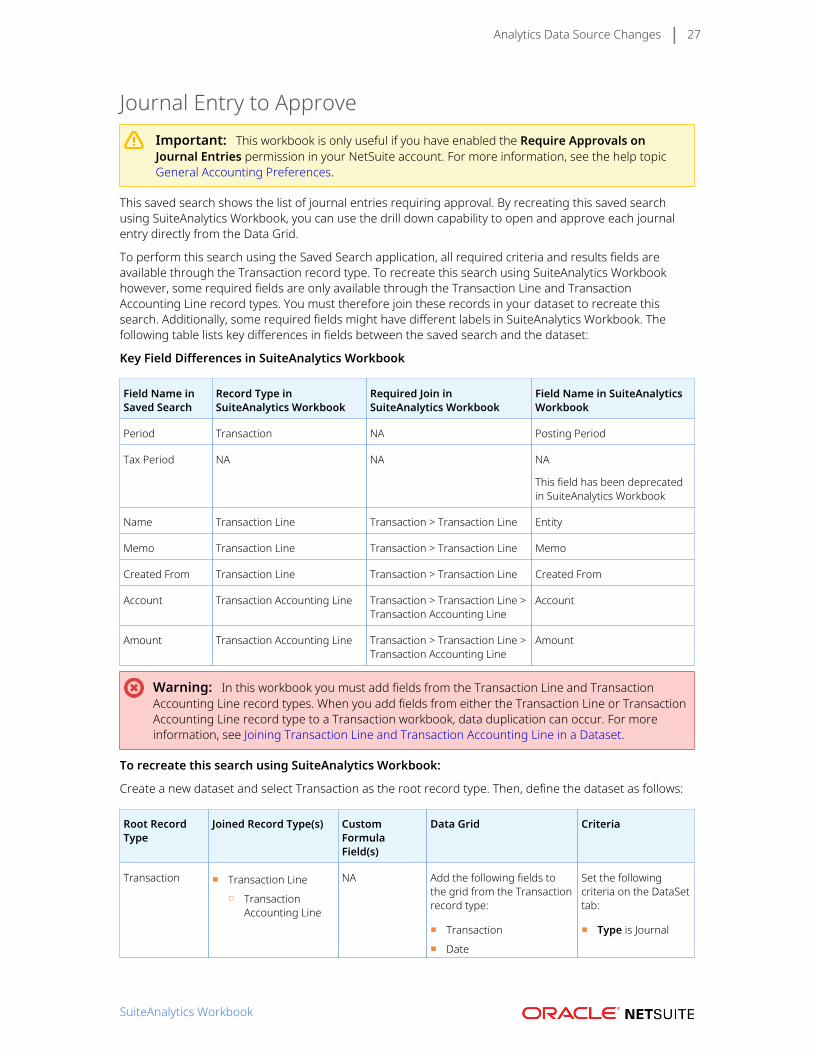
Analytics Data Source Changes 27
Journal Entry to ApproveImportant: This workbook is only useful if you have enabled the Require Approvals onJournal Entries permission in your NetSuite account. For more information, see the help topicGeneral Accounting Preferences.
This saved search shows the list of journal entries requiring approval. By recreating this saved searchusing SuiteAnalytics Workbook, you can use the drill down capability to open and approve each journalentry directly from the Data Grid.
To perform this search using the Saved Search application, all required criteria and results fields areavailable through the Transaction record type. To recreate this search using SuiteAnalytics Workbookhowever, some required fields are only available through the Transaction Line and TransactionAccounting Line record types. You must therefore join these records in your dataset to recreate thissearch. Additionally, some required fields might have different labels in SuiteAnalytics Workbook. Thefollowing table lists key differences in fields between the saved search and the dataset:
Key Field Differences in SuiteAnalytics Workbook
Field Name inSaved Search
Record Type inSuiteAnalytics Workbook
Required Join inSuiteAnalytics Workbook
Field Name in SuiteAnalyticsWorkbook
Period Transaction NA Posting Period
Tax Period NA NA NA
This field has been deprecatedin SuiteAnalytics Workbook
Name Transaction Line Transaction > Transaction Line Entity
Memo Transaction Line Transaction > Transaction Line Memo
Created From Transaction Line Transaction > Transaction Line Created From
Account Transaction Accounting Line Transaction > Transaction Line >Transaction Accounting Line
Account
Amount Transaction Accounting Line Transaction > Transaction Line >Transaction Accounting Line
Amount
Warning: In this workbook you must add fields from the Transaction Line and TransactionAccounting Line record types. When you add fields from either the Transaction Line or TransactionAccounting Line record type to a Transaction workbook, data duplication can occur. For moreinformation, see Joining Transaction Line and Transaction Accounting Line in a Dataset.
To recreate this search using SuiteAnalytics Workbook:
Create a new dataset and select Transaction as the root record type. Then, define the dataset as follows:
Root RecordType
Joined Record Type(s) CustomFormulaField(s)
Data Grid Criteria
Transaction ■ Transaction Line
□ TransactionAccounting Line
NA Add the following fields tothe grid from the Transactionrecord type:
■ Transaction
■ Date
Set the followingcriteria on the DataSettab:
■ Type is Journal
SuiteAnalytics Workbook

Analytics Data Source Changes 28
Root RecordType
Joined Record Type(s) CustomFormulaField(s)
Data Grid Criteria
■ Posting Period
■ Created By
Add the following fieldsfromthe Transaction Line recordtype:
■ Entity
■ Memo
■ Created From
■ Location
Add the following fields fromthe Transaction AccountingLine record type:
■ Account
■ Amount
■ Status is Journal:Pending Approval
Guidelines for Joining Record Types inSuiteAnalytics WorkbookSuiteAnalytics Workbook enables you to add fields from multiple record types to a single dataset. Thisincludes record types that are more than one join away from the root record type of a dataset, enablingyou to compile workbook source data from a more diverse set of record types.
By default, the DataSet tab lists all joinable record types that you have access to. To complete a join, youmust add fields from the desired record type to the Data Grid or create a Criteria filter.
If joining record types is a new concept for you, there are a number of considerations you should makebefore you attempt to join different record types in a dataset. To best take advantage of this powerful newcapability, see the following topics:
■ The Analytics Data Source contains a variety of record types with predefined relationships to oneanother. Depending on the type of relationship between each record type that you add to a dataset,certain joins can cause unwanted duplication of your workbook source data. For more information, seeData Duplication Based on Record Joins.
■ The Transaction and Transaction Line record types share a one-to-many relationship which canresult in duplication of your workbook source data. Joining the Transaction Accounting Line recordtype to a Transaction dataset can also cause data duplication. For more information about using theTransaction record type in a dataset, see Joining Transaction Line and Transaction Accounting Line ina Dataset.
■ Based on the relationship between each record type that you add to a dataset, the order in whichyou join record types can also impact your source data. For more information, see Join Order inSuiteAnalytics Workbook.
Data Duplication Based on Record JoinsThe Analytics Data Source contains different record types with predefined relationships to one another.In the SuiteAnalytics Workbook user interface, you can browse through these relationships in the Recordslist on the Dataset tab
SuiteAnalytics Workbook

Guidelines for Joining Record Types in SuiteAnalytics Workbook 29
Note: The record types listed on the Dataset tab are based on the root record type of thedataset, the features enabled in your account, and the permissions assigned to the role you use tolog in to NetSuite. If you do not see a record type that you think you should have access to, contactyour NetSuite administrator.
There are two types of relationships that you should be cautious of when you join record types in adataset: those with a one-to-many relationship with the source record type, and those with a many-to-many relationship with the source record type.
One-to-many relationships between record types are those in which the source record type can beassociated to multiple iterations of the target record type. For example, consider the relationship betweenthe Transaction and Transaction Line record types. For each transaction record there can be multipletransaction line records that are associated by common field values such as the transaction ID, and thetransaction total. When records with a one-to-many relationship are joined in a dataset, the cardinalityof the data from the source record type is duplicated for each instance of the target record type. Thisduplication can result in inaccurate data aggregations and summaries in your datasets and the associatedworkbooks.
To better understand the implications of joining record types with a one-to-many relationship, considerthe Total Amount field on the Transaction record type.
In a Transaction dataset, for each transaction record listed there is a single value for the Total Amountfield.
SuiteAnalytics Workbook

Guidelines for Joining Record Types in SuiteAnalytics Workbook 30
However, if you join the Transaction Line record type to the dataset by adding a Transaction Line fieldto the Data Grid, notice that the number of values listed for the Total Amount field is multiplied by thenumber of associated transaction line records.
The result is that aggregations based on the duplicated source record fields are inaccurate. This includesthe summaries displayed at the bottom of the Data Grid, and the totals and grand totals that you set upon the Pivot Tab of any associated workbooks.
SuiteAnalytics Workbook

Guidelines for Joining Record Types in SuiteAnalytics Workbook 31
This data duplication can also occur when you create criteria filters using fields from record types thathave a one-to-many relationship, even if you do not explicitly add fields from the joined record type to theData Grid.
For example, assume you are working on a Transaction dataset with only one transaction record thatmatches your selected criteria.
If you create an additional criteria filter based on the Transaction Line record type, the results are againmultiplied in the Data Grid.
SuiteAnalytics Workbook
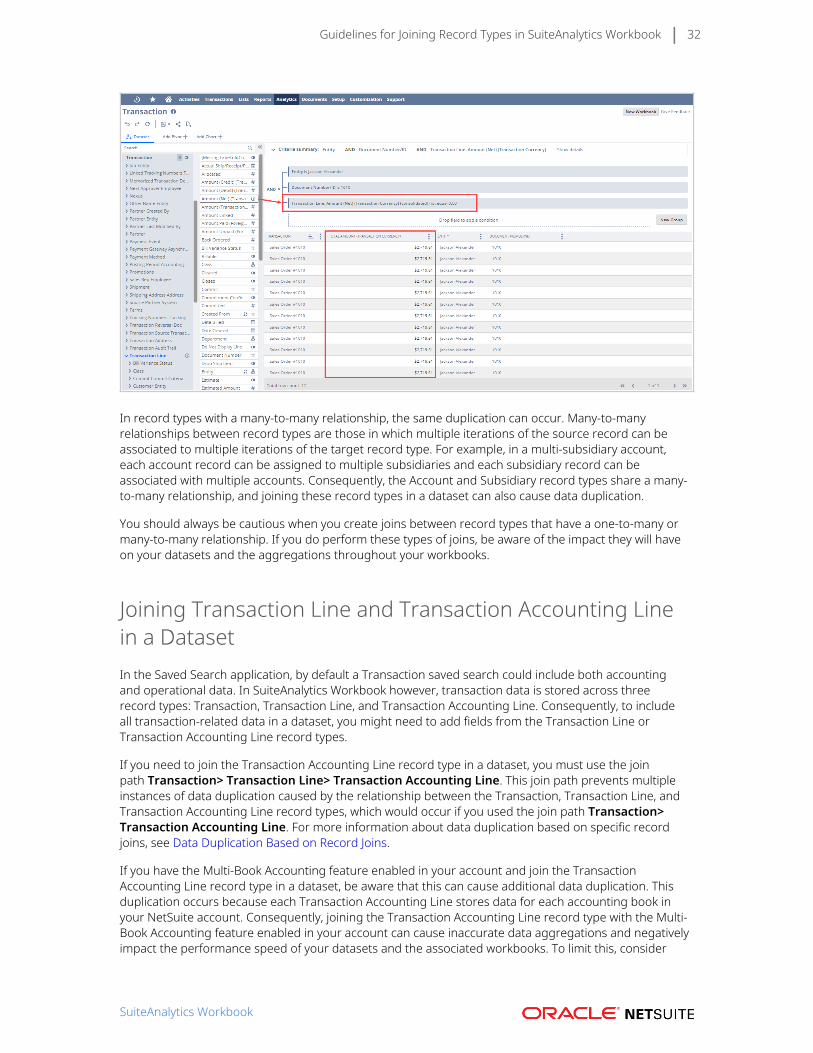
Guidelines for Joining Record Types in SuiteAnalytics Workbook 32
In record types with a many-to-many relationship, the same duplication can occur. Many-to-manyrelationships between record types are those in which multiple iterations of the source record can beassociated to multiple iterations of the target record type. For example, in a multi-subsidiary account,each account record can be assigned to multiple subsidiaries and each subsidiary record can beassociated with multiple accounts. Consequently, the Account and Subsidiary record types share a many-to-many relationship, and joining these record types in a dataset can also cause data duplication.
You should always be cautious when you create joins between record types that have a one-to-many ormany-to-many relationship. If you do perform these types of joins, be aware of the impact they will haveon your datasets and the aggregations throughout your workbooks.
Joining Transaction Line and Transaction Accounting Linein a DatasetIn the Saved Search application, by default a Transaction saved search could include both accountingand operational data. In SuiteAnalytics Workbook however, transaction data is stored across threerecord types: Transaction, Transaction Line, and Transaction Accounting Line. Consequently, to includeall transaction-related data in a dataset, you might need to add fields from the Transaction Line orTransaction Accounting Line record types.
If you need to join the Transaction Accounting Line record type in a dataset, you must use the joinpath Transaction> Transaction Line> Transaction Accounting Line. This join path prevents multipleinstances of data duplication caused by the relationship between the Transaction, Transaction Line, andTransaction Accounting Line record types, which would occur if you used the join path Transaction>Transaction Accounting Line. For more information about data duplication based on specific recordjoins, see Data Duplication Based on Record Joins.
If you have the Multi-Book Accounting feature enabled in your account and join the TransactionAccounting Line record type in a dataset, be aware that this can cause additional data duplication. Thisduplication occurs because each Transaction Accounting Line stores data for each accounting book inyour NetSuite account. Consequently, joining the Transaction Accounting Line record type with the Multi-Book Accounting feature enabled in your account can cause inaccurate data aggregations and negativelyimpact the performance speed of your datasets and the associated workbooks. To limit this, consider
SuiteAnalytics Workbook

Guidelines for Joining Record Types in SuiteAnalytics Workbook 33
creating a criteria filter using the Accounting Book field from the Transaction Accounting Record type, sothat data from only one accounting book is included.
To watch a video that demonstrates how data can be impacted by joining the Transaction Line andTransaction Accounting Line record types in a dataset, click here.
Join Order in SuiteAnalytics WorkbookAs specified in the Data Duplication Based on Record Joins topic, , data duplication can occur when youjoin record types with a one-to-many or many-to-many relationship in a dataset. We can also demonstratethis duplication by examining the order in which record types are added to a dataset.
Consider the relationship between the Entity and Transaction record types: for each transaction record,there can only be one associated entity or customer record. Each customer record however, can beassociated with multiple transaction records. This means that aggregations such as field counts can varyfrom dataset to dataset even if they contain the same fields and record types, depending on the orderthat they are added to the dataset.
For example, assume you want to see a list of customers and their associated transactions. If you create anew dataset beginning with the Entity record type, you can then join the Transaction record type to vieweach associated transaction. If you select the Entity field to view a count of the total number of distinctcustomers, it is displayed at the bottom of the Data Grid.
If you create your dataset beginning with the Transaction record type and join the Entity record typehowever, notice that the number of distinct customers decreases.
SuiteAnalytics Workbook
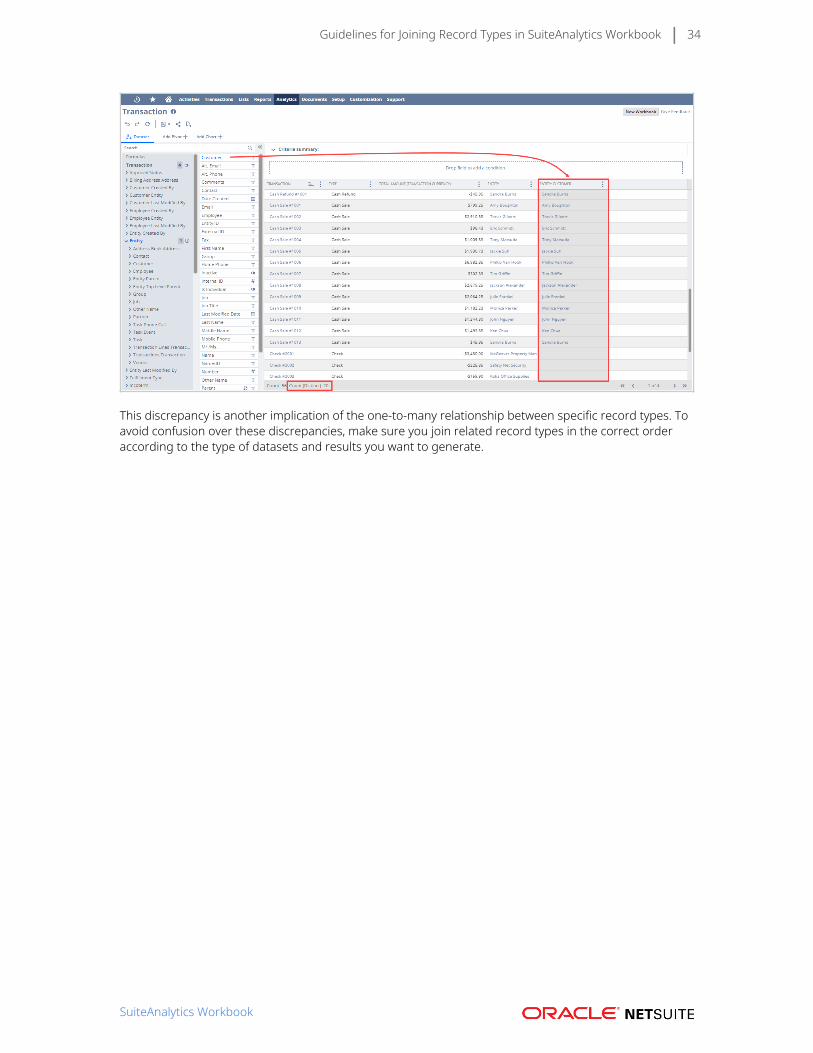
Guidelines for Joining Record Types in SuiteAnalytics Workbook 34
This discrepancy is another implication of the one-to-many relationship between specific record types. Toavoid confusion over these discrepancies, make sure you join related record types in the correct orderaccording to the type of datasets and results you want to generate.
SuiteAnalytics Workbook

Custom Workbooks and Datasets 35
Custom Workbooks and DatasetsIn SuiteAnalytics Workbook, you analyze your company data using two distinct objects: a dataset and aworkbook.
Datasets are the basis for all workbooks and workbook components in your account. In a dataset, youcombine record type fields and criteria filters to create a query. The results of this query act as thesource data for your workbooks. A single dataset can be used in multiple workbooks, so to preventdata discrepancies they can only be edited or deleted by dataset owners or users with the AnalyticsAdministrator permission. Additionally, changes that you make to a dataset are automatically propagatedto the workbooks that the dataset is used in. This reduces the need for multiple dataset objects in youraccount and enables less experienced users to create complex workbooks.
Workbooks are where you analyze the results of your dataset queries using different components, suchas tables, pivot tables, and charts. All workbooks are based on a dataset, and a single dataset can be usedas the basis for multiple workbooks. You can access the dataset used in a workbook from the DatasetPanel in any workbook component. Moreover, when you author a workbook you can either define a newcustom dataset, or use any of the existing datasets that you have access to in your account.
To better understand some of the changes to dataset and workbook functionality as of 20.1, see thefollowing table:
Functionality Dataset Workbook
Add fields and joinrecord types?
Yes
You define the source data for all workbooks in youraccount by adding fields and joining record types in adataset query.
No
If you want to add fields or joinrecord types to a workbook, youmust edit the underlying dataset.
Create visualizations? No
The dataset is only where you query your business data.To analyze the results of your dataset queries, create aworkbook based on the dataset.
Yes
The workbook is whereyou analyze your datasetquery results using differentcomponents and visualizations.
Automaticallypropagate edits toother workbooks?
Yes
A single dataset can be used in multiple workbooks. Toprevent data discrepancies, edits that you make to adataset are automatically propagated to workbooks thatare based on that dataset.
No
Workbooks in your accountexist independently of oneanother. If you edit a workbook,your changes apply only to theworkbook you are in.
Currency conversionor consolidation?
No
Prior to 20.1, currency conversion or consolidation wasapplicable from the Data Grid in the Dataset tab. As of20.1, you can only apply currency conversion to a fieldfrom within a workbook component such as a pivot tableor chart. Alternatively, on the Dataset tab you can createa custom formula field that converts the values of a fieldusing the TO_NUMBER function. For more information,see Currency Conversion Using Custom Formula Fields.
Yes
You can convert field valuesto a specific currency directlyfrom the user interface in anyworkbook component. Formore information, see CurrencyConversion from the UserInterface.
Sharing? Yes
You can share a dataset with other users in your accountas its own object, or as part of a shared workbook.Recipients of a shared workbook cannot edit the
Yes
Shared workbooks include allworkbook components.
SuiteAnalytics Workbook

Defining a Dataset 36
underlying dataset but can edit and save their ownversions of the dataset using a different name. For moreinformation, see Accessing and Sharing Workbooks andDatasets.
■ For information about how to author a dataset, including steps for how to join record types and fieldsor create custom formula fields, see Defining a Dataset.
■ After you define your dataset, you can filter the results by creating criteria filters. Criteria filterscan be based on existing values in the dataset results, or custom values that you define. For moreinformation, see Dataset Criteria Filters.
■ For information about creating a workbook based on a dataset, see Creating a Workbook. This sectionincludes steps for setting up and customizing the different components that you can include in aworkbook, and how to access the underlying dataset.
Defining a DatasetDatasets are the basis for all workbooks in your account. In a dataset, you combine the fields of a rootrecord type and any joined related record types to create a query. The record types and fields that youhave access to are based on the features enabled in your account and the permissions assigned to therole you use to log into NetSuite. You can also create custom formula fields to calculate values that arenot available through standard record type fields.
On the Dataset tab, the results of your query are displayed in a tabular format in the Data Grid on theright. When you first create a new dataset, the Data Grid is automatically populated with fields basedon the root record type. Joinable record types and fields that you can add to your query appear in theRecords and Fields lists on the left. Only fields that you that add to the Data Grid can be used to buildtables, pivot tables, and charts in a workbook.
■ To view a record type’s fields, click the name of the record type to refresh the Fields list.
■ To view additional related record types, click the arrow next to any record type in the Records list.
■ To join a record type to a dataset, add fields from the record type to the Data Grid or use the field tocreate a criteria filter. For more information about dataset criteria filters, see Dataset Criteria Filters.
You can join any number of record types in a dataset, however more than ten joined record types cannegatively impact performance.
For more information about joining record types in a dataset, see Guidelines for Joining Record Types inSuiteAnalytics Workbook.
For information about access to specific record types and fields in NetSuite, download the followingworksheet: NetSuitePermissionsUsage.xls.
For information about editing a dataset that is used in a workbook, see Editing a Dataset.
To define a new dataset:
1. Click New Dataset on the Dataset subtab of the Analytics Home page or on the Select a datasetto create a new workbook page.
2. Select a root record type for the dataset. The record type you choose will determine the recordtypes and fields that you can join to the dataset.
3. Add fields from the root record type to the Data Grid. You have three options:
SuiteAnalytics Workbook

Defining a Dataset 37
■ Drag the desired fields from the Fields list to the Data Grid.
■ Double-click the desired field names in the Fields list.
■ Type the name of the desired fields in the search bar above the Fields list, then drag or double-click them to add them to the Data Grid.
Note: If you add a hierarchical field to the Data Grid, you are prompted to select whetherto display the child values or the full hierarchy for each record type in the correspondingfield column. For more information, see Hierarchical Fields.
4. Add fields from related record types to the Data Grid.
a. Click the arrow next to any record type in the Records list to view additional related recordtypes.
b. Click the desired record type name to update the Fields list.
c. Double-click or drag the desired fields to the Data Grid.
Note: Certain record types in SuiteAnalytics Workbook have multiple variants.For example, there are Entity Job, Entity Customer, and Entity Vendor record typesaccessible in a Transaction dataset. Make sure you select the correct record typedepending on the type of data you want to query.
5. Optionally, click Formulas to view, create, and add custom formula fields to the Data Grid.
For step-by-step instructions on how to create a custom formula field, see Formula Fields.
6. Remove any fields you do not want to include in the dataset.
a. Click the Field Menu icon in the column you want to remove from the Data Grid.
b. Select Remove Column from the dropdown list.
Important: If you create a workbook based on the current dataset, removinga field from the Data Grid also removes it from any associated workbooks andworkbook components. This can cause workbook failures or other unwanted results.Exercise caution when you remove a field from the grid in datasets that are used in aworkbook.
7. Click Save to save the dataset. Alternatively, if you are creating the dataset from within a newworkbook, click Save & Close to save the dataset and access the workbook.
The Save Dataset As window appears.
8. Enter a name and description for the dataset in the fields provided, then click Save.
9. Optionally, to preview your dataset in a workbook before saving your changes, click Create NewWorkbook or Apply to workbook. The workbook will appear.
Note: You must save the dataset before you can save the connected workbook. Unsaveddatasets are denoted by a warning icon in the Dataset panel of a workbook. For moreinformation, see Editing a Dataset.
Editing a DatasetOnly a dataset owner or users with the Analytics Administrator permission can save changes to anexisting dataset. This prevents data discrepancies among workbooks that share the same dataset. Userswith whom a dataset is shared however, can edit the dataset and save it under a new name. Additionally,
SuiteAnalytics Workbook
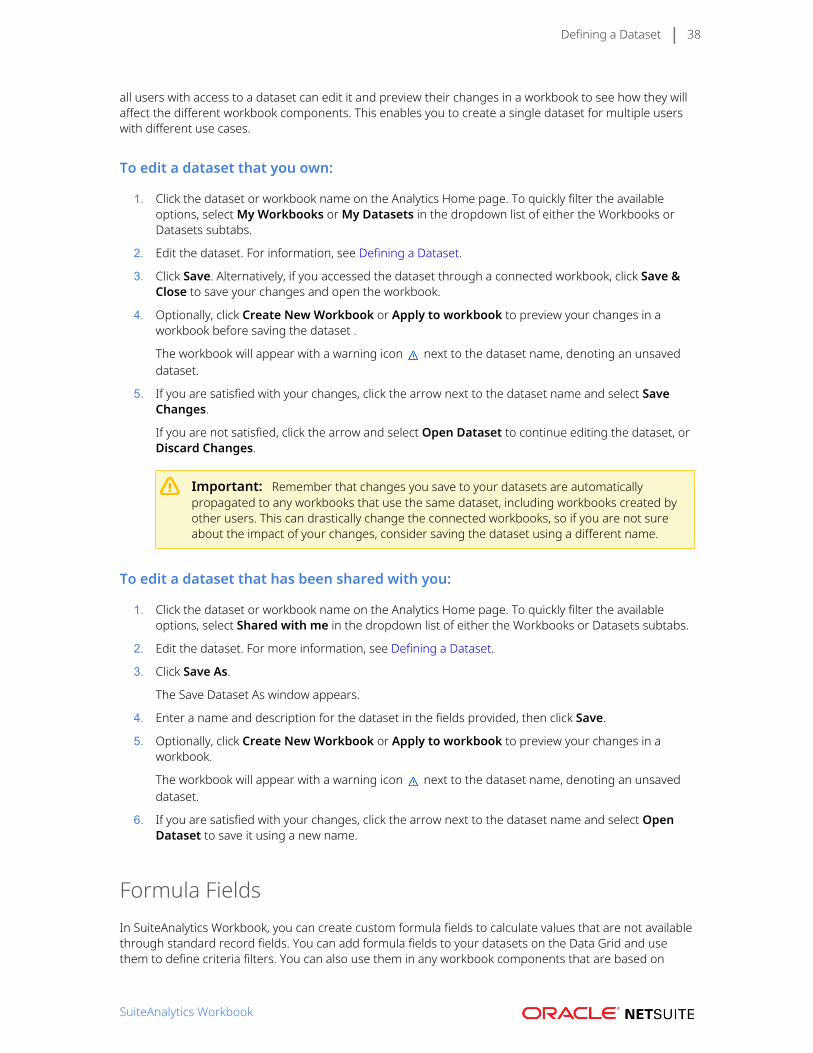
Defining a Dataset 38
all users with access to a dataset can edit it and preview their changes in a workbook to see how they willaffect the different workbook components. This enables you to create a single dataset for multiple userswith different use cases.
To edit a dataset that you own:
1. Click the dataset or workbook name on the Analytics Home page. To quickly filter the availableoptions, select My Workbooks or My Datasets in the dropdown list of either the Workbooks orDatasets subtabs.
2. Edit the dataset. For information, see Defining a Dataset.
3. Click Save. Alternatively, if you accessed the dataset through a connected workbook, click Save &Close to save your changes and open the workbook.
4. Optionally, click Create New Workbook or Apply to workbook to preview your changes in aworkbook before saving the dataset .
The workbook will appear with a warning icon next to the dataset name, denoting an unsaveddataset.
5. If you are satisfied with your changes, click the arrow next to the dataset name and select SaveChanges.
If you are not satisfied, click the arrow and select Open Dataset to continue editing the dataset, orDiscard Changes.
Important: Remember that changes you save to your datasets are automaticallypropagated to any workbooks that use the same dataset, including workbooks created byother users. This can drastically change the connected workbooks, so if you are not sureabout the impact of your changes, consider saving the dataset using a different name.
To edit a dataset that has been shared with you:
1. Click the dataset or workbook name on the Analytics Home page. To quickly filter the availableoptions, select Shared with me in the dropdown list of either the Workbooks or Datasets subtabs.
2. Edit the dataset. For more information, see Defining a Dataset.
3. Click Save As.
The Save Dataset As window appears.
4. Enter a name and description for the dataset in the fields provided, then click Save.
5. Optionally, click Create New Workbook or Apply to workbook to preview your changes in aworkbook.
The workbook will appear with a warning icon next to the dataset name, denoting an unsaveddataset.
6. If you are satisfied with your changes, click the arrow next to the dataset name and select OpenDataset to save it using a new name.
Formula FieldsIn SuiteAnalytics Workbook, you can create custom formula fields to calculate values that are not availablethrough standard record fields. You can add formula fields to your datasets on the Data Grid and usethem to define criteria filters. You can also use them in any workbook components that are based on
SuiteAnalytics Workbook

Defining a Dataset 39
the dataset. The values of custom formula fields are updated each time you refresh the dataset, or theconnected workbook components. Currently, you cannot create custom formula fields based on existingformula fields.
To create a custom formula field, you combine NetSuite fields and SQL formula functions in a formuladefinition. You must also select an output type for the formula, depending on the fields and functions youinclude in your definition. SuiteAnalytics Workbook supports the following formula output types:
■ Boolean- Returns True, False, or NULL values
■ Date- Returns day, month, and year values
■ Datetime- Returns day, month, year, hour, and minute values
■ Float- Returns values that include a decimal, such as currency values
■ Integer- Returns values that are in whole numbers only, such count values
■ String- Returns fixed string character values, such as names
■ Clobtext- Returns long unicode character strings, such as item descriptions
■ Percent- Returns numeric values as percentages
■ Duration- Returns hour and minute values, such as hours worked
Knowledge of SQL will help you to fully leverage the flexibility and power of SQL functions to definecomplex formulas. The following link provides access to a Microsoft Excel worksheet that describesevery SQL function currently supported in the SuiteAnalytics Workbook formula builder. The informationcontained in this worksheet is also available on the Functions subtab in the Formula Field window. Youcan use this worksheet if you are not sure about which function to use in a formula definition.
To access the worksheet, click this link: SuiteAnalyticsWorkbookFormulaFunctions.xls.
For more information about SQL formula functions, see the help topic SQL Expressions.
For sample formulas you can create using some of the supported SQL functions, see Sample Formulas.
To create a custom formula field in SuiteAnalytics Workbook:
In the following example, you create a formula field that converts date values to a different format.Remember that the Formula Field window only includes fields from the root record type on the datasetand any fields from related record types that have been added to the Data Grid.
Important: To perform accurate aggregations and other types of numeric manipulation onfields that contain values in multiple currencies, you must first convert the values of the fields. Inthe Dataset tab, you can only do this using a custom formula field that contains the TO_NUMBERfunction. For more information, see Currency Conversion Using Custom Formula Fields.
1. Click Formulas above the Records list on the DataSet tab.
2. In the Fields list, click New Formula.
The Formula Field window appears.
SuiteAnalytics Workbook

Defining a Dataset 40
3. Enter a Formula Field Name.
For example, enter Formatted Date.
4. Select an Output Type for the formula field values.
For the purposes of this procedure, select String.
SuiteAnalytics Workbook

Defining a Dataset 41
Note: Each output type only works with certain fields and formula functions. If you selectan incompatible output type for the formula, the formula is invalidated. To view detailsabout the validation error, click the error icon .
5. In the Formula field, enter the field IDs and SQL formula functions to use in the formula expression.Alternatively, double-click the desired field IDs or formula functions from the Functions and Fieldssubtabs to add them to the expression.
For the purposes of this procedure, select the TO_CHAR function and replace the content in thebrackets with {trandate}, 'Month DD, YYYY'.
SuiteAnalytics Workbook

Defining a Dataset 42
6. To validate the formula, click Validate.
Note: If there are errors with the formula, click the error icon to view the details.
7. Click Apply to add the formula field to the dataset.
The field appears in the Field lists on the Dataset tab when you click Formulas. If you add the fieldto the Data Grid, it is also available for use in any workbooks connected to the dataset.
To create criteria filters using formula fields:
1. Create a valid formula field on the Dataset tab.
2. Double-click or drag the field from the Fields list to the Criteria Builder.
3. Set the desired filter conditions in the Filter window. For details, see Filter Types.
To add formula fields to a workbook component:
1. Create a valid formula field on the Dataset tab.
2. Add the field to the Data Grid so that it is included in any workbooks connected to the dataset.
3. On the Table, Pivot, or Chart tabs of the workbook, drag the field from the Dataset panel to thedesired section of the Layout panel
SuiteAnalytics Workbook
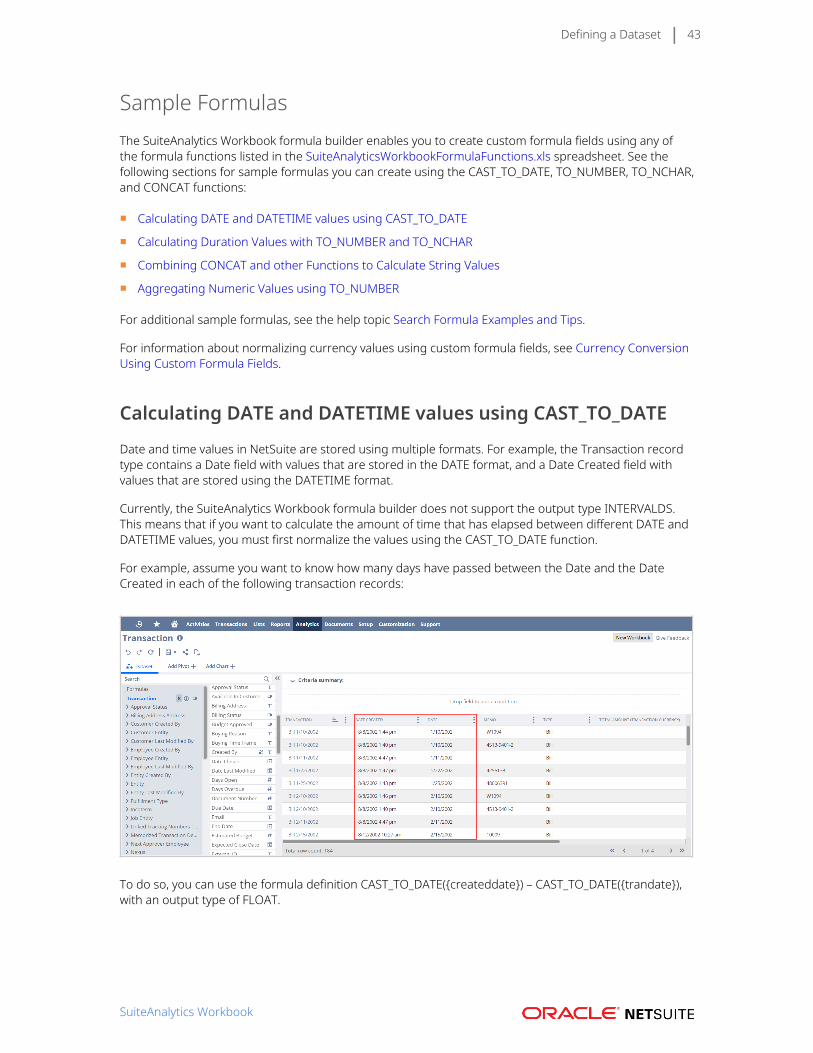
Defining a Dataset 43
Sample FormulasThe SuiteAnalytics Workbook formula builder enables you to create custom formula fields using any ofthe formula functions listed in the SuiteAnalyticsWorkbookFormulaFunctions.xls spreadsheet. See thefollowing sections for sample formulas you can create using the CAST_TO_DATE, TO_NUMBER, TO_NCHAR,and CONCAT functions:
■ Calculating DATE and DATETIME values using CAST_TO_DATE
■ Calculating Duration Values with TO_NUMBER and TO_NCHAR
■ Combining CONCAT and other Functions to Calculate String Values
■ Aggregating Numeric Values using TO_NUMBER
For additional sample formulas, see the help topic Search Formula Examples and Tips.
For information about normalizing currency values using custom formula fields, see Currency ConversionUsing Custom Formula Fields.
Calculating DATE and DATETIME values using CAST_TO_DATE
Date and time values in NetSuite are stored using multiple formats. For example, the Transaction recordtype contains a Date field with values that are stored in the DATE format, and a Date Created field withvalues that are stored using the DATETIME format.
Currently, the SuiteAnalytics Workbook formula builder does not support the output type INTERVALDS.This means that if you want to calculate the amount of time that has elapsed between different DATE andDATETIME values, you must first normalize the values using the CAST_TO_DATE function.
For example, assume you want to know how many days have passed between the Date and the DateCreated in each of the following transaction records:
To do so, you can use the formula definition CAST_TO_DATE({createddate}) – CAST_TO_DATE({trandate}),with an output type of FLOAT.
SuiteAnalytics Workbook

Defining a Dataset 44
The resulting values display the number of days between each date, regardless date formats used in theformula definition.
SuiteAnalytics Workbook

Defining a Dataset 45
Calculating Duration Values with TO_NUMBER and TO_NCHAR
Duration values are incompatible with the TO_NUMBER function unless they are first convertedto a variable format using the TO_NCHAR function. Consequently, if you want to create a customformula field that displays duration values as a number, you must use the formula definitionTO_NUMBER(TO_NCHAR({field_ID})).
For example, assume you want to see the amount of time that has elapsed for each case in your account,in hours.
In this case, use the formula TO_NUMBER(TO_NCHAR({timeelapsed})) with an output type of Float.
SuiteAnalytics Workbook
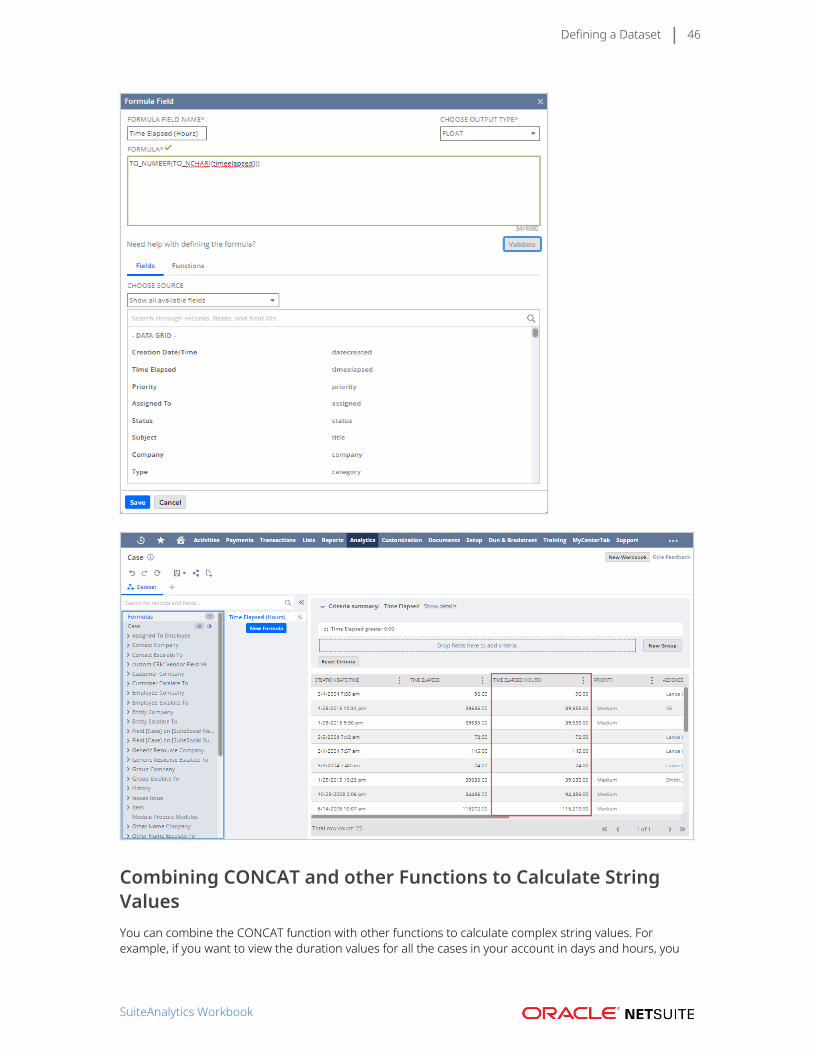
Defining a Dataset 46
Combining CONCAT and other Functions to Calculate StringValuesYou can combine the CONCAT function with other functions to calculate complex string values. Forexample, if you want to view the duration values for all the cases in your account in days and hours, you
SuiteAnalytics Workbook
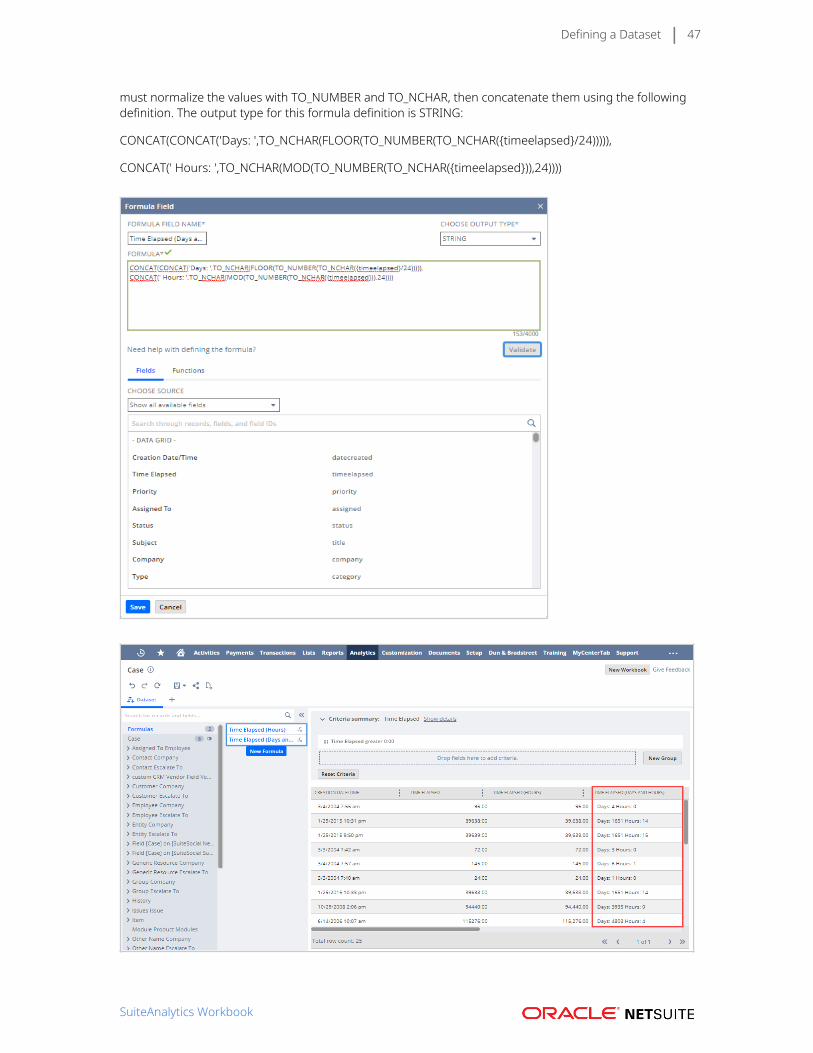
Defining a Dataset 47
must normalize the values with TO_NUMBER and TO_NCHAR, then concatenate them using the followingdefinition. The output type for this formula definition is STRING:
CONCAT(CONCAT('Days: ',TO_NCHAR(FLOOR(TO_NUMBER(TO_NCHAR({timeelapsed}/24))))),
CONCAT(' Hours: ',TO_NCHAR(MOD(TO_NUMBER(TO_NCHAR({timeelapsed})),24))))
SuiteAnalytics Workbook

Defining a Dataset 48
Try combining different formula functions with the CONCAT function to calculate different string values.
Aggregating Numeric Values using TO_NUMBER
You cannot aggregate field values that contain numbers unless you normalize the values of each fieldusing the TO_NUMBER function. For example, if you attempt to aggregate the values of two fields in theformula definition TO_NUMBER(field ID1-field ID2), the formula is invalid. However, if you normalize thevalues for each field using the format TO_NUMBER ({field ID1}) — TO_NUMBER({field_ID2}), the calculationwill work.
For example, if you want to calculate the difference between the unit price and cost for each item inyour account, you can use the following formula definition: TO_NUMBER({item<pricing.unitprice}) -TO_NUMBER({cost}). The output type for this formula is FLOAT.
SuiteAnalytics Workbook

Defining a Dataset 49
Hierarchical FieldsSuiteAnalytics Workbook supports hierarchical fields. Hierarchical fields behave similarly to standardrecord fields, except that you can choose to display the field values as hierarchies or child values. You canalso create filter conditions at the parent or child levels of the hierarchy.
Display Options for Hierarchical FieldsWhen you add a hierarchical field to the Data Grid or to a pivot table or chart, you are prompted to selecta display option for the field values.
On the Data Grid, you have the following options:
■ Select Show child level only to display only the child-level values for the field.
■ Select Show hierarchy to display the full hierarchy values for the field.
To change the hierarchy display after adding a field to the grid, click the Field Menu icon and selectShow Hierarchy.
On the Pivot and Chart tabs, you have the following options:
SuiteAnalytics Workbook

Defining a Dataset 50
■ Select Show child level only to display only the child-level values for the field.
■ Select Show single-column hierarchy to display the full hierarchy values for the field in a singlecolumn or chart measurement.
■ Select Show multi-column hierarchy to display each level of the hierarchy in a separate table columnor chart measurement. If you select this option and enable total or grand totals for the pivot table,totals are calculated for each hierarchy level.
For example, in the following table the Item field is displayed as a multi-column hierarchy.Consequently, the table calculates totals for each surgical item and for the Surgical Equipment parentlevel.
To change the hierarchy display for a field after adding it to a pivot table or chart, click the Field Menu icon in the Layout panel and select a new display option.
SuiteAnalytics Workbook

Defining a Dataset 51
Filter Conditions for Hierarchical FieldsWhen you create a filter condition based on a hierarchical field, there is an additional Show Hierarchyoption displayed in the Filter window.
SuiteAnalytics Workbook

Defining a Dataset 52
When this option is enabled, the Filter window displays only the parent values for the selected field. Ifyou create a filter condition at the parent level, only records with fields that have the selected parent areincluded in your workbook. For example, assume your source data has two records with a class of NewCustomer but only one of those records has a parent class of Web Store Business. If you create a filtercondition to exclude records that have a parent value of Web Store Business, one of the New Customerrecords is removed from your workbook.
Advanced Sorting OptionsYou can sort the values that are displayed in the Data Grid using the Advanced Sorting window. Sortingoptions that you apply to the Data Grid do not affect any workbooks that are connected to the datasetand should only be used to improve the readability of the values presented on the grid. To filter thevalues included in your dataset, you must create criteria filters using the Criteria Builder, located abovethe Data Grid. For more information, see Dataset Criteria Filters.
To open the Advanced Sorting window, click the Field Menu icon next to a column in the Data Grid andselect Add Sort... from the menu.
In the advanced sorting window, you can set up sorting conditions for any field in the Data Grid. After youset up each condition, you can select the order in which each condition should be considered.
The elements of the Advanced Sorting window are identified in the following image:
1 Up/ Down Arrows — Click the arrows to change the order of the sorting conditions. Alternatively, click and dragthe entire row to the desired location.
2 Field list — Select the field you want to create a sorting condition for.
3 Sort — Sort the result set in ascending or descending order, based on the values of the selected field.
4 Options — Click this icon to view the following options specific to the selected sorting condition:
■ NULL First — If checked, blank values for the selected field are listed first in the corresponding column in theData Grid.
■ Case Sensitive — If checked, values beginning with capital letters are listed first in the corresponding columnin the Data Grid.
■ Language — Sort the result set based on the alphabetic sequence of the selected language.
5 Delete — Remove the selected sorting condition.
SuiteAnalytics Workbook

Defining a Dataset 53
6 Add Sorting — Add another sorting condition, for a different field.
7 OK — Apply the selected sorting conditions to the Data Grid.
Cancel — Close the Advanced Sorting window without making any changes to the existing sorting conditions.
Remove All — Remove all of the sorting conditions currently listed in the Advanced Sorting window.
Joining Records Types in a DatasetSuiteAnalytics Workbook enables you to join multiple record types in the same dataset. This includesrecord types that are more than one join away from the root record type selected for the dataset,enabling you to compile data from more diverse record types.
By default, the Dataset tab lists all joinable record types that you have access to. To complete a join,simply add fields from the desired record type to the Data Grid or create a criteria filter using the CriteriaBuilder.
If joining record types is a new concept for you, there are a number of considerations you should makebefore you begin, such as the effect of one—to—many relationships between record types, and thedirection and order of your joins. This is especially true if you are working on a Transaction dataset andwant to join the Transaction Line and Transaction Accounting Line record types.
For more information, see Guidelines for Joining Record Types in SuiteAnalytics Workbook.
Currency Conversion in Datasets and WorkbooksDatasets are designed to display only raw field data. This means that some fields will display data inmultiple currencies. To perform accurate data aggregations and other types of numeric manipulationbased on these fields, you must convert or consolidate the field to a single currency.
■ In the Dataset tab, you can create a custom formula field using the TO_NUMBER function to convertthe values of a field to a specific. For more information, see Currency Conversion Using CustomFormula Fields.
■ With Transaction Accounting Line fields, you can apply currency consolidation when you create criteriafilters on the Dataset tab. For more information, see Criteria Filters Based on Fields with Values inMultiple Currencies.
■ In workbook Table Views, Pivot Tables, and Charts, you can apply currency conversion to a field directlyfrom the user interface. For more information, see Currency Conversion from the User Interface.
In SuiteAnalytics Workbook, currency consolidation converts the values of a field to the currency of thelowest level subsidiary that is a common parent to all the subsidiaries that you have access to in youraccount. Conversely, currency conversion enables you to convert the values of a field to any currency thatyou have set up in your account.
To apply currency conversion in a dataset or workbook, you must have the Multiple Currencies featureenabled in your account. To apply currency consolidation, you must be in a NetSuite OneWorld account.Additionally, you should make sure that your currency records, chart of accounts, currency exchangerates, and currency conversion rates are all set up correctly to ensure that the correct rates andaccounting periods are used during conversion. For more information, see the topics:
■ Currency Exchange Rates
■ Consolidated Exchange Rates
■ Multiple Currencies in OneWorld
SuiteAnalytics Workbook

Defining a Dataset 54
Currency Conversion Using Custom Formula Fields
On the Dataset tab, you can create custom formula fields using the TO_NUMBER function to convert fieldvalues that are in multiple currencies. This is useful for when you want to perform data aggregationsbetween two fields that contain values in multiples currencies. For example, to create a formula thatdisplays the remaining balances on the invoices in your account regardless of the original currencyused on each invoice, you can create a custom formula field using the following definition: TO_NUMBER({total#sign_consolidated}) - TO_NUMBER ({amountpaid#sign_consolidated}).
Use the following custom formula field definitions to create fields that convert your Total Amount(Transaction Currency) values using a specific currency ID, and date. The output type for each of theseformulas is FLOAT:
Note: To use these formulas with other fields that contain values in multiple currencies, replaceforeigntotal with the appropriate field ID.
■ TO_NUMBER({foreigntotal#converted})
□ Converts the amounts using the currency of the lowest level subsidiary that is a common parent toall the subsidiaries that you have access to in your account, and today’s date
■ TO_NUMBER({foreigntotal#converted[1]})
□ Converts the amount using the currency ID specified in the square brackets [1] and today’s date
■ TO_NUMBER({foreigntotal#converted[1;2017-01-30]})
□ Converts the amount using the currency ID [1] and the date specified in the square brackets[2017-01-30]
Criteria Filters Based on Fields with Values in MultipleCurrencies
Important: The Consolidate field box is only available when you create a criteria filter usingamount fields from the Transaction Accounting Line record type. To create criteria filters based onconverted values from other record type fields, you must first define a custom formula field thatapplies currency conversion to the field, then create your filter conditions based on the customformula field. For more information about currency conversion using custom formula fields,see Currency Conversion Using Custom Formula Fields.
When you create criteria filters based on Transaction Accounting Line fields that have values in multiplecurrencies, the Filter window includes a Consolidate Field box.
SuiteAnalytics Workbook

Defining a Dataset 55
When you check the Consolidate field box, the values of the field are consolidated before the selectedfilter conditions are applied. The currency used for the consolidation is that of the lowest level subsidiarythat is a common parent to all the subsidiaries that you have access to in your account. The date used tocalculate the rate of the consolidation is the current date.
Currency Conversion from the User InterfaceTo apply consolidation or conversion from within a workbook table view, pivot table, or chart, click theField Menu icon next to an applicable field in the Layout Panel or column header, then select Currency.Depending on the field, you are presented with up to four options:
■ Display Original: displays each amount in the original currency used for the transaction.■ Apply Consolidation: consolidates each amount to the currency of the lowest level subsidiary that
is a common parent to all the subsidiaries that you have access to in your account. In SuiteAnalyticsWorkbook, the rate type used for the consolidation is based on the general rate type set up for eachaccount in your chart of accounts: either Historical, Average, or Current. For more information aboutConsolidated Exchange Rates in NetSuite, see the help topic Consolidated Exchange Rates.
Note: You can only apply currency consolidation to amount fields from the TransactionAccounting Line record type. To convert amount fields from the Transaction and TransactionLine record types, use the currency conversion options or define a custom formula field.For more information about custom formula fields, see Currency Conversion Using CustomFormula Fields.
■ Apply Conversion: converts each amount using the currency and date selected on the Convert Towindow. By default, the Convert To window is set to the current date and the currency of the lowestlevel subsidiary that is a common parent to all the subsidiaries that you have access to in your account.
SuiteAnalytics Workbook

Defining a Dataset 56
■ Conversion Options...: opens the Convert To window. In the Convert To window, you select thecurrency and date to use when the Apply Conversion option is selected. The rates used in theconversion are drawn from the table of currency exchange rates set up in your account. For moreinformation, see the help topic Currency Exchange Rates List Page.
Note: If you check the Anchor Relative to Today box, the current date will be used for theconversion each time the workbook is opened.
Dataset Criteria FiltersOn the Dataset tab above the Data Grid, the Criteria Builder enables you to filter your dataset results.Unlike filters that you create within workbook components such as pivot tables or charts, criteria filtersremove entire records and fields from a dataset which, impacts all workbooks that are based on thedataset. For example, if you create a criteria filter that removes invoice records from a dataset, workbooksbased on that dataset will also no longer include invoice data. Use caution when applying new criteriafilters to a dataset that is used in multiples workbooks.
Criteria filters are joined by AND/OR logic within the Criteria Builder and can be grouped so that multiplefilter conditions are evaluated as one item within the list of filters. You can edit or delete criteria filtersas necessary, or move filters so that they are evaluated in a different order. Any fields that you use in acriteria filter are highlighted in the Fields list, however they do not appear at the top of the Fields list likefields that are added to the Data Grid. If you are not sure which record type a field in the Criteria Builderbelongs to, click the Field menu icon next to a criteria filter and click Show Location in Field List.
When you create a new criteria filter, the results in the Data Grid are automatically updated. To updatethe results in a workbook connected to the dataset however, you must manually refresh each workbookcomponent.
Important: If you create a criteria filter based on a joined record type that has a one-to-many or many-to-many relationship with the root record type of the dataset, it can cause dataduplication. For more information, see Data Duplication Based on Record Joins.
To create a dataset criteria filter:
1. On the Dataset tab, drag a field from the Fields list to the Criteria Builder above the Data Grid.
The Filter window appears.
2. In the Filter window, select the filter conditions you want to apply to the field. Up to four types offilters are available depending on the field you select. For more information, see Filter Types.
Note: For hierarchical fields, you can set any filter type at the child or hierarchy level. Formore information, see Filter Conditions for Hierarchical Fields
3. Optionally, if you want to group your criteria filters, click New Group.
Grouped criteria filters are considered one item in the list of criteria filters and are evaluated in theorder that they appear in the Criteria Builder. For more information, see Grouping Filters.
4. Repeat steps 1–3 for each filter or filter group you want to define.
By default, criteria filters are added using an AND operator. To change the relationship betweenfilters and filter groups, click AND and select OR from the popup window.
5. Optionally, if you accessed the dataset from within a workbook, click Apply to workbook topreview your changes in the workbook.
SuiteAnalytics Workbook

Dataset Criteria Filters 57
6. Click Save to save your dataset changes.
If you do not own the dataset, click Save As to save it under a different name.
Filter TypesWhen you add a field from the Fields list to the Criteria Builder, the Filter window appears. Use the Filterwindow to set up specific filter conditions for a field. The types of filters you can set up depend on thevalues of the field, with each filter type represented by a different tab in the Filter window.
Important: The Filter window is also available from the Pivot tab within a workbook, howeverfilter conditions set up from the Pivot tab only impact the impact the pivot table and do not affectthe underlying dataset or other components of the workbook. Only filters that you set up from theCriteria Builder above the Data Grid can impact a dataset.
In each tab of the Filter window, you can define the values and expressions for the filter. You canonly create one type of filter per field at a time however, unless you use a group of filters. For moreinformation, see Grouping Filters. The available values and expressions in each tab of the Filter windowdepend on the type of field you select.
■ Values: Create a filter condition based on existing values or dates in the source data, or custom values
■ Ranges/ Date Ranges: Create a filter condition based on a range of values or dates available in thesource data
■ Relative Conditions/ Relative Dates: Create a filter condition relative to the existing values or dates inthe source data
SuiteAnalytics Workbook

Dataset Criteria Filters 58
■ Conditions/ Specific Dates: Create a filter condition using custom values or dates and an expression
Note: For hierarchical fields, filter conditions can be set at the parent or child level. For moreinformation, see Hierarchical Fields.
If you are in a NetSuite OneWorld account and create a criteria filter based on a field that containsvalues in multiple currencies, a Consolidate Field box is also displayed in the Filter window. Check theConsolidate Field box to the apply the filter based on the consolidated values of the field. For moreinformation, see Criteria Filters Based on Fields with Values in Multiple Currencies.
Grouping FiltersIn the Criteria Builder, you can click New Group to create a group of criteria filters.
Grouped criteria filters are the same as parenthetical expressions in the existing Saved Searchapplication. Use them to define a string of filter conditions connected by AND or OR operators, to beevaluated as one item within the list of criteria filters.
For example, if you set up the following criteria filters, SuiteAnalytics Workbook evaluates the entire set ofgrouped filter conditions (Status is Open AND Sales Rep is A Wolfe-admin) before the Start Date filter, andafter the Date filter.
You can also create a group of filters within another group. If you do, SuiteAnalytics Workbook evaluatesthe conditions in order from inside-to-outside.
For example, in the following group of filters, (Status is Closed AND Sales Rep is J Wolfe) is consideredbefore (Status is Open OR Sales Rep is Kennedy, Sean). Moreover, because the entire group is placedbefore the Start Date filter, the grouped filters are evaluated first.
SuiteAnalytics Workbook

Dataset Criteria Filters 59
Creating a WorkbookA workbook is where you analyze the results of a dataset query by creating workbook components suchas tables, pivot tables, and charts.
All workbooks are based on a dataset, however a single dataset can be used in multiple workbooks.Although you can access the underlying dataset from within a workbook, the dataset exists as itsown object, with its own creator and access rights. Moreover, changes to a dataset are automaticallypropagated to any connected workbooks. This prevents data discrepancies but also means that yourworkbooks can change unexpectedly if you do not own the underlying dataset. Finally, you can only createworkbook components using fields that have been added to the underlying dataset. If you do not see afield that you want to include in specific workbook component, you must add it to the dataset or contactthe dataset owner so that they can add it for you. For more information about defining a dataset, seeDefining a Dataset.
The types of workbook components that you can create include table views, pivot tables, and charts:
■ Table Views enable you to display and analyze your dataset results in a simplified table. For moreinformation, see <Table Views>.
Note: By default, all workbook templates include a Table View based on the underlyingdataset. For more information about workbook and dataset templates, see <Workbook andDataset Templates>.
■ Pivot tables enable you to pivot your dataset results so that you can analyze different subsets of thedata, such as the number of unfulfilled orders per customer in your account. For more information,see Workbook Pivot Tables.
■ Charts enable you to create different visualizations of your dataset results so that they can be analyzedat a glance. For more information, see Workbook Charts.
To create a new workbook based on new dataset:
1. From the Analytics Home page on the Workbooks subtab, click New Workbook.
SuiteAnalytics Workbook

Creating a Workbook 60
2. On the Select a dataset to create a new workbook page, click New Dataset.
3. Select a record type for the dataset.
The Dataset tab appears with preselected fields in the Data Grid.
4. Select the fields and criteria filters you want to include in the dataset. For more information, seeDefining a Dataset and Dataset Criteria Filters.
5. When you are satisfied with your results, click Apply to workbook.
6. Select a workbook component to begin.
7. Edit the layout for each workbook component that you add.
For more information, see Workbook Table Views, Workbook Pivot Tables, or Workbook Charts.
8. Click Save...
The Save Workbook As window appears.
Important: You cannot save a workbook with an unsaved dataset. If you have notalready saved your changes to the dataset, click the arrow next to the dataset name inthe Dataset Panel of the workbook and select Save Changes. Alternatively, if you want tocontinue editing the dataset, click Open Dataset.
9. Enter a name and description for the workbook in the fields provided, then click Save.
10. Optionally, click Share to share the workbook with other users in your account.
The Share Workbook window appears.
11. Select the roles or user IDs that you want to share the workbook with, then click Share.
For more information about sharing workbooks, see Accessing and Sharing Workbooks andDatasets.
To create a new workbook based on an existing dataset:
1. From the Analytics Home page on the Workbooks subtab, click New Workbook.
Alternatively, if you are already in an existing dataset, click Create New Workbook and proceed tostep 3.
2. Select a dataset on the Select a dataset to create a new workbook page.
3. Select a workbook component to begin.
Important: Keep in mind that you can only create workbook components using fieldsthat have been added to the selected dataset. If you do not own the selected dataset andyou want to add fields or criteria to it, you must save the dataset using a different name.Additionally, if you proceed without saving your own version of the dataset, the datasetcreator can make changes to the dataset which will impact your workbook. Use cautionwhen creating workbooks based on datasets that you do not own.
4. Edit the layout for each workbook component that you add.
For more information, see Workbook Table Views, Workbook Pivot Tables, or Workbook Charts.
5. Click Save...
The Save Workbook As window appears.
6. Enter a name and description for the workbook in the fields provided, then click Save.
7. Optionally, click Share to share the workbook with other users in your account.
The Share Workbook window appears.
8. Select the roles or user IDs that you want to share the workbook with, then click Share.
SuiteAnalytics Workbook

Creating a Workbook 61
For more information about sharing workbooks, see Accessing and Sharing Workbooks andDatasets.
Workbook Table ViewsWorkbook table views are where you can explore your dataset query results without altering the sourcedata of any workbooks that are based on the selected dataset. Using the table view does not requirecomplex customization and enables you to view your data without setting up a layout or defining customformula fields.
You can only create table views using the fields selected in the underlying dataset, as displayed in theDataset panel. Each field in the Dataset panel includes an icon that identifies the type of value containedwithin the field. For more information about each field type, open the underlying dataset. By default, allworkbook templates include a Table View based on the underlying dataset. For more information aboutworkbook and dataset templates, see <Workbook and Dataset Templates>.
To create a table view, you drag fields from the Dataset Panel to the Table Viewer. After you add fields tothe Table Viewer, you can filter and sort them as needed. When you add a new field to the Table Vieweror apply new sorting or filtering options, the results are automatically updated. You can further customizeyour table view by renaming the columns and each table view tab in your workbook. You can create asmany table views as you like using the same dataset. Additionally, you can export the data presented inyour table view to a CSV file.
To create a table view:
Important: Sorting, filtering, and other customization options that you apply to the tableview do not affect the underlying dataset or any other workbook components. To change theassociated dataset, click the dataset name in the Dataset Panel. If you do not own the underlyingdataset, contact the dataset owner.
1. Click the add icon from anywhere within the workbook and select Table.2. On the Table tab, drag fields from the Dataset Panel to the Table Viewer.
Fields added to the Table Viewer are highlighted in blue on the Dataset Panel.
Note: If you add hierarchical fields to the table, you are prompted to select a display typefor the field values. For more information, see Hierarchical Fields.
3. Optionally, customize the appearance of your table:a. Change the order of the columns by dragging them to the desired position or clicking the
Field Menu icon and selecting one of the move options.b. Rename the columns by clicking the Field Menu icon in the column header that you want to
rename, then selecting Rename.
Note: The change applies to the column name of the selected table view only. Thename does not change in the Dataset Panel, the underlying dataset, or any otherworkbook components that are based on the selected dataset.
c. Remove unwanted columns by clicking the Field Menu icon in the column header that youwant to remove, then selecting Remove Column.
4. Optionally, sort the data presented in the table:a. Click the Field Menu icon next to the field you want to sort.b. Select Ascending or Descending to apply one of the default sorting options, or select Add
Sort... to apply advanced sorting.
SuiteAnalytics Workbook

Creating a Workbook 62
Note: The advanced sorting options available for a table view are the same asthose that you can apply to a dataset. For more information, see Advanced SortingOptions.
5. Optionally, filter the data presented in the table:a. Click the Field Menu icon next to the field that you want to filter and select Filter...
The Filter window appears.b. Select the conditions or values for the filter, then click Apply. For more information about
the available filtering options, see Value-based Filters.The Table Viewer is automatically updated.
6. Optionally, click the Export icon to save a CSV file of your completed table.
Note: To export your table view, you must have the Export Lists permission.
Workbook Pivot TablesThe Pivot tab is where you pivot your dataset query results to analyze different subsets of data. Withineach table you can define multiple fields for each pivot table dimension, or create filters unique to thetable to customize your results. You can also change the appearance of your table by formatting thenumeric values that are presented, renaming your table rows and columns, adding totals and grandtotals, or applying sorting options.
As with all workbook components, you can only create a pivot table based on the fields in the underlyingdataset. On the Pivot tab, these fields appear in the Dataset Panel on the left. The Pivot Table Viewer onthe right displays your completed table based on the fields you define as rows, columns, and measuresin the Layout Panel. Each time you change or update your layout, you must click the Refresh icon toupdate the table. You must also refresh your table if changes are made to the dataset that the workbookis based on.
To create a pivot table:1. Click the add icon from anywhere within the workbook and select Pivot.2. On the Pivot tab, drag the desired fields from the Dataset Panel to the Rows, Columns, or Measures
tabs in the Layout panel. Alternatively, drag the fields from the Dataset Panel directly to the PivotTable Viewer.
Note: If you add hierarchical fields to the table, you are prompted to select a display typefor the field values. Depending on where you add the field and the display type you select,you can also add additional subtotals to the pivot table for each level in the hierarchy. Formore information, see Hierarchical Fields.
3. Select the summary type and format options for any date or numerical fields you add to the pivottable.
1. Click the Field Menu icon next to the field you want to format in the Layout panel.2. Select a summary type from the popup window.
The summary options vary depending on the type of field you select.3. Optionally, select Currency... to view the currency consolidation or conversion options for
any fields with values in multiple currencies.For more information, see Currency Conversion from the User Interface.
4. Optionally, click Format... to customize the numeric values for a field.
SuiteAnalytics Workbook

Creating a Workbook 63
For more information about numeric formatting options, see Customizing Numeric Values.4. Add totals and grand totals to the pivot table.
1. Click the Totaling icon .2. In the Totaling window, select where you want the totals or grand totals for each applicable
field to appear. If there are multiple fields that can be totalled in the rows or columns, checkthe Set Individually box to select where the totals for each field will appear on the pivottable.
3. Click OK.5. Click the Refresh icon to generate the pivot table.6. Optionally, filter the data displayed in the pivot table.
Note: Filter conditions created on the Pivot tab only impact the data displayed in the pivottable. No changes are made to the dataset that the workbook is based on.
1. Click the Field Menu icon next to the field you want to create a filter for. Depending onwhether the field has been defined as a Column, Row, or Measure, the following optionsare available. If you click the Field menu icon from the Fields List or the Layout Panel, it canalso impact the available options:■ Top 10: display only the top 10 rows or columns based on the measures defined for the
table.■ Bottom 10: display only the bottom 10 rows or columns based on the measures defined
for the table.■ Filter [Field Name] by...: enables you to define a custom measure-based filter for the
selected row or column.■ Filter [Field Name]: enables you to define a custom value-based filter based on specific
values within the table results.■ Add as Filter...: enables you to define a custom value-based filter based on specific
values within the table results.■ Filter Date: enables you to define a custom date filter based on date ranges that you
choose.2. The results in the table are updated automatically.
For more information, see Workbook Component Filters.
Pivot Table CustomizationSuiteAnalytics Workbook enables you to customize many aspects of your pivot tables. Click the followinglinks for more information:
■ Customizing Numeric Values■ Grouping Pivot Table Fields■ Compact and Expanded Mode■ Additional Pivot Table Customization Options
Customizing Numeric ValuesYou can customize the numeric values displayed in your pivot table using the Format window. To accessthe Format window, click the Field Menu icon next to the desired field in the Fields list or Layout paneland select Format... from the list.
SuiteAnalytics Workbook

Creating a Workbook 64
The following options are available. To change the default settings, check the Override box. After youmake a selection, the Preview field displays your changes. To apply your changes to the table, click OKand refresh the table. To define your own syntax, click the Special tab and enter the syntax in the fieldprovided.
■ Settings Applied From: Enables you to apply numeric formatting based on a specific language. Todefine each setting manually, select Custom. To use the numeric formatting set up in your NetSuitepersonal preferences, select User Preferences. For more information about personal preferences,see the help topic Setting Personal Preferences.
■ Decimal Places: The number of decimal places to include for each value.□ Select Per Currency/Unit to use the decimal places of the currency or unit of measure for each
value.□ Select Unbound to place no limits on the number of decimal places used for each value.
■ Negative Values: The format to use for negative values.■ Decimal Separator: The punctuation to indicate the decimal place. Select Custom to define your own
punctuation.■ Thousands Separator: The punctuation to separate groups of thousands. Select Custom to define
your own punctuation.■ Prefix: Enables you to define a prefix for the values in the field.■ Suffix: Enables you to define a suffix for the values in the field.■ Currency Symbol: Enables you to define where the currency symbol appears for dollar values in the
field.■ Units: Enables you to abbreviate the values of the field by thousands, millions, or billions.
Grouping Pivot Table FieldsGrouping fields in the pivot table Layout panel changes the granularity of the data presented in the table.By defining multiple fields as rows or columns, you can display subsets of data in the table.
For example, in the following Transaction table, only the Sales Rep field has been defined as a row. Thepivot table therefore only displays the total transactions for each sales representative.
SuiteAnalytics Workbook

Creating a Workbook 65
If you also define the Entity field as a row however, the table displays the total transactions per salesrepresentative and customer.
Try grouping different fields in your pivot table layouts to analyze different subsets of data.
Compact and Expanded ModeBy default, if you group fields or include multicolumn hierarchical fields in your pivot table, the tableexpands horizontally which can make it difficult to view your data.
SuiteAnalytics Workbook

Creating a Workbook 66
To display the table data vertically, click the Compact Mode icon .
Additional Pivot Table Customization OptionsTo further customize the appearance of your pivot tables, SuiteAnalytics Workbook offers the followingoptions:
■ To freeze column or row headers so that they are always visible as you scroll through your table, clickthe Freeze Column or Freeze Row icons.
SuiteAnalytics Workbook

Creating a Workbook 67
■ To enable row or column highlighting when you point to a specific part of the table, click the HighlightColumn or Highlight Row icons.
■ To rename a column or row, click the Field Menu icon and select Rename... from the menu.
■ To resize a column or row, drag one of the column or row boundaries until it is the size you want.
■ To change the width of a column based on its values, double-click the column header.
■ To expand or minimize the number of rows displayed in a column, click the icons in thecolumn header.
■ To expand or minimize the number of values displayed for a row, click the icon in the row header.
Pivot-based PortletsYou can see your pivot-based workbook data on your home dashboard by adding the Analytics portlet.The portlet enables you to quickly see the workbook data on your dashboard and provides quick accessto your workbook. Visualizing the data right on your dashboard enables you to spend more time learningfrom it and less time gathering it.
You can also choose how you want to visualize your pivot-based workbook by entering the number ofvisible rows you want to view at once. To identify the Analytics portlet on your dashboard, you can alsoenter a title. By default, the title displays the name of the workbook and the pivot table.
For more information about how to add and set up the Analytics portlet, see the help topic WorkbooksOverview.
Workbook ChartsThe Chart tab is where you create visualizations of your dataset query results. There are multiple charttypes you can create, all of which you can add to the Analytics portlet on any NetSuite dashboard. Youcan also print or export your charts to an SVG file. Additionally, you can customize the appearance of yourchart by adding a title and subtitle, or by renaming each axis. Filtering capabilities are also supported,enabling you to display only the most pertinent values in each chart.
As with the Table View and Pivot tabs, the Chart tab displays any fields that are included in the underlyingdataset in the Dataset Panel on the left. Completed charts are displayed in the Chart Viewer on the right,based on the fields you define as the x-axis, series, and measures in the Layout Panel. Each time youchange or update your layout, you must click the Refresh icon to update the chart. You must alsorefresh the chart if you make changes to the underlying dataset.
SuiteAnalytics Workbook

Workbook Charts 68
To create a chart:
1. Drag the desired fields from the Dataset Panel to the X-Axis, Series, or Measures tabs in the Layoutpanel.
2. Select the summary type and format options for any date or numerical fields you add to the chart.a. Click the Field Menu icon next to the field you want to format in the Layout panel.b. Select a summary type from the popup window.c. Optionally, click Format... to customize the numeric values for a field.
For more information about numeric formatting options, see Customizing Numeric Values.d. Optionally, select Currency... to view the currency consolidation or conversion options for
any fields with values in multiple currencies.For more information, see Currency Conversion from the User Interface.
3. In the Layout panel, select the type of chart you want to produce from the popup window.For information about each chart type, see the Chart Types topic.
4. Optionally, click the Properties subtab in the Layout panel to add a title and subtitle to the chart, orto rename each axis.
5. Click the Refresh icon to generate your chart.6. Optionally, filter the data displayed in the chart:
Note: Filters applied on the Chart tab affect only the data displayed in the chart. Nochanges are made to the underlying dataset or any other workbook components.
a. Click the Field Menu icon next to the field you want to create a filter for. Depending onwhether the field has been defined as the X-Axis, Series, or Measure, or if you click the Fieldmenu icon from the Fields List or the Layout Panel, the following options are available:■ Top 10: display only the top 10 results based on the measures defined for the chart.■ Bottom 10: display only the bottom 10 results based on the measures defined for the
chart.■ Filter [Field Name] by...: enables you to define a custom measure-based filter for the
selected chart component.■ Filter [Field Name]: enables you to define a custom value-based filter based on specific
values within the chart results.■ Add as Filter...: enables you to define a custom value-based filter based on specific values
within the chart results.b. The results in the table are updated automatically.
For more information, see Workbook Component Filters.
Chart TypesThere are multiple chart types you can use to visualize your data. To apply a chart type from either theChart tab or the Analytics portlet, click the chart type dropdown and select an option from the popupwindow. Changing the chart type from the Analytics portlet does not affect the chart type selected for thecorresponding workbook. Chart types let you compare values, and show trends. When you select a charttype, keep in mind the data included in the chart and the type of information you want to display. Thefollowing chart type options are available:
■ Column Chart – Enables you to compare values for different categories or compare value changesover a period of time for a single category. For example, sales by period of time (weekly, monthly,
SuiteAnalytics Workbook

Workbook Charts 69
quarterly, or yearly). You can also use column charts to display negative values and to show anoverview of the highest and lowest categories.
■ Bar Chart – Enables you to compare values offering the same capabilities of the column chart. You canuse this chart type when the data labels are long as it improves readability. For example, when usingregions or sales representatives as dimensions.
■ Area Chart – Enables you to display trends and accumulative value changes over time, such as itemstock, number of employees, or savings account.
■ Line Chart – Enables you to display trends for a higher number of data points. For example, whenshowing more than 20 data points.
■ Stacked Column Chart – Enables you to show the composition of the data, by displaying the proportionof each category to a whole. For example, you can use it to see the percentage of the base price anddiscount price by customer.
■ Stacked Bar Chart –Enables you to display data in a bar chart emphasizing the composition, instead ofcomparison.
■ Stacked Area Chart – Enables you to display data in an area chart showing how each categorycontributes to the total over a period of time.
To see some examples, see the following charts:
■ Open Sales Orders Lines Charts■ Number of Fulfillments Chart■ Value of Shipping Charges Charts
Chart-based PortletsYou can see your chart data on your home dashboard by adding the Analytics portlet. The portlet enablesyou to quickly see the chart on your dashboard and provides quick access to your workbook. Visualizingthe data on your dashboard enables you to spend more time learning from it and less time gathering it.
You can also choose how you want to visualize your chart by setting layout options such as the portletsize and chart type. To identify the Analytics portlet on your dashboard, you can also enter a title. Bydefault, the title displays the name of the workbook and the chart.
For more information on how to add and set up the Analytics portlet, see the help topic WorkbooksOverview.
SuiteAnalytics Workbook

Workbook Component Filters 70
Workbook Component FiltersAfter you set up a table view, pivot table, or chart, you can filter the data that is displayed using value-based or measure-based filters.
In table views and pivot tables, value-based filters are applied to every row and column and removesthose that do not contain the selected value. Similarly, in charts, any columns, bars, or lines that do notcontain the selected value are removed from the results.
In pivot tables, measure-based filters are applied to the row and column totals and remove any columnsor rows that do not match the selected filter criteria. In charts, any columns, bars, or lines with totals thatdo not meet the selected criteria are removed. Measure-based filters are not supported in table views.
In all workbook components, you can also create filters based on specific dates or custom date rangesthat you choose.
There is no limit on how many value-based filters you can apply to a workbook component, however youcan only apply one measure-based or date-based filter. Additionally, if you apply both value-based andmeasure-based filters, all value-based filters are applied first.
Filters that you apply to a workbook component do not affect the dataset that the workbook is based onand only refine the values displayed in the selected workbook component. To filter the dataset, you mustcreate criteria filters from the Dataset tab. Additionally, if you are in a NetSuite account that has values inmultiple currencies, you must consolidate or convert these values before you can use them in a measure-based filter condition.
For more information about filtering a dataset, see Dataset Criteria Filters.
For more information converting or consolidating values in a workbook component, see CurrencyConversion in Datasets and Workbooks.
Value-based FiltersValue-based filters enable you to filter the data displayed in your workbook components using specificvalues from any field that has been added to the Layout panel or Table Viewer. In pivot tables, value-based filters are applied to every row and column in the table and removes those that do not contain theselected value. In charts, any columns, bars, or lines that do not contain the selected value are removedfrom the results.
To apply a value-based filter to a workbook component:
1. Click the Field Menu icon next to any field in the Layout panel or Viewer and select Filter [FieldName]...
The Filter window appears.
2. In the Filter window, select the field values and operator to use in the filter condition.
3. Click OK.
The results are updated and the selected filter criteria is displayed above the Viewer.
Measure-based FiltersIn pivot tables, measure-based filters enable you to filter out entire columns or rows using filterconditions that are applied to the totals displayed in the table, based on the measures defined for the
SuiteAnalytics Workbook

Workbook Component Filters 71
table. In charts, any columns, bars, or lines with total values that do not meet the selected criteria areremoved from the chart.
For example, assume you have set up the following pivot table and you only want to see customers withover thirty thousand dollars in total transactions:
To do so, you can apply a measure-based filter on the Entity field of Entity by Total Amount(Transaction Currency) (Sum) greater 30,000.00.
Alternatively, if you want to quickly display the top 10 or bottom 10 customers based on their totaltransactions, you can select the Top 10 or Bottom 10 options from the Field Menu.
SuiteAnalytics Workbook

Workbook Component Filters 72
In both cases, a filter is applied to the Entity rows based on their Total Amount (Transaction Currency)totals.
Note: If you are in a NetSuite account that has values in multiple currencies, you mustconsolidate or convert these values before you can use them in a measure-based filter condition.For more information about currency conversion in SuiteAnalytics Workbook, see CurrencyConversion in Datasets and Workbooks.
To apply a custom measure-based filter to your pivot table or chart:
1. Click the Field Menu icon next to any column, row, x-axis, or series field in the Layout panel orViewer.
2. Select Filter [Field name] by... and click the desired measure.
The Filter window appears.
SuiteAnalytics Workbook

Workbook Component Filters 73
3. In the Filter window, select Greater/Less than, then select the measure, operator, and value forthe filter condition.
4. Click OK.
The table or chart automatically updates the results.
To apply a Top N or Bottom N measure-based filter to your pivot table or chart:
1. Click the Field Menu icon next to any column, row, x-axis, or series field in the Layout panel orViewer.
2. To quickly view the top 10 or bottom 10 results based on the measure defined for the table, clickTop 10 [Field name] or Bottom 10 [Field name].
The table or chart automatically updates the results.
3. Alternatively, to customize the number of top or bottom results, the Field Menu icon and selectFilter [Field name] by... , then click the desired measure.
4. In the Filter window, make sure Top/Bottom is selected.
5. In the fields provided, select whether to display the top or bottom results, the number of results todisplay, and the measure to use for the filter.
6. Click OK.
The table or chart automatically updates the results.
Date FiltersDate filters enable you to filter your results based on a specific date or custom date range that youchoose. You can only apply one date filter per workbook component.
To apply a date filter to a workbook component:
1. Click the Field Menu icon in the Dataset Panel or Layout Panel next to a date field and selectFilter Date> Advanced...
2. In the Filter Date (Advanced...) window, use the Specific Dates tab to enter a custom date or daterange to use for the filter. Use the Values tab to select specific dates from the underlying datasetquery results.
3. Click Apply.
The table or chart automatically updates the results.
SuiteAnalytics Workbook

Workbook and Dataset Templates 74
Workbook and Dataset TemplatesSuiteAnalytics Workbook currently offers over 20 predefined workbook and dataset templates.
In a dataset template, all of the required fields, record types, and criteria filters are predefined so that youcan create a workbook without having to first define a complex, custom dataset. Conversely, workbooktemplates include predefined workbook components such as tables, pivot tables, and charts, so that youcan analyze and visualize the results of the accompanying dataset templates.
By default, only users with the Analytics Administrator permission can access workbook and datasettemplates. If you do not have the Analytics Administrator permission, you can access these templatesonly if a user with the Analytics Administrator permission shares them with you. You must also haveaccess to the underlying dataset template to open a workbook template. Additionally, some templates arefeature dependent. If you do not see one of the listed templates in your account, contact your accountadministrator.
If you have the Analytics Administrator permission, you can access the templates from the Analytics Homepage, from either the Workbooks or Datasets subtabs.
For more information about the Analytics Administrator permission, see Analytics AdministratorPermission.
To see the dataset templates currently available in SuiteAnalytics Workbook, see Dataset Templates.
To see the workbook templates currently available in SuiteAnalytics Workbook, see Workbook Templates.
Dataset TemplatesImportant: By default, only users with the Analytics Administrator permission can access theworkbook and dataset templates in your account. If you do not have the Analytics Administratorpermission, contact a user with the Analytics Administrator permission about sharing thetemplates with you.
SuiteAnalytics Workbook offers over 20 dataset templates. Each template includes preselected fields,joined record types, and criteria filters so that you can quickly create a custom workbook or your ownversion of the dataset. Additionally, each dataset template has an accompanying, predefined workbooktemplate. For information about workbook templates, see <Workbook Templates>.
The following dataset templates are currently available in SuiteAnalytics Workbook. If you have theAnalytics Adminstrator permission, access the templates by selecting Templates on the Datasets subtabof the Analytics Home page:
Important: Some templates are feature dependent. If you do not see one of the listedtemplates in your account, contact your account administrator.
■ System Notes v2 Dataset Template
■ Purchases (Billed) Dataset
■ Purchases (Ordered) Dataset
■ Transaction Detail Dataset Template
■ Warehouse Inventory: Counts & Adjustments Dataset Template
■ Warehouse Inventory: Inbound Dataset
■ Warehouse Inventory: Outbound Dataset
SuiteAnalytics Workbook

Dataset Templates 75
■ Actual Time Dataset Template
■ Time-Off Analysis Dataset Template
■ SuiteCommerce Top Searches (Beta) Dataset Template
■ SuiteCommerce Top Searches with No Results (Beta) Dataset Template
■ Manufacturing Dataset Template
■ Items by Customer Dataset Template
■ Customers by Item Dataset Template
■ Web Store Orders Dataset Template
■ Employee Tax Jurisdictions (Beta) Dataset Template
■ Workplace Tax Jurisdictions (Beta) Dataset Template
Workbook TemplatesImportant: By default, only users with the Analytics Administrator permission can access theworkbook and dataset templates in your account. If you do not have the Analytics Administratorpermission, contact a user with the Analytics Administrator permission about sharing thetemplates with you.
SuiteAnalytics Workbook offers over 20 workbook templates, based on the available dataset templatesin your account. Each template includes a different set of workbook components for you to analyze yourdata, including a Table View containing all of the fields from the underlying dataset. Use these templatesto quickly analyze and visualize different parts of your company data. To access the underlying datasettemplate, click the dataset name in the Dataset Panel from any of the workbook components and selectOpen Dataset.
The following workbook templates are currently available in SuiteAnalytics Workbook. If you have theAnalytics Adminstrator permission, access the templates by selecting Templates on the Workbookssubtab of the Analytics Home page:
Important: Some templates are feature dependent. If you do not see one of the listedtemplates in your account, contact your account administrator.
■ Purchases (Billed) Workbook
■ Purchases (Ordered) Workbook
■ Manufacturing Workbook Template
■ System Notes v2 Workbook
■ Transaction Detail Workbook
■ Employee Tax Jurisdictions Workbook (Beta)
■ Workplace Tax Jurisdictions (Beta) Workbook
■ Time-Off Analysis Workbook
■ SuiteCommerce Top Searches (Beta) Workbook
■ SuiteCommerce Top Searches with No Results (Beta) Workbook
■ Items by Customer Workbook
■ Customers by Item Workbook
SuiteAnalytics Workbook

Workbook-based Portlets 76
Workbook-based PortletsWith the Analytics portlet, SuiteAnalytics Workbook enables you to view your workbook data on yourdashboards. The Analytics portlet lets you add charts and pivot tables from workbooks listed in the MyWorkbooks and Shared with Me sections of the Workbook Listing Page. You can add up to 10 Analyticsportlets to your dashboards, each with a unique chart and pivot table.
For more information, see the help topic Workbooks Overview.
Displaying Chart and Pivot Data in the AnalyticsPortletsTo display your chart and pivot data on your home dashboard, you can add and set up the Analyticsportlet. The portlet enables you to quickly see the workbook data and provides quick access to yourworkbook. Visualizing the data right on your dashboard enables you to spend more time learning from itand less time gathering it.
You can also choose how you want to visualize the workbook data on your portlet. To identify theAnalytics portlet on your dashboard, you can enter a title. By default the title displays the name of theworkbook and the chart. Additionally, you can set layout options, such as the following:
■ For chart-based portlets, you can set the portlet size and chart type.
■ For pivot-based portlets, you can enter the number of rows you want to view at once when loading thepivot table.
For more information on how to add and set up an Analytics portlet, see the help topics Adding anAnalytics Portlet and Setting Up the Analytics Portlet.
SuiteAnalytics Workbook

SuiteAnalytics Workbook Tutorial 77
SuiteAnalytics Workbook TutorialUse this tutorial to walk through the authoring process for SuiteAnalytics Workbook.
In this tutorial, you create a sample Transaction dataset and a workbook that includes a pivot table andchart. The pivot table and chart display the total billed sales orders for each sales representative in yourcompany, for the date range you choose.
The following table describes the steps to create the dataset then the workbook. Each step builds on theprevious step, so you must complete them in order:
Step Description
Step 1: Select a Root Record Type Begin your dataset by choosing a root record type.
Step 2: Add Fields and Join Record Types Choose the fields and record types that you want to include in yourdataset.
Step 3: Filter Your Dataset Apply criteria filters to refine your dataset query results.
Step 4: Create a Workbook Based on YourDataset
Continue your analysis by creating a workbook based on yourdataset.
Step 5: Pivot Your Dataset Query Results Create a pivot table using your dataset query results.
Step 6: Chart Your Dataset Query Results Create a chart using your dataset query results.
Note: This tutorial assumes that you have the appropriate permissions and features enabled inyour account to view transaction and sales order data. If you are not sure about which permissionsneed to be enabled to view transaction records or fields, download the following worksheet:NetSuitePermissionsUsage.xls. If you do not have a specific permission enabled, contact yourNetSuite administrator.
Step 1: Select a Root Record TypeThe following steps show you how to select a root record type for your dataset. The available record typesare based on the features enabled in your account and the permissions assigned to the role you use tolog in to NetSuite. If you do not see the Transaction record type, contact your administrator.
To select a root record type:
1. Click the Analytics tab in the NetSuite navigation menu.2. On the Analytics Home page, click the Datasets subtab and select New Dataset.3. Select a record type from the list.
The Dataset tab opens with preselected fields on the Data Grid based on the record type youchoose.For the purposes of this tutorial, select the Transaction record type.
Continue to Step 2: Add Fields and Join Record Types.
Step 2: Add Fields and Join Record TypesIf you have not already done so, complete Step 1: Select a Root Record Type.
SuiteAnalytics Workbook

Step 2: Add Fields and Join Record Types 78
The following steps show you how to add fields and join record types to your dataset. Only fields that areincluded on the Data Grid can be used to build workbook components such as tables, pivot tables, andcharts.
By default, the Data Grid displays preselected fields based on the root record type selected for theworkbook. Fields that you add to the grid appear highlighted at the top of the Fields list.
To add fields and join record types:
1. Add fields from the root record type to the Data Grid. You have three options:
■ Drag the fields from the Fields list to the Data Grid.
■ Double-click the fields in the Fields list.
■ Type the name of the fields in the search bar at the top of the Fields list, then drag or double-click them to add them to the Data Grid.
For the purposes of this tutorial, add the Sales Rep and Status fields to the Data Grid.
Note: If you add a hierarchical field to the Data Grid, you are prompted to select whetherto display the child values or the full hierarchy for each record in the corresponding fieldcolumn. For more information, see Hierarchical Fields.
2. Join related record types to the dataset by adding their fields to the Data Grid.
a. By default, the Records list on the Dataset tab shows all related record types that you haveaccess to in your account.
Click the arrow next to any record type in the Records list to view additional related recordtypes.
b. Click the desired record type name to update the Fields list.
SuiteAnalytics Workbook

Step 2: Add Fields and Join Record Types 79
c. Double-click or drag the desired fields to the Data Grid.
Note: Depending on the relationship between record types that you join in adataset, data duplication might occur. For more information, see Guidelines forJoining Record Types in SuiteAnalytics Workbook.
For the purposes of this tutorial, no related record type fields are required.
3. Create and add formula fields to the Data Grid.
a. Click the Formulas link above the Records list.
b. Click New Formula in the Fields list.
The Formula Field window appears.
SuiteAnalytics Workbook
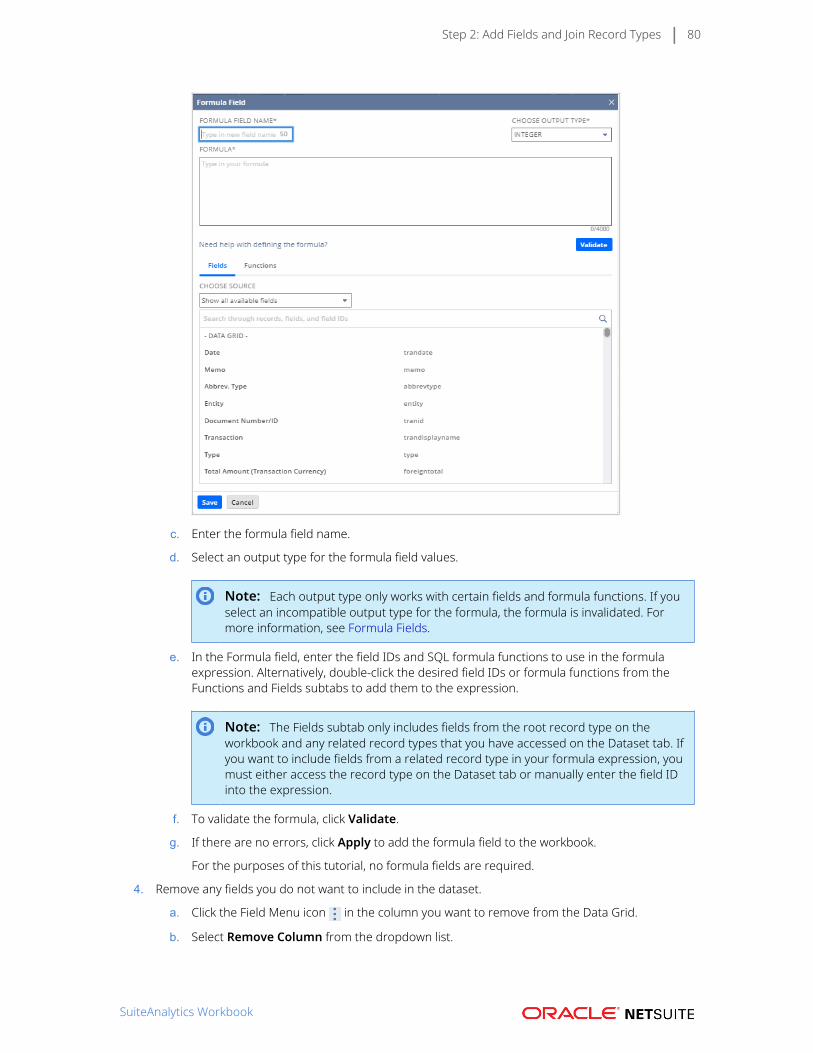
Step 2: Add Fields and Join Record Types 80
c. Enter the formula field name.
d. Select an output type for the formula field values.
Note: Each output type only works with certain fields and formula functions. If youselect an incompatible output type for the formula, the formula is invalidated. Formore information, see Formula Fields.
e. In the Formula field, enter the field IDs and SQL formula functions to use in the formulaexpression. Alternatively, double-click the desired field IDs or formula functions from theFunctions and Fields subtabs to add them to the expression.
Note: The Fields subtab only includes fields from the root record type on theworkbook and any related record types that you have accessed on the Dataset tab. Ifyou want to include fields from a related record type in your formula expression, youmust either access the record type on the Dataset tab or manually enter the field IDinto the expression.
f. To validate the formula, click Validate.
g. If there are no errors, click Apply to add the formula field to the workbook.
For the purposes of this tutorial, no formula fields are required.
4. Remove any fields you do not want to include in the dataset.
a. Click the Field Menu icon in the column you want to remove from the Data Grid.
b. Select Remove Column from the dropdown list.
SuiteAnalytics Workbook

Step 2: Add Fields and Join Record Types 81
For the purposes of this tutorial, remove the Memo, Document Number/ID, and Transactionfields.
Warning: Any changes you make to a dataset are automatically propagated toworkbooks that are based on the dataset. Removing a field from the Data Gridcan therefore cause failures in the connected workbooks. Exercise caution whenremoving a field from the grid.
Continue to Step 3: Filter Your Dataset.
Step 3: Filter Your DatasetIf you have not already done so, complete Step 2: Add Fields and Join Record Types.
The following steps show you how to filter you dataset query results. Criteria filters that you apply tothe dataset are propagated to any new or existing workbooks that you create based on the dataset. Forexample, if you create a criteria filter to exclude any sales orders created in the last week, data from thosesales orders are not presented in any previously associated workbooks, or new workbooks that you createusing this dataset.
To filter your dataset:
1. On the Dataset tab, drag the desired record field or formula field from the Fields list to the CriteriaBuilder above the Data Grid.
The Filter window appears.
2. In the Filter window, select the filter conditions you want to apply to the field. Up to four optionsare available for filtering the data, depending on the type of field that is selected. For hierarchicalfields, you can set any of the following filters at the child or hierarchy level:
■ Values: Existing values or dates from the source data, or custom values
■ Ranges/Date Ranges: Range of values or dates available in the source data
■ Relative Conditions/Relative Dates: Conditions relative to the existing values in the source data
SuiteAnalytics Workbook

Step 3: Filter Your Dataset 82
■ Conditions/Specific Dates: Specific value or date and an expressionFor the purposes of this tutorial, set the following filter conditions:■ Date within X and Y
AND■ Status is Sales Order: Billed
Note: If you want to group filter conditions, click New Group. Grouped filters areconsidered one item in the list of conditions and are evaluated in the order that they appearin the Criteria Builder. For more information, see Grouping Filters.
3. Repeat steps 1–2 for each filter you want to define.By default, filters are added using an AND operator. To change the relationship between filters andfilter groups, click AND and select OR from the popup window.
4. After you define each filter, the Data Grid is updated with only the data that matches your selectedcriteria and a criteria summary is displayed above the grid.
SuiteAnalytics Workbook

Step 3: Filter Your Dataset 83
Important: If you want to convert field values that are in multiple currencies, you mustdo so from within a workbook or using a custom formula field with the TO_NUMBERfunction. For more information, see Currency Conversion in Datasets and Workbooks
5. Click Save.
The Save Dataset As window appears.
6. Enter a name and description for the dataset in the fields provided.
7. Click Save.
Continue to Step 5: Pivot Your Dataset Query Results.
Step 4: Create a Workbook Based on Your DatasetIf you have not already done so, complete Step 3: Filter Your Dataset.
The following steps show you how to create a workbook based on your completed dataset.
Note: If you want to create additional workbooks based on the dataset you saved in Step 3, goto the Analytics Home page and click New Workbook on the Workbooks subtab. Then, select thedataset you saved to open a new workbook.
If you want to edit the dataset from within your workbook, click the dataset name in the DatasetPanel in any workbook component.
To create a workbook based on your dataset:
1. On the Dataset tab, click Create New Workbook.
2. A workbook will open.
By default, the workbook is named after the root record type on the dataset.
3. Select a workbook component you want to create: either a Table View, Pivot table, or Chart.
For the purposes of this procedure, select Pivot.
Continue to Step 5: Pivot Your Dataset Query Results.
Step 5: Pivot Your Dataset Query ResultsIf you have not already done so, complete Step 4: Create a Workbook Based on Your Dataset.
The following steps show you how to pivot your dataset query results to create a pivot table.
To pivot your source data:
1. On the Pivot tab, drag the desired fields from the Fields list to the Rows, Columns, or Values tabs inthe Layout panel. Alternatively, drag the fields from the Fields list directly to the Pivot Table Viewer.
SuiteAnalytics Workbook

Step 5: Pivot Your Dataset Query Results 84
For the purposes of this tutorial, add the Sales Rep field to the pivot table Rows, add two instancesof the Date field to the pivot table Columns, and add the Total Amount (Transaction Currency) fieldto the pivot table Measures.
Note: If you add hierarchical fields to the table, you are prompted to select a display typefor the field values. Depending on where you add the field and the display type you select,you can also add additional subtotals to the pivot table for each level in the hierarchy. Formore information, see Hierarchical Fields.
2. Select the summary type and format options for any date or numerical fields you add to the pivottable.
1. Click the Field Menu icon next to the field you want to format in the Layout panel.
2. Select a summary type from the popup window.
3. Optionally, select Currency... to view the currency consolidation or conversion options forany fields with values in multiple currencies.
For more information, see Currency Conversion from the User Interface.
SuiteAnalytics Workbook

Step 5: Pivot Your Dataset Query Results 85
Important: If you have fields with values in multiple currencies, you must convertthe values to a single currency to perform accurate data aggregations or othertypes of numeric manipulation.
4. Optionally, click Format... to customize the numeric values for a field.
For more information about numeric formatting options, see Customizing Numeric Values.
For the purposes of this tutorial, select the following summary types. No numeric formatting isrequired:
■ Date (Year)
■ Date (Quarter)
■ Total Amount (Transaction Currency) (Sum)
3. Add totals and grand totals to the pivot table.
1. Click the Totaling icon .
2. In the Totaling window, select where you want the totals or grand totals for each applicablefield to appear. If there are multiple fields that can be totalled in the rows or columns, checkthe Set Individually box to select where the totals for each field will appear on the pivottable.
3. Click OK.
For the purposes of this tutorial, set the Row totals to appear on the bottom and the Column totalsto appear on the right.
4. Click the Refresh icon to generate the pivot table.
SuiteAnalytics Workbook

Step 5: Pivot Your Dataset Query Results 86
5. Optionally, filter the data displayed in the pivot table.
Note: Filter conditions created on the Pivot tab only impact the data displayed in the pivottable. No changes are made to the underlying dataset.
a. Click the Field Menu icon next to the field you want to create a filter for. Depending onwhether the field has been defined as a Column, Row, or Measure, or if you click the Fieldmenu icon from the Fields List or the Layout Panel, the following options are available:
■ Top 10: display only the top 10 rows or columns based on the measures defined for thetable.
■ Bottom 10: display only the bottom 10 rows or columns based on the measures definedfor the table.
■ Filter [Field Name] by...: enables you to define a custom measure-based filter for theselected row or column.
■ Filter [Field Name]: enables you to define a custom value-based filter based on specificvalues within the table results.
■ Add as Filter...: enables you to define a custom value-based filter based on specific valueswithin the table results.
SuiteAnalytics Workbook
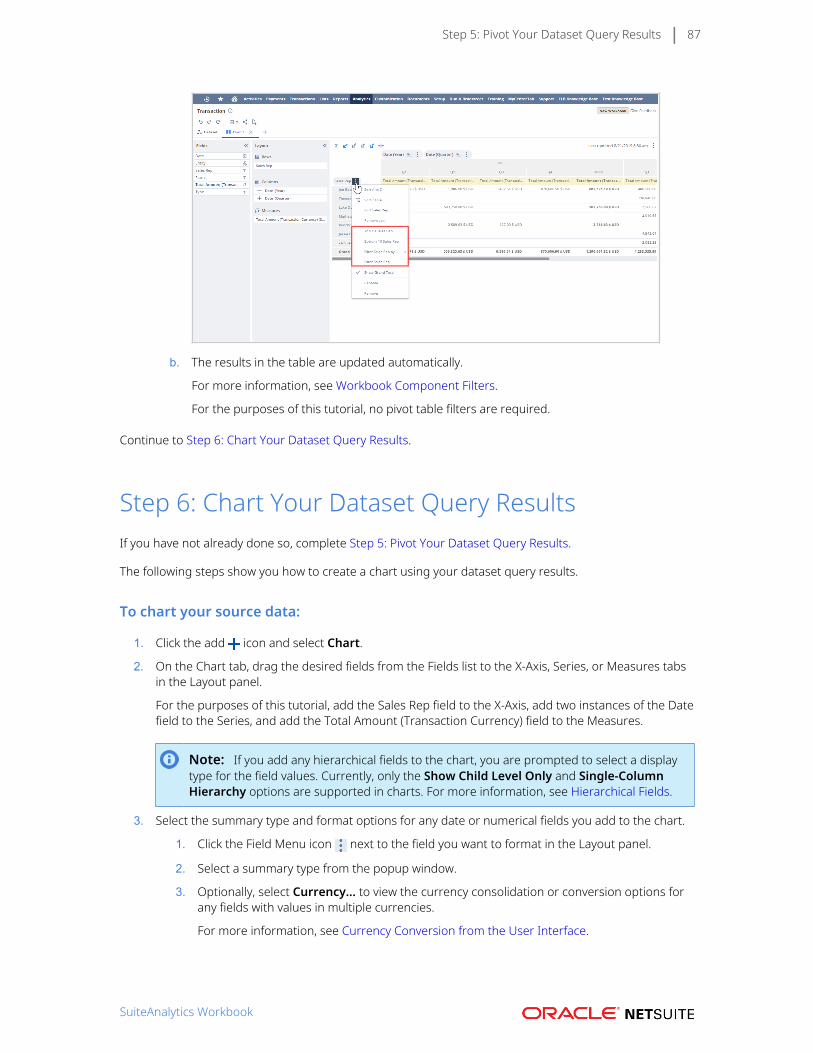
Step 5: Pivot Your Dataset Query Results 87
b. The results in the table are updated automatically.
For more information, see Workbook Component Filters.
For the purposes of this tutorial, no pivot table filters are required.
Continue to Step 6: Chart Your Dataset Query Results.
Step 6: Chart Your Dataset Query ResultsIf you have not already done so, complete Step 5: Pivot Your Dataset Query Results.
The following steps show you how to create a chart using your dataset query results.
To chart your source data:
1. Click the add icon and select Chart.
2. On the Chart tab, drag the desired fields from the Fields list to the X-Axis, Series, or Measures tabsin the Layout panel.
For the purposes of this tutorial, add the Sales Rep field to the X-Axis, add two instances of the Datefield to the Series, and add the Total Amount (Transaction Currency) field to the Measures.
Note: If you add any hierarchical fields to the chart, you are prompted to select a displaytype for the field values. Currently, only the Show Child Level Only and Single-ColumnHierarchy options are supported in charts. For more information, see Hierarchical Fields.
3. Select the summary type and format options for any date or numerical fields you add to the chart.
1. Click the Field Menu icon next to the field you want to format in the Layout panel.
2. Select a summary type from the popup window.
3. Optionally, select Currency... to view the currency consolidation or conversion options forany fields with values in multiple currencies.
For more information, see Currency Conversion from the User Interface.
SuiteAnalytics Workbook

Step 6: Chart Your Dataset Query Results 88
Important: If you have fields with values in multiple currencies, you must convertthe values to a single currency to perform accurate data aggregations or othertypes of numeric manipulation.
4. Optionally, click Format... to customize the numeric values for a field.
For more information about numeric formatting options, see Customizing Numeric Values.
For the purposes of this tutorial, select the following summary types. No numeric formatting isrequired:
■ Date (Year)
■ Date (Quarter)
■ Total Amount (Transaction Currency) (Sum)
4. In the Layout panel, select the type of chart you want to produce from the popup window.
For information about each chart type, see the Chart Types topic.
For the purposes of this tutorial, select the Basic Column Chart.
5. Optionally, click the Options subtab in the Layout panel to add a title and subtitle to the chart, or torename each axis.
6. Click the Refresh icon to generate the chart.
SuiteAnalytics Workbook

Step 6: Chart Your Dataset Query Results 89
7. Click the Save.
8. In the Save Workbook As window, enter a name and description for the workbook in the fieldsprovided and click Save.
All selections made in each workbook component is saved.
9. Optionally, share the workbook with other users in your account.
a. Click the Share.
b. In the Share Workbook window, select the users or roles you want to share the workbookwith.
c. Click Share.
For more information about sharing workbooks, see Accessing and Sharing Workbooks andDatasets.
10. Optionally, if you want to make edits to the underlying dataset, click the dataset name in theDataset Panel from within any workbook component.
For more information, see Editing a Dataset.
SuiteAnalytics Workbook

Navigating SuiteAnalytics Workbook 90
Navigating SuiteAnalytics WorkbookThe SuiteAnalytics Workbook user interface includes an entry point, a Dataset tab, and three workbookcomponent tabs. Click the following links to learn more about each area of the interface:
■ Analytics Home Page
■ Dataset Tab
■ Table Tab
■ Pivot Tab
■ Chart Tab
Analytics Home PageThe Analytics Home page appears when you click the Analytics tab in the NetSuite navigation menu. Thepage includes Workbook and Dataset subtabs, enabling you to open and view any of the workbooks anddatasets that you have access to. If you have the Analytics Administrator permission, you can also accesspredefined workbook and dataset templates and any of the workbooks or datasets created by other usersin your account. For more information about the Analytics Administrator permission, see The AnalyticsAdministrator Permission.
The elements of the Analytics Home page are identified in the image below:
Note: The options available on this page vary depending on whether you are in the Workbooksor Datasets subtab.
1 Favorite Workbooks — Includes any workbooks you have marked as a favorite. Click the icon in the upper rightcorner to sort the workbooks by name, in ascending or descending order.
2 Workbooks/Datasets subtabs — Switch between viewing the workbooks and datasets in your account.
3 Search — Search for saved workbooks or datasets using a field name, user name, criteria filter, or any otherworkbook or dataset element. Searches are only executed across the selected list (4).
SuiteAnalytics Workbook

Analytics Home Page 91
For example, to search workbooks that you are the owner of, make sure that My Workbooks is selected in thedrop down list of the Workbooks subtab.
4 Workbook/Dataset lists — Specify the workbooks or datasets you want to view. You can only view templates andobjects created by other users if you have the Analytics Administrator permission:
■ All Workbooks/ Datasets- Every workbook or dataset that you have access to in your account.
■ My Workbooks/ Datasets- Workbooks or datasets that you have created.
■ Shared with me- Workbooks and datasets that other users have created and shared with you.
■ Employee Workbooks/ Datasets- Workbooks and datasets created by other users in your account.
■ Templates- Predefined workbook and dataset templates. For more information, see Workbook and DatasetTemplates.
5 New Workbook/Dataset — On the Workbook subtab, click New Workbook to begin authoring a workbook usingan existing dataset or a new dataset that you create. On the Dataset subtab, click New Dataset to select a recordtype and begin authoring a new dataset. For more information, see Custom Workbooks and Datasets.
6 Workbook/Dataset table — All workbooks and datasets that you have access to are presented in a table. If youare on the Workbooks subtab, you can also view each workbook as a thumbnail.
In the table, the owner, creation date, and other information is displayed for each object. You can edit some ofthese values if you have the Analytics Administrator permission.
■ To view a summary of the fields and criteria filters in each dataset, click Details.
■ To delete or share a workbook or dataset, click the Action icon and select Share or Delete. For datasets, youalso have the option to Create Workbook.
Dataset TabThe Dataset tab appears after you select a root record type for a new dataset, or if you click the datasetname in the Dataset Panel of a workbook. On this tab you combine record types, fields, and criteria filtersto create queries. The results of these queries are the basis for all workbooks in your account.
On the Dataset tab, your query results are displayed in a tabular format in the Data Grid on the right.Record types, fields, custom formula fields, and configuration options appear in the Records and Fieldslists on the left. Only fields that are included in the Data Grid can be used to build workbook componentssuch as pivot tables and charts.
Above the Data Grid is the Criteria Builder where you create criteria filters to refine the results displayedin the grid. Criteria filters impact not only your dataset query results but also the data presented inworkbooks that are based on the dataset.
To build your dataset, drag fields from the Fields list to the Data Grid. To create a filter condition, dragfields from the Fields list to the Criteria Builder. On the grid itself, you can sort and filter the values thatare presented. After you create your query, you have multiple options to apply or preview the results in aworkbook.
■ For information about how to use the Dataset tab to create a query, see Defining a Dataset.
■ For information about creating criteria filters to refine your query results, see Dataset Criteria Filters.
■ For information about creating a workbook based on your dataset query results, see Creating aWorkbook.
The elements of the Dataset tab are identified in the image below:
SuiteAnalytics Workbook
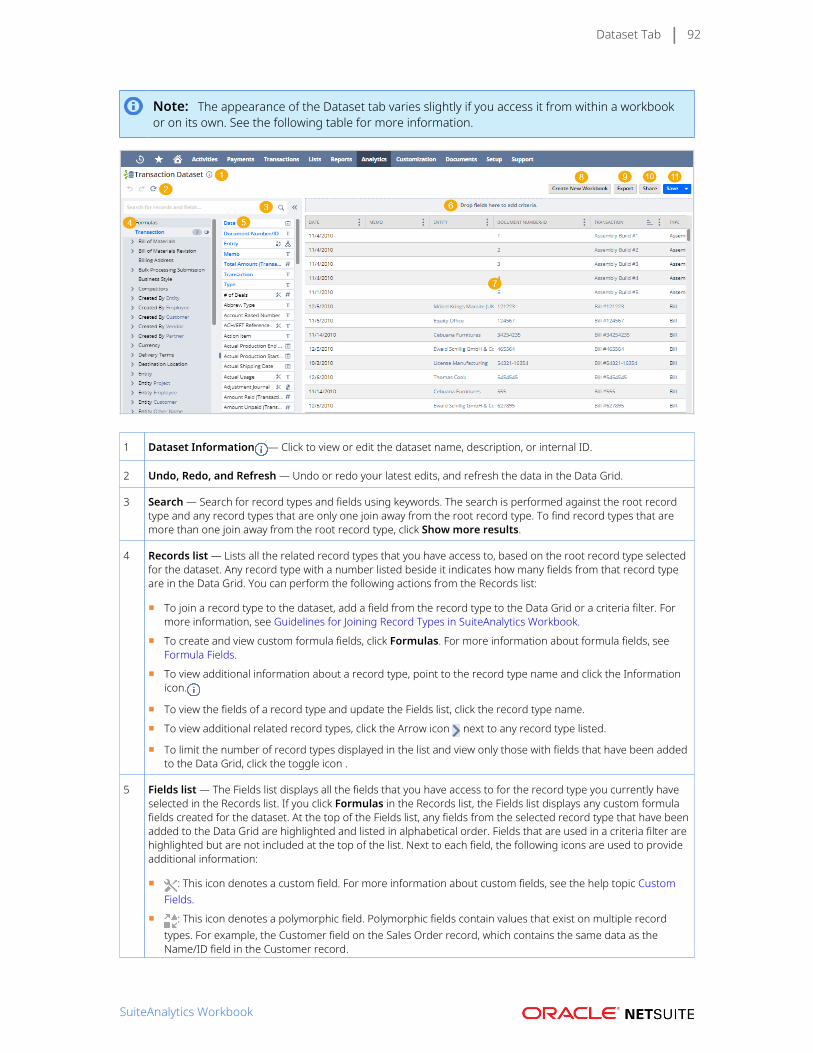
Dataset Tab 92
Note: The appearance of the Dataset tab varies slightly if you access it from within a workbookor on its own. See the following table for more information.
1 Dataset Information — Click to view or edit the dataset name, description, or internal ID.
2 Undo, Redo, and Refresh — Undo or redo your latest edits, and refresh the data in the Data Grid.
3 Search — Search for record types and fields using keywords. The search is performed against the root recordtype and any record types that are only one join away from the root record type. To find record types that aremore than one join away from the root record type, click Show more results.
4 Records list — Lists all the related record types that you have access to, based on the root record type selectedfor the dataset. Any record type with a number listed beside it indicates how many fields from that record typeare in the Data Grid. You can perform the following actions from the Records list:
■ To join a record type to the dataset, add a field from the record type to the Data Grid or a criteria filter. Formore information, see Guidelines for Joining Record Types in SuiteAnalytics Workbook.
■ To create and view custom formula fields, click Formulas. For more information about formula fields, seeFormula Fields.
■ To view additional information about a record type, point to the record type name and click the Informationicon.
■ To view the fields of a record type and update the Fields list, click the record type name.
■ To view additional related record types, click the Arrow icon next to any record type listed.
■ To limit the number of record types displayed in the list and view only those with fields that have been addedto the Data Grid, click the toggle icon .
5 Fields list — The Fields list displays all the fields that you have access to for the record type you currently haveselected in the Records list. If you click Formulas in the Records list, the Fields list displays any custom formulafields created for the dataset. At the top of the Fields list, any fields from the selected record type that have beenadded to the Data Grid are highlighted and listed in alphabetical order. Fields that are used in a criteria filter arehighlighted but are not included at the top of the list. Next to each field, the following icons are used to provideadditional information:
■ : This icon denotes a custom field. For more information about custom fields, see the help topic CustomFields.
■ : This icon denotes a polymorphic field. Polymorphic fields contain values that exist on multiple recordtypes. For example, the Customer field on the Sales Order record, which contains the same data as theName/ID field in the Customer record.
SuiteAnalytics Workbook

Dataset Tab 93
■ : This icon denotes a hierarchical field. Hierarchical fields have a defined parent-child relationship inNetSuite. These fields have multiple display options and can be used to create criteria filters based on theparent or child values in each record. For more information, see Hierarchical Fields.
■ : These icons denote the type of values contained within the field. Fields can include eithertext, numerical, date, or boolean data.
Using the Fields list, you can perform the following actions:
■ To collapse the Records and Fields lists and expand the Data Grid, click the double arrows .
■ To view additional information about a field, point to the field and click the icon.
■ To add a field to your dataset, double-click or drag the field from the Fields list to the Data Grid.
■ To create a criteria filter, drag a field from the Fields list to the Criteria Builder above the Data Grid.
Important: When you add fields from related record types to the Data Grid or use fields fromrelated record types to create criteria filters, the record type is joined to the dataset. Depending onthe relationship between the related record type and the root record type of the dataset, certainjoins can have unexpected results such as data duplication. If joining record types is a new conceptfor you, see Guidelines for Joining Record Types in SuiteAnalytics Workbook for more information.
6 Criteria Builder — The Criteria Builder displays the criteria filters you have created for the dataset in the orderthat they are applied to the Data Grid, as well as the operators that connect them. For example, the filters“Cleared is true AND Status any of Open, Paid In Full” means the values of the Cleared field are evaluated first,followed by the values of the Status field.
Criteria filters refine your dataset query results and are automatically propagated to any workbooks that arebased on the dataset. For example, if you create a criteria filter to remove all invoices from your dataset, invoicedata is also removed from any pivot tables or charts in the connected workbooks.
You can add filters to the Criteria Builder by dragging fields from the Fields list to the builder, then settingthe specific filter conditions in the Filter window. For more information, see Dataset Criteria Filters. Within theCriteria Builder, you can perform the following actions:
■ To edit a filter, click the name of the filter.
■ To delete a filter, point to the filter and click the Delete icon.
■ To change the order of the filters, point to the filter you want to move and click the arrows.
■ To create a group of filters, click New Group. For more information about grouping filters, see GroupingFilters.
■ To change the operator between individual or grouped filters, click AND or OR and select a differentoperator from the popup window.
■ To see where a field is located in the Fields list, point to the associated filter, click the Menu icon and selectShow Location in Field List.
■ To reset your criteria filters, click Reset Criteria.
■ To hide the Criteria Builder and expand the Data Grid, click the arrow next to the criteria summary.
7 Data Grid — Your dataset query results are displayed in the Data Grid. By default, the grid displays preselectedfields based on the root record type selected for the dataset. You can add fields to the grid by double-clickingthem on the Fields list, or dragging them to the grid. The number of rows displayed on each page of the gridis based on the Number of Rows in List Segments setting in your NetSuite user preferences, to a maximumof 500 rows per page. Only fields that are included on the grid can be used in workbook components that arebased on the dataset. On the grid itself, you can perform the following actions:
■ To sort the values displayed in the grid, click the Field Menu icon in the column header and select SortAscending, Sort Descending, or Edit Sort... to apply advanced sorting to the grid.
For more information, see Advanced Sorting Options.
■ To filter the values that are displayed in the grid, click the Field Menu icon next to the field you want toapply the filter to and select Filter... from the dropdown list. The filter window appears with up to four types
SuiteAnalytics Workbook

Dataset Tab 94
of filters you can set depending on the values of the field. For more information about the Filter window, seeFilter Types.
Note: Filter conditions and sorting options set up on the Data Grid only impact the values thatare displayed in the grid itself and do not affect field values any connected workbooks. If you wantto change your dataset query results and any associated workbooks, you must set up criteria filtersusing the Criteria Builder above the Data Grid. For more information, see Dataset Criteria Filters.
■ If there is a hierarchical column in the grid, click the Field Menu icon next to it and select Show Hierarchyto display the values of the field as a full hierarchy. For more information, see Hierarchical Fields.
■ To move a column, drag the column header to the desired location. Alternatively, click the Field Menu icon next to the column you want to move and select a move option from the list.
■ To remove a column from the grid, click the Field Menu icon next to the column you want to delete andselect Remove Column.
■ To rename a column, click the Field Menu icon next to the field column and select Rename....
■ To change the width of a column, drag the right boundary of the column header until it is as wide as youwant.
■ To view the records associated to any links displayed in the grid, click the link. The corresponding NetSuiterecord opens in a new browser tab.
■ To view different pages, click the arrows at the bottom of the grid.
■ To view a summary of the values for any column in the grid, click the column header. The summary isdisplayed at the bottom of the grid.
■ To see where a field is located in the Records and Fields lists, click the Field Menu icon and select ShowLocation in Field List.
8 Create New Workbook/ Apply to Workbook — Click Create New Workbook to create a workbook based onthe current dataset. If you accessed the dataset from within an existing workbook, click Apply to Workbookto apply your dataset changes to the workbook components before saving them. This feature enables you topreview the impact that your dataset changes will have before saving the connected workbook.
9 Export — Export the data presented in the Data Grid to a CSV file. To use this feature, you must have the ExportLists permission.
10 Share — Share your dataset with individual users or roles. For more information about sharing, see Accessingand Sharing Workbooks and Datasets
11 Save — Save your dataset, including any joined record types, custom formula fields, or criteria filters. If you donot own the dataset you are working in, you must save a copy of the dataset using the Save As function.
Table TabThe Table tab is where you can explore your dataset query results without altering the source data of anyassociated workbooks and without having to set a layout. Any fields that are included in the underlyingdataset appear in the Dataset Panel on the left. To build your table, drag fields from the Dataset Panel tothe Viewer.
You can create multiple table views in a single workbook using the dataset query results.
For information about how to explore your data in a table view, see Workbook Table Views.
The elements of the Table View tab are identified in the image below:
SuiteAnalytics Workbook

Table Tab 95
1 Workbook Information — Click to view or edit the workbook name, description, or internal ID. This informationis available from anywhere within the workbook.
2 Undo, Redo, and Refresh — Undo or redo your latest edits, and refresh the data in the workbook componentyou are currently working in. Keep in mind that the undo and redo options apply to any action within theworkbook and not just the current tab you are working in. For more information about data refreshing, see DataRefresh in SuiteAnalytics Workbook.
3 Add — Click the add icon to add a new workbook component.
4 Dataset Panel — The leftmost area of any workbook component, the Dataset Panel contains all of the fieldsincluded in the underlying dataset that is connected to the workbook. To build a workbook component, dragfields from the Dataset Panel to the Layout Panel or the Table Viewer. You can also access and edit the underlyingdataset using the dataset link at the top of the panel.
■ To view additional information about a field, point to the field and click the icon.
■ To collapse the Dataset Panel and expand the Viewer, click the double arrows .
5 Export — Click this icon to export a CSV file of the table.
6 Table Viewer — The Table Viewer displays your table automatically after you add the fields. In the Table Vieweritself, you can customize the appearance of the columns, and sort and filter your data.
■ To customize the appearance of the your table, you can perform the following actions:
□ To rename a field, click the Field Menu icon and select Rename....
Note: The change applies to the column name of the selected table view only.
□ To change the order of the columns, drag them to the desired position or click the Field Menu icon andselect one of the move options.
□ To remove unwanted columns, click the Field Menu icon in the column header that you want to remove,and then select Remove Column.
SuiteAnalytics Workbook

Table Tab 96
■ To filter and sort your data, click the Field Menu icon next to the field you want and then perform thefollowing actions as needed:
□ To apply the default sorting options to the table, select Ascending or Descending.
□ To apply advanced sorting options, select Add Sort.... For more information, see Advanced SortingOptions.
□ To filter your data, select Filter... and then define the filtering conditions. For more information, see Value-based Filters.
7 Navigation Panel — Displays the number of rows shown in your table view and lets you navigate through thedifferent pages.
To view different pages, click the arrows at the bottom of the viewer.
8 Last Updated — Displays when the data in the current workbook component was last updated. To retrieve thelatest results, click the Refresh icon.
For more information, see Data Refresh in SuiteAnalytics Workbook.
9 Workbook Menu — This menu is available from within all workbook components.
■ Click Share to share the workbook and the underlying dataset with other users in your account.
For more information, see Accessing and Sharing Workbooks and Datasets
■ Click Save to save your workbook, including all selections made on the Table, Pivot, and Chart tabs. You canonly save your workbook if the underlying dataset has also been saved. If you do not own the underlyingdataset, save a copy using a different name.
Pivot TabThe Pivot tab is where you pivot your dataset query results. Any fields that are included in the underlyingdataset appear in the Dataset Panel on the left. To build your pivot table, drag fields from the DatasetPanel to the Layout panel, then click the Refresh icon . The generated pivot table is displayed in thePivot Table Viewer on the right.
You can create multiple pivot tables using the same dataset query results.
For information about how to use the Pivot tab to pivot your dataset query results, see Creating aWorkbook.
The elements of the Pivot tab are identified in the image below:
SuiteAnalytics Workbook

Pivot Tab 97
1 Workbook Information — Click to view or edit the workbook name, description, or internal ID. This informationis available from anywhere within the workbook.
2 Undo, Redo, and Refresh — Undo or redo your latest edits, and refresh the data in the workbook componentyou are currently working in. Keep in mind that the undo and redo options apply to any action within theworkbook and not just the current tab you are working in. For more information about data refreshing, see DataRefresh in SuiteAnalytics Workbook.
3 Add — Click the add icon to add a new workbook component.
4 Dataset Panel — The leftmost area of any workbook component, the Dataset Panel contains all of the fieldsincluded in the underlying dataset that is connected to the workbook. To build a workbook component, dragfields from the Dataset Panel to the Layout Panel or the Viewer. You can also access and edit the underlyingdataset using the dataset link at the top of the panel.
■ To view additional information about a field, point to the field and click the icon.
■ To create a value-based filter, click the Field Menu icon and select Filter [Field Name] from the list.You can also create measure-based filters from the Layout panel or the Viewer. For more information, seeWorkbook Component Filters.
■ To collapse the Dataset Panel and expand the Viewer, click the double arrows .
5 Layout panel — The Layout panel displays the layout for your pivot table. For date and numeric fields, thesummary type is also displayed next to the field. Every time you make changes to your pivot table layout, youmust click the Refresh icon for the changes to take effect.
■ To add fields to the layout, drag them from the Dataset Panel to the desired section of the pivot table. Youcan define multiple fields for the same table component. For more information, see Grouping Pivot TableFields.
■ If you are in a NetSuite account with multiple currencies and your workbook contains fields with values inmultiple currencies, click the Field Menu icon next to an applicable field and select Currency... to applycurrency consolidation or conversion. You must convert values that are in multiple currencies to perform
SuiteAnalytics Workbook

Pivot Tab 98
accurate data aggregations and other types of numeric manipulation. For more information, see CurrencyConversion in Datasets and Workbooks.
■ To create a value-based filter for the table, click the Field Menu icon and select Filter [Field name]....You also create measure-based filters for the table if you select the Top 10 [Field name], Bottom 10 [Fieldname], or Filter [Field name] by options. For more information, see Workbook Component Filters.
■ To rename a field, click the Field Menu icon and select Rename....
■ To format the numeric values that are displayed in the table, click the Field Menu icon and selectFormat.... For more information, see Customizing Numeric Values.
■ To change the summary type for dates and numeric values displayed in the table, click the Field Menu icon next to an applicable field and select the preferred summary type.
■ To collapse the Layout panel and expand the Pivot Table Viewer, click the double arrows .
■ To add a grand total for a field, click the Field Menu icon and select Show Grand Total.
6 Pivot Table menu — This menu contains additional formatting options for the pivot table. The following optionsare available:
■ Totaling icon — Add totals and grand totals to your pivot table for any applicable fields. Totals for columnscan be added to the right or left of the table. Totals for rows can be added to the top or bottom.
■ Highlight Rows icon — When enabled, rows are highlighted when you point to them.
■ Highlight Columns icon — When enabled, columns are highlighted when you point to them.
■ Row Lock icon — When enabled, the top row is locked so that it remains visible while scrolling through thetable.
■ Column Lock icon — When enabled, the first column is locked so that it remains visible while scrollingthrough the table.
■ Compact Mode icon — If you define multiple fields as rows or add a multi-column hierarchy to your table,turn on compact mode to condense the fields into a single column.
7 Pivot Table filter summary — Displays a summary of the filter conditions applied to the pivot table. Filterconditions created on the Pivot tab only affect the data displayed in the pivot table and do not change workbooksource data.
8 Pivot Table Viewer — The Pivot Table Viewer displays your generated pivot table after updating the layout andclicking the Refresh icon. As an alternative to dragging fields to the Layout panel to construct your table, youcan add them directly to the Pivot Table Viewer.
In the Pivot Table Viewer itself, you can perform the following actions:
■ To resize a column or row, drag one of the column or row boundaries until it is the size you want.
■ To change the width of a column based on its values, double-click the column header.
■ To add a total for a column or row, click the Field Menu icon and select Show Grand Total.
■ To create a measure-based filter for the table, click the Field Menu icon and select Top 10 [Field name],Bottom 10 [Field name], or Filter [Field name].
■ To create a value-based filter for the table, click the Field Menu icon and select Filter [Field Name]....
For more information, see Workbook Component Filters.
■ To rename a field, click the Field Menu icon and select Rename... from the list.
■ To apply sorting to the table, click the Field Menu icon and select Sort A to Z, Sort Z to A, or Sort [Fieldname...].
9 Last updated — Displays when the data in the table was last updated. Keep in mind that this does notnecessarily correspond to the time of the last refresh, since the table might have been refreshed using cacheddata. To retrieve the latest results, click the Menu icon next to the date, select Clear cache, then refresh thetable.
SuiteAnalytics Workbook

Pivot Tab 99
For more information, see Data Refresh in SuiteAnalytics Workbook.
10 Workbook Menu — This menu is available from within all workbook components.
■ Click Share to share the workbook and the underlying dataset with other users in your account.
For more information, see Accessing and Sharing Workbooks and Datasets
■ Click Save to save your workbook, including all selections made on the Table, Pivot, and Chart tabs. You canonly save your workbook if the underlying dataset has also been saved. If you do not own the underlyingdataset, save a copy using a different name.
Chart TabThe Chart tab is where you create visualizations of your dataset query results. Any fields that are includedin the underlying dataset appear in the Dataset Panel on the left. To build your chart, drag fields from theDataset Panel to the Layout panel, then click the Refresh icon . The generated chart is displayed in theviewer on the right.
You can create multiple charts using the same dataset query results.
For information about how to use the Chart tab to create a chart with your dataset query results, seeWorkbook Charts.
The elements of the Chart tab are identified in the image below:
1 Workbook Information — Click to view or edit the workbook name, description, or internal ID. This informationis available from anywhere within the workbook.
2 Undo, Redo, and Refresh — Undo or redo your latest edits, and refresh the data in the workbook componentyou are currently working in. Keep in mind that the undo and redo options apply to any action within theworkbook and not just the current tab you are working in. For more information about data refreshing, see DataRefresh in SuiteAnalytics Workbook.
SuiteAnalytics Workbook

Chart Tab 100
3 Add — Click the add icon to add a new workbook component.
4 Dataset Panel — The leftmost area of any workbook component, the Dataset Panel contains all of the fieldsincluded in the underlying dataset that is connected to the workbook. To build a workbook component, dragfields from the Dataset Panel to the Layout Panel or the Viewer. You can also access and edit the underlyingdataset using the dataset link at the top of the panel.
■ To view additional information about a field, point to the field and click the icon.
■ To create a value-based filter, click the Field Menu icon and select Filter [Field Name] from the list.You can also create measure-based filters from the Layout panel or the Viewer. For more information, seeWorkbook Component Filters.
■ To collapse the Dataset Panel and expand the Viewer, click the double arrows .
5 Layout panel — The Layout panel displays the layout for your chart. For date and numeric fields, the summarytype is also displayed next to the field. Every time you make changes to your chart layout, you must click theRefresh icon in the Workbook menu for the changes to take effect.
■ To select a chart type, click the chart type link and select an option from the menu. The following options areavailable:
□ Column Chart
□ Bar Chart
□ Area Chart
□ Line Chart
□ Stacked Column Chart
□ Stacked Bar Chart
□ Stacked Area Chart
For more information, see Chart Types.
■ To display the measures in the chart as a percentage of the totals for each record, click Show percentage.You can show percentages for stacked charts only.
■ To add fields to the layout, drag them from the Dataset Panel to the desired section of the chart. As withpivot tables, you can also group multiple fields in the same chart component to change the granularity ofinformation displayed in the chart. For more information, see Grouping Pivot Table Fields.
■ If you are in a NetSuite account with multiple currencies and your workbook contains fields with values inmultiple currencies, click the Field Menu icon next to an applicable field and select Currency... to applycurrency consolidation or conversion. You must convert values that are in multiple currencies to performaccurate data aggregations and other types of numeric manipulation. For more information, see CurrencyConversion in Datasets and Workbooks.
■ To create a value-based filter for the chart, click the Field Menu icon and select Filter [Field name].... Youcan also create measure-based filters for the chart if you select the Top 10 [Field name], Bottom 10 [Fieldname], or Filter [Field name] by options. For more information, see Workbook Component Filters.
■ To rename a field, click the Field Menu icon and select Rename....
■ To format the numeric values that are displayed in the chart, click the Field Menu icon and selectFormat.... For more information, see Customizing Numeric Values.
■ To change the summary type for dates and numeric values displayed in the table, click the Field Menu icon next to an applicable field and select the preferred summary type.
■ To change the summary type of a field, click the Field Menu icon and select the preferred summary type.
■ To create a title and subtitle for the chart or to add labels for the X and Y axes, click the Properties subtaband complete the appropriate fields.
■ To collapse the Layout panel and expand the Chart Viewer, click the double arrows .
6 Chart menu — This menu contains additional options for the chart displayed in the viewer. The followingoptions are available:
SuiteAnalytics Workbook

Chart Tab 101
■ Print — Print the chart currently displayed in the viewer.
■ Export — Export an SVG file of the chart currently displayed in the viewer.
7 Chart filter summary — Displays a summary of the filter conditions applied to the chart. Filter conditionscreated on the Chart tab only affect the data displayed in the chart and do not change workbook source data.
8 Chart Viewer — The Chart Viewer displays your generated chart after updating the layout and clicking theRefresh icon.
In the Chart Viewer itself, you can perform the following actions:
■ To view the exacts amounts for a specific measure, point to the desired bar or data point in the chart.
■ To hide specific data points in the chart, click the corresponding color in the legend below the chart.
9 Last updated — Displays when the data in the chart was last updated. Keep in mind that this does notnecessarily correspond to the time of the last refresh, since the table might have been refreshed using cacheddata. To retrieve the latest results, click the Menu icon next to the date, select Clear cache, then refresh thetable.
For more information, see Data Refresh in SuiteAnalytics Workbook.
10 Workbook Menu — This menu is available from within all workbook components.
■ Click Share to share the workbook and the underlying dataset with other users in your account.
For more information, see Accessing and Sharing Workbooks and Datasets
■ Click Save to save your workbook, including all selections made on the Table, Pivot, and Chart tabs. You canonly save your workbook if the underlying dataset has also been saved. If you do not own the underlyingdataset, save a copy using a different name.
SuiteAnalytics Workbook