Embed Size (px)
Citation preview

Sugar-sweetened beverages and their
association with obesity in South Asian children
by
Jasmine Parmar
B.Sc. (Honours), University of Victoria, 2010
Thesis Submitted in Partial Fulfillment of the
Requirements for the Degree of
Master of Science
in the
Department of Biomedical Physiology and Kinesiology
Faculty of Science
Jasmine Parmar 2014
SIMON FRASER UNIVERSITY
FALL 2014

ii
Approval
Name:
Jasmine Parmar
Degree:
Master of Science (Biomedical Physiology and Kinesiology)
Title of Thesis:
Sugar-sweetened beverages and their relationship with obesity in South Asian children
Chair: Dr. Allan Davis Examining Committee:
Dr. Scott Lear Senior Supervisor Professor
Dr. Constadina Panagiotopoulos Supervisor Clinical Professor, Department of Pediatrics, University of British Columbia
Dr. Charlotte Waddell Supervisor Professor
Dr. Jean-Pierre Chanoine External Examiner Clinical Professor, Department of Pediatrics, University of British Columbia
Date Defended/Approved:
September 4, 2014

iii
Partial Copyright License
iv
Ethics Statement

v
Abstract
The prevalence of obesity among South Asian (SA) children is increasing in
comparison to their ethnic counterparts. This is of great concern given that SA adults
have a greater predisposition to cardiovascular disease and type II diabetes. This
increase in obesity may be further exacerbated by the adoption of ‘Westernized’ lifestyle
behaviours such as dietary changes. Over the past fifty years, consumption of sugar
sweetened beverages (SSBs) has dramatically increased to high levels which have led
SSBs to become highly scrutinized as a major contributor to the rise in childhood
obesity. Evidence suggests the consumption of SSBs is associated with a rise in body
mass index (BMI) in young children and adolescents. It is unknown whether this effect is
exacerbated in specific populations at high risk of obesity, such as SA children. For this
investigation a total of 363 SA children enrolled in grades 2 and 3 were randomly
recruited from communities in Vancouver, British Columbia and Hamilton, Ontario.
Children were evaluated using the RICH LEGACY Questionnaire that included a
comprehensive assessment of the child’s lifestyle and physical measures. Independent
multiple linear regression models adjusted for age and sex displayed an association
between consumption of SSBs with z-BMI (p=0.02) but not with waist circumference
(WC) (p=0.35) and waist to height ratio (W:Ht) (p=0.86). Diet beverages were not
associated to z-BMI, WC or W:Ht (p=0.43, 0.46, 0.43, respectively). This new evidence
is key in shaping future public health policies and interventions aimed at reducing the
prevalence of childhood obesity.
Keywords: sugar-sweetened beverages; SSB; childhood obesity; South Asian children; Indian children; diet risk factors

vi
This thesis is dedicated to the memory of my
beloved late grandfather, Sarwan Singh Pawar.
My academic journey is inspired by his
unconditional love, encouragement and support
for the pursuit of higher education.

vii
Acknowledgements
First and foremost, I would like to thank Dr. Scott Lear for his supervision during my
graduate studies. I thoroughly appreciate his mentorship and guidance, which extended
beyond his responsibilities as my academic supervisor.
I would like to acknowledge the members of my committee, Dr. Charlotte Waddell
and Dr. Constadina Panagiotopoulos whom generously given their time and guidance to
better my research.
I feel blessed to be surrounded by people in my personal and professional life who
have given me the strength to reach for the stars and find my full potential. I express my
sincerest gratitude to my colleagues in the CoHeaRT lab for the endless conversations and
laughs during my academic endeavours. I would like to thank the other students, staff and
instructors I met along my journey that gave me kind words of encouragement throughout
my graduate studies. To my family and friends, thank you for your encouragement and
support when times were difficult. A special thank you to my parents and siblings for their
unconditional love and support to help me through this entire experience.

viii
Table of Contents
APPROVAL .................................................................................................................................................. II
PARTIAL COPYRIGHT LICENSE .............................................................................................................. III
ETHICS STATEMENT ................................................................................................................................ IV
ABSTRACT .................................................................................................................................................. V
DEDICATION.............................................................................................................................................. VI
ACKNOWLEDGEMENTS .......................................................................................................................... VII
TABLE OF CONTENTS ........................................................................................................................... VIII
LIST OF TABLES ......................................................................................................................................... X
LIST OF FIGURES ....................................................................................................................................... X
LIST OF ACRONYMS ................................................................................................................................. XI
1.1. OBESITY ......................................................................................................................................... 1
1.1.1. Epidemiology ........................................................................................................................... 1
1.1.1.1. Measuring childhood obesity ........................................................................................ 1
1.1.1.2. Prevalence of childhood obesity .................................................................................. 5
1.1.1.3. Economic burden of obesity .......................................................................................... 6
1.1.2. Prevalence of obesity in South Asian children .......................................................... 6
1.1.3. Increased risk of obesity in South Asian children ................................................... 7
1.1.4. Determinants of childhood obesity ................................................................................ 8
1.1.5. Health consequences of childhood obesity ............................................................... 10
1.2. DIET ............................................................................................................................................ 12
1.2.1. Nutrition and obesity ......................................................................................................... 12
1.2.2. Sugar-sweetened beverages............................................................................................ 12
1.2.3. Consumption trends of sugar-sweetened beverages ........................................... 13
1.2.4. Effect of diet beverages on obesity ............................................................................... 14
CHAPTER 2. RATIONALE ..................................................................................................... 16
CHAPTER 3. RESEARCH DESIGN AND METHODS ........................................................ 17
3.1. RESEARCH DESIGN ................................................................................................................... 17
3.1.1. Hypothesis ............................................................................................................................... 17
3.1.2. Specific Aims ........................................................................................................................... 18

ix
3.1.3. Study Population .................................................................................................................. 18
3.1.4. Inclusion and Exclusion Criteria ................................................................................... 18
3.2. METHOD OF ASSESSMENTS ..................................................................................................... 19
3.2.1. Recruitment Strategy ......................................................................................................... 19
3.2.2. Data Collection ...................................................................................................................... 20
3.2.3. Assessment of Sugar-Sweetened Beverage Intake ............................................... 21
3.2.4. Ethical Considerations ....................................................................................................... 22
3.2.5. Direct Role in Study ............................................................................................................. 22
CHAPTER 4. ANALYSIS ......................................................................................................... 24
4.1.1. Sample Size Determination ............................................................................................. 24
4.1.2. Statistical analysis ............................................................................................................... 24
CHAPTER 5. RESULTS ........................................................................................................... 26
5.1. DEMOGRAPHIC AND DESCRIPTIVE CHARACTERISTICS ....................................................... 26
5.2. PRIMARY ANALYSIS .................................................................................................................. 32
5.3. SECONDARY ANALYSIS ............................................................................................................. 33
CHAPTER 6. DISCUSSION ..................................................................................................... 35
6.1. SUMMARY OF MAJOR FINDINGS ............................................................................................. 35
6.2. DEMOGRAPHIC AND DESCRIPTIVE CHARACTERISTICS ....................................................... 36
6.3. SUGAR-SWEETENED BEVERAGE ANALYSIS .......................................................................... 37
6.3.1. Primary Analysis .................................................................................................................. 37
6.3.2. Secondary Analysis .............................................................................................................. 40
6.4. IMPLICATIONS ........................................................................................................................... 41
6.5. STUDY STRENGTHS AND LIMITATIONS ................................................................................. 42
6.6. KNOWLEDGE TRANSLATION ................................................................................................... 43
6.7. CONCLUSION AND FUTURE DIRECTIONS .............................................................................. 43
REFERENCES............................................................................................................................. 44
APPENDIX A: CONSENT FORMS ........................................................................................................... 54
APPENDIX B: RICH LEGACY QUESTIONNAIRE ............................................................................... 63
APPENDIX C: SECONDARY BEVERAGE QUESTIONNAIRE ................................................................. 82
APPENDIX D: PARTICIPANT REPORT LETTER .................................................................................. 84

x
List of Tables
Table 1. Definitions of childhood obesity ......................................................................................... 2
Table 2. Demographic and descriptive characteristics of study population stratified by location (n=363) ........................................................................................... 27
Table 3. Demographic and descriptive characteristics of study population stratified by BMI status (n=363) ..................................................................................... 29
Table 4. Demographic and descriptive characteristics of study population stratified by gender (n=363) ............................................................................................. 31
Table 5. Regression models adjusted for age and sex using anthropometric measures as dependent variables ................................................................................... 33
Table 6. Beverage intake in Vancouver population (n=36) ................................................... 33
List of Figures
Figure 1. WHO growth curves for boys aged 2-19 years old ...................................................... 3
Figure 2. WHO growth curves for girls aged 2-19 years old ...................................................... 4
Figure 3. Causal model of obesity ....................................................................................................... 10
Figure 4. Bivariate correlation between total SSB consumption (log transformed) and zBMI (R2=0.016, p=0.46) ............................................................... 30

xi
List of Acronyms
BMI Body mass index
CAC Community advisory committee
CDC Center for Disease Control
CHMS Canadian Health Measures Survey
CVD Cardiovascular disease
DBP Diastolic blood pressure
DEXA Dual-energy X-Ray absorptiometry
DRS Dietary risk score
FFQ Food frequency questionnaire
GL Glycemic load
HDL High-density lipoproteins
HFCS High-fructose corn syrup
IOTF International Obesity Task Force
LDL Low-density lipoproteins
NHANES National Health and Nutritional Examination Survey
NSCH National Survey of Children’s Health
RICH LEGACY Research in International Cardiovascular Health: Lifestyles, Environments and Genetic attributes in Children and Youth
SBP Systolic blood pressure
SES Socioeconomic status
SSB Sugar-sweetened beverage
Term Initial components of the term
USDA US Department of Agriculture
WC Waist circumference
WHO World Health Organization
1
1.1. Obesity
1.1.1. Epidemiology
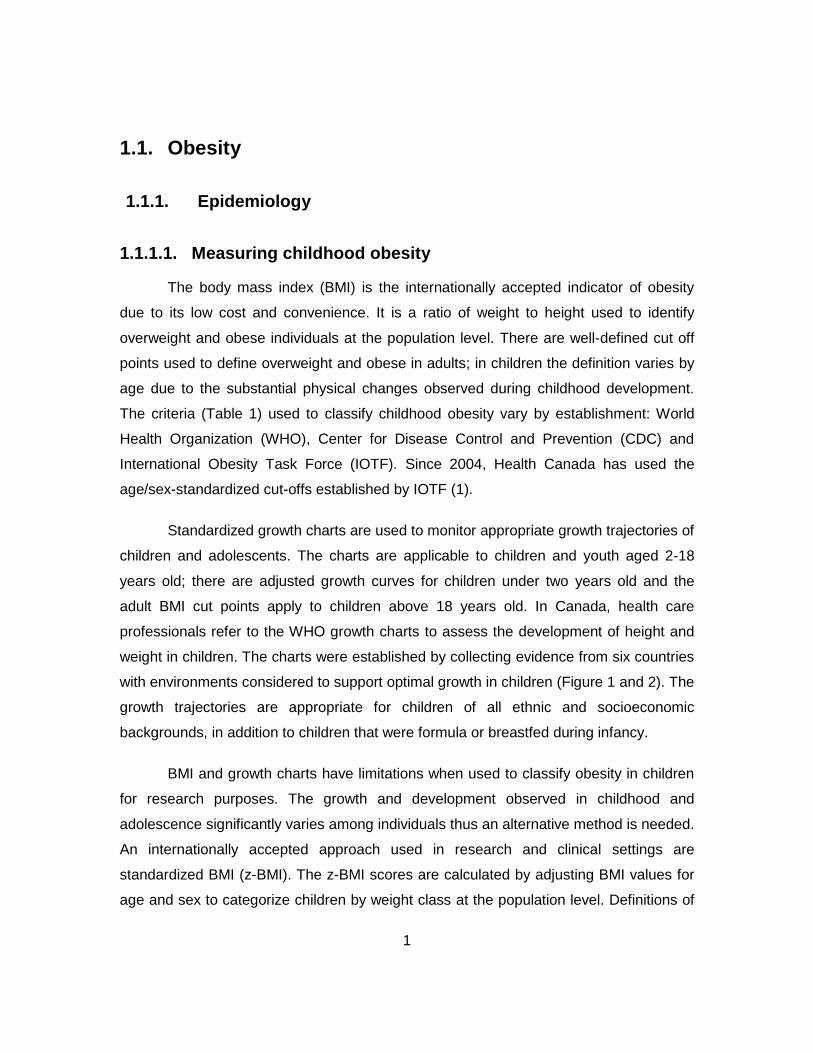
1.1.1.1. Measuring childhood obesity
The body mass index (BMI) is the internationally accepted indicator of obesity
due to its low cost and convenience. It is a ratio of weight to height used to identify
overweight and obese individuals at the population level. There are well-defined cut off
points used to define overweight and obese in adults; in children the definition varies by
age due to the substantial physical changes observed during childhood development.
The criteria (Table 1) used to classify childhood obesity vary by establishment: World
Health Organization (WHO), Center for Disease Control and Prevention (CDC) and
International Obesity Task Force (IOTF). Since 2004, Health Canada has used the
age/sex-standardized cut-offs established by IOTF (1).
Standardized growth charts are used to monitor appropriate growth trajectories of
children and adolescents. The charts are applicable to children and youth aged 2-18
years old; there are adjusted growth curves for children under two years old and the
adult BMI cut points apply to children above 18 years old. In Canada, health care
professionals refer to the WHO growth charts to assess the development of height and
weight in children. The charts were established by collecting evidence from six countries
with environments considered to support optimal growth in children (Figure 1 and 2). The
growth trajectories are appropriate for children of all ethnic and socioeconomic
backgrounds, in addition to children that were formula or breastfed during infancy.
BMI and growth charts have limitations when used to classify obesity in children
for research purposes. The growth and development observed in childhood and
adolescence significantly varies among individuals thus an alternative method is needed.
An internationally accepted approach used in research and clinical settings are
standardized BMI (z-BMI). The z-BMI scores are calculated by adjusting BMI values for
age and sex to categorize children by weight class at the population level. Definitions of

2
weight categories are outlined by WHO as described in table 1 (e.g. a child with normal
weight would have a z-BMI score of (-2) – 1, inclusive.
Table 1. Definitions of childhood obesity
Organization Definition
World Health
Organization (2)
WHO Reference 2007 (ages 5 to 19)
Obese: BMI >2 standard deviations above the WHO growth standard median
Overweight: BMI >1 standard deviations above the WHO growth standard median
Underweight: BMI <2 standard deviations below the WHO growth standard median
US Center for Disease
Control and Prevention
(2)
CDC growth charts (ages 2 to 19)
BMI is assessed by age and sex specific percentiles:
Obese: BMI >95th percentile
Overweight: BMI >85th percentile and <95th percentile
Normal weight: BMI >5th percentile and <85th percentile
Underweight: BMI <5th percentile
International Obesity
Task Force (3)
Provides international BMI cut points by age and sex for overweight and obesity for children age 2 to 18
The cut points correspond to an adult BMI of 25 (overweight) or 30 (obesity)

3
Figure 1. WHO growth curves for boys aged 2-19 years old

4
Figure 2. WHO growth curves for girls aged 2-19 years old
5
1.1.1.2. Prevalence of childhood obesity
Childhood obesity has become an epidemic according to emerging evidence
from global data trends. It is estimated that 155 million or one in 10 school-age children
are classified as overweight or obese. The prevalence of childhood obesity is highest -
close to 20-40% of the population - in developed regions, such as Europe and the
Americas (4). Approximately 40 million children under the age of five are overweight;
close to 30 million overweight children reside in developing nations (5). Newly
industrialized areas in countries such as Brazil, Chile, Mexico and Egypt have
experienced a dramatic shift from underweight to overweight in children and
adolescents. The lowest prevalence of childhood obesity is seen in parts of Southeast
Asia and South Africa, whereas South America and Central America, the Middle East
and North Africa display moderate trends (6).
The Canadian Health Measures Survey (CHMS) from 2009-2011 identified 17%
of children and youth aged 2-18 years old as overweight; 7% of those children were
classified as obese (7). Similar estimates were reported by the CDC in the US, with
approximately 17% of children and youth classified as overweight or obese in 2009-2010
(8). These estimates have not changed significantly from previous years; however, more
data are needed to determine if prevalence is increasing or stabilized (1). Also, there is
limited information regarding the prevalence of obesity in minority groups in Canada.
Reports examined differences between children of various ethnic groups within Canada
reported prevalence of overweight/obesity were similar in Caucasian and Black children
at 26% and 29%, with lower rates (18%) observed in Southeast/East Asian children (9).
An emerging public health concern is increasing prevalence of childhood obesity
in countries previously associated with low rates of obesity (4). Research has
demonstrated many low- and middle-income countries now face a double burden —
battling rising obesity trends while attempting to reduce rates of malnutrition and
communicable diseases (5). A clear shift from malnutrition to over-nutrition in children
residing in India, Brazil and China has occurred over two to six decades, respectively
(6). Furthermore, within developing nations there are disparities in the prevalence of
obesity across urban and rural populations. These changes were more pronounced in

6
populations residing in urban rather than rural populations in these countries (6, 10). A
possible explanation is likely due to gains in economic prosperity, which have led to
urbanization and the adoption of western lifestyles similar to those from higher
socioeconomic backgrounds.
1.1.1.3. Economic burden of obesity
The high incidence of adult and childhood obesity has profound financial
implications on the health care system. Measures of the cost of obesity include both the
direct and indirect costs to the health care system. An investigation of eight chronic
diseases associated with obesity reported the total health care costs due to obesity in
Canada rose from $3.9 to $4.6 billion from 2000-2008 (11). Another study, using
comparable methodology and investigating 18 obesity-related chronic diseases,
estimated the economic cost of obesity to be $7.1 billion (2006 dollars) (12). In Canada
there is limited literature regarding the direct costs of childhood obesity on the health
care system. A Canadian study found the effect of obesity on physician costs was not
different between normal weight adolescents and overweight/obese adolescents.
However, this study found strong evidence for increased physician costs associated with
age; compared with normal weight groups, costs were 5.3% higher for obese young
adults (18-39 years old), 7.0% higher for obese middle-aged adults (40-59 years old)
and 28.3% higher for obese older adults (60+ years old) (13). These results suggest that
age is associated with increasing physician costs for obese individuals, likely due to the
development of obesity-related health consequences. Therefore childhood obesity may
not have direct, but an indirect economic burden on the health care system long term.
1.1.2. Prevalence of obesity in South Asian children
The emerging dual burden of obesity and malnutrition are significant health
problems affecting youth in India (14). In Indian children, prevalence of overweight has
been reported to range from 9-27.5% and that of obesity from 1-12.9% (15, 16). There
are increasing amounts of cross-sectional data to confirm the increasing prevalence of
obesity in children and adolescents are localized to urban regions of India (17-20). In

7
Delhi, current estimates of children and young adolescents classified as overweight
range from 22–25% and those suffering from obesity is approximately 2–6% (21).
Due to immigration, there are extensive South Asian communities emerging
outside of India in western countries, most prominently Canada, UK and US. An
investigation of approximately 5600 ethnically diverse school children residing in the UK
found the odds of being overweight in Pakistani and Indian boys were about 1.3 to 1.5
times higher compared to their ethnic counterparts (22). The same study reported
Pakistani girls to be 1.7 times more likely to be obese than their ethnic counterparts;
however, Indian girls were less likely to be obese (odds ratio 0.39) (22). The Canadian
Community Health Survey of 2004 reported 18% of Southeast Asian children under the
age of 18 years to be overweight or obese (9). Exclusive data in the US on South
Asians is limited as Black, Hispanic and non-Hispanic white populations are the most
prevalent ethnic groups. The 2007 National Survey of Children’s Health (NSCH)
reported 18% of Asians aged 10-17 years old to be overweight and 9% to be obese
(23).
1.1.3. Increased risk of obesity in South Asian children
Evidence indicates that South Asian adults experience cardiovascular disease
(CVD) and type 2 diabetes 5-10 years earlier in comparison to individuals of other
ethnicities (24). Metabolic consequences in South Asian adults may differ than their
European counterparts due to their higher rates of central adiposity and insulin
resistance (25, 26). These metabolic consequences arise due to the differential
accumulation of visceral adipose tissue (27). South Asians exhibit a unique “thin-fat”
phenotype that leads to increasing amounts of visceral adipose tissue coupled with a
lower lean mass (28). This altered body composition is associated with the increased
risk of CVD and type 2 diabetes seen in South Asian adults.
Similar trends of central obesity and high insulin levels are observed in South
Asian adolescents (18, 29, 30). In Canada, South Asian male adolescents have the
lowest rates of obesity but displayed adverse cardio metabolic risk factors in comparison
to European adolescents; similar patterns were not observed in females (29). The

8
metabolic consequences are likely a result of the differential accumulation of visceral
adipose tissue similarly observed in South Asian adults. Nightingale et al. (31)
demonstrated UK South Asian children aged 9-10 years old had higher levels of
adiposity in comparison to European children. The authors reported BMI to be lower in
South Asian children than European children at any given fat mass. Collectively this
evidence suggests visceral adipose tissue may increase the risk of obesity and CVDs in
South Asian children.
An alternative hypothesis to explain the current obesity epidemic in India is
traditionally attributed to “thrifty” genes, which helped survival in times of nutritional
deprivation; but has become detrimental in modern times of excess food supply and
reduced physical work (32). The “thrifty” phenotype proposes chronic fetal under-
nutrition may lead to metabolic and structural changes that increase the prevalence of
risk factors associated with type 2 diabetes and CVDs later in life. Research indicates
ethnic differences in body fat composition are present at birth; South Asian infants tend
to exhibit higher amount of body fat than white infants (33). The aforementioned “thin-
fat” phenotype in adults may originate in utero and place South Asian individuals at
higher risk of developing adverse cardio metabolic risk factors before birth.
The prevalent indicator used in population-based studies to define and classify
obesity in individuals is BMI. Studies have established South Asian adults and children
display increased amounts of adiposity yet have lower levels of BMI in comparison to
other ethnic groups (34). Since BMI is an indicator of relative weight rather than
adiposity it may underestimate the prevalence of obesity in the South Asian population
due its inherent limitations (35-37). Alternative measures, such as waist circumference
(WC), may serve as a better indicator of obesity in South Asians due to their
predisposition towards central obesity.
1.1.4. Determinants of childhood obesity
At the individual level there are numerous determinants that influence the
development and progression of childhood obesity. These determinants include:
genetics, behaviour and environments, which have a potential influence on the

9
accumulation of adiposity in children (38). The model of obesity (Figure 1) outlines its
various components; however, it does not emphasize the intricacies of the origins of
obesity. Certain unmodifiable factors, such as genetics, set heritable conditions that
begin the progression of obesity from an early age (38). Genetics are a critical
component in how our bodies regulate the internal energy balance. While genetics
regulate fundamental physiological processes of the human body, environmental factors
have a significant influence on the progression of obesity.
Socioeconomic status (SES) is used to describe the social welfare and economic
well being of an individual; the definition is adapted in children as a child’s quality of life,
which is often determined by family income. SES can also be measured through a
combination of parental occupation, income or education (4). It is well known that SES
has strong correlations to obesity and other chronic conditions across all age categories
(39). In many developed countries lower SES groups have the highest levels of
overweight and the lowest levels of physical activity; adolescent girls are at highest risk
of obesity (38). However, a reverse trend is observed in developing countries where
children from urban areas are more likely to be obese than those from rural villages (4).
A higher SES background may provide access to an “obesogenic” lifestyle,
characterized by sedentary activity and consumption of Westernized foods (38).
Therefore family income, a large determinant of a child’s SES, may serve as a proxy that
influences the risk of obesity in children.
The model of obesity is based on the fundamentals of energy balance, which
requires the adequate intake of energy to sustain normal growth and development
without promoting weight gain (40). Energy balance has two critical components: energy
intake and energy expenditure. Energy expenditure refers to the energy used by the
body during physical activity, thermogenesis and basal metabolism (Figure 1). Energy
released via thermogenesis and basal metabolism varies in each individual, as they are
intrinsic characteristics unique to every individual. Of these three factors, physical
activity is modifiable and has an essential role in weight management (38). Recent
reports indicate that 9% of Canadian boys and 4% of girls achieve at least 60 minutes of
exercise at least six days a week; a greater percentage of boys (83%) and girls (73%)

10
accumulate 30 minutes of moderate exercise at least three days a week (41). On
average Canadian children and adolescents spend 62% of their waking hours consumed
in sedentary behaviours and these numbers are reported to increase with age (9).
Physical activity is significantly lower in Asian countries where children are taught to
focus on academics, which is thought to detract from involvement in sports and other
physical activities (38). Multi-ethnic population studies report South Asian adults and
children tend to have the lowest levels of physical activity (42). There is strong evidence
to support physical inactivity and increases in sedentary behaviours are linked to obesity
regardless of racial background (43).
Figure 3. Causal model of obesity
1.1.5. Health consequences of childhood obesity
Obesity is a condition marked by increased amounts of body fat as well as the
growth of excess adipocytes (44). The excess body fat has damaging effects to an
individual’s overall health and is especially detrimental in children. Children and
adolescents that are overweight and obese are at greater risk of becoming overweight

11
and obese adults. In addition, these children will face increased risks of various chronic
conditions such as: cardiovascular, endocrine, psychosocial, gastrointestinal, pulmonary
and renal diseases (45). These conditions may arise as consequences of obesity during
childhood and will become increasingly severe if left untreated into adulthood.
Childhood obesity can result in a wide spectrum of adverse health outcomes
including premature death to serious chronic conditions that reduce the overall quality of
life (44). Overweight and obese children are at high risk of type 2 diabetes, sleep
apnoea, respiratory disorders, osteoarthritis, endocrine disorders and cancers (45-47).
A cross-sectional study of children two to five years old found the overweight and obese
children had four times higher risk of becoming overweight adults than normal weight
children (48). The severity of obesity and its related health consequences will persist into
adulthood if preventative measures are not taken during early childhood.
Other metabolic risk factors associated with childhood obesity are high blood
pressure and hyperlipidemia. Signs of adiposity in early age and family history of
hypertension play critical roles in developing hypertension. In a Canadian population
based study, obese children were found to have 7.6 mmHg higher SBP than their normal
weight counterparts (49). Multiple investigations in school children found overweight and
obese children to have higher LDL and lower HDL cholesterol than their normal weight
counterparts (40). Combined these health risks can have damaging effects on the heart
as the children progress into adulthood.
The outcomes of childhood obesity are not just limited to physical health issues.
Other long-term health risks in obese children and adolescents include the development
of psychosocial and mental disorders (50). Children with higher amounts of body fat are
often viewed as “more mature” and are mistaken for being older than their chronological
age. Consequently, adults tend to have greater expectations, which can lead to
frustration or a sense of failure in this subset of children. In addition, overweight or obese
children are known to have lower self-esteem than their normal weight counterparts
(45). It is unclear whether psychosocial effects contribute to or result from obesity.

12
1.2. Diet
1.2.1. Nutrition and obesity
Nutritional intake and diet composition are crucial factors influencing energy
balance in an individual; where the deposition of body fat is the result of an overall
positive energy balance (51). The adoption of western lifestyles and urbanization across
the world has contributed to changes in nutritional intake of individuals. This economic
advancement has dramatically changed the dietary patterns of children to include
increased consumption of energy dense foods and sweetened drinks (52). Due to the
demands of modern society, children are often left unsupervised or with a caretaker for a
significant amount of time with a surfeit of food choices. Children left to make
independent decisions about dietary choices tend to replace nutrition rich foods with
those lacking nutrients but high in energy. A study conducted in children with parents
whom work outside of the home reported children will opt for energy dense, nutritional
poor foods, such as sugar sweetened beverages due to ease of accessibility and
availability (53).
1.2.2. Sugar-sweetened beverages
In recent years, attention has turned to the rising consumption of sugar-
sweetened beverages (SSBs) and their contribution to the obesity epidemic in children.
SSBs contain high amounts of sugar and are consumed more frequently than
recommended by national dietary guidelines. Examples of SSBs include soft drinks, fruit
juices (with added sugar), fruit cocktails, flavoured water, flavoured milk, energy or sport
drinks. Certain beverages are marketed as health products, which includes: low-calorie,
high-protein meal replacements, nutritional supplements providing the recommended
daily allowance of vitamins, or include caffeine or artificial sweeteners (54). Regardless
of the additional health ingredients and their benefits, the addition of sugars – even in
their natural form – can be detrimental. High sugar intake in children can lead to early
development of tooth decay, obesity or type 2 diabetes mellitus (55).

13
The prevailing mechanism of weight gain due to SSB consumption is linked to a
positive energy balance due to increases in energy intake (56). These beverages are
devoid of nutritional value while being caloric dense with an average intake of 140-150
calories and 39 grams of sugar in a 12 oz. serving, equivalent to a can of soda.
According to the USDA, a standard serving size of soda is 12 oz. although in reality fast
food outlets serve an average serving size of 23 oz. A typical serving of SSB can
contribute up to 10% greater energy intake than in non-SSB consumers (57). Following
the principles of energy balance, the additional consumption of a serving of SSB daily
(56) would amount to weight gain of five lbs. in approximately one year (56). The
consumption of liquid calories provides little satiety and does not suppress appetite thus
resulting in compensatory intake of solid foods. The continuation of such habits will lead
to weight gain due to increases in positive energy balance, which consequently leads to
the deposition of body fat (51).
An alternative, yet highly controversial mechanism proposes the differential
metabolism of fructose-containing sugars can lead to weight gain (58). The commercial
sweeteners used in SSB production are high fructose corn syrup (HFCS) and sucrose,
which is composed of equal ratios of glucose to fructose. From a physiological
perspective, glucose and fructose are differentially metabolized in the liver. Fructose
metabolism has been linked to a variety of metabolic diseases based on evidence from
epidemiological studies, animal studies and experiments involving pure fructose and
pure glucose (59).
1.2.3. Consumption trends of sugar-sweetened beverages
Over the past few decades the consumption of SSBs in children and adolescents
has doubled in North America. The American Heart Association recommends limiting
consumption to less than 450 kilocalories – the equivalent of three 12 oz. cans of soda -
per week (60). NHANES (National Health and Nutrition Examination Survey) data show
US children between the ages 2-18 years consume between 1075-1927 mL per day and
with an average intake of 228 kcals. In Canada the consumption amounts are less
however still high, averaging between 500-1000 mL per day (61). The highest

14
consumed beverages - after water - were soft drinks, whole-fat milk and juice,
respectively. In addition, the majority of SSB consumption tends to occur at home as
opposed to the school environment (62, 63). This is partly due to recent nutritional
policies adopted by schools that have led to the reduction of snacks and drinks with
added sugars in the school environment.
The 2004 Canadian Community Health Survey reported SSBs comprise 30% of
the total calorie intake for children aged 4-13 years old and 40% of a child’s total
beverage intake. The highest rates of SSB consumption are witnessed in boys and girls
aged 6-11 years old (61). Further analysis revealed increased consumption of soft
drinks, opposed to other beverages, was strongly associated to BMI (64). Another
longitudinal study conducted on the development of 170 female children residing in
central Pennsylvania assessed beverage intake every two years from age 5-15 years.
The findings revealed that consumption of soft drinks - not including milk or fruit juices -
at five years was a predictor of adiposity into adolescence (65). Ludwig et al. (57)
further confirmed the association between increased SSB consumption and obesity
through a 19-month observational study with school children aged 11-17 years old.
There is increasing evidence to support the relationship between increasing weight gain
and SSB consumption in children.
1.2.4. Effect of diet beverages on obesity
Similar to SSBs, the consumption of diet beverages has steadily increased over
the past few decades as artificial sweeteners have been used to replace high fructose
corn syrup in commercial beverages. Artificial sweeteners are potent simulators
providing 100 or more times sweetness than sugar however lack nutritional value or
energy. Five artificial sweeteners have been approved for commercial use: aspartame,
sucralose, acesulfame potassium, saccharin and neotame (66).
There is increasing interest in the role of diet beverages in obesity and CVD
management. Prospective observational studies investigating the effects of diet
beverages on weight gain display mixed results with no, positive and inverse
associations (57, 66-69) Theoretically, diet beverages can assist in weight loss through

15
decreasing total energy intake and provide similar satiation as SSBs (70). Evidence
from multiple cross-sectional studies demonstrates overweight/obese individuals are the
highest consumers of diet beverages in comparison to their normal weight counterparts.
This may be due to the incorporation of diet beverages as a low-calorie dietary
alternative for a potential weight management solution. A longitudinal study of 2294
adolescents demonstrated that regular consumption of diet beverages was associated
with adolescent weight gain over five years through dieting practices (66). It has been
previously shown dieting behaviours are consistent with weight gain in youth and adults
(71-73). Regular diet beverages consumers may experience weight gain through
increased consumption of solid foods due to the lack of satiety from diet beverages,
which inadvertently increases their energy intake leading to weight gain. These results
may further be explained by the bias imposed by the nature of cross-sectional studies,
as they cannot evaluate whether diet beverage intake leads to obesity or vice-versa. The
correlation between increased consumption of diet beverages in obese individuals is
unclear: is it that obese individuals tend incorporate diet beverage intake as a weight
management practice, or rather, that diet beverage consumption indirectly leads to
higher obesity?

16
Chapter 2. Rationale
Observations about the rising global trends of childhood obesity have been well
documented. Previous obesity interventions have aimed to reduce the number of
individuals suffering from obesity or co-morbidities; however, the focus needs to shift to
a younger demographic. There is increasing evidence to suggest the burden of obesity
is rising in younger populations, especially in South Asian children (74). As previously
mentioned, the incidence of obesity is a great burden on youth in urban India and a
growing problem for South Asians living in western countries, such as Canada.
South Asians are one of the largest and fastest growing minority populations in
Canada comprising 4% of the total population. The South Asian community in Canada is
expected to increase at a faster rate than the general population as a result of
immigration (75). In Canada, studies have shown South Asian adults have an adverse
metabolic risk profile and increased amounts of visceral adipose tissue (76). A trend in
ethnic differences for various CVD risk factors (LDL, HDL, fasting insulin, blood
pressure) are present in South Asian youth similar to those seen in South Asian adults
(77).
The cause behind these metabolic differences could be due to social and cultural
issues that are unique to South Asians, such as dietary choices and lifestyle.
Specifically, South Asians are exposed to food and beverage choices that were once
unavailable or “out of reach” which could serve as a potential explanation to increased
consumption of energy dense processed food items. Since South Asian youth have a
greater predisposition to obesity and diabetes, increased SSB consumption could further
exacerbate the risk of obesity. This study will aim to estimate the prevalence of obesity
and to investigate the dietary practices of South Asian children living in Canada.
Children with high SSB consumption patterns are expected to be in the
overweight/obese BMI category.

17
Chapter 3. Research Design and Methods
3.1. Research Design
The research conducted for this thesis is part of a larger study, RICH LEGACY
(Research in Cardiovascular Health-Lifestyles, Environment and Genetic Attributes in
Children and Youth). The larger study is a cross-sectional analysis designed to identify
characteristics affecting the cardiovascular health of South Asian children living in
Canada, urban and rural India. However for the purposes of this thesis project the
investigation will focus on South Asian children residing in Canada. Our project sites are
located in Vancouver, British Columbia and Hamilton, Ontario. Recruitment was
concentrated in Surrey, British Columbia and Brampton, Ontario due to the large
population of South Asian individuals residing in these cities as defined by census.
3.1.1. Hypothesis
Primary Hypothesis
There is a positive relationship between SSB consumption and z-BMI in South
Asian children after adjusting for confounders (age, sex, socioeconomic status, total
physical activity, dietary score and acculturation).
Secondary Hypothesis
There is a positive between SSB consumption and:
waist circumference
waist to height ratio

18
after adjustment for confounders. Additionally, specific categories of beverages (ex. soft
drinks, fruit juices, milk) will be correlated to a higher BMI in South Asian children.
3.1.2. Specific Aims
The aims of this research are to investigate the relationship between SSB
consumption and BMI in South Asian children. The children will undergo comprehensive
interviews to gather information about lifestyle characteristics and anthropometric
measurements to assess their risk of obesity.
3.1.3. Study Population
A total of 363 South Asian children were screened for study eligibility. For the
purposes of this investigation, South Asian is defined as a person with exclusive
ancestry in Bangladesh, India, Nepal, Pakistan and Sri Lanka. Ethnicity will be self-
reported by parent/guardians of children participating in the study.
3.1.4. Inclusion and Exclusion Criteria
Inclusion Criteria
Children entering or enrolled in grades two and three in public schools (age range six-nine years old, depending on date of birth)
Parents and/or children must be able to communicate in English
Parental consent and child assent is required prior to assessment
Exclusion Criteria
Unable to provide consent

19
3.2. Method of Assessments
3.2.1. Recruitment Strategy
Children were recruited through community based recruitment strategies.
Recruitment began by contacting elementary schools with high enrolments of South
Asian children. This information was made available by contacting the respective school
boards participating in the research study. Individual packages containing letters with a
description of the RICH LEGACY study and consent forms were sent to
parent/guardians of grade two and three children enrolled in participating elementary
schools. Additionally, information booths were arranged one hour prior and after school
hours to recruit parents and children on a monthly basis at various elementary schools.
An effective recruitment strategy included information sessions for parents during
weekday evenings – potentially corresponding with other school events (i.e. parent
teacher interviews, student showcase nights, etc.).
The study was also marketed to the South Asian community by advertising at
community centres (i.e. libraries), places of worship and South Asian festivals.
Advertisements were placed in South Asian newspapers and broadcasted on local
television stations. The majority of community recruitment was accomplished through
health fairs at places of worship (i.e. Sikh and Hindu temples) and South Asian festivals
(i.e. Vaisakhi). Research assistants fluent in Punjabi and Hindi were present to avoid
language barriers during recruitment. These health fairs were held in partnership with
the Heart and Stroke Foundation, which began a campaign- “Our Health is our Wealth” -
to raise awareness of hypertension and CVD in the South Asian community. During the
health fairs our research team simultaneously recruited and volunteered to provide free
cardiovascular risk profile assessments. Interested families provided their contact
information. Therefore these health fairs were beneficial to raise community awareness
of the prevalence of CVD and reaching out to families interested in participating in the
RICH LEGACY study that may have not seen previous study advertisements.
In addition, a Community Advisory Committee (CAC) was created due to the
essential support of the community required for recruitment. The committee consisted of

20
health professionals and prominent individuals from the South Asian community. The
committee provided advice on recruitment strategies, aided in study promotion and
provided community access to key organizations. The CAC is also in place to help
disseminate the results of the study into the South Asian community.
3.2.2. Data Collection
Our research team contacted families that provided contact information through
community health fairs and evening information sessions via telephone. The research
assistant scheduled an appointment for assessment if the children met the eligibility
criteria. Children were assessed in a place of convenience in their community (i.e.,
community centres, places of worship) during evenings or weekends and were asked to
bring a parent/guardian to complete the assessment. As an incentive for parents we
provided a health report outlining the results from the child’s assessment (Appendix I). A
book was provided as a gift for the children at the end of their assessment.
A trained research assistant administrated the questionnaires in the language
preferred by the families to avoid bias introduced from translation. Questionnaires were
administered to ensure accurate and thorough responses. Research assistants were
trained through simulator sessions and retrained if variation from the coordinator was
unacceptable.
Each assessment included a standardized questionnaire (Appendix II) that took
approximately one hour to complete. Standardized questionnaires were used to assess
the child’s background, medical history, nutrition, physical activity levels and
anthropometric data. Questions were asked to parent(s) and child, however if there is a
discrepancy in the answers provided the child’s answers were not used. The child’s
answer was prioritized for questions evaluating opinions on healthy behaviours or body
image satisfaction. Socio-economic status was assessed using parental education. A
food frequency questionnaire (FFQ) assessed the intake of a variety of foods and
beverages. Beverages included were: regular soft drinks, diet soft drinks and fruit juices.
The food frequency questionnaire was adapted from the INTERHEART FFQ (78), which
was shown to predict MI in an international study including adults of South Asian and

21
European descent. A dietary risk score (DRS) was generated from the FFQ (79). An
additional (secondary) beverage questionnaire was adapted from Action Schools BC
and was tailored to be culturally relevant (80). The activity questionnaire gathered
information concerning physical activity.
The physical examination includes: height, weight (for BMI calculation), waist
circumference, and blood pressure. Height was measured using a portable stadiometer
without footwear rounded to the nearest 0.1 cm. Individuals were asked to take a deep
breath before measures are taken. Weight was measured using the Tanita Ironman
body composition monitor, with minimal clothing and footwear removed. BMI was
calculated from weight in kilograms divided by height in meters squared. Waist
circumference measurement was recorded in centimetres and measures were taken
with no or minimal clothing using a measuring tape. Waist circumference was recorded
as the average of two measures taken halfway between the lower rib margin and the
iliac crest against the skin following normal exhalation. Waist circumference was
categorized as ≥90th and <90th percentile after adjusting for age and sex. Blood pressure
was assessed using the Omron HEM-711DLX blood pressure monitor with a child or
adult sized cuff (depending on child’s arm girth) placed on the left arm. Children were
seated for the entire length of the blood pressure assessment; three measures were
taken over a six-minute period with the average being recorded. Blood pressure z-
scores and percentiles were calculated and adjusted for age and sex. Children between
90-95th percentile were categorized as pre-hypertensive and >95th percentile were
categorized as hypertensive.
3.2.3. Assessment of Sugar-Sweetened Beverage Intake
As previously mentioned, the RICH LEGACY FFQ (primary questionnaire)
provides a broad overview of the weekly frequency of soft drink, fruit juice intake and diet
beverages. For the analysis, SSB refers to the inclusive intake of soft drinks and fruit
juices. A secondary questionnaire was included to assess more specific categories of
SSBs and to determine serving size intake as well. This questionnaire was administered
to the Vancouver cohort to further investigate beverage consumption patterns and

22
trends. Categories included in the secondary questionnaire include: milk based drinks
(ex. chai tea, hot chocolate), soft drinks (regular/diet), 100% fruit juice and other drinks
(e.g., sports drinks, fruit cocktails, Slurpees).
3.2.4. Ethical Considerations
A total of three consent and assent forms (Appendix I) were drafted according to
guidelines set by Simon Fraser University Research Ethics board. Consent and assent
was obtained from parents/guardians and children, respectively, prior to beginning of
assessments. Each family was provided with a copy of the consent and assent forms for
their personal records. Research assistants fluent in Hindi and Punjabi were present
during assessments to ensure language barriers were not an issue in obtaining informed
consent.
Consent was also obtained from each respective school district. After consent
was obtained from the school districts, our research team invited principals from various
schools to participate in the study. The community centres and places of worship did not
require formal consent to be obtained for use of their facilities. Our research team
approached various community centres and places of worship willing to participate in the
study. These venues did not require formal consent however we established a
consensual agreement for continual use of their facilities for our research purposes.
All information provided by parents and child was entered into a confidential and
secured database. Each child was assigned a study identification number. All forms and
results were labelled with study identification numbers and no personal identifiers to
ensure confidentiality. Only the principal investigators, project coordinators and research
assistants involved in the study have access to the complete study records.
3.2.5. Direct Role in Study
My direct role in the RICH LEGACY study involved duties such as:
Acting as the community liaison to build and maintain connections with community centers, temples and elementary schools

23
Recruitment of study participants from the community
Scheduling and performing assessments with study participants
Designing and implementation of the secondary beverage questionnaire
Training new research assistants to complete assessments

24
Chapter 4. Analysis
4.1.1. Sample Size Determination
A sample size of convenience comprised of 300 children was set based on
feasibility for this study. Standard deviations were calculated from preliminary data of
193 children. Based on the standard deviation for the frequency of SSB intake of 1.00
(units) and 1.35 for z-BMI, with power set to 80% and alpha set to 0.05, the detectable
difference was found to be 0.22. This represents the increase in z-BMI for every one unit
increase in SSB consumption. Smaller differences can be obtained if the sample size is
increased.
4.1.2. Statistical analysis
Descriptive and demographic data were stratified by sex, location and weight
class. Normally distributed continuous data are presented as means and standard
deviations. If the data are not normally distributed the variables were log transformed
and displayed as median and interquartile ranges. Categorical data were presented as
counts and frequencies. Independent t-tests and ANOVAs were performed on
continuous variables and Pearson Chi-square tests for categorical variables. Percentiles
and standardized scores were calculated for waist circumference, systolic and diastolic
blood pressure, respectively, after adjustment for age and sex (81). For study purposes,
a p-value less than or equivalent to 0.05 represents statistical significance.
The primary hypothesis was addressed by performing a bivariate correlation to
analyze the relationship between measures of obesity and SSB intake. A secondary aim
was to investigate the relationship of diet beverages with measures of obesity. Measures
of obesity include z-BMI, waist circumference and waist to height ratios. The main
dependent variable under investigation, SSB and diet beverage intake was log

25
transformed to provide a normal distribution. Data from the RICH LEGACY questionnaire
was used to assess SSB intake in terms of frequency per day. Multiple linear
regressions were performed to further analyze the data for correlations. Regression
models were adjusted for age and sex however additional co-variates were considered
in the regression models: total physical activity, dietary risk score and socio-economic
status and acculturation. The additional co-variates had little effect on the analysis
therefore were excluded from the final models. Underweight children were also excluded
from the final models.
Beverage data from the secondary survey was used to address the secondary
hypothesis. The secondary beverage data was stratified into normal and
overweight/obese weight categories; underweight children were treated as outliers and
excluded from analysis. Consumption of SSB intake is represented as millilitres per day.
Non-parametric tests were performed to differentiate consumption patterns between
normal vs. overweight/obese children. Multiple linear regression models were used to
identify which beverage categories are correlated to obesity. Each model was adjusted
for age and sex.
26
Chapter 5. Results
5.1. Demographic and Descriptive Characteristics
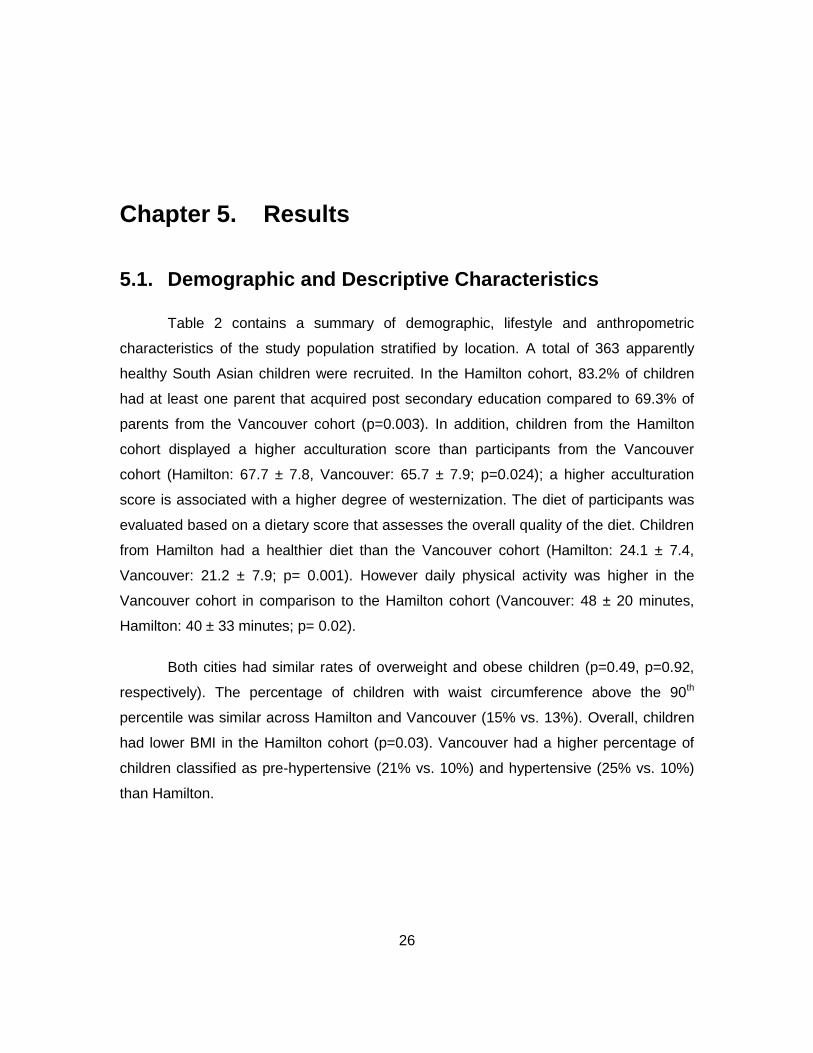
Table 2 contains a summary of demographic, lifestyle and anthropometric
characteristics of the study population stratified by location. A total of 363 apparently
healthy South Asian children were recruited. In the Hamilton cohort, 83.2% of children
had at least one parent that acquired post secondary education compared to 69.3% of
parents from the Vancouver cohort (p=0.003). In addition, children from the Hamilton
cohort displayed a higher acculturation score than participants from the Vancouver
cohort (Hamilton: 67.7 ± 7.8, Vancouver: 65.7 ± 7.9; p=0.024); a higher acculturation
score is associated with a higher degree of westernization. The diet of participants was
evaluated based on a dietary score that assesses the overall quality of the diet. Children
from Hamilton had a healthier diet than the Vancouver cohort (Hamilton: 24.1 ± 7.4,
Vancouver: 21.2 ± 7.9; p= 0.001). However daily physical activity was higher in the
Vancouver cohort in comparison to the Hamilton cohort (Vancouver: 48 ± 20 minutes,
Hamilton: 40 ± 33 minutes; p= 0.02).
Both cities had similar rates of overweight and obese children (p=0.49, p=0.92,
respectively). The percentage of children with waist circumference above the 90th
percentile was similar across Hamilton and Vancouver (15% vs. 13%). Overall, children
had lower BMI in the Hamilton cohort (p=0.03). Vancouver had a higher percentage of
children classified as pre-hypertensive (21% vs. 10%) and hypertensive (25% vs. 10%)
than Hamilton.

27
Table 2. Demographic and descriptive characteristics of study population stratified by location (n=363)
Variables Hamilton
(n=262)
Vancouver
(n=101) p
Age (years) 7.8 ± 0.6 8.3 ± 0.9 < 0.001
Female (%) 49 51 0.54
Education
One parent attends post-secondary (%)
83 69 0.003
Both parents attend at least primary/secondary (%)
60 38 < 0.001
Diet score 24 ± 7 21 ± 8 0.001
SSB1 consumption (frequency/day)
1.1 ± 0.7 1.1 ± 0.9 0.53
Daily physical activity (minutes)
40 ± 33 48 ± 20 0.02
Daily leisure time (minutes) 1334 ± 617 1276 ± 664 0.43
Acculturation score 68 ± 8 66 ± 7 0.02
BMI 17 ± 3 17 ± 3
z-BMI 0.4 ± 1.4 0.4 ± 1.5
% Overweight 20 19 0.99
% Obese 15 17 0.62
WC (cm) 58.9 ± 8.3 58.7 ± 9.1 0.910
WC > 90th percentile* (%) 15 13 0.62
Height (cm) 129.4 ± 6.5 132.0 ± 8.2 0.001
Weight (kg) 28.4 ± 6.5 30.5 ± 9.2 0.007
SBP (mmHg) 106 ± 10 114± 10
SBP z-scores* 0.58 ± 0.90 1.25 ± 0.85 < 0.001
DBP (mmHg) 64 ± 8 69 ± 7
DBP z-scores* 0.41 ± 0.75 0.81 ± 0.61 < 0.001
Pre-hypertension (%) 10 21 < 0.001

28
Hypertension (%) 10 25 < 0.001
1SSB: sugar-sweetened beverages; WC: waist circumference; SBP: systolic blood pressure; DBP: diastolic blood pressure *WC percentiles and blood pressure z-scores calculated by adjusting for age and sex
Table 3. represents the demographics and anthropometric characteristics
stratified by weight class. Underweight children were younger than normal, overweight
and obese children (underweight: 7.7 ± 0.8, normal: 7.8 ± 0.6 years old, overweight: 8.0
± 0.8 years old, obese: 8.0 ± 0.8 years old; Table 3). There were no major differences in
diet across children from different BMI classifications (p=0.98). Anthropometric
measures varied across BMI classifications. Waist circumference was highest in the
obese category after adjustment of age and sex (obese: 64%, overweight: 18%, normal:
1%, underweight: 0%). The height and weight was greatest in the obese cohort with a
decreasing trend in overweight children and further reduction in normal weight children
(Obese: 134.5cm ± 7.6cm, 38.8kg ± 7.3kg, overweight: 130.7cm ± 6.1cm, 60.7kg ±
5.3kg, normal: 128.1cm ± 6.4cm, 24.3kg ± 3.1kg; p<0.001 for height and weight,
respectively). Systolic and diastolic blood pressure was highest in obese children and
lowest in underweight children, after adjustment for age and sex. Hypertension was
observed in approximately 42% of obese children with blood pressure values above the
95th percentile; 20% of overweight children were affected compared to 5% of normal
weight and 8% of underweight children.

29
Table 3. Demographic and descriptive characteristics of study population stratified by BMI status (n=363)
Variables Underweight
(n=13)
Normal
(n=220)
Overweight
(n=73)
Obese
(n=56) p
Age (years) 7.7 ± 0.8 7.8 ± 0.6 8.1 ± 0.8 7.9 ± 0.8 0.011
Female (%) 46 52 54 42 0.24
Education
One parent attends post-secondary
(%)
53 82 82 71 0.07
Both parents attend at least
primary/secondary (%)
0 55 63 46 0.001
Diet score 22 ± 5 23 ± 8 23 ± 8 24 ± 8 0.98
SSB1 consumption (frequency/day)
1.1 ± 0.7 1.1 ± 0.7 1.2 ± 0.7 1.2 ± 1.0 0.61
Daily physical activity (minutes)
31 ± 12 41 ± 31 46 ± 28 45 ± 31 0.44
Daily leisure time (minutes)
996 ± 598 1342 ± 639 1317 ± 632 1301 ±
601 0.94
Acculturation score 67 ± 7.5 67 ± 8.3 67 ± 7.0 67 ± 7.1 0.69
BMI (kg/m2) 13 ± 0.4 15 ± 1 19 ± 1 22 ± 0.1
z-BMI -2.5 ± 0.4 -0.3 ± 0.8 1.4 ± 0.3 2.6 ± 0.6 < 0.001
WC1 (cm) 48.1 ± 3.0 55.2 ± 4.7 64.4 ± 5.7 72.2 ±
6.1 < 0.001
WC > 90th percentile* (%)
0 1 18 64 < 0.001
Height (cm) 126.2 ± 7.3 128.1 ± 6.2 133.6 ± 6.1 135.3 ±
8.4 < 0.001
Weight (kg) 20.5 ± 2.5 25.1 ± 3.3 33.2 ± 5.4 40.3 ±
7.9 < 0.001
SBP (mmHg) 102 ± 10 105 ± 8 113 ± 10 119 ± 11
SBP z-scores* 0.25 ± 1.0 0.47 ± 0.76 1.1 ± 0.87 1.6 ± 0.98
< 0.001
DBP (mmHg) 68 ± 8 63 ± 7 68 ± 7 72 ± 8

30
DBP z-scores* 0.11 ± 0.75 0.32 ± 4.5 0.82 ± 0.78 1.0 ± 0.73
< 0.001
Pre-hypertension (%) 8 7 23 25 < 0.001
Hypertension (%) 8 5 20 42 < 0.001
1SSB: sugar-sweetened beverages; WC: waist circumference; SBP: systolic blood pressure; DBP: diastolic blood pressure *WC percentiles and blood pressure z-scores calculated by adjusting for age and sex
The demographics did not differ significantly between boys and girls (Table 4).
Boys had more daily leisure time than girls (Boys: 1388 ± 601 minutes, Girls: 1246 ± 652
minutes; p=0.03). Lifestyle characteristics such as: physical activity, diet and SSB
consumption were similar for both genders (p=0.27, p=0.28, p=0.21 respectively). The
percentage of obese children was slightly higher in boys than girls (27% vs. 19%,
respectively) however similar percentage of boys and girls were found to have a waist
circumference over the 90th percentile (14% across both). Height, weight and blood
pressure did not differ significantly across genders.

31
Table 4. Demographic and descriptive characteristics of study population stratified by gender (n=363)
Variables Boys
(n=182)
Girls (n=181)
p
Age (years) 7.9 ± 0.7 7.9 ± 0.7 0.35
Education
One parent attends post-secondary (%)
81 77 0.35
Both parents attend at least primary/secondary (%)
54 52 0.72
Diet score 23 ± 7 21 ± 8 0.28
SSB1 consumption (frequency/day)
1.2 ± 0.9 1.1 ± 0.7 0.21
Daily physical activity (minutes)
44 ± 28 41 ± 31 0.27
Daily leisure time (minutes) 1388 ± 601 1246 ± 652 0.03
Acculturation score 67 ± 7.2 67 ± 8.5 0.29
BMI (kg/m2) 17 ± 3 17 ± 2
% Overweight 18 22 0.35
% Obese 19 12 0.04
z-BMI 0.46 ± 1.5 0.35 ± 1.3 0.48
WC1 (cm) 59.1 ± 8.2 58.2 ± 8.8 0.30
WC > 90 h percentile* (%) 14 14 0.98
Height (cm) 131.2 ± 7.3 130.1 ± 6.9 0.27
Weight (kg) 29.1 ± 7.7 29.1 ± 7.0 0.37
SBP (mmHg) 109 ± 11 107 ± 10
SBP z-score 0.79 ± 0.94 0.74 ± 0.94 0.95
DBP (mmHg) 65 ± 8 65 ± 8
DBP z-score 0.46 ± 0.77 0.57 ± 0.69 0.25
Pre-hypertension (%) 12 14 0.59
Hypertension (%) 16 12 0.49

32
1SSB: sugar-sweetened beverages; WC: waist circumference; SBP: systolic blood pressure; DBP: diastolic blood pressure *WC percentiles and blood pressure z-scores calculated by adjusting for age and sex
5.2. Primary Analysis
Figure 4. Bivariate correlation between total SSB consumption/day (SSB units are on log scale; x=0 equivalent to 1 unit of SSB consumption) and zBMI (R2=0.016, p=0.46)
There was no correlation between total SSB and zBMI (Figure 4) or with WC and
waist to height ratio (data not shown). When adjusted for age and sex there was a
significant association observed between SSB and zBMI (p=0.02); this association was
not observed with diet beverages (p=0.43). In the adjusted models, WC and waist
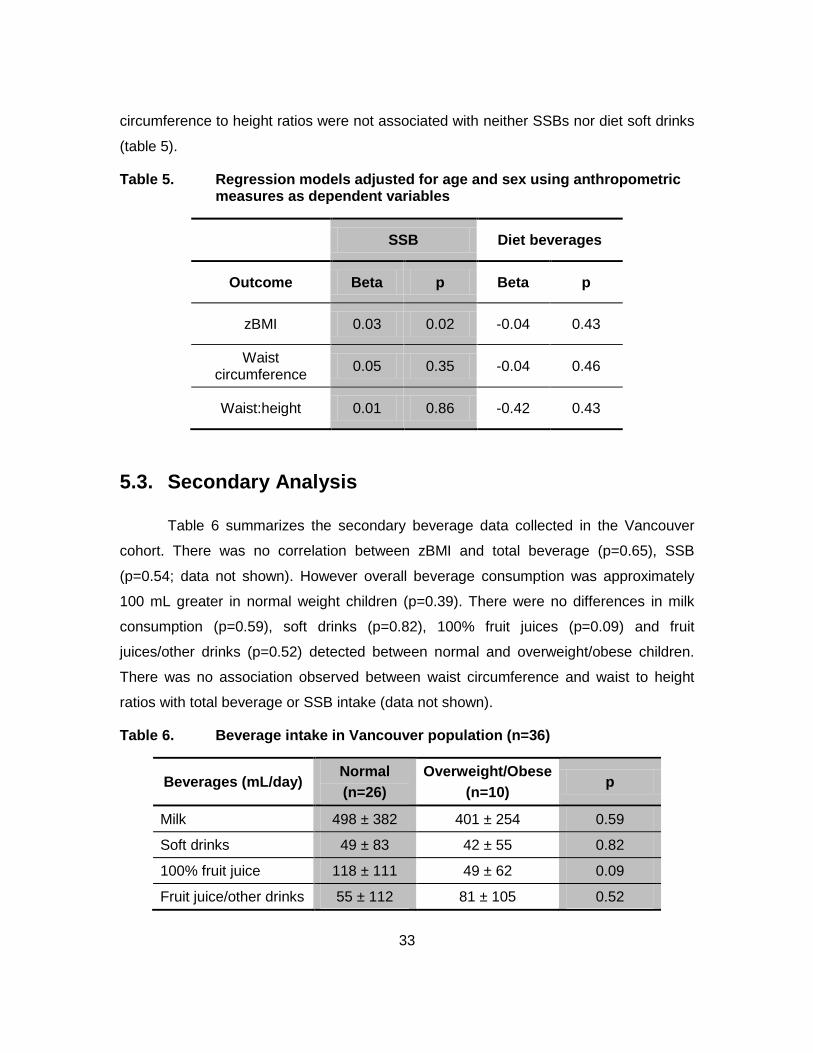
33
circumference to height ratios were not associated with neither SSBs nor diet soft drinks
(table 5).
Table 5. Regression models adjusted for age and sex using anthropometric measures as dependent variables
SSB Diet beverages
Outcome Beta p Beta p
zBMI 0.03 0.02 -0.04 0.43
Waist circumference
0.05 0.35 -0.04 0.46
Waist:height 0.01 0.86 -0.42 0.43
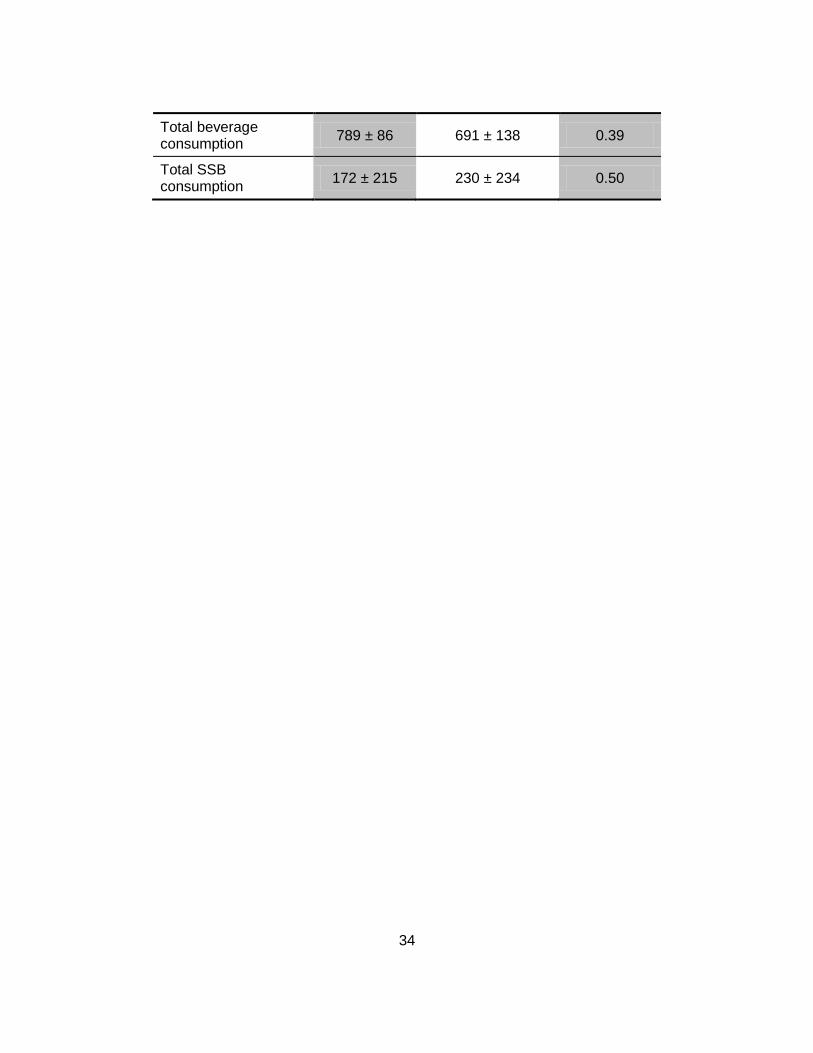
5.3. Secondary Analysis
Table 6 summarizes the secondary beverage data collected in the Vancouver
cohort. There was no correlation between zBMI and total beverage (p=0.65), SSB
(p=0.54; data not shown). However overall beverage consumption was approximately
100 mL greater in normal weight children (p=0.39). There were no differences in milk
consumption (p=0.59), soft drinks (p=0.82), 100% fruit juices (p=0.09) and fruit
juices/other drinks (p=0.52) detected between normal and overweight/obese children.
There was no association observed between waist circumference and waist to height
ratios with total beverage or SSB intake (data not shown).
Table 6. Beverage intake in Vancouver population (n=36)
Beverages (mL/day) Normal
(n=26)
Overweight/Obese
(n=10) p
Milk 498 ± 382 401 ± 254 0.59
Soft drinks 49 ± 83 42 ± 55 0.82
100% fruit juice 118 ± 111 49 ± 62 0.09
Fruit juice/other drinks 55 ± 112 81 ± 105 0.52
34
Total beverage consumption
789 ± 86 691 ± 138 0.39
Total SSB consumption
172 ± 215 230 ± 234 0.50

35
Chapter 6. Discussion
6.1. Summary of Major Findings
Patterns over the past three to four decades have shown a close parallel
between the rise in added sugar intake and the global childhood obesity epidemic. SSBs
are the primary source of added sugar intake in the diets of North American children. A
large number of observational studies have reported the positive association between
SSB consumption and long-term weight gain. A rising amount of experimental studies
and interventions have investigated the potential effects of SSB consumption as a risk
factor of obesity. The added sugars in these beverages contribute to weight gain through
an increase in caloric load - considered as extraneous calories - as they provide no
nutritional value or satiation. Recent literature has reported there are disparities
observed in the intake patterns of minority children living in North America (64, 82).
Anand et al. (83) demonstrated South Asian individuals are disproportionately affected
by increased abdominal obesity and adverse metabolic risk factors. This study aimed to
investigate SSB consumption in South Asian children living in Canada and its potential
relationship to obesity.
The major findings from the study include a positive association between zBMI
and SSB consumption; however there were no correlations with other measures of
obesity (WC and waist to height ratio). Further analysis of the intake of various beverage
categories demonstrated consumption did not differ between normal and
overweight/obese children. Milk was the highest consumed beverage compared to soft
drinks, fruit juices (100% and artificial) and other drinks in all weight categories.

36
6.2. Demographic and Descriptive Characteristics
Notable differences in demographics of children living in Hamilton and Vancouver
were observed. The percentage of families that had at least one parent with a formal
post-secondary education was higher in Hamilton than Vancouver. Parental education
was used as an indicator of socioeconomic status (84). Previous studies have
demonstrated children from lower SES families are at higher risk of being overweight or
obese however this effect was not observed; the prevalence of overweight and obesity
was similar in both cities. Despite these similarities, children from Hamilton had a
healthier diet score and lower levels of physical activity than the Vancouver cohort. This
is consistent with existing evidence that children from high SES backgrounds - especially
in urban settings - tend to have better nutritional intake and lower rates of physical
activity (38).
Analysis of children in various weight classes demonstrated no differences in
demographic characteristics (diet scores, physical activity or SSB consumption) though
there were differences among physical characteristics. Obese children had the highest
scores of blood pressure, WC, height and weight and these values subsequently
decreased in overweight and furthermore in normal and underweight weight children.
These trends are illustrative of the clinical consequences observed in overweight and
obese children (45). A higher BMI is strongly correlated to adverse health outcomes
such as higher blood pressure and increased adiposity (45). In addition a significant
portion of obese children were found to have a WC above the 90th percentile. In children
a higher WC is associated with a higher risk of obesity and is a risk factor of metabolic
syndrome (85).
Overall there were gender differences observed in the time spent in leisure
activities. Leisure time was assessed using TV time, computer/video game usage and
time spent on academics. Boys were found to spend more time engaged in daily leisure
activities than girls. A study investigating the leisure activities of 120 children aged 5-13
years old demonstrated similar findings. In addition the study suggests gender
disparities exist in the activities children choose to spend their leisure time engaged in
(86). Jayalakshmi et al. (87) reported sedentary individuals tend to display higher blood
37
pressure and are at an increased risk of weight gain. Although there were no significant
differences in anthropometric measures and blood pressure in the study sample the
increased time in leisure activity suggests boys may be at higher risk of obesity than
girls.
6.3. Sugar-Sweetened Beverage Analysis
6.3.1. Primary Analysis
The increasing prevalence of childhood obesity is suspected to be due to a
combination of environmental and social factors relating to diet and physical activity. Of
these factors, SSBs have been scrutinized as a large contributor to weight gain. Overall,
SSB consumption was related exclusively to zBMI, not WC or waist to height ratio. BMI
is the most common measure used to estimate body size in children and adults. It is
used as the primary indicator of obesity due to its cost-effectiveness and convenience in
field research.
Waist circumference and waist to height ratios have been suggested as
alternatives to measuring adiposity due to their association with cardio metabolic risk
factors and visceral fat (88). However, neither WC nor waist to height ratios were
associated with obesity. WC has been well studied as a predictor of obesity; it is an
accurate measure of central adiposity in comparison to BMI, which is a relative ratio of
overall body size. WC is not widely used due to the lack of robust comparison standards
and guidelines among children and adolescents. In addition, development of visceral
adipose tissue is prevalent during early adolescence therefore WC measurements in the
population under study may not be appropriate due to their younger age (89).
Other cross-sectional studies evaluated fat mass measured by dual-energy X-ray
absorptiometry (DEXA) as the primary outcome method of assessment. Fat mass is
another accurate predictor of obesity however not frequently used due to its high cost
and inconvenience. One longitudinal study reported SSB consumption increased over
time in children aged 8-18 years old however there was no significant relationship
38
between consumption and fat mass (90). Johnson et al. (91) reported no significant
findings in a cross-sectional study investigating the relationship between SSB
consumption and fatness in 5-7 year old children.
Previous research indicates minority populations tend to have higher SSB
consumption in comparison to Caucasian populations. Wang et al. (2008) performed an
analysis of the National Health and Nutrition Examination Survey (NHANES) data from
1988-1994 and 1999-2004 to examine racial differences in beverages consumption. For
all age groups, the increase in SSB consumption was highest in minority populations –
black and Mexican American children – in comparison to white populations (62). To
date, there is limited evidence of the specific dietary practices, including beverage
consumption patterns, of South Asian children living in Canada. A recent study
conducted by Lesser et al. (92) investigated the dietary patterns of 209 South Asian
adult immigrants. The results reported positive dietary practices, such as consumption of
fruits and vegetables, along with the adoption of unhealthy dietary practices, such as an
increase in fast foods and consumption of SSBs (93). Since children tend to emulate the
dietary patterns established by their parents, it is likely similar patterns may be observed
in South Asian children.
The present study is among the first to demonstrate a correlation between SSB
consumption and obesity in South Asian children. Due to the cross-sectional nature of
this investigation it is difficult to identify causal factors. Research suggests ethnicity may
influence the risk of obesity in children at a physiological level as there is ample
evidence in adults to demonstrate this effect. Due to limited research studying the effect
of SSB beverage consumption on obesity in South Asian children comparative data is
extrapolated from investigations including minority populations that have been well
studied. Children from other minority populations tend to display similar cardio metabolic
risk factors, such as the adverse distribution of visceral adipose tissue, observed in
South Asians in comparison to white populations (94). A recent randomized controlled
trial tested a two year intervention aimed at reducing SSB intake in children. Among
Hispanic children, the difference in BMI between the experimental and control group was
significant at one year and during follow up. The same effect was not observed in non-

39
Hispanic children (95). The same authors conducted a re-analysis of a previous 19-
month intervention that reported positive association between SSB consumption and
change in BMI (57). After re-analysis of the data to include effect modification by ethnic
group, reduction of SSB intake showed strong associations to reduction in BMI in
Hispanic children; this effect was not significant in non-Hispanic children (95). These
findings suggest ethnicity may influence susceptibility but whether they are generalizable
to South Asians – or other minority groups - requires further investigation.
The physiological mechanisms of weight gain due to intake of excess sugars are
less understood. The prevailing theory of weight gain suggests energy consumed in the
form of a liquid carbohydrates provides less satiety and micronutrients than energy
consumed from solid carbohydrates (96). Numerous studies have established that when
an individual increases their consumption of liquid carbohydrates they do not
concomitantly reduce their solid food consumption (97-99). This was demonstrated in a
study where the consumption of soda - equivalent of 1180 kilojoules per day - resulted in
significantly greater weight gain than did consumption of an isocaloric solid carbohydrate
load (100). Additional studies reported results consistent with these findings (101, 102).
The high amounts of sugars and high fructose corn syrup (HFCS) in SSBs have
been shown to induce rapid spikes in blood glucose and insulin levels (103).
Consumption of large volumes of SSBs contributes to a high dietary glycemic load (GL).
High GL diets are thought to promote weight gain due to the high postprandial insulin
response, which stimulates uptake of glucose by tissues. This produces a rapid fall in
blood glucose concentrations thought to induce a hunger response. The loss of
metabolic fuel leads to compensatory overeating as the body attempts to restore energy
homeostasis (104).
There is growing evidence to suggest consumption of fructose, a component
found in equal amounts in sucrose and HFCS, may induce adverse metabolic effects
that contribute to obesity. From a physiological perspective, the metabolism of fructose
and glucose are different; fructose is preferentially metabolized by the liver leading to fat
deposition, hepatic de novo lipogenesis and insulin resistance (105). In a study of
overweight and obese adults, a diet providing 25% of energy intake from fructose-

40
sweetened beverages resulted in significantly higher visceral adipose volume compared
to a group that had glucose in place of fructose (106). Therefore drinks sweetened with
higher amounts of fructose may pose an even greater threat to visceral fat deposition,
eventually leading to weight gain.
Diet beverages were included in the analysis to observe its potential effects on
obesity in South Asian children. Current theories state replacing SSBs with diet
beverages may lead to overall decrease in energy intake and assist in weight
management. Two observational studies demonstrated diet beverage consumption led
to weight reduction in individuals with high BMI or those from minority groups (95, 107)
The results of this study do not provide conclusive evidence to support this theory. This
effect may not be witnessed demographic because consumption in the study cohort may
be low. Dietary guidelines do not recommended consumption of diet beverages as part
of a daily balanced diet in children (108). The majority of randomized control trials to
demonstrate statistically significant results are conducted in adolescents and may not be
clinically meaningful given their modest effect on weight and body fat reduction (70).
6.3.2. Secondary Analysis
A secondary analysis focused on identifying specific beverage consumption
trends and patterns observed in the Vancouver population. Preliminary analysis revealed
there was no relationship between SSB consumption and zBMI. Failure to detect
significance may be due to lack of power in the subset population used for this analysis.
There were no significant differences in the types of beverages consumed
between normal and overweight/obese children. High consumption of SSBs was
expected in overweight/obese children, not normal weight children. Due to the biased
nature of self-report data, the overweight/obese children may have underreported their
levels of fruit juice and other sugared beverage consumption. A cross-sectional analysis
of 12 648 children demonstrated overweight/obese participants aged 7-10 years old
reported consuming fewer calories than their normal weight peers (109). The
discrepancy in data observed between normal weight and obese children may not depict

41
an accurate reflection of their true dietary intake therefore may have influenced the
results of the overall study.
The secondary beverage questionnaire was tailored to be able to detect specific
beverages and consumption patterns that are culturally relevant to South Asians. The
questionnaire captured additional data about sugars added to beverages, such as milk
as it is a common dietary practice in South Asian culture. Milk consumption in children is
necessary to provide the essential nutrients such as calcium, protein, vitamin B-12 and
D required for growth and development. There was higher intake of milk beverages than
soft drinks, 100% fruit juice, fruit juice/other drinks in both weight categories; however
there were no significant differences observed in the consumption of milk between
normal weight and overweight/obese children. Milk consumption has been known to
have a protective effect against obesity due to its subsequent decreased intake of SSBs
(56). The results do not provide conclusive evidence for the protective effect of milk
against obesity. Certain types of milk, such as reduced fat milk provide less calories and
fat than whole milk however is linked to a higher BMI in children due to decreased
satiation (110).
6.4. Implications
It is imperative to understand how environment, social differences from
Westernized culture and native cultural customs may impact the health of South Asian
children. The school setting has been considered an ideal setting to introduce PA and
dietary changes for all children regardless of their ethnic or socioeconomic background.
School-based policies aimed at targeting healthy behaviours have reported reduced
intake of SSBs (63, 111, 112). Introducing such policies aimed at targeting the reduction
of specific beverages with high consumption in South Asian children could prove to be
effective.
There is a need for further investigations to determine the influence of different
environments South Asian children are exposed to outside of the school setting. During
the assessments, South Asian families frequently reported the importance of gatherings

42
with family at home and places of worship (Appendix III). This encourages the support
for family-based interventions to reduce unhealthy behaviours since social support from
families may encourage dietary adherence (113). Places of worship have been identified
as a potential venue for intervention due to the access to a wider family unit. This will
offer valuable opportunities to provide cultural specific support for the implementation of
such family-based interventions. Places of worship - such as Sikh temples, Hindu
mandhirs and mosques - are non-for-profit organizations that run their facilities off
monetary and food donations by the community and patrons. This tends to lead to an
abundance of unhealthy foods and drinks that are readily available for temple patrons.
Possible regulations or policies governing the types of foods and drinks accepted and
served by places of worship may reduce the access and consumption of SSBs in South
Asian children.
6.5. Study Strengths and Limitations
A major strength of the study is the sample size and strong representation of
South Asian children in the study sample. There is limited research on the consumption
of SSBs in various racial groups in Canadian children. In addition the use of a secondary
beverage questionnaire allows for a comprehensive analysis of SSB intake. This will
provide a better understanding of the effect of specific beverages on the study
outcomes.
One limitation of the study is the cross-sectional nature of the study which
uncovers the association between variables without determining the causation. The
beverage data contained several limitations as data collected was self-reported therefore
may be underreported by children, especially in overweight/obese children. In addition
the RICH LEGACY questionnaire was not designed to collect volumetric data of
beverage consumption; the “units” of SSB consumption refer only to frequency of intake
on a daily basis. Also total energy intake is a strong predictor of obesity however was not
included as a co-variate because it was not included in the original study design.

43
Other limitations include the use of BMI as an indicator of obesity. Caution must
be taken when comparing obesity data from various countries due to the differences in
methodology when obtaining BMI. A globally accepted definition of childhood obesity
does not currently exist. Estimates based off the WHO criteria routinely overestimate
BMI whereas the IOTF criteria tend to underestimate BMI classification in comparison to
CDC criteria (114). These methodological inconsistencies have made it difficult to
classify children into appropriate weight classes and to grasp a true comparative
understanding of the global obesity epidemic witnessed in children.
6.6. Knowledge Translation
Knowledge translation is an imperative component of community-based
research. Upon the completion of this study, results will be shared with parents and
community through information sessions held at participating elementary schools. The
CAC will also assist to disseminate the study results within the South Asian community.
6.7. Conclusion and Future Directions
South Asian children and youth are at increased risk of obesity and related
CVDs. The information obtained from this study demonstrates there are correlations
between SSB consumption and obesity. Future studies should aim to determine if
beverage consumption patterns and its observed effect on obesity are ethnic specific. In
addition, there is a need to investigate the genetic contribution and to identify metabolic
risk factors that may contribute to the increased adiposity witnessed in South Asian
children. This will allow public health officials to create and implement culturally tailored
interventions and policies to lower rates of obesity affecting South Asian communities
located in Canada and worldwide.

44
References
1. Roberts K, Shields M, de Groh M, Aziz A, Gilbert J. Overweight and obesity in children and adolescents: Results from the 2009 to 2011 canadian health measures survey. Ottawa: Statistics Canada; 2012. Report No.: 82-003-X.
2. Defining childhood obesity [Internet].; 2014. Available from: http://www.hsph.harvard.edu/obesity-prevention-source/obesity-definition/defining-childhood-obesity/.
3. Cole TJ, Bellizzi MC, Flegal KM, Dietz WH. Establishing a standard definition for child overweight and obesity worldwide: International survey. BMJ. 2000 May 6;320(7244):1240-3.
4. Wang Y, Lim H. The global childhood obesity epidemic and the association between socio-economic status and childhood obesity. Int Rev Psychiatry. 2012 Jun;24(3):176-88.
5. World Health Organization. Obesity and overweight. 2013. Report No.: Fact sheet 311.
6. Wang Y, Monteiro C, Popkin BM. Trends of obesity and underweight in older children and adolescents in the united states, brazil, china, and russia. Am J Clin Nutr. 2002 Jun;75(6):971-7.
7. Statistics Canada. Health indicator profile, annual estimates, by age group and sex, canada, provinces, territories, health regions (2011 boundaries) and peer group. Ottawa: Statistics Canada; 2012. Report No.: Ottawa: Statistics Canada, 2012.
8. Ogden C, Carroll M, Kit B, Flegal K. Prevalence of obesity in the united states, 2009–2010. NCHS data brief. Hyattsville, MD: National Center for Health Statistics; 2012. Report No.: 82.
9. Shields M. Overweight and obesity among children and youth. Health Report [Internet]. 2006;17(3):27-42.
10. Mathur P, Shah B. Research priorities for prevention and control of noncommunicable diseases in india. Indian J Community Med. 2011 Dec;36(Suppl 1):S72-7.
45
11. Public Health Agency of Canada. Obesity in canada. 2011. Report No.: HP5-107/2011E-PDF.
12. Anis AH, Zhang W, Bansback N, Guh DP, Amarsi Z, Birmingham CL. Obesity and overweight in canada: An updated cost-of-illness study. Obes Rev. 2010 Jan;11(1):31-40.
13. Janssen I, Lam M, Katzmarzyk PT. Influence of overweight and obesity on physician costs in adolescents and adults in ontario, canada. Obes Rev. 2009 Jan;10(1):51-7.
14. Adlakha A. Population trends: India. U.S. Department of Commerce Economics and Statistics Administration; 1992. Report No.: PPT/92-3.
15. Wang Y, Lobstein T. Worldwide trends in childhood overweight and obesity. Int J Pediatr Obes. 2006;1(1):11-25.
16. Khadilkar VV, Khadilkar AV, Cole TJ, Chiplonkar SA, Pandit D. Overweight and obesity prevalence and body mass index trends in indian children. Int J Pediatr Obes. 2011 Jun;6(2-2):e216-24.
17. Raj M, Kumar R. Obesity in children & adolescents. Indian Journal of Medical Research. 2010;132(5):598.
18. Gupta DK, Shah P, Misra A, Bharadwaj S, Gulati S, Gupta N, et al. Secular trends in prevalence of overweight and obesity from 2006 to 2009 in urban asian indian adolescents aged 14-17 years. PLoS ONE. 2011;6(2).
19. Sharma A, Sharma K, Mathur KP. Growth pattern and prevalence of obesity in affluent schoolchildren of delhi. Public Health Nutr. 2007 May;10(5):485-91.
20. Kapil U, Singh P, Pathak P, Dwivedi SN, Bhasin S. Prevalence of obesity amongst affluent adolescent school children in delhi. Indian Pediatr. 2002 May;39(5):449-52.
21. Bhardwaj S, Misra A, Khurana L, Gulati S, Shah P, Vikram NK. Childhood obesity in asian indians: A burgeoning cause of insulin resistance, diabetes and sub-clinical inflammation. Asia Pac J Clin Nutr. 2008;17 Suppl 1:172-5.
22. Saxena S, Ambler G, Cole TJ, Majeed A. Ethnic group differences in overweight and obese children and young people in england: Cross sectional survey. Archives of Disease in Childhood. 2004;89(1):30-6.
23. Singh G, Kogan M. Childhood obesity in the united states, 1976-2008: Trends and current racial/ethnic, socioeconomic, and geographic disparities. Rockville, Maryland: Health Resources and Services Administration, Maternal and Child Health Bureau; 2010. Report No.: A 75th Anniversary Publication.

46
24. Bhopal R. Epidemic of cardiovascular disease in south asians. BMJ. 2002 BMJ Publishing Group Ltd;324(7338):625-6.
25. McKeigue PM, Shah B, Marmot MG. Relation of central obesity and insulin resistance with high diabetes prevalence and cardiovascular risk in south asians. The Lancet. 1991 2/16;337(8738):382-6.
26. Misra A, Shrivastava U. Obesity and dyslipidemia in south asians. Nutrients. 2013 Jul 16;5(7):2708-33.
27. Lear SA, Humphries KH, Kohli S, Frohlich JJ, Birmingham CL, Mancini GBJ. Visceral adipose tissue, a potential risk factor for carotid atherosclerosis. Stroke. 2007 September 01;38(9):2422-9.
28. Lear SA, Kohli S, Bondy GP, Tchernof A, Sniderman AD. Ethnic variation in fat and lean body mass and the association with insulin resistance. J Clin Endocrinol Metab. 2009 Dec;94(12):4696-702.
29. Vuksan V, Rogovik A, Jenkins A, Peeva V, Beljan-Zdravkovic U, Stavro M, et al. Cardiovascular risk factors, diet and lifestyle among european, south asian and chinese adolescents in canada. Paediatr Child Health. 2012 Jan;17(1):e1-6.
30. Whincup P, Gilg J, Owen C, Odoki K., A, KGMM., Cook D. British south asians aged 13–16 years have higher fasting glucose and insulin levels than europeans. Diabetic Medicine. 2005;22(9):1275.
31. Nightingale CM, Rudnicka AR, Owen CG, Cook DG, Whincup PH. Patterns of body size and adiposity among UK children of south asian, black african-caribbean and white european origin: Child heart and health study in england (CHASE study). Int J Epidemiol. 2011 Feb;40(1):33-44.
32. Hales CN, Barker DJ. Type 2 (non-insulin-dependent) diabetes mellitus: The thrifty phenotype hypothesis. Int J Epidemiol. 2013 Oct;42(5):1215-22.
33. Yajnik CS, Fall CHD, Coyaji KJ, Hirve SS, Rao S, Barker DJP, et al. Neonatal anthropometry: The thin-fat indian baby. the pune maternal nutrition study. Int J Obes Relat Metab Disord. 2003 print;27(2):173-80.
34. Harding S, Teyhan A, Maynard MJ, Cruickshank JK. Ethnic differences in overweight and obesity in early adolescence in the MRC DASH study: The role of adolescent and parental lifestyle. Int J Epidemiol. 2008 Feb;37(1):162-72.
35. Wang J, Thornton JC, Russell M, Burastero S, Heymsfield S, Pierson RN,Jr. Asians have lower body mass index (BMI) but higher percent body fat than do whites: Comparisons of anthropometric measurements. Am J Clin Nutr. 1994 Jul;60(1):23-8.

47
36. Deurenberg P, Deurenberg-Yap M, Guricci S. Asians are different from caucasians and from each other in their body mass index/body fat per cent relationship. Obes Rev. 2002 Aug;3(3):141-6.
37. WHO. Appropriate body-mass index for asian populations and its implications for policy and intervention strategies. The Lancet. 2004 1/10;363(9403):157-63.
38. Ang Y, Wee B, Poh B, Ismail M. Multifactorial influences of childhood obesity. Current Obesity Reports. 2013;2(1):10.
39. Oliver L, Hayes M. Neighbourhood socio-economic status and the prevalence of overweight canadian children and youth. Canadian Journal of Public Health. 2005;96(4):415-20.
40. Perichart-Perera O, Balas-Nakash M, Schiffman-Selechnik E, Barbato-Dosal A, Vadillo-Ortega F. Obesity increases metabolic syndrome risk factors in school-aged children from an urban school in mexico city. J Am Diet Assoc. 2007 01/01;107(1):81-91.
41. Colley RC, Garriguet D, Janssen I, Craig CL, Clarke J, Tremblay MS. Physical activity of canadian children and youth: Accelerometer results from the 2007 to 2009 canadian health measures survey. Health Reports. 2011 Mar 2011;22(1):15-23.
42. Fischbacher CM, Hunt S, Alexander L. How physically active are south asians in the united kingdom? A literature review. J Public Health (Oxf). 2004 Sep;26(3):250-8.
43. Janssen I, LeBlanc A. Systematic review of the health benefits of physical activity and fitness in school-aged children and youth. International Journal of Behavioral Nutrition and Physical Activity. 2010;7(1):40.
44. World Health Organization. Obesity: Preventing and managing the global epidemic. Geneva, Switzerland: World Health Organization; 2000. Report No.: 894.
45. Dietz WH. Health consequences of obesity in youth: Childhood predictors of adult disease. Pediatrics. 1998 March 01;101(Supplement 2):518-25.
46. Lobstein T, Baur L, Uauy R. Obesity in children and young people: A crisis in public health. Obesity Reviews. 2004;5:4-85.
47. Ebbeling CB, Pawlak DB, Ludwig DS. Childhood obesity: Public-health crisis, common sense cure. Lancet. 2002 Aug 10;360(9331):473-82.
48. Freedman DS, Khan LK, Serdula MK, Dietz WH, Srinivasan SR, Berenson GS. The relation of childhood BMI to adult adiposity: The bogalusa heart study. Pediatrics. 2005 Jan;115(1):22-7.

48
49. Shi Y, de Groh M, Morrison H. Increasing blood pressure and its associated factors in canadian children and adolescents from canadian health measures survey. BMC Public Health. 2012 May 29;12(1):388.
50. Zametkin A, Zoon C, Klein H, Munson S. Psychiatric aspects of child and adolescent obesity: A review of the past 10 years. Journal of the American Academy of Child & Adolescent Psychiatry. 2004 2;43(2):134-50.
51. Speakman JR, O'Rahilly S. Fat: An evolving issue. Dis Model Mech. 2012 Sep;5(5):569-73.
52. Ozmert E, Ozdemir R, Pektas A, et al. Effect of activity and television viewing on BMI z-score in early adolescents in turkey. World Journal of Pediatrics. 2011 02/01;7(1):37-40.
53. van der Horst K, Oenema A, Ferreira I, Wendel-Vos W, Giskes K, van Lenthe F, et al. A systematic review of environmental correlates of obesity-related dietary behaviors in youth. Health Educ Res. 2007 Apr;22(2):203-26.
54. Malik VS, Pan A, Willett WC, Hu FB. Sugar-sweetened beverages and weight gain in children and adults: A systematic review and meta-analysis. Am J Clin Nutr. 2013 Oct;98(4):1084-102.
55. Ruxton CHS, Gardner EJ, McNulty HM. Is sugar consumption detrimental to health? A review of the evidence 1995-2006. Crit Rev Food Sci Nutr. 2009 12/31; 2012/06;50(1):1-19.
56. Malik VS, Schulze MB, Hu FB. Intake of sugar-sweetened beverages and weight gain: A systematic review. The American Journal of Clinical Nutrition. 2006 August 2006;84(2):274-88.
57. Ludwig DS, Peterson KE, Gortmaker SL. Relation between consumption of sugar-sweetened drinks and childhood obesity: A prospective, observational analysis. The Lancet. 2001 2/17;357(9255):505-8.
58. Malik VS, Popkin BM, Bray GA, Després J, Hu FB. Sugar-sweetened beverages, obesity, type 2 diabetes mellitus, and cardiovascular disease risk. Circulation. 2010 March 23;121(11):1356-64.
59. Rippe JM. The metabolic and endocrine response and health implications of consuming sugar-sweetened beverages: Findings from recent randomized controlled trials. Adv Nutr. 2013 Nov 6;4(6):677-86.
60. Lloyd-Jones DM, Hong Y, Labarthe D, Mozaffarian D, Appel LJ, Van Horn L, et al. Defining and setting national goals for cardiovascular health promotion and disease reduction: The american heart association's strategic impact goal through 2020 and beyond. Circulation. 2010 Feb 2;121(4):586-613.

49
61. Danyliw AD, Vatanparast H, Nikpartow N, Whiting SJ. Beverage intake patterns of canadian children and adolescents. Public Health Nutr. 2011;14(11):1961.
62. Wang YC, Bleich SN, Gortmaker SL. Increasing caloric contribution from sugar-sweetened beverages and 100% fruit juices among US children and adolescents, 1988-2004. Pediatrics. 2008 Jun;121(6):e1604-14.
63. Levy DT, Mabry PL, Wang YC, Gortmaker S, Huang TT, Marsh T, et al. Simulation models of obesity: A review of the literature and implications for research and policy. Obes Rev. 2011 May;12(5):378-94.
64. Danyliw AD, Vatanparast H, Nikpartow N, Whiting SJ. Beverage patterns among canadian children and relationship to overweight and obesity. Appl Physiol Nutr Metab. 2012 10/01; 2012/08;37(5):900-6.
65. Fiorito LM, Marini M, Francis LA, Smiciklas-Wright H, Birch LL. Beverage intake of girls at age 5 y predicts adiposity and weight status in childhood and adolescence. The American Journal of Clinical Nutrition. 2009 October 01;90(4):935-42.
66. Vanselow MS, Pereira MA, Neumark-Sztainer D, Raatz SK. Adolescent beverage habits and changes in weight over time: Findings from project EAT. The American Journal of Clinical Nutrition. 2009 December 01;90(6):1489-95.
67. Fowler SP, Williams K, Resendez RG, Hunt KJ, Hazuda HP, Stern MP. Fueling the obesity epidemic? artificially sweetened beverage use and long-term weight gain. Obesity (Silver Spring). 2008 Aug;16(8):1894-900.
68. Blum JW, Jacobsen DJ, Donnelly JE. Beverage consumption patterns in elementary school aged children across a two-year period. J Am Coll Nutr. 2005 Apr;24(2):93-8.
69. Nettleton JA, Lutsey PL, Wang Y, Lima JA, Michos ED, Jacobs DR,Jr. Diet soda intake and risk of incident metabolic syndrome and type 2 diabetes in the multi-ethnic study of atherosclerosis (MESA). Diabetes Care. 2009 Apr;32(4):688-94.
70. Pereira MA. Diet beverages and the risk of obesity, diabetes, and cardiovascular disease: A review of the evidence. Nutr Rev. 2013 Jul;71(7):433-40.
71. Neumark-Sztainer D, Wall M, Guo J, Story M, Haines J, Eisenberg M. Obesity, disordered eating, and eating disorders in a longitudinal study of adolescents: How do dieters fare 5 years later? J Am Diet Assoc. 2006 4;106(4):559-68.
72. Stice E, Cameron RP, Killen JD, Hayward C, Taylor CB. Naturalistic weight-reduction efforts prospectively predict growth in relative weight and onset of obesity among female adolescents. J Consult Clin Psychol. 1999 Dec;67(6):967-74.
50
73. Field AE, Austin SB, Taylor CB, Malspeis S, Rosner B, Rockett HR, et al. Relation between dieting and weight change among preadolescents and adolescents. Pediatrics. 2003 Oct;112(4):900-6.
74. Gupta R, Misra A, Vikram NK, Kondal D, Gupta S, Agrawal A, et al. Younger age of escalation of cardiovascular risk factors in asian indian subjects. BMC Cardiovascular Disorders. 2009;9(1):28.
75. Malenfant EC, Lebel A, Martel L. Projections of the diversity of the canadian population. Ottawa: Statistics Canada; 2010. Report No.: 91-551-X.
76. Lear SA, Humphries KH, Kohli S, Chockalingam A, Frohlich JJ, Birmingham CL. Visceral adipose tissue accumulation differs according to ethnic background: Results of the multicultural community health assessment trial (M-CHAT). The American Journal of Clinical Nutrition. 2007 August 2007;86(2):353-9.
77. Donin AS, Nightingale CM, Owen CG, Rudnicka AR, McNamara MC, Prynne CJ, et al. Ethnic differences in blood lipids and dietary intake between UK children of black african, black caribbean, south asian, and white european origin: The child heart and health study in england (CHASE). The American Journal of Clinical Nutrition. 2010 October 01;92(4):776-83.
78. Iqbal R, Anand S, Ounpuu S, Islam S, Zhang X, Rangarajan S, et al. Dietary patterns and the risk of acute myocardial infarction in 52 countries. Circulation. 2008 November 04;118(19):1929-37.
79. Dehghan M, Mente A, Teo KK, Gao P, Sleight P, Dagenais G, et al. Relationship between healthy diet and risk of cardiovascular disease among patients on drug therapies for secondary prevention: A prospective cohort study of 31 546 high-risk individuals from 40 countries. Circulation. 2012 Dec 4;126(23):2705-12.
80. Naylor PJ, Scott J, Drummond J, Bridgewater L, McKay HA, Panagiotopoulos C. Implementing a whole school physical activity and healthy eating model in rural and remote first nations schools: A process evaluation of action schools! BC. Rural Remote Health. 2010 Apr-Jun;10(2):1296.
81. Anthropometric calculators [Internet]. Available from: http://www.bcchildrens.ca/Services/SpecializedPediatrics/EndocrinologyDiabetesUnit/ForProfessionals/AnthropometricCalculators.htm.
82. LaRowe TL, Moeller SM, Adams AK. Beverage patterns, diet quality, and body mass index of US preschool and school-aged children. J Am Diet Assoc. 2007 7;107(7):1124-33.
83. Anand SS, Yusuf S, Vuksan V, Devanesen S, Teo KK, Montague PA, et al. Differences in risk factors, atherosclerosis, and cardiovascular disease between ethnic groups in canada: The study of health assessment and risk in ethnic groups (SHARE). The Lancet. 2000 7/22;356(9226):279-84.

51
84. Bradley RH, Corwyn RF. Socioeconomic status and child development. Annu Rev Psychol. 2002 02/01; 2014/06;53(1):371-99.
85. Fernandez JR, Redden DT, Pietrobelli A, Allison DB. Waist circumference percentiles in nationally representative samples of african-american, european-american, and mexican-american children and adolescents. J Pediatr. 2004 Oct;145(4):439-44.
86. Cherney ID, London K. Gender-linked differences in the toys, television shows, computer games and outdoor activities of 5- to 13-year old children. Sex Roles. 2006;54(9-10):717-26.
87. Jayalakshmi M, Prabhu Raj N, Shanmukhappa N, Smilee Johncy S. Effect of sedentary lifestyle on anthropometric and cardiovascular parameters. Internation Journal of Biological and Medical Research. 2011;2(4):846-51.
88. Brambilla P, Bedogni G, Heo M, Pietrobelli A. Waist circumference-to-height ratio predicts adiposity better than body mass index in children and adolescents. Int J Obes. 2013 print;37(7):943-6.
89. Huang TT, Johnson MS, Figueroa-Colon R, Dwyer JH, Goran MI. Growth of visceral fat, subcutaneous abdominal fat, and total body fat in children. Obes Res. 2001 May;9(5):283-9.
90. Mundt CA, Baxter-Jones AD, Whiting SJ, Bailey DA, Faulkner RA, Mirwald RL. Relationships of activity and sugar drink intake on fat mass development in youths. Med Sci Sports Exerc. 2006 Jul;38(7):1245-54.
91. Johnson L, Mander AP, Jones LR, Emmett PM, Jebb SA. Is sugar-sweetened beverage consumption associated with increased fatness in children? Nutrition. 2007 Jul-Aug;23(7-8):557-63.
92. Lesser IA, Gasevic D, Lear SA. The association between acculturation and dietary patterns of south asian immigrants. PLoS One. 2014 Feb 18;9(2):e88495.
93. Lesser IA, Gasevic D, Lear SA. The association between acculturation and dietary patterns of south asian immigrants. PLoS One. 2014 Feb 18;9(2):e88495.
94. de Hoog ML, van Eijsden M, Stronks K, Gemke RJ, Vrijkotte TG. Ethnic differences in cardiometabolic risk profile at age 5-6 years: The ABCD study. PLoS One. 2012;7(8):e43667.
95. Ebbeling CB, Feldman HA, Chomitz VR, Antonelli TA, Gortmaker SL, Osganian SK, et al. A randomized trial of sugar-sweetened beverages and adolescent body weight. N Engl J Med. 2012 10/11; 2012/11;367(15):1407-16.
96. Pan A, Hu FB. Effects of carbohydrates on satiety: Differences between liquid and solid food. Curr Opin Clin Nutr Metab Care. 2011 Jul;14(4):385-90.

52
97. Kvaavik E, Andersen LF, Klepp KI. The stability of soft drinks intake from adolescence to adult age and the association between long-term consumption of soft drinks and lifestyle factors and body weight. Public Health Nutr. 2005 Apr;8(2):149-57.
98. Rodriguez-Artalejo F, Garcia EL, Gorgojo L, Garces C, Royo MA, Martin Moreno JM, et al. Consumption of bakery products, sweetened soft drinks and yogurt among children aged 6-7 years: Association with nutrient intake and overall diet quality. Br J Nutr. 2003 Mar;89(3):419-29.
99. St-Onge MP, Keller KL, Heymsfield SB. Changes in childhood food consumption patterns: A cause for concern in light of increasing body weights. Am J Clin Nutr. 2003 Dec;78(6):1068-73.
100. DiMeglio DP, Mattes RD. Liquid versus solid carbohydrate: Effects on food intake and body weight. Int J Obes Relat Metab Disord. 2000 Jun;24(6):794-800.
101. De Castro JM. The effects of the spontaneous ingestion of particular foods or beverages on the meal pattern and overall nutrient intake of humans. Physiol Behav. 1993 Jun;53(6):1133-44.
102. St-Onge MP, Rubiano F, DeNino WF, Jones A,Jr, Greenfield D, Ferguson PW, et al. Added thermogenic and satiety effects of a mixed nutrient vs a sugar-only beverage. Int J Obes Relat Metab Disord. 2004 Feb;28(2):248-53.
103. Janssens JP, Shapira N, Debeuf P, Michiels L, Putman R, Bruckers L, et al. Effects of soft drink and table beer consumption on insulin response in normal teenagers and carbohydrate drink in youngsters. Eur J Cancer Prev. 1999 Aug;8(4):289-95.
104. Ludwig DS. The glycemic index: Physiological mechanisms relating to obesity, diabetes, and cardiovascular disease. JAMA. 2002 May 8;287(18):2414-23.
105. Bray GA. Energy and fructose from beverages sweetened with sugar or high-fructose corn syrup pose a health risk for some people. Adv Nutr. 2013 Mar 1;4(2):220-5.
106. Stanhope KL, Schwarz JM, Keim NL, Griffen SC, Bremer AA, Graham JL, et al. Consuming fructose-sweetened, not glucose-sweetened, beverages increases visceral adiposity and lipids and decreases insulin sensitivity in overweight/obese humans. Journal of Clinical Investigation. 2009;119(5):1322-34.
107. Ebbeling CB, Feldman HA, Osganian SK, Chomitz VR, Ellenbogen SJ, Ludwig DS. Effects of decreasing sugar-sweetened beverage consumption on body weight in adolescents: A randomized, controlled pilot study. Pediatrics. 2006 March 01;117(3):673-80.

53
108. de Ruyter JC, Olthof MR, Seidell JC, Katan MB. A trial of sugar-free or sugar-sweetened beverages and body weight in children. N Engl J Med. 2012 10/11; 2012/11;367(15):1397-406.
109. Skinner AC, Steiner MJ, Perrin EM. Self-reported energy intake by age in overweight and healthy-weight children in NHANES, 2001-2008. Pediatrics. 2012 Oct;130(4):e936-42.
110. Scharf RJ, Demmer RT, DeBoer MD. Longitudinal evaluation of milk type consumed and weight status in preschoolers. Arch Dis Child. 2013 May;98(5):335-40.
111. Taber DR, Stevens J, Evenson KR, Ward DS, Poole C, Maciejewski ML, et al. State policies targeting junk food in schools: Racial/ethnic differences in the effect of policy change on soda consumption. Am J Public Health. 2011 Sep;101(9):1769-75.
112. Cradock AL, McHugh A, Mont-Ferguson H, Grant L, Barrett JL, Wang YC, et al. Effect of school district policy change on consumption of sugar-sweetened beverages among high school students, boston, massachusetts, 2004-2006. Prev Chronic Dis. 2011 Jul;8(4):A74.
113. Wilson D, Ampey-Thornhill G. The role of gender and family support on dietary compliance in an african american adolescent hypertension prevention study. Annals of Behavioural Medicine. 2001;23(1):59-67.
114. Shields M, Tremblay MS. Canadian childhood obesity estimates based on WHO, IOTF and CDC cut-points. Int J Pediatr Obes. 2010 05/03; 2013/12;5(3):265-73.

54
Appendix A: Consent Forms
RICH Legacy Subject Initials: _____
Consent for Parents/Guardians Version 4.0 Page 1 of 5
Faculty of Health Sciences 515 West Hastings Street Vancouver, BC V6B 5K3 Telephone: 778-782-7916
RICH LEGACY (Research in International Cardiovascular Health -
Lifestyles, Environments and Genetic Attributes in Children and Youth) Study
Parent/Guardian Consent Form
The University and those conducting this project subscr be to the ethical conduct of research
and to the protection at all times of the interests, comfort, and safety of participants. This research is being conducted under permission of the Simon Fraser University and Northern
Health Authority Research Ethics Boards. This research is supported by the Canadian Institutes
of Health Research.
Principal Investigator:
Dr. Scott Lear, Faculty of Health Sciences, Simon Fraser University
Primary Study Contact:
To be determined
Introduction
Your child is being invited to participate in the Research in International Cardiovascular Health - Lifestyles, Environments and Genetic Attr butes in Children and Youth Study (RICH LEGACY Study),
a community-based research study designed to better understand the behavioural, environmental
and genetic determinants of cardiovascular health of children living in diverse settings in Canada and India. Your child’s participation is entirely voluntary, so it is up to you and your child to decide whether
or not to take part in this study. Before you decide, it is important for you to understand what the research involves (a form of assent will be provided to your child as well). This consent form will
tell you and your child about the study, why the research is being done, what will happen during
the study and the poss ble benefits and/or risks. If you give permission for your child to participate, you will be asked to sign this form. However, your child is still free to decide not to participate and can also withdraw at any time and without giving any reasons for their decision.

55
RICH Legacy Subject Initials: _____
Consent for Parents/Guardians Version 4.0 Page 2 of 5
Purpose
The purpose of this research is to identify social, environmental and biological characteristics that are related to heart disease risk factors such as high blood pressure, high blood sugar,
obesity and abnormal cholesterol in children. These risk factors are increasing in children
throughout the world. As a result, diseases such as diabetes and heart disease are occurring at younger ages. Some research suggests that the environment where children live including their home, neighbourhood and school may contribute to the chance of developing these risk factors
for poor health. Our research will identify individual, family, school and community
characteristics that are linked with cardiovascular risk factors in 5400 children and youth. We will compare 3 distinct settings: urban Canada, urban India and rural India. This study is an
essential step to improving health in different populations whose practices and beliefs may require different solutions. Who can participate in this study?
Children (boys and girls) of ages 7 and 8, and ages 14 and 15.
What will my child’s participation involve?
If your child participates, he/she will be asked to:
1. Complete simple questionnaires about collected on health behaviours including diet, physical activity, smoking and alcohol use. All information will be collected by researchers
and will remain confidential.
2. Undergo assessment of blood pressure, body size (height, weight, waist circumference), body fatness (using simple bioelectrical impedance as used in fitness centres) and handgrip
strength. 3. Provide a saliva sample for assessment of DNA (to assess hereditary markers for heart
disease). This assessment will take place at or near the school, before or after school, or on the weekend.
Seven and eight year old children will have visits booked along with their parent (preferably
mother) to help with some of the information in the questionnaires. We anticipate it will take no more than 45 minutes.
A small subset of children (approximately 1 in 5) will be asked to undergo additional measures
of factors related to health and heart disease risk consisting of: 1. A fasting blood sample (approximately 1 tablespoon) to measure blood sugar, cholesterol
and other heart disease risk markers. 2. Additional questionnaires about family, home and school for the child and the parent
(preferably mother) will be completed at this time.
3. A full-body DEXA (dual energy x-ray absorptiometry) scan to assess the amount of total
body fat. The DEXA scan uses a very low energy x-ray beam (about one fifth of a plain x-ray) that passes below you as you lay on the bed.
4. Assessment of physical activity using an accelerometer (an iPod sized device that counts
movements worn on a waist-band) and by completion of an activity diary for 4 days.
This assessment will be conducted in the Simon Fraser University Surrey Campus. We anticipate it will take no more than two hours including the time for the activity diary.
In addition, we may wish your child (with you for which we have a separate consent form) to participate in group interviews with other children and their parents to discuss the results of the
study and ask for input on how our findings may help to improve child heart health in your
community. The interviews will last up to 90 minutes and will be tape-recorded.

56
RICH Legacy Subject Initials: _____
Consent for Parents/Guardians Version 4.0 Page 3 of 5
What are the risks of participation?
Participation in this study involves minimal risk. The blood samples will be obtained by venipuncture- (standard procedure for taking blood) a harmless procedure. The side effects are
rare but may include bleeding under the skin (hematoma) or, in extremely rare instances,
inflammation of the vein (phlebitis). The total volume of all the blood samples required is less than one tablespoon (<15 mL). The DEXA scan involves exposure to low energy radiation (one fifth of a normal x-ray). The exposure involved in the DEXA scan is less than spending 30
minutes in the sunshine or one day of regular urban living.
What are the costs of participation?
There are no costs to participating in this study. What are the benefits of participation? It is poss ble that your child will not benefit from this study. However, we will provide you and
your child a report of your child’s blood pressure, body size measures and blood measures (if
applicable) with guidance regarding whether the results fall within the desired ranges. All results obtained are for research purposes only and will not be interpreted by a medical doctor as part
of the study participation. In the event of significant abnormalities, we will contact you and your
child directly.
Who Do I Contact If I have any Questions?
If you have any questions during or after the completion of this study, you may contact the research coordinator or any of the study investigators listed above. Final results and copies of
published articles of the study can be received by contacting Dr. Scott Lear at
If you have any concerns about your rights as a research subject and/or your experiences while
participating in this study, contact the principal investigator, Dr. Scott Lear, Simon Fraser
University at or Dr. Hal Weinberg, Director of Research Ethics at Simon Fraser University at
How will we protect your confidentiality?
Your child’s confidentiality will be respected. No information that discloses your child’s identity will be released or published without specific consent from you and your child to the disclosure.
Ensuring confidentiality is very important to us. Any information that is obtained during this study will be kept confidential to the full extent permitted by the law. We will not need to record your child’s name or personal identifiers (ie: date of birth, personal health number) on any study
material. Data will be labeled with an anonymous code number and entered into a secure
database. Your child will not need to mention their name or any identifying information on the interview. Tape recordings of any interviews will be destroyed after transcr bed. Only the
research investigator, the study research assistants, and the research coordinator will have
access to this data.
Research and medical records identifying your child may be inspected in the presence of the
Investigator or his or her designate by representatives of the Research Ethics of Simon Fraser
University for the purpose of monitoring the research. However, no records which identify your child by name or initials will be allowed to leave the Investigators' offices.

57
RICH Legacy Subject Initials: _____
Consent for Parents/Guardians Version 4.0 Page 4 of 5
Consent
By signing this form, I, ________________________, agree to my child’s voluntarily participation in this research study, have read the above information and:
· I understand the procedures to be used in this study, and the potential personal risks and
benefits to my child in taking part in this study.
· I understand that permission for this study has been obtained by the Surrey School District.
· I have had the opportunity to ask questions and have had satisfactory responses to my
questions.
· I understand that all of the information collected will be kept confidential.
· I understand that my child’s participation in this study is voluntary and that he/she is completely free to refuse to participate or to withdraw from this study at any time without changing in any way the quality of services that I or my child receives from Simon Fraser
University or the Surrey School District, now or in the future and that refuse to participate or
to withdraw will have no adverse effects on my child's grade or evaluation in the course or classroom.
· I understand that I, or my child, are not giving up any of my legal rights as a result of signing
this consent form.
· I have read this form and I freely consent for my child to participate in this study.
· I understand that I will be given a copy of this signed and dated consent form.
I agree that you may contact us YES NO to collect information about long-term follow-up
over the next several years
I agree for my child to have his/her blood taken YES NO I agree for my child to provide a saliva sample YES NO
for analysis of DNA
Blood and DNA samples will be labeled with an anonymous code number. The sample will not
have your child’s name or any other identifying information on it. The list linking your child’s name and the anonymous code number will be kept in a secure place separate from the samples. Only the research investigators will have access to the list link. One year following
completion of the study and publication of the results, the list linking the samples and your
child’s name will be destroyed. You, and your child, are free to request that your child’s samples are removed and destroyed at any time up until that period; otherwise, your child’s samples will
be kept for another 10 years and destroyed afterward. Regarding the participation of children The parent(s)/guardian(s) and the investigator are satisfied that the information contained in this
consent form was explained to the child to the extent that he/she is able to understand it, that all
questions have been answered, and that the child assents to participating in the research.
___________________________ __________________________ _______________
Printed name of participant (or legally Signature Date acceptable representative)
___________________________

58
RICH Legacy Subject Initials: _____
Consent for Parents/Guardians Version 4.0 Page 5 of 5
Printed name of child
___________________________ __________________________ _______________ Printed name of witness Signature Date
___________________________ __________________________ _______________ Printed name of principal investigator Signature Date
___________________________ __________________________ _______________ Printed name of translator (if applicable) Signature Date

59
RICH Legacy
Participant Assent Version 3.0 Page 1 of 2
Faculty of Health Sciences 515 West Hastings Street Vancouver, BC V6B 5K3 Telephone: 778-782-7916
RICH LEGACY (Research in International Cardiovascular Health - Lifestyles, Environments and Genetic Attributes in Children and
Youth) Study
Participant Assent Form
You are being invited to be part of a research study. It is up to you if you want to be in this study. No one will make you be part of the study. Even if you agree now to be part of
the study, you can change your mind later. No one will be mad if you choose not to be
part of this study. We are discussing the study with your parents and you should talk to them about it too. You do not have to be in this study, if you do not want to be.
Why are you doing this study? We are doing a research study about what makes children’s hearts healthy or sick when they
are older, especially their habits, their families and schools. A research study is a way to learn
more about people.
Why am I being asked to be in the study? You are being asked to take part in the RICH LEGACY Study, because you live in this area and you
are 7 or 8 or 14 or 15 years old which is the age of the children who can participate in this study. Children in Canada and in India are taking part.
What if I have questions?
You can ask questions if you do not understand any part of the study. If you have questions later that you can’t think of now, you can talk to me again or you can call me at (study contact number)
If I am in the study what will happen to me? If you decide that you want to be part of the study, you will be asked to come for a visit in your school
where a study worker will take measurements of your blood pressure, body size and hand grip
strength all in privacy. You will be asked for a sample of saliva (spit). You will be asked questions about what you eat, how you spend your time and about your health.
You may also be invited to the study clinic for a morning-time blood test (with about a tablespoon of
blood) and more questions about your health, the place where you live and go to school. We will ask your parents questions about your family and the place where you live. At this visit, you may have a
type of X-ray scan that shows what your body is made up of. You may be asked to wear on your
waist a small box the size of an iPod that counts movements for 4 days, and to keep an activity diary.
If you agree, we will contact you again in the future to ask about your health and do some
measurements again.
Even after signing this, you can to say no to any of these tests or questions if you don’t want to do them. you can also drop out of the study.
60
RICH Legacy
Participant Assent Version 3.0 Page 2 of 2
Can Anything Bad Happen to Me? You may feel a little pain, feel faint, light headed or dizzy when the blood is taken from your arm
with the needle. Also, you might bleed a little when the needle is taken out of your arm or get a
small infection if your arm is dirty when the needle is put in. Will the study help me? This study may not help you but we will share the results of your measures (such as your weight,
blood measures and blood pressure) with you and your parents, which you may find helpful. All other answers you give us will remain between you and the researchers (secret). The information and
results of this study may help prevent and treat things that lead to heart disease and diabetes in young people in the future. You will receive a certificate saying how much time you spent in the study. If you are in high school,
this may count as Community Service hours.
Who Will Know I Am in the Study?
Only your parent(s) and the people who are involved in the study will know you are in it.
When the study is finished, the study workers will write a report about what was learned. This report will not say my name or that you were in the study. Your parents and you do
not have to tell anyone you are in the study if you don’t want to.
When Do I Have To Decide?
You have as much time as you want to decide to be part of the study. You have also been asked to discuss my decision with your parents.
Signatures:
If I put my name at the end of this form, it means that I agree to be in the study.
___________________________ __________________________ _______________
Printed name of subject Signature Date
___________________________
Printed name of guardian/parent

61
RICH Legacy Subject Initials: _____
Consent for Parents/Guardians Version 1.0 Page 2 of 3
characteristics that are linked with cardiovascular risk factors in 5400 children and youth. We
will compare 3 distinct settings: urban Canada, urban India and rural India. This study is an essential step to improving health in different populations whose practices and beliefs may
require different solutions.
Who can participate in this study? Parents of children (boys and girls) of ages 7 and 8, and ages 14 and 15 that are also participating in this study.
What will my participation involve?
We would like your permission to contact you, in case we would like you and your child to participate in group interviews with other children and their parents to discuss the results of the study and ask for input on how our findings may help to improve child heart health in your community. The interviews will last up to 90 minutes and will be tape-recorded.
What are the risks of participation? Participation in this study involves minimal risk.
What are the costs of participation? There are no costs to participating in this study.
What are the benefits of participation? It is poss ble that you will not benefit from this study. However, your input on the study results
and how they may be applied to child heart health may have a beneficial effect on your community.
Who Do I Contact If I have any Questions?
If you have any questions during or after the completion of this study, you may contact the
research coordinator or any of the study investigators listed above. Final results and copies of published articles of the study can be received by contacting Dr. Scott Lear at
If you have any concerns about your rights as a research subject and/or your experiences while participating in this study, contact the principal investigator, Dr. Scott Lear, Simon Fraser
University at or Dr. Hal Weinberg, Director of Research Ethics at Simon Fraser University at How will we protect your confidentiality?
Your confidentiality will be respected. No information that discloses your identity will be released or published without your specific consent to the disclosure. Ensuring your confidentiality is very
important to us. Any information that is obtained during this study will be kept confidential to the
full extent permitted by the law. We will not need to record your name or personal identifiers (ie: date of birth, personal health number) on any study material. Data will be labeled with an anonymous code number and entered into a secure database. You will not need to mention your name or any identifying information on the interview. Tape recordings of any interviews will
be destroyed after transcribed. Only the research investigator, the study research assistants, and the research coordinator will have access to this data.
Research and medical records identifying you may be inspected in the presence of the Investigator or his or her designate by representatives of the Research Ethics of Simon Fraser

62
RICH Legacy Subject Initials: _____
Consent for Parents/Guardians Version 1.0 Page 3 of 3
University for the purpose of monitoring the research. However, no records which identify you
by name or initials will be allowed to leave the Investigators' offices.
Consent
By signing this form, I, ________________________, and agree to participate in this research study, have read the above information and:
· I understand the procedures to be used in this study, and the potential personal risks and
benefits to me in taking part in this study.
· I understand that permission for this study has been obtained by the Surrey School District.
· I have had the opportunity to ask questions and have had satisfactory responses to my
questions.
· I understand that all of the information collected will be kept confidential.
· I understand that my participation in this study is voluntary and that I am completely free to refuse to participate or to withdraw from this study at any time without changing in any way
the quality of services that I or my child receives from Simon Fraser University or the Surrey School District, now or in the future and that refuse to participate or to withdraw will have no adverse effects on my child's grade or evaluation in the course or classroom.
· I understand that I am not giving up any of my legal rights as a result of signing this consent
form.
· I have read this form and I freely consent to participate in this study. I understand that I will be given a copy of this signed and dated consent form.
I agree that you may contact me YES NO
to collect information about long-term follow-up over the next several years
Regarding the participation of children The parent(s)/guardian(s) and the investigator are satisfied that the information contained in this
consent form was explained to the child to the extent that he/she is able to understand it, that all
questions have been answered, and that the child assents to participating in the research.
___________________________ __________________________ _______________
Printed name of participant (or legally Signature Date
acceptable representative)
___________________________ __________________________ _______________
Printed name of witness Signature Date
___________________________ __________________________ _______________
Printed name of principal investigator Signature Date
___________________________ __________________________ _______________
Printed name of translator (if applicable) Signature Date
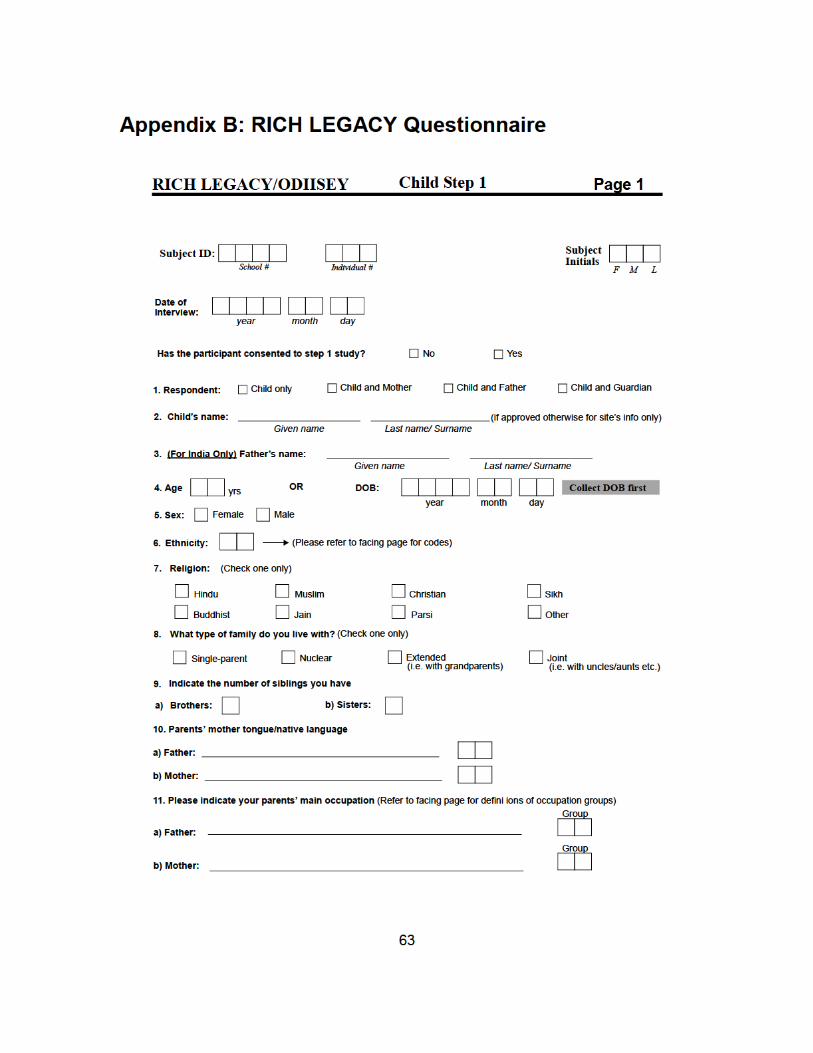
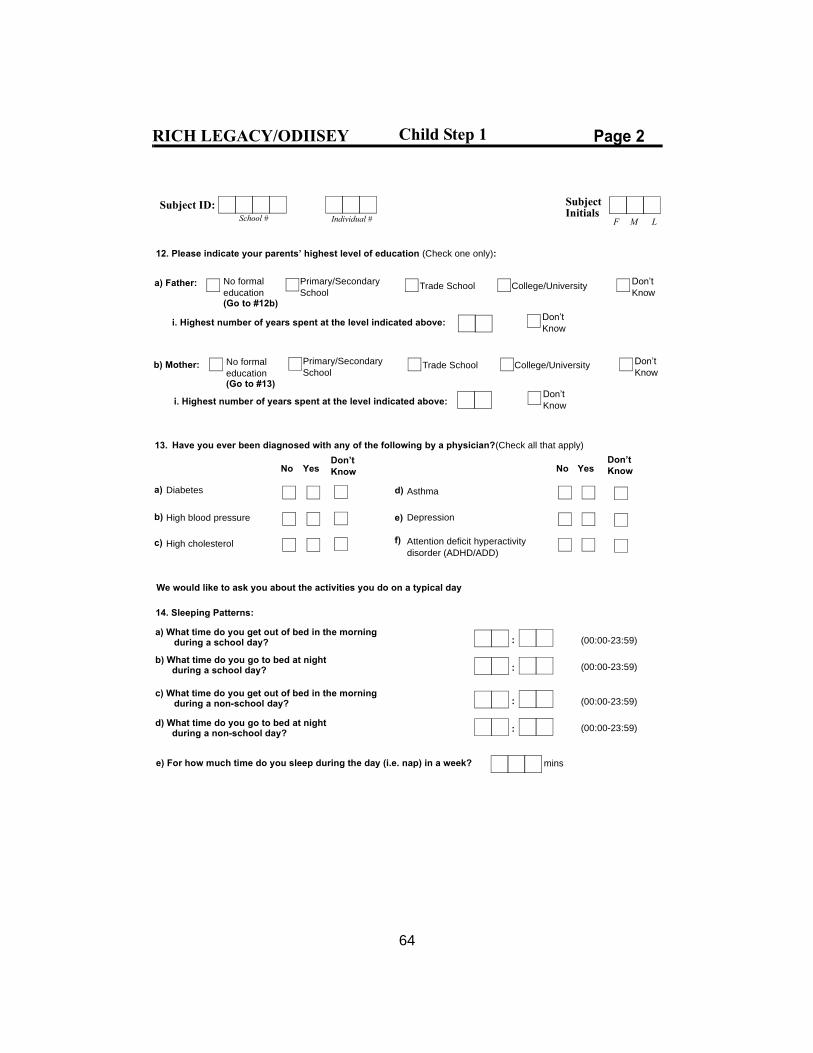
64
RICH LEGACY/ODIISEY Child Step 1
Individual #
Subject ID:School #
SubjectInitials
F M L
Page 2
Have you ever been diagnosed with any of the following by a physician?(Check all that apply)
Diabetes
Don’t
High blood pressure
High cholesterol
No Yes
13.
a)
c)
b)
Asthma
Depression
Don’t
KnowNo
Attention deficit hyperactivity
d)
f)
e)
Yes
a) What time do you get out of bed in the morning: (00:00-23:59)during a school day?
b) What time do you go to bed at night: (00:00-23:59)during a school day?
c) What time do you get out of bed in the morning: (00:00-23:59)during a non-school day?
d) What time do you go to bed at night: (00:00-23:59)
during a non-school day?
Know
disorder (ADHD/ADD)
We would like to ask you about the activities you do on a typical day
e) For how much time do you sleep during the day (i.e. nap) in a week? mins
12. Please indicate your parents’ highest level of education (Check one only):
No formal Primary/SecondaryTrade School College/University
Don’t a) Father: education School Know
i. Highest number of years spent at the level indicated above:
b) Mother: No formal Primary/Secondary Trade School College/University Don’t
education School Know
i. Highest number of years spent at the level indicated above:
14. Sleeping Patterns:
Don’t
Know
Don’t
Know
(Go to #12b)
(Go to #13)


66
RICH LEGACY/ODIISEY Child Step 1
Individual #
Subject ID:School #
SubjectInitials
F M L
Indicate in the table below the activities that you perform and how often you perform them:
(Over the last 30 days)
a) Viewing TV
b) Videogames/computers/internet
c) Homework/tuitions outside school
d) Games/sports/exercise in school:
e) Major recess/lunch time activity:
19.
f) Games/sports/exercise outside school:
Type of Activity Rough Duration
mins.
mins.
mins.
mins.
mins.
mins.
mins.
mins.
mins.
mins.
Times permonth
Times perweek per time
OR
i.
ii.
iii.
i.
ii.
i.
ii.
iii.
mins.
(not for homework)
Page 4
(Refer to facing page for definitions and examples)
I do not do any games/sports/exercise in school
OR
I do not do any games/sports/exercise outside school
OR

67
RICH LEGACY/ODIISEY Child Step 1
Individual #
Subject ID:School #
SubjectInitials
F M L
Page 5
21. How often do you eat food from each of the following groups?
How many days per week do you eat breakfast? 20.
< 1 per month - never Monthly Weekly Daily # TimesOR
choose one If either monthly,weekly, or daily ischecked, record #of times.
a) Whole grains breads/cereals
b) Refined breads/rice/pasta and cereals
c) Dairy Products (not milk in tea or coffee)
d) Meat
h) Fish and seafood
g) Eggs
f) Poultry
i) Pizza
e) Organ meats
m) Legumes/nuts/seeds
j) Green leafy vegetables
k) Vegetables, other (raw)
l) Vegetables (cooked)
n) Potatoes, boiled and mashed
p) Deep fried food
q) Salty snacks
o) Pickled food
r) Fruits
t) Desserts and sweet snacks
u) Confectionary, sugars, and syrups
v) Fruit juice and sugared drinks
w) Carbonated beverages (Diet)
s) Ice cream and pudding
x) Carbonated beverages (Non-Diet)
y) Fast food
days
(Refer to facing page for definitions of food groups)

68
RICH LEGACY/ODIISEY Child Step 1
Individual #
Subject ID:School #
SubjectInitials
F M L
22. How important is each of the following in making you want to eat healthy foods?
a) To keep fit and strong
b) To look good
c) To be free from sickness/disease
d) To grow well
e) To stay mentally alert/study better
f) To be energetic
g) Other (specify):
23. What makes you eat unhealthy foods?
a) Eating with friends
b) Ea ing at home
c) Eating at school
d) Ea ing outside
e) I like the taste of unhealthy foods
f) I am tempted by TV and advertisements
g) Parents don’t have the time to make healthy foods
h) I don’t have the time to make, buy or eat healthy foods
i) Other (specify):
Never Rarely OftenVeryOften
Not Important Somewhat Important Very Important
24. How important is it to you to eat healthy foods right now at your age?
25. How important is it to you to eat healthy foods as you get older?
Not important Somewhat important Very important
Not important Somewhat important Very important
Page 6
(Refer to facing page for suggested wording of question)
(Refer to facing page for suggested wording of question)
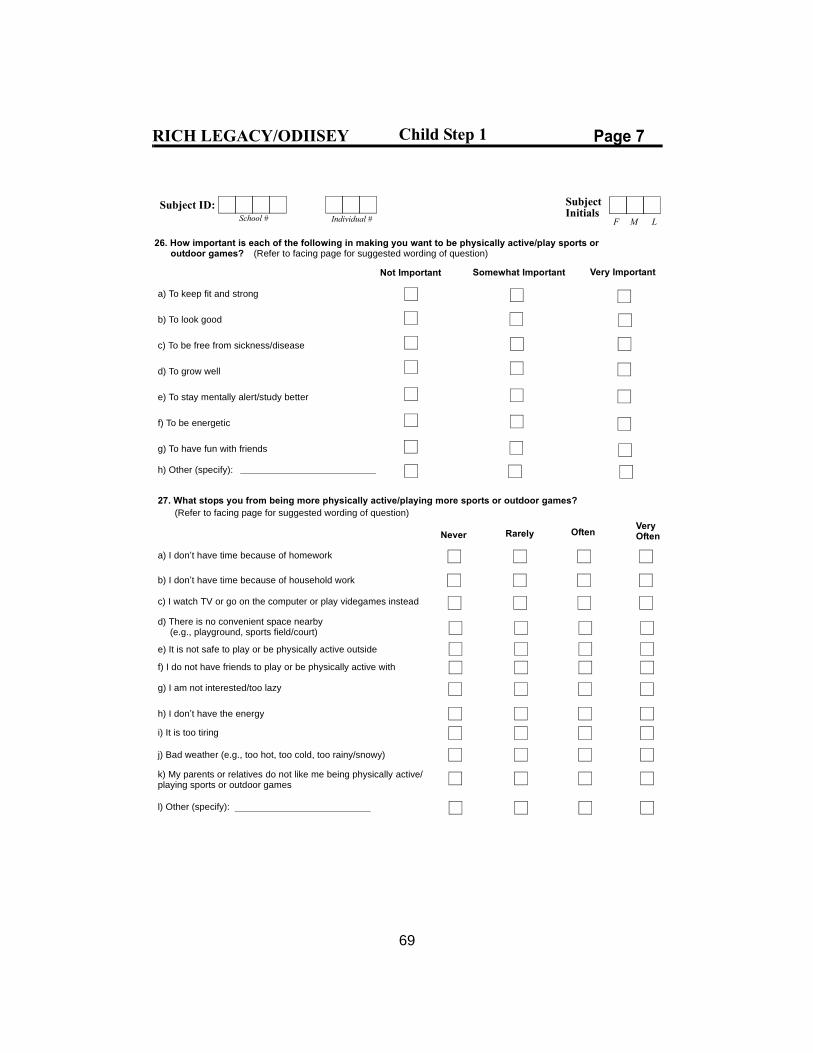
69
RICH LEGACY/ODIISEY Child Step 1
Individual #
Subject ID:School #
SubjectInitials
F M L
26. How important is each of the following in making you want to be physically active/play sports or
a) To keep fit and strong
b) To look good
c) To be free from sickness/disease
d) To grow well
e) To stay mentally alert/study better
f) To be energetic
g) To have fun with friends
27. What stops you from being more physically active/playing more sports or outdoor games?
a) I don’t have time because of homework
b) I don’t have time because of household work
c) I watch TV or go on the computer or play videgames instead
d) There is no convenient space nearby
e) It is not safe to play or be physically active outside
f) I do not have friends to play or be physically active with
g) I am not interested/too lazy
h) I don’t have the energy
i) It is too tiring
h) Other (specify):
(e.g., playground, sports field/court)
j) Bad weather (e.g., too hot, too cold, too rainy/snowy)
k) My parents or relatives do not like me being physically active/playing sports or outdoor games
l) Other (specify):
Never Rarely OftenVeryOften
Not Important Somewhat Important Very Important
Page 7
outdoor games? (Refer to facing page for suggested wording of question)
(Refer to facing page for suggested wording of question)

70
RICH LEGACY/ODIISEY Child Step 1
Individual #
Subject ID:School #
SubjectInitials
F M L
28. How important is it to you to be physically active/play sports or outdoor games right now at your age?
Not important Somewhat important Very important
29. How important is it to you to be physically active/play sports or outdoor games as you get older?
Not important Somewhat important Very important
a) How often do you speak English with your:
i. Parent(s)
ii. Siblings
iii. Friends
i. TV shows/serials
c) How often do you watch or listen to English:
b) How often do you speak your mother tongue/
ii. Movies
iii. Music
30. Acculturation/Westernization (Refer to facing page for instructions)
Never Sometimes Often Very often/Always
native country’s language with your:
i. Parent(s)
ii. Siblings
iii. Friends
i. TV shows/serials
d) How often do you watch or listen to the following
ii. Movies
iii. Music
in your mother tongue/native country’s language:
i. Lunch or dinner (e.g., pizza, hamburgers)
e) How often do you eat Western/Continental food for:
ii. Snack (e.g., potato chips, cookies)
iii. Dessert (e.g., cakes, puddings, pastries)
N/A
Page 8
Not asked
Not asked
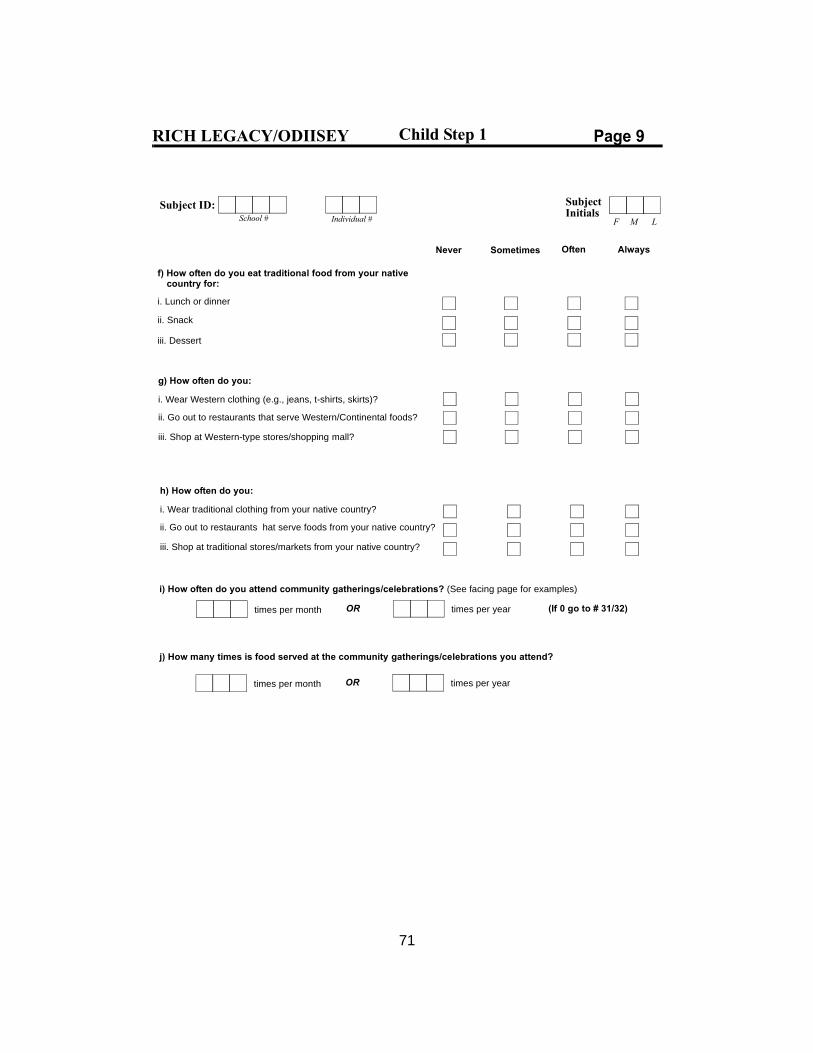
71
RICH LEGACY/ODIISEY Child Step 1
Individual #
Subject ID:School #
SubjectInitials
F M L
i. Lunch or dinner
f) How often do you eat traditional food from your native
ii. Snack
iii. Dessert
g) How often do you:
i. Wear Western clothing (e.g., jeans, t-shirts, skirts)?
ii. Go out to restaurants that serve Western/Continental foods?
iii. Shop at Western-type stores/shopping mall?
h) How often do you:
i. Wear traditional clothing from your native country?
ii. Go out to restaurants hat serve foods from your native country?
iii. Shop at traditional stores/markets from your native country?
Never Sometimes Often Always
Page 9
country for:
i) How often do you attend community gatherings/celebrations? (See facing page for examples)
times per month
j) How many times is food served at the community gatherings/celebrations you attend?
times per month
times per year (If 0 go to # 31/32)OR
times per yearOR


73
RICH LEGACY/ODIISEY Child Step 1
Individual #
Subject ID:School #
SubjectInitials
F M L
33. Circle the picture that shows how YOU look.
For BOYS:
For GIRLS:
Page 11
Indicate picture number:

74
RICH LEGACY/ODIISEY Child Step 1
Individual #
Subject ID:School #
SubjectInitials
F M L
34. Circle the picture that shows how YOU WANT to look (it can be the same or different).
For BOYS:
For GIRLS:
Page 12
Indicate picture number:


77
RICH LEGACY/ODIISEY Child Step 1
Individual #
Subject ID:School #
SubjectInitials
F M L
4 or more 3-6 times/weekNone 1-2 times/week
At least once
a day times/day2-3 times/day
Page 15
38. Over the past 12 months, what has been your typical exposure to other people’s smoke?
(“Exposed” is defined as a minimum of 5 consecutive minutes, during which you inhale other people’s smoke)
Select ONE only
For All Participants (Question 38)
CONFIDENTIAL QUESTIONNAIRE
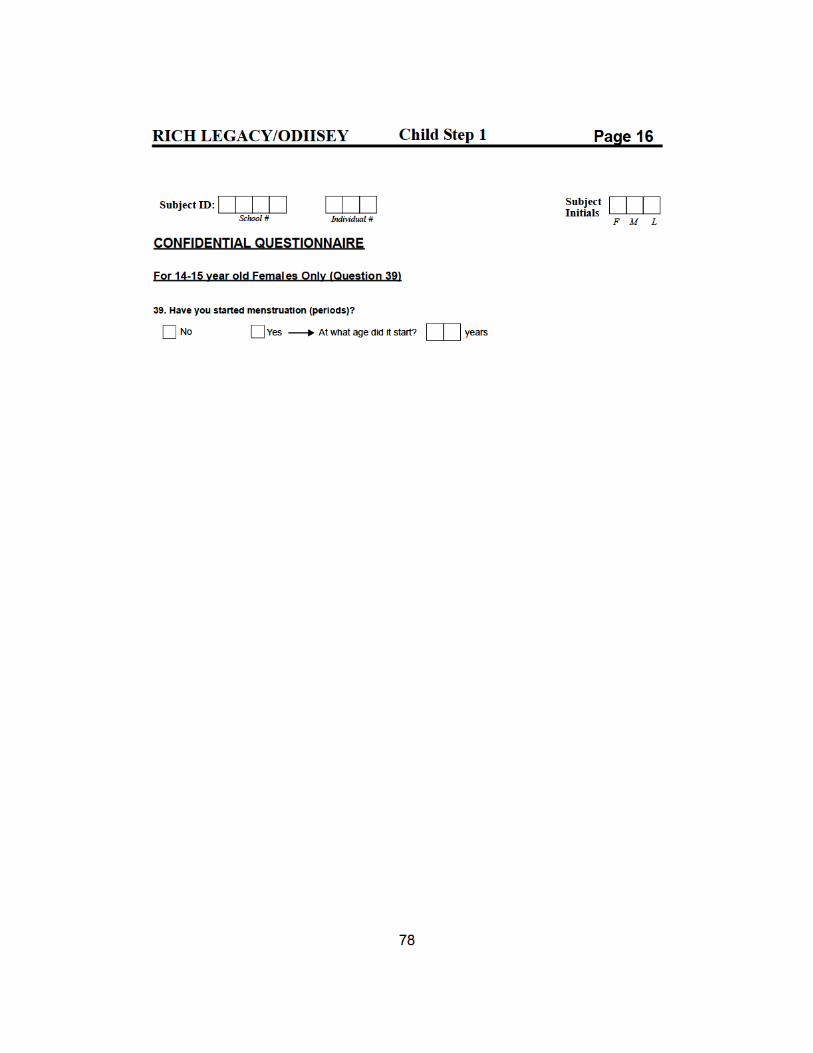

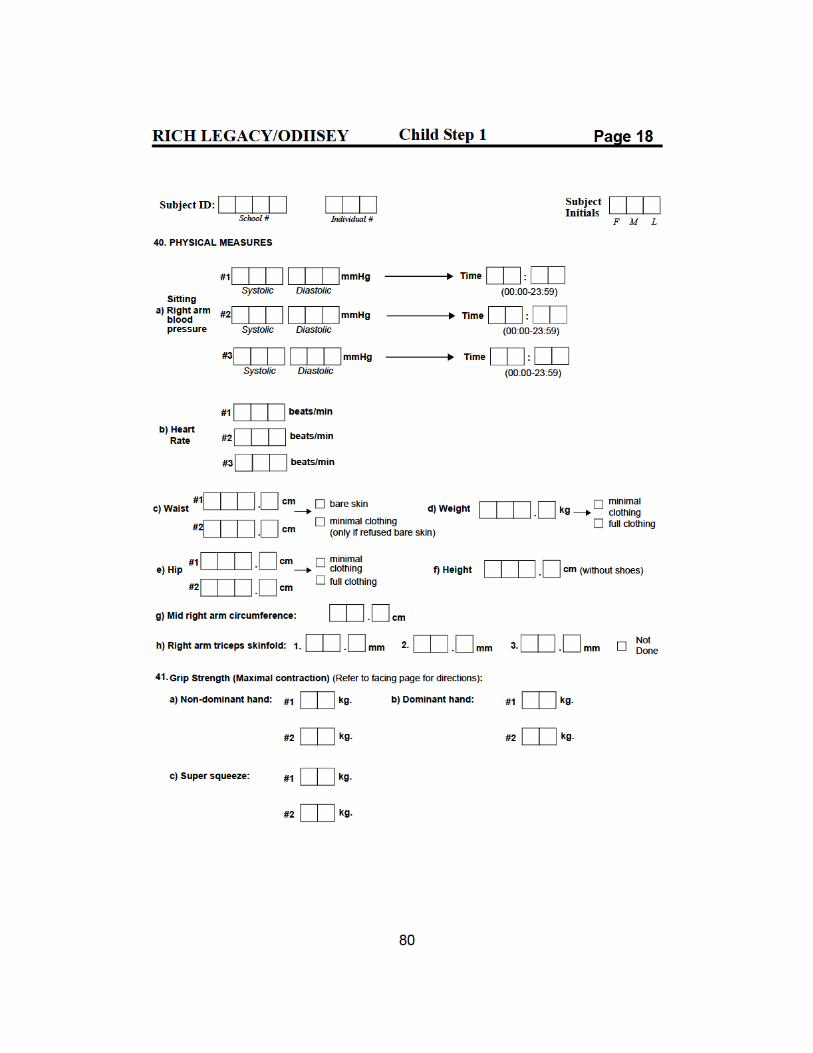

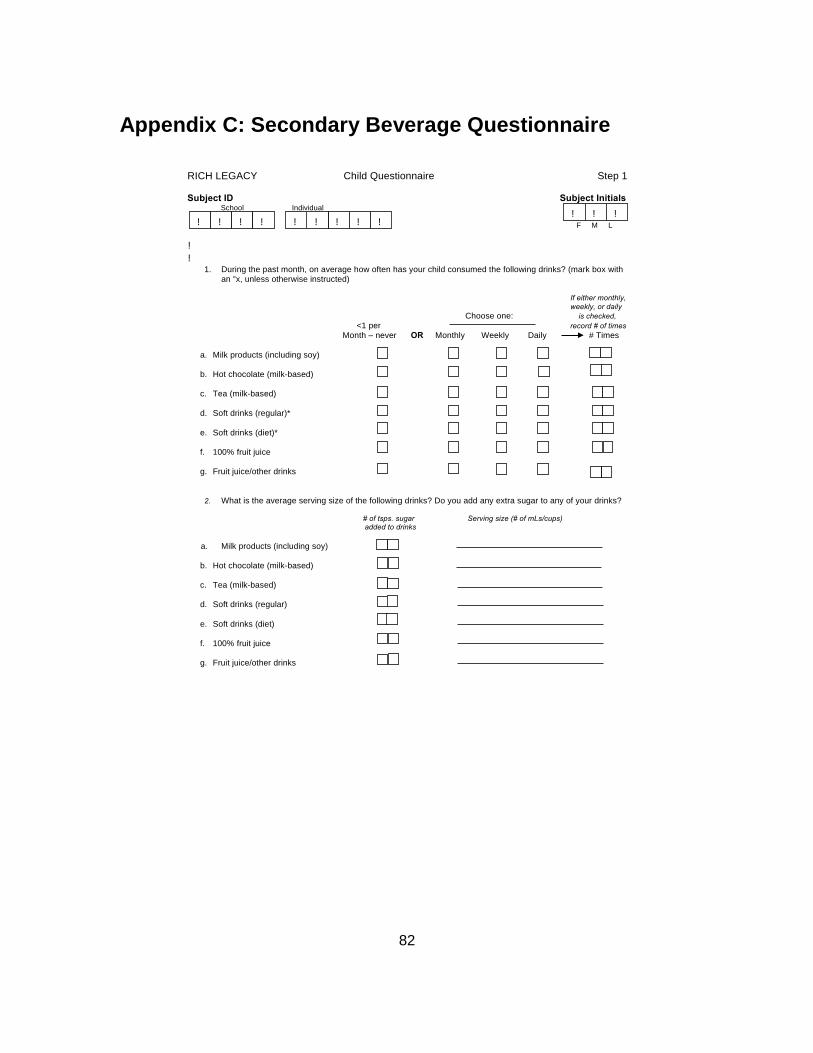
82
Appendix C: Secondary Beverage Questionnaire
RICH LEGACY Child Questionnaire Step 1 Subject ID Subject Initials School Individual
F M L
!
!
! ! ! ! !!!! ! !
! !
1. During the past month, on average how often has your child consumed the following drinks? (mark box with an “x, unless otherwise instructed)
If either monthly,
weekly, or daily
Choose one: is checked,
<1 per record # of times
Month – never OR Monthly Weekly Daily # Times
a. Milk products (including soy) b. Hot chocolate (milk-based)
c. Tea (milk-based)
d. Soft drinks (regular)*
e. Soft drinks (diet)*
f. 100% fruit juice
g. Fruit juice/other drinks
2. What is the average serving size of the following drinks? Do you add any extra sugar to any of your drinks?
# of tsps. sugar Serving size (# of mLs/cups) added to drinks
a. Milk products (including soy) b. Hot chocolate (milk-based)
c. Tea (milk-based)
d. Soft drinks (regular)
e. Soft drinks (diet)
f. 100% fruit juice
g. Fruit juice/other drinks

83

84
Appendix D: Participant Report Letter
RICH%LEGACY%Study
.%
Measurement% Results%
Measurement%Results% At%Optimal%Level%
%Not%At%Optimal%Level%
%

85
EXPLANATION%OF%THE%RESULTS%%
!1.% Waist%Circumference%(WC):%
%
Ideal%Waist%Circumference%
2.% Body%Mass%Index%(BMI):
Healthy%Body%Mass%Index%
3.% Body%Fat%Percentage:%
%
Healthy%Body%Fat%Percentage%
4.% Blood%Pressure%(BP):%
Healthy%Systolic/Diastolic%B.P.%
5.% Hand%Grip%Strength
%
Usual%Grip%Strength%%