Embed Size (px)
Citation preview

SUGAR INDUSTRY SEES LIGHT AT END OF THE TUNNEL�

After Brazil, India is the largest sugar producer in the world and it leads in sugarcane production. However, if alternative sweeteners such as khandsari (sort of raw sugar) and gur (jaggery) are included in the fold, then India would be the largest overall producer of sugar. Brazil accounts for approximately 22 percent of the global sugar production and India contributes almost 14 percent.
In all, approximately Rs. 1,250 crore is invested in this industry and it also provides livelihood for close to 2.86 lakh workers. The industry also benefits the nearly 2.5 crore people who grow sugarcane in India. In India, the major sugar producing states are Maharashtra, Gujarat, Uttar Pradesh, Haryana, Tamil Nadu, Punjab, Karnataka, Bihar and Andhra Pradesh.
As may be seen from the list above, sugar production is practised all across India. However, the peninsular region has been a better performer than the north Indian states and there has also been a gradual shift from north to south for the sugar industry. One of the major reasons is the better conditions available for cultivation in the peninsular part. The sugar industry in India is also highly localized owing to problems in transporting sugarcane. Sugar Production in India
In the 2014‐15 crushing season, the sugar production of India has seen an increase of 11.5 percent. The Indian Sugar Mills Association (ISMA) says that as of 31st March, India had produced 24.72 million tonnes of sugar and this was an addition of 2.84 million tonnes to the sugar production of 2013‐14. It is estimated that in the 2015‐16 season, 24.8 million tonnes of sugar will be consumed. ISMA estimates that due to the increased production in the year gone by, there will be a carryover stock of 8.5 million tonnes. There will be 2.5 million tonnes more than what is thought to be the standard requirement in these cases.
It is expected that in 2017, Indians will be consuming almost 28.5 million tonnes of sugar. Maharashtra is traditionally the leader when it comes to sugar production in India. Before Maharashtra, Uttar Pradesh was the leader. There are several reasons as to why Maharashtra occupies this place in the pantheon of Indian states that produce sugar. The state has a longer crushing period compared to other states and its rate of recovery is also significantly higher.
Maharashtra currently has almost 25 percent of the sugar mills operating in India and it accounts for nearly 30 percent of the entire sugar produced in India. In fact, the sugar mills in Maharashtra are supposed to be the biggest in the country. Most of these mills are located at the river valleys in the western stretches of the Maharashtra Plateau. Ahmednagar is among the leading centre of sugar production along with Kolhapur, Pune, Satara, Nashik and Solapur. Import and Export of Indian Sugar Industry
The Indian government has a rather strict policy when it comes to import of sugar. During 2014, it has raised the import duty from 15 percent to 40 percent with a view to discourage this side of the sugar trade and promote exports. Thanks to the increased import duty, refiners find it rather hard – economically unfeasible to be precise – to bring in sugar especially from countries such as Brazil, Pakistan and Thailand.
The Indian government provides a subsidy amounting to Rs. 4,000 per tonne with the aim to promote exports. This is provided for raw sugar shipments, where the volume is around 1.4 million tonnes. However, in spite of that, of late, Indian sugar industry has had a hard time in exporting raw sugar owing to the fact that prices have been consistently on a downward spiral. The situation is especially precarious at the market in New York, which is regarded as a benchmark.
Consumption of sugar and related sweeteners in India has increased in the last few years. One of the major reasons for the increasing demand for sugar is the growing population of India as well as improving economic conditions. Majority of the consumers of the sugar that is produced directly by mills are bakeries, local sweets and candy manufacturers. Together with the soft drink makers, they comprise almost 60 percent of the clientele. The major consumers of khandsari are locally operating sweets establishments. Gur is also used in the rural areas in its normal form as a sweetener as well as feed. Biscuit manufacturers, food products companies, pharmaceutical setups, and hotels and restaurants also consume fair quantities of sugar.
Market trends and prospects Prices
World sugar prices are projected to decline from historical highs at the start of the Outlook, but to remain on an elevated plateau and to average higher in real terms to 2020‐21, compared with the past decade. The margin between raw and white sugar – the white premium – is expected to decline from the high level in 2010 and then to average above USD 90/t over the projection period, reflecting increased sales of white sugar by some traditional sugar exporters and from new destination refineries in the Middle East and Africa.
World sugar prices are expected to follow a wave pattern over the projection period, similar to the past decade, as a result of a continuation of government policies that intervene in sugar markets in many countries and production cycles in Asia, particularly in India, that cause large, periodic swings in trade between imports and exports. As a consequence, world prices are projected to fall to a trough in 2012‐13 as production peaks in India and rises in other countries and additional exports are placed on (or lower imports are drawn from) the world market. Subsequently, the cycle in India enters the down phase leading to a shortfall in production and the need for large imports to meet consumption needs that boost the world price in 2015‐16. The upturn in the cycle then recommences leading to a further drop in world prices in 2017‐18 and so on.
Brazil, as the leading sugar producer and dominant global trading nation, has attained the status of a “price setter” on the world market with international sugar prices usually correlated with its relatively low production costs. Sugar production costs in Brazil, along with those of other major exporters of Australia and Thailand, have increased in recent times with the appreciation of their currencies against the US dollar. The size of the annual sugar cane crop in Brazil, together with its allocation between ethanol and sugar production are key factors underlying the projection of international sugar prices to 2020‐21. Sugar production in Brazil is expected to continue to account for less than 50% of its enormous sugarcane harvest which should approach 1 bn by the close of the decade.
Production and use of sugar
Sugar crops in many parts of the world are projected to expand in response to rising demand for sugar and other uses and relatively high market prices. World sugar production is expected to increase by 50 Mt to reach over 209 Mt in 2020‐21. The bulk of the additional sugar production will come from the developing countries and the main burden of growth will continue to fall on Brazil. Brazil has expanded production rapidly in the past two decades, but a slowdown in investment in new mills occurred after the financial crisis of 2008, slowing overall growth in following years. The recent surge in sugar prices has improved profitability and should trigger additional investment to come on stream within the decade, with output rising by around 11 Mt to nearly 50 Mt by 2020‐21.

India, the second largest global producer and the world’s leading consumer, is expected to boost production substantially to 32 Mt of sugar per year, on average, in the coming decade, or some 50% higher than in 2008‐10, when production fell sharply. Annual sugar output will continue to be subject to periodic large swings in response to the longstanding production cycle (Figure 6.4). Some other countries of Asia, such as China and Pakistan, are also expected to continue to experience milder forms of production cycles, which contribute to fluctuations in production and their import volumes. Outside this group, an expansion drive underway in Thailand is expected to continue as investment projects currently in the pipeline come on stream, lifting production to around 8.7 Mt by 2020‐21, and maintaining its position as the world’s third largest producer.
In contrast, to the expansion trends in the developing world, the traditional sugar industries in a number of developed countries are expected to witness static or lower production over the coming decade. For instance, in the European Union quota based sugar production has declined with policy reform and is expected to stabilise around 13.4 Mt wse (14.4 Mt rse), with a continuation of existing production quotas, to equilibrate the domestic market in a context of stable consumption, a fixed volume of subsidised exports and projected higher imports. Some additional out‐of‐quota sugar beet production is expected to arise over the projection period for use in ethanol production and the chemical industry.
Production of sugar in the United States is expected to show little growth and to remain well below the 85% minimum allotment level of the 2008 FCE Act. US producers are expected to focus on improving their sugar margins by cutting costs and essentially leaving Mexico to fill the expanding gap between stable production and higher US consumption requirements.
Assured access to higher prices in the slowly growing US market is expected to encourage some further investment and growth in Mexico’s sugar production to 2020‐21. The sugar industry in Australia, although devastated by flooding and a cyclone in 2010, is expected to recover in coming years. However, with continuing pressure on land available for sugarcane production, sugar producers will likely focus on higher productivity, based on farm consolidation and improved cane varieties and higher sugar yields, rather than cane area expansion, in lifting output to around 5 Mt in 2020‐21. The sugar industry in the Russian Federation has undergone a transformation in recent years and is projected to continue to expand production, under the stimulus of high domestic support measures, to reach nearly 5 Mt by 2020‐21.
Global sugar consumption has continued to increase despite the continuing economic difficulties in many developed countries, compounded by the period of high sugar prices and increased volatility. This has slowed sugar use at the start of the Outlook period and slower consumption growth is expected to continue over the longer term as world sugar prices average higher in real terms. Global consumption is projected to grow at 2.2% p.a. to 2020‐21, and down from 2.6% p.a. in the previous ten years. The developing countries will continue to experience the strongest growth in sugar consumption, fuelled by rising incomes and populations, although with considerable variation between countries. The sugar deficit regions of Asia and the Far East as well as Africa, will be responsible for most of the expansion in use. In contrast, sugar consumption in many developed countries, with their mature sugar markets, are expected to show little or no growth. Total consumption in these countries is expected to increase from 48Mt to nearly 52 Mt over the projection period. This reflects, among other things, slowing population growth and dietary shifts that are underway as a result of increasing health awareness and concerns with obesity and related health issues.

Trade
Over the last decade, there have been a number of structural changes affecting the evolution of trade patterns which will continue to influence international sugar transactions in the coming period. These include increased concentration in sugar export trade, with a smaller number of global exporters, and a decline in the volume of white sugar traded internationally. The reform of the sugar regime in the European Union led to an abrupt decline in white sugar exports, of the order of 6‐7 Mt, as production quotas were progressively reduced below consumption requirements. As a consequence, the EU has switched from a large net exporter of white sugar to a large importer of mainly raw sugar for further refining and sale in the domestic market.
The white sugar trade is expected to recover over the coming years. This will occur as more refined sugar is exported by traditional exporters in response to the high white sugar premium at the start of the Outlook and as new destination refineries in a number of countries in Africa and the Middle East progressively come on stream and begin to export increasing quantities of white sugar to neighbouring countries and regional markets.
Brazil is expected to consolidate its position as the leading global exporter and will account
for over 55% of global trade and over 63% of all additional sugar exports by the close of the projection period. While the bulk of Brazil’s exports will continue to comprise high quality raw sugar (VHP), which increase to 21 Mt in 2020‐21, the composition of trade will also start to favour white

sugar shipments which grow by 50% and amount to over 12 Mt, in the same period. The growing concentration of global sugar exports is not without risks for sugar users as world export supplies depend increasingly on the growing conditions of a single country. This may be another factor, in addition to production cycles in Asia, which contributes to future market volatility. A possible counterweight is that a majority of Brazil’s sugar cane will continue to be used for ethanol production and many mills have the capacity to produce both sugar and ethanol. Brazil also remains the only exporter that can switch 5‐10% of milling capacity between sugar and ethanol production within a year in response to changes in relative profitability between the two end uses. This flexibility should help assure sugar production and export availabilities, when relative prices periodically favour sugar over ethanol production.
In terms of other leading exporters, Thailand plays a unique role in Asia as the only
consistent producer of a large sugar surplus and with a natural trade advantage, along with Australia, to service the large and ballooning sugar deficit in that region. Exports from Thailand, which is ranked number two in the world, are projected to grow to around 5.8 Mt by 2020‐21, exceeding the 2003 record. In the case of Australia, increased production over the projection period should support exports of around 3.8 Mt by 2020‐21. Strong demand for HFCS in Mexico, which is expected to grow to 75% of total sweetener consumption and similar to the situation in the US, will substitute for sugar used in beverage manufactures, releasing surplus sugar for export to the US market. Mexican exports to the preferred US market are projected to exceed 1.8 Mt by 2020‐21.
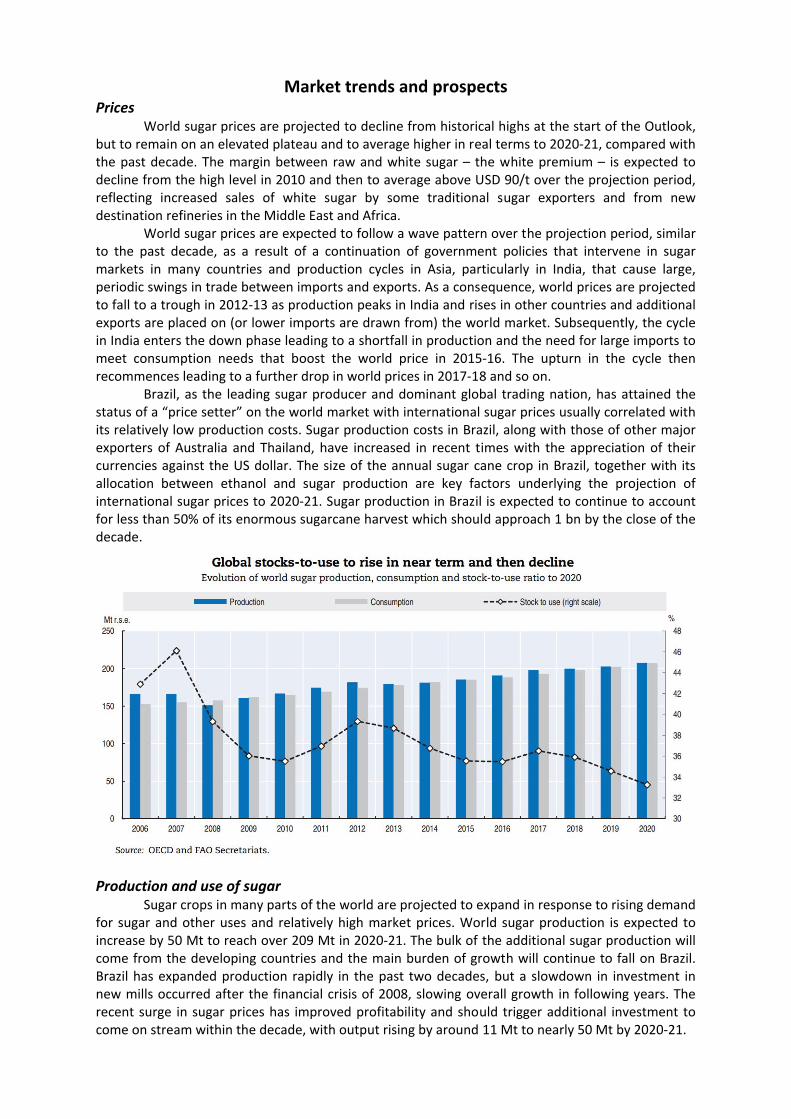
Sugar importers make up a broader, more diversified group of countries. A significant development in 2010‐11 was that China exceeded for the first time the TRQ of 1.95 Mt established on sugar imports at the time of its entry to the WTO in 1998. Rapid economic growth and urbanisation trends are promoting the industrial use of sugar in food manufacture and preparations. Along with low per capita sugar consumption levels of only 11 kg per person in the population at large and tightening government controls on the production and use of artificial sweeteners, these are expected to lead collectively to strong growth in sugar use in China in coming years. Sugar disappearance is projected to grow by over 3% p.a., exceeding the growth of production which is increasingly limited by tightening water availability, and boosting sugar imports to over 5 Mt by 2020‐21. This will make China the largest importer exceeding that of the EU, US and the Russian Federation.
High world sugar prices at the onset of the Outlook period and declining internal prices with
sugar policy reform have made the European Union a less attractive destination for preferential exports from LDC countries under the EBA initiative and Economic Partnership Agreements. As world prices recede, the EU as an assured market will likely become an attractive destination once more for many of these countries, although ongoing problems with infrastructure and technology adoption could constrain some LDC countries from exploiting fully their export opportunities. The United States sugar market remains heavily insulated from the world market with prohibitive tariffs and safeguard measures on imports in excess of minimum TRQ volumes. With duty‐free and unrestricted imports expected to grow from Mexico under NAFTA over the coming decade, US imports under its WTO TRQ and other trade agreements are projected to be maintained at minimum levels.

Total US imports are projected to reach 3.6 Mt in 2020‐21, and are not assumed to trigger
the Feedstock Flexibility Program (FFP) under the FCE Act for converting excess sugar supplies to ethanol in order to maintain domestic sugar prices above support levels. For its part, Mexico is expected to backfill periodically from the world market to assure its domestic consumption requirements and exports in periods of lower production. Finally, imports of the Russian Federation, which historically had been a leading destination for white sugar, before switching in the early 1990s to raw sugar imports for domestic processing, are projected to decline to around 1 Mt in 2020‐21, as expanding domestic production and stable consumption lead to further import substitution.
India: The role of policies in the sugar production cycle The international sugar market remains one of the most volatile of all commodity markets.
One of the contributory factors to this volatility is policy‐induced production swings among some Asian countries, particularly India. A longstanding feature of the sugar market in India is the cyclical nature of production, where 2‐3 years of surplus are followed by 2‐3 years of deficit. In recent years, the cycle has been more pronounced, with larger swings in production and trade. After an increase in 2006/07 to 30.1 Mt, 33% over the record 2002/03 crop, sugar output declined to 15.2 Mt in 2008/09 and is currently estimated at 28 Mt for 2010/11. Trade generally follows a similar trend, with imports exceeding 2 Mt during the deficit phase of the cycle, replaced by large exports during the surplus phase. Weather patterns of course are a key factor as sugarcane yields are greatly affected by the level of rainfall, notably during the critical monsoon season. But, domestic sugar polices amplify the cycle through their effect on incentives along the sugar value chain, including for farmers and sugar factories.
There are four broad areas of public intervention that regulate the sugar market in India. First, both the Central and the State Governments set a price support for sugarcane. In general, the Central Government announces a price level, referred to as the statuary minimum price for sugar (SMP), at which sugar factories are legally required to pay farmers for their sugarcane. The SMP is then raised by State Governments to account for differences notably in productivity and transportation cost. The second area of intervention is through restrictions on sugar quantities to be sold on the market, as well as imposing on the sugar factories a so‐called sugar levy, by which they are required to sell at below market price to the public distribution centres. In addition, the government regulates sugar trade via export limitations and marketing restrictions, such as limits on private stockholdings.
Initially, the government introduced these polices to sustain the income of sugarcane farmers while at the same time protecting consumers from sugar price inflation. Reconciling these objectives is a challenge as fixed sugarcane prices are disconnected from the relatively market based sugar prices. In the years of surplus production, sugar factories are caught in a price‐cost squeeze

with low sugar prices and relatively elevated fixed sugarcane costs. As sugar mills struggle to pay farmers at the obligatory price, growers eventually substitute alternative crops for sugarcane. As cane area is reduced and input use on standing cane is reduced, cane production falls significantly – this corresponds to the trough of the cycle. The downfall in production shifts the sugar balance into the deficit phase and provides an upward support to sugar prices. Eventually, sugar factories become solvent and begin to repay arrears to growers. As the incidence of default declines, sugarcane cultivation becomes attractive once more, shifting the domestic sugar balance into the upside phase of the cycle. Hence, the accumulation of arrears, brought about by a lack of instantaneous alignment between sugarcane and sugar prices, is causing, to a great extent, the cyclical nature of sugar production in India. Further, inelastic supply in the short‐run, because of the perennial nature of sugarcane, means that farmers cannot adjust quickly to the realities of the market, hence prolonging the upside and downside phases of the cycle.
Against a backdrop of recurrent large swings in production, sugar demand in India has been growing steadily at about 4% per year over the past 10 years. Therefore, the domestic production and consumption balance moves from periods of surpluses and deficits, leading to often significant changes in the trade position. For instance, in 2007/08, exports reached 4.7 Mt (9.7% of world exports), but in 2009/10, these were replaced by imports of about 4 Mt (7% of world imports). These changes in trade channel the swings in domestic production to the international sugar markets, contributing to its volatility, especially during periods of global market tightness. The potential for expanding sugar production in India exists and can be fully exploited if adjustments were introduced to ensure a market driven relationship between sugar and sugarcane prices. Also, relaxing some of the existing measures, such as the monthly releases, could provide sugar factories with some cash flow flexibility. The use and valorisation of sugarcane by‐products, such as ethanol, electric power, and other derivatives, can cushion against low sugar prices and other market risks. Clearly, the liberalisation of the sugar industry can only be undertaken within the context of broader domestic reforms, because of the linkages on both demand and supply sides that prevail in agricultural commodity markets.
The next six months are going to be crucial for the Indian sugar industry. Global and domestic markets are witnessing a reversal of the two‐year supply glut leading to fall in prices. Sugar prices in the domestic market have risen by Rs 8‐10 per kg across India. However, the industry itself is being highly cautious about building up hopes. While sugar prices have risen by more than 50% in certain areas, it still hovers significantly below the cost of production in the largest sugar producing states.
“If we take an all India average, the cost of production (CoP) of sugar (Rs 32 per kg) is still higher by Rs 5‐8 per kg than the prevailing ex‐mill prices,” admitted Abinash Verma, Director General of the Indian Sugar Mills Association (ISMA). Though the gap in CoP and ex‐mill prices might seem large, it is nothing when compared to the lows that the sugar industry faced during August 2015, when prices hit Rs 19 per kg – almost half that of CoP.
The following months have witnessed a race by sugar companies to remove excess stock from the market and prop up prices. The government’s push to increase exports by offering a ‘Rs 45 per tonne of cane’ subsidy for mills that completed their export quotas has contributed to the reducing stock. But, the major factor has been the decreased domestic production during the current crop season.
The continued upswing in sentiment in both the commodities market and the stock market has been buttressed by market speculation that the acreage for cane for the next crop season, to begin in six months, will be even lower than this year’s. “But that is where we are cautious, the price increase is being driven by reducing stocks. But there will be no true recovery unless global prices keep increasing and exports become remunerative again combined with a continuing decrease in domestic production,” said a owner of a leading South Indian sugar mill.
ISMA is a bit more optimistic. “Indian sugar mills have already contracted for 1.2 – 1.3 million tonnes of exports. And there is another six months left to reach the 3.2 million tonne export target set by the government.

EID PAR
turnaroubuying iupswingmarket seven lowline quiimmedia
BANNA
sugar faare primexports.witnessimirror tat the al
RRY SUGARSugar stocksund. Againstnterest at log in sentimenspeculation twer than thiste resolutelate trend‐lin
ARI AMMANBannari Amctories, in Tmarily engag. On the ching more dehe movemell time high o
R s have beent this backdower levels ant in both ththat the acres year's. Froy and heade target of 2
N SUGAR man Sugar amilnadu anged in the mharts too weeclines for mnt seen in thof 1350 to be
n in the newdrop the notand attempte commoditeage for canem the chartsed higher. W220 been ach
is a prominend Karnatakamanufacture e can see tmore than 1his sector. We surpassed i
ws as the glotable namesting to breacties market ae for the nexs we see thaWith prospehieved in the
ent player ina. The distilleof white cr
that the sto.5 years. Th
With the pricif the market
obal and doms like this cch the near and the stocxt crop seasot the prices ects of mor next few da
n the sugar eries unit is rystal sugarsock has beehe strong mes continuint reinstates t
mestic markounter are term resistak market hason, to begin are holding e rise in stoays.
industry. Thalso situateds, industrial n in a contomentum inng the upwarthe newfoun
kets are witnwitnessing ances. The cos been buttrin six monththe long terore can loo
he company d in Tamilnaalcohol andtinuous ascen this stock rd climb we nd bullish bia
nessing a a steady ontinued ressed by s, will be m trend‐ok at the
has two du. They d granite ent after looks to can look as.

BALRAM
are beinnicely anlarger untrends ryet the cas every
DHAMP
neutral on the pNorthershortagethis coubreacheas the nbreakoucontinue
MPUR CHINSugar stocksng driven by nd have heldnits that is wesume upwacorrections ty swing lets t
PUR SUGARDhampur Sualcohol, alcopower side isn belt provide of resourcunter after ted and sustainews flow in ut makes it med towards 9
NI s are in the global rise ind the gains twell managedard again. Thto be continhe RSI drop
R ugar has exteohol‐based cs on focusseddes surplus pes which hethe consolidins. The run sugar secto
more interest98 levels.
news for a wn sugar pricehru the reced and has a hhe recent breued till 88 letill 60 levels
ended its pohemicals andd to impact tpower to conlps in varioudation in thpast 32 leve
or as well as ting in setup
while and thes and talks oent downfall high beta witeakout from evels. Momeand resume
rtfolio beyond biofertilizethis counter ntinue with tus progressee lower levels have witnpower sectop as RSI has m
he good tidinof shortagesof the markthin the sectthe 90 levelsntums indicae the trend fu
nd sugar to ers. Not only equally. Thethe operatins to keep covels which snessed long or. The stabmoved past
ngs continues. All sugar stket. Balrampuor and wouls has been reate a strong urther.
renewable ethe sugar see power planng activities dontinued. Thited aroundterm buyersbility at the h60 levels wi
e to flow. Thtocks have lour Chini is ond perform wetraced by 1Uptrend to
energy, alcohector, but gonts situated mdespite of cae long term d 60 levels s coming intohigher levelsth the uptre
he trends ooked up ne of the well when 127% and be intact
hol, extra ood news mostly in arnage or trend in has now o picture s and the end to be
DWARI
This stocaccomp
channel in price which is200leve
DALMIA
months.consolidAny dipnear 75‐the upsi
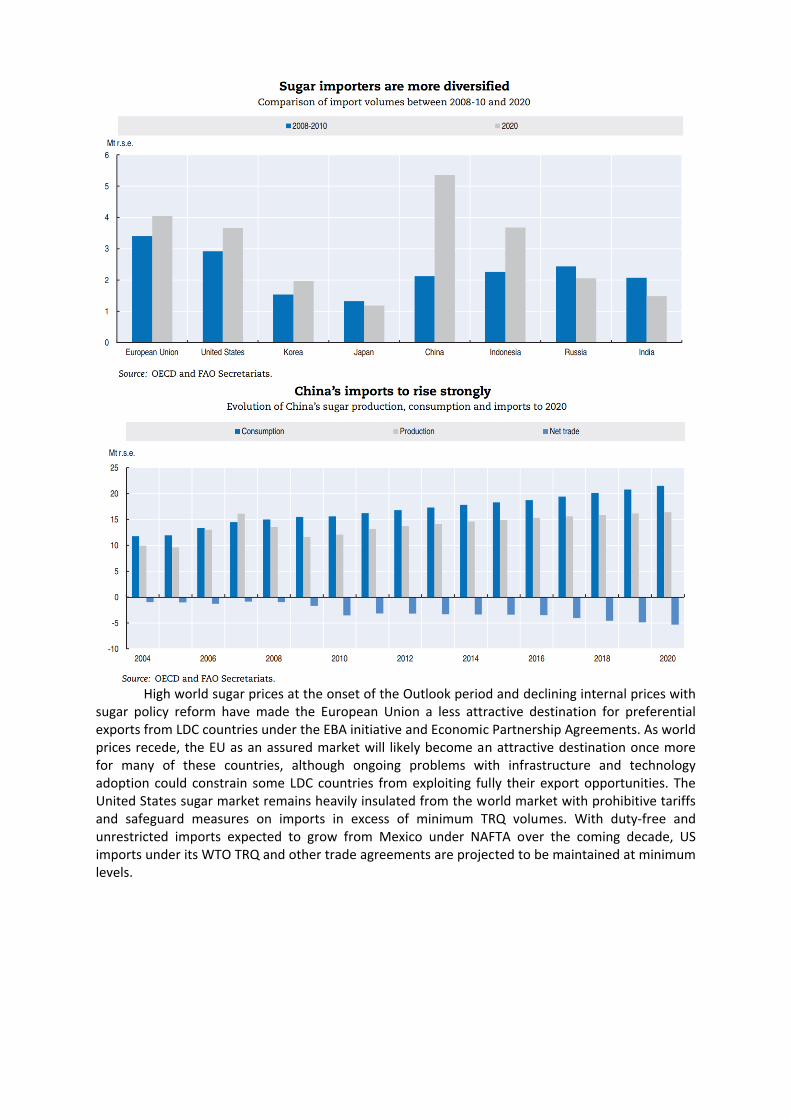
KIESH SUGASugar Stock ck saw an amlished with rLooking at twith supporshould be
s its previousls which is al
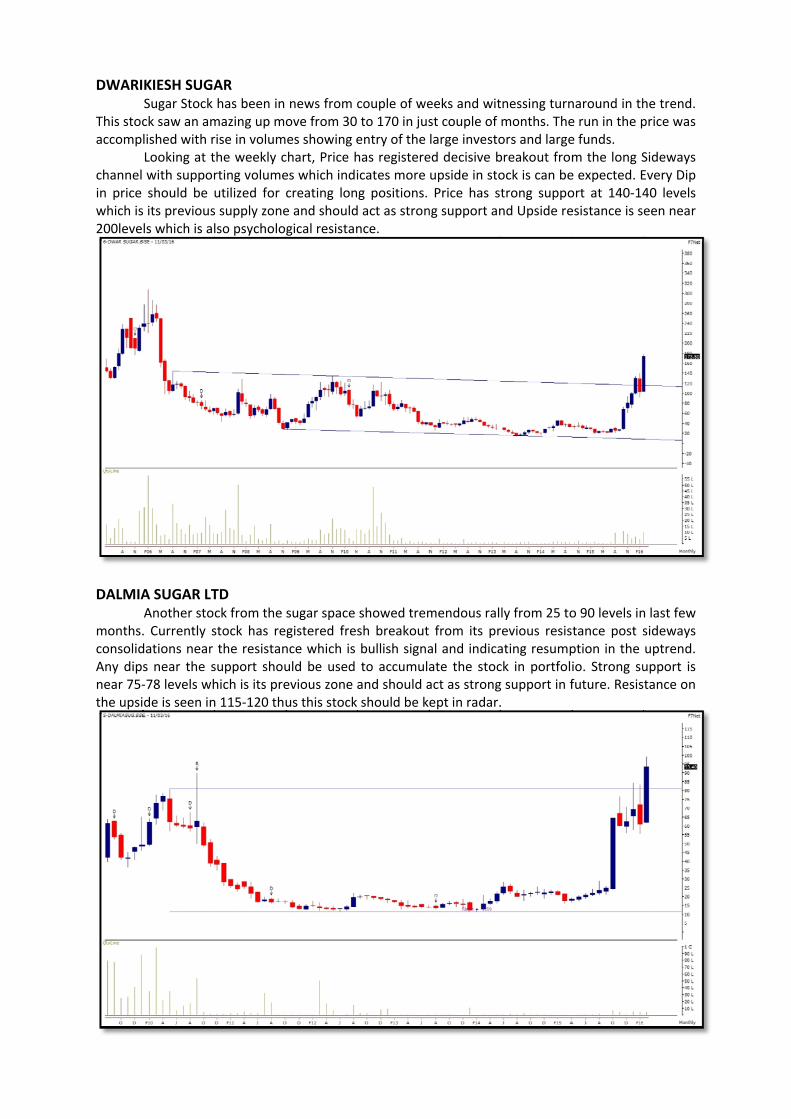
A SUGAR LTAnother sto. Currently sdations near s near the s‐78 levels whde is seen in
AR has been in
mazing up morise in volumthe weekly crting volumeutilized for s supply zonelso psycholo
TD ck from the stock has rethe resistansupport shouhich is its pren 115‐120 thu
news from cove from 30 es showing echart, Price hes which indicreating lone and shouldgical resistan
sugar space gistered fresnce which is uld be used evious zone aus this stock
couple of weto 170 in jusentry of the has registereicates more g positions. d act as stronnce.
showed tremsh breakoutbullish signato accumuland should ashould be k
eeks and witst couple of large investoed decisive bupside in stoPrice has s
ng support an
mendous ral from its pral and indicaate the stocact as strongept in radar.
tnessing turnmonths. Theors and largebreakout fromock is can betrong suppond Upside re
ly from 25 torevious resisating resumpck in portfolg support in f.
naround in the run in the pe funds. m the long Se expected. Eort at 140‐14esistance is s
o 90 levels intance post sption in the io. Strong sufuture. Resis
he trend. price was
Sideways Every Dip 40 levels een near
n last few sideways uptrend. upport is tance on

TRIVEN
Companturbine to custoassistan
testing dexperienas strenexpanditrend. O
SHREE R
segment
Renuka across. Pevery atvolumesbuyers aimportafor brea
NI ENGINEERThis counteny holds 7 subusiness in Bomers from tce to after saThe rally padown the sunced some sgth for the rng range he
On the long ru
RENUKA SUThe compant produces pA good movSugar fails toPast trading ttempt of ths and some are suggestent levels of 3kout.
RING r is specialigar mills witBangalore. Cthe requiremales and refust 2003 has upports againelling and drrally to contlps the stockun, this scen
UGAR ny’s portfoliopower from bve has been o attract buysessions shohe rise dragprice action
ed entering 38.2% aroun
zed in manuth a standaloCompany’s tement mappinurbishment abeen seen on. The recenrops into 38tinue and dipk to correct inario is expec
o consists ofbagasse for switnessed oyer’s interesows the dowgging this con which is inif only the pnd 16.56 leve
ufacturing oone distilleryechnical servg to solutionand maintenon a downtrt high of 55..2% retracemp is recommitself well focted strong a
f integrated ssale to the stn the wholet despite of wn sloping reounter towan absence, wprice breachels. Till then,
of sugar as wy all located ivices workfon advisory toance. rend with th.60 was the ment. Largermended to acr new buyeras the mome
sugar and bitate grid in Ine sector follogood managesistance whards lower lwe would nes out the d, we can kee
well as in en prime arearce provides
o machinery
e lows arounprevious higr timeframe ccumulation rs to enter bentums show
io‐energy. Thndia and Braowed by the gement and hich makes cevels. Unlesot suggest gdown‐slopinep this count
ngineering bas of UP ands end‐to‐endsupply to ins
nd 10 made gh made whesuggest the in the portfut fails to viows positive bi
he alternativzil. stocks in thiproduction ontinues press and until,getting in. Pg trend lineter on radar
business. d a steam d support stallation
recently ere price recovery folio. The olate the ias.
ve power
is sector. numbers essure at , we see Positional and the and wait

Outlook The outlook for the sugar industry remains grim since the industry is facing a tough time as
cane arrears still seem to be mounting with higher sugarcane prices and lower price of produce. The cost of production of sugar in India is high making sugar uncompetitive and exports unviable. Low recovery of sugar from sugarcane poses a problem for sugar industry. It has become difficult for sugar companies to pay cane price of farmers and service the debt under current circumstances. Indian sugar mills do not have sugar plantations of their own and hence do not have control over quantity and quality of sugarcane supplied by various cane growers. Another problem of sugar industry is that the by‐products of sugar mills like molasses and bagasse are not fully utilized. The government has been taking steps from time to time to bring things under control. The de‐regulation of the sugar sector was to improve the financial health of the sugar mills, increase the cash flow, reduce their inventory cost and also result in timely and better payment of cane price to sugarcane farmers in the country.
In order to make Indian sugar industry competitive, the government should rationalize cane pricing policy, at par with norms across the world. The government should develop sustainable mechanism to dispose‐off the surplus sugar. In addition, it should encourage ethanol blending programme to balance surplus sugar. A revenue sharing formula should be evolved between the sugar mills and the cane farmers in the ratio of their relative cost as per the recommendation of the Rangarajan Committee.