Embed Size (px)
Citation preview

Successful promotion of
Solar Water Disinfection
(SODIS)
Thesis
presented to the Faculty of Arts of
the University of Zurich
for the degree of Doctor of Philosophy
by Andrea Tamas from Germany
Accepted in the spring semester 2009 on the recommendation of Prof. Dr. Hans-Joachim Mosler and Prof. Dr. Heinz Gutscher
Zurich, 2009


CONTENTS – OVERVIEW
Acknowledgements Page 5
Summary
Page 7
Table of contents Page 11
Introduction
Page 19
Methods Page 31
Chapter 1:
Behavioral models for the consumption of SODIS, boiled and untreated water
Page 59
Chapter 2: Why do people stop using SODIS?
Page 87
Chapter 3: Influences of prompts and public commitments
Page 113
Chapter 4: Effects of different communication strategies
Page 145
Discussion Page 161
References
Page 185
Curriculum Vitae Page 200


V
ACKNOWLEDGEMENTS
This dissertation is a result of a collaboration between the Swiss Federal Institute for
Environmental Science and Technology (Eawag; Dübendorf, Switzerland) and the Fundación
SODIS (Cochabamba, Bolivia). Further institutions that were actively involved are the SODIS
Reference Center at Eawag (Dübendorf, Switzerland), the Ministry of Health of Chuquisaca and
the Departmental Health Service (SEDES; Sucre, Bolivia), the communication company
i-estrategas (Cochabamba, Bolivia), Obispo Anaya (Cochabamba, Bolivia), SACOA (Santa Cruz,
Bolivia), and the University of Zurich (Switzerland).
Funds are acknowledged for Study I from the Swiss National Centre of Competence in
Research (NCCR) North–South: Research Partnerships for Mitigating Syndromes of Global
Change, co-funded by the Swiss National Science Foundation (SNF) and the Swiss Agency for
Development and Cooperation (SDC), and for Study II from the UBS Optimus Foundation,
Switzerland.
At Eawag, my greatest and very special thanks go to my main supervisor Prof. Hans-
Joachim Mosler for all those uncountable discussions about new and unconventional SODIS
promotion strategies. He was always open to innovative thoughts and left enough space for my
own ideas and development. Furthermore, I would like to thank Robert Tobias for his always
critical eye on questionnaires and analyses. As it would fill the entire page to thank all Eawag
people individually, I would like to thank all SIAMese together. You really are a great department.
From the Fundación SODIS, I particularly thank the former directorate, Marcelo Encalada
and Matthias Saladin, who always supported our research ideas and approaches.
During my various stays in Bolivia, I experienced loads of friendliness and help. My
deepest thanks go to Carmen Camargo, who became a true friend and was always at my side
during both projects. Furthermore, I would like to thank all the interviewers who worked with us,
as well as Liceth and Benigno from the Fundación SODIS, Armando and Dillma from SACOA,
Norma from Obispo Anaya, the Bolivia Guesthouse for the great hosting, and my dear friend
Laura for showing me the Bolivian way of life.
At the Social Psychology Department of the University of Zurich some very great students
have studied or are still studying. Huge thanks go to Jennifer Inauen, Sabrina Fugazza,
Simonne Rufener, Alexandra Huber, Chantal Bourloud, Esther Bisig and Jasmin Meyer, all
students who were of invaluable support for the smooth operation of the projects. The head of
this wonderful department, Prof. Heinz Gutscher, I thank for taking over the co-referat.
Silvie Kraemer, Sören Vogel, Eike von Lindern, Jennifer Inauen and Michele Steiner I
thank for proofreading the manuscript.
Last but never least, I would like to express my deepest thanks to my family and Michele
for their love and patience during all those years, no matter if I was home or abroad.


VII
SUMMARY
The consumption of untreated source water is still among the major causes of diarrhea
and child mortality in low income countries. Roughly one third of infant mortality is caused by
such waterborne diarrheal diseases (WHO, 2007). To combat this preventable global burden,
the Millennium Development Goals (MDGs) have called for halving the proportion of people
without sustainable access to safe drinking water and basic sanitation by 2015.
The promotion of household water treatment and safe storage systems (HWTS)
represents an effective and realistic method to accelerate health gains to those without reliable
access to safe drinking water (WHO, 2007). A variety of technologies for water treatment at
household level exist and many are widely used in different parts of the world (e.g. boiling,
filtering, chlorination, solar disinfection etc.). According to the World Health Organization (WHO,
2008), solar water disinfection (SODIS) is one of the most promising and accessible
technologies for household water treatment. The method consists of exposing water-filled,
transparent plastic bottles to full sunlight for about one day. Experiences of efforts promoting
SODIS or other HWTS, however, have shown that the uptake of treatment techniques has often
been slow and not initiated through information only. Consequently, investigations are needed
on people's motivations to use HWTS, to understand how households can be encouraged to
take up these new methods, and how their behavior can be changed sustainably (Zwane &
Kremer, 2007).
The overall objective of the present work is the investigation of how to successfully
promote the consumption of SODIS water. More specifically, questions investigated are: Which
are psychological drivers of safe and unsafe water consumption behavior, particularly the
consumption of SODIS water? What are reasons for discontinuing water treatment with SODIS?
How can the development of a long-term habit be successfully supported with specifically
designed interventions? Which type of communication strategy is most cost-effective in terms of
reaching people and changing their behavior towards SODIS water consumption during SODIS
promotion campaigns?
For understanding the behavior change process, an integrative model based on four
behavior change theories was developed. The considered behavior change theories were all
stage models, namely the "Transtheoretical model" (Prochaska & DiClemente, 1982, 1983), the
"Innovation decision process" (E. M. Rogers, 1983, 2003), the "Model of action phases"
(Heckhausen & Gollwitzer, 1987; Gollwitzer, 1996), and the "Health action process approach"
(Schwarzer, 1992, 2008). The phases derived are problem awareness, persuasion, uptake and
habituation, with the first two involving motivational and the latter two volitional processes.
These phases are not understood strictly linear, relapses from later to earlier phases may occur.
Specific factors of the various stages of the behavior change process were investigated for

VIII
understanding the consumption of SODIS, boiled and untreated water. The investigation of the
discontinuance of SODIS use was guided by the same model with a special focus on the
habituation phase. The mode of operation of two habit supporting interventions, prompt (e.g. De
Young, 1993) and public commitment (e.g. Dwyer, Leeming, Cobern, Porter & Jackson, 1993),
was investigated using a range of so-called behavior near factors. These represent processes
taking place in the habituation phase, and habit supporting interventions are assumed to
operate via these factors. Implementation intentions, perceived habit and commitment were the
most prominent ones under investigation. The selection of communication strategies was on
one hand based on the classification into mass and interpersonal communication strategies (E.
M. Rogers, 1995), on the other hand this classification was supplemented by experience driven
considerations.
Two data sets are the basis of this thesis. Questionnaire measurements took place during
two studies where SODIS was actively promoted in (I) periurban and (II) rural areas of Bolivia.
Both data collection designs were longitudinal panel designs with four measurement time points.
The time frame, however, of the two studies was different. While Study I had a two months
highly active promotion phase and a seven months inactive phase, Study II consisted of eleven
months constant but less intensive promotion activities. Study I was designed to investigate the
impacts of different communication strategies and the two habit supporting interventions, prompt
and public commitment. In addition, due to its inactive phase, it was possible to study the
sustainability of the SODIS promotion campaign and reasons for behavior discontinuance.
Study II covered a larger area than Study I and was designed for the investigation of the same
habit supporting interventions as were used in Study I. Moreover, Study II provided the data to
calculate the behavioral model regarding the consumption of SODIS, boiled and untreated
water.
The detailed analyses of the complete water consumption pattern at the end of Study II
revealed that the more SODIS water is consumed, the lower is the amount of consumed
untreated water, whereas the proportion of boiled water is nearly constant with approximately
25% of the total daily water consumption. Of the total investigated sample, only 17% do not use
SODIS at all after eleven months of SODIS promotion campaign. However, the prepared
amounts vary considerably. Only those 25% of the SODIS users who treat more than 80% of
their daily needed water with SODIS, do not or very little consume untreated water. The
analyses of the integrated behavior change model for the behaviors SODIS, boiled and
untreated water consumption confirm the usefulness of the model, particularly the inclusion of
the habit phase. Of the motivational phases, problem awareness does not seem to play such an
important role, whereas affective beliefs such as liking and the taste belief are of predictive
importance for all water consumption intentions. The behaviors, in turn, are all influenced by the
behavioral intentions, which indicates the importance of this transition measure. For two of the
three water consumption behaviors, the influence of habit proved to be even stronger than that

IX
of intention, underlining the importance of investigating habit development in addition to
motivational processes.
Into the same direction points the analysis of the discontinuance of SODIS use. After a
seven months non-promotion phase in Study I, about 55% of former SODIS users have dropped
the behavior. In general, these relapsers have lower values than continued users for all factors
of the behavior change process. In addition, the further the behavior change process advances,
the greater are the differences between relapsers and continuers, and the lower is the level of
the factors for relapsers resulting in the largest differences during the habituation phase. It can
be reasoned that the causality for people being relapsers lays mainly in the missing habit, which
they have not managed to maintain during the inactive phase in contrast to those who stayed
users. Interestingly, among relapsers as well as continuers, two different types of relapsers and
continuers were identified. Low-value relapsers (referring to the values of the factors of the
behavioral model) differ from high-value relapsers mainly in affective beliefs, such as liking and
the taste belief, the injunctive norm, intention and cognition intensity. High-value relapsers
interestingly have values almost as high as low-value continuers, only differing in the degree of
habit. Only high-value continuers seem to be stable and do not show a decrease in critical habit
variables over time, whereas low-value continuers still need to strengthen their habit.
The applied habit supporting interventions, prompt and public commitment, are both able
to increase chances for people to start using SODIS by 100 to 300%. For the prompt, stable
long term effects were shown. Directly after the intervention phase, the interventions are most
effective in influencing SODIS uptake. The quantity of water treated with SODIS was explained
with a model involving indirect influences of the interventions via behavior-near factors. On
implementation intention, both interventions operate in a similar way: activation of the SODIS
behavior and initiation of planning processes. Perceived habit to use SODIS is only directly
influenced by the prompt. The public commitment, in contrast, does not act as a direct reminder
to perform SODIS, because it has not been placed where the behavior was to be executed and
it contains too little information. Instead, the implementation intention evoked by the public
commitment manifests itself in the habit. Overall, it was shown that prompts and public
commitments operate via behavior-near factors and not directly on the behavior itself, when it
comes to increase the proportion of SODIS-treated water on the overall water consumption.
Initial SODIS uptake, on the other hand, can directly be initiated through these interventions.
When looking at different strategies on how to communicate with the target population, in
terms of reaching people and changing their behavior to use SODIS, employed promoters are
most successful and have achieved 73% of SODIS users after a two months promotion time
period. Opinion leaders – although less effective on the uptake of SODIS (62% SODIS users
after two months) – pose the additional potential to stimulate communication between people
about SODIS. In contrast, a health fair has stayed beyond expectations in reaching people and
does not have a big impact on behavior. Of the investigated sample, 20% have been reached
by the health fair and 14% have used SODIS afterwards. One major reason seems to be that a

X
health fair is only a one-time event. Comparing the costs of the different communication
strategies, it appears even less advisable to use a health fair, because of the high costs
involved. Paid promoters cost about half of the health fair and opinion leaders are almost of no
cost, except for the regular trainings and follow-ups that are needed. Due to the higher
effectiveness of the professional promoters in initiating SODIS uptake, a combination of
promoters and voluntary opinion leaders may show interesting synergetic effects, save costs,
and may be most sustainable during long-term promotion campaigns.
Summarizing, during a SODIS promotion campaign, particular interest should be paid to
address the relevant factors of the behavior change process. The SODIS method should be
connected to positive affects, and a possibility for tasting the water should be provided. The
development of a positive intention and uptake (at least a try out) should be supported. During
the following phase of habit development, supporting interventions like prompts or public
commitments are easily applicable and widely accepted possibilities. Particularly prompts have
a proven positive long-term influence on habituation and the amount of water treated with
SODIS within a household. Communication channels should be primarily interpersonal, others
like fairs or mass media may be used as supportive sources of information. However, solely
applying the latter ones is not likely to show the desired effects on behavior.
In future studies, additional factors for explaining the water consumption behavior should
be considered to gain more detailed insight into drivers of this particular type of behavior.
Another topic that urgently needs to be addressed is social influence and with it interpersonal
communication. The question remains, how people can be motivated to communicate about
water treatment, which at the moment is not very frequent.
Finally, some limitations like small sample sizes, the sometimes low number of people
who actually received interventions, the long time difference between measurements,
particularly in Study II, as well as the specific context of the two studies have to be overcome.

XI
TABLE OF CONTENTS
List of tables and figures XV
Introduction 19 Problem definition ................................................................................................................ 20 The SODIS method.............................................................................................................. 20
Effectiveness on eliminating microorganisms............................................................... 20 Health impact ................................................................................................................ 21 Cost Benefit Aspects..................................................................................................... 22 Promotional Efforts ....................................................................................................... 22
Theoretical background relevant to SODIS promotion ........................................................ 24 Diffusion of innovations................................................................................................. 24 Models of behavior change........................................................................................... 26 Classification systems of interventions ......................................................................... 27
Summary .............................................................................................................................. 29
Methods 31 Study I .................................................................................................................................. 32
Study area..................................................................................................................... 32 Description of promotion strategies .............................................................................. 33
Communication strategies ..................................................................................... 34 Interventions .......................................................................................................... 35 Persuasion ............................................................................................................. 36
Measurement ................................................................................................................ 37 Interview procedure ............................................................................................... 37 Operationalization.................................................................................................. 38 The problem awareness diarrhea scale ................................................................ 44
Design ........................................................................................................................... 46 Measurement design ............................................................................................. 46 Promotional design ................................................................................................ 48
Study II ................................................................................................................................. 48 Study area..................................................................................................................... 48 Description of promotion strategies .............................................................................. 49
Communication strategies ..................................................................................... 49 Interventions .......................................................................................................... 51 Persuasion ............................................................................................................. 51
Measurement ................................................................................................................ 52 Design ........................................................................................................................... 53
Measurement design ............................................................................................. 53 Promotional design ................................................................................................ 54
Sample description............................................................................................................... 55

XII
Study I ........................................................................................................................... 55 Study II .......................................................................................................................... 56
Behavioral models for the consumption of SODIS, boiled and untreated water 59 Abstract ................................................................................................................................ 60 Introduction........................................................................................................................... 61
SODIS behavior change in a stage model.................................................................... 61 Problem awareness ............................................................................................... 62 Persuasion ............................................................................................................. 63 Uptake.................................................................................................................... 65 Habit....................................................................................................................... 66 Summary................................................................................................................ 67
Comparing determinants of SODIS, boiled and untreated water consumption............ 68 Methods................................................................................................................................ 69 Results ................................................................................................................................. 69
Relations between behavioral intentions and behaviors SODIS, boiling and untreated water consumption ................................................................................ 69
Predictors of the behavioral intention ........................................................................... 71 Predictors of behavior ................................................................................................... 76
Discussion ............................................................................................................................ 79 The intention models..................................................................................................... 79 The behavioral models.................................................................................................. 81 Integration of the intention and the behavioral models into a stage model .................. 82
Conclusion & Limitations...................................................................................................... 85
Why do people stop using SODIS? 87 Abstract ................................................................................................................................ 88 Introduction .......................................................................................................................... 89
The habit stage of the behavior change process.......................................................... 90 Different types of ‘continuers’ and ‘relapsers’ ............................................................... 92
Typing with intention and cognition intensity ......................................................... 93 Methods................................................................................................................................ 94 Results ................................................................................................................................. 95
Identification of relapser types and continuer types...................................................... 95 Characterization of relapsers, continuers and their subtypes....................................... 96 Change over time of relapsers, continuers and their subtypes .................................... 99
Discussion .......................................................................................................................... 103 Relapser or continuer?................................................................................................ 103 Low or high relapser, low or high continuer? .............................................................. 105
The relapser types ............................................................................................... 105 The continuer types ............................................................................................. 108
Conclusion & Limitations.................................................................................................... 110

XIII
Influences of prompts and public commitments 113 Abstract .............................................................................................................................. 114 Introduction......................................................................................................................... 115
Prompts....................................................................................................................... 115 Public commitment...................................................................................................... 116 The modes of operation of prompt and public commitment ...................................... 116 Behavior – uptake or intensity?................................................................................... 119 The uptake model ....................................................................................................... 120 The behavior intensity model ...................................................................................... 120
Methods.............................................................................................................................. 121 Results ............................................................................................................................... 122
Influences on SODIS uptake....................................................................................... 122 Study I.................................................................................................................. 122 Study II................................................................................................................. 125
Influences on the quantity of water disinfected with SODIS (Study II) ....................... 129 The modes of operation of prompts and public commitments (Study II) .................... 131
The prompt model................................................................................................ 132 The public commitment model............................................................................. 134
Discussion .......................................................................................................................... 135 SODIS uptake ............................................................................................................. 135 Quantity of water disinfected with SODIS................................................................... 137 The modes of operation of prompts and public commitment...................................... 137
Direct influence paths of prompts and public commitments ................................ 137 The structure of the behavioral model and indirect influences of prompts
and public commitments............................................................................... 138 Conclusion.......................................................................................................................... 141 Limitations & Outlook ......................................................................................................... 142
Effects of different communication strategies 145 Abstract .............................................................................................................................. 146 Introduction ........................................................................................................................ 147 Methods.............................................................................................................................. 149 Results ............................................................................................................................... 150
SODIS knowledge....................................................................................................... 150 Knowledge depth ........................................................................................................ 151 SODIS use .................................................................................................................. 152 Communication channels............................................................................................ 154 Effects of the interviewer............................................................................................. 155
Discussion .......................................................................................................................... 156 Interpersonal communication...................................................................................... 157 Centralized communication......................................................................................... 157
Limitations .......................................................................................................................... 159

XIV
Discussion 161 Introduction......................................................................................................................... 162 The behavior change process and SODIS promotion – the investigation ......................... 162 The development of a positive intention ............................................................................ 163
Problem awareness .................................................................................................... 163 SODIS knowledge....................................................................................................... 164 Cognitive and affective components of attitude .......................................................... 165 Social factors............................................................................................................... 166
Predicting behavior ............................................................................................................ 168 Intention ...................................................................................................................... 168 Resource availability ................................................................................................... 170 The habit factors ......................................................................................................... 170
Water consumption behavior ............................................................................................. 173 Campaign effects ........................................................................................................ 173 Effects of different communication strategies ............................................................. 175 Effects of situational cues – prompts and public commitments .................................. 176
Summary, or: a 'perfect' SODIS promotion campaign ....................................................... 178 Limitations & Open issues.................................................................................................. 181
Limitations ................................................................................................................... 181 Open issues ................................................................................................................ 182
References 185
Curriculum Vitae 200

XV
LIST OF TABLES AND FIGURES
Tables
Table 1. Item formulations, including demographic variables. Studies I and II. ...................... 39 Table 2. Factor analysis (principal component, mineigen>1) of the items of the problem
awareness stage. Rotated (Varimax) component matrices are presented. Studies I and II........................................................................................................... 45
Table 3. Reliability analysis of the items of the problem awareness stage. Cronbach's alphas are presented. Studies I and II. ..................................................................... 45
Table 4. Descriptive measures of all four time points. Studies I and II. .................................. 57 Table 5. Descriptive statistics of all factors of the motivational stages for SODIS, boiled
water and untreated water. Means (M) and standard deviations (SD) as well as the Pearson correlation coefficients (r) of the intentions to consume SODIS, boiled and untreated water with all factors from the motivational phase of the behavior change process, and demographic variables are presented. Study II, Panel 4. ..................................................................................................................... 73
Table 6. Standardized betas of stepwise regressions of factors of the motivational stages on the behavioral intentions of using SODIS, boiling water and consuming untreated water. Study II, Panel 4. ......................................................... 75
Table 7. R squares of separate regressions of the different blocks of factors on the behavioral intentions of using SODIS, boiling water and consuming untreated water. Study II, Panel 4. ............................................................................................ 75
Table 8. Descriptive statistics of all factors of the action stages for SODIS, boiled water and untreated water. Means (M) and standard deviations (SD) as well as the Pearson correlation coefficients (r) with the percentage of consumed water treated with SODIS, boiling or consumed untreated water of all factors from the action stages of the behavior change process and the demographic variables are presented. Study II, Panel 4. ............................................................... 77
Table 9. Standardized betas of stepwise regressions on the behavioral indicators percentages of consumed water treated with SODIS, consumed boiled water and consumed untreated water. Study II, Panel 4. ................................................... 78
Table 10. R squares of separate regressions of the different blocks of factors on the behavioral indicators percentages of consumed water treated with SODIS, consumed boiled water and consumed untreated water. Study II, Panel 4.............. 78
Table 11. Descriptive statistics of factors of the behavior change process including the two cluster variables and demographic variables. Values are presented separately for the two relapser and the two continuer types as well as for total relapsers and total continuers. Study I, Panel 4........................................................ 97
Table 12. Descriptive statistics of the interventions of Study I in 2005 and 2006, monitoring and long questionnaire. Values are presented separately for the two relapser and the three continuer types as well as for total relapsers and total continuers. Study I, Panel 4............................................................................... 99
Table 13. Reasons for relapse of low and high relapsers. Study I, Panel 4. .......................... 101 Table 14. Descriptive statistics of some factors of the behavior change process,
measured at the 3rd panel. Values are presented separately for the two relapser and the two continuer types as well as for total relapsers and total continuers. Study I, Panel 3. ................................................................................... 102

XVI
Table 15. Descriptive statistics of Study I. Received interventions, other activities and demographic variables separately for SODID non-user, SODIS user and the entire sample. Study I, Panels 2, 3 and 4. .............................................................. 124
Table 16. Effects of prompts and public commitment. Binary logistic regression on SODIS use. Study I, Panels 2, 3 and 4. .................................................................. 126
Table 17. Descriptive statistics of Study II. Received interventions, other activities and demographic variables separately for SODID non-user, SODIS user and the entire sample. Study II, Panels 3 and 4. ................................................................. 128
Table 18. Effects of prompts and public commitment. Binary logistic regression on SODIS use. Study II, Panels 3 and 4. ..................................................................... 129
Table 19. Effects of prompts and public commitment. Linear regression on % SODIS water on total water consumption. Study II, Panels 3 and 4. .................................. 129
Table 20. Means (M), standard deviations (SD) and correlations for variables before (1) and after (2) the interventions. N=179. Study II, Panels 3 and 4. ........................... 132
Table 21. Crosstabulation of commitment 1 and behavior 1, frequencies. Study II, Panels 3 and 4......................................................................................................... 140
Table 22. Percentages of people knowing SODIS over time for each promotional strategy. Study I, Panels 1 to 4. .............................................................................. 151
Table 23. Percentages of people using SODIS over time for each communication strategy. Study I, Panels 1 to 4. .............................................................................. 153
Table 24. Percentages of communication channels over time and for each promotional strategy. Study I, Panels 1 to 4. .............................................................................. 155
Figures Figure 1. Water sources in periurban areas: Water truck and water storage........................... 33 Figure 2. Water sources in rural areas: hand pump, dirty tap, water tower (left to right). ........ 33 Figure 3. View of a periurban area of Cochabamba named Calicanto. ................................... 33 Figure 4. View of the village near San Julian named Nucleo 24. ............................................. 33 Figure 5. The prompt on a fridge, ............................................................................................. 36 Figure 6. A public commitment outside .................................................................................... 36 Figure 7. Complete design of Study I. Includes dates of panels, number of long and
short questionnaires, dates of communication activities, number of interventions, and number of households with monitoring........................................ 47
Figure 8. View of two villages in the study area of Study II. ..................................................... 49 Figure 9. The prompt of Study II. Unfolded view and folded view............................................ 52 Figure 10. The public commitment of Study II. ........................................................................... 52 Figure 11. Complete design of Study II, including dates of panels, number of
questionnaires, number of interventions, and number of households with monitoring.................................................................................................................. 54
Figure 12. A stage model to explain drinking water consumption. ............................................. 68 Figure 13. Water consumption pattern of untreated and boiled water, dependent on the
amount of water that is treated with SODIS. Additionally, the percentages of total N are given of each category of SODIS use. NTOTAL=437. Study II, Panel 4................................................................................................................................. 70

XVII
Figure 14. Predictors of intention and behavior SODIS water (green), boiled water (blue) and untreated water (orange). Study II, Panel 4. ...................................................... 83
Figure 15. Cluster profiles of the two relapser clusters and the three continuer clusters by intention and cognition intensity. Study I, Panel 4..................................................... 96
Figure 16. Relapse time-point distribution of low and high relapsers over time. Study I, Panel 4. ................................................................................................................... 100
Figure 17. Development of intention, cognition intensity, forgetting and habit between 3rd and 4th panel. Graphs are presented separately for the two relapser and the two continuer types. N=211. Study I, Panels 3 and 4. ............................................ 103
Figure 18. The SODIS uptake model. ...................................................................................... 120 Figure 19. Model of the mode of operation of prompts and public commitment on SODIS
behavior intensity..................................................................................................... 121 Figure 20. The mode of operation of prompts over two points in time: Path model with
standardized path coefficients. Study II, Panels 3 and 4. ....................................... 133 Figure 21. The mode of operation of public commitments over two points in time: Path
model with standardized path coefficients. Study II, Panels 3 and 4. ..................... 135 Figure 22. Mean knowledge depth over time and for each communication strategy. Study
I, Panels 1 to 4......................................................................................................... 152


Introduction
CONTENTS
Problem definition.............................................................................20 The SODIS method ..........................................................................20 Effectiveness of eliminating microorganisms .............................20 Health impact..............................................................................21 Cost Benefit Aspects ..................................................................22 Promotional Efforts .....................................................................22 Theoretical background relevant to SODIS promotion.....................24 Diffusion of innovations ..............................................................24 Models of behavior change ........................................................26 Classification systems of interventions.......................................27 Summary ..........................................................................................29
Introduction 20
PROBLEM DEFINITION
More than one third of the people living in developing countries do not have access to
save drinking water. Microbiologically contaminated drinking water can cause diarrheal diseases,
which are particularly dangerous to children. Roughly one third of infant mortality is caused by
such diarrheal diseases, and every day around 6.000 children die due to the direct or indirect
effects of diarrheal diseases – in many cases caused by contaminated drinking water. In 2003,
the United Nations have included safe drinking water in their list of Millennium Development
Goals, with the goal to halve the amount of people with no access to safe drinking water by the
year 2015 (United Nations, 2003). This ambitious goal can be reached in two ways: on one
hand, new and safe installations (pipes, boreholes, etc.) can be set up; on the other hand,
people can be educated not to drink untreated water. Of course, on the long run it surely is a
goal to provide safe drinking water from the tap, however, this will still be a long way to go.
Household water treatment and safe storage (HWTS) interventions can lead to dramatic
improvements in drinking water quality and reductions in diarrheal diseases – making an
immediate difference to the lives of those who rely on water from polluted rivers, lakes and, in
some cases, unsafe wells or piped water supplies (WHO, 2008).
This thesis has its relevance in the field of the promotion of the household water
treatment method SODIS (Solar Water Disinfection) and intends to be a first step into the
direction of an integrative analysis of different aspects related to SODIS promotion.
THE SODIS METHOD
This part summarizes all relevant research that has been published and insights that
have been gained about SODIS. Different topics will be included, namely, biological studies on
the effectiveness on eliminating microorganisms, a short overview about the effects of SODIS
on the reduction of diarrhea (health impact), some analyses on economical savings, and a
review of studies that have investigated behavioral factors determining SODIS use or analyzed
SODIS promotion.
Effectiveness on eliminating microorganisms
The Solar Water Disinfection (SODIS) process is a simple technology used to improve
the microbiological quality of drinking water. SODIS uses solar radiation to destroy pathogenic
microorganisms which cause water borne diseases. SODIS is ideal to treat small quantities of
water. Contaminated water is filled into transparent PET bottles and exposed to full sunlight for
six hours (or for two days if the sky is more than 50% cloudy). SODIS is especially designed for
the use at household level, because it only relies on locally available resources such as PET

Introduction 21
bottles and sunlight. Sunlight is treating the contaminated water through two synergetic
mechanisms: Radiation in the spectrum of UV-A (wavelength 320-400nm) and increased water
temperature (SODIS Reference Center, 2008a).
Research on solar water disinfection was first conducted by Professor Aftim Acra at the
American University of Beirut in the early 1980s (Acra, Karahagopian, Raffoul & Dajani, 1980).
Follow-up research at the Swiss Federal Institute of Aquatic Science and Technology (Eawag)
revealed that at 30°C water temperature, a threshold solar radiation intensity of at least 500
W/m2 (all spectral light) is required for five hours for solar water disinfection to be efficient. This
dose corresponds to five hours of mid-latitude midday summer sunshine. The bottles used for
SODIS should not exceed three liters and as suspended solids block UV radiation, preliminary
treatment is necessary if turbidity exceeds 30 NTU (sedimentation, flocculation, and filtration;
Sommer et al., 1997). A large body of microbiological research followed, which assessed and
demonstrated the effectiveness of SODIS in destroying diarrhea-causing bacteria
(Campylobacter jejuni, Yersinia enterocolitica, enteropathogenic Escherichia coli,
Staphylococcus epidermidis, Vibrio cholerae, Salmonella typhimurium, Shigella dysenteriae,
Pseudomonas aeruginosa), viruses (Poliovirus), parasites (Giardia spp., Cryptosporidium spp.,
Acanthamoeba) and fungi (Candida albicans, Fusarium solani; Berney, Weilenmann & Egli,
2006; Berney, Weilenmann, Simonetti & Egli, 2006; Boyle et al., 2008; Conroy, Elmore-Meegan,
Joyce, McGuigan & Barnes, 2001; Gaafar, 2007; Heaselgrave, Patel, Kilvington, Kehoe &
McGuigan, 2006; Kehoe, Barer, Devlin & McGuigan, 2004; Lonnen, Kilvington, Kehoe, Al-Touati
& McGuigan, 2005; MacKenzie, Ellison & Mostow, 1992; McGuigan, Joyce, Conroy, Gillespie &
Elmore-Meegan, 1998; McGuigan et al., 2006; Méndez-Hermida, Castro-Hermida, Ares-Mazás,
Kehoe & McGuigan, 2005; Smith, Kehoe, McGuigan & Barer, 2000). Only spore forming
bacterial species may survive the SODIS disinfection process (Boyle et al., 2008; Lonnen et al.,
2005).
Health impact
Regular application of SODIS has the potential to reduce diarrhoeal diseases by up to
50%. Up to date SODIS is used in about 30 countries by more than 2 million people and is
recommended by the World Health Organization (WHO, 2008). The health impact of consuming
SODIS-treated water was first examined in Kenya in the 1990s. The study conducted among
Maasai children under the age of five showed a 16-24% diarrhea reduction and an 86%
reduction in cholera cases during an outbreak (Conroy, Elmore-Meegan, Joyce, McGuigan &
Barnes, 1996, 1999, 2001). From 2000 to 2003, the Swiss Tropical Institute conducted an
epidemiological study in Bolivia in collaboration with Eawag to assess the health impact of
SODIS on children below five. According to the study, SODIS reduced diarrhea incidence by
more than 35% (Hobbins, 2003). A health impact study among 100 children in an urban slum in
Tamil Nadu revealed that the risk of diarrhea was reduced by 40% by using SODIS (Rose et al.,

Introduction 22
2006). Further health evaluation studies showed a reduction of 13 to 39% in Pakistan (Gamper,
2004), in Uzbekistan by 53-57% (Grimm, 2004; Grimm, 2006) and of about 50% in projects
conducted in Nepal, East Lombok and Assam, India (SODIS Reference Center, 2008b).
Cost Benefit Aspects
The mean costs for SODIS implementation in 13 countries, including the costs for bottles
and educational material amounted to annually USD 0.75 per trained person. In the following
years, users pay on average USD 0.60 per person per year for the application of SODIS, i.e. to
replace damaged bottles. The running costs for SODIS application are greatly outweighed by
the economic benefits drawn from improved health as a result of reduced diarrhea incidence, i.e.
expenditure for medical care decreases, the economic productivity of adults and the school
attendance of children increase, which leads to additional benefits.
The health impact assessments in Pakistan, Uzbekistan, Nepal, East Lombok, and India
revealed that diarrhea rates of more than 970'000 SODIS users were reduced by about 50%
(see above). Therewith, an estimated 2.4 million diarrhea cases could be prevented annually in
the project areas. Assuming that treatment of one diarrhea case costs the health sector USD 10
(Haller & Hutton, 2004), more than USD 24 million were saved by the health sector. Moreover,
the benefit of an improved economic labor force through improved health is estimated at USD
12 million (Haller & Hutton, 2004). With a total project cost of USD 730'800, the achieved cost-
benefit ratio for the health sector amounted to 1:49.
At household level, the cost-benefit ratio is not as dramatic, but still significant: SODIS
users in Nepal and Pakistan save on average 32 USD, respective 22 USD, annually per
household through reduced costs for medical treatment of diarrhea. In the Kibera Slum of
Nairobi, Kenya, one household annually saves 7 USD on average through reduced costs for
medical treatment of diarrhea. The annually recurring costs for PET-bottles needed by one
household for SODIS application are 2.20 USD in Nepal and Pakistan, and 3.20 USD in Kenya
(SODIS Reference Center, 2008c). At the same time, people save money, because no wood or
gas for boiling is needed. Data on the benefits of the improved labor force has not been
collected at household level.
Promotional Efforts
Because the SODIS method is quite recent, there has been almost no scientific research
on its promotion. Nonetheless, since 1995 SODIS has already been promoted in many
countries by international and local non-governmental organizations (NGOs) within the
framework of general health promotion efforts. The numbers of users up to date has
accumulated to about two million users worldwide. Unfortunately, often it is neither
systematically investigated nor well understood why in some projects success rates are higher

Introduction 23
than in others. The studies often ignore why certain promotion campaigns were successful and
others not. Moreover, the success that has been achieved so far can be described as rather
moderate in view of the inexpensiveness of the method and the effort applied for its promotion.
NGO partners such as the SODIS Foundation (Latin America) regularly report that the
promotion of SODIS needs a comprehensive training and promotion process to achieve a
significant uptake at user level (Mercado, 2005). No spontaneous diffusion of the method has
been observed after its initial introduction into a community (Meierhofer & Wegelin, 2002). On
one hand, the lack of self-promotion is not very surprising, since examples for the lacking
relationship of knowledge, pro-behavioral attitudes or intentions and the behaviors itself exist.
Many can be found in the field of lacking health prevention practices such as using condoms to
prevent AIDS, undertaking a cancer breast screening or to undertake exercise (for a review on
these and similar examples see Sheeran, 2002). On the other hand, one might have expected a
rather enthusiastic uptake of such an easy and cheap water disinfection method like SODIS,
saving people money and effort.
An analysis of the few studies available assessing the effectiveness of SODIS promotion
strategies shows that the success rates (percentage of SODIS users) reported in these studies
vary greatly. Rainey and Harding (2005) report an adoption rate of only 9% in the course of a
four-month follow-up study in Nepal, but the promotional effort here was very limited (one 2-hour
training session). Reasons seemed to be perceived barriers (work, culture) on one hand and on
the other hand lacking awareness, knowledge and motivation. In contrast, other studies report
adoption rates of between 40 and 70% (Kabra, 2005; Mahmood & Lodhi, 2004; Moser et al.,
2005; unpublished project reports). However, the promotional effort in these studies was
comparably high, consisting of multiple strategies applied simultaneously. Various strategies
were post-hoc evaluated, but no systematic comparison between the effectiveness of different
promotion strategies was carried out. We found a few studies focusing on investigating which
internal factors are important in determining SODIS uptake. One of the studies (Moser et al.,
2005) focused on influential factors to use SODIS and found that habit, the behavioral intention
and a social factor are amongst the most important ones. Also, the recent study of Altherr,
Mosler, Tobias and Butera (2008) rather focused on behavior determining factors and tested a
TPB model (Theory of planned behavior; Ajzen, 1991). They found similar results: intention and
social influence were important. Additionally, attitude and knowledge were found to have
influence on the use of SODIS. On the explicit evaluation of the diffusion process of the
innovation SODIS is the one study of Heri and Mosler (2008). There the full diffusion of
innovations model (E. M. Rogers, 2003) was tested and different determinants of the amount of
water treated with SODIS were found such as the relative advantage of the SODIS method,
compatibility with daily habits, availability of PET bottles, descriptive norm and the number of
promotion activities a person participated. Furthermore, the amount of consumed untreated
water had a negative relationship to the amount of water treated with SODIS. Only one paper
(which is also a part of this thesis) so far has investigated the effectiveness of different
communication strategies to promote SODIS (Tamas, Tobias & Mosler, accepted). The authors

Introduction 24
compared a health fair, professional promoters and community based opinion leaders and
found the two interpersonal strategies (promoters and opinion leaders) being much more
effective and cost-efficient.
Summarizing, SODIS has proven to disinfect water effectively, to reduce diarrhea
incidence by approx. 50% and to save people and governments health costs. Only when it
comes to SODIS promotion, the picture gets more diffuse concerning effects and reasons for
failure of the applied strategies. Therefore, in the next part, some theoretical backgrounds that
are necessary to understand SODIS promotion from a social scientists perspective will be
outlined.
THEORETICAL BACKGROUND RELEVANT TO SODIS PROMOTION
This thesis has the goal to provide a broad insight into how to achieve that people use
SODIS to treat their water. This involves two theoretical parts to consider: one, which
psychological factors influencing behavior (i.e. the uptake of SODIS) are of importance, and two,
which promotional strategies work best in changing these factors and the related behavior. So,
not a test of one particular theory or model or experimental paradigm will be performed, but
various approaches that are related to the topic of SODIS promotion will be briefly outlined. But
first of all, a clarification of what "SODIS promotion" implies psychologically must be made.
First, on a community level, the promotion of the technology SODIS in a social
environment that has not yet heard about SODIS can be viewed as the diffusion of an
innovation. To understand the process of innovation diffusion, a brief overview on Everett M.
Rogers' (1983, 1995, 2003) "Diffusion of Innovations" theory will be given. Secondly, on an
individual level, SODIS promotion can be understood as a change of an everyday behavior.
Correspondingly, models of behavior change must be employed to understand the behavior
change process. Thirdly, since it is the aim to change behavior, i.e. to promote the uptake of
SODIS, it is important to have an overview about interventions that exist to reach this goal.
Diffusion of innovations
Everett M. Rogers' (1995) "Diffusion of innovations" theory (DOI) is a very comprehensive
introduction to the process of innovation diffusion, viewing the process from different angles.
Rogers tries to answer the questions of how, why, and at what rate new ideas and technologies
spread through cultures. Rogers incorporates four possible influence factors on a general level
and searches proof in many real world examples. In principle, the theory states that the
adoption of an innovation depends on (1) the perceived attributes of the innovation, (2) the used

Introduction 25
communication channels, (3) the nature of the social system, and (4) the time aspect of the
entire process.
The first factor, attributes of the innovation, is the one most widely studied (e.g. Moore
& Benbasat, 1991; Tornatzki & Klein, 1982). Five attributes have been found to explain between
49 and 87% of variance in the rate of adoption of innovations. These are the relative advantage
of the innovation over the idea it replaces, the compatibility with existing values and habits, past
experiences and needs of the receivers, the complexity or the degree to which the innovation is
perceived as difficult to understand and use, the trialability or the degree to which an innovation
can be easily tested for effectiveness, and the observability of the outcome of the innovation (E.
M. Rogers, 1995, p. 206). Innovations an individual adopts to prevent an unwanted event in the
future are classified as "preventive innovations". SODIS is a classic representative of a
preventive innovation – it is adopted to prevent diarrhea. These types of innovations encounter
particular slow uptake, because the outcome of the innovation is not immediately observable.
Communication channels are most commonly divided into mass media and
interpersonal channels (Alcalay, 1983; Griffin & Dunwoody, 2000; E. M. Rogers, 2003; Valente
& Saba, 1998). Classical mass media representatives are radio, television, or newspaper.
Interpersonal communication involves interpersonal contact between someone who knows
something about the innovation and the recipient and is often realized with promoters or opinion
leaders. Mass media are viewed as helpful for having positive effects during the early phase of
innovation adoption, besides they are able to transmit information to a wide audience, but rarely
change behavior. Interpersonal communication is mostly seen as the more effective strategy.
Diffusion of an innovation occurs within a social system. The system's norms and the
communication structure and intensity between the members of the social system can influence
the adoption of innovations. System norms describe what ought to be done (injunctive norms)
and what is done (descriptive norms; Cialdini, Reno & Kallgren, 1990; Rhodes & Courneya,
2003). Both norms can completely hinder an innovation to be taken up by a certain population
as in the case of boiling in a Peruvian village (Wellin, 1955). Without communication no diffusion
occurs and the communication intensity can make a complete difference in the speed of
innovation adoption (Rogers & Kincaid, 1981).
The last of Rogers' factors, time, is involved in three concepts. First, in the process model
of behavioral change, the "Innovation Decision Process", where it is stated that an individual
needs time to pass through the stages of the behavior change process. Secondly, individuals
have different degrees of innovativeness, and therefore, will adopt an innovation at different
speeds. Five categories of adopters are described, ranging from innovators (very early adopters)
to laggards (the latest adopters). Thirdly, different innovations have different rates of adoption,
which refers to the relative speed with which an innovation is adopted by members of a social
system. Nevertheless, the shape of the curve of cumulated amount of adopters over time will
more or less be the same for all innovations: an S curve. The faster an innovation gets adopted,
the steeper the S curve will be, and vice versa.

Introduction 26
Rogers' theory was described in brief, because it provides a very holistic picture of what a
diffusion of an innovation can be. Later in this work, it will be gone back to the attributes of the
innovation and the norms of the social system, how they were operationalized for the innovation
SODIS, and how they contribute to explaining SODIS behavior. More detailed results will be
presented on the effectiveness of different communication channels. The innovation decision
process will be, amongst other theories, employed to understand the discontinuation of SODIS
use.
Models of behavior change
As briefly mentioned in the introductory part of this chapter, SODIS uptake must be
understood as a process of behavior change. Therefore, it is important to have a general
overview about psychological predictors of behavior, and a short summary on models of
behavioral change is presented. Many different theories exist, proposing sometimes different,
sometimes similar predictors of behavior. This part only gives an overview. The details about
which parts of which theories were used in which way will be described in the corresponding
chapter (chapter 1).
Behavioral models can be divided into two approaches: continuous or linear models and
stage models. Continuum models want to explain an individual's likelihood of performing a
certain behavior with combining influential predictor variables in one prediction equation. The
individual moves along the proposed continuum of behavior likelihood. Prominent
representatives of such theories are the "Theory of planned behavior" (TPB; Ajzen, 1985, 1991),
the "Norm activation model" (Schwartz, 1973, 1977) or the "Protection motivation theory" (R. W.
Rogers, 1983; R. W. Rogers & Prentice-Dunn, 1997). Such models do not assume any
sequence of psychological change, nor do they allow for "jumps" or going back during the
course of the behavior change. They imply that it is not important, which behavioral predictor
should be first targeted with an intervention and interventions could be applied in any order or
also simultaneously as long as they influence the important predictors of behavior (Schwarzer,
2008). Moreover, the behavioral predictors described in continuum models are preceding a
behavioral intention, but leave a black box between intention and behavior, the so called
"intention-behavior gap" (Sheeran, 2002). Nevertheless, the predictor variables described in
these theories are very important for understanding motivational predictors of behavior, for
example the concepts of intentions, attitudes, norms or beliefs.
Stage models in contrast describe behavior change rather as a process with certain
qualitatively distinct stages an individual has to pass through. The behavior change process is
not assumed to be linear; relapses may occur and the process is often described as spiral-like.
The probably most famous representative of stage models is the "Transtheoretical model" (TTM;
Prochaska & DiClemente, 1982, 1983). The TTM proposes five stages (pre-contemplation,
contemplation, preparation, action, maintenance), which are all mutually exclusive and

Introduction 27
qualitatively different. Also the already mentioned "Innovation decision process" (IDP; E. M.
Rogers, 1983, 2003) proposes five distinct stages (knowledge, persuasion, decision,
implementation, confirmation), whereas the "Model of action phases" (MAP; Heckhausen &
Gollwitzer, 1987; Gollwitzer, 1996) defines four stages: pre-decisional, pre-actional, actional and
post-actional phase. The TTM and the MAP additionally define goals or tasks that mark the
transition points between the stages. One model, the "Health action process approach" (HAPA;
Schwarzer, 1992, 2008) only differentiates between a motivational and a volitional phase, with
the latter including the actual action. Summarizing, although the presented stages of the
different models by far are not identical, the process they describe is the same and they could
be mapped against each other. One important advantage of all stage models compared with
continuum models is the inclusion of a post-intentional phase that intends to close the intention-
behavior gap apparent in continuum models. Similar like continuum models, also stage models
describe a variety of motivational predictor variables of behavior, which are placed along the
different stages. These specific assignments imply that some predictors are prerequisites of
others and consequently a sequence of interventions is also implied. Therefore, stage models
are often viewed as better applicable in field work, especially in intervention studies when
describing differential effects of interventions.
As pointed out already, stage models are advantageous to continuum models. So, in this
work behavior will be understood as the process where an individual passes through different
phases or stages. To keep the model simple, we propose four areas which an intervention
should target: (1) problem awareness (transition from pre-contemplation to contemplation, TTM),
(2) persuasion (contemplation & preparation, TTM; knowledge to decision, IDP; pre-decisional &
pre-actional, MAP; motivational, HAPA), (3) uptake (action, TTM; implementation, IDP; actional,
MAP; action, HAPA) and (4) habit (maintenance, TTM; confirmation, IDP; post-actional, MAP;
volitional, HAPA). In later chapters the entire behavior change process or parts of it will be used
to explain SODIS behavior. There a more detailed description on which behavior determinants
were used, how they were operationalized, and how they influence the behavior will be provided.
Classification systems of interventions
A standard dictionary defines intervention as a force or act that occurs in order to modify
a given state of affairs. In the context of behavioral change, an intervention may be any outside
influence that has the effect of modifying an individual's behavior, cognition, or emotional state.
The aim of this work is to change behavior directly or indirectly from drinking untreated water to
using SODIS. Therefore, it is important to have a general overview about instruments or
interventions and their way of functioning scientists have developed and practitioners have
already tested to initiate a behavior change, independent of the type of behavior.
Unlike on the topic of behavior change, on the mechanisms of interventions no theory as
such exists. Nevertheless, there exist some useful classification systems that also include some

Introduction 28
information about what the intervention should achieve or change. A common distinction of
interventions is the one between external and internal interventions, or structural and person
focused, respectively (De Young, 1993; Frey, Stahlberg & Wortmann, 1990; Homburg &
Matthies, 1998; Mosler & Gutscher, 1998; Scheuthle & Kaiser, 2003). Internal interventions are
strategies targeted to change conditions lying inside the person, whereas external interventions
are targeted to changing situational circumstances to allow for the new behavior. Homburg and
Matthies (1998) further distinguish within the person focused interventions between knowledge
and norm centered techniques. Structural interventions are further classified into antecedent
and consequential stimuli of behavior, i.e. changing conditions preceding or succeeding a
behavioral performance (Dwyer, et al., 1999; Geller, 1987, 1989; Mosler & Gutscher, 1998;
Schahn, 1993). However, one big drawback of all those classifications is the ignorance of the
desired psychological effect in the individual according to a psychological model of behavior
change. Only a few approaches tried to classify interventions viewed from a person's inside
point of view, but the underlying behavioral models are rather reduced in complexity and differ
between the classifications (Cook & Berrenberg, 1981; Flury-Kleubler & Gutscher, 2001). One
recent publication of Mosler and Tobias (2007a) addressed the mentioned shortcomings and
presented a more comprehensive classification, integrating most of the interventions mentioned
in older classifications. For this reason, their classification will be presented in more detail in the
following.
Mosler and Tobias (2007a) developed a person focused system that understands
behavior change as a process where first the behavior execution has to be possible in general,
then the goal behavior must be the preferred behavioral alternative by the individual, and finally
the person must remember the behavior execution in the appropriate moment. This
classification uses a similar behavioral model like the underlying consent found in the formerly
presented stage models: developing a preference for a behavior is certainly a motivational
process and ends with the intention to perform the behavior, and then remembering the
behavior in the crucial moment corresponds to the volitional or post-decisional phase. The
intervention strategies on the first level were correspondingly classified into "behavior
generating techniques" and "behavior supporting techniques". The behavior generating
techniques are further divided into structure and person-focused techniques. Structure-focused
means to make the behavior (im)possible from a person-external point of view, e.g. imposing of
fees, subventions, certificates, or new infrastructure. Person-focused techniques point at making
the behavior possible from a person's point of view; techniques are information, persuasive
communication to convince and motivate, or requests. The second group, behavior supporting
techniques, comprises situation-focused and diffusion-focused techniques. Situation-focused
techniques can aim at individuals or the social system; they can be passive or active. A passive
technique aimed at the individual may be a simple reminder or feedback; actively social would
be a public self-commitment to perform the behavior. Finally, diffusion-focused techniques
include all strategies that explicitly include the community or social network to diffuse the

Introduction 29
innovation. This last category strongly corresponds with what E. M. Rogers (2003) called
"communication channels".
In this work, only behavior supporting techniques will be investigated systematically. The
reason is that we already knew before conducting our field work that motivating people to try
SODIS (behavior generating) is often easy, but maintenance of the SODIS behavior poses a
problem. Therefore, we concentrated on the maintenance aspect (habit formation). Of course
also behavior generating techniques were applied, only no systematic variation took place to
compare different ones. As already mentioned in the part about the "Diffusion of innovations"
theory, different diffusion-focused techniques will also be compared.
SUMMARY
During the course of this chapter about the theoretical background that was considered to
be relevant for understanding SODIS promotion and uptake, the theory of innovation diffusion
was introduced as an integrative overview, various behavior change theories to understand the
process were outlined and a classification of behavior change interventions to understand how
to influence behavior was presented. Shortly summarizing, it is important to take into account
which stage of the behavior change process is crucial for the uptake, i.e. if we need to convince
and motivate people for the innovation or if we can directly support their already existing
intentions and actions, because they are already convinced. Of equal importance is the social
system, its norms and communication structure and last but not least, which communication
channels and interventions are used for the promotion of the new behavior. Designing
promotion campaigns should particularly pay attention to link the theoretical behavior change
process with appropriate measures to influence this process, i.e. select appropriate
communication channels and interventions.
In the following chapters, results corresponding to the mentioned topics of interest will be
presented. The key factors of the different stages of the behavior change process will be
inspected. Target behavior is of course primarily SODIS use and SODIS use intensity, but also
the consumption of untreated and boiled water. The two latter behaviors and their determinants
will also be investigated to describe the entire water consumption pattern. The last stage of the
behavior change process, habit formation, will be more intensively looked at with an analysis of
reasons for behavior discontinuance in contrast to continuance after a longer period of time after
the introduction of the SODIS method into the community. Into two groups of interventions will
be looked closer: behavior supporting intervention techniques and diffusion focused techniques,
which are called communication strategies in the following, will be compared regarding their
effectiveness and psychological influence. Each of these chapters will contain a more detailed
description of the underlying theories and their parts. But before, design, time frame,
methodology and a few general descriptive measures of the two field studies will be presented.


Methods
CONTENTS
Study I...............................................................................................32 Study area ..................................................................................32 Description of promotion strategies............................................33 Communication strategies....................................................34 Interventions.........................................................................35 Persuasion ...........................................................................36 Measurement..............................................................................37 Interview procedure..............................................................37 Operationalization ................................................................38 The problem awareness diarrhea scale...............................44 Design ........................................................................................46 Measurement design............................................................46 Promotional design...............................................................48 Study II..............................................................................................48 Study area ..................................................................................48 Description of promotion strategies............................................49 Communication strategies....................................................49 Interventions.........................................................................51 Persuasion ...........................................................................51 Measurement..............................................................................52 Design ........................................................................................53 Measurement design............................................................53 Promotional design...............................................................54 Sample description ...........................................................................55 Study I ........................................................................................55 Study II .......................................................................................56

Methods 32
STUDY I
The complete study design took the form of a longitudinal four-point panel lasting nine
months. Measurements took place at the beginning of the study (first panel, end of August
2005), after the first month (second panel, end of September 2005), the second month (third
panel, end of October 2005) and then again seven months later (fourth panel, June 2006). The
first two months of the study were conceptualized as an active promotion phase, whereas no
activities took place during the last seven months. Consequently, the first three panel
measurements reflect short-term effects whereas the fourth panel reflects long-term effects after
an inactive phase.
Study area
Our study area was located in Bolivia, one of Latin America's poorest countries. There is
no piped water system in most of its periurban and rural areas. In periurban areas, water is
often delivered by trucks at intervals of between every two days up to only once a week (Figure
1Fehler! Verweisquelle konnte nicht gefunden werden.). The origin and quality of the truck
water vary unsystematically. In rural areas, some NGO or other organization has often funded a
well and water tower, but there is no continuous maintenance of these installations. Additional
and widely used water sources in rural areas are manual pumps, which are almost always
unsafe (Figure 2). No quality control system exists. It is consequently not advisable to drink
untreated water anywhere in Bolivia, no matter where it comes from. Even tap water in the cities
can be contaminated.
We selected four periurban (Figure 3) and one rural investigation area (Figure 4). The
periurban areas were located in the outskirts of the city of Cochabamba, which is located
around 2.500m above sea level in the Andes. In each selected area lived around 150 to 350
households. The houses in the periurban areas were mostly one to two floors high and built of
bricks or concrete with metal roofs. The areas had roads and the houses were arranged in block
structures with backyards in the middle. Although the four periurban areas were neighboring
communities, not much exchange exists between them. The rural area was a village, located 2
hours away from the capital of the municipality, San Julian (near Santa Cruz de la Sierra). The
village had a population of around 40 households. Houses were mainly made out clay and roofs
out of straw. The houses were arranged quite closely to each other around a big rectangular
meadow of the size of a soccer field. The areas were selected with the help of the local NGO
(Sacoa), who indicated a village where SODIS was not yet used. Due to high transportation
costs in rural areas it was not possible to investigate a second village.
About the percentage of people already knowing SODIS, only rough estimations were
available from the NGO for the four periurban areas. From the rural area we already knew that
people most probably would already know SODIS from previous radio campaigns.

Methods 33
Figure 1. Water sources in periurban areas: Water truck and water storage.
Figure 2. Water sources in rural areas: hand pump, dirty tap, water tower (left to right).
Figure 3. View of a periurban area of Cochabamba named Calicanto.
Figure 4. View of the village near San Julian named Nucleo 24.
Description of promotion strategies
First, a clarification has to made, how termini are used throughout this thesis: A
promotion strategy or campaign (synonyms) is that what is done to promote something, i.e.
SODIS. The promotion strategy involves the use of a communication channel and the
application of an intervention. A communication strategy describes how the information
reaches the people, i.e. how it is communicated with the target population. For example, via

Methods 34
radio, print media, directly in a group, directly in a 1-to-1 conversation etc. Hence, a
communication strategy is always involved, else no contact to the people would exist. An
intervention strategy is something that is designed to influence the behavior. It can be certain
messages or something material, a poster for example. In the case of messages, the
intervention is the content that is transported with the communication strategy. For example,
rational arguments can be used like 'SODIS is healthy and tasty' or more peripheral messages
like 'SODIS is fancy and modern'. Both can be transmitted via the same communication strategy
(e.g. radio or a flyer). If something material is given to the people, this can already be the
intervention, because if it is kept at a place where it is noticed by the person it can have an
influence. Therefore, it has to be considered as a positive (or negative) stimulus. The material
can be anything: a poster, sticker, flyer, bottle etc. The basic idea of these studies is that always
a combination of different communication strategies and interventions is possible and may have
a different influence on the behavior, although not all combinations are useful.
Now coming back to Study I, in three out of the four periurban areas we had selected, a
different communication strategy was applied: a health fair, promoters and opinion leaders; the
fourth one served as a control group. The theoretical background to these strategies can be
found in chapter 4. In the rural area, SODIS continued to be promoted via radio and additionally
a bottle center was installed. Additionally, prompts and public commitments were applied as
intervention strategies. The theoretical background on those can be found in chapter 3. For the
persuasiveness of the promotion strategies it was controlled for by using the same persuasion
in all areas (except control area).
Communication strategies
Area 1: Health fair. The health fair was organized in cooperation with the locally working
NGO Obispo Anaya. Apart from SODIS, the health fair included other topics such as hygiene,
nutrition and medication. It was pre-announced with banner ads and a car with loudspeaker
equipment driving through the area, assuring many people would be able to participate. During
the health fair, people got to taste SODIS water, illustrated information on SODIS was
presented and the antibacterial effects of sunlight were demonstrated. The persuasive
arguments were used in conversations with the people who participated in the health fair and
prompts as well as a few public commitments were distributed to those interested in SODIS.
Later on during the study the prompts and public commitments were also distributed by the
interviewer because the health fair did not reach as many people as expected. The health fair
was held only once, shortly before the second panel.
Area 2: Promoters. The promoters we selected were trained twice during the study
period: shortly after the first panel and again after the second one. The training lasted about two
hours each time with the aim of familiarizing them with the persuasive arguments on SODIS and
the prompts and later with the public commitments. After each training session, their task was to

Methods 35
visit all interested families in their area, which took about 5 days each time. The promoters were
instructed to use the persuasive arguments in their conversations and to distribute the prompts
and later the public commitments. They received a regular salary for these days of work.
Area 3: Opinion leaders. The opinion leaders were selected together with the local
NGO Obispo Anaya who works on children’s health and runs a primary school in the area. The
women we chose were described as being greatly involved in the problems of the community as
well as in school activities, some had positions as dirigentes (which means something like head
of the quarter), they were always the most interested in new ideas and respected in the
community. Finally, we invited 15 of these women to the training workshop. There we informed
them on water quality and diarrhea, on the SODIS method, and trained them with the
persuasive arguments. The dates and time frame of the training were similar to those for the
promoters. After each training session, they were asked to talk about SODIS to their friends and
neighbors using the arguments they had learnt. No payment was made nor were any presents
given. The opinion leaders did not work within a limited time frame like the promoters, so they
basically worked constantly. In this area, the public commitments and later the prompts were
distributed by the interviewers, because it turned out to be impractical to leave them with the
opinion leaders.
Area 4: Radio & bottle supply center. Radio spots on SODIS had already been
broadcast for some months in the rural area, but the local NGO was aware that people did not
use SODIS. During the entire study period, the radio station kept broadcasting the spots as
before. Additionally, we started running the bottle supply center. We collected the empty bottles
in the nearby town and brought them to the village. They were then distributed free of charge
from a fixed place in the centre of the village. The person who maintained the bottle center was
trained with persuasive arguments and issued the prompts and later the public commitments
when people came to get bottles. People had to come and get the bottles themselves. The
bottle center was maintained for the two months between the first and third panels.
Area 4: Control. Only four measurements were made in the control area.
Interventions
Additionally to the different communication strategies, two kinds of habit supporting
interventions were applied: a prompt and a public commitment.
The prompt (Figure 5) was a big, colorful A3 size poster containing the five steps of
doing SODIS and a prominent question: "Have you already put your bottles into the sun today?”.
It was given away with the instruction to hang it visibly at the place where water is usually
prepared. Its function was to remind people and to provide the necessary information of how to
do SODIS.

Methods 36
Figure 5. The prompt on a fridge, Study I.
Figure 6. A public commitment outside a house, Study I.
The public commitment (Figure 6) was an A4 sized poster with the sentence "In this
house we drink SODIS water and look after our health". It also contained a SODIS logo, but no
information on how to do SODIS. It was given away with the instruction to hang it visibly outside
the house. Its function was to create a commitment within the person, a descriptive norm for
other people and to remind the person it belonged to, to use SODIS.
Persuasion
Apart from the communication and intervention strategies, it also needs a persuasive part
with which people should be convinced for the innovation. As a basis we take the Elaboration
Likelihood Model of Petty and Cacioppo (1986) and use arguments and peripheral cues.
Persuasion will not be varied in our study, which means that all promotion strategies will have
the same persuasion strategy. However, one has to be aware of interactions between the type
of promotion strategy and persuasion. For example, for the promoters one has to expect a high
peripheral cue, because of the competency people attribute to them.
For building the details of the arguments we revert to E. M. Rogers (1995, p. 15)
perceived attributes of the innovation, as there are: (a) the relative advantage of the innovation
over the idea it supersedes ("SODIS is safe and good for your health"), (b) compatibility with the
existing values, past experience and needs of the receivers ("SODIS is practical"), (c)
complexity, or the degree to which the innovation is perceived as difficult to understand and use
("SODIS is easy to use"), (d) trialability, or the degree to which an innovation can be tested for
effectiveness on a cost or scope-limited basis ("SODIS is economical"), and (e) observability of
the outcome of the innovation ("SODIS is good for your health"). Additionally, descriptive norms
(E. M. Rogers, 1995, p. 23; Ajzen, 1991) were intended to be addressed as well ("SODIS is
already used in many other places").

Methods 37
Measurement
Measurements were realized with questionnaires that were conducted in the form of
interviews, because many people in Bolivia cannot read and write. Before the first panel took
place, a loudspeaker car drove through all the periurban areas announcing the upcoming
interviews, mentioning and describing SODIS in brief. In the rural area, the interviews were pre-
announced during a community meeting shortly before. The pre-announcement was highly
recommended by the local NGO, since people are wary of strangers. A second reason for using
the loudspeaker car in the periurban areas was to create similar percentages of people knowing
SODIS in all areas to have the possibility of investigating knowledge dissemination depending
only on the promotion strategies. Unfortunately, as can be seen later in the results section of
chapter 4, the loudspeaker car did not have the desired effect.
The questionnaires were revised and validated with local experts and the interviewers to
ensure identical understanding of the items. Long and short versions of the questionnaire were
used. The short one only measured a few demographic variables, whether people had heard
about SODIS at all, whether they used SODIS and where they had heard about it
(communication channels). The long questionnaire contained additional demographic
characteristics, more detailed information on water consumption, psychological variables
preceding SODIS use, and the degree of knowledge of SODIS.
Additionally, a social monitoring was applied to about 50% of the families who were in the
long questionnaire group. The monitoring was developed to gain more insight into the timely
variations of some psychological key factors such as attitude or intention towards SODIS, social
norms, SODIS behavior and reasons for not doing SODIS. The monitoring questionnaire was
also conducted in the form of an interview and lasted about 10 minutes. It was applied twice a
week. It is known that such a high-frequency measurement may have an effect of its own due to
reactivity (Landua, 1993). Therefore, the monitoring can be viewed as a separate intervention
and will be included as such in the chapter on intervention effects. The complete time series
analysis, however, will not be presented within this thesis. It was investigated in a separate work
by Inauen (2007).
Interview procedure
During an interview, the interviewer read out the questions to the interviewee. However, it
often happened that people did not understand what was meant with a certain questions,
therefore, explanations were sometimes necessary. Answers to the questions often were simply
"yes" or "no", even when questions were formulated in a way that would require a more
differentiated answer (e.g. "How much does it bother you when you have diarrhea?"). The
reason is that people are simply not used to scaled answers. Therefore, interviewers had
received an extensive training on how to inquire about the strength of a certain statement to find

Methods 38
a differentiated answer. This difficulty resulted in quite varying interview durations ranging from
30 minutes to more than one hour. This procedure applies for both studies.
Operationalization
The operationalization of all variables used in this thesis can be found in Table 1. Since
item formulations were mostly identical in studies I and II, details of Study II are also already
included. Presented are the name of the measure as it is used in this thesis, the scale type
(open, nominal, unipolar or bipolar scale), the item formulation translated as close as possible
from Spanish, the scale information including naming of the endpoints for both studies and
possible restrictions. Restrictions are for the psychological measures about SODIS that the
person has at least to know SODIS and for the habit related measures that the person has to
use SODIS.
The scales of the psychological measures were 4-point scales for unipolar items and 7-
point scales for bipolar items in Study I. In Study II, scales were changed from 4- to 5-point
scales for unipolar items and from 7- to 9-point scales for bipolar items. The reason was to
achieve more variance of the answers. To have comparable mean values, scales were for both
studies rescaled to scores between -1 and 1 if nothing else is mentioned. For Study I, the
resulting scale steps are -1 – -0.67 – -0.33 – 0 – 0.33 – 0.67 – 1, for Study II scale steps are -1
– -0.75 – -0.5 – -0.25 – 0 – 0.25 – 0.5 – 0.75 – 1 if nothing else is mentioned. Bipolar scales
(negative and positive answer possibilities) covered the entire range from -1 to 1 with 0
representing a neutral answer. Unipolar scales either ranged from -1 to 0 or in most cases from
0 to 1. The coding direction of the unipolar items depends on the content of the item: negative
values always indicate that it hinders the behavior, neutral that there is no influence and positive
answers indicate supporting conditions for the behavior. For example, a high perceived difficulty
is a hindering factor (-1) and no difficulty is a neutral condition for the behavior (0). In contrast,
perceiving a high problem awareness is fostering the behavior (1) and perceiving no problem
awareness is neutral, but not hindering as such (therefore 0).
In the following, some more details are given to some of the measured items.
Items of problem awareness. The items concerning problem awareness were
developed based on our own previous studies (Altherr et al., 2008; Moser & Mosler, 2008) as
well as in collaboration with locals and what they though could indicate a Bolivian's perception
of problem awareness. The aim was to construct a problem awareness scale. Moser and Mosler
(2008) have already aggregated three similar variables into one scale measure; however,
internal reliability was low. Therefore, it was intended to cover a wide range of possible problem
awareness issues. Four items were initially developed: problem awareness diarrhea children,
problem awareness diarrhea self, awareness clean water, and importance clean water. In Study
II, the item about the importance of clean water was changed to the importance of health,

Methods 39
Table 1. Item formulations, including demographic variables. Studies I and II.
Variable name Scale type Item formulation Scale Study I Scale Study II
Restric-tions
Psychological measures
Problem awareness diarrhea children (Item 1 of scale Problem awareness diarrhea)
unipolar 0 to 1
Do you think it is a serious disease when a child has diarrhea?
4-point: 0 it's something
normal 1 very serious
5-point: 0 it's something
normal 1 very serious
-
Problem awareness diarrhea self (Item 2 of scale Problem awareness diarrhea)
unipolar 0 to 1
How much does it bother you when you have diarrhea?
4-point: 0 doesn't bother me1 bothers me a lot
5-point: 0 doesn't bother me 1 bothers me a lot
-
Awareness clean water
unipolar 0 to 1
When you drink a glass of water, how much do you bother about if it is clean?
4-point: 0 never 1 always
5-point: 0 never 1 always
-
Importance clean water
unipolar 0 to 1
How important is it for you to have clean water?
4-point: 0 not at all 1 a lot
- -
Importance health unipolar 0 to 1
How important is it for you to have good health?
- 5-point: 0 not at all 1 a lot
-
Causality untreated water - diarrhea
unipolar 0 to 1
Do you think that untreated water can cause diarrhea
- 5-point: 0 never 1 always
-
Knowledge SODIS nominal Have you heard of SODIS? dichotomous: 0 no 1 yes
dichotomous: 0 no 1 yes
-
Knowledge depth SODIS
unipolar 0 to 1
Could you please explain SODIS to me?
5-point: 0 does not know
SODIS 1 knows SODIS
very well
5-point: 0 does not know
SODIS 1 knows SODIS
very well
-
Belief taste - SODIS - boiling - untreated water
bipolar -1 to 1
What do you think about the taste of… - SODIS water? - boiled water? - untreated water?
7-point: -1 tastes very bad 0 tastes neither
good nor bad 1 tastes very good
9-point: -1 tastes very bad 0 tastes neither
good nor bad 1 tastes very good
SODIS: has to know it
Belief health - SODIS - boiling - untreated water
bipolar -1 to 1
Do you think that… - SODIS water - boiled water - untreated water …is good or bad for your health?
7-point: -1 very bad 0 neither good nor
bad 1 very good
9-point: -1 very bad 0 neither good nor
bad 1 very good
SODIS: has to know it
Belief money - SODIS - boiling
unipolar -1 to 0
Do you think that… - SODIS water - boiled water …costs little or a lot of money?
4-point: -1 costs a lot 0 does not cost
anything
5-point: -1 costs a lot 0 does not cost
anything
SODIS: has to know it
Belief time - SODIS - boiling
unipolar -1 to 0
Do you think that preparing… - SODIS water - boiled water …costs little or a lot of time?
4-point: -1 costs a lot of time 0 does not cost time
5-point: -1 costs a lot of time 0 does not cost time
SODIS: has to know it
Belief difficulty SODIS
unipolar -1 to 0
Do you think that preparing SODIS is difficult?
4-point: -1 very difficult 0 not difficult at all
5-point: -1 very difficult 0 not difficult at all
SODIS: has to know it

Methods 40
Variable name Scale type Item formulation Scale Study I Scale Study II
Restric-tions
Cost-benefit evaluation SODIS
bipolar -1 to 1
How much is it worth to prepare SODIS water?
7-point: -1 it costs a lot more
than it's worth 0 costs and benefits
are equal 1 it's a lots more
beneficial than it costs
- SODIS: has to know it
Affect - SODIS - boiling - untreated water
bipolar -1 to 1
Do you like/enjoy… - preparing SODIS? - preparing boiled water? - consuming untreated water?
7-point: -1 I dislike it a lot 0 I neither enjoy nor
dislike it 1 I like it a lot
9-point: -1 I dislike it a lot 0 I neither enjoy nor
dislike it 1 I like it a lot
SODIS: has to know it
Attitude - SODIS - boiling - untreated water
bipolar -1 to 1
How good or bad do you think is… - using SODIS? - boiling water? - consuming untreated water?
7-point: -1 it's very bad 0 it's neither good
nor bad 1 it's very good
9-point: -1 it's very bad 0 it's neither good
nor bad 1 it's very good
SODIS: has to know it
Injunctive norm - SODIS - boiling - untreated water
bipolar -1 to 1
What do other people think if you drink… - SODIS water? - boiled water? - untreated water?
7-point: -1 they think very
bad about me 0 they think neither
good nor bad about me
1 they think very good about me
9-point: -1 they think very
bad about me 0 they think neither
good nor bad about me
1 they think very good about me
SODIS: has to know it
Subjective norm - SODIS - boiling - untreated water
unipolar 0 to 1
What do you think or know, how many other people (neighbours)… - use SODIS? - boil their water? - consume untreated water?
5-point: 0 (almost) no one 1 (almost) everyone
5-point: 0 (almost) no one 1 (almost) everyone
SODIS: has to know it
Descriptive norm SODIS
unipolar 0 to ∞
How many people you know have you seen using SODIS during the last month?
open, numeric open, numeric SODIS: has to know it
Availability of - bottles (for SODIS) - combustibles (for boiling)
unipolar 0 to 1
Are there sufficient… - bottles available to prepare SODIS? - combustibles available to boil water?
4-point: 0 no
bottles/combustibles available
1 always available
5-point: 0 no
bottles/combustibles available
1 always available
bottles: has to know SODIS
Intention - SODIS - boiling - untreated water
unipolar 0 to 1
How much water you think you will... - disinfect with SODIS - boil - consume untreated ...in the future?
4-point: 0 nothing 1 as much as
possible
5-point: 0 nothing 1 everything
has to know SODIS
Perceived habit - SODIS - boiling - untreated water
unipolar 0 to 1
Do you think you have the habit to… - prepare SODIS? - boil water? - consume untreated water?
4-point: 0 not at all 1 a lot
5-point: 0 not at all 1 a lot
has to consume the water type
Cognition intensity SODIS
unipolar 0 to 1
Do you always remember doing SODIS?
4-point: 0 never 1 always
5-point: 0 never 1 always
has to prepare SODIS
Forgetting SODIS unipolar -1 to 0
How often do you have the intention to prepare SODIS, but then you forget it?
4-point: -1 always 0 never
5-point: -1 always 0 never
has to prepare SODIS
Dissonance SODIS unipolar 0 to 1
How much does it bother you in case you forget preparing SODIS?
4-point: 0 not at all 1 a lot
5-point: 0 not at all 1 a lot
has to prepare SODIS

Methods 41
Variable name Scale type Item formulation Scale Study I Scale Study II
Restric-tions
Implementation intention
unipolar 0 to 1
How important is it for you to use SODIS?
- 5-point: 0 not at all 1 a lot
has to prepare SODIS
Strength of commitment
unipolar 0 to 1
How committed do you feel to use SODIS?
- 5-point: 0 not at all 1 a lot
has to prepare SODIS
Behavioral measures
Behavior - SODIS - boiling - untreated water - bought beverages
nominal Do you… - use SODIS? - boil water? - consume untreated water?- buy beverages/water?
dichotomous: 0 no 1 yes
dichotomous: 0 no 1 yes
-
Behavior intensity - SODIS - boiling - untreated water - bought beverages
unipolar 0 to 1
How much of your water consumption is… - SODIS water? - boiled water? - untreated water? - bought beverages/water?
open answer in liters per day for the entire family, subsequent calculation of percentages based on total water consumption (calculated out of all separate water consumptions): 0 0% 1 100%
Panels 1 to 3: 5-point, Panel 4: 11-point: 0 0% 1 100%
-
Relapse time point open When did you stop using SODIS?
open, categorization into the respective month
- only relapser
Reasons for relapse open Why did you stop using SODIS?
multiple open answers, all answers were then grouped into categories
- only relapser
Intervention checks & measurement indicators
Communication channels
open Panel 1: Where did you here about SODIS for the first time? Panels 2 to 4: Where did you here about SODIS after the last interview?
multiple open answers, all answers were then grouped into categories
multiple open answers, all answers were then grouped into categories
-
Number of communication channels
unipolar 0 to ∞
calculated, based on the information given in the previous question -
Prompt nominal Did you receive a prompt since the last interview?
dichotomous: 0 no 1 yes
dichotomous: 0 no 1 yes
-
Public Commitment nominal Did you receive a public commitment since the last interview?
dichotomous: 0 no 1 yes
dichotomous: 0 no 1 yes
-
Monitoring nominal not asked dichotomous: 0 no 1 yes
dichotomous: 0 no 1 yes
-
Number of long questionnaires
unipolar 0 to 3
not asked 4-point: 0, 1, 2 or 3
- -
Demographic variables
Age unipolar How old are you? open, whole years open, whole numbers -

Methods 42
Variable name Scale type Item formulation Scale Study I Scale Study II
Restric-tions
Education unipolar How many years you went to school?
open, whole years. Calculation of years was assisted by the interviewer. University degree = 17 years (12 high school + 5 university)
open, whole years. Calculation of years was assisted by the interviewer. University degree = 17 years (12 high school + 5 university)
-
Number of persons per household
unipolar How many people are living in your household?
open, numeric open, numeric -
Number of children < 5years per household
unipolar How many children below 5 years of age are living in your household?
open, numeric open, numeric -
Job nominal Do you follow a regular work?
open, categorization into 0 no 1 yes
- -
Number of contacts unipolar How many people do you know in outside your household, but inside your community?
open, numeric - -
Note: The order of the variables follows the behavior change process (see Chapter 1). Intervention related variables are placed after the psychological factors.
because on clean water was already asked with the item about the awareness of clean water.
Additionally, later in Study II an item about the understanding of the causality between untreated
water and diarrhea (only panels 3 and 4) was included. How the scale was finally constructed is
explained after the operationalization part.
Knowledge depth SODIS. This question required the interviewee to explain the steps of
preparing SODIS in a detailed way. These answers were then instantly categorized by the
interviewer into one of the five possible categories, using the following criteria. These criteria
were written on the questionnaire for the interviewers' own use.
0 = no knowledge, criteria: has never heard about SODIS
0.1 = very little knowledge, criteria: has heard about SODIS, but does not know how to
prepare it and that SODIS disinfects water
0.33 = some knowledge, criteria: knows in principle how to prepare SODIS and that it
disinfects water, but does not know why or gives some 'magic' explanation
0.67 = good knowledge, criteria: knows how to prepare SODIS and either the sun or the
temperature as the cause of the disinfection process is mentioned
1 = very good SODIS knowledge: complete understanding of how to do SODIS and how
it works
The knowledge scale does not show equal intervals, because the category 'very little
knowledge' does only represent that a person has heard about the existence of SODIS or solar
disinfection without actually knowing any facts about it. The scale regarding real knowledge
depth is actually conceptualized as a 4-point scale with the presented scale steps but without
the step 'very little knowledge'. However, it seemed appropriate to include the 'very little

Methods 43
knowledge' in between 'no knowledge' and 'some knowledge'. Moreover, only few individuals
fell into this category (approx. 5-10%). Mostly, if people had heard about SODIS they also knew
some details.
In general, our knowledge measure may appear somehow unusual, but there has not
been much investigation on the issue of measuring SODIS knowledge. First steps into
establishing one have already been taken by Altherr et al. (2008) who have used a very similar
measure. The use of only one open question contrarily to classical multiple choice (often used in
education tests) or false/true items (e.g. on AIDS knowledge; Carey & Schroder, 2002) and the
subsequent categorization by the interviewers were chosen for various reasons. One is that
SODIS is basically too easy to allow for numerous questions to assess different knowledge
facets. Another one is that people are probably not used to multiple choice questions or judging
false/true statements.
Belief measures. The aim was to cover all advantages and disadvantages that people
could possibly perceive about a certain water type. Therefore, a wide range of beliefs was
covered, mainly inspired by our own studies (Altherr et al., 2008; Heri & Mosler, 2008; Moser &
Mosler, 2008) and what people had mentioned at previous occasions as an advantage or
disadvantage of the SODIS method. Since it is the aim to have more information on which belief
is important for future intervention planning, no scale was constructed.
Cost-benefit. This measure was used during the first study as a kind of summary
measure for all cognitively evaluated beliefs. The cognitive beliefs were only introduced at the
end of Study I and in Study II.
Affect and attitude. Affect is measured separately, because of the dividing of the attitude
concept. Still, attitude was measured additionally, because it is such a prominent concept (Ajzen,
1991) and it was not sure if the separate measures of affect and the cognitive beliefs would be
sufficient information.
Norms. Injunctive and subjective norm were conceptualized according to Cialdini's norm
concepts (Cialdini et al., 1990; Cialdini, 2003). Additionally, it was assumed that measuring a
real descriptive norm (how many other people were truly seen performing the behavior; Park &
Smith, 2007) covers a distinct aspect of social normative influence. Of course, also the widely
popular theory of planned behavior (Ajzen, 1985, 1991) stresses the importance of norms,
however, only focusing on Cialdini's subjective (Ajzen: descriptive) norm factor.
Availability of resources. This is a measure of the perceived behavioral control (Ajzen,
1991), which has already been used before (Altherr et al., 2008).
Intention. This measure is according to almost all behavioral theories a central construct
in predicting behavior (Ajzen, 1991) or in stage models marking the change from motivation to
action (Schwarzer, 2008) and captures how much a person intends to perform the behavior in
the future.
Cognition intensity, forgetting and dissonance. The theoretical reflection can be found
in chapter 2. The operationalizations follow the idea to be as close as possible to the
phenomenon that is intended to be captured.

Methods 44
Perceived habit. Bamberg (1996) stated the importance of asking the participants if they
perceive the behavior as habitual. The present measure of directly assessed perceived habit
was recently used by Knussen, Yule, MacKenzie and Wells (2004). However, the problem of
operationalizing the habit construct is not yet solved adequately (Klöckner, Matthies & Hunecke,
2003).
Implementation intention. Even though a great number of studies manipulate
implementation intentions (Bamberg, 2002; Chasteen, Park & Schwarz, 2001; Sheeran, Webb &
Gollwitzer, 2005), it still is not clearly defined how to operationalize this concept appropriately.
Rise, Thompson and Verplanken (2003) asked their participants about the planning strength of
the action achievement. From different yes or no answers about where and when the specific
action was planned, they formed a summation scale to model the strength of implementation
intention. So obviously, the planning of an action is the core element which is tried to capture
with measuring implementation intention (see also Brandstätter, Lengfelder & Gollwitzer, 2001;
Gollwitzer, 1999; Ziegelmann, Luszczynska, Lippke & Schwarzer, 2007). The question used in
the present study asks how important it is for the people to do SODIS. Although this question
does not follow the tradition of explicitly asking for planning efforts people may have made, it is
assumed that if a behavior is viewed as important, some planning processes are active to
successfully perform it. Planning processes as they were conceptualized by the previously
mentioned authors were viewed as an unknown or too complicated concept within the rural
Bolivian population and could therefore not be inquired directly.
Commitment. This factor was operationalized by asking about the strength of the felt
commitment. Mosler and Tobias (2007b) assume that the strength of commitment defines how
much an individual is committed to perform a certain behavior.
The problem awareness diarrhea scale The construction of the problem awareness scale using all measured items mentioned
above posed some problems. First, factor analyses were conducted (results Table 2) and
secondly different variations of the scale were analyzed with reliability analyses (Table 3).
Factor analyses for Study I always result in a 1-factor solution. However, the loading of
the item awareness clean water is only in the fourth panel >0.5. For the other three panels, the
loading is very low. In Study II the picture gets more complicated. For panels 1 and 2, the same
two factors were found: items problem awareness diarrhea children and problem awareness
diarrhea self load on one factor and awareness clean water and importance health on the
second one. In panel three, when causality untreated water – diarrhea was additionally included,
these two factors were found again plus a third one, only consisting of the newly added item. In
panel four again problem awareness diarrhea children and problem awareness diarrhea self
loaded on one factor, but the second factor consisted of the awareness clean water and the
causality untreated water – diarrhea. Importance health did not belong to one of these two

Methods 45
Table 2. Factor analysis (principal component, mineigen>1) of the items of the problem awareness stage. Rotated (Varimax) component matrices are presented. Studies I and II. Study I Study II
P1 P2 P3 P4 P1 P2 P3 P4
Label F1 F1 F1 F1 F1 F2 F1 F2 F1 F2 F3 F1 F2
PA1 .73 .69 .71 .70 .82 .06 .87 .13 .84 .18 .05 -.01 .86 PA2 .70 .73 .81 .68 .80 .12 .82 .01 .86 -.01 -.12 .09 .81 PA3 .32 .43 .49 .62 .12 .76 -.12 .84 .08 .83 .16 .85 .05 PA4 .70 .69 .70 .65 .05 .80 .31 .64 .09 .77 -.30 .38 .30 PA5 - - - - - - - - -.05 -.05 .96 .82 -.04 Eigenvalue 1.62 1.68 1.90 1.75 1.57 1.00 1.63 1.05 1.74 1.11 1.00 1.71 1.33 % of variance 40 42 47 44 39 25 41 26 35 22 20 34 27
Note: PA1 = Problem awareness diarrhea children; PA2 = Problem awareness diarrhea self; PA3 = Awareness clean water; PA4 = Importance clean water (Study I), importance health (Study II); PA5 = Causality untreated water – diarrhea. Bold numbers indicate factor loadings >0.5. P1 to P4 = Panels 1 to 4. F1 to F3 = Factors 1 to 3.
Table 3. Reliability analysis of the items of the problem awareness stage. Cronbach's alphas are presented. Studies I and II.
Study I Study II
Scale Panel 1 Panel 2 Panel 3 Panel 4 Panel 1 Panel 2 Panel 3 Panel 4
PA1 to PA5 - - - - - - .36 .51 PA1 to PA4 .48 .53 .62 .57 .48 .47 .54 .47 PA1 + PA2 + PA4 .55 .56 .65 .52 .43 .55 .51 .48 PA1 + PA2 .48 .53 .64 .53 .51 .66 .63 .62 PA3 + PA4 .24 .34 .39 .45 .39 .23 .51 .36
Note: PA1 = Problem awareness diarrhea children; PA2 = Problem awareness diarrhea self; PA3 = Awareness clean water; PA4 = Importance clean water (Study I), importance health (Study II); PA5 = Causality untreated water – diarrhea. Bold numbers indicate Cronbach's alphas >0.6.
factors. In general the picture is different for Study I and Study II. Study I indicates a one-factor
solution with three items, whereas Study II points to a two-factor solution with two items each.
Different combinations were tested for reliability in a next step.
Cronbach's alphas are in general pretty low and never exceed 0.66. The 5-item scale,
which could only be tested for 2 measurement points, performed unsatisfactory (Cronbach's
alphas of 0.36 and 0.51). The 4-item scale (without the newly added item causality untreated
water – diarrhea) and also the three-item solution, which was indicated by the factor analysis of
Study I, overall performed also unsatisfactory (7 out of 8 Cronbach's alphas < 0.6). Finally, two
two-item scales were tested as they were indicated by the factor analysis of Study II. The one
using problem awareness diarrhea children and problem awareness diarrhea self performed
best of all tested solutions, although Cronbach's alphas are still very borderline to be accepted
(for Study I between .48 and .64, for Study II between .51 and .66). However, it was a first trial
towards reducing the many dimensions measured in these studies and will be used during the
further analyses. The other three items, which are now not included in the scale, will be
separately included into the analyses.

Methods 46
Design
Since there are different types of measurements (panel, monitoring) as well as different
types of promotional strategies (communication strategies and interventions), a detailed
overview on all combinations will be given in the following. The complete design of the study is
presented in Figure 7, showing which communication strategies were applied when and in
which area as well as which of the intervention strategies prompts and public commitment
occurred in which area. Also, numbers of households with short and long questionnaires are
given as well as households with a monitoring.
Measurement design
Households were selected using a modified random route procedure (Hoffmeyer-Zlotnik,
1997). In contrast to the technique described by Hoffmeyer-Zlotnik, we did not select random
intersections, because the areas were not very big. Instead we partitioned each of the periurban
areas into four parts and one interviewer started to select each second or third house from the
center of each part, depending on how big the total area was. An equal spread of households
across areas was ensured with the aid of maps on which all the interviewed households were
marked. In the rural area, all households were tried to be interviewed due to the small size of
the village.
The person selected for the interview had to be the one responsible for water in the
household (in 90% of cases it was a woman). In the periurban areas, she was first asked if she
was willing to participate in the long questionnaire. If she refused, we asked for participation at
least in the short questionnaire. The interviewed person was told that the study would consist of
two additional measurements. Rejection rates were approximately 20% for the long
questionnaires and almost 0 for the short ones. In the rural area only long questionnaires were
applied. All households where the person responsible for water was at home during the time of
the first panel participated in the study. For the second and third panel, the same households
were visited. Of the households which initially had only had a short questionnaire in the
periurban areas and were willing to participate also in a long one, a long questionnaire was
applied (30 changes short to long questionnaire in the second panel, 26 in the third panel).
Additionally, new households were included (90 in the second panel, 9 in the third panel). The
criterion for both, changing from short to long questionnaire and inclusion of new households
was that the interviewed persons had to know about SODIS. The main reasons were to
compensate for drop outs and to assure to have households in the study that have actually
heard about SODIS, because an investigation of the effects of promotional strategies requires
knowing where people had heard about SODIS. In chapter 4 some insight will be provided into
differences on SODIS knowledge and use between households in the study since the beginning
and those 70 households who joined during the second panel. This procedure of changing short

Methods 47
Figure 7. Complete design of Study I. Includes dates of panels, number of long and short questionnaires, dates of communication activities, number of interventions, and number of households with monitoring.
1st Panel Promotion phase I 2nd Panel Promotion phase II 3rd Panel
Inactive phase 4th Panel 01.09.05 1 month 30.09.05 1 month 26.10.05 7 months 04.06.06
Health Fair: 25.09.05 no activities Prompts: 26 Prompts: 29 Prompts kept: 25 Public Commitments: 4 Public Commitments: 10 Public Commitments kept: 1
Area 1 peri-urban
N long: 30 short: 69
Monitoring: 16
N long: 78 short: 55
Monitoring: 46
N long: 84 short: 42
N long: 90
Promoters: 15-19.09.05 Promoters: 10.-14.10.05 no activities Prompts: 77 Prompts: 4 Prompts kept: 40 Public Commitments: 1 Public Commitments: 40 Public Commitments kept: 2
Area 2 peri-urban
N long: 30 short: 70
Monitoring: 12
N long: 48 short: 42
Monitoring: 25
N long: 49 short: 34
N long: 76
Opinion leaders: start 06.09.05 no activities
Prompts: 7 Prompts: 39 Prompts kept: 18 Public Commitments: 22 Public Commitments: 8 Public Commitments kept: 10
Area 3 peri-urban
N long: 30 short: 67
Monitoring: 14
N long: 73 short: 44 Monitoring: 38
N long: 85 short: 26
N long: 87
Radio; Bottle center: start 05.09.05 Radio
Prompts: 35 Prompts: 9 Prompts kept: 12 Public Commitments: - Public Commitments: 8 Public Commitments kept: -
Area 4 rural
N long: 37 short: 0
Monitoring: 32
N long: 39 short: 0 Monitoring: 35
N long: 38 short: 0
N long: 32
Area 5 peri-urban
N long: 32 short: 73
Control N long: 31 short: 64
Control N long: 31 short: 55
no activities N long: 84
Prompts: 145 Prompts: 81 Prompts kept: 95 Public Commitments: 27 Public Commitments: 66 Public Commitments kept: 13Total
N long: 159 short: 279 Monitoring: 74
N long: 269short: 205 Monitoring: 144
N long: 287 short: 157
N long: 369
Note: For the panel measurements, the starting day is given. Completing the measurements took about 5 days.
to long questionnaires and including new participants was not applied to the control area.
Constant drop outs after the first and second panel were very low and mostly related to the
short questionnaires. Rates were 7% for long questionnaires and 13% for short ones after the
first panel, 6% for long questionnaires and 14% for short ones after the second panel.
Households, which where only failed to be visited during the second or third panel were not
included in the drop out rate.
After the third panel, the study was declared as finished in all areas and no more activities
took place. The fourth panel then was conducted in June 2006. No prior warning was given to
the households, and using the same interviewers as in 2005, about 70% of the households
could be identified and interviewed again. During the fourth panel, only long questionnaires
were applied.
The social monitoring was applied to all households we could get hold of on a regular
basis in the rural area. No monitoring was applied in the control area. In the remaining three

Methods 48
periurban areas, after the first panel about 50% of the households with long questionnaires
were asked for participation in the monitoring. After the second panel, more households were
measured with long questionnaires and proportionally more households of those now having
had a long questionnaire were included in the monitoring after the second panel.
Promotional design
During the first month, the prompt was combined with the promoters and the public
commitment with the opinion leaders. For the second month of the active phase (after the
second panel), the combination was switched to promoters with public commitment and opinion
leaders with prompt. In the health fair area it had been planned to distribute both interventions
during the entire active phase. In the rural area the same sequence of interventions was applied
as in the promoters’ area (first month prompt, second public commitment). As can be seen in
Figure 7, in some cases the distribution plan did not work out as intentioned. In general, fewer
public commitments than prompts were distributed, especially during the first month of activities,
where almost no public commitments reached the households.
STUDY II
As in Study I, the complete study design took the form of a longitudinal four-point panel.
Study II lasted 11 months, but in contrast to Study I, measurements were distributed with equal
time intervals across the entire time span. The first panel took place at the beginning of the
study (beginning of May 2007), the second after 3.5 months (mid August 2007), the third after
another 3 months (mid November 2007) and the fourth and last panel took place at the end of
the study after another interval of 4 months (mid March 2008).
Study area
Also the area of Study II was located in Bolivia. Study II was carried out in the department
Chuquisaca. 22 villages from the provinces Tarabuco, Presto (approx. 9.000 inhabitants) and
Mojocoya (approx. 8.000 inhabitants) were selected (Figure 8). These regions are situated in
the highlands, more or less 3.000 meters above sea level. People use water from shallow wells
or take it directly from the river. Although we did not carry out water quality tests, it is assumed
that the water is contaminated, because the villages are surrounded by agricultural areas and
cattle. Diarrhea incidence is known to be high in the department of Chuquisaca. Although in
overall Bolivia a reduction of child mortality (children < 5 years) was achieved between 1998
and 2003 (from 67 to 54 per 1.000 live births), in Chuquisaca numbers stagnated during the
same period of time (1998: 69, 2003: 67). While in 1998 Chuquisaca was at least Bolivian

Methods 49
Figure 8. View of two villages in the study area of Study II.
average, now it is clearly above average (all numbers from Montes & Dorado, 2007, p. 77).
Moreover, the Bolivian goal by 2015 is to reduce child mortality to 30 per 1.000 live births. As a
comparison, in the EU child mortality was 6.4 per 1.000 live births in 2003 (WHO, 2003). It was
known that only few people in the study provinces knew SODIS before the start of the study and
that almost no-one was using it.
Description of promotion strategies
In contrast to Study I, Study II was planned and carried out within a much bigger project
involving a lot more actors. The overall project, named "Proyecto Agua Segura y manos limpias
(PRASML)" (Project safe water and clean hands), was carried out by the Foundation SODIS
(Fundación SODIS) in collaboration with the Ministry of Health of Chuquisaca and Departmental
Health Service (SEDES; Sucre, Bolivia). The target areas of the overall project were 5 provinces
of the department Chuquisaca with a total target population of 10.000 households. These
provinces are very rural with almost no public transport, very bad road conditions and very
dispersed settlement structures. Some so called nuclei exist with a more densely populated
village structure.
Within Study II, three areas were selected to separate the different intervention strategies.
However, many overlaps of different promotion strategies occurred and it is hardly possible to
build 'clean' subgroups where all members received the same promotional strategies.
Communication strategies
The main goal of this project was to promote SODIS and hand washing through existing
structures. The widely present structure in rural areas of many Latin American countries is the
existence of health volunteers. Each village has one or more of these health volunteers. They
are people from the village and get elected, but work without payment. The purpose of having
these health volunteers is to make the link between the employed health personnel (paid
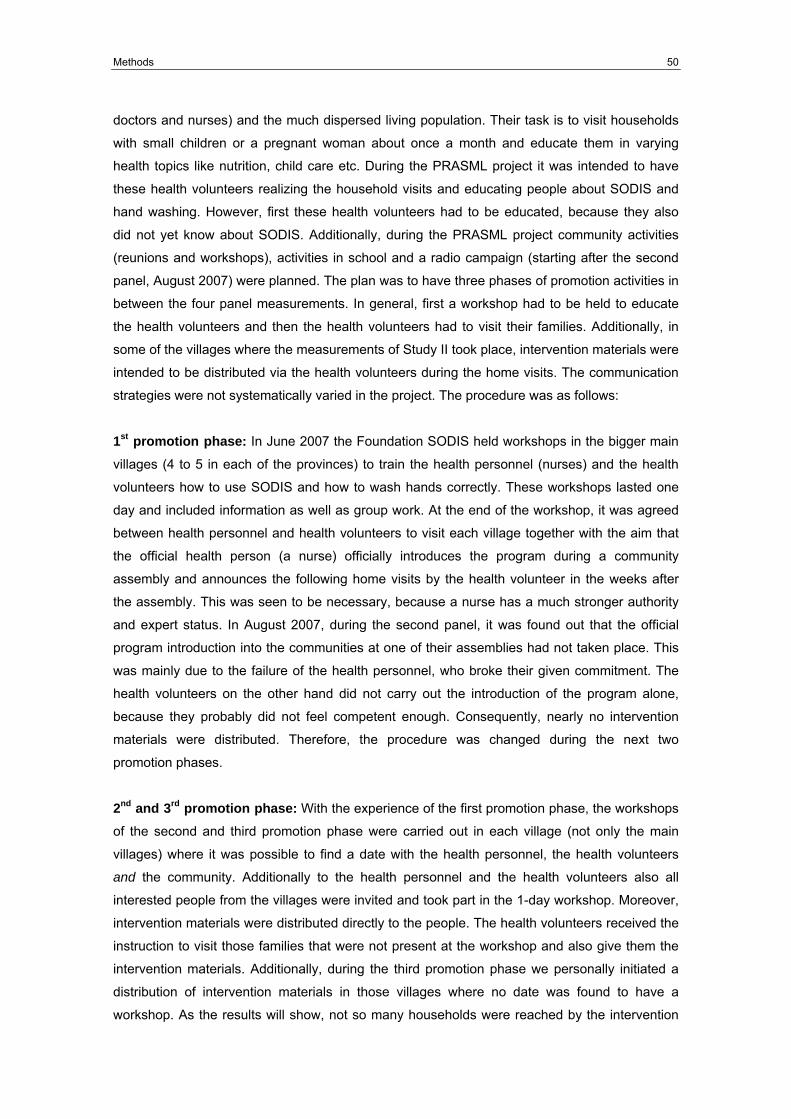
Methods 50
doctors and nurses) and the much dispersed living population. Their task is to visit households
with small children or a pregnant woman about once a month and educate them in varying
health topics like nutrition, child care etc. During the PRASML project it was intended to have
these health volunteers realizing the household visits and educating people about SODIS and
hand washing. However, first these health volunteers had to be educated, because they also
did not yet know about SODIS. Additionally, during the PRASML project community activities
(reunions and workshops), activities in school and a radio campaign (starting after the second
panel, August 2007) were planned. The plan was to have three phases of promotion activities in
between the four panel measurements. In general, first a workshop had to be held to educate
the health volunteers and then the health volunteers had to visit their families. Additionally, in
some of the villages where the measurements of Study II took place, intervention materials were
intended to be distributed via the health volunteers during the home visits. The communication
strategies were not systematically varied in the project. The procedure was as follows:
1st promotion phase: In June 2007 the Foundation SODIS held workshops in the bigger main
villages (4 to 5 in each of the provinces) to train the health personnel (nurses) and the health
volunteers how to use SODIS and how to wash hands correctly. These workshops lasted one
day and included information as well as group work. At the end of the workshop, it was agreed
between health personnel and health volunteers to visit each village together with the aim that
the official health person (a nurse) officially introduces the program during a community
assembly and announces the following home visits by the health volunteer in the weeks after
the assembly. This was seen to be necessary, because a nurse has a much stronger authority
and expert status. In August 2007, during the second panel, it was found out that the official
program introduction into the communities at one of their assemblies had not taken place. This
was mainly due to the failure of the health personnel, who broke their given commitment. The
health volunteers on the other hand did not carry out the introduction of the program alone,
because they probably did not feel competent enough. Consequently, nearly no intervention
materials were distributed. Therefore, the procedure was changed during the next two
promotion phases.
2nd and 3rd promotion phase: With the experience of the first promotion phase, the workshops
of the second and third promotion phase were carried out in each village (not only the main
villages) where it was possible to find a date with the health personnel, the health volunteers
and the community. Additionally to the health personnel and the health volunteers also all
interested people from the villages were invited and took part in the 1-day workshop. Moreover,
intervention materials were distributed directly to the people. The health volunteers received the
instruction to visit those families that were not present at the workshop and also give them the
intervention materials. Additionally, during the third promotion phase we personally initiated a
distribution of intervention materials in those villages where no date was found to have a
workshop. As the results will show, not so many households were reached by the intervention

Methods 51
materials, so the procedure followed during the second and third promotion phase should be
improved.
Interventions
The same interventions were applied as in Study I, but this time it was tried to apply them
separately in contrast to Study I. Therefore, prompt and public commitments were applied in
different areas. The goal was to re-test them in a similar context (Bolivia). However, due to
special local circumstances (it was not allowed to hang a poster inside a house) the prompt had
to be redesigned. Also the public commitment was adjusted to the new circumstances and
changed a little its design.
The prompt (Figure 9) was a cuboid made of cardboard of about 15 cm x 15 cm x 30 cm in size.
The cuboid had four sides with pictures and information on SODIS. On one side, the five steps
of how to do SODIS were displayed. On the second side were photographs of people drinking
SODIS water and the sentence "One has to put the bottles with water out into the sun". The
third side contained a reminder of hand washing with the sentence "Tell me, which hand are you
eating with … and I tell you which face you will have." (referring to the smily and the frowny on
the girl's hands) and the fourth side was a calendar, to motivate people to keep the prompt. The
cuboid had cords, which enabled the participants to hang the prompt up to the ceiling, but it also
could be put on top of some furniture. The handing in of the prompt was accompanied by the
instruction that he prompt should be situated at the place where drinking water is normally
prepared.
The public commitment (Figure 10) was as in Study I an A4 sized poster made to be
hung up outside the house. A picture with a promoter and a local woman was added to
underline the commitment character of the public commitment poster. The sentence was
changed to "We are committing us to drink water treated with the SUN" with the aim to have the
word "commitment" in the sentence. Like in Study I, it also contained a SODIS logo and no
information on how to do SODIS. It was given away with the instruction to hang it visibly outside
the house. Its function was to create a commitment within the person, a descriptive norm for
other people and to remind the person it belonged to, to use SODIS.
Persuasion
As well as in Study I, the persuasion part was tried to be standardized. A similar set of
arguments as in Study I was developed and introduced to the health volunteers. Persuasion will
not be varied in this study.
The arguments taken from Study I were: "SODIS is good for your health", "SODIS is easy
to use", "SODIS is economical", "SODIS is practical", "SODIS is popular" (similar to Study I).
New arguments were "SODIS is natural" (referring to its taste; relative advantage to boiled

Methods 52
Figure 9. The prompt of Study II. Unfolded view and folded view.
Figure 10. The public commitment of Study II.
water, which changes the taste) and "Doing SODIS is pleasant" (referring to the strong influence
of affect on intention).
Measurement
Like in Study I, measurements were realized with questionnaires that were conducted in
the form of interviews, because many people in Bolivia cannot read and write. Since the areas
were very rural and settlements were much dispersed, no pre-announcement was possible as in
Study I. Instead, community heads were informed and the interviewer carried an official
document approving their work.
The questionnaire was developed on the basis of the questionnaire of Study I and some
more items were added. Mostly identical formulations of items were used to assure
comparability between the two studies. See also operationalizations, Table 1. The questionnaire
was revised and validated with local experts and the interviewers to ensure identical
understanding of the items. In Study II only a long version existed. It contained demographic
characteristics, detailed information on water consumption, psychological variables preceding
SODIS use, boiled water use and untreated water consumption, and the degree of knowledge
of SODIS.

Methods 53
Additionally, a social monitoring was applied to about 45 households coming from three
different villages. The monitoring was developed to gain more insight into the timely variations of
some psychological key factors such as attitude or intention towards SODIS, social norms,
SODIS behavior and reasons for not doing SODIS. The monitoring questionnaire was also
conducted in the form of an interview and lasted about 10 minutes. It was applied once a week.
It is known that such a high-frequency measurement may have an effect of its own due to
reactivity (Landua, 1993). Therefore, the monitoring can be viewed as a separate intervention
and will be included as such in the chapter on intervention effects. The complete time series
analysis, however, will not be presented within this thesis. Its investigation is still in preparation.
Interview procedure and operationalizations are already described with Study I.
Design
The overview includes details on the different types of measurements (panel, monitoring)
and the different types of promotional strategies (communication strategies and interventions).
Although measurements took place in three different provinces, this will not be taken into
account in the presentation of the design, because communication strategies and interventions
occurred in all three regions. Demographic data do not indicate large differences between these
regions (not presented; Tamas, 2008, p.13). The complete measurement and promotional
design scheme is presented in Figure 11.
Measurement design
22 villages were selected for measurements. The instruction at the first panel to the
interviewers was simply to interview as many households as possible. Usually about half of the
households were at home during the first panel and included in the study. A total of 536
households were interviewed. During the following panels, interviewers were instructed to find
the previously interviewed households again. No new households were included during the
course of the study. During each panel around 85% of the initial 536 households were
interviewed again. Final drop out rates were 2% after the first panel, 2% after the second panel
and 14% after the third panel. In total, 63% were interviewed all four times.
As in Study I, the person selected for the interview had to be the one responsible for water in
the household (in 70% of cases it was a woman). If the person responsible for the water in the
household was absent, it was asked when she/he would be back and the interviewer tried to
return at that time. The interviewed person was told that the study would consist of three
additional measurements. Rejection rates were low with 0 in 71% of the cases, 1 in 20% of the
cases and between 2 and 9 for the rest (the corresponding question was "How many

Methods 54
Figure 11. Complete design of Study II, including dates of panels, number of questionnaires, number of interventions, and number of households with monitoring.
1st Panel
Promotion phase I 2nd Panel Promotion phase II 3rd Panel Promotion phase III 4th Panel 04.05.07 3.5 months 15.08.07 3 months 15.11.07 4 months 23.03.08
Prompts: 8 Prompts: 44 Prompts: 44 Public Commitments: - Public Commitments: - Public Commitments: 1 Area 1
Prompts N=95 Monitoring: 30
N=82 Monitoring: 30
N=84 Monitoring: 30
N=79
Prompts: 1 Prompts: - Prompts: - Public Commitments: 14 Public Commitments: 33 Public Commitments: 54
Area 2 Public commit-ments
N=110 Monitoring: -
N=95 Monitoring: -
N=93 Monitoring: -
N=86
Prompts: - Prompts: - Prompts: 23 Public Commitments: 1 Public Commitments: 36 Public Commitments: 26
Area 3 both N=57
Monitoring: 15 N=51
Monitoring: 15 N=54
Monitoring: 15 N=42
Prompts: - Prompts: - Prompts: - Public Commitments: - Public Commitments: - Public Commitments: -
Area 4 none N=274
Monitoring: - N=207
Monitoring: - N=236
Monitoring: - N=231
Prompts: 9 Prompts: 44 Prompts: 67 Public Commitments: 15 Public Commitments: 69 Public Commitments: 81 Total N=536 Monitoring: 45
N=435 Monitoring: 45
N=467 Monitoring: 45
N=438
Comm. Channels (Total)
N=536
Workshop: 6% Health volunteer: 2% Radio: 4% School teacher: 4% Nurse, doctor: 6% Women's group etc.: - Personal contactsa: 3% Other: - None: 78%
N=435
Workshop: 19% Health volunteer: 8% Radio: 53% School teacher: 8% Nurse, doctor: 11% Women's group etc.: 1% Personal contactsa: 7% Other: 3% None: 28%
N=467
Workshop: 46% Health volunteer: 7% Radio: 61% School teacher: 17% Nurse, doctor: 21% Women's group etc.: 12%Personal contactsa: 26% Investigatorsb: 17% None: 11%
N=438
Note: For the panel measurements, the starting day is given. Completing the measurements took about 10 days. a Personal contacts include: friends, neighbors, family members. b During the third promotion phase, the investigators of Study II went personally to two villages to hand in the intervention materials.
households did you visit without success before this one?"). However, in this measure are also
households included where the person responsible for the water in the household was not
present.
The social monitoring started in week 30, 2007 (18.07.2007). Three of the larger villages
were selected and of each village 15 households were asked to participate in the monitoring.
Promotional design
As described earlier, communication strategies were not varied during the project, it was only
checked afterwards, which households received which communication channel. In contrast,
interventions were separated and applied in different villages. The areas in this study are
therefore defined by the type of interventions: only prompt, only public commitment, both, and

Methods 55
none. The communication channels that occurred in more or less all areas are also shown in the
design overview, however, since they are not separately analyzed in this thesis, no detailed
information on co-occurrence with the interventions and distribution across the areas are
presented. As can be seen in the listing of communication channels, lots of different ones
occurred and effects would be hardly separable. Moreover, all the named communication
channels also occurred in random combinations.
SAMPLE DESCRIPTION
In the following, a descriptive overview of all used variables of the two studies being part
of this thesis is given. Note that the measures given in Table 4 refer to the entire sample
available at each time point. Therefore, descriptive measures given with the separate chapters
may differ from the ones presented here, because often analyses had to be restricted to sub-
samples due to problems with missing values or due to a particular research question. In the
following, the complete samples are described according to their demographic data. For Study I,
the areas will be compared regarding demographic data, because the analysis of the different
communication strategies (chapter 4) is based on the comparability of the four periurban areas.
The descriptive measures of the variables related to consumption of SODIS, boiled and
untreated water and their change over time are not further described, they are simply too
numerous. They are only presented for a more comprehensive understanding of the
development of different facets of the behavior change process. At some points a reference is
made to these values, particularly in the final discussion. All descriptive measures can be found
at the end of this part in Table 4.
Study I
The following demographic variables were collected and are used for sample description:
age, education, number of persons per household, number of children below 5 years per
household, gender, job situation and number of personal contacts. Percentages or means are
presented in Table 4. If significant differences exist between the four periurban areas, they will
be mentioned in the following.
The person responsible for water in the household (interviewed person) was female in
93% of the cases (N=528), the mean age was 38 years (SD=15, N=525), and the mean years of
education were 6.9 (SD=4.6, N=520). For education, all four periurban areas differ significantly
from each other, except health fair and control. The promoters' area had the lowest education
(4.9 years), followed by the control area (6.5 years), the health fair area (7.1 years) and the
opinion leader area (9.6 years). The average employment rate was 37% in the periurban areas
(mostly vendors, few with formal employment; N=490). In the rural area, almost all people

Methods 56
worked as farmers. For occupation rate, the promoters' area differed significantly from all other
areas having the lowest employment rate (15%). The other three areas had employment rates
between 43% and 48%. The total amount of people living in one household was 5.0 people
(SD=2.0, N=526). Significant differences were found only between the health fair (5.3 persons)
and the opinion leader area (4.6 persons); the other two areas had values in between. Each
household had on average 0.85 children below 5 years of age (SD=0.95, N=525); no significant
differences between the areas. On average, the interviewed person had contact with 2.4
persons outside their own house, but still living within the same community (SD=2.3, N=306)
with significant differences between the promoters' area (3.2 persons) and the health fair (2.0
persons) as well as the opinion leaders' area (1.5 persons). The control area had a value in
between (2.1 persons).
Overall, the demographics do not show any important differences between the four
periurban areas. Particularly important, there is no area having always the lowest or highest
values. Therefore, the areas are considered as being comparable for the analyses of chapter 4,
but it will also be controlled for the demographic variables whenever possible.
Study II
For Study II, the same demographic variables are presented, except job situation and
number of personal contacts. The job situation in rural areas is the same for all households –
every family has to do farming, else they would not have food to eat. Therefore, this measure is
not presented. Number of contacts was not measured in this study.
The person responsible for water in the household (interviewed person) was female in
71% of the cases (N=536), the mean age was 44 years (SD=16, N=536), and the mean years of
education were 2.9 (SD=3.4, N=535). The total amount of people living in one household was
5.1 people (SD=4.3, N=536) and each household had on average 0.7 children below 5 years of
age (SD=0.9, N=536).
Compared to Study I, a higher percentage of men were interviewed, although the majority
of the water responsible persons is still a woman. The sample was on average a little older and
a lot less educated. This is most probably due to the fact that the sample of Study I is mainly
from periurban areas and the Study II sample from very rural areas. The indicator on education
shows for Study II that 40% did not go to school at all; for Study I it is only 12%. Interestingly,
household sizes are the same and also number of children below 5 years is equally low in both
samples. However, the mean age indicates that the samples are rather old (especially Study II)
and their children are probably already more than 5 years old.

Methods 57
Table 4. Descriptive measures of all four time points. Studies I and II. Study I Study II Panel 1 Panel 2 Panel 3 Panel 4 Panel 1 Panel 2 Panel 3 Panel 4 Variable name N M SD N M SD N M SD N M SD N M SD N M SD N M SD N M SD Problem awareness diarrhea children 159 .68 .29 269 .78 .25 287 .71 .24 369 .77 .21 533 .66 .20 429 .72 .18 465 .73 .15 436 .76 .10 Problem awareness diarrhea self 159 .74 .26 266 .76 .22 286 .77 .20 369 .78 .21 532 .66 .18 434 .71 .19 458 .71 .15 435 .74 .09 Problem awareness diarrhea 159 .71 .22 266 .77 .19 286 .74 .19 369 .78 .17 531 .66 .15 429 .72 .16 458 .72 .13 435 .75 .08 Awareness clean water 159 .53 .36 269 .60 .34 287 .6 .35 369 .58 .31 535 .45 .28 434 .62 .26 465 .69 .21 436 .64 .17 Importance clean water 158 .82 .18 269 .84 .17 287 .82 .16 368 .75 .17 - - - - - - - - - - - - Importance health - - - - - - - - - - - - 535 .78 .16 435 .83 .16 465 .85 .16 437 .75 .08 Causality untreated water - diarrhea - - - - - - - - - - - - - - - - - - 466 .65 .25 437 .70 .23 Knowledge SODIS (% yes) 438 36% 473 81% 444 98% 369 100% 536 10% 435 41% 466 86% 437 96% Knowledge depth SODIS 159 .25 .33 245 .55 .37 277 .79 .22 367 .74 .26 534 .04 .13 418 .16 .26 458 .42 .29 430 .64 .26 Belief taste SODIS - - - - - - - - - 359 .51 .33 45 .41 .33 151 .40 .36 389 .42 .36 416 .62 .27 Belief taste boiling - - - - - - - - - - - - 536 .08 .40 435 .04 .44 464 .12 .44 436 .33 .48 Belief taste untreated water - - - - - - - - - - - - 536 .53 .33 434 .50 .40 466 .48 .48 437 .14 .61 Belief health SODIS - - - - - - - - - 367 .59 .26 50 .65 .20 150 .65 .27 391 .65 .25 418 .70 .17 Belief health boiling - - - - - - - - - - - - 536 .61 .25 435 .64 .33 465 .63 .27 437 .66 .20 Belief health untreated water - - - - - - - - - - - - 536 -.09 .48 433 -.11 .50 465 -.25 .53 436 -.33 .56 Belief money SODIS - - - - - - - - - - - - 51 -.07 .13 150 -.06 .13 391 -.03 .09 415 -.03 .09 Belief money boiling - - - - - - - - - - - - 535 -.16 .18 435 -.18 .22 465 -.14 .20 435 -.14 .15 Belief time SODIS - - - - - - - - - 367 -.13 .20 51 -.15 .14 149 -.13 .18 390 -.09 .15 418 -.09 .13 Belief time boiling - - - - - - - - - - - - 536 -.19 .16 433 -.18 .18 463 -.14 .17 437 -.15 .14 Belief effort SODIS - - - - - - - - - 367 -.14 .20 - - - - - - - - - - - - Belief difficulty SODIS 155 -.22 .30 238 -.05 .14 286 -.05 .16 367 -.07 .17 49 -.18 .20 150 -.12 .21 388 -.11 .19 418 -.06 .13 Cost-benefit evaluation 70 .52 .47 226 .74 .23 286 .69 .27 367 .62 .32 - - - - - - - - - - - - Affect SODIS 61 .55 .29 225 .65 .25 286 .68 .19 367 .54 .32 50 .41 .31 150 .43 .31 390 .48 .30 417 .64 .20 Affect boiling 153 .62 .33 258 .57 .35 284 .58 .31 - - - 535 .24 .34 435 .23 .41 467 .37 .35 437 .54 .30 Affect untreated water - - - - - - - - - - - - - - - 434 .45 .40 466 .34 .49 435 .07 .62 Attitude SODIS 156 .74 .24 268 .73 .21 287 .77 .20 367 .67 .27 48 .46 .31 151 .56 .30 391 .56 .28 418 .69 .17 Attitude boiling - - - - - - - - - - - - 536 .39 .30 434 .38 .37 465 .44 .33 437 .57 .32 Attitude untreated water - - - - - - - - - - - - 533 .13 .47 435 .18 .50 466 -.02 .57 437 -.11 .64 Injunctive norm SODIS 70 .39 .34 225 .52 .30 286 .48 .32 367 .36 .33 49 .24 .34 148 .33 .33 390 .38 .34 417 .42 .35 Injunctive norm boiling - - - - - - - - - - - - 536 .26 .31 435 .27 .37 466 .33 .33 436 .38 .34 Injunctive norm untreated water - - - - - - - - - - - - 535 .03 .29 434 .08 .32 465 -.01 .35 436 -.02 .45 Subjective norm SODIS - - - - - - - - - - - - 50 .14 .14 150 .18 .18 388 .28 .23 417 .23 .19 Subjective norm boiling - - - - - - - - - - - - 533 .21 .18 433 .24 .14 467 .30 .23 437 .25 .21 Subjective norm untreated water - - - - - - - - - - - - 534 .72 .30 435 .76 .21 465 .63 .23 437 .44 .32 Descriptive norm SODIS 157 0.62 2.07 269 1.74 3.17 287 2.95 4.03 369 1.11 1.75 42 0.38 0.94 114 0.66 1.10 261 2.41 5.15 389 1.54 1.76

Methods 58
Study I Study II Panel 1 Panel 2 Panel 3 Panel 4 Panel 1 Panel 2 Panel 3 Panel 4 Variable name N M SD N M SD N M SD N M SD N M SD N M SD N M SD N M SD Availability bottles 158 0.76 0.37 103a .87 .26 32a .95 .15 - - - - - - 189 .60 .38 317 .61 .32 400 .55 .31 Availability combustibles 159 0.79 0.31 103a .89 .18 32a .85 .24 - - - 536 .56 .28 433 .58 .30 466 .60 .29 437 .54 .30 Intention SODIS 156 .84 .26 236 .83 .28 285 .87 .25 366 .68 .33 37 .39 .25 149 .57 .24 388 .66 .23 418 .65 .22 Intention boiling 159 .72 .34 257 .82 .28 285 .87 .24 - - - 536 .42 .17 434 .49 .19 464 .51 .25 437 .51 .22 Intention untreated water - - - - - - - - - - - - 534 .54 .22 435 .54 .23 463 .39 .29 436 .25 .29 Perceived habit SODIS - - - - - - - - - 367 .25 .30 13 .60 .22 93 .48 .28 247 .61 .25 363 .60 .23 Perceived habit boiling - - - - - - - - - - - - - - - 430 .35 .24 460 .36 .29 436 .45 .24 Perceived habit untreated water - - - - - - - - - - - - - - - 435 .64 .25 465 .49 .30 433 .31 .32 Cognition intensity SODIS 16 .50 .30 160 .60 .30 232 .66 .28 367 .38 .39 14 .48 .32 92 .52 .28 246 .64 .25 366 .58 .23 Forgetting SODIS 16 -.52 .34 158 -.33 .29 233 -.29 .23 266 -.56 .35 14 -.29 .24 92 -.38 .27 248 -.29 .22 364 -.24 .23 Dissonance SODIS 16 .40 .28 151 .45 .35 225 .49 .33 350 .24 .29 12 .27 .31 92 .28 .25 233 .32 .23 324 .42 .28 Implementation intention - - - - - - - - - - - - - - - 149 .63 .29 389 .64 .28 417 .68 .25 Strength of commitment - - - - - - - - - - - - - - - 91 .45 .31 247 .42 .32 364 .54 .27 Behavior SODIS I (% yes) 438 5% 472 33% 444 58% 369 38% 536 3% 436 25% 467 54% 438 83% Behavior boiling I (% yes) 159 97% 268 96% 287 99% 369 99% 535 90% 434 95% 467 91% 438 96% Behavior untreated water I (% yes) 159 54% 103a 24% 262 22% 369 33% 536 98% 435 97% 467 84% 438 55% Behavior bought beverages I (% yes) 159 25% 103a 16% 32a 25% 369 55% 529 21% 417 35% 467 17% 438 13% Behavior intensity SODIS 159 .01 .07 103a .20 .28 32a .22 .28 369 .15 .23 532 .01 .09 427 .11 .23 467 .33 .35 438 .47 .31 Behavior intensity boiling 159 .58 .34 103a .65 .27 32a .58 .27 369 .64 .27 536 .24 .20 435 .32 .21 467 .34 .26 437 .28 .19 Behavior intensity untreated water 159 .32 .37 103a .09 .18 32a .08 .20 369 .12 .23 535 .74 .26 435 .64 .27 464 .47 .33 437 .25 .31 Behavior intensity bought beverages 159 .09 .18 103a .06 .14 32a .11 .21 369 .10 .17 - - - - - - - - - - - - Age 435 39.1 14.9 466 38.3 15.1 436 38.3 15.0 364 39.3 15.2 536 43.8 16.3 435 44.4 16.1 467 44.0 16.2 438 43.9 16.0 Education 432 6.7 4.7 461 7.1 4.6 429 7.0 4.6 358 6.8 4.7 535 2.9 3.4 435 2.8 3.2 466 2.8 3.4 437 2.8 3.2 Persons per household 436 5.1 2.0 467 5.0 2.0 436 5.1 2.1 364 5.2 2.0 536 5.1 4.3 435 5.1 4.5 467 5.1 4.4 438 5.1 4.5 Children <5y. per household 436 0.8 0.9 467 0.9 0.9 435 0.9 1.0 364 0.8 1.0 536 0.7 0.9 435 0.7 0.9 467 0.7 0.9 438 0.7 0.9 Gender (% female) 438 93% 469 93% 437 93% 365 93% 536 71% 435 73% 467 70% 438 71% Job (% yes) 438 34% 469 36% 437 36% 365 35% - - - - - - - - - - - - Number of contacts 216 2.6 2.5 287 2.4 2.3 282 2.4 2.3 244 2.3 2.3 - - - - - - - - - - - - Prompts (% yes) - - - 474 30% 444 18% - - - - - - 435 2% 467 9% 438 15% Public commitment (% yes) - - - 474 6% 444 15% - - - - - - 435 3% 467 15% 438 18% No. of communication channels - - - 474 1.39 1.05 444 0.66 0.82 - - - - - - 435 0.25 0.52 466 1.13 0.97 437 2.05 1.44 Long questionnaires 159 269 287 369 536 435 467 438 Short questionnaires 279 205 157 - - - - - Additional households - 90 9 - - - - - Real drop outs - 33 30 105 - 10 13 75
Note: a These variables were only measured with those households who joined the study newly or were changed from short to long questionnaires. They have to be interpreted carefully.
Chapter 1
Behavioral models for the consumption of SODIS, boiled and untreated water
CONTENTS
Abstract.............................................................................................60 Introduction.......................................................................................61 SODIS behavior change in a stage model .................................61 Problem awareness..............................................................62 Persuasion ...........................................................................63 Uptake ..................................................................................65 Habit .....................................................................................66 Summary ..............................................................................67 Comparing determinants of SODIS, boiled and untreated
water consumption ...............................................................68 Methods ............................................................................................69 Results..............................................................................................69 Relations between the intentions and behaviors SODIS,
boiling and untreated water..................................................69 Predictors of the behavioral intention.........................................71 Predictors of behavior ................................................................76 Discussion ........................................................................................79 The intention models ..................................................................79 The behavioral models ...............................................................81 Integration of the intention and the behavioral models into
the stage model....................................................................82 Conclusion & Limitations ..................................................................85

Behavioral models for using SODIS, boiling and consuming untreated water 60
ABSTRACT
The entire water consumption pattern is investigated in the present chapter based on the
factors derived from a stage model of behavior change. The model consists of two motivational
phases, namely problem awareness and persuasion, and two volitional phases, namely uptake
of the behavior and habit development. Intention is viewed as a crucial transition point between
the motivational and volitional phases. It is hypothesized that SODIS, boiled and untreated
water consumption are driven by different factors of the behavior change process. It is assumed
that with the knowledge of those factors, contents of promotion campaigns could be planned
much more effectively.
To analyze the water consumption pattern, data from the last panel of Study II is used.
Regressions were calculated to predict a) the intentions to use SODIS, boil water and consume
untreated water with factors from the motivational phases, and b) the percentage of water
consumed of each water type with the behavioral intention and factors from the volitional stages.
The results show that all stages of the behavior change process are involved in predicting
intentions and behaviors. However, the problem awareness factors are of much lower
importance than the persuasion phase factors. Particularly affective influences show a strong
influence on intention in addition to the belief about the taste of each water type. Norms only
influence the intention to boil water with a relevant strength. The behaviors are all influenced by
the intention, which indicates the importance of this transition measure, and perceived habit.
Availability of resources and the indicator of uptake, past behavior, only showed low influence.
Additionally, quite strong negative relations between the different intentions as well as the
different behaviors of SODIS and untreated water were found.
The analyses confirm the usefulness of the model, particularly the inclusion of the habit
phase. Of the motivational phases, problem awareness does not seem to play such an
important role. Although some valuable insights could be gained, additional factors should be
considered, because particularly the intention towards boiling and the behavior boiling could not
be explained very well. Moreover, indicators of the uptake phase are missing. Furthermore,
implications for SODIS campaigns are discussed based on the specific factors influencing the
different intentions and beliefs.
Keywords: behavior, intention, behavior change process, SODIS, boiling, untreated water

Behavioral models for using SODIS, boiling and consuming untreated water 61
INTRODUCTION
For some decades now, the topic of health behavior has been the focus of many
researchers, who studied for example smoking prevention (Prochaska, DiClemente & Norcross,
1992), exercise programs (Fuchs et al., 2005) or changing poor diets (Lippke & Sniehotta, 2003).
Often, the adoption of a health preventive behavior is viewed as the only logical answer to a
potential health threat (Schwarzer, 2001). This view is mainly based on the doubtful assumption
that humans are purely rational driven living beings. However, many studies show that the
perception of a health risk alone is a weak predictor of behavior change, i.e. the adoption of a
preventive behavior (e.g. Calnan & Rutter, 1988; Luszczynska & Schwarzer, 2003; Schwarzer,
2001). One may only think of the risk of contracting lung cancer due to smoking, obesity due to
too much junk food, and many other examples where no action is taken, although risks are
perfectly known (Schwarzer, 2001).
The desire to understand the phenomena in the context of health preventive behaviors
led to the development of several behavioral models, e.g. the transtheoretical model (Prochaska
& DiClemente, 1983) or the health action process approach (Schwarzer, 2008). These models
follow the assumption of qualitatively different stages and consequently different mechanisms
underlying each stage. Stage models were designed for closing the intention-behavior gap by
including those post-intentional factors that seemed to be of importance for behavior change.
Moreover, this approach was simply more appealing for designing and understanding the
functioning of different interventions.
In the present chapter the behavior change process regarding SODIS water consumption
is described in detail, using four different stage models as the basic theoretical approach and
combining them. The described stages of the behavior change process also apply of course to
the consumption of other types of water, i.e. boiled or untreated water. The statistical analyses
first focus on explaining the behavioral intention as the transition point from motivation to action
stages and then, in a second step, try to explain the consumption of the three types of water
that are consumed in the study areas: SODIS water, boiled water and untreated water. All three
types of consumed water are investigated, because they are strongly related to each other,
which is also shown during the analysis. Discussion will concentrate on important predictors of
intentions as well as behaviors and discuss measures to increase consumption of SODIS or
boiled water and decrease the consumption of untreated water.
SODIS behavior change in a stage model
A short introduction to stage models has already been given in the chapter Introduction,
particularly outlining the advantages of stage models compared to continuum models. It was
concluded that stage models are more appropriate to serve as a theoretical framework to

Behavioral models for using SODIS, boiling and consuming untreated water 62
explain the behavior change process for the present study than continuum models. Not only the
emphasis on the stage or phase character of the behavior change process was a decisive factor
in favor of stage models, but also the common intention-behavior gap of continuum models,
simply ignoring the habit formation process. Several stage models outlined in the chapter
Introduction were condensed to a model comprising four different themes of interest. These four
topics follow the general idea of stage models, understood as different phases or stages the
individual has to pass through. The four topics or stages are: (1) problem awareness (2)
persuasion, (3) uptake and (4) habit. Problem awareness and persuasion can be condensed
into a motivational phase, where mostly cognitive processes are involved. It is not explicitly
stated that being in the problem awareness and persuasion phase has to occur in sequence,
processing of both types of information may as well take place in parallel. Uptake and habit are
action phases and involve different processes. It has already been suggested by theoretical and
empirical evidence that uptake and maintenance of a new behavior have different underlying
motivational and volitional processes. While behavior uptake is probably more determined by
positive beliefs, attitudes and intentions, as well as initiation processes, for habit development
factors like maintenance self-efficacy (e.g. Luszczynska & Schwarzer, 2003), action planning,
self concordance of intentions, or integration of feedback may be more important determinants
(Lippke, Ziegelmann & Schwarzer, 2004, 2005). Intention is viewed as a transition point
between the motivational and action phases. The more a goal intention actually corresponds to
one’s own wishes and needs, the stronger the goal behavior will be pursued in critical moments.
Also, mechanisms of protecting the intention against attractive behavioral alternatives can be a
useful strategy (Fuchs et al., 2005).
In the following, the stages are described in more detail, taking the behavior SODIS water
consumption as an example and deriving specific factors of each stage. The overlaps of each
stage to four common stage models are described. Links to the proposed indicators of the
different stages will also be made.
Problem awareness
The first topic considered as being important to initiate successful behavior change is
everything that relates to the awareness of the problem the target behavior is designed to solve.
A certain need for a new behavior must be developed (E. M. Rogers, 1995, p. 164). The new
behavior can trigger the perception of that need or vice versa. Of course, at some point the
individual has to realize that the target behavior actually exists and may be a possible solution
to the problem or need.
Often, stage models do not include this stage or simply depict problem awareness as the
prior condition to enter the behavior change process (E. M. Rogers, 1995, p. 163). Only the
transtheoretical model has a separate stage for people who have not yet experienced the need
or seen the problem: the pre-contemplators. The process of acquiring problem awareness

Behavioral models for using SODIS, boiling and consuming untreated water 63
describes the transition from the immotive pre-contemplation stage to the contemplation
process (Prochaska & DiClemente, 1983). A certain amount of motivation to change the
behavior is necessary to start dealing with the problem (Prochaska & DiClemente, 1982).
Schwarzer (2008) at least involved risk perception as one factor into his first stage (motivational
phase).
The problem the SODIS method intends to solve is the occurrence of diarrhea episodes
by disinfecting drinking water. Hence, it has to be realized by the individual that diarrhea is
dangerous not only for the adult itself, but particularly for young children (problem awareness
diarrhea1), the causality between consuming contaminated untreated water and contracting
diarrhea has to be made (causality contaminated water – diarrhea) and it has to be realized that
the individual's own drinking water is contaminated. Moreover, the topic of being healthy and
having clean water has to be given a certain priority or importance (importance health,
awareness clean water), which results in the motivation that is needed to take serious steps
towards solving the problem (Prochaska & DiClemente, 1982). At this stage of the process the
individual does not show the target behavior and maybe does not even know about the
existence of SODIS.
To gain awareness of the drinking water and diarrhea problem, different possibilities exist.
The contamination of drinking water may be perceived directly, for example by having frequent
episodes of diarrhea. Then, with simple information, a link can be made between water and
diarrhea, and the solution SODIS use can be pointed out. If no diarrhea has been experienced,
the dangerous potential of consuming untreated water, its relation to diseases and the solution
SODIS can also be directly explained to the person.
Persuasion
Persuasion involves all processes that support the individual in forming a favorable or
unfavorable opinion about the target behavior and results in an at least temporarily valid
decision to try out the behavior. This involves cognitive, affective, social and mental planning
processes. Cognitive processes are the seeking and evaluating of different available information
to reduce uncertainty about the new behavior. In developing an attitude toward the new
behavior, an individual may also rely on social peers and their opinions and actions. Apart from
a purely rational evaluation of information, affects or feelings toward the new behavior may also
be of significance, especially in case of lower importance of the topic and therefore lower
cognitive processing activity (see Elaboration Likelihood Model; Petty & Cacioppo, 1986). The
end of the persuasion stage is marked by a decision and a certain degree of commitment to
step into action and try out the behavior (Prochaska & DiClemente, 1982). Finally, mental
planning processes can be used to anticipate the future situation (E. M. Rogers, 1995, p. 168).
1 The italic names in brackets are the item names that will be used later in the results and discussion section.

Behavioral models for using SODIS, boiling and consuming untreated water 64
In the most common stage models, the persuasion stage is conceptualized as an
important step towards behavior adoption. The innovation decision process (E. M. Rogers, 1995)
divides it up into the knowledge stage, which involves the cognitive processes of information
seeking, the persuasion stage, which is more characterized by affective thinking, and the
decision stage, which describes the actual decision to adopt or reject the new behavior. Also the
transtheoretical model (Prochaska & DiClemente, 1983) divides the processes of thinking about
adoption of the new behavior and deciding to do so into two separate stages: contemplation and
preparation. The model of action phases (Heckhausen & Gollwitzer, 1987) summarizes all
consideration processes into one stage, the pre-decisional stage. The decision to act is viewed
as the critical step of 'crossing the Rubicon'. The model of action phases separates the
subsequent planning process from the decision (pre-actional phase). Finally, the health action
process approach (Schwarzer, 1992, 2008) views all these processes as being part of the
motivational phase.
In SODIS terms, at the persuasion stage, the individual has realized that untreated
drinking water is potentially dangerous and knows that SODIS could be a possible solution.
However, the person is still not convinced that SODIS may be the best solution in his or her
situation and may also not know exactly how it works. Consequently, the individual is
perceptible for information about SODIS and action-related knowledge about SODIS increases
(knowledge depth). Some studies have shown a positive relation between knowledge and
behavior for recycling (De Young, 1988; Vining & Ebreo, 1990). However, Frick (2003) suggests
that the influence of action knowledge is mediated by intention (Frick, 2003, p. 103). During the
processing of SODIS information, certain beliefs about SODIS develop, which can predict
behavior (Graf, Meierhofer, Wegelin & Mosler, 2008). In this study, the various beliefs are
understood as the cognitive process of evaluating information; hence, they contribute to form an
intention. A wide range of beliefs was covered, adopted from Heri and Mosler (2008), who
conducted a similar analysis, and further complemented by what people had mentioned at
previous occasions as an advantage or disadvantage of the SODIS method. Concerns about
the safety of SODIS water (belief health), its application costliness (belief money), time
requirements (belief time) and difficulty (belief difficulty) of the SODIS method were measured.
Not less important, but probably with a more affective connotation is the belief about the taste of
the water (belief taste) and the general affect or feeling the person develops towards SODIS
water (affect). Those cognitive and affective considerations lead to a favorable or unfavorable
attitude towards SODIS (attitude). The two dimensions of attitude, cognitive and affective, have
already been described by several authors (Breckler & Wiggins, 1989; Fabrigar & Petty, 1999;
Mosler, Tamas, Tobias, Caballero Rodriguez & Guzman Miranda, 2008; Trafimow & Sheeran,
1998). Moreover, the differentiation into cognitive beliefs and affective elements is a lot more
useful for evaluating, which aspects of an innovation have to be addressed, particularly for
future promotion campaigns (Van Der Pligt & De Vries, 1998).
Both, cognitive and affective processes can of course be influenced by the exchange with
peers. The perceived opinion of neighbors and friends regarding SODIS, and the assumption

Behavioral models for using SODIS, boiling and consuming untreated water 65
that they are using SODIS or not, should not be underestimated in their influence on someone's
opinion. It is distinguished between the reputation SODIS has (injunctive norm) and the
perceived percentage of people performing SODIS in the community (subjective norm; Ajzen,
1985, 1991; Cialdini et al., 1990; Cialdini, 2003). Real observations of people using SODIS will
exert an additional influence (descriptive norm). Finally, a decision will emerge. Either the
individual decides that SODIS is nothing for him or her due to various reasons, or a decision is
made to at least try out SODIS a little or a lot (intention), which marks the transition point to the
action stages. Intention is represented as a kind of bottle neck in most models, being the
repository of all the previously mentioned processes (e.g. Ajzen, 1991; Heckhausen &
Gollwitzer, 1987; Schwarzer, 2008).
Measures to cognitively convince people of SODIS can be all kinds of information in oral
or written form. Addressing the affective dimension of attitude is more difficult and may be
realized with relating SODIS to something pleasant. This may be the atmosphere during an
information campaign or a joke on a poster. Positive social influence is hard to exert in an
environment where people are not yet using SODIS. Here, either local stars or influential
persons of a community may be won over to publicly support the SODIS idea and function as
role models.
Uptake
Until now, the behavior change process was only marked by motivational mental
processes (E. M. Rogers, 1995, p. 172). Now, in the third phase the individual starts performing
the behavior and volitional processes take over. At first, try out behavior is performed to
evaluate the usefulness of the method in an individual’s situation (Prochaska et al., 1992).
Situational factors can be very important during this early action phase (Fuchs, 2003, p. 133). If
the trials are negatively evaluated, the individual may go back to the persuasion stage and
maybe look for more information or social support. These relapses to a former stage may occur
several times and are postulated as spiral-like processes (E. M. Rogers, 1995, p. 201;
Prochaska & DiClemente, 1983). As during all previous stages, the individual also has the
possibility to drop out of the process. Maybe an alternative behavior appears to be more
convincing and suitable, or the old behavior is resumed. One of the challenges of the uptake
phase is to continue performing the behavior in case of a positive opinion and intention until a
certain amount of automaticity and habit has developed. During this phase, the behavior has to
be consciously remembered and activated.
Some stage models simply call this stage 'action' (transtheoretical model, Prochaska &
DiClemente, 1982; model of action phases, Heckhausen & Gollwitzer, 1987). Rogers (E. M.
Rogers, 1995, p. 172) calls this stage implementation stage and the health action process
approach (Schwarzer, 2008) post-intentional volitional phase. The main differences to the
following maintenance stage are the time span after the decision, and that the behavior has not
yet been established as a continued change (Prochaska et al., 1994). Rogers additionally takes

Behavioral models for using SODIS, boiling and consuming untreated water 66
note of the implementation phase phenomenon of re-invention of an innovation. This is, when
"the new idea changes and evolves during the diffusion process" (E. M. Rogers, 1995, p. 174).
However, this phenomenon will not be investigated here and has been observed only in very
rare occasions for SODIS2.
Regarding SODIS, a person may try out SODIS once or a few times. Either doubts arise
and another phase of persuasion is entered or SODIS will be used more or less regularly. Since
the SODIS behavior is not very complicated, in promotion campaign areas most people at least
reach this try-out phase. Depending on the initial intention, situational factors like bad weather,
not having time or availability of bottles (availability of bottles) may or may not interrupt SODIS
use. The amount of cognitive resources each person applies to sustain SODIS use also
depends on the initial commitment. Low cognition intensity at this stage often results in
forgetting the behavior (Tobias, 2007). Not only using SODIS constantly in the uptake phase is
important, but also which part of the daily consumed water is treated with SODIS. During the
first try out period, a person can as well decide to only disinfect a small part of the daily
consumption with SODIS, which probably makes a difference in habit formation and reflects the
initial amount of commitment. This suggests past behavior intensity as a predictor of present
behavior intensity. However, empirical evidence already suggests that in case of well formed
intentions, effects of past behavior on future behavior are weak (Ajzen, 2002a; Bamberg et al.,
2003). Moreover, for the current analysis the time span between measurements was fairly long
(4 months). Therefore, effects are expected to be rather weak.
To keep SODIS present in people's heads, it is important not to stop with SODIS
promoting activities too early. At this stage, content does not really play a role (unless people
fall back to the persuasion stage), it may be a better strategy to use many small and individual
things that help remembering. Also, the easiness of the trial is important (E. M. Rogers, 1995, p.
16) and can be facilitated by providing the necessary resources (i.e. bottles) in the beginning.
Habit
The last stage is characterized by habit development with habit forming processes being
active. These processes are described in more detail in chapter 2, where relapse behavior due
to failed habit development is characterized in contrast to continued behavior.
The transtheoretical model defines a time frame for entering the maintenance stage – that
is 6 months after action has started (Prochaska et al., 1994) and ends when the problem is
solved and the individual has left the process, because no desire to relapse exists anymore
(Prochaska & DiClemente, 1982). For Rogers (E. M. Rogers, 1995, pp. 180), the last stage,
named confirmation, has a stronger focus on confirming the taken decision and action. This can
be realized by seeking reinforcement, or by reducing or avoiding a state of dissonance. In the
model of action phases (Heckhausen & Gollwitzer, 1987), the last stage (post-actional phase) is
2 In Study I, about 5 households used SODIS to heat up their water already before the study. However, these individuals were unaware of the disinfection process.

Behavioral models for using SODIS, boiling and consuming untreated water 67
rather cognitively driven, where intended and achieved goals are critically evaluated. Also, the
health action process approach (Schwarzer, 2008) does not explicitly mention habit developing
processes in the volitional phase, which includes maintenance. Only cognitive, behavioral and
situational processes are mentioned, which correspond more to the previously described uptake
stage.
For a long-term use of SODIS, it is important that people primarily do not forget preparing
SODIS during their daily life routine or constantly prioritize other things. Also, it is of importance
to achieve a positive evaluation in terms of solving the problem initially described, i.e. reducing
diarrhea episodes. It is therefore a goal to reduce untreated water consumption and increase
SODIS water consumption as much as possible. Else, people will never experience any positive
health effects and most likely stop using SODIS after a while. Once SODIS preparation is truly
habitual, it is used rather unconsciously, despite of possibly hindering situational factors
(perceived habit). However, the factors it depends on and how long exactly it takes until a new
habit has developed, has not been answered clearly by today’s behavior change research
(Tobias, 2007, p. 109). This problem will be discussed in more detail in the chapter about
relapse behavior (chapter 2).
Measures to support habit development processes should be introduced on an individual
level with memory aids or personalized integration of the new behavior into people's daily
routines, so that it gets anchored and related to other daily activities.
Summary
In Figure 12 the entire behavior change process is presented. The topics or stages
described are not strictly linear as it may appear from the graphical presentation. Particularly
problem awareness and persuasion may in large parts be parallel processes. As Schwarzer
(2008) suggests, it is sufficient to only distinguish between pre- and post-intentional processes
(motivational and volitional), because in some empirical studies not all stages of models
containing several stages could be replicated and for example, critics on the many stages of the
transtheoretical model arose (Herzog, Abrams, Emmons, Lincoln & Shadel, 1999; Abraham,
Norman & Conner, 2000; West, 2005). However, a model test is not intended to be performed
within the presented study. The aim is rather to explore the relevant factors for predicting
intentions and behaviors in the water consumption context. These results are hopefully valuable
in deriving suitable interventions to promote or hinder the consumption of a certain water type.
Therefore, no explicit hypotheses are stated, which factors are of lower or higher importance in
predicting intention and behavior. The intentions and behaviors studied here are related to the
consumption of SODIS water, boiled water and untreated water. For boiled water, the situational
restriction is naturally not the availability of bottles, but the availability of combustibles. For
untreated water, beliefs about how much time and money it costs are irrelevant, because
consuming untreated water does not require any additional time or money and neither does it
cause any difficulty.

Behavioral models for using SODIS, boiling and consuming untreated water 68
Figure 12. A stage model to explain drinking water consumption.
Comparing determinants of SODIS, boiled and untreated water consumption
In the previous part, the behavior change process for the adoption of SODIS was outlined.
The following analyses, however, will not be restricted to determine predictors of the intention to
use SODIS and the SODIS use itself. Also, determinants of the intention and consumption of
boiled and untreated water will be analyzed using the same model factors. The main reason is,
as already mentioned, that the three water consumption behaviors are related to each other.
Thus, if it is possible to decrease the consumption of untreated water, the consumption of
treated water (boiled or SODIS) has to increase. Therefore, it is necessary to know all factors
involved in the overall water consumption behavior. Additionally, it is assumed that the
consumption of the different types of water is determined by different factors, which can have
relevance for planning interventions. For example, since SODIS is a new behavior and people
got newly convinced about SODIS, problem awareness and beliefs may have a greater impact,
while boiling and consuming untreated water are already established behaviors and may only
be determined by habit.
Since it was not possible to fit the data into a long-term model analysis (missing cases
between time points, too many predictors), only a snap shot from the last measurement will be
presented. It is tried to explain intention with predictors from the motivational phases, that is
problem awareness indicators and persuasion stage indicators. Additionally, the situational
factors may already have an influence in the decision phase (Ajzen, 1991). Behavior intensity is
not expected to be strongly directly influenced by indicators of the motivational phases, since
these exert their influence via the behavioral intention. One exception are the situational

Behavioral models for using SODIS, boiling and consuming untreated water 69
circumstances that can particularly in the case of barriers have direct influence on behavior.
Also, the belief about the difficulty of the behavior performance can influence behavior directly
(Ajzen, 1991; Schwarzer, 2008). Those two factors will be included into the behavioral model in
addition to behavioral intention and the factors from the uptake and habit stages.
METHODS
The explanatory influence of the indicators of the motivational stages on intention and the
influence of intention and the factors of the volitional stages on the three water consumption
behaviors, SODIS, boiled and untreated water, will be calculated using data from the last panel
of Study II. A detailed description of the study area, participants' characteristics as well as all
operationalizations can be found in the overall Methods part of this thesis.
RESULTS
The results part consists of three analyses: 1) a brief analysis on the inter-relations of the
three intentions and behaviors related to water consumption, 2) the explanation of the
behavioral intentions to consume SODIS treated, boiled or untreated water with three separate
linear regressions of factors from the motivational stages, and 3) the explanation of water
consumption of SODIS, boiled and untreated water with linear regressions of factors previously
described in the action phases on the percentages of SODIS treated water, boiled water and
untreated water. Into the intention models, only those cases were entered, who new about the
respective water type. Since everybody knew boiled and untreated water, this is only relevant
for the selection of households for the SODIS intention model. Similarly, into the water
consumption models only those entered, who consumed the respective water type. This was
relevant for the selection of cases for the SODIS behavior model and also for the untreated
water model, since some people stopped consuming untreated water.
Relations between behavioral intentions and behaviors SODIS, boiling and untreated water consumption
This part gives an overview of the inter-correlations of the three intentions to consume
SODIS, boiled and untreated water and the three corresponding behaviors using correlation
analyses. Additionally, the overall water consumption pattern is presented (percentages of
which type of water are consumed by the population; Figure 13).

Behavioral models for using SODIS, boiling and consuming untreated water 70
Figure 13. Water consumption pattern of untreated and boiled water, dependent on the amount of water that is treated with SODIS. Additionally, the percentages of total N are given of each category of SODIS use. NTOTAL=437. Study II, Panel 4.
0%
20%
40%
60%
80%
100%
x-axis = % of SODIS w ater of total w ater consumption
0%
5%
10%
15%
20%
25%
Untreated 65% 61% 47% 43% 31% 14% 6% 7% 1% 1% 0%
Boiled 35% 29% 33% 27% 27% 35% 34% 23% 19% 9% 0%
% N 17% 7% 10% 3% 3% 8% 12% 14% 21% 4% 1%
0% 10% 20% 30% 40% 50% 60% 70% 80% 90% 100%
% of total N
in the respective category of SO
DIS use (x-axis)
% o
f boi
led
and
untre
ated
wat
er o
f to
tal w
ater
con
sum
ptio
n
The intentions regarding the two treatment behaviors, to do SODIS and to boil water, are
only weakly correlated with each other (r=.15, p=.003, N=418). In contrast, their correlations
with the intention to consume untreated water are higher. The correlation of the intention to
consume untreated water with the intention to boil water is still rather low (r=-.29, p<.001,
N=436), whereas the correlation with the intention to use SODIS is of medium intensity (r=-.48,
p<.001, N=418).
When looking at the behavior intensities, the percentages of SODIS, boiled and untreated
water on the total water consumption, the picture is a bit different. Boiling behavior correlates at
a medium level with the two other behaviors (both r=-.30, p<.001, N=437). In contrast, a very
strong relation was found between untreated water and SODIS behavior (r=-.81, p<.001,
N=437). Note, that in this analysis also zero-amounts were included. That means, if someone
did not consume a certain water type, it was coded with zero. Thereby, the relations of the
amounts of consumed water could be analyzed in the entire sample.
Summarizing, it seems that the introduction of SODIS most strongly influenced untreated
water intention and consumption, and had a weaker impact on boiled water intention and
consumption. This perfectly meets the desired effect of SODIS promotion campaigns.
The above presented assumption is also supported by the graphs of the overall water
consumption pattern (Figure 13). The data points of the graphs of boiled and untreated water
consumption were calculated based on how much SODIS water a person consumes (x-axis,
10% steps). An additional graph gives the number of people in each category of % SODIS water
consumption. Analyzing the graph, it is clearly visible that with increasing SODIS water

Behavioral models for using SODIS, boiling and consuming untreated water 71
consumption, untreated water consumption decreases. When people treat around 60% of their
water with SODIS, almost no untreated water is consumed anymore. After that point, the
increased SODIS water consumption reduces the amount of water that is boiled. Boiled water
consumption is relatively stable for SODIS water consumption percentages of 0 to 60%. Looking
at the amount of people in each category of percentage SODIS water consumption, two peaks
are observable. Either people treat no or very little amounts of water with SODIS or 50% to 80%
with a clear maximum at 80%. It seems that 60 to 80% SODIS water, 20 to 30% boiled water
and around 5% untreated water is an optimum, which is preferred by almost 50% of the
interviewed sample.
Predictors of the behavioral intention
In this part, influences of factors from the areas of problem awareness and persuasion on
behavioral intentions to use SODIS, to boil water and to consume untreated water are
investigated. Problem awareness comprises the specific awareness of the diarrhea problem, the
awareness of clean water, the importance of health and the understanding of the causality
between contaminated water and diarrhea. Those four variables are identical for all three
behavioral intentions. Persuasion comprises the topics of knowledge about the target behavior,
specific cognitive beliefs, a general affective belief, attitude, social factors and situational
barriers. Specific knowledge was only included for the SODIS behavior, because for boiling it is
known that people have the knowledge on how to boil water and untreated water does not
require special knowledge. The specific beliefs about taste and health of the respective water
type were included for all three behaviors. The beliefs about monetary and time related costs do
only make sense for the two behaviors that can require money and time costs. For consuming
untreated water consequently these two beliefs were not measured. The same applies for
situational barriers: for untreated water an additional situational barrier like the bottles for
preparing SODIS and combustibles for boiling water, does not exist. Only for the SODIS
behavior the belief perceived difficulty was included. Of the social factors, the descriptive norm
was only included for SODIS water consumption, because, at least in the beginning of the study,
nearly every household consumed untreated and boiled water. Although this changed over time,
the measure was not included later on.
All predictors of intention from the problem awareness and persuasion stages were
entered as a first step into a linear regression analysis using a stepwise procedure. The reason
to do so was the rather high number of predictors and the explorative character of investigating
which factors actually contribute to explain the three different intentions. Moreover, risk of
diluting the main effects with entering too many predictors into the model was intended to be
reduced. The entry criterion for the predictors was set to a rather weak significance level
(pin=.10), so no information on marginal effects would be lost. Once entered, variables were not
removed anymore from the regression in order not to loose that information. Order of entry will

Behavioral models for using SODIS, boiling and consuming untreated water 72
be given with the results. The demographic variables entered afterwards as a second block in a
forward procedure into the regression. As already mentioned above, only households who knew
SODIS entered into the regression on the intention to use SODIS. The total amount of
interviewed households in the fourth panel of Study II was 438. Boiling water and consuming
untreated water was known to everybody, here the slightly lower number of Ns are caused by
missing values of one of the factors (list-wise deletion).
First, descriptive measures (means, standard deviations and correlations with the
dependent variable intention) of all variables of the regression models are presented in Table 5.
Correlations between the independent variables are not presented, but were calculated and
checked for problematically high correlations. The highest correlation found in the matrix of the
SODIS related variables was 0.75 between the belief about the taste and attitude, in the boiling
correlation matrix the highest correlation was 0.58 between the beliefs about money and time,
and in the untreated water correlation matrix the highest correlation was 0.84 between the belief
about the taste and the affect.
The dependent measure intention has the highest value for using SODIS (M=.65),
followed by the intention to boil water (M=.51). The lowest value shows the intention to consume
untreated water (M=.25). These values are highly significantly different from each other (p<.001).
The four indicators of the problem awareness stage are the identical measures for all
three behavioral intention models, therefore means and standard deviations are very similar
(only varying due to the slightly different sample sizes). The mean values in general indicate
quite a high level of problem awareness (M>.64). Correlations with the behavioral intentions are
only significant for the awareness of clean water (rSODIS=.22, rBoiled=.11, rUntreated=-.18) and the
awareness of the causality between contaminated water and diarrhea (rSODIS=.33, rBoiled=.13,
rUntreated=-.30), not for the problem awareness of diarrhea and the importance of health.
SODIS knowledge depth is at a satisfactory level (M=.67) and shows a medium
correlation with the intention to use SODIS (r=.44).
People belief that SODIS water is quite tasty and healthy (M=.62 and .70, respectively).
These two beliefs correlate with medium intensity with the intention to use SODIS (r=.46 and .41,
respectively). Boiled water is judged less tasty (M=.33), but almost equally healthy as SODIS
water (M=.66). Untreated water in contrast is judged slightly unhealthy (M=-.33) and only a little
tasty (M=.14). The correlations of those two beliefs with the intentions are all significant and
range from .21 to .68. The mean values of the beliefs about time and money regarding SODIS
use and boiling water as well as the belief about the difficulty of using SODIS are all nearly 0
(means from -.03 to -.15), which means that neither SODIS nor boiling are perceived as costly
regarding money and time, neither is SODIS perceived as very difficult. Correlations with
intention for SODIS are rather low (from .14 to .31) but significant, whereas for boiling
correlations are not significant.
The affect towards SODIS water as well as the attitude are positive and of about the
same level like intention (M=.64 and .69, respectively). Correlations with intention are of

Behavioral models for using SODIS, boiling and consuming untreated water 73
Table 5. Descriptive statistics of all factors of the motivational stages for SODIS, boiled water and untreated water. Means (M) and standard deviations (SD) as well as the Pearson correlation coefficients (r) of the intentions to consume SODIS, boiled and untreated water with all factors from the motivational phase of the behavior change process, and demographic variables are presented. Study II, Panel 4.
SODIS (N=404) a Boiled (N=429) Untreated (N=429)
Factor M SD r M SD r M SD r
Intention .65 .22 . .51 .22 . .25 .29 . Problem awareness diarrhea .75 .08 .00 .75 .08 -.04 .75 .08 .02 Awareness clean water .65 .17 .22 .64 .18 .11 .64 .17 -.18 Importance health .75 .08 .04 .75 .08 .07 .75 .08 -.02 Causality contaminated water - diarrhea .71 .23 .33 .70 .23 .13 .70 .23 -.30 Knowledge depth SODIS .74 .20 .45 ----- ----- ----- ----- ----- ----- Belief taste .62 .27 .46 .33 .48 .46 .14 .62 .68 Belief health .70 .17 .41 .66 .20 .21 -.33 .56 .55 Belief money -.03 .09 .21 -.13 .15 -.08 ----- ----- ----- Belief time -.09 .13 .14 -.15 .14 -.04 ----- ----- ----- Belief difficulty -.06 .13 .31 ----- ----- ----- ----- ----- ----- Affect .64 .20 .51 .54 .30 .31 .07 .63 .68 Attitude .69 .17 .42 .57 .32 .32 -.12 .64 .66 Injunctive norm .42 .35 .20 .38 .34 .24 -.02 .45 .51 Subjective norm .23 .19 .20 .25 .21 .32 .44 .32 .32 Descriptive norm 1.5 1.8 .21 ----- ----- ----- ----- ----- ----- Availability bottles / combustibles .55 .31 .09 .54 .30 -.10 ----- ----- ----- Age (years) 44 16 -.06 44 16 .03 44 16 .02 Education (years) 2.8 3.3 -.06 2.8 3.2 -.03 2.8 3.2 -.07 No. of persons per household 5.2 4.6 -.06 5.1 4.5 .03 5.2 4.5 -.01 No. of children <5y. per household 0.8 0.9 .06 0.7 0.9 .01 0.7 0.9 .00 Gender (0=m, 1=f) 0.72 0.45 .04 0.72 0.45 .02 0.72 0.45 .03
Note: Grey correlation coefficients are not significant at p<.1 level. ----- = not measured for the respective type of water. a Except: descriptive norm N=371, availability bottles N=386.
medium intensity (r=.51 and .42, respectively). For boiling, affect and attitude are a bit lower and
again at a very similar level like intention (M=.54 and .57, respectively) with a moderate
correlation with intention (r=.31 and .32, respectively). For untreated water, affect and attitude
are clearly lower with attitude even having a negative value (M=.07 and -.12, respectively).
Interestingly, correlations with the intention to consume untreated water are twice as high as for
boiling (r =.68 and .65, respectively).
The injunctive norm (i.e. the reputation of the respective water type) is positive, but rather
low for SODIS (M=.42) and boiling (M=.38), and neutral for untreated water (M=-.02).
Particularly for boiling, the low value of reputation is rather surprising, because boiling water is
necessary to have hot beverages and is practiced by virtually every household. Correlations to
intention are rather low for SODIS and boiling (r=.20 and .24, respectively), but of medium
intensity for untreated water (r=.51). The mean values of the subjective norms unveil some
interesting misjudgment, it seems that people are not able to correctly estimate the proportion of
people who use SODIS, boil water or consume untreated water. Especially for SODIS and
boiling the subjective norm is very distinct to reality. People estimate that only around 23%
(corresponds to M=.23) of all people use SODIS, but according to the data 83% did so. For
boiling the discrepancy is similar – according to the estimated subjective norm, 25% boil their

Behavioral models for using SODIS, boiling and consuming untreated water 74
water, in contrast to 96% who actually stated to boil water. For untreated water the estimated
subjective norm (44%) is not so different to reality (55%). Nevertheless, correlations of
subjective norm with intention were significant, but of lower intensity for SODIS (r=.20) and
boiling (r=.24) than for untreated water (r=.51). The 'reality measure' descriptive norm, which
was only asked for SODIS, shows that on average only 1.5 other households were observed
using SODIS. The correlation with the intention to use SODIS is the same as for subjective
norm (r=.21).
Bottles for SODIS and combustibles for boiling were judged as medium available (M=.55
and .54, respectively). These values did only marginally correlate with intention (r=.09 and -.10,
respectively).
Finally, none of the demographic variables correlated significantly with any of the three
intentions. For a description of the mean values of the sample see the overall Methods chapter.
Table 6 shows the results of the three linear regressions on the three different intentions.
As additional information, in Table 7 the explained variances of intention of different blocks of
variables are presented separately. The calculations presented in Table 7 were done to get a
better impression, which groups of factors explain bigger parts of the variance of the three
intentions.
In general, it has to be noted that the intentions to drink SODIS and boiled water could
not be explained very well (39% and 29%, respectively). The explained variance of the intention
to consume untreated water is much better with 57%. The factor blocks that contributed most for
all three intentions were the different beliefs as well as affect and attitude. Additionally, the
problem awareness factors and SODIS knowledge contributed to explain SODIS intention. To
explain the intention to boil and to consume untreated water, the social variables contributed too.
Comparing the three regression models, some commonalities are observable. First, the taste of
the water seems to be of importance for all three water types. For the intentions to consume
boiled and untreated water it even is the most important predictor with quite a strong influence
(β=.38 and .29, respectively). For the SODIS intention it is the third most important predictor
(β=.17). Another factor influencing all three behavioral intentions is affect. For SODIS intention,
affect is the strongest predictor (β=.30), for boiled and untreated water the effect is weaker
(β=.13 and .15, respectively). Another group of factors that is somehow consistent across the
three behaviors are the social factors. However, here for boiled and untreated water, the
subjective norm shows an influence on intention (β=.21 and .11, respectively), whereas for
SODIS the injunctive norm plays a role (β=.12). Slight differences between the three models
are found for the influence of factors from the problem awareness stage. SODIS and boiling
intention are both slightly positively influenced by the understanding of the causality between
contaminated water and diarrhea (β=.09 and .12, respectively). Oddly enough, the importance
of health shows a slight negative influence on SODIS intention (β=-.10). The intention to

Behavioral models for using SODIS, boiling and consuming untreated water 75
Table 6. Standardized betas of stepwise regressions of factors of the motivational stages on the behavioral intentions of using SODIS, boiling water and consuming untreated water. Study II, Panel 4.
Block Factor SODIS a Boiled Untreated
1 Problem awareness diarrhea Awareness clean water Importance health 5: -.10 * Causality contaminated water - diarrhea 6: .09 * 3: .12 **
2 Knowledge depth 2: .22 *** ----- ----- 3 Belief taste 3: .17 ** 1: .38 *** 1: .29 *** Belief health 3: .17 *** Belief money 4: .11 ** ----- Belief time ----- Belief difficulty ----- -----
4 Affect 1: .30 *** 4: .13 ** 5: .15 * Attitude 2: .23 *** 5 Injunctive norm 7: .12 ** Subjective norm 2: .21 *** 4: .11 ** Descriptive norm ----- -----
6 Availability bottles / combustibles 8: .07 (*) ----- 7 Age (years) Education (years) -.07 (*) -.07 (*) No. of persons per household No. of children <5y. per household Gender (0=m, 1=f)
Tolerance 3 all >0.62 all >0.85 all >0.28 VIF all <1.61 all <1.17 all <3.56 R² 0.408 0.299 0.574 Adj. R² 0.394 0.291 0.569 N 404 a 429 429
Note: Presented are the standardized betas of the final model of a stepwise linear regression (Blocks 1 to 6) on intention. Input threshold was p=.1, no out threshold was set (that means, once a factor had passed the threshold, it stayed in the calculation, independently whether it became insignificant later on or not). The demographic block 7 entered after the other blocks in a forward procedure. The number preceding each standardized beta refers to the step the factor became included into the model. Each column represents one regression. Significance levels of standardized betas: *** p<.001, ** p<.01, * p<.05, (*) p<.1. Empty cells indicate that the respective factor in the respective regression has not met the .1 threshold to enter the model. ----- = no data is available for that factor at that certain time point. a Except: descriptive norm N=371, availability bottles N=386. All missing values were replaced with mean values for the regressions.
Table 7. R squares of separate regressions of the different blocks of factors on the behavioral intentions of using SODIS, boiling water and consuming untreated water. Study II, Panel 4.
Block SODIS Boiled Untreated
Block 1 .114 *** .026 * .092 *** Block 2 .198 *** ----- ----- Block 3 .281 *** .230 *** .519 *** Block 4 .280 *** .128 *** .510 *** Block 5 .076 *** .117 *** .320 *** Block 6 .008 (*) .009 * ----- Block 7 .022 ns .003 ns .005 ns
Note: Block 1 – Problem awareness diarrhea, awareness clean water, importance health, causality contaminated water - diarrhea. Block 2 -– SODIS knowledge depth. Block 3 – Beliefs taste, health, money, time and difficulty. Block 4 – Affect, attitude. Block 5 – Injunctive, subjective and descriptive norm. Block 6 – Availability of bottles (SODIS) and combustibles (boiling). Block 7 – demographic variables. Presented are the R squares of each block on intention, being tested with a separate regression. All factors of a block entered simultaneously into the regression. Significance level is given: *** p<.001, ** p<.01, * p<.05, (*) p<.1. However, it is not adjusted to the number of regressions calculated and may therefore be interpreted with caution. ----- = no data is available for that factor at that certain time point.
3 Tolerance and VIF are indicators of the collinearity statistics of a linear regression. Tolerance values should not fall below 0.2 (Menard, 1995) and VIF, which is its reciprocal, consequently not above 5. Other authors even state a value not greater than 10 as acceptable for a VIF and consequently for tolerance values greater 0.1 are acceptable (Myers, 1990).

Behavioral models for using SODIS, boiling and consuming untreated water 76
consume untreated water was not influenced by problem awareness related factors. Further
influences among the beliefs were found for the belief about the costliness of SODIS on SODIS
intention (β=.11) and for the belief about the healthiness of untreated water on the intention to
consume untreated water (β=.17). Moreover, the intention to consume untreated water is
influenced quite strongly by the attitude towards untreated water (β=.23). Another important
predictor of the SODIS intention is how well the person knows about preparing SODIS
(knowledge depth; β=.22). Furthermore, a very slight influence was found for the factor bottle
availability (β=.07). Among the demographic variables, only education shows a tendency to
negatively influence SODIS and boiled water intention.
Predictors of behavior
The second part of the analyses investigates the behavioral models for SODIS, boiled
and untreated water consumption. The factors predicting behavior intensity are taken from the
later stages of the behavior change process, uptake and habit. The uptake phase is
represented by the past behavior intensity of each behavior and the habit phase by the
perceived habit. Additionally, the situational barriers and the perceived difficulty are assumed to
have an influence (real and perceived behavioral control; see Ajzen, 1991) as well as the
intention as the repository for the indicators of the previous phases (Ajzen, 1991). These
predictors were, like for the intention models, entered first into the regression using the same
stepwise procedure (pin=.10, no pout). Order of entry will be given with the results. The
demographic variables entered the regressions as a second block in a forward procedure. Only
households who consumed the respective water type were included into each analysis, resulting
in different Ns for each of the three behavioral models. The Ns were additionally reduced by
approximately 40 households due to the inclusion of past behavior.
First, descriptive measures of all independent and dependent variables are presented in
Table 8 (means, standard deviations and correlations with the dependent variable behavior).
Correlations between the independent variables are not presented, but were calculated and
checked for problematically high correlations. The highest correlations found in all three
correlation matrices, of the SODIS, boiling and untreated related variables was found between
the intention and perceived habit. For SODIS, the correlation was 0.51, in the boiling correlation
matrix 0.61, and for untreated water 0.59.
The dependent measure intensity of consumed water shows that the highest part of
consumption is water treated with SODIS (M=.58), followed by untreated (M=.47) and boiled
water (M=.28). These values cannot be compared directly, because the sample is partly a
different one for each water consumption behavior due to the exclusion of households who do
not consume a certain type of water from the respective regression.

Behavioral models for using SODIS, boiling and consuming untreated water 77
Table 8. Descriptive statistics of all factors of the action stages for SODIS, boiled water and untreated water. Means (M) and standard deviations (SD) as well as the Pearson correlation coefficients (r) with the percentage of consumed water treated with SODIS, boiling or consumed untreated water of all factors from the action stages of the behavior change process and the demographic variables are presented. Study II, Panel 4.
SODIS (N=307) Boiled (N=370) Untreated (N=202)
Factor M SD r M SD r M SD r
Behavior .58 .24 . .28 .18 . .47 .28 . Belief difficulty -.05 .11 .35 ----- ----- ----- ----- ----- ----- Availability bottles / combustibles .57 .30 .26 .55 .30 .06 ----- ----- ----- Intention .70 .17 .55 .52 .21 .54 .42 .25 .61 Past behavior .38 .36 .05 .34 .27 .23 .52 .33 .21 Perceived habit .63 .21 .66 .47 .24 .54 .54 .23 .71 Age (years) 44 16 -.17 44 16 .23 45 17 .01 Education (years) 2.9 3.3 .03 2.8 3.3 -.05 2.8 3.0 -.06 No. of persons per household 5.2 4.1 -.11 5.2 4.8 .02 5.1 4.7 .06 No. of children <5y. p. household 0.8 0.9 .05 0.7 0.9 -.12 0.7 0.9 -.02 Gender (0=m, 1=f) 0.71 0.45 .02 0.7 0.5 .02 0.70 0.46 .09
Note: Grey correlation coefficients are not significant at p<.1 level. ----- = not measured for the respective type of water.
As for the entire sample knowing SODIS, also for the subsample that uses SODIS, the
SODIS behavior is not perceived as difficult (M=-.05). Nevertheless, a substantial correlation
with SODIS behavior exists (r=.35). Similarly, judgments on the availability of bottles and
combustibles by SODIS users and boiling subsamples are the same as for the entire sample.
Bottles are more or less available (M=.57) as well as combustibles (M=.55). A correlation with
the behavior only exists between bottle availability and SODIS behavior (r=.26).
Past water consumption of SODIS and boiled water is quite similar at about the current
level of boiled water (M=.38 and .34, respectively). This indicates a strong increase in
consumed SODIS water and a slight decrease of boiled water. Past consumption of untreated
water also decreased slightly from a mean value of 0.52. Correlations with current behavior are
low for boiled and untreated water (r=.23 and .21, respectively), and even insignificant for
SODIS water (r =.05).
The perceived habit is of medium intensity with SODIS habit having the highest value and
habit to boil water the lowest (MSODIS=.63, MBoiled=.47, MUntreated=.54). Correlations with behavior
are quite high (rSODIS=.66, rBoiled=.54, rUntreated=.71).
In contrast to the intention models, the demographic variables show some significant
correlations to the water consumption behaviors. Age is negatively related to SODIS water
consumption (r=-.17) and positively to boiled water consumption (r=.23). Moreover, the total
number of persons per household shows a slight negative correlation with SODIS water
consumption (r=-.11) and number of children below five years of age to boiled water
consumption (r=-.12).
Table 9 shows the results of the three linear regressions on the three different behaviors.
In Table 10 the explained variances of each factor on each behavior is examined separately.

Behavioral models for using SODIS, boiling and consuming untreated water 78
Table 9. Standardized betas of stepwise regressions on the behavioral indicators percentages of consumed water treated with SODIS, consumed boiled water and consumed untreated water. Study II, Panel 4.
Block Factor SODIS Boiled Untreated
1 Belief difficulty ----- ----- Availability bottles / combustibles 3: .10 * 3: .14 ** -----
2 Intention 2: .28 *** 1: .37 *** 2: .29 *** 3 Past behavior 4: .09 * 3: .14 ** 4 Perceived habit 1: .50 *** 2: .30 *** 1: .52 *** 5 Age (years) -.20 *** .18 *** Education (years) No. of persons p. HH No. of children <5y. p. HH Gender (0=m, 1=f) -.07 (*)
Tolerance all >0.71 all >0.61 all >0.64 VIF all <1.42 all <1.63 all <1.56
R² 0.542 0.429 0.578 Adj. R² 0.534 0.421 0.572 N 307 370 202
Note: Presented are the standardized betas of the final model of a stepwise linear regression (Blocks 1 to 4) on the behavioral indicator. Input threshold was p=.1, no out threshold was set (that means, once a factor had passed the threshold, it stayed in the calculation, independently whether it became insignificant later on or not). The demographic block entered after the other blocks in a forward procedure. The number preceding each standardized beta refers to the step the factor became included into the model. Each column represents one regression. Significance levels of standardized betas: *** p<.001, ** p<.01, * p<.05, (*) p<.1. Empty cells indicate that the respective factor in the respective regression has not met the .1 threshold to enter the model. ----- = no data is available for that factor at that certain time point.
Table 10. R squares of separate regressions of the different blocks of factors on the behavioral indicators percentages of consumed water treated with SODIS, consumed boiled water and consumed untreated water. Study II, Panel 4.
Block SODIS Boiled Untreated
Block 1 .157 *** .004 ns ----- Block 2 .301 *** .294 *** .370 *** Block 3 .002 ns .052 *** .046 ** Block 4 .433 *** .290 *** .506 *** Block 5 .051 ** .065 *** .016 ns
Note: Block 1 – Difficulty, availability of bottles (SODIS) and combustibles (boiling). Block 2 – Intention. Block 3 – Past behavior. Block 4 – Perceived habit. Block 5 – demographic variables. Presented are the R squares of each block on the behavioral indicator, being tested with a separate regression. All factors of a block entered simultaneously into the regression. Significance level is given: *** p<.001, ** p<.01, * p<.05, (*) p<.1. However, it is not adjusted to the number of regressions calculated and may therefore be interpreted with caution. ----- = no data is available for that factor at that certain time point.
In general, explained variance for the SODIS and boiling behavior models is better than it
was for the corresponding intention models (53% and 42%, respectively). For untreated water a
very similar portion of the variance of the behavior as for the intention could be explained (57%).
The factors that contributed most to all three behaviors were intention and perceived habit.
Additionally, for SODIS the perceived barriers were of importance. No or little contribution was
made by past behavior and by the demographic variable block.
The explained variances are directly reflected by the calculated regression coefficients.
Intention and perceived habit have the strongest influence on all three behaviors. For SODIS
and untreated water consumption, perceived habit is the strongest predictor (β=.50 and .52,

Behavioral models for using SODIS, boiling and consuming untreated water 79
respectively), whereas for boiled water consumption intention is the strongest predictor (β=.37).
The situational barriers, bottles for SODIS and combustibles for boiling water, show a slight
influence on both behaviors. The more bottles or combustibles are available, the more water is
treated with SODIS or boiled, respectively (β=.10 and .14, respectively). The perceived difficulty
did not show any influence on SODIS behavior. As expected, past behavior did not show a big
influence on current behavior. For SODIS behavior, no relation was found (as there was already
no correlation). This is not very surprising, because SODIS behavior was targeted to be
changed with the interventions and not based on past behavior intensity. For boiled water as
well as for untreated water a weak influence was found (β=.09 and .14, respectively), which
reflects that boiled and untreated water consumption were not as strongly changed by the
interventions and still a relation to past behavior existed. An interesting and rather unexpected
influence was found for age on SODIS and boiled water consumption. On SODIS behavior, a
negative influence was found (β=-.20), which means that younger people disinfect more water
with SODIS. Contrarily, on boiling a positive influence of age was found (β=.18), which indicates
that older people prefer boiling a larger proportion of their water.
DISCUSSION
The structure of the discussion will follow the structure of the results, so at first, influences
on behavioral intentions are discussed, and secondly influences on water consumption behavior
in view of implications for future interventions. Finally, the findings will be integrated into the
behavior change model.
The intention models
Although quite many factors got included into the models predicting the three different
behavioral intentions, two common factors that influence all three intentions could be found: the
belief about the taste of the water and the affect towards its consumption. It can be generalized
that these two factors always play a role when people form their intentions about which water
they intend to consume in the future. In contrast, the other more rational beliefs about monetary
and time costs, healthiness and difficulty as well as the preceding problem awareness have a
much lower influence spectrum.
Only for untreated water a relation between the health belief and the intention exists. This
is a rather interesting finding, because campaigns often emphasize how healthy SODIS and
boiled water is, instead of stressing how unhealthy untreated water is. Complementing this
interesting relationship, the understanding of the causality between contaminated water and the
occurrence of diarrhea only positively influences the intentions of SODIS and boiling, but not
negatively the intention to drink untreated water (as one could easily have expected).

Behavioral models for using SODIS, boiling and consuming untreated water 80
Consequently, during campaigns both aspects have to be addressed, because they cover
distinct information (correlations are only between .26 and .39) and influence different intentions.
Another slightly important belief is the one about the monetary costs of SODIS. This
seems natural, because the costs of a new behavior first have to be assessed. Then the
behavior is more likely to be preferred if it is evaluated as being of low costs. Interestingly, for
the intention to boil the costs – although rated slightly higher than those of preparing SODIS –
do not play a role. Probably boiling is viewed as a necessary behavior (to have hot beverages),
and therefore performed independently of its costs.
The beliefs about difficulty and time costs are not of importance for building the intention
to use SODIS or boil water. Also not crucial for the forming of the behavioral intentions are the
resources needed to perform the behavior (bottles for SODIS and combustibles for boiling). It
seems that at this stage, resource availability is not yet considered.
As already mentioned, only the belief about the taste and the affect are universal
predictors of all three behavioral intentions. Moreover, for SODIS intention the affect and for the
other two intentions the belief about the taste is also the most important predictor. This finding is
consistent with the one of Heri and Mosler (2008), who found affect being the most important
predictor of SODIS intention. The consistent influence of affect and taste belief also has some
implications for promotion campaigns. These two factors should be targeted most during
campaigns promoting SODIS (and boiling) and discouraging people to consume untreated
water. However, the factors often stressed as being of decisional importance for the people are
the ones that did not show such universal influences. Campaigns usually aim at creating
problem awareness and convincing people with arguments about the healthiness, easiness and
non-costliness of the SODIS method. It is not said that this should not be done, but taking into
account the quite positive mean levels of these factors, it seems that it is quite easily achieved
that people have good general problem awareness and a positive set of beliefs about SODIS
and also boiling. Consequently, the implication would be to specifically target the belief about
the taste of all water types and the affective connotation towards each water type, because
these are the main driving factors of the behavioral intentions. The mean values of both
indicators for untreated water allow for further interventions changing the currently neutral
evaluation of taste and affect of untreated water into negative ones. Interestingly, the taste of
untreated water and the affect towards consuming it are very closely related (r=.84). In contrast,
the taste and affect of SODIS are already quite positively evaluated and would not pose such a
potential for improvement. Moreover, it seems easier to relate the consumption of untreated
water to the feeling of unpleasantness, indicating its unsecure origin or the possibility of fecal
contamination by humans and animals, for example. Here the relationship between the
intentions should be used, because a lower intention towards untreated water correlates with a
higher intention to consume SODIS water. For boiled water, not much intervention potential is
seen to improve the belief about its taste, because boiled water in reality does not taste very
well. On top of it, taste is by far the strongest predictor for boiling intention.

Behavioral models for using SODIS, boiling and consuming untreated water 81
In addition, as one would expect, the knowledge level of the new behavior SODIS is
important for a positive intention to use it in the future. Consequently, a thorough and constant
provision with action knowledge on how to prepare SODIS must be guaranteed, until people
have understood and internalized the entire process.
Furthermore, it is interesting to note that for the 'old' behaviors, boiling and consuming
untreated water, the perceived subjective norm is important, whereas for the new behavior
SODIS the reputation (injunctive norm) influences the intention. This, although the injunctive
and subjective norms for all three behaviors are pretty low, and the subjective norms do not
reflect real percentages of users among the population, particularly for SODIS use and boiling. It
can only be suspected that for the old behaviors reputation does not matter anymore, but one
gets influenced by what others seem to do. In contrast, the new behavior SODIS first has to get
established and people are more influenced by what they think that others think about it. The
reason why these two norms are rated so low may as well be based in a misunderstanding of
the items. This issue should be investigated further and in case of really low reputation of
SODIS (and boiling), interventions increasing this factor should be thought of (e.g. famous role
models).
The behavioral models
Comparing the three behavioral models, as expected the intention and the perceived
habit are strong predictors of behavior intensity. The stronger the intention to use SODIS, boil
water or consume untreated water and the stronger the person perceives her/his own habit
towards each of these three behaviors, the more water of the respective water type is
consumed. For SODIS and untreated water consumption, perceived habit is the stronger
predictor, whereas for boiled water consumption it is the intention. This implies that during
campaigns, habit development and regularity of the water consumption should be stressed to
increase people's perceived habits. Since lowering the perceived habit of untreated water
consumption may be difficult, focus should be laid on increasing the perceived habit of SODIS
and boiled water consumption. The intentions should be influenced via the important predictors
from the intentional models (see above).
Additional, but much weaker influence on behavior is exerted by the available resources
for preparing SODIS and for boiling water (bottles and combustibles). The more easily these
resources are available, the more water is treated with SODIS or is boiled. Structural
interventions would be helpful to have these resources at hand when people have formed a
positive intention and are ready to act. Another way to make those resources available would be
to point out ways and means for people to organize bottles or combustibles themselves.
However, still 50% of the people claimed at the end of the study that one or more bottles were
missing, which reduces the possible amount of water that can be treated with SODIS.
Unfortunately, the situation about bottle availability was not explicitly investigated. The

Behavioral models for using SODIS, boiling and consuming untreated water 82
perceived difficulty of SODIS does not have an influence on the behavior, and in general,
SODIS is not perceived as being very difficult.
As expected, past behavior does not predict current behavior for SODIS and only shows
weak influence on boiled and untreated water consumption. The long time-span between the
measurements (4 months) and the interventions that were targeted to influence the water
consumption behaviors and uncouple it from past practices are likely to have caused these
weak relationships. An additional, quite interesting relationship between age and the behaviors
was found. Apparently, younger people disinfect more water with SODIS and older people boil
more water. For untreated water consumption, no relationship was found. An explanation could
be that younger people are more open to an innovation than older people who have already
lived a longer time with their habits and stay with what they know. This circumstance could
possibly be used during promotion campaigns, with first targeting younger people.
Overall, boiled water consumption could be partly explained (42% of the variance), as
well as SODIS and untreated water consumption (53% and 57% of the variance) with the
suggested factors. Other factors probably have to be considered in addition to those presented.
Integration of the intention and the behavioral models into a stage model
In the following, the stage model of Figure 12 is presented again in Figure 14 now
highlighting the found predictors of the intentions towards SODIS use, boiling and consumption
of untreated water (motivational phase) as well as the found predictors of the three
corresponding behaviors (volitional phase).
The highlighting of influence factors in the model shows that factors from all topics of the
behavior change process are involved in predicting the intentions and behaviors. The intentions
were only weakly influenced by one factor from the problem awareness phase and strongly by
factors from the persuasion phase. The behaviors were influenced by all hypothesized factors
from the uptake and habit phase.
For SODIS intention, this is consistent with what was expected. Problem awareness was
assumed to have existed already before the study. Instead, the persuasion stage factors played
the dominant motivational role. As long as the behavior is not yet completely habitual, all the
cognitive processes are active and cognitive beliefs, affects, action knowledge and social
evaluation processes that in turn form the intention are easily accessible. Later on, it would be
expected that those factors are not salient anymore. The two known studies containing
comparable analyses of SODIS intention (Altherr et al., 2008; Heri & Mosler, 2008) show some
similarities, but also differences. The one study that had some indicators of problem awareness,
as well as knowledge included in their model (Altherr et al., 2008) confirms the low influence of
problem awareness, but in contrast to the present study, knowledge did not show an influence
on intention either. Both studies confirm the importance of affect: Heri and Mosler (2008) used

Behavioral models for using SODIS, boiling and consuming untreated water 83
Figure 14. Predictors of intention and behavior SODIS water (green), boiled water (blue) and untreated water (orange). Study II, Panel 4.
Note: Smallest type size = indicators that never have shown an influence, medium type size = indicators that have shown low influence, large type size = indicators that have shown medium influence, very large type size = indicators that have shown a strong influence. Green background = influence on SODIS, blue background = influence on boiling, orange background = influence on untreated water. Grey type color = not included in the models calculated in the present chapter.
an explicit affect measure and Altherr et al. (2008) with a quite affectively connotated attitude
measure. Also, the importance of cognitive beliefs about taste and money on SODIS intention,
as well as the injunctive norm influence gets support by one of the studies (Heri & Mosler, 2008).
For the intentions to boil and consume untreated water, it is interesting to see that they
are also explained by factors from the motivational phase, which was not expected with such
strength. Apparently, due to the process of changing drinking water habits with the introduction
of SODIS as a new alternative, also for the old behaviors, beliefs were activated and changed.
A complete analysis of the entire change process (i.e. analyzing all points of measurement)
would be interesting, but would go beyond the scope of this chapter. At this point it shall only be
referred to the descriptive statistics already presented in the overall Methods chapter. There it
can be seen that those variables predicting the extent of intention towards boiling and untreated
water consumption indeed have been changed during the course of the study into the desired
directions (more positive evaluation of boiling and more negative evaluation of untreated water).
This is particularly true for untreated water, where more drastic changes were observed.
Additionally, the intentions towards untreated and SODIS water are related much stronger to
each other than the intentions towards boiled and SODIS water.
Presumably, this is also the reason why the untreated water intention could be explained
much better than the boiled water intention, where 70% of the variance was not explained with
the factors of the motivational phase. Probably, boiling intention predicting motivations were not

Behavioral models for using SODIS, boiling and consuming untreated water 84
accessible with the applied measures. Also, the intention to use SODIS could be explained
better than the intention for boiling. Somehow, the model factors from the motivational phase
are not sufficient for explaining the intention of boiling behavior. Other factors, addressing the
necessity component related to boiling water may serve better in explaining its intention.
A similar relation of explained variances and consequently predictive power of the model
is found for the three behaviors: the boiling behavior model had the lowest value in explained
variance (42%), the other two had equally higher explained variances (53% and 57%). Again,
SODIS and untreated water consumption are related much stronger to each other than to boiled
water consumption. Overall, the factors of the volitional phase of the stage model explain
behavior quite well and their strengths of influences indicate that perceived habit and intention
are crucial factors. The need for consideration and operationalization of a separate habit phase
is therefore confirmed and should be tested further in the context of water consumption behavior.
One important addition in this context should be to determine what makes people perceiving a
certain habit strength or not, because perceiving a habit is not directly addressable with
interventions. More insight into this important construct can probably facilitate the development
of more effective ways to support habit formation. Additionally, it should be thought of indicators
that describe the uptake process. In the presented model, only past behavior was included, but
as already discussed above, this logically does not explain future behavior when behavior
change campaigns are taking place and the time difference between measurements is large.
Here maybe the inclusion of planning processes that have occurred during uptake could help to
bridge the gap (Schwarzer, 2008).
Finally, the low explained variance of boiling behavior indicates that the model factors do
not provide such explanatory power for boiling behavior. Like already mentioned for the
intention towards boiling, other relevant factors addressing the necessity aspect of boiling
should be investigated.
One additional factor not included in the current model but suggested by several authors
is the concept of self-efficacy (Bandura, 1982; Schwarzer, 1992, 2008). Self-efficacy is said to
have influence on intention and behavior (Schwarzer, 2001). On the other hand, the concept of
self-efficacy, dealing largely with the difficulty to perform a behavior, is already incorporated in
the concept of perceived behavioral control (Ajzen, 2002b). The parallel between self-efficacy
and perceived behavioral control concerning their effect on intention, as well as on behavior,
support Ajzen's view. However, perceived difficulty and 'real' difficulty, which together form the
amount of perceived behavioral control were measured and included and did not show very
strong impacts. One other factor one could think of is the perceived compatibility with existing
habits (Heri & Mosler, 2008). However, such a factor would only apply for a new behavior,
because old behaviors can be assumed to fit with existing habits.

Behavioral models for using SODIS, boiling and consuming untreated water 85
CONCLUSION & LIMITATIONS
Summarizing, the factors derived from the stage model could explain a good part of the
water consumption related intentions and behaviors. The behavior could be better explained
than the intentions. Especially for boiling, additional factors not yet included in the model have
to be thought of. Explained variances for the boiling intention is rather unsatisfactory, for the
behavior it is acceptable.
The negative correlations that were found between SODIS and untreated water intentions,
as well as between the two behavior intensities, suggest that promotion campaigns addressing
the increased use of SODIS and the decreased consumption of untreated water at the same
time, pose a higher potential for success. Additionally, the factors found influencing intentions
provide insight into which particular beliefs must be addressed to influence which intention. The
belief about the taste of the water and the affect were interestingly found to be strong and water
type independent predictors of intention. Having a positive intention then, in turn, influences
behavior, together with perceived habit. Here, more research is needed to untangle the
predictors of perceived habit. Moreover, it is assumed that circumstances that were present
during the uptake phase could possibly also play a role. However, they have to be investigated
and operationalized with following research.
A clear limitation of the presented analyses is that it is only a one point snap shot of the
behavior change process. No real process analysis was carried out, which would have required
the inclusion of the previous time points. It is therefore highly suggested to gather larger
samples of longitudinal data with shorter time intervals to have a better database for analyzing
the process character of behavior change. A larger sample and shorter time intervals of
measurements would provide the possibility of placing groups of individuals along the stages of
the process and analyze their progress separately. This would not have been possible with the
available data, because for analyzing separate groups, the longitudinal sample size was too
small, and the measurements were too far apart from each other to analyze over time
causalities. Additionally, it has to be tested if the same relations exist in different circumstances,
for example more urban settings (as that of Study I).


Chapter 2
Why do people stop using SODIS?
CONTENTS
Abstract.............................................................................................88 Introduction ......................................................................................89 The habit stage of the behavior change process .......................90 Different types of ‘continuers’ and ‘relapsers’ ............................92 Typing with intention and cognition intensity........................93 Methods ............................................................................................94 Results..............................................................................................95 Identification of relapser types and continuer types ...................95 Characterization of relapsers, continuers and their subtypes ...............................................................................96 Change over time of relapsers, continuers and their subtypes ...............................................................................99 Discussion ......................................................................................103 Relapser or continuer? .............................................................103 Low or high relapser, low or high continuer? ...........................105 The relapser types..............................................................105 The continuer types............................................................108 Conclusion & Limitations ................................................................110

Why do people stop using SODIS? 88
ABSTRACT
In this chapter households having stopped using SODIS after a long inactive period of
time, named relapsers, are compared with households which have continued with SODIS use
after the same long inactive period of time, named continuers. Relapsers and continuers are not
only investigated as such, but as it had been already tried by Fuchs (1997), different subtypes
were hypothesized. Those subtypes were assumed to differ mainly in their intention to use
SODIS and the degree of cognition intensity (cognitive presence of the topic SODIS). Further, it
was investigated how relapsers, continuers and their subtypes can be characterized using a
range of factors from the stages of the behavior change process. It was assumed that
differences would occur mainly among the factors of the action stages.
For analyzing relapsers and continuers, data from measurement time point 3 and 4 of
Study I were used. Cluster analyses were employed for finding relapser and continuer subtypes,
and variance analyses for comparing them afterwards regarding the different factors.
In the comparison of overall relapsers and users it was shown that for all factors of the
behavior change process relapsers had lower values than users. The difference pattern of these
factors shows that the further the behavior change process advances the greater are the
differences between relapsers and users, and the lower is the level of the variables for relapsers.
It can be reasoned that the causality for people being relapsers lays mainly in the missing habit,
which they obviously did not manage to maintain in contrast to those who stayed users.
Similar to Fuchs typology (1997), two relapser and two user subtypes could be identified.
A low and a high relapser as well as a low and a high user were found. The classification ‘low’
and ‘high’ relates directly to the mean level of the factors of the behavior change process. Low
relapsers stopped using SODIS early compared to high relapsers, and therewith show a similar
behavior like Fuchs’ relapser types. In addition, low relapsers show quite a range of differences
to high relapsers in psychological factors. Not only were variables used for identifying the
subtypes, intention and cognition intensity, different as hypothesized, but also one central belief
(taste), the affective connotation, injunctive norm, and dissonance. High relapsers interestingly
have values almost as high as low users, only differing in the degree of habit. Under the
assumption of an underlying threshold of habit being critical for behavior performance, it is
argued that low users are at risk of becoming high relapsers if no measures are taken. Only
high users seem to be stable and did not show a decrease in critical habit variables between the
two measurement time points. However, also high users do not yet perform SODIS
automatically, because their cognition intensity is still very high, and forgetting still occurs.
In the further discussion, the different subtypes are placed along the behavior change
process and possible interventions for each type are highlighted.
Keywords: relapse, continuance, solar water disinfection, intervention

Why do people stop using SODIS? 89
INTRODUCTION 4
Preface. The idea for the following analysis was inspired by the situation we found in the
fourth panel of Study I, when we went back to Bolivia for the long term evaluation. The situation
it is referred to is the almost equal numbers of people still using SODIS and having stopped
SODIS use. This kind of distribution gave the statistical opportunity and raised curiosity to closer
analyze the differences between those who continued using SODIS and those who stopped it.
The ones who continued with SODIS are labeled 'continuers' and those who stopped are named
'relapsers'.
In the previous chapter, the predictors of the behavioral intention and behavior intensity
were analyzed to describe the behavior change process until the point where a habit starts to
develop. However, it was not analyzed what happens when a habit does not develop and
people finally stop the behavior. Experiences from health psychology have shown that it is not a
given fact that someone, who knows about the obvious advantages of a certain preventive
behavior and has even already tried out this behavior, actually continues doing so forever (e.g.
Fuchs et al., 2005). Often, it is not a conscious decision against a certain behavior, it is rather
guided by partly unconscious factors (Scheirer, 1990). Everyday behaviors like water
consumption in contrast to more complex (health) behaviors like alcohol abstinence pose even
more potential to be widely unconscious.
Since some decades, the topic of health behavior change is the focus of many
researchers. At the same time, these researchers started to wonder why people dropped out of
their health prevention programs or resumed with a health risky behavior. Drop out rates for
example for exercise and sport programs can be as high as 60% (Fuchs, 1997; Pahmeier,
1994). As a consequence, stage models for explaining (health) behavior change were inspired
or developed (e.g. the transtheoretical model [Prochaska & DiClemente, 1982, 1983]; the health
action process approach [Schwarzer, 2008]) as it was already laid out in the previous chapter.
These stage models about health behavior change aimed at closing the intention-behavior gap
with the inclusion of not only motivational processes, but also the action phase. Moreover, some
of these stage models explicitly include maintenance of a behavior as a separate stage,
acknowledging that performing a behavior does not necessarily mean life-long continued
performance of the same.
The behavior change process regarding SODIS has already been described in detail in
chapter 1. Therefore, the present chapter only focuses on the habit phase and described more
4 This chapter is in preparation for publication: Tamas & Mosler (paper in preparation). Why do people stop treating their contaminated drinking water with solar water disinfection (SODIS)?; based on: Fugazza, A. S. (2009). Warum wird die Anwendung von SODIS wieder abgebrochen? Am Beispiel SODIS in Bolivien [Why do people stop using SODIS? The example of SODIS in Bolivia]. Unpublished Lizentiatsarbeit.

Why do people stop using SODIS? 90
in detail (which was not done in the previous chapter). However, also factors from the earlier
stages will be used to investigate differences between continuers and relapsers.
Additionally, Fuchs (1997) has presented a typology of people who continue with a
behavior and those who relapse, which will be laid out as well. The analyses of this chapter will
focus on finding different types among SODIS relapsers and continuers, and then describe them
using the different variables from the behavior change process.
The habit stage of the behavior change process
Being in the habit stage, it is said that the individual performs the behavior, i.e. SODIS,
with a certain continuity and despite of hindering situational factors. Then after some time a new
habit will develop. But what factors it depends on and how long it takes exactly until a new habit
has developed is not answered clearly by today’s behavior change research (Tobias, 2007, p.
109). This problem will be discussed more in detail in the following part.
As just mentioned, factors and time frame of habit development are not defined clearly by
existing research. However, different assumptions exist, and first it will be reflected about time
frames.
Pavlov stated 1927 that in the context of classical conditioning – which can also be
viewed as a type of behavior change – after 6 stimuli without reinforcement the relation between
stimulus and reflex is deleted (Pavlov, 1927). In the context of reinforcement learning it was
stated that after approximately 14 days an optimum is reached (Tolman & Honzik, 1930, p. 267).
Others rely more on the frequency of the behavior execution than on time frames. However, the
range is quite wide. From 12 to 15 behavior executions without a given time frame (Breckler &
Wiggins, 1989), via at least 10 repetitions and a frequency over time of at least twice a month
(Ronis, Yates & Kirscht, 1989) to daily or at least weekly performance in stable circumstances
(Ouellette & Wood, 1998). According to these researchers, a SODIS habit would be established
after one month, because SODIS is a behavior that has to be performed every 1 or 2 days.
In contrast to those very specific statements on what it needs to develop a habit, Rogers
assumes that like the period of time that is needed for a person to take over an innovation, also
the period of time that is needed to develop a habitual behavior depends on the innovation and
the person itself (E. M. Rogers, 2003, p. 191). One aspect rarely mentioned is that uptake of a
behavior and maintenance of that behavior may possibly be completely different processes
(Rothman, 2000). Rothman refers to the fact that many individuals frequently manage to start
new behaviors, but periodically fail to maintain them. This is taken as a hint that there must be
different mechanisms behind these two processes. Moreover, the habit component that has
been added to the theory of planned behavior, although conceptualized only as the past
behavior intensity, is able to predict behavior continuance somehow better than intention and

Why do people stop using SODIS? 91
perceived behavioral control alone (Ronis et al., 1989; Bamberg et al., 2003; Ouellette & Wood,
1998). So maybe, the time frame depends on the innovation or even on the individual.
If the behavior is not already during the uptake phase prevented from being performed in
the future due to negative evaluations of motivational factors, other performance hindering
factors come in during the habit phase. For example, simply forgetting the behavior, low
cognition intensity (i.e. the intensity with which an individual thinks about the behavior) or the
degree to which a person perceives dissonance when the behavior execution was forgotten are
viewed as important. High cognition intensity is important for the transition from the uptake
phase to the habit phase and it prevents forgetting the behavior. The less habitual a behavior is,
the more it has to be cognitively active to prevent forgetting (Logan, 1980; Tobias, 2007). If the
behavior is not activated, chances that it will be performed despite of the existence of old habits
are low, unless it is related to a very positive affective component (which is not expected to be
the case for water treatment). If then additionally a high degree of dissonance is perceived when
the behavior execution was forgotten, the behavior is even more likely to be cognitively
activated (Festinger, 1957). The degree of perceived dissonance depends on the goals the
person has defined for her/himself beforehand. Only once a behavior is truly habitual, cognition
intensity will be much lower, because the characteristic of an automatic behavior is an only
marginal need for cognitive resources (Ouellette & Wood, 1998; Tobias, 2007, p. 101). In the
context of habit development, some authors also stress the importance of how strongly people
themselves perceive they are performing the behavior habitually (perceived habit; Bamberg,
1996; Knussen et al., 2004; Verplanken & Orbell, 2003).
Additionally, in order to not to forget the new behavior, the correct moment for behavior
execution has to be detected. For example, doing SODIS has to be remembered when the
person is at home and not at work. Furthermore, it has to be remembered how the behavior is to
be performed (e.g. the five SODIS steps). The more salient key situations are defined, the more
likely the possibility to perform the behavior will be recognized, and the more likely is behavior
execution (Marsh, Hicks & Hancock, 2000). Habitual behavior has the characteristic that it is
performed despite of changing circumstances and emerging difficulties (Fuchs et al., 2005). To
support people in remembering when and how to perform the behavior, memory aids are a
possible intervention. In the present study, some households had received prompts to support
remembering the SODIS behavior in the correct situation and to provide information on how to
perform it. A detailed description of these prompts and their mode of operation can be found in
the general Methods chapter (design) and in chapter 3 (mode of operation).
Summarizing, the main question that is intended to be answered with the current chapter
is: Which are the factors that make the difference between continuers and relapsers, including
time as well as motivational and volitional factors? It is not precisely stated to which stage of the
behavior change process an individual falls back when relapsing after some time of behavior
performance. It is suspected that the motivational factors at the stages of problem awareness
and persuasion (i.e. beliefs, attitudes, knowledge etc.) are not very different between relapsers

Why do people stop using SODIS? 92
and continuers, because all people have already passed through those two stages, got
convinced about SODIS and have at some point started using it. The main differences that are
hypothesized to exist between continuers and relapsers will probably be found at the action
stages. It is hypothesized that relapsers have a lower intention to do SODIS as the key
transition point to the uptake phase. Furthermore, it is assumed that relapsers have had lower
behavior intensity already before they have dropped out, because of to the influence of past
behavior5. Unfortunately, the assumption on previous behavior cannot be tested due to missing
data. Further it is assumed, that relapsers have a lower cognition intensity concerning the
SODIS behavior, forgetting is much higher than for continuers and forgetting is not perceived as
very dissonant. At this stage it should have had an influence if people previously had received a
memory aid (prompt). Furthermore, people who do not consume SODIS water must naturally
consume a different type of water. It is unclear, whether relapsers use an alternative disinfection
method (e.g. boiling) or if they drink more untreated water6.
Different types of ‘continuers’ and ‘relapsers’
Often it is only distinguished between those who stop with a certain behavior and those
who continue. Fuchs’ research (1997), which is related to sports program compliance, however,
suggests a more than dichotomous view. He identified four types in his study on participation
behavior in a sport intervention: two types of continuers and two types of relapsers. The overall
continuers are distinguished into continuers and fluctuaters, and relapsers into early and late
relapsers.
Continuers participate continuously in the sports program and show a behavior intensity
of about 90%. Also fluctuaters are in some sense continuers, but show more interruptions.
Their behavior intensity is about 68%. Early relapsers show the behavior for two weeks and
then drop out. Among all four types, early relapsers have the highest degree of self-
determination and the lowest degree of introjection. This implies that early relapsers choose
their behavioral goals according to their own needs, emotions and interests, and are not
responsive to other people’s expectations. They are probably the ones that realize quickly that
the chosen sports program does not meet their expectations, and draw the appropriate
consequences (Fuchs et al., 2005). Finally, there are late relapsers, who encounter their
relapse after approximately six weeks. They show an inclination to externally determined
behavior and rather low self-determination, and appear to be the complete opposite to the early
relapsers. The long period of time late relapsers are actually showing the sport behavior is a hint
5 In chapter 1, the influence of past behavior was non-existent for current SODIS behavior. However, it is assumed that the interventions that had been taken place had a stronger effect than the length of the interval between measurement time points, because it is known that people behave very constant under constant circumstances. Therefore, it can be assumed that the past behavior could have had an influence on relapse or continuing, because no intervention had been taking place between those two measurements compared in the present chapter. 6 Although in the previous chapter it was found that SODIS water consumption is strongly negatively related to untreated water consumption, in this analysis the case could possibly be different, because the study area is mostly periurban and not rural. Water consumption patterns are known to be different between periurban and rural areas.

Why do people stop using SODIS? 93
that extrinsic motivation or social-contextual conditions can actually trigger a longer
performance, but eventually are not sustainable (Ryan & Deci, 2000).
Fuchs and colleagues (2005) argued that this taxonomy may be transferable to other
behaviors. However, one may have doubts on the comparability of a sports activity to an every
day water treatment behavior. Further doubts arise about the control mechanisms of the
variables used for characterizing the two relapsers, self-determination and introjection. These
may be of importance when it comes to such a complicated behavior like following regular
sports activities. Here it is assumed that an everyday behavior is not dependent on general,
stable personality traits. Instead, it is assumed that everyday behavior is rather guided by topic
related and stage specific factors which were laid out in the previous chapter in the description
of the behavior change process. Therefore, the idea of different sub-types among relapsers and
continuers from Fuchs is kept and will be tested, but different criteria will be investigated. The
crucial factors that make the difference between becoming a real long-term SODIS user or one
that drops out after a while are hypothesized to be factors of the later stages of the behavior
change process. Therefore, two of those key variables will be used: intention and cognition
intensity7. Moreover, the relapse pattern over time in the present study is a rather continuous
one and does not indicate a clear early or late type. For SODIS use, fluctuation cannot be
estimated, because people had not been continuously monitored like in Fuchs study. Due to this
lack of information, it would simply not be possible to establish the same categories like Fuchs
and do a subsequent characterization with other variables.
Typing with intention and cognition intensity
As it was just mentioned, due to the nature of the present data it is not possible to actually
replicate Fuchs’ types. Therefore, two variables of the behavior change process were selected
to serve as the basis for a cluster analysis and the identification of different types among
relapsers and continuers. In the following a brief explanation will be given, why those two
variables were chosen.
As it was explained in the description of SODIS within the behavior change process, it is
hypothesized that the critical stages for relapse or continuing to use SODIS are the action
stages of the behavior change process.
The successful transition between motivational and action stage, however, is marked by
a high intention. The behavioral intention can be described as an aim or decision to act in a
specific way. According to the theory of reasoned action (Fishbein & Ajzen, 1975) and the
theory of planned behavior (Ajzen, 1985, 1991), intention is the proximal cause of behavior. 7 In the last chapter, perceived habit was found to be very dominant in predicting behavior. Cognition intensity is used instead of perceived habit in the present chapter, a) because perceived habit is quite a general variable and was only used in the previous chapter, because cognition intensity was not measured for boiling and untreated water consumption (only perceived habit was measured for all three water types), and b), cognition intensity has a strong to very strong relation (correlation) to perceived habit and seems to be its dominant predictor (analyses not presented). In any case, perceived habit is still included in the close-up of the relapser and continuer types.

Why do people stop using SODIS? 94
Once there is an opportune situation to show the favored behavior, the behavioral intention
gains strength and guides the action until the goal is achieved (Heckhausen & Kuhl, 1985). This
does not mean that every behavior is operated by a preliminary intention; for example habitual
and reflexive actions are automatic and initiated through a situation, not through an intention
(Heckhausen, 1991). Many studies investigating different behaviors have shown a good
predictive power of intention on behavior (e.g. Ajzen, 1991; Bamberg et al., 2003; Bamberg,
2002; Kaiser & Gutscher, 2003), although often the so-called intention-behavior gap remains
(that is the residual part of the variance, often >50%, that cannot be explained with intention).
The underlying assumption for using intention to discriminate different relapser types and
continuer types is the suspicion that among non-users (relapsers), non-intenders and intenders
are distinguishable (Schüz, Sniehotta, Mallach, Wiedemann & Schwarzer, 2009). This
distinction implies quite different actions or interventions for preventing relapse and is therefore
of interest. Also, among continuers may exist some with a lower and others with a higher
intention, manifesting itself in a lower or higher behavioral intensity. It is expected that intention
is more important for differentiating between relapser types than between continuer types.
Cognition intensity, the second cluster variable, was described previously as being
important for a constant behavior performance during the time before a real habit is established.
A high cognition intensity prevents forgetting and facilitates the correct processing of situational
cues. Other key processes at the action stages like planning processes, implementation
intentions, self-efficacy, which are investigated by other authors (e.g. Schwarzer, 2008), also
imply a certain amount of cognitive conscious processing. In the current analysis it is suspected
that cognition intensity for relapsers is rather low, but differences are observable, probably
depending on when people stopped using SODIS. The longer it was ago, the lower the
cognition intensity should be. For continuers, it is hypothesized that there exist different groups
related to cognition intensity: those who are performing the behavior still under strong cognitive
control should have a high cognition intensity and those that have already reached fully the
habit stage should have a lower cognition intensity. It is expected that cognition intensity is more
important to differentiate between the continuers than between the relapsers.
METHODS
The differences between relapsers and continuers will be investigated using data from
Study I. Relapse occurred between panels 3 and 4, therefore data from those two panels will be
looked at to test the stated hypotheses. Study procedures, the interventions and participants'
characteristics as well as all operationalizations can be found in the overall Methods part of this
thesis.

Why do people stop using SODIS? 95
RESULTS
The results part consists of two major analyses: first, finding different relapser and
continuer types. This will be realized with two separate cluster analyses – one for the relapsers
to identify relapser types and one for the continuers with the aim to identify continuer types. In a
second part, the found types as well as relapsers and continuers in general will be compared
with each other in different aspects of the behavior change process using variance analyses.
Finally, on some selected factors an insight about their change over time will be given.
166 relapsers and 123 SODIS continuers entered the analyses. As relapsers those
households were categorized that were not using SODIS in the fourth panel. All those who
reported using SODIS in the fourth panel were classified as continuers, independently if they
had been using SODIS at the third panel or if they started afterwards during the inactive phase.
Identification of relapser types and continuer types
A cluster analysis was run including all relapsers. The number of clusters was set free. A
two-step-cluster analysis using intention and cognition intensity measured at time point 4
identified a two cluster solution among relapsers (Nr1=96, Nr2=70). The same cluster analysis
including all continuers revealed a three cluster solution (Nu1=34, Nu2=33, Nu3=56). A
corresponding discriminant analysis to validate the clusters confirms that the clusters are well
distinguishable. Both discriminant analyses, for relapsers and continuers, revealed 100% of
correctly classified cases. For relapsers, the discriminant analysis resulted in one canonical
discriminant function with a Wilks’ lambda of 0.23 (χ²(2)=220.23, p<.001). For continuers, two
canonical discriminant functions were found with a Wilks’ lambda of 0.07 (χ²(4)=357.92, p<.001)
for the first one.
The cluster profile, consisting of the mean values of each cluster for the two cluster
variables, is presented in Figure 15. Cluster subtypes that were found in the two cluster
analyses can be described as follows. Relapser type 1 has a medium level of intention, but
never thinks about SODIS. Relapser type 2 has higher levels of both variables: a medium
cognition intensity and a quite high intention. Continuer type 1 is the ‘medium’ type – medium
intention and medium cognition intensity. All cases of continuer type 2 have the maximum
intention, but only a medium cognition intensity. It appears to be a similar pattern like relapser 2.
Finally, continuer type 3 has a maximum intention and a maximum cognition intensity. The five
types will be characterized further in the next section, when variables from the entire behavior
change process are analyzed separately for the five types and relapsers vs. continuers together.

Why do people stop using SODIS? 96
Figure 15. Cluster profiles of the two relapser clusters and the three continuer clusters by intention and cognition intensity. Study I, Panel 4.
0.0
0.2
0.4
0.6
0.8
1.0
Clustertypes
Intention 0.53 0.89 0.59 1.00 1.00
Cognition Intensity 0.02 0.55 0.57 0.54 1.00
Relapser 1 Relapser 2 User 1 User 2 User 3
Mea
n va
lue
of In
tent
ion
and
Cog
nitio
n in
tens
ity
Characterization of relapsers, continuers and their subtypes
Descriptives of all variables of the behavior change process were calculated for the two
relapser and three continuer types separately as well as for all relapsers and all continuers
together. Mean differences were analyzed with variance analyses (between the subtypes), t-
tests (relapsers vs. continuers) and chi-square tests in case of non-ordinal data. Between
continuer type 1 and continuer type 2, only two factors showed a significant difference: the
cluster variable intention (means see Figure 15, p<.001) and the belief about the costliness of
the SODIS method (MContinuer1=.66, MContinuer2=.78, p=.003). A lot more differences, particularly for
the variables of the habit stage, were found between continuer type 3 compared to the other two.
Due to their similarity, at this step it was decided to unite continuer types 1 and 2, resulting in a
final solution with two relapser types and two continuer types, which will be described more
detailed in the following. All means and standard deviations as well as significance values of the
variance analyses comparing the now only four subtypes with each other and t-tests comparing
overall relapsers and continuers are found in Table 11.
Comparing overall relapsers and continuers it is clearly visible from Table 11 that
continuers have significantly higher values than relapsers for nearly all psychological factors at
all stages of the behavior change process. For the motivational factors, problem awareness and
persuasion, significant differences between relapsers and continuers for the following factors
were found: problem awareness concerning diarrhea, awareness and importance of clean
drinking water, SODIS knowledge depth, beliefs about the healthiness, costliness, effort as well
as difficulty of (doing) SODIS and injunctive as well as subjective norm. These differences vary
between 0.04 and 0.15 on a scale ranging from 0 to 1. Larger differences (> 0.15) were found
for belief about the taste of SODIS water, cost-benefit evaluation, affect as well as attitude

Why do people stop using SODIS? 97
Table 11. Descriptive statistics of factors of the behavior change process including the two cluster variables and demographic variables. Values are presented separately for the two relapser and the two continuer types as well as for total relapsers and total continuers. Study I, Panel 4.
Groups Significance tests a
Relapser 1
(r1) Relapser 2
(r2) Continuer 1
(c1) Continuer 2
(c2) Relapser total (r)
Continuer total (c) r1-r2 r1-c1 r1-c2
r2-c1
r2-c2
c1-c2 r-c
Factor M SD M SD M SD M SD M SD M SD p p p p p p p
PA Diarrhea .77 .20 .78 .15 .79 .16 .86 .15 .77 .18 .82 .16 * (*) * Aw. clean water .60 .29 .56 .26 .65 .30 .63 .30 .58 .28 .64 .29 (*) Imp. clean water .76 .17 .71 .17 .78 .17 .79 .17 .74 .17 .79 .16 (*) * * Knowledge depth .72 .29 .81 .23 .83 .18 .88 .16 .75 .27 .86 .17 (*) ** *** *** Belief taste .41 .40 .61 .20 .63 .24 .70 .22 .50 .34 .66 .23 *** *** *** *** Belief health .54 .33 .64 .19 .67 .16 .70 .16 .58 .29 .68 .16 (*) ** ** ** Belief time -.14 .20 -.13 .21 -.11 .16 -.11 .16 -.14 .20 -.11 .16 Belief money .67 .17 .68 .16 .72 .17 .73 .13 .68 .17 .73 .15 (*) ** Belief effort -.16 .21 -.13 .20 -.10 .17 -.09 .16 -.15 .21 -.10 .16 * Belief difficulty -.10 .20 -.06 .16 -.03 .13 -.01 .04 -.08 .18 -.02 .10 (*) ** ** Cost-benefit .59 .31 .66 .27 .71 .27 .83 .18 .62 .29 .77 .24 * *** ** (*) *** Affect .47 .32 .60 .17 .67 .19 .75 .16 .52 .28 .71 .18 ** *** *** ** *** Attitude .61 .30 .67 .13 .77 .18 .84 .17 .63 .25 .80 .17 *** *** * *** *** Injunctive norm .31 .30 .49 .29 .41 .32 .53 .30 .38 .31 .47 .31 ** *** * Subjective norm .07 .13 .13 .15 .19 .20 .28 .24 .10 .14 .23 .23 ** *** *** * *** Descriptive norm 0.6 1.2 1.1 1.5 1.70 1.95 2.4 2.5 0.8 1.4 2.0 2.2 ** *** *** *** Intention .53 .31 .89 .20 .79 .23 1.00 .00 .68 .32 .89 .20 *** *** *** * *** *** Untreated water .15 .28 .18 .30 .06 .13 .03 .07 .16 .29 .05 .11 * * ** *** Boiled water .72 .28 .71 .30 .52 .19 .42 .15 .72 .29 .47 .18 *** *** *** *** *** SODIS water - - - - .38 .16 .51 .15 - - .44 .17 - - - - - *** - Cognition intensity .02 .09 .55 .21 .55 .26 1.00 .00 .25 .30 .76 .29 *** *** *** *** *** *** Forgetting -.78 .28 -.70 .33 -.42 .27 -.24 .21 -.74 .31 -.34 .26 *** *** *** *** ** *** Dissonance .12 .19 .24 .24 .37 .30 .63 .20 .17 .22 .49 .29 * *** *** ** *** *** *** Perceived habit .09 .18 .20 .27 .43 .23 .64 .27 .14 .23 .52 .27 * *** *** *** *** *** *** Age 39.0 15.9 40.3 15.3 38.1 14.4 38.2 12.4 39.5 15.6 38.2 13.5 Education 7.3 4.9 6.3 4.7 7.83 5.01 6.8 4.6 6.9 4.9 7.4 4.8 Persons per HH 4.8 2.0 5.0 2.0 5.40 1.87 5.6 2.0 4.9 2.0 5.5 1.9 * Children <5y p. HH 0.8 0.9 0.9 0.9 .91 1.00 0.8 1.0 0.8 0.9 0.8 1.0 Gender (% ♀) 93% 91% 97% 87% 92% 93% Job (% yes) 43% 18% 33% 36% 33% 34% ** No. of contacts 5.7 2.8 6.6 3.1 5.80 2.62 6.8 2.9 6.1 3.0 6.2 2.8 N 96 70 67 56 166 123
Note: The two orange marked factors are the cluster variables. PA – Problem awareness. Aw. – Awareness. Imp. – Importance. HH – Household. M – mean, SD – standard deviation. a The presented significance values are from post-hoc Bonferroni analyses. For the comparison relapsers total vs. continuers total (d-u) t-tests were calculated. In case of the variables gender and job, chi-square tests were calculated. *** p<.001, ** p<.01, * p<.05, (*) p<.1. All empty cells are non-significant.
towards doing SODIS, and intention. However, all those differences are less than one scale
step (1 scale step = 0.33). Additionally, the descriptive norm shows that continuers know on
average more than twice as many other people also using SODIS compared to relapsers. The
behavioral indicators show that relapsers consume 11% more untreated water than continuers,
but also boil a bigger proportion of their water (difference 25%). The indicators from the last
stage of the behavior change process, habit, show much bigger differences than those
previously mentioned. Differences between relapsers and continuers are at least one scale step

Why do people stop using SODIS? 98
(between 0.32 and 0.51) for cognition intensity, forgetting of SODIS, the perceived dissonance
in case of forgetting, and perceived habit.
Comparing the two relapser types with each other, relapsers type 2 have higher values
for all those factors that show significant or even only a trend to significant differences between
the two relapser types: SODIS knowledge, beliefs about the taste and healthiness of SODIS,
affect towards SODIS, injunctive norm, intention, cognition intensity, dissonance, and perceived
habit. The highest differences were those of the belief about the taste of SODIS water
(ΔM=0.20), the injunctive norm (ΔM=0.18) and the two cluster variables (intention: ΔM=0.36;
cognition intensity: ΔM=0.53). Another, very interesting difference is that of relapsers type 2 only
18% have a job, whereas of relapsers type 1 43% have a job (average 33%). According to the
values of the psychological factors, one could call relapsers type 1 ‘low relapsers’ and relapsers
type 2 ‘high relapsers’.
The comparison of the two continuer types only shows significant differences for
subjective norm (ΔM=0.09), intention (ΔM=0.21), and the habit indicators cognition intensity
(ΔM=0.45), forgetting (ΔM=0.18), dissonance (ΔM=0.26), and perceived habit (ΔM=0.21).
Continuers type 2 have for all those variables more positive values. They also consume
significantly more SODIS water than continuers type 1 (ΔM=13%). Interestingly, the
consumption of untreated water does not differ (3 and 6%). Instead, continuers type 1 consume
10% more boiled water; however, this difference is not significant. No differences in
demographic variables were found. Like for the relapser types, a low and a high subtype of
continuers was found. Continuers type 1 will be ‘low continuers’ and continuers type 2 ‘high
continuers’ in the following.
Comparing the relapser types with continuer types, it is apparent from Table 11 that low
relapsers differ from both continuer types in quite many aspects. In contrast, high relapsers
compared with the two continuer types, only differ in many aspects from high continuers. The
difference to low continuers, however, is limited to behavioral and habit factors. High relapsers
consume more untreated water (ΔM=12%), but also more boiled water (ΔM=19%) than low
continuers, as well as they forget SODIS more often (ΔM=0.28), feel less dissonance (ΔM=0.13),
and have a lower perceived habit (ΔM=0.23). Interestingly, intention is even higher and
cognition intensity the same for high relapsers compared to the low continuers (not significant;
ΔM=0.10 and 0.00, respectively). In fact, for many variables not only relapsers together have
lower values than continuers together, but a clear overall sequence of the four subtypes is
found: low relapsers < high relapsers <= low continuers < high continuers with the exception of
injunctive norm and intention.
Regarding the habit supporting interventions, prompt and public commitment, in 2005
future continuers and future relapsers did not receive different amounts of prompts or public
commitments (see Table 12, average 58% for prompts and 26% for public commitments).

Why do people stop using SODIS? 99
Table 12. Descriptive statistics of the interventions of Study I in 2005 and 2006, monitoring and long questionnaire. Values are presented separately for the two relapser and the three continuer types as well as for total relapsers and total continuers. Study I, Panel 4. Groups Significance tests a
Low relapser
(r1)
High relapser
(r2)
Low continuer
(c1)
High continuer
(c2) Relapser total (r)
Continuer total (c) r1-r2 r1-c1 r1-c2
r2-c1
r2-c2
c1-c2 r-c
Factor M M M M M M p p p p p p p
Prompt 2005 49% 76% 58% 50% 60% 54% ** * PC 2005 18% 30% 30% 30% 23% 30% Prompt 2006 24% 30% 42% 38% 27% 40% (*) * PC 2006 4% 1% 6% 7% 3% 7% No. of comm. channels 3.1 3.3 3.5 3.4 3.2 3.4
Monitoring 35% 54% 48% 32% 43% 41% (*) (*) No. of long questionnaires 1.6 1.9 2.1 2.0 1.7 2.0
* *
N 96 70 67 56 166 123 Note: M – mean. PC – Public commitment. a The presented significance values are from post-hoc Bonferroni analyses (no. of communication channels, no. of long questionnaires) or chi-square tests (all other factors). The threshold for significance level of chi-square tests was adjusted according to number of tests calculated (Sachs, 1978, p. 369). For the comparison relapsers total vs. continuers total (d-u) t-tests were calculated for no. of communication channels and no. of long questionnaires. ** p<.01, * p<.05, (*) p<.1. All empty cells are non-significant.
However, a higher percentage of continuers in the fourth panel still had their prompts (40%)
compared to relapsers (27%). The reason for not having the prompt anymore was in 85% of the
cases because it was torn up or dirty. The public commitment almost nobody kept until 2006,
also in 88% of the cases because it was torn up, wet or dirty. Other reasons for not having the
prompt or public commitment anymore were that people gave it away as a present, they moved
house and forgot it or that it simply had been lost. One possible influence on people continuing
to use SODIS may have been the long questionnaires: future continuers had a slightly higher
average amount of long questionnaires in 2005 than the relapsers. Number of perceived SODIS
communication channels and having been in the monitoring group did not have an influence on
continuing or stopping SODIS use.
Comparing the types within the groups of relapsers and continuers, one interesting result
was found: high relapsers had received substantially more prompts (76%) and have the highest
percentage of people who were in the monitoring group in 2005 (54%) compared to he low
relapsers (prompts: 49%, monitoring: 35%) and to continuers (prompts: 57%, monitoring: 42%).
Change over time of relapsers, continuers and their subtypes
So far, relapsers and continuers and their sub-types have been characterized using all
available data from the fourth panel. However, information is still missing on what actually
happened between the end of the active phase (third panel) and the fourth panel. Unfortunately,
not much information is available, only the time point of when relapsers stopped using SODIS

Why do people stop using SODIS? 100
Figure 16. Relapse time-point distribution of low and high relapsers over time. Study I, Panel 4.
0%
10%
20%
30%
Low relapser 19.8% 26.0% 8.3% 11.5% 6.3% 5.2% 5.2% 5.2% 0.0% 1.0% 11.5%
High relapser 5.7% 8.6% 7.1% 18.6% 17.1% 2.9% 7.1% 5.7% 1.4% 18.6% 7.1%
Sep/ Oct05
Nov05 Dec05 Jan06 Feb06 Mrz06 Apr06 May06 Jun06 not admitted
missingPerc
enta
ge o
f rel
apse
r typ
e 1
and
2, re
spec
tivel
y
x-axis = Time
and reasons for relapse were inquired retrospectively. For all other factors, a simple comparison
of the values of the third and the fourth panel must be sufficient.
The key criterion for characterizing relapsers relating back to Fuchs is presented next: the
time-point relapsers had actually stopped using SODIS. Figure 16 shows the distribution of
relapsers type 1 and 2 along a time axis from September 2005 to June 2006.
Two peaks are clearly distinguishable between relapser types. Whereas 46% of low
relapsers stopped using SODIS either already during the active study phase (September/
October 2005) or shortly after (November 2005), 36% of high relapsers stopped using SODIS in
January or February 2006. Additionally, 19% are found among high relapsers under the label
‘not admitted’. Those are people who stated in the questionnaire that they were still using
SODIS and therefore the information on a relapse time point is not available. Nevertheless, they
also stated that they did not treat any amount of water with SODIS, therefore they got classified
as relapsers. It can be assumed, that they have just recently stopped using SODIS and may
even take it up again later. However, at the time of the fourth panel they were relapsers and
most of them belong to the high relapser group. For 10% of the cases the information about the
relapse time point is simply missing. To simplify the classification, it seems that the line for
separating the two peaks of early and late relapsers is in December 2005. Classifying all
relapsers until end 2005 as early and all of the year 2006 as late relapsers, 61% of all valid
cases of low relapsers are early relapsers, and 77% of all valid cases of high relapsers would be
late relapsers. A chi-square test on relapser type (low vs. high) by relapse time point (early vs.
late) shows highly significant results (χ²(1, 149)=21.6, p<.001).
Reasons for relapse were assessed with an open question and categorized (Table 13).
Similar percentages of low and high relapsers named the reasons no time (30 and 37%), bad

Why do people stop using SODIS? 101
Table 13. Reasons for relapse of low and high relapsers. Study I, Panel 4. Reason Low relapser High relapser Chi-square test (p)
No time 30% 37% Bad weather 15% 16% No bottles 13% 20% Forgot 23% 17% Boils or buys water 26% 9% ** Evacuation 4% 10% Doubts / taste 6% 0% Other 8% 4%
Missing 22% 24% N 96 70
Note: * p<.05. All empty cells are non-significant.
weather (15 and 16%), no bottles (13 and 20%), forgetting (23 and 17%), evacuation (4 and
10%), and that they had doubts about the effectiveness of the SODIS method or did not like the
taste (6 and 0%). Other reasons included travels, that no water was available or that they were
busy with moving. Only the reason that people boil or buy water instead of using SODIS was
significantly named more often by the low relapsers (26 and 9%). Interestingly, no-one of the
high relapsers had mentioned doubts or bad taste, this was mentioned only by low relapsers.
Unfortunately, of 23% of relapsers no answers were available.
For completing the characterization of relapsers and continuers, of some selected
variables values of the third panel (that is, before the relapsers have become ‘relapsers’) are
presented. Particularly, for the variables that have shown larger differences between relapsers
and continuers at the fourth panel, it seems to be of interest if they already had had lower
values for relapsers, when they were still using SODIS at the time of the third panel, and if the
change between the third and fourth panel is found to be significant.
Table 14 shows the values of those variables of the third panel that had differences
greater than 0.15 between relapsers and continuers at the fourth panel, except the belief about
the taste of SODIS water and perceived habit, which were not measured at the third panel. In
general, only very few significant differences were found between relapsers and continuers.
Only attitude and the dissonance in case of forgetting SODIS were already more positive among
the continuers at the third panel. No significant differences were found within relapsers and
within continuers. Only low relapsers had a significantly lower cost-benefit evaluation than high
continuers and knew by trend less other people using SODIS (descriptive norm). So, over all no
relevant differences were found at the time of the third panel. The general level of all variables is
quite highly in favor of using SODIS (high mean values).
Analyses of significance of the change over time, calculated separately for the two
relapser types and the two continuer types using dependent t-tests, revealed highly significant
negative changes between third and fourth panel among the low relapsers for affect (t(57)=3.52,

Why do people stop using SODIS? 102
Table 14. Descriptive statistics of some factors of the behavior change process, measured at the 3rd panel. Values are presented separately for the two relapser and the two continuer types as well as for total relapsers and total continuers. Study I, Panel 3.
Groups Significance tests a
Low relapser
(r1)
High relapser
(r2)
Low continuer
(c1)
High continuer
(c2) Relapser total (r)
Continuer total (c) r1-r2 r1-c1 r1-c2
r2-c1
r2-c2
c1-c2 r-c
Factor M SD M SD M SD M SD M SD M SD p p p p p p p
Cost-benefit .65 .27 .74 .22 .72 .26 .80 .27 .70 .25 .75 .26 * Affect .66 .18 .68 .23 .71 .19 .73 .17 .67 .20 .72 .18 (*) Attitude .75 .23 .75 .19 .81 .20 .84 .18 .75 .21 .82 .19 * Descriptive norm 2.1 3.1 3.4 4.8 2.5 3.2 4.0 4.3 2.7 4.1 3.2 3.8 (*) Intention .87 .24 .96 .15 .92 .19 .91 .22 .91 .20 .92 .20 Cognition intensity .64 .28 .66 .27 .67 .32 .70 .28 .65 .27 .69 .30 Forgetting -.34 .20 -.26 .23 -.27 .23 -.26 .23 -.30 .22 -.27 .23 Dissonance .43 .33 .45 .32 .52 .33 .59 .32 .44 .33 .55 .32 * N 58 53 58 42 111 100
Note: M – mean, SD – standard deviation. a The presented significance values are from post-hoc Bonferroni analyses. For the comparison relapsers total vs. continuers total (d-u) t-tests were calculated. *** p<.001, ** p<.01, * p<.05, (*) p<.1. All empty cells are non-significant.
p=.001), attitude (t(57)=2.55, p=.014), descriptive norm (t(57)=3.38, p=.001), intention
(t(57)=7.12, p<.001), cognition intensity (t(46)=13.80, p<.001), forgetting (t(29)=6.07, p<.001),
and dissonance (t(40)=5.10, p<.001). For high relapsers also most of the factors showed a
significant decline between third and fourth panel, except intention and cognition intensity (the
two cluster variables; affect: t(52)=2.76, p=.008; attitude: t(52)=2.28, p=.027; descriptive norm:
t(52)=3.60, p=.001; forgetting: t(48)=6.19, p<.001; dissonance: t(45)=3.63, p=.001). For low
continuers, all habit factors and intention show a significant decline (intention: t(55)=3.63,
p=.001; cognition intensity: t(50)=2.75, p=.008; forgetting: t(50)=2.97, p=.005; dissonance:
t(46)=2.71, p=.009), whereas for high continuers only the descriptive norm shows a significant
decline (t(41)=2.19, p=.034). For the two cluster variables, intention and cognition intensity, a
significant increase could be detected (intention: t(41)=-2.55, p=.015; cognition intensity: t(38)=-
6.54, p<.001). The changes of the variables of the habit phase as well as for intention are for
better illustration presented in Figure 17.

Why do people stop using SODIS? 103
Figure 17. Development of intention, cognition intensity, forgetting and habit between 3rd and 4th panel. Graphs are presented separately for the two relapser and the two continuer types. N=211. Study I, Panels 3 and 4.
Intention
0.0
0.2
0.4
0.6
0.8
1.0
Panel 3 Panel 4
Low relapser High relapserLow user High user
Forgetting
-1.0
-0.8
-0.6
-0.4
-0.2
0.0
Panel 3 Panel 4
Low relapser High relapserLow user High user
Dissonance
0.0
0.2
0.4
0.6
0.8
1.0
Panel 3 Panel 4
Low relapser High relapserLow user High user
Cognition intensity
0.0
0.2
0.4
0.6
0.8
1.0
Panel 3 Panel 4
Low relapser High relapserLow user High user
DISCUSSION
In the discussion, relapsers, continuers and their subtypes will be characterized using all
presented data and they will be related to Fuchs types and to the stages of the behavior change
process. Finally, some recommendations for possible interventions will be given.
Relapser or continuer?
This part contrasts overall relapsers against overall continuers, before it will be looked at
the subtypes of relapsers and continuers.
Summarizing description of results. The results have shown that relapsers have
significantly lower values than continuers for almost all factors along the behavior change
process. Starting at the first stage with problem awareness and knowledge about SODIS,
continuing with the cognitive beliefs, affect, attitude and intention at the second stage, and
ending with cognition intensity, forgetting, dissonance and perceived habit at the action stage, a
similar pattern is observed. Looking closer, there are two aspects apparent: first, differences

Why do people stop using SODIS? 104
between relapsers and continuers are smallest on the problem awareness stage. Factors on the
persuasion stage already show larger, but still rather small differences (less than one scale
step), and finally on the habit stage the differences are largest (greater than one scale step).
The second aspect refers to the mean level of the factors. The mean level of the factors on the
problem awareness stage is quite high for relapsers and continuers (close to the scale step
before the maximum one). On the persuasion stage most cognitive belief factors (time, money,
effort, difficulty, cost-benefit) as well as attitude and intention have also quite high mean levels.
However, some factors at the persuasion stage, such as the beliefs about taste and health as
well as the affect are as low as the middle of the scale for the relapsers. Alarmingly low for both
groups, relapsers and continuers, are the norm factors: injunctive and subjective norm are in the
lower half and lower quarter of the scale, which implies that SODIS among relapsers and
continuers has quite a low reputation and that people underestimate the proportion of other
people in their community using SODIS. Also the descriptive norm, that is how many other
people a person knows using SODIS, is very low for relapsers with a value of less than one.
The lowest mean values, however, were observed for the habit factors for relapsers. These
mean values are between the lowest and the next to lowest scale point for all four habit factors,
cognition intensity, forgetting, dissonance, and perceived habit. Additionally, relapsers have a
slightly lower number of persons per household. The behavioral indicators show a much higher
consumption of boiled water by the relapsers (72%; continuers 47%), but boiling does not
compensate not using SODIS completely. Untreated water consumption is higher for relapsers
with 16% compared to 5% among the continuers.
Summarizing, the difference pattern between relapsers and continuers on the
psychological variables shows that the further the behavior change process advances, the
greater the differences between relapsers and continuers, and the lower is the level of the
variables for the relapsers. It can be reasoned that the causality for people being a relapser lays
mainly in the missing habit, which they obviously did not manage to maintain in contrast to those
who stayed continuers.
The point just being made – the missing maintenance of the habit – is backed up by the
results of the previous panel. These results clearly show that relapsers had equally high levels
of all indicators that seem to have become crucial in determining the destiny as a relapser or
continuer, namely the critical factors of the persuasion stage (cost-benefit evaluation and affect),
descriptive norm and two of the three habit factors (cognition intensity and forgetting). Only
attitude and dissonance are slightly lower for relapsers already in 2005. The almost equal
values for relapsers and continuers at the third panel on one hand do not give hints, why a
certain person went the one way or the other. On the other hand, those results show that
relapse is not pre-determined by initially lacking problem awareness, negative beliefs or low
initial habit intensity. The results contrariwise indicate that relapsers have started at the same
point like the continuers, but something was missing to support them in the fragile and often
situation dependent establishment of a long term habit. Therefore, targeted interventions would

Why do people stop using SODIS? 105
be very appropriate and indicated. Support for the possible usefulness of habit supporting
interventions is already given by the fact that those people who still had their prompt in 2006
were more likely to still be a continuer. The results in general show that there is high
intervention potential among relapsers to make them staying continuers.
Until now, relapsers and continuers were compared globally. In the next part, the focus
will be laid on the question whether all relapsers show the same relapse pattern and whether all
continuers show the same stability, and finally give some more ideas on how the subtypes can
be addressed with further interventions
Low or high relapser, low or high continuer?
The effort to find sub-types of relapsers and continuers was inspired by Fuchs’ (1997),
who found early and late relapsers, fluctuating and constant continuers. In contrast to Fuchs, in
the present study two psychological variables to find different types of relapsers and continuers
were used: intention and cognition intensity. Two different relapser types and three different
continuer types were found and confirmed with statistical analyses. Looking at the psychological
factors, it appeared to be useful to unite two of the continuer types, which resulted then in two
relapser types and two continuer types. Those four types, labeled low and high relapser, low
and high continuer relating to the mean level of the psychological factors will be characterized in
the following.
The relapser types
Summarizing description of results. In general, both relapser types are aware of the
diarrhea and water problem, have acquired enough knowledge about SODIS and also have a
positive opinion about SODIS. Only the taste is valued less positively by the low relapser than
by the high relapser. This may be the reason that the low relapser also affectively likes it less to
do SODIS than the high relapser, and for him SODIS has quite a low reputation. Nevertheless,
attitude and the other beliefs are as positive as those of the high relapser. Quite apparent is the
low descriptive norm of the low relapser – he only knows on average 0.6 persons using SODIS
(almost 70% do not know anyone using SODIS) compared to 1.1 persons in the high relapser
group. Although the low relapsers' intention is a lot lower than that of the high relapser, it still
has a medium level. More informative are the habit indicators – the low relapsers never think
about SODIS (cognition intensity), almost never feel any dissonance in case they forget SODIS,
and do almost not perceive any habit. In contrast, the cognition intensity of the high relapsers is
at a medium level, and dissonance and perceived habit are twice as high as those of the low
relapsers. Water consumption is similar for low and high relapsers, they consume equal
amounts of untreated and boiled water. Interestingly, 43% of low relapsers have a regular job,

Why do people stop using SODIS? 106
which is more than twice as many people as in the high relapser group, and the highest
percentage among all. The high relapsers are for almost all indicators between low relapsers
and low continuers, but mostly being closer to low continuers than to low relapsers. Despite all
those differences in the fourth panel, differences between the two relapser types had not yet
been visible in the third panel. Both relapser types had equally positive values at that time point.
Both relapser types have experienced a significant decrease of the crucial factors between third
and fourth panel. Only intention and cognition intensity did not decrease for high relapsers in
contrast to low relapsers. Low relapsers have stopped using SODIS early compared to high
relapsers. Until the end of 2005, 61% of low relapsers had already stopped, but only 23% of
high relapsers. High relapsers stopped mainly in January / February 2006 (36%), and another
19% were not even admitting to the fact that they had stopped using SODIS. High relapsers
have been favored by the distribution of the prompts – 76% had received a prompt in 2005,
which is more than any other group (average ca. 55%). However, in 2006 equal percentages of
both relapser types have kept the prompt until then. Compared to low relapsers, high relapsers
also have been more often in the monitoring group, by trend even more often than continuers.
As the main reason for relapse by one third of the people it was mentioned that they do not
have time. No time can have different meanings, but mostly it is meant that people have to work,
even informal work, or leave very early in the morning for the market and therefore no time
seems to be left to prepare the SODIS bottles. Further reasons are – equally mentioned by low
and high relapsers – bad weather, no bottles available, that it was forgotten and some other
minor reasons. The only reason indicating a difference is that the low relapser mentions more
often than the high one boiling or buying water was the reason for stopping to use SODIS.
Summarizing, low relapsers show differences to high relapsers for quite a range of factors.
Not only the cluster variables intention and cognition intensity were different, as hypothesized,
but also one central belief (taste), the affective connotation, injunctive norm, dissonance, and
perceived habit. High relapsers have values almost as high as low continuers, only differing in
attitude, forgetting, dissonance, and perceived habit from low continuers.
The differences between low and high relapsers indicate that low relapsers have taken
an early and conscious decision against using SODIS. Maybe, the perception of the taste has
not been positive enough, has caused a less positive affect and a lower overall intention, and
therefore the decision was taken to boil or buy water instead. Additionally, among friends and
neighbors, almost nobody was known who used SODIS and could have exerted a positive
influence. Probably due to missing information, SODIS was rated as not being very socially
favorable (because nobody seemed to be using it). Boiling or buying water may also have been
more convenient for the high percentage of employed persons. Since the decision was taken
quite early without a long period of time of trying to develop a habit, it is only logical that the
habit is basically non-existent. Unfortunately, untreated water consumption was not reduced to
zero, however, the untreated water consumers are not the same ones who gave boiling or
buying water as a reason to stop SODIS use.

Why do people stop using SODIS? 107
Relating back to Fuchs’ (1997) relapser types, low relapsers correspond clearly with the
early relapser type of Fuchs and colleagues (Fuchs, 1997; Fuchs et al., 2005). Fuchs had
described his early relapsers as those who decided within 2 weeks consciously and rational
driven against the behavior (sports exercise), because it did not appear to be appropriate for
them and to fit with their goals and expectations. The low relapsers of this study have also tried
out the behavior for a short while and then stopped rather early due to a combination of
affective, rational and social driven considerations.
According to the behavior change process, low relapsers have fallen out of the process
(Prochaska & DiClemente, 1982; E. M. Rogers, 2003) after the third phase. However, they have
kept a high problem awareness and still think positively about SODIS. To get low relapsers to
use SODIS in the future, it has to be inquired more precisely, which are the hindering reasons
for not using it. Maybe SODIS really is not suitable for low relapsers, or it may also be possible
that solutions to the seemingly hindering factors can be found on an individual basis.
High relapsers, on the other hand, according to most of the factors of the behavior
change process, could also have been low continuers. It seems they have tried to develop a
habit for quite some time, probably because they had quite a high level of initial external support
from the previously received prompts, the monitoring and social support (descriptive norm).
High relapsers in contrast to the low ones still show some signs of habit, it did not vanish
completely. They even think as often as low continuers about SODIS, but naturally report to
forget it more often and to perceive SODIS as less habitual. The nature of high relapsers in
comparison to low continuers suggests a threshold of habit before it leads to behavior. Only
when habit rises over a certain threshold, behavior gets performed (Inauen, 2007; Tobias, 2007).
It seems that only the higher amount of felt dissonance of low continuers compared to high
relapsers made the difference, because all other factors are similar.
High relapsers of this study are in various aspects similar to Fuchs’ late relapsers. Fuchs’
late relapsers are described as strongly extrinsically motivated and having externally introjected
behavioral goals. However, high external support can lead to a low degree of anchoring of the
behavior in the self system and increased chances of relapse (Ryan & Deci, 2000). High
relapsers of this study have also stopped the behavior execution rather late and have had
strong external motivational cues in form of prompts, the monitoring and a higher descriptive
norm. However, high relapsers had ‘lost’ a high proportion of their external cues (prompts, other
people who do SODIS). It can be argued, that either high relapsers had felt that they should do
SODIS because of all the external cues, but did not really want it, and as soon as all the cues
disappeared this feeling has vanished. Another explanation, which seems more plausible and is
also supported by the still very high values of the motivational factors, the intention and the
cognition intensity, is that high relapsers have relied on the external cues to remind them and as
they slowly disappeared they forgot doing SODIS more and more often. Although they still have
a positive motivation, including a high intention, and still think about SODIS sometimes, this
does not trigger behavior execution due to the missing dissonance, and in consequence,
SODIS is perceived as less habitual.

Why do people stop using SODIS? 108
Relating back to the behavior change process, high relapsers have gone back to the start
of the action phase, actually being very ready to perform the behavior, because the transition
condition – high intention – is met. They just seem to need a small external push into the right
direction. For example, dissonance could be induced with a commitment intervention (Brehm &
Cohen, 1962; Heckhausen, 1991), forgetting prevented with prompts or other reminders (Mosler
& Tobias, 2007a), and cognition intensity increased with anything increasing the presence of the
topic. This could be for example a social intervention, which would have additional positive
influence on the currently rather low injunctive and subjective norms. However, it has to be
made sure that the motivation at some point gets internalized to not fall back to old habits when
the external cues are gone.
Concerning Fuchs’ types only one remark must be made: the time frame for classifying as
early relapsers seems necessary to be redefined much longer (1-2 months) in the case of the
every day behavior SODIS than for sports exercises as described by Fuchs (2 weeks).
The continuer types
Summarizing description of results. Both continuer types are, like relapsers, aware of
the diarrhea and water problem, have acquired enough knowledge about SODIS, have equally
positive opinions about SODIS, think both that SODIS has a medium reputation (injunctive
norm), and know both around 2 other people also using SODIS. The estimation of the subjective
norm is significantly lower for low continuers, but not much. Differences between low and high
continuers start with the intention, and manifest among all four habit variables. Intention is still
high for low continuers and at a maximum level for high continuers. Low continuers only think
about SODIS on the same medium level like high relapsers in contrast to high continuers, who
always think about SODIS. Consequently, low continuers forget SODIS more often than high
continuers and feel less dissonance. Additionally, they also perceive that they are performing
SODIS less habitual. However, the levels of forgetting, dissonance, and perceived habit of low
continuers are higher than those of high relapsers as already pointed out in the relapsers’
description. At the behavioral level, low continuers treat less water with SODIS than high
continuers (38% compared to 51%), but boil more water instead. Remaining untreated water
consumption is equal for both and around 5% of the total water consumption. Looking back to
the third panel, both continuer types had equally positive values for all variables, also for the
habit variables. Particularly for the habit variables and for intention, low continuers showed a
significant decrease, whereas high continuers showed an increase in intention and cognition
intensity and stayed stable for forgetting and dissonance. Consequently, high continuers are the
only type of all who showed no decrease of the critical tested habit variables. Regarding
external influences, low and high continuers almost do not show differences. The same
percentage of both had received prompts and public commitments in 2005, and only 12-16%
have lost the prompt until 2006, resulting in 40% who still have the prompt in their house. Only
the percentages of households having been in the monitoring group showed a slight difference

Why do people stop using SODIS? 109
– only 32% of high continuers have been in the monitoring group compared to 48% of low
continuers.
Summarizing, low continuers differ from high continuers only for intention, the habit
factors and in consequence, low continuers treat 13% less water with SODIS. Interestingly, low
continuers compensate 10% of not using SODIS with boiling water instead. This is an
interesting and sensible combination of the target and an alternative behavior, which was also
found for high continuers, who still boil 42% of their water. Boiling instead of using SODIS was
of course already observed for relapsers, who boil significantly more of their water than
continuers (72%). However, in case of low continuers, the combination of SODIS and boiling
leads to the advantage that almost no untreated water is consumed anymore (only 6%). For
high continuers it can be assumed that the behavioral level of SODIS is not increasable
anymore, because a part of the daily water consumption will always be boiled water due to its
use in tea and coffee. Nevertheless, it cannot be concluded that both, low and high continuers,
have reached a stable state of healthy water consumption, because of the characteristics of the
crucial behavioral factors.
The strong differences between low and high continuers for intention and habit factors
indicate that low continuers may not yet have reached such a stable level of using SODIS (and
complementing it with boiling). Particularly critical is the sometimes only small difference to the
high relapsers, which suspects that although low continuers for the time being are above the
formerly described threshold with their habits, and therefore perform the behavior, they may as
well easily fall below, and would sooner or later stop using SODIS. Underpinning this
assumption, a negative development between the third and fourth panel has already been
observed for forgetting and dissonance, and this development is suspected to continue with
time.
Low continuers cannot be related to Fuchs’ flucturer, because it was not measured if they
had been constantly using SODIS between the third and fourth panel, or of irregularities have
occurred. Moreover, Fuchs does not describe his continuer types with psychological factors, he
only mentions the degree of regularity as a criterion.
Placing low continuers within the behavior change process, they are clearly situated in
the action phase. To prevent low continuers from becoming high relapsers, the same
interventions are indicated as already mentioned for high relapsers. Although forgetting,
dissonance and perceived habit of low continuers are still more in favor of using SODIS than for
high relapsers, they could need some strengthening. Cognition intensity and social factors are
equally low for both, low continuers and high relapsers, anyway.
High continuers actually do not indicate much need for improvement and seem to be in
the stable last stage of the behavior change process: they have a maximum level of intention
and high values for habit variables, and have been stable since the third panel. According to
Fuchs, high continuers are the classic continuers who start a behavior and simply continue.
However, relating back to previous assumptions of the habit phase, the high value of cognition

Why do people stop using SODIS? 110
intensity indicates that even high continuers cannot yet be viewed as finally being ‘save’ from
relapses. The high degree of cognition intensity is only necessary during the process of
establishing a new habit, because then it prevents early relapses as it has been observed for
the relapsers. However, the goal is to establish a behavior as truly habitual and mostly
automatic, and then only low cognitive resources would be necessary (Oullette & Wood, 1998;
Tobias, 2007, p.101). Obviously, this goal has not yet been reached for high continuers. One
could argue that low continuers instead are the ones that already are on the way to the fully
habitual behavior, because their cognition intensity got lower. However, the higher degree of
forgetting in combination with a lower dissonance and a lower perceived habit excludes this
explanation, because if forgetting is still prevalent, dissonance must be high to reduce forgetting
(under the assumption that the goal is not to forget SODIS), and the perceived habit should be
much stronger. Only if the behavior does not get forgotten anymore, then no more dissonance is
needed. In the situation of high continuers, it is recommended to keep track if they keep
showing the same stability, and to intervene only in case of changing behavioral indicators.
Interventions per se on almost habitual continuers are not recommended, because this could
lead to an externalization of already internalized motivations, or even to reactance. In the case
of the present study, where different continuer and relapser types live in the same community, it
is recommended to try to motivate high continuers to become some sort of role model and
opinion leader to support spreading of SODIS behavior to the other types. This would not be an
explicit intervention on high continuers, but would still ensure continuance of SODIS use due to
the newly acquired function.
CONCLUSION & LIMITATIONS
The presented approach of not only characterizing relapsers and continuers as such, but
looking for differences also within these two groups has proven to produce some very valuable
insights. The placement of different subtypes along a theoretical model of the behavior change
process gives additional hints of critical points that have to be considered when future
interventions are designed to get relapsers back to use SODIS and to prevent continuers from
relapse. Particularly interesting in this context is the finding that within relapsers and within
continuers differences are partly larger than between certain subtypes of relapsers and
continuers, which implies quite different approaches for relapser subtypes and continuer
subtypes. Another valuable finding is the fact that all types have more or less had equally high
levels at the third panel, and therefore it should be generally possible to find appropriate
interventions for all. Furthermore, the results indicate that for all types, interventions should
rather aim at habit formation and social support than on more information about SODIS or
persuasion on certain convictions or beliefs as it is often done.

Why do people stop using SODIS? 111
A clear limitation of this analysis is the missing data of what happened between the two
analyzed time points. Only the time point of stopping SODIS use and reasons were assessed
retrospectively with open questions. More measurement time points with shorter time intervals
would probably have provided a better insight into what actually happened in those seven
months between the two measurements. However, applying questionnaires itself would have
been an intervention and maybe relapser would not have been observable in the same ‘natural’
pattern as it was possible now.


Chapter 3
Influences of prompts and public commitments
CONTENTS Abstract...........................................................................................114 Introduction.....................................................................................115 Prompts ....................................................................................115 Public commitment ...................................................................116 The modes of operation of prompt and public commitment ....116 Behavior – uptake or intensity? ................................................119 The uptake model.....................................................................120 The behavior intensity model ...................................................120 Methods ..........................................................................................121 Results............................................................................................122 Influences on SODIS uptake ....................................................122 Study I ................................................................................122 Study II ...............................................................................125 Influences on the quantity of water disinfected with SODIS
(Study II) .............................................................................129 The modes of operation of prompts and public
commitments (Study II) ......................................................131 The prompt model ..............................................................132 The public commitment model ...........................................134 Discussion ......................................................................................135 SODIS uptake...........................................................................135 Quantity of water disinfected with SODIS ................................137 The modes of operation of prompts and public commitment ...137 Direct influence paths of prompts and public
commitments................................................................137 The structure of the behavioral model and indirect
influences of prompts and public commitments .................138 Conclusion......................................................................................141 Limitations & Outlook......................................................................142
Influences of prompts and public commitments 114
ABSTRACT
This chapter investigates the effects of the interventions prompt and public commitment
on SODIS behavior. SODIS behavior will be divided into the uptake process and then, once
people started using SODIS, the determinants of the quantity of consumed SODIS water will be
investigated. It is assumed that the interventions show direct effects on SODIS uptake.
Furthermore, other situational variables such as communication activities, monitoring and
demographic characteristics were also included to control for them. Quantity of SODIS water
was first tried to be explained directly with the same variables, however, it was already
hypothesized that SODIS water quantity would be influenced by psychological behavior-near
factors. Perceived habit, implementation intention, commitment and an alternative behavior
(untreated water consumption) were employed to explain SODIS water quantity over time.
For the calculation of the SODIS uptake model, data from studies I and II was used.
SODIS water quantity was only measured in detail in Study II.
Results show that the applied interventions, prompt and public commitment, were able to
increase chances for people to start using SODIS. For the prompt, stable long term effects
could be shown. Directly after the intervention phase, the interventions were most effective in
influencing SODIS uptake. The quantity of water treated with SODIS was better explained with a
model involving indirect influences of the interventions via behavior-near factors. It was found
that the prompt influences implementation intention and perceived habit directly and both of
these factors in turn influence SODIS behavior intensity. The influence path for public
commitment was somehow different. Public commitment only influenced implementation
intention directly, which then influenced perceived habit, which in turn influenced SODIS
behavior. Commitment turned out to be an unreliable predictor. The alternative behavior
consuming untreated water was reduced down to the point where it could not be included in the
model calculation anymore.
It is argued that on implementation intention both interventions operate in a similar way:
activation of the goal behavior and initiation of planning processes that lead to an
implementation intention that is related to the target behavior. Perceived habit was only directly
influenced by the prompt, because the public commitment did not fulfill the precondition of
acting directly as a reminder on habit: it was not placed where the behavior was to be executed
and it contained too little information. Instead, the implementation intention evoked by the public
commitment manifested itself in the habit.
Finally, some limitations like the small sample size, the sometimes low number of people
who actually received the interventions or the time difference between measurements are
discussed.
Keywords: prompt, public commitment, perceived habit, implementation intention, solar water
disinfection, intervention

Influences of prompts and public commitments 115
INTRODUCTION
In this chapter, the effects of the applied behavior supporting techniques will be studied in
detail. In both studies, prompts and public commitments had been applied. They were chosen
for various reasons: First, prompt and public commitment are expected to function in a generally
similar way, but nevertheless have interesting differences: a prompt is a passive technique
aimed exclusively at the individual, whereas a public commitment is more active and above all a
social technique (Mosler & Tobias, 2007a). Second, both prompt and public commitment, are
fairly well studied regarding their design, applicability and effectiveness. Third, both are easily
applicable to the setting of a developing country. In the next parts, studies that have
investigated the effects of prompts and public commitments on behavior are presented. Then
the modes of operation of prompts and public commitments are outlined, and two behavioral
models are developed.
Prompts
Prompts are external memory aids, understood contrary to internal memory aids (e.g.
mental rehearsal; Tobias, 2007). They point out to an individual that a certain behavior has to
be executed in a specific moment (Mosler & Tobias, 2007a). Hence, well-designed prompts
should refer to both aspects, i.e. what has to be done and when it must be done (Tobias, 2007).
Usually, prompts are designed as posters, stickers or signs with a request to execute a specific
behavior. In order to function as a memory impulse, a prompt should be noticeable, situated
where it is highly visible, and it should be comprehensible to the target population, which
behavior is requested to be performed (Tobias, 2007).
There has been vast evidence that prompts are effective in influencing behavior. They
have been successfully applied to increase recycling behavior (e.g. Hopper & McCarl-Nielsen,
1991), seat belt use (e.g. Cox, Cox & Cox, 2005; Johnston, Hendricks & Fike, 1994), to reduce
littering (e.g. Baltes & Hayward, 1976; Hansmann & Scholz, 2003; Reiter & Samuel, 1980) and
to minimize the number of graffiti attacks (Craw, Leland, Bussell, Munday & Walsh, 2006). In his
meta-analysis, De Young (1993) concluded that a prompt can be an effective memory aid.
Some studies, however, yielded little (Witmer & Geller, 1976) or no effects of prompts on
behavior (Geller, 1981). One reason may be that prompts often contain not only a request for a
specific behavior, but additional information on the consequences of the behavior or other
persuasive messages (e.g. Geller, 1981). The effects of prompts could therefore be confounded
with other intervention effects. Furthermore, these persuasive messages could also have been
less accepted by subjects than a simple request for executing a behavior. In general, for a
prompt to be effective, it seems to be crucial that it is formulated in a way that avoids reactance
(Brehm, 1966) and that it is located at the place where the behavior is intended to be performed
(Hopper & McCarl Nielson, 1991). Practical advantages of prompts are their easy application to

Influences of prompts and public commitments 116
a whole population, the low production costs compared to other interventions and the high
acceptability by all different kinds of target groups (Thyer & Geller, 1987).
Public commitment
A commitment is an oral or written promise of an individual or group to perform a certain
behavior (Abrahamse, Steg, Vlek & Rothengatter, 2005; DeLeon & Fuqua, 1995). There are two
forms of commitment: private and public. Commitment is private, if the promise to execute the
behavior is given privately, whereas public commitment includes the announcement of the
pledge to the community. In the review of Dwyer and colleagues (1993), public commitment
yielded increases in recycling behavior (Wang & Katzev, 1990; Burn & Oskamp, 1986) and
energy conservation (Shippee & Gregory, 1982; Katzev & Johnson, 1983). Mosler, Gutscher
and Artho (2001) successfully used public commitment during a driving speed reduction
campaign.
A public commitment can be implemented in different ways. The names of persons, who
committed themselves, can for example be published on a notice board or in a local newspaper
(Shippee & Gregory, 1982). Burn and Oskamp (1986) used sticker, which people put on their
front doors containing the information about the behavior they promised to show. This strategy
implicates that the favored behavior is visible for the environment and therefore can be
observed by the public. Also De Young (1993) comments in his meta-analytic review that public
commitment can be a very effective intervention technique. It is rated as very reliable and
initiates a fast behavior change. Most notably, this strategy enhances sustainable changes
(Schultz, Oskamp & Mainieri, 1995).
The modes of operation of prompt and public commitment 8
The mode of operation of prompts and public commitments comprises different aspects,
namely accessibility and implementation intentions, perceived habit, the felt commitment, and
social norms. These factors (except for social norms) can be described as 'behavior-near'
factors, because according to the stage models of behavior change they are post-intentional
factors acting at the habit stage of the model and are directly preceding behavior (for a detailed
description of the behavior change process, see chapter 1). In contrast, pre-intentional factors
can be called behavior-distant factors. The behavior-near factors and social norms, which are
relevant for the present analysis, as well as the hypothesized influences of prompt and public
commitment on these factors, will be described in the following.
Accessibility and implementation intentions. A prompt can simply remind a person to
perform a certain behavior. During this process, prospective memory is supported and 8 This part of this chapter is in preparation for publication: Huber, A. C., Tamas, A., Mosler, H.-J. & Meyer, B. (paper in preparation). The modes of operation of prompts and public commitment: A field study in Bolivia.

Influences of prompts and public commitments 117
accessibility of the behavior is increased. Several studies have shown the positive effect of a
prompt on the performance of the prospective memory (Einstein & McDaniel, 1995; Ellis, 1996;
Mäntylä, 1996). These positive performance effects are already visible in childhood (Meacham
& Colombo, 1980). Also, De Young (1993) reasoned that a prompt gets effective the moment it
is displayed due to activation processes. Therefore, it can very fast enable a behavior
performance, however, the moment the prompt is removed, the effect may also decrease very
fast. So, prompts can function as a cue stimulus and increase the accessibility of a specific
behavior. If, in addition, the prompt is interpreted by the individual as a request to perform the
behavior, a positive implementation intention develops (Tobias, 2007). Sheeran and colleagues
have investigated the connection between goal activation, implementation intention and
behavior performance (Sheeran, Webb & Gollwitzer, 2005; Sheeran, Milne, Webb & Gollwitzer,
2005). They found evidences that implementation intentions only show effects on behavior if the
target behavior was activated before. It was also shown that participants who formed an
implementation intention significantly required less time to perform the action expressed in the
intention in comparison to participants without an implementation intention. Furthermore, they
could prove that the effect is even stronger when the target behavior was activated by priming
the participants. There was no effect found when the behavior was not at all activated.
Additionally, Aarts, Dijksterhuis and Midden (1999) found out that with the formation of an
implementation intention the mental accessibility of a situational cue stimulus (i.e. a prompt) is
increased and this simplifies again the activation of the favored behavior.
Not only the prompt, but also the public commitment can affect the strength of
implementation intentions. Gollwitzer (1999) stated that a commitment to a behavior is required
to form an implementation intention. In other words, the target person has to feel committed
before she/he can express an implementation intention. Creating a commitment is exactly what
a public commitment does: urge the participants to commit themselves to show a certain
behavior. Therefore, the requirement to subsequently form an implementation intention is given.
Moreover, Gollwitzer (1999) showed within his research that a strong commitment adds power
to the relation between implementation intention and behavior. Therefore, it is important to
emphasize that the target group needs to stick to the planned behavior instead of leaving a
broad tolerance to perform the action (Gollwitzer, 1999). A public commitment also influences
the process of planning a behavior and planning is an important requirement to form an
implementation intention (Dahlstrand & Biel, 1997; Tobias, 2007).
Habit. A habit is a goal-oriented behavior with the characteristic that it is shown
automatically when the situation occurs (Aarts & Dijksterhuis, 2000a; Bargh & Gollwitzer, 1994).
It is important to note that a habit is not an automatic behavior, as for example inborn reflexes.
According to Aarts and Dijksterhuis (2000b), the most important difference is that a habit is goal-
oriented, which means that a certain behavior has repeatedly lead to a successful goal
achievement. Many researchers have found a strong effect of habit on behavior choices in their
studies (e.g. Bamberg, 1996). Already Triandis (1977, 1980) incorporated habit to explain

Influences of prompts and public commitments 118
behavior in his “model of the attitude-behavior relation”. In this model, he claims that the
stronger a habit of a particular behavior, the higher the probability that a person acts in a certain
way. Also Oullette and Wood (1998) state that habits can arouse a behavior with minimal
cognitive cost.
Due to its ability to act as a situational stimulus, prompts can directly influence habit.
Situational stimuli easily activate the accessible mental structures of future behavior, and lead to
the initiation of a behavior without a deliberate evaluation of the decision or a planning process
(Aarts et al., 1998). Consequently, prompts can initiate a habit. Dahlstrand and Biel (1997)
define sub-steps, which an individual has to pass to change a certain habit. The first step is the
activation of the relevant action. The authors assume that the stronger and more precisely the
target behavior is activated, the more likely a habit is generated. Prompts are so-called cue
stimuli which, when they are placed accurately, catch people’s eyes every day. Due to the daily
observation of the prompt and its presented information, people get primed to the target
behavior. Therefore, a constant activation of the goal takes place, which encourages the
formation of a habit. To achieve such an ongoing and constant impact, a good prompt should
neither loose its topicality nor its material quality (De Young, 1993). However, one has to be
aware of habituation effects. Two studies of Goschke and Kuhl (1993, 1996) reported no effects
of prompts, probably due to habituation to the constant presence of the prompt.
Also the intervention strategy public commitment can affect behavior via habit. In
various field studies, public commitments were operationalized with posters that were displayed
outside houses (e.g. Mosler & Tobias, 2007b; Inauen, 2007). Since the poster is visible for the
participants, for example every time they enter the house, the public commitment helps them to
remember the behavior. Through this daily confrontation, the public commitment can, like a
prompt, act as an external cue stimulus, activate the relevant behavior, and initiate a habit
(Aarts et al., 1998; Dahlstrand & Biel, 1997).
Social norms. When prompts are displayed in public, chances are higher that a target
person performs the requested behavior if other persons already performing the behavior are
present. Aronson and O'Leary (1982-1983) found that while being alone, only 20% of the people
followed the request of the prompt, whereas with the presence of one other positive model
already 50% performed the behavior and with two models present two thirds complied with the
request. Private prompts are not expected to be related to social influence.
The effect of publicity that was shown with the previously mentioned study makes the link
to the functioning of public commitments. According to DeLeon and Fuqua (1995), a public
commitment leads to negative social consequences if the commitment displayed in the public is
not converted into actual behavior. It is expected that due to social pressure, the external norm
gets internalized by the individual. So, public commitment acts like a strong internal control and
is therefore seen as an explicit pledge to a certain behavior (Katzev & Pardini, 1988). A
particular effect of a public commitment is that persons will perceive others’ commitments. If
behavior execution of others is hard to observe, public commitments will facilitate the generation

Influences of prompts and public commitments 119
of external ideal norms, which may then influence behavior selection processes through the
cognitive component.
Commitment. Heckhausen (1991) defines commitment as a bond with the goal of an
actor. A person acts self-committed if an action or decision is enunciated. The willingness to
show the behavior increases even more when the person’s intention is expressed publicly
(Wenninger, 2000). As the underlying mechanism, it is assumed that individuals form
implementation intentions due to commitment (Cialdini, 2001). It is argued that commitment
affects planning processes, out of which implementation intentions emerge (Tobias, 2007). As
soon as a person feels committed, the chances are higher that a situational cue stimulus like a
prompt can urge the person to act (Mosler & Tobias, 2007b). It is assumed that a certain initial
level of commitment already develops, when the procedure of handing over the prompt is
designed in a way that it has to be explicitly accepted into the household by the target person
(as it was done in our studies). Another mechanism of influencing behavior via commitment is
the emergence of dissonance. If a person feels committed to a certain behavior, but does not
act accordingly, cognitive dissonance should develop (Brehm & Cohen, 1962; Heckhausen,
1991). According to Festinger's theory of cognitive dissonance (Festinger, 1957), the individual
will seek reduction of dissonance either via behaving consistently with the commitment or via
rejection of the activated goal. In the case of voluntary public commitment, it is not expected that
a person will reject the goal behavior he/she has committed him/herself to beforehand. So, it is
most likely that the felt commitment induced by the public commitment positively influences the
behavioral outcome, either via the dissonance mechanism or via implementation intentions. For
the intervention public commitment, it is assumed that the felt commitment is even stronger due
to the normative aspect of the commitment, especially when the target behavior can be easily
observed.
Behavior – uptake or intensity?
In the previous section, the effects of prompt and public commitment directly on behavior or via
the behavior-near factors on behavior were described. Now, a closer look will be taken on the
dependent variable behavior. As already described in the general introduction about stage
models of behavior change, the decision to try out a behavior is often seen as the end point of
the motivational phase, where problem awareness and positive attitudes were developed (TTM;
Prochaska & DiClemente, 1983; IDP; E. M. Rogers, 2003; HAPA; Schwarzer, 2008). In many
stage models, action and maintenance are separate stages. It is therefore assumed that the
underlying processes of the uptake of a behavior (action) and the continuous performance
(maintenance) are different. Therefore, the analysis looks separately into the uptake of the
behavior and its predictors on one hand, and the behavior intensity and its predictors on the
other hand.

Influences of prompts and public commitments 120
Figure 18. The SODIS uptake model.
The uptake model
The impact of prompts and public commitment on the uptake will be investigated using a
very straightforward model where the effect of the interventions on SODIS use is directly
investigated, without difficult underlying moderation of behavioral variables. This is to get an
impression, whether behavior actually changed amongst those people who had received a
prompt or public commitment in comparison to those who did not. No internal psychological
factors were included in this analysis. Only other situational influences were included, to have at
first a simple estimation of the direct impacts of the interventions prompt and public commitment
when taking into account all other activities, namely the communication activities and the
monitoring. Additionally, demographic variables were included in this model to see if some of
the effects on behavior are moderated by any of the stable demographic characteristics. The
final uptake model is displayed in Figure 18.
The behavior intensity model
As it was already described in the part on the modes of operation of prompt and public
commitment, the two interventions operate on the stages of behavior execution and habit
formation of the postulated behavior change model. Therefore, a model including the described
factors implementation intentions, perceived habit and commitment will be tested. Although it
was stated that prompts and public commitment also operate via social norms, these will not be
included in the model. Norms are known to be a rather pre-decisional factor and to display
themselves via behavioral intentions (Ajzen, 1991; for empirical evidence e.g. Bamberg et al.,
2003; Michie, Dormandy, French & Marteau, 2004; Kaiser & Gutscher, 2003). Apart from the
psychological behavior-near factors already described, there exist always one or more
alternatives to a certain behavior. Maybe specific alternative behaviors exist, but there is at least
always the possibility to not perform the target behavior. According to Mosler and Tobias
Prompt
Public commitment
No. of received communication channels
Monitoring
Demographic characteristics
SODIS non-use vs. SODIS use

Influences of prompts and public commitments 121
(2007b), the performance of a specific behavior not only depends on the preference of the
behavior, but also which alternative behaviors are remembered by the target person. This
implicates that an alternative behavior can operate as a distraction from the target behavior if it
is remembered first. Hence, the repeated performance of an alternative behavior must have a
negative influence on the execution of the target behavior. Of course, the alternative behavior is
also determined by all the factors that apply for the target behavior (implementation intentions,
habit etc.). However, for investigating the target behavior itself and the modes of operation of
interventions that were designed to influence the target behavior and its behavior-near factors
(and not of the alternative), it is assumed to be sufficient to include only the alternative behavior
itself as the valid final manifestation of all its preceding factors.
Finally, a certain behavior and its determining factors do not develop out of the air, they
often depend on their past status. Therefore, the modes of operation of prompt and public
commitment will be investigated taking into account previous dispositions of the behavior and its
behavior-near predictors. Particularly the direct influence of past on current behavior has been
investigated by several studies and past behavior has been found to be a predictor of the future
behavior (Ajzen, 1991; Bagozzi, 1981; Bentler & Speckart, 1979; Fredricks & Dossett, 1983; see
Ouellette & Wood, 1998, for a meta-analytic review). Additionally, it is assumed that past
behavior via habit influences future behavior, because repeated performance of a behavior
leads to habituation (Ronis et al., 1989). However, contradicting evidence was found by a study
of Bamberg et al. (2003), who did not find the mediating effect of habit between past and future
behavior. In the same study, also the direct relation between past and future behavior was not
found in the case of an intervention between the two time points. In the following model both
possibilities will be tested.
The final model is displayed in Figure 19.
METHODS
The effects of the interventions on the uptake of SODIS will be investigated using
available data from both studies. The data from all measurements that were taken after an
intervention period will be analyzed separately for each time point.
The effects of the interventions on the quantity of SODIS use will be analyzed using data
from Study II of the two measurements which had taken place after an intervention phase. The
behavioral model will also be calculated with these data.
Study procedures, the interventions prompt and public commitments, participants'
characteristics as well as operationalizations are already described in the overall Methods
section of this thesis.

Influences of prompts and public commitments 122
Figure 19. Model of the mode of operation of prompts and public commitment on SODIS behavior intensity.
RESULTS
The section examining the effects of prompts and public commitments consists of the two
parts mentioned already in the introduction: SODIS uptake and quantity of use. First, with binary
logistic regressions the effects of prompts and public commitment on the uptake of SODIS were
calculated. As dependent variable served the dichotomous SODIS use variable (SODIS non-
use vs. SODIS use). Second, with a linear regression on SODIS use quantity, the direct effects
of prompts and public commitment were tested. In a last analysis, the two models of the mode
of operation of prompts and public commitments on SODIS behavior intensity were tested using
path analysis.
Influences on SODIS uptake
This part investigates the direct effects of the prompt and the public commitment on
SODIS uptake. The dependent variable is SODIS non-use (0) vs. SODIS use (1).
Study I
The effects of prompts and public commitments were tested using a binary logistic
regression on the dependent variable SODIS behavior (non-use vs. use). Main independent
Implementation intention 2
Perceived habit 2
Commitment 2
Alternative behavior 2
Commitment 1
Implementation intention 1
Perceived habit 1
Quantity of SODIS water 2
Alternative behavior 1
Quantity of SODIS water 1
Prompt / Public commitment

Influences of prompts and public commitments 123
variables were whether a household had received a prompt or a public commitment. The
interaction of both interventions could not be tested for the second and third panel, because
only very few households had actually received both interventions together during one
intervention time point (second panel N=5, third panel N=16), resulting in one cell with 0 cases
and some cells having very low frequencies for the crosstabulation prompt x public commitment
x SODIS use. Further important predictors of SODIS behavior that could not be ignored were
the communication activities, which were entered for simplicity only as the number of perceived
communication channels, and the monitoring. The model of the fourth panel is slightly different
to those of the second and third panel9. Here not only the current situation was of interest and
entered as independent variables (still having a prompt or public commitment, communication
channels perceived between third and fourth panel), but also what had happened before
(having had a prompt, public commitment and their interaction, number of communication
channels perceived until the third panel).
The main predictors of SODIS use, prompt and public commitment, were entered first into
the analysis (block 1). In a second block, number of communication channels and monitoring
were entered. The reason was to separate the effects on behavior in terms of explained
variance and significance of the contribution (chi-square statistics) of the interventions from the
rest. Additionally, it was controlled for demographic variables (age, education, persons per
household, children below 5 years, gender, job yes/no, and place (periurban vs. rural)). These
seven variables were only entered into the model in case a significant influence was found. This
was realized with a stepwise forward procedure. The reason to do so was the rather low number
of cases in some of the models and the resulting risk to dilute the main effects with entering too
many predictors into the models. Only households with a long questionnaire were included into
the analysis, because only very few of the households with short questionnaires had actually
received prompts and public commitments. For panel 4 – because then only long questionnaires
got applied – those households were excluded who had had only short questionnaires before.
First, descriptive statistics are displayed in Table 15, followed by the results of the
regression Table 16.
The descriptive statistics show that at each time point a higher percentage of SODIS users have
prompts in their house. For public commitment this is only true for the third panel. During the
active phase of the Study I (panels 2 and 3), SODIS user have heard from more channels about
SODIS, a higher percentage is in the monitoring group, SODIS users have lower education, and
a higher percentage of them lives in the rural area, all in comparison to the SODIS non-user.
Additionally, in the third panel, a lower percentage of SODIS users have a job compared to the
non-users. This still tends to be true for the fourth panel; additionally, SODIS users are more
likely to be female. Regarding all other indicators, SODIS users and non-users do not differ from
each other during the fourth panel.
9 The fourth panel of Study I was measured after a seven months promotion-inactive period of time. For the detailed design of Study I, see general methods chapter.

Influences of prompts and public commitments 124
Table 15. Descriptive statistics of Study I. Received interventions, other activities and demographic variables separately for SODID non-user, SODIS user and the entire sample. Study I, Panels 2, 3 and 4.
Time Indicator SODIS non-
user SODIS user
Total Test of significance
between non-user & user
N 127 106 233 2nd Panel Prompt (% yes) 21% 65% 41% χ²(1)= 45.83 *** Public commitment (% yes) 6% 11% 8% χ²(1)= 2.60 Prompt & Public commitment (% yes) 0% 4% 2% χ²(1)= 4.88 * No. of comm. channels (M / SD) 0.91 / 0.23 2.08 / 1.02 1.45 / 1.06 F (1; 231)= 101.60 *** Monitoring (% yes) 13% 42% 27% χ²(1)= 25.00 *** Age (M / SD) 37 / 15 39 / 14 38 / 15 F (1; 231)= 1.48 Education (M / SD) 7.8 / 4.5 6.1 / 4.7 7.0 / 4.7 F (1; 231)= 7.40 ** Persons per household (M / SD) 5.0 / 1.9 5.1 / 2.0 5.1 / 1.9 F (1; 231)= 0.18 Children < 5 years (M / SD) 1.1 / 1.0 0.9 / 1.0 1.0 / 1.0 F (1; 231)= 1.63 Gender (% women) 91% 91% 91% χ²(1)= 0.00 Job (% yes) 38% 31% 35% χ²(1)= 1.13 Place (% rural) 6% 23% 13% χ²(1)= 14.70 ***
N 68 210 278 3rd Panel Prompt (% yes) 9% 34% 28% χ²(1)= 16.50 *** Public commitment (% yes) 6% 29% 23% χ²(1)= 15.39 *** Prompt & Public commitment (% yes) 0% 7% 5% χ²(1)= 5.13 * No. of comm. channels (M / SD) 0.54 / 0.63 0.96 / 0.94 0.86 / 0.89 F (1; 276)= 11.64 ** Monitoring (% yes) 12% 61% 49% χ²(1)= 50.69 *** Age (M / SD) 37 / 15 38 / 14 38 / 14 F (1; 276)= 0.15 Education (M / SD) 8.8 / 4.8 6.9 / 4.7 7.4 / 4.7 F (1; 276)= 7.90 ** Persons per household (M / SD) 5.1 / 2.1 5.2 / 2.0 5.1 / 2.0 F (1; 276)= 0.15 Children < 5 years (M / SD) 0.9 / 1.1 1.0 / 1.0 1.0 / 1.0 F (1; 276)= 0.74 Gender (% women) 90% 93% 92% χ²(1)= 0.97 Job (% yes) 51% 28% 34% χ²(1)= 12.54 *** Place (% rural) 3% 16% 13% χ²(1)= 7.62 **
N 92 98 190 4th Panel Prompt before (% yes) 59% 62% 61% χ²(1)= 0.25 Public commitment before (% yes) 32% 38% 35% χ²(1)= 0.81 Prompt & PC before (% yes) 29% 34% 32% χ²(1)= 0.41 Prompt now (% yes) 27% 45% 36% χ²(1)= 6.45 * Public commitment now (% yes) 3% 9% 6% χ²(1)= 2.81 (*) Prompt & PC now (% yes) 3% 7% 5% χ²(1)= 1.43 No. of comm. channels before (M / SD) 3.22 / 2.01 3.58 / 1.76 3.41 / 1.89 F (1; 188)= 1.80 No. of comm. channels now (M / SD) 0.24 / 0.45 0.16 / 0.39 0.20 / 0.43 F (1; 188)= 1.50 Monitoring before (% yes) 52% 46% 49% χ²(1)= 0.74 Age (M / SD) 39 / 14 39 / 13 38 / 14 F (1; 188)= 0.00 Education (M / SD) 7.4 / 4.9 7.5 / 4.9 7.4 / 4.9 F (1; 188)= 0.01 Persons per household (M / SD) 5.1 / 2.0 5.5 / 2.0 5.3 / 2.0 F (1; 188)= 2.30 Children < 5 years (M / SD) 0.9 / 0.9 0.9 / 1.0 0.9 / 0.9 F (1; 188)= 0.04 Gender (% women) 88% 95% 92% χ²(1)= 2.89 (*) Job (% yes) 40% 29% 34% χ²(1)= 2.86 (*) Place (% rural) 16% 11% 14% χ²(1)= 1.04
Note: *** p<.001, ** p<.01, * p<.05, (*) p<.1. PC = Public commitment.
The logistic regressions show that at the time point after the first intervention (second
panel), households having a prompt in the house have a significant 158%10 increased chance to
10 This percentage is calculated based on the Exp(B) value of the logistic regression. The value Exp(B) equals to: odds after a unit change of the predictor (e.g. prompt: yes=1) / original odds before unit change of the predictor (e.g. prompt:

Influences of prompts and public commitments 125
use SODIS compared to those households without a prompt (Exp(B)=2.58). The public
commitment also has a positive effect and increases the chance to use SODIS by 70%
(Exp(B)=1.7). However, this value is not significant, probably mainly due to the fact that there
are only 19 households who actually received a public commitment until the second panel. As
expected, number of perceived SODIS communication channels and the monitoring also show a
significant influence on SODIS use probability. None of the demographic variables show an
influence. The overall explained variance of the model is 49%, of which prompt and public
commitment contribute 29%. The classification for both groups, non-user and user, is correct in
>50% of the cases with an overall of 79% correctly classified cases.
After the second round of interventions, the influence of the prompt on SODIS use is
about the same as after the first round of interventions. The chances to use SODIS with a
prompt were increased by 147% compared to not having a prompt (Exp(B)=2.47). However, this
value only shows a tendency to significance (p=.08). Stronger than the prompt, the public
commitment significantly raises the probability of using SODIS by 243% (Exp(B)=3.43). Again,
number of perceived SODIS communication channels and the monitoring show a strong
influence, as it was expected. Of the demographic variables, education becomes significant with
a small negative value, which means having one year more education makes a household 17%
less likely to use SODIS (Exp(B)=0.93). The overall explained variance of the model is a bit
lower than in the previous model (37%), with prompt and public commitment contributing the
major part (25%). Classification is still correct for both SODIS behavior groups in >50% of the
cases; overall 81% are correctly classified.
After the seven months without activities (fourth panel), 69 families still owned the prompt
they previously received, but only 12 still had the public commitment. Whether a prompt or
public commitment had been received during the intervention phase in 2005, does not have an
influence on current SODIS use. The important factor is (at least for the prompt), whether the
household still has it or not. Still having the prompt raises the probability of using SODIS with
almost the same strength as before (Exp(B)=2.46) and is the only significant predictor in the
model of the fourth panel. Consequently, the overall explained variance of SODIS uptake is only
9%. Interestingly, classification is still >50% correct for both SODIS behavior groups with an
overall correct classification of 60%.
Study II
The same analysis as for Study I was then calculated with the data from Study II. Here
we only have two measurement points after an intervention had taken place: the third and the
fourth panel (see description of study design, chapter Methods).
no=0). The interpretation is as follows, given an Exp(B) value of 2.58 for the predictor prompt: The chance of a household that has a prompt of also using SODIS are 2.58 times higher than the chance of a household that does not have a prompt at home (adapted from Field, 2005, p. 241). The Exp(B) value can also be transformed into a percentage: (Exp(B)-1)*100. Then the value of 2.58 translates into: The chance of a household that has a prompt of also using SODIS is increased by 158%.

Influences of prompts and public commitments 126
Table 16. Effects of prompts and public commitment. Binary logistic regression on SODIS use. Study I, Panels 2, 3 and 4.
95% C.I. for Exp(B)
Time Included B SE (B) Exp(B) Lower C.I. Upper C.I.
Block 1: Method=enter 2nd Panel Prompt 0.95 0.38 2.58 * 1.24 5.39 Public Commitment 0.53 0.57 1.70 0.56 5.19 Note block 1: ΔR²=0.29 (Nagelkerke). Model Δχ²(2)=54.40, p<.001.
Block 2: Method=enter Number of communication channels 1.37 0.25 3.94 *** 2.42 6.42 Monitoring 0.78 0.40 2.18 * 1.00 4.76 Note block 2: ΔR²=0.20 (Nagelkerke). Model Δχ²(2)=50.58, p<.001.
Block 3: Method=forward
Age, education, persons per household, children < 5 years, gender (masculine=low), having a job, place (periurban=low): not significant
Constant -2.84 0.39 0.06 *** Note final model: N=233, R²=0.49 (Nagelkerke), Classification 79% correct. Model χ²(4)=104.98, p<.001.
Block 1: Method=enter 3rd Panel Prompt 0.90 0.51 2.47 (*) 0.91 6.75 Public Commitment 1.23 0.59 3.43 * 1.08 10.92 Note block 1: ΔR²=0.25 (Nagelkerke). Model Δχ²(2)=41.23, p<.001.
Block 2: Method=enter Number of communication channels 0.42 0.21 1.51 * 1.00 2.29 Monitoring 2.07 0.43 7.93 *** 3.39 18.53 Note block 2: ΔR²=0.10 (Nagelkerke). Model Δχ²(2)=34.21, p<.001.
Block 3: Method=forward
Age, persons per household, children < 5 years, gender (masculine=low), having a job, place (periurban=low): not significant
Education -0.08 0.03 0.93 * 0.87 0.99 Note block 3: ΔR²=0.02 (Nagelkerke). Model Δχ²(1)=4.92, p=.027.
Constant 0.36 0.35 1.43 Note final model: N=278, R²=0.37 (Nagelkerke), Classification 79% correct. Model χ²(5)=80.36, p<.001.
Block 1: Method=enter 4th Panel Prompt before -0.06 0.51 0.94 0.35 2.54 Public Commitment before 0.22 0.97 1.24 0.19 8.26 Prompt x PC before -0.46 1.02 0.63 0.09 4.64 Prompt now 0.90 0.41 2.46 * 1.11 5.44 Public Commitment now 0.72 0.76 2.06 0.47 9.06 Note block 1: ΔR²=0.07 (Nagelkerke). Model Δχ²(5)=9.48, p=.091.
Block 2: Method=enter No. of communication channels before 0.12 0.10 1.13 0.93 1.36 No. of communication channels now -0.46 0.42 0.63 0.28 1.43 Monitoring before -0.46 0.41 0.63 0.28 1.42 Note block 2: ΔR²=0.02 (Nagelkerke). Model Δχ²(3)=4.25, p=.235.
Block 3: Method=forward
Age, education, persons per household, children < 5 years, gender (masculine=low), having a job, place (periurban=low): not significant
Constant -0.28 0.34 0.76 Note final model: N=190, R²=0.09 (Nagelkerke), Classification 60% correct. Model χ²(8)=13.73, p=.089.
Note: The presented estimates (B and exp(B) statistics, significance level), are those of the final model for each time point. Dependent variable SODIS Non-Use(0) vs. SODIS Use(1) at each time point. *** p<.001, ** p<.01, * p<.05, (*) p<.1. C.I. = Confidence interval. All available cases at each time point were included (without short questionnaires).

Influences of prompts and public commitments 127
Main independent variables were again whether a household had received a prompt or a
public commitment. No interactions could be calculated, because during the third panel it was
not intended to have prompt and public commitment distributed together (and it also did not
occur, Table 17). During the fourth panel, it occurred that 20 households had received both,
prompt and public commitment. However, the distribution of the crosstabulation prompt x public
commitment x SODIS use did not allow for the test of the interaction (too many (almost) empty
cells). Actually, the test of the direct effect of the public commitment on SODIS uptake would
also not have been possible for the fourth panel, because one cell of the crosstabulation public
commitment x SODIS use had no cases (see Table 17, 4th panel: 0% of the SODIS non-user
had a public commitment). So, basically if a household had a public commitment, the odds of
that household also using SODIS were 100%. However, this made it impossible to estimate the
Exp(B)11. Therefore, one case that had a public commitment was manually set to be a SODIS
non-user. Other predictors used in the analysis were the same as for Study I: number of
communication channels, monitoring and demographics (age, education, persons per
household, children below 5 years, gender). Having a job and place were not necessary,
because everyone was in one way or the other busy with farming and all lived in the same type
of area (rural). As before, the first block entering was the two interventions, followed by a forced
entry of number of communication channels and monitoring, and at last the demographics block
entered using a stepwise forward procedure (reason as described above).
First, descriptive statistics are displayed in Table 17, followed by the results of the
regression in Table 18.
For both time points a higher percentage of the SODIS users than of the non-users have
a prompt or a public commitment in-/outside their house. Also, SODIS users have heard from
more channels about SODIS. For the third panel, additional differences between SODIS user
and non-user are that SODIS user are a bit younger, show a trend to have higher education and
have more children below 5 years of age. In the fourth panel, SODIS user families show a trend
to have a higher number of persons per household.
The results of the regressions show an equal influence of prompt and public commitment
at the time of the third panel. The prompt increases the chance of SODIS use compared to
having no prompt by 178% (Exp(B)=2.78), and the public commitment by 103% (Exp(B)=2.03),
both significant. Additionally, the number of communication channels becomes a highly
significant and strong predictor, and raises chances of SODIS use by 236% per additional
communication channel (Exp(B)=3.36). Monitoring does not have a significant influence on 11 The calculation of the Exp(B) which is the core information of the logistic regression, follows this equation: Δodds=Exp(B)=odds after a unit change of the predictor / original odds before unit change of the predictor Now, both odds values entering this equation are calculated from: probability of the event (e.g. SODIS use) / probability of the non-event (e.g. SODIS non-use) Consequently, if the probability of the non-event equals 0, the last equation cannot be calculated (more details see Fields, 2005, pp. 240). Therefore, one can set one case to the non-event to have a non-zero probability of the non-event. This does not change the overall pattern of the relation between event (SODIS use) and predictor (intervention), but allows estimation of the logistic regression.

Influences of prompts and public commitments 128
Table 17. Descriptive statistics of Study II. Received interventions, other activities and demographic variables separately for SODID non-user, SODIS user and the entire sample. Study II, Panels 3 and 4.
Time Indicator SODIS
non-user SODIS user
Total
Test for significance between non-user & user
N 212 253 465 3rd Panel % SODIS of total water consumption 0% 60% 33% - Prompt (% yes) 5% 13% 9% χ²(1)= 9.53** Public commitment (% yes) 8% 21% 15% χ²(1)= 14.34*** Prompt & Public commitment (% yes) 0% 0% 0% − No. of communication channels (M / SD) 0.65 / 0.77 1.53 / 0.94 1.13 / 0.97 F (1; 463)= 117.68*** Monitoring (% yes) 7% 10% 9% χ²(1)= 1.98 Age (M / SD) 46 / 16 42 / 16 44 / 16 F (1; 463)= 5.54* Education (M / SD) 2.5 / 3.1 3.1 / 3.6 2.8 / 3.4 F (1; 463)= 3.63(*) Persons per household (M / SD) 5.2 / 6.0 5.1 / 2.4 5.1 / 4.4 F (1; 463)= 0.50 Children < 5 years (M / SD) 0.6 / 0.8 0.8 / 0.9 0.7 / 0.9 F (1; 463)= 6.87** Gender (% women) 67% 74% 71% χ²(1)= 2.37
N 74 362 436 4th Panel % SODIS of total water consumption 0% 57% 47% - Prompt (% yes) 4% 17% 15% χ²(1)= 8.52** Public commitment (% yes) 0% 22% 19% χ²(1)= 20.34*** Prompt & Public commitment (% yes) 0% 6% 5% χ²(1)= 4.28* No. of comm. channels (M / SD) 1.57 / 1.23 2.15 / 1.46 2.06 / 1.44 F (1; 434)= 10.40** Monitoring (% yes) 7% 10% 9% χ²(1)= 0.73 Age (M / SD) 46 / 18 44 / 16 44 / 16 F (1; 434)= 0.87 Education (M / SD) 2.3 / 3.1 2.9 / 3.2 2.8 / 3.2 F (1; 434)= 2.28 Persons per household (M / SD) 4.3 / 2.4 5.3 / 4.8 5.1 / 4.5 F (1; 434)= 3.39(*) Children < 5 years (M / SD) 0.6 / 0.9 0.8 / 0.9 0.7 / 0.9 F (1; 434)= 2.24 Gender (% women) 77% 70% 71% χ²(1)= 1.41
Note: *** p<.001, ** p<.01, * p<.05, (*) p<.1.
SODIS use, neither does any of the demographic variables. Explained variance of the behavior
is very low when only prompt and public commitment are in the model (8%) and only rises to an
acceptable level (30%) when number of communication channels and the monitoring were also
included in the model. Overall classification is good with 83%, however, of one SODIS behavior
category only 52% are classified correctly (which is only 2% above chance).
The model of the fourth panel looks a bit different. The same predictors become significant, but
the influence strengths changed. Prompts now increase the chance for SODIS use by 362%
(Exp(B)=4.62) and public commitment even by a tremendous 1783% (Exp(B)=18.83). However,
as was mentioned before, the calculation of the odds for public commitment was only artificially
made possible and the confidence interval of Exp(B) ranges from 2.56 up to 138.37, which
reflects the high uncertainty of the Exp(B)-value for public commitment. Therefore, to be on the
safe side, the lower confidence interval value (2.56) is used for further interpretation.
Number of communication channels still is a significant predictor, but not such an
important one anymore, and raises the chance of using SODIS by 37% per communication
channel (Exp(B)=1.37). As for the third panel model, again neither monitoring nor the
demographic variables show any significant influence. Explained variance even for the

Influences of prompts and public commitments 129
Table 18. Effects of prompts and public commitment. Binary logistic regression on SODIS use. Study II, Panels 3 and 4.
95% C.I. for Exp(B)
Time Included B SE (B) Exp(B) Lower C.I. Upper C.I.
Block 1: Method=enter 3rd Panel Prompt 1.02 0.46 2.78 * 1.13 6.84 Public Commitment 0.71 0.34 2.03 * 1.04 3.96 Note block 1: ΔR²=0.08 (Nagelkerke). Model Δχ²(2)=28.77, p<.001.
Block 2: Method=enter Number of communication channels 1.21 0.15 3.36 *** 2.51 4.50 Monitoring -0.65 0.45 0.52 0.22 1.25 Note block 2: ΔR²=0.22 (Nagelkerke). Model Δχ²(2)=90.48, p<.001.
Block 3: Method=forward Age, education, persons per household, children < 5 years, gender (masculine=low): not significant
Constant -1.20 0.18 0.30 *** Note final model: N=465, R²=0.30 (Nagelkerke), Classification 73% correct. Model χ²(4)=119.25, p<.001.
Block 1: Method=enter 4th Panel Prompt 1.53 0.66 4.62 * 1.26 17.00 Public Commitment 2.94 1.02 18.83 ** 2.56 138.37 Note block 1: ΔR²=0.13 (Nagelkerke). Model Δχ²(2)=34.67, p<.001.
Block 2: Method=enter Number of communication channels 0.32 0.11 1.37 ** 1.11 1.69 Monitoring 0.03 0.57 1.03 0.33 3.17 Note block 2: ΔR²=0.03 (Nagelkerke). Model Δχ²(2)=9.96, p=.007.
Block 3: Method=forward Age, education, persons per household, children < 5 years, gender (masculine=low): not significant
Constant 0.60 0.24 1.83 * Note final model: N=436, R²=0.16 (Nagelkerke), Classification 83% correct. Model χ²(4)=44.64, p<.001.
Note: The presented estimates (B and Exp(B) statistics, significance level) are those of the final model for each time point. Dependent variable SODIS Non-Use(0) vs. SODIS Use(1) at each time point. *** p<.001, ** p<.01, * p<.05, (*) p<.1. PC = Public commitment. C.I. = Confidence interval. All available cases at each time point were included.
final model is low (16%), with the predictors prompt and public commitment contributing most to
it (13%). Correct classification is not possible, all cases were classified into the same category.
Influences on the quantity of water disinfected with SODIS (Study II)
In the previous part, the effects of prompts and public commitment on the uptake decision
of SODIS have been analyzed, now it also is important to know, how much SODIS water is
disinfected once a person uses SODIS, and how this was influenced by the interventions. The
criterion for how much water is disinfected is expressed in the percentage of SODIS water on
the total drinking water consumption. Only data from Study II can be analyzed, for Study I, water
consumption was not asked in such a detailed way.
First, a linear regression on the percentage of SODIS water on total water consumption
was calculated. The same predictor variables as for the logistic regression on SODIS non-use

Influences of prompts and public commitments 130
Table 19. Effects of prompts and public commitment. Linear regression on % SODIS water on total water consumption. Study II, Panels 3 and 4.
95% C.I. for B
Time Included stand. β B SE (B) Lower C.I. Upper C.I.
Block 1: Method=enter 3rd Panel Prompt .01 0.01 0.05 -0.09 0.10 Public Commitment .06 -0.03 0.04 -0.11 0.04 Note block 1: ΔR²=0.003. Model ΔF(2)=0.41, p=.663.
Block 2: Method=enter Number of communication channels .03 0.01 0.02 -0.03 0.04 Monitoring -.05 -0.04 0.05 -0.14 0.06 Note block 2: ΔR²=0.003. Model ΔF(2)=0.38, p=.686.
Block 3: Method=forward Age, education, persons per household, children < 5 years, gender (masculine=low): not significant
Constant .60 *** 0.03 0.55 0.66
Note final model: N=253, R²=0.006, adj. R²=-0.01. Model F(4)=0.34, p=.813. Collinearity statistics: all Tolerance values >0.80, all VIF values <1.25
Block 1: Method=enter 4th Panel Prompt .12 * 0.08 0.04 0.00 0.15 Public Commitment .09 (*) 0.05 0.03 -0.01 0.11 Note block 1: ΔR²=0.04. Model ΔF(2)=6.96, p=.001.
Block 2: Method=enter Number of communication channels -.11 * -0.02 0.01 -0.04 0.00 Monitoring .05 0.05 0.05 -0.05 0.14 Note block 2: ΔR²=0.02. Model ΔF(2)=3.12, p=.046.
Block 3: Method=forward Education, children < 5 years, gender (masculine=low): not significant Age -.19 *** 0.00 0.00 0.00 0.00 Persons per household -.12 * -0.01 0.00 -0.01 0.00 Note block 3: ΔR²=0.04. Model ΔF(2)=8.56, p<.001.
Constant 0.74 *** 0.05 0.64 0.84
Note final model: N=362, R²=0.10, adj. R²=0.08. Model F(6)=6.300, p<.001. Collinearity statistics: all Tolerance values >0.75, all VIF values <1.34
Note: The presented estimates (stand. β, significance level and B statistics) are those of the final model for each time point. Dependent variable: % SODIS water on total water consumption at each time point. *** p<.001, ** p<.01, * p<.05, (*) p<.1. PC = Public commitment. C.I. = Confidence interval. All available cases that used SODIS at each time point were included.
vs. use (prompt, public commitment, number of communication channels, monitoring, and
demographics) were used. Like before, they entered the regression in three blocks. Only
households that used SODIS were included in the analyses. The results of the regression are
presented in Table 19.
The first regression, for the third panel, does not contribute at all to explain the variance
of the percentage of SODIS water on the total drinking water consumption. None of the entered
predictors becomes significant; also the overall model is not significant.
The regression for the fourth panel looks a little better with 10% explained variance of the
dependent variable and a significant model. Prompts show a significant, but not very strong

Influences of prompts and public commitments 131
influence on percentage of consumed SODIS water (β=.12). The influence of the public
commitment is negligible (β=.09). Number of communication channels shows a slight negative
influence (β=-.11), which is a bit bewildering. Of the demographic variables, interestingly age
and persons per household show a negative and significant influence (β=-.19 and -.12,
respectively).
Overall, it is expected that other variables would be much better predictors of the intensity
of the SODIS behavior and that the interventions prompt and public commitment did not
influence behavior intensity directly, but via those variables. Therefore, in the following the
models of the mode of operation of prompts and public commitments on SODIS behavior
intensity will be tested.
The modes of operation of prompts and public commitments (Study II)
Of the total sample, 179 cases were analyzed. These subjects were the ones who took
part in both, the third and the fourth panel, and used SODIS at both points in time. Using SODIS
was a necessary criterion for the analysis of the mode of operation of the interventions, because
the behavior-near constructs require using SODIS to answer the questions concerning the
behavior-near variables properly.
Before calculation of the models, descriptive statistics are displayed. Table 20 shows all
means, standard deviations and correlations for all model variables for both points of time,
before and after the interventions took place. The target behavior, namely to disinfect the
drinking water with SODIS, is already relatively high before the interventions and reaches a
mean of 0.63 (SD=.24). The results also indicate a slight increase of the behavior-near
constructs after the interventions, except for the alternative behavior, which decreases as
expected, indicating that after receiving an intervention less people consume untreated water.
Correlations between the measures within one time point are higher than those between the two
time points. The table also shows that at the time of the second survey, 20% (35) of the
households had the prompt displayed in their house and 29% (52) families had hung up the
public commitment on their front door.
The now following two models were developed with the SIMPLIS command language and
path analyses were calculated using LISREL 8.54 (Jöreskog & Sörbom, 2003). A path analysis
is a method of structural equation modeling to test theoretical relationships between observed
(measured) variables. Within a path model, it is possible to analyze direct and indirect effects of
variables (Jöreskog & Sörbom, 1993). Due to the fact that the applied questionnaire data had
ordinal scales, the weighted least squares algorithm for polychoric correlations including the
asymptotic covariance matrices was employed (Jöreskog & Sörbom, 1993, 1996).

Influences of prompts and public commitments 132
Table 20. Means (M), standard deviations (SD) and correlations for variables before (1) and after (2) the interventions. N=179. Study II, Panels 3 and 4.
Correlations
Variables M SD SB1 PH1 II1 C1 AB1 SB2 PH2 II2 C2
SODIS behavior (SB) 1 .63 .24 . Perceived habit (PH) 1 .62 .25 0.59 . Implementation intention (II) 1 .75 .21 0.49 0.60 . Commitment (C) 1 .40 .33 0.05 0.35 0.33 . Alternative behavior (AB) 1 .28 .26 -0.53 -0.49 -0.57 -0.01 . SODIS behavior (SB) 2 .61 .22 0.07 0.11 0.10 0.19 -0.04 . Perceived habit (PH) 2 .63 .21 0.05 0.06 0.12 0.09 -0.07 0.71 . Implementation intention (II) 2 .75 .19 -0.05 0.02 0.06 0.13 -0.01 0.58 0.58 . Commitment (C) 2 .54 .27 -0.18 -0.05 0.00 0.19 0.08 0.49 0.50 0.48 . Alternative behavior (AB) 2 .19 .25 -0.07 -0.05 -0.18 0.02 0.20 -0.71 -0.65 -0.50 -0.42 Prompt (P) 20% Public commitment (PC) 29% Note: SODIS behavior, habit, implementation intention, commitment and alternative behavior range from 0 to 1. Prompt and public commitment is the proportion of households that received a prompt or public commitment between the third and fourth panel. Grey correlations are not significant at p<.1 level.
During the analyses, the error variances of the independent variables were allowed to
covary in order to obtain an acceptable model fit. We are aware of the fact that this procedure
deviates from a strict hypothesis-testing approach. However, we deem it appropriate to use an
explorative strategy employed in the present analyses. Jöreskog and Sörbom (2003) state that
even though error covariances do not exist by default, error variances are allowed to covary if
covariations can be explained adequately. In the present analyses, the four error variances of
the independent variables habit, strength of implementation intention, strength of commitment,
and alternative behavior are likely to covary, because the constructs were measured with the
same instrument and all are behavior-near constructs.
The fit between the data and the path model is expressed with five fit indices: chi-square
(χ2), degrees of freedom (df), root mean square error of approximation (RMSEA), goodness-of-
fit (GFI) and adjusted goodness-of-fit index. A good model fit is assumed if the χ2 is not more
than three times as high as the df (compare Schermelleh-Engel, Moosbrugger & Müller, 2003,
for heuristics on the assessment of model fit). The RMSEA indicates the degree of difference
between the predicted and the obtained covariance structures. Usually, a RMSEA value should
be less than .08 to be acceptable. The GFI estimates the amount of explained variance by the
model, and the AGFI adjusts this estimate. Both of these values should be over .95 to indicate a
good fit (see also Browne & Cudeck, 1993; Jöreskog & Sörbom, 1996).
The prompt model
At first, the model was calculated for the intervention prompt. Unfortunately, satisfactory
model parameters for the original hypothetical model (see Figure 19) were not reached. For this
reason, the model had to be readjusted. On that account, LISREL suggested further paths that

Influences of prompts and public commitments 133
Figure 20. The mode of operation of prompts over two points in time: Path model with standardized path coefficients. Study II, Panels 3 and 4.
Note: The numbers 1 and 2 refer to the time point 1 = before the intervention (3rd panel of Study II), 2 = after the intervention (4th panel of Study II). * = not significant. Explained variances: R2
(Quantity of SODIS water 1)=.59, R2(Quantity of SODIS water
2)=.56, R2(Habit 2)=.81, R2
(Implementation intention 2)=.56, R2(Commitment 2)=.63. Model fit indices: χ2=41.74, df=21, RMSEA=.076, GFI=
.99, AGFI=.98. increased model fit. The model with the best fit being as similar as possible to the hypothesized
model is displayed in Figure 20. To reach adequate model parameters, the variable alternative
behavior 2 (after the intervention) had to be eliminated, as well as the path from behavior 1 to
behavior 2. The error covariances of the independent variables habit 1, implementation intention
1, commitment 1, and alternative behavior 1, which are not displayed in favor of simplicity,
ranged from -.66 to .71.
All relations between the variables are shown in Figure 20, which displays the model
parameters for changing behavior with a prompt. All path coefficients, except those with an
asterisk, display a significant t-value at the 5% level. The amounts of explained variances of the
dependent variables as well as the model fit indices are stated in the bottom line. The model fit
is found to be satisfactory according to the above-mentioned criteria.
As can be seen in Figure 20, 59% of the behavioral variance at the first measurement
time can be explained. The behavior before the intervention is significantly affected by habit
(.67), the alternative behavior (-.32), and by the strength of commitment (-.24). Contrary to the
hypothesis, the strength of commitment has a negative effect on behavior. Furthermore, the
model shows that the strength of implementation intention does not show a significant influence
Implementation intention 2
Perceived habit 2
Commitment 2Commitment 1
Implementation intention 1
Perceived habit 1
Quantity of SODIS water 2
Alternative behavior 1
Quantity of SODIS water 1
Prompt
-.32
-.24
-.09*
.67
.89 .78 .71
.14*
.13*
.16
.23
.56
-.01*
.32

Influences of prompts and public commitments 134
on SODIS behavior. As predicted, the SODIS behavior before the intervention positively
influenced the habit after the intervention (.23). The path coefficients between the three
behavior-near constructs from the first to the second measurement time exhibit small values,
and only the path between the first and second strength of implementation intention (.16)
reaches significance.
The intervention technique prompt significantly influenced all three behavior-near
constructs positively as hypothesized: habit 2 (.89), strength of implementation intention 2 (.78),
and strength of commitment 2 (.71). Two of the three variables of the second time point, habit
and implementation intention, affect the target behavior 2 in a positive way (.56 and .32,
respectively). The effect of the commitment 2 on SODIS behavior 2 – after the intervention
prompt – was reduced to -.01 and not significant. The explained variance of the target behavior
after the interventions reached 56%.
The public commitment model
In a second analysis, the model showing the mode of operation of public commitments
was calculated. Again, the originally assumed model as displayed in Figure 19 did not fit to the
data. The model showing the modes of operation of the intervention public commitment also
had to be readjusted. The model that reached the best model parameters and was as similar as
possible to the original model is shown in Figure 21. To reach a better model fit, the public
commitment model also had to be reduced by the constructs alternative behavior 2 and the path
from the SODIS behavior before the intervention to the behavior after the intervention. In
addition to the previous model of the prompt intervention, the commitment 2 after the
intervention had to be eliminated. Furthermore, an extra path between the implementation
intention 2 and habit 2 after the intervention had to be inserted. As in the previous analysis, the
error variances of the independent variables habit, strength of implementation intention,
strength of commitment, and alternative behavior at the first measurement time were set freely
by the program and were allowed to covary. The covariances, again not displayed in favor of
simplicity, reached values between -.66 and .64.
The model fit is found to be good. The goodness-of-fit statistics provide a chi-square of
16.66 with fourteen degrees of freedom. The RMSEA of .033 is below the .05-threshold for a
good model fit. The descriptive indices of overall model fit also indicate a good fit (GFI=.99 and
AGFI=.99).
As for the prompt model, habit shows a significant influence on SODIS behavior 1 before
the implementation of the public commitment (.53). All other behavior-near constructs did not
reach significant influences on behavior at the 5% level for time point 1. Nevertheless, the
explained variance of SODIS behavior 1 reached 57%. Interestingly, behavior 1 did not have a
significant influence on habit 2 after the intervention as it was the case for the prompt model.
The path coefficients between the two remaining behavior-near constructs from the first to the
second measurement time again exhibit small values, and none of the two reaches significance.

Influences of prompts and public commitments 135
Figure 21. The mode of operation of public commitments over two points in time: Path model with standardized path coefficients. Study II, Panels 3 and 4.
Note: The numbers 1 and 2 refer to the time point 1 = before the intervention (3rd panel of Study II), 2 = after the intervention (4th panel of Study II). * = not significant. Explained variances: R2
(Quantity of SODIS water 1)=.57, R2(Quantity of SODIS water
2)=.55, R2(Habit 2)=.55, R2
(Implementation intention 2)=.25. Model fit indices: χ2=16.66, df=14, RMSEA=.033, GFI= .99, AGFI=.99.
In fact, time point 2 is in the case of the public commitment model completely detached from the
predictors of time point 1.
The public commitment affected the strength of implementation intention 2 significantly
(.49), which in turn had a strong influence on habit 2 (.71). Furthermore, habit 2 after the
intervention strongly affected the target behavior 2 (.56). The strength of implementation
intention 2 did not significantly influence the SODIS behavior after the intervention. In all, 55%
of the variance of the target behavior 2 after the implemented public commitment was explained.
DISCUSSION
At first, a brief summary of the results on SODIS uptake and SODIS water quantity will be
presented. The main part of the discussion will then focus on the effects and modes of operation
of prompts and public commitments
SODIS uptake
Throughout the two studies and across almost all measurement points, SODIS uptake
was positively influenced by having a prompt. In Study I and the third panel of Study II, a family
Implementation intention 2
Perceived habit 2
Commitment 1
Implementation intention 1
Perceived habit 1 Quantity of
SODIS water 2
Alternative behavior 1
Quantity of SODIS water 1
Public commitment
-.23*
-.24*
-.16*
.53
.05* .49
.06*
.15*
.05*
.56
.23*
.71

Influences of prompts and public commitments 136
which had a prompt in the house had increased chances of about 150% to use SODIS. In the
fourth panel of Study II, this chance increased to even 360%. Most amazing was to still detect
the influence of the prompt in the fourth panel of Study I, when already seven months of
inactivity had passed. This result is clearly a strong sign in favor of prompts, because a), the
prompt has shown to have the potential to stay a long time in a household (in comparison to the
public commitment, which was reported to be torn down by wind and weather) and b), if the
prompt is there, it also has a proven impact. These results suggest that no habituation has
taken place and the effect did not decrease. Rather, it is assumed that between the prompt and
the behavior SODIS a strong link has emerged and people got primed to the target behavior.
In those cases, where enough public commitments had been actually distributed to
calculate their impact on SODIS uptake (Study I, only panel 3; Study II, panels 3 and 4), they
also exhibited a good influence on SODIS uptake. Chances to use SODIS when a public
commitment was hung outside the house were increased by factor 100 to 250% (most
conservative estimation). Unfortunately, the long term influence could not be estimated (Study I,
panel 4), because not enough public commitments had survived the 7 months interval.
Taken together, prompts and public commitment were able to explain parts of the uptake
behavior. However, the amount of explained variance due to prompt and public commitment
varied quite a bit. In Study I during the active phase, 25 to 30% were explained, in contrast to
the fourth panel after the seven months break where only 7% of the behavioral variance was
explained. In Study II, the part of variance explained by prompt and public commitment never
exceeded 13%, which was only half as much as for Study I. One reason is seen in the
difference of time intervals between the intervention and the measurements. Whereas in Study I
panels 2 and 3 took place between one and three weeks after the intervention phase, in Study II
the interval may have been as long as four months. This would also explain the low value for
Study I, panel 4, because there the interval was seven months. It is assumed that at first the try-
out behavior is quite quickly directly initiated by having a prompt or public commitment. Later on,
other internal factors develop and therefore the direct influence declines.
Further influence on SODIS uptake was as elicited in both studies by the number of
communication channels – one communication channel more from where people had heard
about SODIS increased the chances of using SODIS by the 200 to 300% after the first phase of
interventions, and by approx. 50% after the second phase of interventions. For detailed effects
of the different communication strategies, see chapter 4. The monitoring only in Study I showed
a strong influence on SODIS uptake, chances to be a SODIS user were increased by 100 to
700%. In Study II however, no influence of the monitoring on SODIS uptake was found. Maybe
here the frequency made the difference: in Study I the monitoring had taken place twice a week,
whereas in Study II only once a week. No relevant influence of demographic characteristics was
found.

Influences of prompts and public commitments 137
Quantity of water disinfected with SODIS
The direct investigation of the effects of prompts, public commitments, other activities and
demographic characteristics on SODIS use intensity of those people who had already started
using SODIS showed that the dependent variable, quantity of water disinfected with SODIS,
could not be explained very well. The brief analysis using data of Study II, panels 3 and 4
showed explained variances of 6% and 10%, respectively. Prompt and public commitment
gained only low influence, stronger predictors were actually age and persons per household in a
negative way. Overall, with only external predictors, it could not be explained why some
households treat 100% of their drinking water with SODIS and others only 25%. It is assumed
that prompts and public commitment do not directly influence the behavioral intensity, but elicit
their impact via other, rather internal factors, which will be discussed next.
The modes of operation of prompts and public commitment
As seen in the analysis discussed above and as it was confirmed by the models on the
mode of operation of prompts (Figure 20) and public commitment Figure 21, once a household
has started to use SODIS, no or only low direct influence of prompts and public commitment on
behavior seems to take place. Instead, the influence is mediated by the behavior-near factors.
Direct influence paths of prompts and public commitments
In its final operational model the prompt influences all three behavior-near factors that
were employed to predict behavior intensity as it was hypothesized: habit, implementation
intention and commitment. The prompt influences habit most strongly, because it has the power
to act as a situational cue. A situational cue in turn can activate mental structures of a future
behavior, which can lead directly to a goal performance without any act of planning (Aarts et al.,
1998). A positive influence of the prompt on implementation intention was also found, which
indicates that the target behavior is activated by the prompt and the development of a
corresponding implementation intention is initiated. Furthermore, also the expected influence on
commitment was found in the model. Prompts, as situational stimuli, helped people to
remember the target behavior and therefore seemed to have made them feel more committed to
act.
Public commitment in contrast did only influence implementation intention (less than the
prompt), not habit. As expected, the public commitment poster creates the feeling of being
committed within the target group and therefore an important condition for forming an
implementation intention is given (Gollwitzer, 1999). Moreover, receiving a public commitment
poster influenced certain processes of planning the target behavior and exactly these processes
are required during the action of forming implementation intentions (Tobias, 2007). Now, the

Influences of prompts and public commitments 138
question is why the public commitment poster did not influence peoples’ habit as it was
expected. These expectations were based on the fact that the poster would act similarly to the
prompt, because it was displayed on the front door where it was visible for the family and the
community. However, this effect could not be observed and the public commitment did not seem
to act like a cue stimulus. Possibly, the poster helped people to remember, but failed to provide
the important information on what exactly has to be done (Tobias, 2007). Furthermore, Tobias
(2007) stressed the importance of the place where a prompt is displayed. A prompt seems to be
more influential and helpful for remembering the target behavior if it is presented at the place
where the action itself has to take place. For the example of preparing SODIS, the most
advisable places to display a prompt are the kitchen or the backyard next to the fountain where
the water is normally filled into the bottles. Summarizing, it is assumed that the public
commitment poster was placed wrong and contained too little information about the target
behavior itself in order to operate as a cue stimulus and influence habitual behavior.
In a next step it will be looked at the entire structure of the two models on the modes of
operation of prompts and public commitments, particularly how behavior is influenced by the
behavior-near constructs.
The structure of the behavioral model and indirect influences of prompts and public commitments
At time point 1, confirming the hypotheses, SODIS behavior was very positively
influenced by habit and negatively by the alternative behavior untreated water consumption.
Unexpectedly, commitment showed a negative influence and implementation intention none at
all. At time point 2, SODIS behavior was again very positively influenced by habit, but also
moderately by implementation intention. Commitment on the other hand changed its moderate
negative influence on behavior to no influence after the intervention in the prompt model, and
even had to be eliminated in the public commitment model. The alternative behavior had to be
removed from both models for time point 2.
The constant effect of habit on behavior was expected and had already been repeatedly
reported by other authors (Aarts & Dijksterhuis, 2000b; Ajzen & Madden, 1986; Fishbein &
Ajzen, 1975; Oullette & Wood, 1998).
Regarding the implementation intention, it is assumed that at the first time point the
participants had not yet formed a correct implementation intention towards the goal behavior.
Although implementation intention already at time point 1 shows a rather high value (Table 20),
it seems that people were neither already committed nor their goal – to do SODIS – was
correctly activated (Gollwitzer, 1999; Triandis, 1977, 1980). As expected, the prompt activated
the correct goal and helped to remember which behavior had to be performed (Sheeran, Webb

Influences of prompts and public commitments 139
& Gollwitzer, 2005). Further, the target group at this point in time felt more committed than in the
beginning before the intervention (M1=0.40 vs. M2=0.54, compare Table 20). The correctly
activated goal and the increased commitment towards the target behavior have probably led to
the formation of a goal oriented implementation intention, which then affects the actual behavior
(time point 2; Gollwitzer, 1993, 1999).
In case of the public commitment, which also had a positive influence on
implementation intention, in contrast to the prompt model, for time point 2 the implementation
intention did not become a significant predictor of the behavior 2. Instead, a new path had to be
introduced into the public commitment model, drawing an influence of implementation intention
2 on habit 2, which has – as already discussed – a positive influence on behavior 2. In other
words, the public commitment provoked a behavior change not directly via habit, but via the
strength of implementation intention that influenced habit. This finding was not expected, but will
be explained in the following. Aarts and Dijksterhuis (2000b), for example, claim that the
process of forming an implementation intention is very similar to the process of developing a
habit (Aarts & Dijksterhuis, 2000a; Bargh & Gollwitzer, 1994). Concerning the formation of an
implementation intention, researchers assume that the mental accessibility of a situational cue
stimulus is increased and consequently simplified (Aarts et al., 1999). The behavior stated in the
implementation intention can also evoke a habit when it is performed repeatedly over time and
with positive results (Oullette & Wood, 1998). It is assumed that in case of the prompt, the path
implementation intention on habit could not emerge due to the already existing direct influence
of the prompt on habit. In case of the public commitment, no direct influence on habit was found
as discussed above. It is assumed that the similarity of the factors, habit and implementation
intention, had to manifest itself differently, namely in the explicit influence of implementation
intention 2 on habit 2.
The negative effect of the strength of commitment on behavior for the first time point will
be discussed next. After analyzing the distribution of these two variables (see Table 21), it is
clear that a great number of families (marked yellow), who disinfect 75% or almost all of their
water with SODIS, do not feel very committed to do so. For these people, a commitment
perhaps indicated a feeling of external obligation. However, since they were already using
SODIS quite intensively, they did not feel externally obliged (and committed), but internally
motivated. Already at time point 1, they showed the behavior due to their own motivation and
not because of an external commitment. Further, it should always be taken into account that it
may be problematic to survey certain psychological constructs in other cultures. Maybe the
participants did not understand the question about feeling committed, or they understood it in a
wrong way.
Although the strength of commitment increased slightly over time, it still did not influence
the target behavior after the intervention in the prompt model and even had to be removed from
the commitment model, because no relation to other variables was found. This finding could
indicate that the other two variables, habit and strength of implementation intention, at time

Influences of prompts and public commitments 140
Table 21. Crosstabulation of commitment 1 and behavior 1, frequencies. Study II, Panels 3 and 4. Target behavior 1: How much SODIS water do you and your family drink? Strength of commitment 1: Do
you feel committed to do SODIS?
(almost) nothing
around 25%
around 50%
around 75%
(almost) 100% Total
no 1 8 5 28 8 50 a little 0 11 18 8 3 40 some 0 7 11 12 5 35
sufficient 0 2 12 16 8 38 a lot 0 1 7 7 1 16
Total 1 29 53 71 25 179
point 2 have together a greater explanatory power on the behavior and therefore exclude the
strength of commitment. Further, it could be supposed that, like at the first measurement time,
the feeling of commitment has a different meaning for this certain target group or was
misunderstood by them.
The removal of the alternative behavior 2 from both models was due to the fact that the
consumption of untreated water decreased and a great percentage (80%) consumed almost no
untreated water at the second time point. However, this does not necessarily mean that the
people were treating more water with SODIS instead. There were still other opportunities to
treat drinking water, for example boiling or chlorinating. However, the participants who still show
the alternative behavior at time point 2 are too few to have an influence on the target behavior
as on behavior 1. As a consequence, the alternative behavior could not be fitted into the model.
Another change to the original model is the elimination of the direct influence of behavior
1 on behavior 2. This elimination indicates that the past behavior collected before the
intervention has no direct effect on the future behavior after the intervention. Only a small
indirect effect of the past behavior on the future behavior via habit remained in the prompt
model. In the public commitment model this relation between time point 1 and 2 did not become
significant. All in all, this is seen to be an effect of the great time difference between the two
surveys (4.5 months) and the promotion activities that had taken place in between12. The same
explanation applies to the low values for the relations between the past and the future values of
the behavior-near constructs. Only in the prompt model the past implementation intention
slightly influenced the future implementation intention. Even though other authors (e.g. Bamberg
et al., 2003) did find stronger influence, they tested pre-intentional (behavior-distant) variables
like attitude, perceived behavioral control and social norm in contrast to the test of behavior-
near constructs as in the present study. Those behavior-distant factors may be more stable
under changing circumstances and therefore a relation over time is more likely to be found.
Moreover, with the present study it was intended to change the behavior-near factors with the
12 The same non-relation has already been observed in chapter 1, see there for a more detailed explanation.

Influences of prompts and public commitments 141
interventions. Therefore, it also seems logical that almost no relation remained between time
point 1 and 2. A strong relation would only make sense in the case of stable situational
circumstances (see also Bamberg et al., 2003).
Summarizing, the explained variances of the final target behavior were 56% in the prompt
model and 55% in the public commitment model, respectively, which are good values.
Concerning the mode of operation of the prompt, it could be shown that the prompt influenced
all three behavior-near factors. Therefore it can be stated that a prompt operates positively on
the formation of a habit and an implementation intention and develops a feeling of commitment
towards the target behavior. Subsequently, the formed implementation intention and habit
evoke the performance of the goal behavior. Thus, the prompt operates simultaneously in two
ways: implementation intention or habit on behavior. The mode of operation of the public
commitment was found to be different. The public commitment seems to initiate an
implementation intention towards the target behavior, but not directly a habit. Instead, the
implementation intention then facilitates the formation of a habit, which then in turn affects the
behavior. So, the public commitment only has one mode of operation: implementation intention
on habit on behavior. The role of the factor commitment, however, remains unclear, see
limitations.
CONCLUSION
It has been demonstrated that the applied interventions prompt and public commitment
were able to increase chances for people moving from a pre-action to an action stage in the
behavior change process, i.e. to start using SODIS. For the prompt, it could be shown that even
on the long term (after 7 months) it was still effective. Directly after the intervention phase the
intervention itself was very dominant in predicting SODIS uptake. After a while, other factors
also seem to become important and the interventions had lower predictive power of SODIS
uptake. When it comes to predicting the amount of water that is treated with SODIS once a
person started using it, prompt and public commitment do not directly contribute to an
explanation anymore. Instead, the influence is more indirect, via the behavior-near factors.
The presented models indicate that the prompts and public commitments operate in
different ways, although both influence the target behavior successfully. Of the three behavior-
near factors investigated, habit, implementation intention and commitment, habit plays the most
central role in influencing behavior before and after the interventions. Only the prompt affected
habit directly, whereas the public commitment operated through the implementation intention
and influenced habit only indirectly. The implementation intention was also influenced by the
prompt and in the prompt model affected the goal behavior directly. So, the prompt shows two
direct ways of influencing behavior: via implementation or habit, whereas the public commitment

Influences of prompts and public commitments 142
has only one, more indirect one, which necessarily involves both factors, implementation
intention and habit. Furthermore, the results of the present study show that both intervention
strategies evoked a decrease of the alternative behavior drinking untreated water, which can
also be seen as a success in terms of reduced chances to contract diarrhea for the targeted
people.
LIMITATIONS & OUTLOOK
Specific limitations for this analysis are the sometimes low number of people who actually
received the interventions. Therefore, for example, it was not possible to estimate the long term
effects of public commitments. Reasons are that intervention materials in our studies are
distributed by field worker in a close-to-normal manner to also test the practicability of the
materials. This routine, however, is very vulnerable to unforeseen complications, and it cannot
be guaranteed that the number of distributed intervention materials reaches the number that
was actually planned and would have been more adequate for statistical analyses. In Study I, it
occurred that in the beginning people liked the prompt a lot more than the public commitment,
because the prompt was a bigger poster and they were allowed to keep it inside (they liked it for
decoration). Only during the second phase of interventions (before the third panel), we
addressed this problem with giving more restrictive instructions to the field workers about where
to distribute which material. Nevertheless, testing the long-term effects failed for the public
commitment, because after 7 months only very few of them were not yet destroyed by wind and
weather. In fact, we were surprised that there were still enough prompts in the houses to
actually run a test on their long-term effects. In Study II, a very disperse area, it was simply
unclear if the families received any material at all, if they used it for a different purpose, lost it or
threw it away. It was simply impossible to control the field workers. For future studies in the field,
it is recommended to plan the distribution of the interventions even better; however, with the
resources we had we already did the most possible.
This insecurity when planning the distribution of intervention materials together with
organizational difficulties particularly in dispersed areas caused another problem: the long time
difference between the panels in Study II. The long interval had a particularly negative effect on
the calculation of the two models on the mode of operation of prompts and public commitments,
because here long-term data was involved. But it simply had to be made sure that there was
actually enough time to have the intervention materials distributed by the field workers, therefore
measurements had not been planned with shorter intervals in Study II.
Particularly disadvantageous for the model calculations on the modes of operation of
prompt and public commitment was the small sample size that was found amongst SODIS user
across two measurement points. One rather unsatisfactory solution to the problem would be to
also include people who do not yet use SODIS. However, this option poses the problem that

Influences of prompts and public commitments 143
one would need to survey habit and commitment of people who do not yet perform the behavior
and would need to foresee or imagine their habit and commitment, which is doubted to produce
valid answers. Increasing the sample size already from the beginning may sound like the
simplest solution, but here the available resources represent a hard limit, since it is not a
question of mailing a few more questionnaires out to addresses taken from the phone book, but
to employ additional interviewers for several weeks.
A further difficulty of the present study is the role of the strength of commitment. After all,
the effects of this construct have remained unclear and it could only be speculated about it.
Thus, it is recommended that further research may operationalize this factor differently and
investigate beforehand in a given setting how this construct is understood.
Despite those limitations, it was possible to demonstrate the potential and also the
problems of prompts and public commitments in the field. It was shown that they were accepted,
and that they have a positive influence, even in the long term. Prompts after all scored a bit
better in the analyses. It is therefore recommended to have either both interventions in
combination (although this effect still has to be investigated) or if this is not possible, to give a
preference to prompts. This recommendation is underpinned by the fact that habit is such an
important factor, but only the prompt influenced it directly. Furthermore, prompts are more
durable, because they are used indoors. In general, the understanding of how intervention
strategies operate may lead to more efficient planning and maybe completely new ideas of how
to improve intervention materials.


Chapter 4
Effects of different communication strategies
CONTENTS Abstract...........................................................................................146 Introduction ....................................................................................147 Methods ..........................................................................................149 Results............................................................................................150 SODIS knowledge ....................................................................150 Knowledge depth......................................................................151 SODIS use................................................................................152 Communication channels .........................................................154 Effects of the interviewer ..........................................................155 Discussion ......................................................................................156 Interpersonal communication ...................................................157 Centralized communication ......................................................157 Limitations.......................................................................................159

Effects of communication strategies 146
ABSTRACT
Three different communication strategies were systematically applied during Study I in the
periurban areas. Two interpersonal strategies had been selected, one using professional
promoters and the other one using local people from the community as opinion leaders. The
third strategy applied was a centralized strategy, namely a health fair, which carries
characteristics of interpersonal and mass communication strategies. Those three approaches
are compared with each other and the control groups. Indicators of the effectiveness of the
communication strategies are SODIS knowledge, SODIS use and effectiveness of the strategies
in reaching people.
Data used for this analysis comes from all four measurement time points of Study I of the
periurban areas. The rural area had to be excluded because the applied communication
strategies were too confounded with each other. The same applies for Study II.
In terms of reaching people and changing their behavior to use SODIS, the strategy of
employing promoters was most successful. Opinion leaders – although less effective – pose a
good potential to stimulate communication between people about SODIS. Working with opinion
leader instead of promoters or a combination of both is rated as being more economic and more
long-term effective. In contrast, the health fair stayed beyond expectations and did not have a
big impact on behavior. Reasons are that only a small portion of the people was reached with
the health fair and it was only a one-time event. Further discussion includes the costs of the
various promotional activities, limitations and some recommendations for future projects.
Keywords: Promoters, opinion leaders, health fair, Bolivia, solar water disinfection

Effects of communication strategies 147
INTRODUCTION 13
An analysis of the few studies available on SODIS promotion shows that the success rate
(percentage of SODIS users) varies greatly. Rainey and Harding (2005) report an adoption rate
of only 9% in the course of a four-month follow-up study, but the promotional effort here was
very limited (one 2-hour training session). In contrast, other studies (Kabra, 2005; Mahmood &
Lodhi, 2005; Moser et al., 2005) report adoption rates of between 40 and 70%. However, the
promotional effort in these studies was comparably high, consisting of multiple strategies
applied simultaneously. The core problem of information about past SODIS promotion activities
is the lack of systematic approaches. In the rare case that an evaluation regarding applied
communication strategies has taken place, the strategies were only evaluated post-hoc, often
various strategies are applied simultaneously, and effects are confounded. But often no
valuable evaluation takes place at all. Until now there is no accordance among practitioners in
the SODIS promotion context, which would be a sensible, economic, and sustainable
combination of communication strategies in a certain cultural background.
During the two studies which are the basis of this thesis, different communication
strategies were applied. However, only Study I was conceptualized as a systematic comparison
of three different communication strategies. In Study II the approach was less systematic and
many different communication strategies were applied simultaneously, so the information would
be too confounded with each other. Therefore, the focus is on the results of Study I. The
communication strategies tested in this study will be presented in the following. They were
derived on the basis of their applicability in the field, integrating what is known from theory and
the field. Taking into account the experiences of our local partners, we found it useful to
supplement the common classification of promotional strategies into mass media and
interpersonal communication channels (e.g. E. M. Rogers, 1995, p. 194) by adding a third
category that we entitled centralized communication.
Classical mass media such as radio or TV are not studied here for two reasons: firstly,
many studies on effectiveness of classical mass media already exist, showing that they often do
not change the actual behavior of the majority of people (e.g. Alcalay, 1983; Griffin & Dunwoody,
2000) and only influence the early adopters of an innovation (Valente & Saba, 1998). Secondly,
from field experiences it is known that personal contact seems to be very important in SODIS
promotion. Therefore, the study concentrated on interpersonal communication and the new
category, centralized communication.
Interpersonal communication channels have a great potential to change behavior
because they allow effective persuasive communication (E. M. Rogers, 1995, p. 18). In addition,
they can change contrary attitudes and encourage implementation intentions due to the process
13 This chapter is accepted for publication: Tamas, A., Tobias, R., & Mosler, H.-J. (accepted). Promotion of Solar Water Disinfection: Comparing the effectiveness of different strategies in a longitudinal field study in Bolivia. Health Communication.

Effects of communication strategies 148
of social exchange (Gierl, 1987). The effectiveness of the social exchange process depends to
a certain extent on the similarity of the exchange partners (homophily; Lazarsfeld & Merton,
1954). Similar social, economic, and educational status between the interaction partners makes
interpersonal communications more effective (E. M. Rogers, 1995, p. 286; Petty & Wegener,
1998). For example, Levy-Storms and Wallace (2003) investigated the promotion of
mammography and found that informal (more homophilous) channels had a greater impact on
implementation intentions and behavior. In the SODIS promotion context, interpersonal
communication is typically realized by heterophilous agents (promoters making household
visits). These promoters have the advantage of being experts in the topic they are promoting,
they can be easily trained to work continuously with their clients, and NGOs usually report high
success rates with them. A disadvantage is the great effort needed to reach people. A way of
realizing homophilous communication is to use opinion leaders (or block leaders; Katz &
Lazarsfeld, 1955), but this approach has never been tested for SODIS promotion. Opinion
leaders are persons from inside a social system (community) with high social status and a high
openness to innovations. Examples of the successful engagement of opinion leaders can be
found in Kelly et al. (1991) on the promotion of AIDS-preventive behavior, or Burn (1991) on the
promotion of recycling. Advantages of working with opinion leaders include, besides more
effective communication, better suitability in dispersed areas where employed promoters are
impractical due to long distances and lack of supervision. Limitations of opinion leaders could be
their 'working' hours and the availability of targeted people (Passanisi, Prout, & Holm, 2001), or
their lower motivation to promote the innovation because of being unpaid. In addition, their
knowledge may not be as profound as that of the promoters, and they are difficult to control
because they work on a voluntary basis. Nonetheless, if the opinion leader approach turned out
to work with SODIS in the field, it would probably give NGOs a very low-cost and low-effort
promotional strategy. Therefore, the opinion leader approach was introduced and tested in
Study I to compare it with the traditional promoters approach. It is expected that the promoters
are very effective in disseminating knowledge and changing behavior. However, effects are only
expected to persist as long as they are actively promoting SODIS. The opinion leaders may
achieve lower and slower changes, because they do not have such an expert status. But in
contrast to the promoters, SODIS should then be embedded more strongly in the social system
and consequently this approach should be more sustainable in the long term.
Apart from classic mass media and classic interpersonal approaches, in the field context
communication strategies are used, which were not clearly classifiable to one or the other
approach. These 'field' strategies hold elements of both approaches, interpersonal and mass
media communication, and have some additional characteristics. These strategies can be best
described as a centralized way of communication and comprise all types of fairs and partly
community reunions. Due to the popularity of fairs, their frequent application (Moser & Mosler,
2008), and because not much is known about the effects of fairs, a health fair as a third
communication strategy was included into the study. The main feature of the new category,
named centralized communication, is the combination of different elements. Similar to mass

Effects of communication strategies 149
communication, one can reach many people at once, but also the persuasive power of the
social exchange process is used during the interpersonal communication that takes place
between the exhibitors and the visitors of the fair. However, the communication is probably
rather brief and in a public context (usually at a central spot in the community, therefore
"centralized communication"). Therefore, the fair is expected to be less effective than household
visits (promoters) or the communication within a social system (opinion leaders). A very
particular characteristic of the centralized communication is that fairs do not take place very
frequently (approximately only once in six months). So unlike any other of the communication
strategies, this is a one-time communication and therefore its effect over time may not be very
strong. The health fair is expected to have an influence on knowledge, but little effect on
behavior. The lower effect on behavior would have two reasons: One, the interpersonal
communication taking place is not expected to be very detailed, and it is therefore less effective;
two, the health fair is only a one-time event. So even if people try out SODIS, this effect is
expected to be weakened quickly with time. An open question is the range of coverage of a
health fair.
Summarizing, two interpersonal promotional strategies, promoters and opinion leaders,
and a centralized communication strategy, health fair, will be systematically compared with each
other and a control group. Measures are the effects on SODIS knowledge, SODIS use and the
achieved coverage of the activities. The following hypotheses can be stated:
(1) Promoters have stronger short-term effects than opinion leaders on SODIS knowledge
and use.
(2) Opinion leaders have stronger long-term effects than promoters on SODIS use.
(3) The health fair has lower effects on SODIS use than both interpersonal strategies,
especially on the long-term.
Additionally, the question whether the health fair has the same or a different coverage
compared to the promoters and opinion leader approaches will be answered.
METHODS
The comparison of the three promotional strategies and the control group will use data
from the periurban areas of Study I, panels 1 to 4. The first three panel measurements reflect
short-term effects whereas the fourth panel reflects long-term effects after an inactive phase. A
detailed description of the study area, the communication strategies as well as all
operationalizations can be found in the overall Methods part.

Effects of communication strategies 150
RESULTS
The demographics do not show any important differences between the four areas
(Methods chapter). Especially important, there is no particular area with permanently the lowest
or highest values. Therefore, the areas are considered as being comparable, but it will also be
controlled for the demographic variables during the analyses.
The main analyses will concentrate on a description of the effects of the different
promotional strategies using the four indicators: percentage of people who knew about SODIS,
depth of SODIS knowledge, adoption rate of SODIS (percentage of users) and communication
channels where people heard about SODIS. The effects of the interviewer will be addressed
separately in the last part of the results section.
SODIS knowledge
Whether people had heard about SODIS or not was investigated by only using those
households that were included in the study since the first panel (consequently, N declines over
time due to drop outs), because the selection criterion for later inclusion was that people had to
know about SODIS. Both types of questionnaires (short and long) contained that information
and were included in the analysis. Within one panel (one point in time), the percentages of the
different areas are compared with pair-wise chi-square tests. For exact and mean percentages,
see Table 22.
The results show, that although it was intended to create similar percentages of people
knowing SODIS before the study with the use of the loudspeaker car, percentages in fact varied
quite a lot between the areas at the time of the first panel. The promoters' area had the lowest
percentage of people who knew SODIS (7%) and differed significantly from all other areas (all
p<.001, χ2(1)>19.1). The other areas (health fair, opinion leaders, and control) had percentages
of between 32% and 51% with one significant difference between health fair and opinion
leaders' area (32% compared to 51%; p=.007, χ2(1)=7.361). Testing for the relation to
demographic variables, we found that the more years of education a person had, the more likely
he or she was to have already heard about SODIS (p<.001, F(1)=29.4). This relation is clearly
reflected by the opinion leader area (most years of education highest percentage of people
knowing SODIS) and the promoters' area (vice versa).
Already at the time of the second panel a ceiling effect occurred, as all areas with
promotional activities had very high percentages of people who knew about SODIS of between
86% (opinion leaders) and 99% (health fair). Only the control area had a significantly lower
value (56%; all p<.001, χ2(1)>19.1). At the end of the active phase at the time of the third

Effects of communication strategies 151
Table 22. Percentages of people knowing SODIS over time for each promotional strategy. Study I, Panels 1 to 4.
1st Panel 2nd Panel 3rd Panel 4th Panel Communication strategy % N % N % N % N
Health fair 32%a 98 99%a 88 99%a 78 100% 50 Promoters 7%b 99 91%ab 74 100%a 66 100% 49 Opinion leader 51%c 90 86%b 85 99%a 79 100% 59 Control 37%ac 104 56%c 93 95%a 83 100% 74 Mean / Total 31% 391 82% 340 98% 306 100% 232
Note: Percentages in one column which do not share the same subscripts differ from each other at least at p<.05 in a pair-wise chi-square test. Since it was necessary to calculate six chi-square tests to assess the differences between all four groups within one panel in a pair-wise way, the corresponding threshold to define the significance p-level was adjusted (Sachs, 1978, p. 369).
panel, almost every household had heard about SODIS and the percentages varied only
between 95% and 100%.
In summary, all promotional strategies were clearly effective in informing people more
quickly compared to the control area.
Knowledge depth
The more qualitative indicator depth of knowledge was analyzed with a General Linear
Model (GLM) for repeated measures. This method allows the simultaneous investigation of
group, time and interaction effects. A drawback is that a GLM model requires complete data
sets, so only cases with data from all four time points were used. Thus, the number of cases
was much lower, but a calculation with the complete dataset (all information available, only long
questionnaires) showed very similar mean values. The finally calculated model contained a total
of 76 cases and included all demographic variables as covariates (age, education, occupation,
number of persons in the household, number of children below 5 years of age in the household,
and gender). Additionally, the number of people a person knows within the same community but
outside the house was included, because having more social contacts could cause a better
knowledge level due to increased exchange possibilities. The development of knowledge depth
over time and for each promotional strategy is shown in Figure 22.
The promotional strategies have a strong direct group effect (p<.001, F(3)=20.2),
whereas time shows a somewhat weaker direct effect on the depth of knowledge (p=.021,
F(3)=3.3). Also, an interaction between both could be observed (p<.001, F(9)=8.2). Of the
demographic variables, only the number of children below 5 years of age showed a slight
significant direct effect (p=.026, F(1)=5.2). None of the demographic covariates showed an
interaction effect with the time factor. Pair-wise comparisons of promotional strategies (post-hoc
Bonferroni method based on estimated marginal means) confirmed what can already be seen in
Figure 22: the health fair and promoters' areas form one group on a generally higher level and

Effects of communication strategies 152
Figure 22. Mean knowledge depth over time and for each communication strategy. Study I, Panels 1 to 4.
0.0
0.2
0.4
0.6
0.8
1.0
1st Panel 2nd Panel 3rd Panel 4th PanelTime
Mea
n de
pth
of S
OD
IS k
now
ledg
e
Health Fair (N=23)
Promoters (N=19)
Opinion Leader (N=15)
Control (N=19)
differ significantly (p<.012) from the opinion leader and control areas, which form a second
group on a lower level. Pair-wise analyses between the four time-points (post-hoc Bonferroni
method based on estimated marginal means) also confirm the visual presumption: the overall
increase of knowledge is highly significant until October 2005 (p<.001), and then the level
remains stable until June 2006.
In summary, quite a high level of knowledge depth was reached after the two months of
promotional activities, and this level remained stable until the fourth panel seven months later.
Although the final level was quite high, clear differences were evident between the promotional
strategies. Whereas the health fair and the promoters almost reached a 'very deep' level, the
opinion leader and control group only achieved a 'deep' level. The late "take off" of the control
and opinion leader groups – the knowledge depth only started to increase remarkably after the
second panel – is especially noteworthy.
SODIS use
The most important aim of the study was – besides informing people about SODIS – to
get people to use SODIS to treat their water. This information was gathered with the long and
the short questionnaires. Table 23 lists the percentages of SODIS users across areas and time.
At the beginning of the study, the opinion leader area had a slightly higher percentage of
SODIS users than the other periurban areas (11% compared to 3% in all other areas), but pair-
wise chi-square tests showed no significant differences. Similar like for the level of knowledge,
at the time of the first panel also for SODIS use a positive relation to the education level existed
(p<.001, F(1)=12.2).

Effects of communication strategies 153
Table 23. Percentages of people using SODIS over time for each communication strategy. Study I, Panels 1 to 4.
1st Panel 2nd Panel 3rd Panel 4th Panel Communication strategy % N % N % N % N
Health fair 3%a 98 14%a 132 48%a 125 39%a 90 Promoters 3%a 99 47%b 88 73%b 81 47%a 74 Opinion leader 11%a 90 33%b 96 62%ab 92 41%a 70 Control 3%a 104 13%a 92 29%c 85 20%b 83 Mean / Total 5% 391 25% 408 52% 383 37% 317
Note: Percentages in one column which do not share the same subscripts differ from each other at least at p<.05 in a pair-wise chi-square test. Since it was necessary to calculate six chi-square tests to assess the differences between all four groups within one panel in a pair-wise way, the corresponding threshold to define the significance p-level was adjusted (Sachs, 1978, p. 369).
After one month of activities, the user percentages of the areas with the various
promotional strategies differed greatly from each other. Promoters produced a good increase to
47% users, and opinion leaders had a more moderate influence and reached 33% users. Only
the health fair resulted in a fairly low percentage (14%). Except for the health fair percentage,
the other two values differed significantly from the control area (p<.01, χ2(1)>10.8), which
reached 13%. The same order of user-percentages as for the second panel was found for the
third panel: the promoters' area had the most users (73%), next was the opinion leaders' area
(62%), which was followed by the health fair area (48%) and the control area (29%). All the
promotional strategy areas, including the health fair area, now differed significantly from the
control area (health fair p=.007, χ2(1)=7.256, the others p<.001, χ2(1)>18.819). Additionally, the
high percentage of the promoters' area differed significantly from the health fair area (p=0.001,
χ2(1)=12.4). In summary, until October 2005 a clear order of the promotional strategies in terms
of SODIS user percentages was visible: the promoters were more effective than the opinion
leaders, which were more effective than the health fair in terms of getting people to start using
SODIS. Interestingly, the control area without any promotional activities also showed a
considerable number of users (29%). This finding will be discussed later.
Now, when looking at user percentages at the fourth panel in June 2006, it can be clearly
seen that quite many people stopped using SODIS. The percentages went down to 39-47% in
the areas and down to 20% in the control area. The differences between the areas of previous
promotional activities and the control area were still significant (health fair p=.008, χ2(1)=7.0;
promoters p<.001, χ2(1)=12.7; opinion leaders p=.005, χ2(1)=7.9; all comparisons with the
control area), but no more significant differences were found in between the areas which
previously had promotional strategies. So, overall the promotional strategies showed their
effects compared to the control area, but there were no differential effects between the various
activities. No relation of SODIS user percentages to the demographic variables were found for
the second, third and fourth panel.

Effects of communication strategies 154
Communication channels
To compare the perceived communication channels with the applied promotional strategy,
communication channels were assessed openly. Table 24 presents percentages of the various
communication channels separately for each promotional strategy and time point. Named
communication channels were the promotional strategies themselves (health fair, promoters
and friends/neighbors to measure opinion leader influence), the loudspeaker car, the
interviewers and other sources (radio, TV, institutions, schools). Unsurprisingly, the interviewers
were named by nearly everyone, but often other sources were also named. Therefore, the
percentage of those who communicated only with the interviewers (and no other source) was
included in Table 24. Additionally, the percentages of households which had no SODIS related
communication at all were also included.
Asking where people had first heard about SODIS during the first panel had the main
goal of checking if the loudspeaker car did have an impact or not. The results show that people
had heard about SODIS mainly from other people, from radio or TV or a range of other sources.
The loudspeaker car as the source of the first-time-knowledge was only mentioned on average
by 8% (N=31), although there were still almost 70% of the people who had never heard about
SODIS before the study (and theoretically would have been the target population for the
loudspeaker car). Since the amount of people who had heard about SODIS from the
loudspeaker car was so small, we refrained from investigating the effects of the loudspeaker car
on SODIS knowledge depth or SODIS use. Basically, the loudspeaker car did not have any
remarkable influence. The other sources named during the first panel will not be further
interpreted, because the time span was about the last 10 years before the study and this
information therefore can not be viewed as reliable.
To judge the effectiveness of the promotional strategies, it is of interest to know how
many people heard about SODIS via the applied promotional strategies. The percentages after
one month (second panel) showed relevant differences: while in the health fair area only 20%
had heard of SODIS during the health fair, in the promoters' area 81% had contact with the
promoters. In the opinion leaders' area, 46% of the people heard about SODIS via friends or
neighbors. Communications within the social network in this area were clearly the result of the
opinion leaders' work, because such communications were very low in the other areas (2-3%).
While 46% was a good result for the opinion leaders as the least controllable promotional
strategy, only 20% for the health fair was surprisingly low. One would expect such a big event to
reach more people in the community. So it is not surprising that among the areas with a
promotion campaign, the health fair area had the highest percentage with no communication at
all (27%) as well as the highest percentage of those who had heard about SODIS only from the
interviewers (45%). After the second month of promotional activities (third panel), the
percentages relating to communication channels showed results similar to those after the first
month: the promoters worked very constantly and reached 73%, and the communications due to

Effects of communication strategies 155
Table 24. Percentages of communication channels over time and for each promotional strategy. Study I, Panels 1 to 4.
Communication Channel
Time Communication strategy
Loud-speaker
Car Health
Fair Pro-
moter
Friend/ Neigh-
bor Other
Source
only Inter-
viewer None N
Health Fair 5% - - 21% 22% - 57% 98 Promoters 4% - - 7% 7% - 84% 99 Opinion Leader 16% - - 41% 34% - 31% 90
1st P
anel
Control 8% - - 20% 24% - 54% 104Health Fair - 20% 3% 2% 5% 45% 27% 132Promoters - 1% 81% 3% 16% 10% 8% 88 Opinion Leader - 2% 0% 46% 18% 27% 15% 96
2nd
Pan
el
Control - 5% 0% 2% 2% 65% 26% 94 Health Fair - - 0% 2% 7% 32% 60% 125Promoters - - 73% 1% 6% 2% 23% 81 Opinion Leader - - 0% 39% 24% 10% 38% 92
3rd
Pan
el
Control - - 0% 2% 1% 9% 88% 85 Health Fair - - - 8% 3% - 89% 90 Promoters - - - 0% 0% - 100% 74 Opinion Leader - - - 7% 3% - 90% 70
4th
Pan
el
Control - - - 1% 1% - 98% 83 Note: Calculation of percentages is based on the total number of interviewed households per area. Percentages are rounded off. Empty cells mean that this type of communication channel did not exist for that time point and promotional strategy area. Bold numbers mark the communication channels that were applied and therefore expected for the corresponding promotional strategy area and time point. Multiple answers were possible; row sums may therefore exceed 100%.
opinion leaders showed that 39% learnt about SODIS within their social network. Only in the
health fair area almost no communication channels were named, because – as planned – the
health fair was not repeated a second time. So, once again we found the highest percentage of
people without communication (60%) and only interviewer communication (32%) in the health
fair area. Not much communication took place in the control area: most people mentioned no
communication channel or only the interviewer.
When the fourth panel took place seven months later, almost no communication channels
were named in all areas. As expected, no activities had taken place, but no communication had
occurred within the social network either. For the opinion leader area it was a rather
disappointing fact to realize that although we had managed to trigger communication within the
social network, nothing remained after seven months.
Effects of the interviewer
The effects of the interviewer shall be investigated in more detail, because of the rather
large amount of households that joined the sample during the second panel. In addition – and
probably the more urgent matter to clarify – there is a considerable amount of households who
have heard about SODIS only from the interviewers. Firstly, the new households from the
second panel will be used in comparison to the households who were in the study since the

Effects of communication strategies 156
beginning to compare for sensitization due to interviewing. Secondly, the households who had
heard about SODIS from the interviewer only and those who mentioned other sources will be
compared with each other.
First, it is distinguished between first (old households) and second panel (new
households) as entry points into the study. At the second panel, an analysis of variance
revealed a slightly but significantly higher knowledge depth of the old households compared to
the new households (Mold=0.54 [0.36], Mnew=0.35 [0.37], N=192, p=.001, F(1)=11.97). This
difference did not exist anymore at the time of the third panel (Mall=0.77 [0.22], N=192). In the
case of SODIS use, chi-square tests were calculated, comparing percentages of SODIS user at
each time point separately for the two groups, new and old households. Already in the second
panel, no significant difference could be found, both groups had a similar percentage of SODIS
users of about 25% (N=408).
The second analysis compared those households who heard from SODIS only from the
interviewer (onlyInt) with those who mentioned other sources as well (other). Households who
did not mention any communication channel are not included in this analysis. For the second
panel, knowledge depth was clearly higher for those having heard about SODIS not only from
the interviewer, but from other sources as well (MonlyInt=0.64 [0.37], Mother=0.40 [0.31], N=153,
p<.001, F(1)=18.1). At the time of the third panel, knowledge depth was equally high for both
groups (Mall=0.79 [0.21], N=136). Looking at SODIS user percentages, only 18% of the
households who had only heard from the interviewer about SODIS also applied SODIS, in
contrast to 42% SODIS user in the "other" group (N=329, p<.001, χ2(1)>21.7). Also for the third
panel the same picture was found: households who heard only from the interviewer were less
likely to use SODIS (fonlyInt=56%, fother=79%, N=179, p=.001, χ2(1)>10.5).
Summarizing, the households who were one month longer in the study showed a slight
sensitization effect on SODIS knowledge, but not on SODIS behavior. Furthermore, the
interviewer did have an impact on SODIS knowledge and use (the effects found in the control
area), but this effect was clearly lower than that of the promotional strategies as sources of
information.
DISCUSSION
The following discussion compares the effectiveness of the different promotional
strategies for the knowledge and use of SODIS. Our conclusions obviously hold only for a
setting similar to the one in which they were tested.

Effects of communication strategies 157
Interpersonal communication
Until the end of the active phase of the study (third panel), both, opinion leaders and
promoters, informed everyone in the sample about SODIS. The promoters reached people very
well (81% during the first month, 73% during the second month) and opinion leaders triggered
communications with moderate success within the social network (46% during the first, 39%
during the second month). As hypothesized (hypothesis 1), a difference could be found when
looking at short-term knowledge depth: promoters transferred information on SODIS better than
opinion leaders. Also as hypothesized (hypothesis 1), promoters were more effective in
influencing SODIS use in the short term and attained a figure of 73% of SODIS users compared
to 62% in the opinion leader area. When looking at the long-term effects (fourth panel),
percentages of SODIS users dropped to 47% for promoters and 41% for opinion leaders, and
the difference had become insignificant. Clearly, SODIS did not become better embedded in the
social system with the opinion leaders than with the promoters over the long term, as expected
(hypothesis 2). The main reason seemed to be a lack of communication within the social
network; it was only observed during the active phase in the opinion leader area. The low
connectedness within the social network (each person only knew two other people on average
outside the household within the same community) probably explains both the poor
communication and that the opinion leaders in general did not make a greater impact. Another
reason for the lower impact of the opinion leaders compared to the promoters may be people's
insecurity about the trustworthiness of the innovation. People seemed to find 'official' information
more convincing as regards the innovation (in our case that SODIS really disinfects water). This
was confirmed by the opinion leaders themselves, who reported that some people they talked to
doubted that the SODIS method worked and sought confirmation when the interviewers walked
around to distribute the reminders. So, a part of the effects in the opinion leader area is certainly
due to the interviewers serving as 'confirming experts' for the people and distributors of the
reminders. Without the distribution of these reminders that serve as situational cues in the
households, a lower effect on behavior would probably have been found.
Centralized communication
A comparison of the health fair with the interpersonal communication strategies reveals
big differences between the two approaches. While at least 39% of the people heard about
SODIS as a result of an interpersonal communication strategy, only 20% of our sample
participated in the health fair. So clearly, the coverage range of the health fair is lower than that
of the interpersonal strategies. Nevertheless, the percentages of informed people and
knowledge depth were very high, at the same level as in the promoters' area. Probably the high
knowledge was caused by the additional, unplanned impact of the interviewers in the health fair
area. However, since it is impossible to disentangle the effects of health fair and interviewers in

Effects of communication strategies 158
the health fair area, we cannot clearly state if the health fair really would have achieved lower
knowledge than the interpersonal strategies, as hypothesized. When looking at the user
percentage after one month, a clear difference to the interpersonal communication strategies
can be seen. The health fair area did not have more users than the control area (14%, which
represents the interviewer effect) while in the interpersonal areas at least 33% of the people
used SODIS. Only later, user percentages in the health fair area also increased more strongly
than in the control area, but the interviewers were actively involved at that time (distributing
reminders). The decision to involve the interviewers was made with the goal in mind to help the
people with their water treatment. Although we cannot exclude delayed effects of the health fair,
it would account for only those 20% who actually participated in it. Confirming our original
hypothesis (hypothesis 3), the health fair area showed the lowest percentages of SODIS users
of all promotional strategies areas at the end of the active phase. An explanation for the low
participation rate (which was rather unexpectedly low to us too) is maybe the fact that people on
average only know two other people outside her/his household. So maybe motivation to go to a
primarily social event where he/she will meet other people is probably low.
As it has been observed for the interpersonal communication strategies, in the fourth
panel also in the health fair area SODIS user percentages dropped down to a slightly lower level
than in the areas with interpersonal strategies (39%). However, this difference was not
significant.
In summary, interpersonal strategies were more effective than the centralized strategy.
The centralized strategy did not reach as many people and did not change behavior well, while
the interpersonal strategies were successful in both respects. Moreover, the applied centralized
strategy (health fair) was the most expensive promotional strategy (music, animator, food for
staff, advertising, prizes for competitions), while the opinion leaders were very inexpensive, and
the two weeks of employing the promoters cost about half of the health fair. To us, the
centralized strategy health fair as a method to reach people as it was suggested by our local
partners seems to be questionable, at least the way it was organized in this study (which is the
way NGOs do it) and in this kind of periurban setting we found. Maybe a more participatory
approach in organizing such an event would have had the power to get more people attracted
and involved, but here it needs further research.
For the interpersonal strategies, promoters are more effective than opinion leaders in the
short term, but there is no difference between these two interpersonal communication strategies
in the long run. The strengths of opinion leaders are their ability to trigger social network
communication and their low costs, whereas the strengths of the promoters are their better
quality in informing people, their higher perceived expertise and their higher practical skills in
distributing additional materials. A clear drawback is the higher cost of their salaries. In our view,
it would be worth to further investigate the opinion leader approach and to develop strategies
that give them a more 'official' appearance. A combination of promoters and opinion leaders
may perhaps show interesting synergetic effects and save costs. This combined approach could

Effects of communication strategies 159
start with promoters and opinion leaders working together and only later would the latter take
over full responsibility. Alternatively, the expert promoters could be chosen directly from within
the community. This combination would also be very practical for field application, because the
training does not require much effort and should be applied for a longer time period to have real
long-term effects on behavior. In fact, the strength of interpersonal contact is also reflected by
the impact the interviewers had in the control area (and later in the health fair area), because
conducting interviews is nothing else than having an interpersonal contact with the people.
Therefore, we would like to emphasize the importance of further studies on how these
interpersonal strategies could be improved in terms of optimizing costs and effects.
LIMITATIONS
A clear limitation is the different community sizes and the almost unavoidable
irregularities of the sample size due to drop-outs and the enlargement of the sample in the
second panel. The percentages of people who knew about SODIS before the study were also
quite different. Only when we were in the field we realized that the opinion leaders are not very
effective in distributing the reminders. So we had to take advantage of the interviewers, because
the reminders were an important part of the promotional strategies. The interviewers had to be
involved again when we realized that the health fair had such a low impact. There was also a
strong general interviewer effect – in the control area a maximum of 29% used SODIS – but it
would be ethically questionable to forbid an interviewer to tell the interviewed person more
about SODIS (a method that could possibly save their children's lives) if she/he were interested
in knowing more.
Even if the list of limitations appears to be long, the results shed some interesting light on
the advantages and disadvantages of the different strategies. In addition, it was our intention to
investigate these strategies in the field as close to NGO reality as possible, because that is
where we hope the results will be used. Although the absolute level of SODIS use is probably
not correct, the relation between the promotional strategies should be. We think that interviewer
effects in all areas were similar or even lower in the areas where the promotional strategies
worked well (opinion leader and promoters), so one should discount the effects of the control
area on SODIS knowledge and behavior from those of the promotional strategies. This should
reveal realistic results in terms of absolute level of SODIS knowledge and user percentages that
can be achieved with the promotional strategies alone (without interviewers). We hope to have
shown that although the promoters may not reach 73% of users on another occasion, they will
probably be more successful than opinion leaders and also more successful than a health fair, if
all are applied in similar periurban areas. However, to overcome some of these limitations and
gain more insight into the promotional strategies presented here in different contexts, more field
studies are needed on this topic.


Discussion
CONTENTS
Introduction.....................................................................................162 The behavior change process and SODIS promotion – the investigation..............................................................................162 The development of a positive intention.........................................163 Problem awareness..................................................................163 SODIS knowledge ....................................................................164 Cognitive and affective components of attitude .......................165 Social factors ............................................................................166 Predicting behavior.........................................................................168 Intention....................................................................................168 Resource availability ................................................................170 The habit factors.......................................................................170 Water consumption behavior..........................................................173 Campaign effects......................................................................173 Effects of different communication strategies ..........................175 Effects of situational cues – prompts and public
commitments ......................................................................176 Summary, or: a 'perfect' SODIS promotion campaign....................178 Limitations & Open issues ..............................................................181 Limitations ................................................................................181 Open issues..............................................................................182

Discussion 162
INTRODUCTION
During the course of this thesis, data were gathered from two field studies and various
results were presented with the goal to investigate SODIS promotion. Viewing angles were
determinants of drinking water consumption (chapter 1), reasons for interrupted SODIS use
(chapter 2), effects of prompts and public commitments (chapter 3), and effectiveness of
different communication strategies (chapter 4).
In the last part of this thesis, previously presented results will be summarized and linked
to each other. The frame for this last discussion is, as laid out in the overall introduction, the
stages of the behavior change process. Although the structure reminds to chapter 1 where the
behavior change process was investigated explicitly, information on the parts of the process
stemming from other chapters will be added. Finally, as a summary, a ‘perfect’ SODIS
promotion campaign will be described based on the presented results.
THE BEHAVIOR CHANGE PROCESS AND SODIS PROMOTION – THE INVESTIGATION
Factors influencing water consumption in Bolivia were investigated. The majority of the
water consumed is either SODIS treated, boiled or untreated water. Bought water is usually only
consumed during special occasions (weekends, get-togethers, events etc.). Consequently,
determinants of the consumption of the three dominant water types were looked into: SODIS,
boiled and untreated water. Each of the three water types is interpreted as a separate behavior
and analyzed as such. Additionally, their inter-relations are laid out. The theoretical basis for
deriving factors influencing the behaviors was a stage model of behavior change. The model
consists of four topics or stages: (1) problem awareness (2) persuasion, (3) uptake, and (4)
habit. Problem awareness and persuasion can be condensed into a motivational phase, where
mostly cognitive processes are involved. Uptake and habit are stages of the action phase, and
involve different processes. Problem awareness includes aspects related to: diarrhea problem
awareness, awareness of clean water, importance of clean water, importance of, and the
understanding of the causality between untreated water consumption and diarrhea. Persuasion
comprises a wide variety of factors, such as: action knowledge, cognitive beliefs (about the taste,
health impact, time costs, money costs, effort, difficulty, and cost-benefit evaluation), the affect,
attitude, and normative influences.
During the uptake phase, the individual starts the new behavior. Resource availability,
such as bottles for SODIS or combustibles for boiling, and situational circumstances become
important. In case an individual moves on to the habit phase, processes of habit development
are active. They can be represented with the perceived habit, the degree of implementation

Discussion 163
intention, commitment and cognition intensity, frequency of forgetting, and felt dissonance in
case the behavior gets forgotten.
Intention is viewed as a crucial transition point between the motivational and volitional
phase. Behavior intensity is the outcome of the process. Problem awareness and persuasion do
not have to be sequential, but may also process in parallel. Predictors of intentions towards
each of the water types and predictors of each water consumption behavior were analyzed.
A comparison of relapse behavior with continued SODIS application including again all
phases of the behavior change process tries to find out retrospectively, at which stage of the
process relapsers failed to continue.
Effects of different applied interventions and communication strategies on SODIS uptake
and percentage of SODIS water of the total water consumption are investigated.
THE DEVELOPMENT OF A POSITIVE INTENTION
In the following, the factors of the motivational phase will be separately looked at to derive
their importance for future SODIS promotion campaigns. These aspects were analyzed
regarding their power to positively influence the behavioral intention, which is a crucial factor for
individuals to proceed to the action phase of the behavior change process.
Problem awareness
In chapter 1 it was shown that only one of the indicators of problem awareness, the
understanding of the causality between untreated water consumption and diarrhea, showed an
influence on the intention to use SODIS and the intention to boil water. However, this influence
was rather low. When looking at the descriptive statistics, problem awareness already existed
quite strongly within the populations before the start of both studies, as it was measured in both
first measurements before any campaigns had started. The only variable, which actually
showed a positive development over time, was the awareness if the consumed water is clean or
not, but this indicator in turn shows no influence on any of the intentions. Also, the analysis of
relapse behavior of chapter 2 showed that those, who stopped using SODIS, still had a high
problem awareness and did not differ much from the continuers.
Summarizing, problem awareness already was prevalent among the investigated
populations and does not influence intention (e.g. Calnan & Rutter, 1988; Luszczynska &
Schwarzer, 2003; Schwarzer, 2001). Consequently, problem awareness does not need to be
targeted with particular emphasis during SODIS promotion campaigns. However, it should be
made sure that it really exists with the desired strength, for example with a baseline
questionnaire. Maybe, also some more detailed (qualitative) information about the
understanding of problem awareness could be gathered to get an impression about 'black spots'

Discussion 164
within people's understanding of problem awareness. Some authors have experimented with
the induction of fear via risk awareness information (Maddux, Brawley & Boykin, 1995; Ruiter,
Abraham & Kok, 2001), but scaring people into healthy behaviors has not shown to be very
effective (Ruiter et al., 2001).
SODIS knowledge
The percentage of people who knew about SODIS during both studies quickly reached
nearly 100%. Already after one campaign phase, more than 80% knew about SODIS. This
percentage was achieved independently of the applied communication strategy, as shown in
chapter 4. Only interviews alone already resulted in around 40 to 50% of people being informed
about SODIS after two rounds of interviews.
Once people have heard about the SODIS method, the more details they know about
how to prepare SODIS water, the higher is their intention towards using it. This relation, which
was found in chapter 1, implies that a focus should be laid on the provision with sufficient action
knowledge until people have internalized the SODIS preparation process. The time span
depends on people's knowledge preceding a promotion campaign. Therefore, the knowledge
level has to be checked from time to time. In the periurban areas of Study I, for example, the
knowledge level was higher already in the beginning and also at the end of the campaign
compared to the rural areas of Study II. Once people have reached a sufficiently high level of
SODIS knowledge, this aspect can be slowly removed from campaigns to avoid reactance
(Brehm, 1966; Brehm & Brehm, 1981). Studies have shown that in the beginning, repetition and
confirmation of existing attitudes or already given information result in an increased persuasive
effect of the messages. More than five repetitions of the same message, however, may result in
a more negative attitude due to reactance, distorted processing of information and generating of
contrary arguments. The number of possible repetitions before negative effects take place may
vary with the complexity and familiarity of the message and if variations of the message are
used or not (Olson & Zanna, 1993; Petty & Wegener, 1998).
In the analysis of Study I in chapter 4, a good knowledge depth was shown to be better
achieved with expert communication strategies. Health fair and professional promoters caused
an almost perfect knowledge of the SODIS preparation process, whereas opinion leaders as
well as interviews alone only lead to a good SODIS knowledge level. However, this level can
still be viewed as sufficient to properly prepare SODIS, concluding that independently of the
communication strategy enough knowledge gets transferred to the targeted population. In a
rural setting (Study II, descriptives), it seems to take longer to inform everyone sufficiently about
the SODIS process. Moreover, the initial knowledge level was lower than in the periurban
population.
Even if SODIS promotion campaigns stop, the knowledge level stays fairly stable,
independently from which source it had been acquired before. Although relapsers showed in
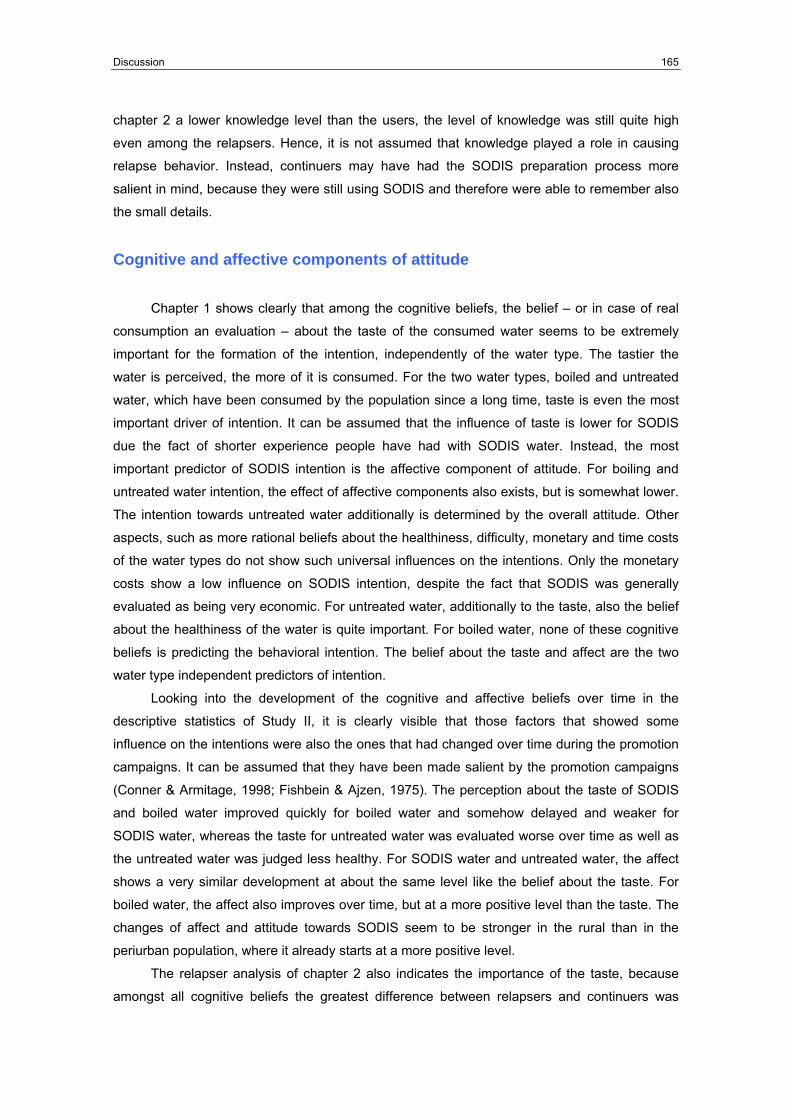
Discussion 165
chapter 2 a lower knowledge level than the users, the level of knowledge was still quite high
even among the relapsers. Hence, it is not assumed that knowledge played a role in causing
relapse behavior. Instead, continuers may have had the SODIS preparation process more
salient in mind, because they were still using SODIS and therefore were able to remember also
the small details.
Cognitive and affective components of attitude
Chapter 1 shows clearly that among the cognitive beliefs, the belief – or in case of real
consumption an evaluation – about the taste of the consumed water seems to be extremely
important for the formation of the intention, independently of the water type. The tastier the
water is perceived, the more of it is consumed. For the two water types, boiled and untreated
water, which have been consumed by the population since a long time, taste is even the most
important driver of intention. It can be assumed that the influence of taste is lower for SODIS
due the fact of shorter experience people have had with SODIS water. Instead, the most
important predictor of SODIS intention is the affective component of attitude. For boiling and
untreated water intention, the effect of affective components also exists, but is somewhat lower.
The intention towards untreated water additionally is determined by the overall attitude. Other
aspects, such as more rational beliefs about the healthiness, difficulty, monetary and time costs
of the water types do not show such universal influences on the intentions. Only the monetary
costs show a low influence on SODIS intention, despite the fact that SODIS was generally
evaluated as being very economic. For untreated water, additionally to the taste, also the belief
about the healthiness of the water is quite important. For boiled water, none of these cognitive
beliefs is predicting the behavioral intention. The belief about the taste and affect are the two
water type independent predictors of intention.
Looking into the development of the cognitive and affective beliefs over time in the
descriptive statistics of Study II, it is clearly visible that those factors that showed some
influence on the intentions were also the ones that had changed over time during the promotion
campaigns. It can be assumed that they have been made salient by the promotion campaigns
(Conner & Armitage, 1998; Fishbein & Ajzen, 1975). The perception about the taste of SODIS
and boiled water improved quickly for boiled water and somehow delayed and weaker for
SODIS water, whereas the taste for untreated water was evaluated worse over time as well as
the untreated water was judged less healthy. For SODIS water and untreated water, the affect
shows a very similar development at about the same level like the belief about the taste. For
boiled water, the affect also improves over time, but at a more positive level than the taste. The
changes of affect and attitude towards SODIS seem to be stronger in the rural than in the
periurban population, where it already starts at a more positive level.
The relapser analysis of chapter 2 also indicates the importance of the taste, because
amongst all cognitive beliefs the greatest difference between relapsers and continuers was

Discussion 166
found for the taste of SODIS water. A particular low perception of taste was found for early
relapsers, so it can be argued that the low perception of taste has caused a lower intention, and
in consequence a quick decision was taken to stop using SODIS. Also for the affect and attitude
towards SODIS, the differences between relapsers and continuers were around the same order
of magnitude as for the belief about the taste of SODIS water. Like for the taste belief, a low
affect towards SODIS co-occurs with early relapse behavior. Attitude is lower for relapsers than
for continuers, independently of an early or late relapse time point.
The impact of these findings on SODIS promotion is twofold: 1) taste and affect are
important. It has to be quickly established that SODIS water tastes good and a positive affect
has to be stimulated, else people are at risk to stop using SODIS. The taste belief could be
targeted with the provision of tasting SODIS water possibilities during workshops, home visits et
cetera. If bottles are provided, they should be cleaned well, because sometimes the taste of the
previous content is still prevalent in the bottle. The taste aspect should be repeatedly mentioned
during campaigns, maybe with a slogan or something alike. Targeting the affect is more difficult
and subtle. Maybe the fun aspect can be emphasized during the promotion campaigns, and the
existing medium relation between the taste belief and affect can be used. To-date, SODIS
promotion often focuses primarily on emphasizing problem awareness and arguments about the
healthiness, easiness and non-costliness of the SODIS method instead of the taste and the
affect.
The second implication for promotion campaigns is that not only the direct predictors of
SODIS water intention can be targeted, but also the ones predicting untreated water intention. A
lower intention towards untreated water correlates with a higher intention to consume SODIS
water. Since the taste and affect of SODIS are already quite positively evaluated and do not
pose such a potential for improvement, it seems sensible to relate the consumption of untreated
water to a feeling of unpleasantness. Taste and affect for untreated water consumption are
strongly related to each other. The unsafe origin of untreated water or the possibility of fecal
contamination by humans and animals can be pointed out, which would additionally influence
the health belief. For boiled water, not much intervention potential is seen to improve the belief
about its taste, because boiled water in reality does not taste very well. On top of it, taste is by
far also the strongest predictor of the boiling intention.
Social factors
Overall, social factors do not play such a dominant role in influencing people's intentions
towards water consumption as it was found out in chapter 1. Only on the intention towards
boiling, subjective norm shows a medium influence. For untreated water intention, also a higher
perceived subjective norm influences the intention, but only weakly. For SODIS water intention,
the injunctive norm shows a weak influence. Interestingly, subjective norm values are
unrealistically low for boiled and SODIS water. This indicates that people are completely

Discussion 167
misjudging the amount of other people who boil water or use SODIS. For SODIS use, the mean
subjective norm estimation of the percentage of people using SODIS in the community is 23% –
in reality 83% reported using SODIS. For boiling, the discrepancy is even larger – the subjective
estimate was 25% of people boiling water in contrast to 96% who reported doing so. Only for
untreated water consumption the estimate was with 44% only 11% below the real percentage.
The misjudgment especially for boiling is bewildering, because boiling is a behavior
people have already performed before the study and one would expect that everyone is aware
that all others also boil parts of their water. For SODIS the misjudgment is more understandable,
because it is a very recent behavior and maybe has not yet reached publicity. This assumption
is supported by the low descriptive norm. Additionally, misperceptions of social norms seem to
be a common phenomenon (Park & Smith, 2007), but the discrepancy can also be in the other
than the observed direction (Borsari & Carey, 2003). The assessed injunctive norms,
conceptualized as the reputation of SODIS, boiled and untreated water, were also found to be
comparably low (in comparison with the cognitive beliefs for example) and showed a medium
positive level for boiled and SODIS water and a neutral level for untreated water.
The development of the normative factors over time also indicates the relative non-
importance of those norms, because only the subjective norm of untreated water consumption
decreased remarkably. The others changed only slightly over time. The analysis of reasons for
relapse in chapter 2 shows a significantly lower subjective and descriptive norm for relapsers.
The injunctive norm only differs marginally.
In any case, the influence of the norm factors on intention was found to be rather low, so
it is questionable, if it makes sense to further investigate the reasons, why these norms are
rated so low. In general, the norm influence in other studies varies from no influence to only
medium influence (for reviews see Ajzen, 1991; Armitage & Conner, 2001), depending on the
behavior. However, Cialdini et al. (1990) noted that norms have to be salient to show an
influence on behavior. Since water consumption is a rather private behavior, maybe the social
norms have not been salient at the time of measurement. This would also explain the heavy
misjudgment of the subjective norm. Maybe with stressing norms explicitly during campaigns, a
lower discrepancy and an influence on intention can be achieved. For example, assessing in a
work group who is consuming which water type helps to make norms salient and perceivable.
Injunctive norms, i.e. the reputation of SODIS and boiling water, can be addressed with famous
role models, for example. If it is possible to make these norms salient with special promotion
activities, then an influence on intention should be found.

Discussion 168
PREDICTING BEHAVIOR
In the following, the factors influencing behavior are discussed. The results analyzed
within the behavior change process will be integrated with the findings about influence paths of
interventions. The main target is to derive ideas for future interventions.
Intention
According to a range of researchers, intention is a key construct of the behavior change
process. The various cognitive and affective evaluations that took place during the motivational
phase manifest in the behavioral intention. The intention marks the transition to action (e.g.
Schwarzer, 2008; Ajzen, 1991). Intention is described as the conscious plan to use physical and
psychological resources to perform the behavior in the near future, and is viewed as a proximal
cause of behavior (Ajzen, 1991). Although no-one denies the existence of the intention-behavior
gap, the importance of intention cannot be denied either. A commonly drawn conclusion of
many researchers is that it needs additional constructs to achieve a better explanation of
observed behavior, but that intention cannot be ignored.
In the analyses of the behavior change process, intention functioned as a dependent
variable and was tried to be explained with the previously described factors of the motivational
phase. Secondly, intention was used as a predictor to explain behavior. These two roles of
intention will be looked at separately.
In chapter 1, intention towards all types of water consumption behavior was tried to be
explained with problem awareness factors, amount of action knowledge, cognitive and affective
beliefs, and social influence. Comparing the explained variances of the intentions towards
SODIS use, boiling water and consuming untreated water, it is apparent that the intention to boil
water was least explainable. Only 29% of the variance it could be accounted for with the used
variables, in contrast to 39% for the intention towards SODIS use and 57% for the intention
towards untreated water consumption. However, boiling water is a necessary behavior for
having hot water, and therefore a factor measuring this need-component would add explanatory
power. Untreated water intention was surprisingly well explained. This indicates that the
measured factors are the ones that influence the intention to a large part and that they had been
mentally accessible for the individuals. This is supported by the change of these factors that has
taken place during the time period of the study. For SODIS intention, actually a higher explained
variance was expected, because it was assumed that as long as the behavior is not yet
completely habitual, all cognitive beliefs, affects, action knowledge and social evaluation
processes that in turn form the intention are easily accessible.
The two available studies for SODIS that tested very similar intention models (Altherr et
al., 2008; Heri & Mosler, 2008) achieved higher explained variances for SODIS intention,

Discussion 169
although the authors used quite similar factors in their models (62% and 52%, respectively). In
the study of Altherr et al. (2008), the affect played a much stronger role, and in the study of Heri
and Mosler (2008), a factor measuring the compatibility with daily tasks and habits added
additional predictive power to their model. From the results of the current study it can be learnt,
that some other factors have to be considered in addition to those presented.
However, studies on various other topics have also reported explained variances of
intention of only roughly 30 to 50% (Corbett, 2002; De Groot & Steg, 2007; Knussen et al., 2004;
Tonglet, Philips & Read, 2004). A review of the explanatory power of TPB variables on health
related behaviors also found only an overall explained variance of 41% (Godin & Kok, 1996, cf.
Conner & Armitage, 1998).
Intention as a predictor of behavior intensity performed well for all three water
consumption behaviors that were investigated. For boiled and SODIS water consumption, the
intention accounted for around 30% of the behavioral variability, for untreated water
consumption 37%. For boiling water, intention was the most important predictor, for SODIS and
untreated water the second most important. During the course of the study, the intention
developed quite positively over time in the investigated rural population (Study II). In contrast,
the intention in the studied periurban population (Study I) was already very high since the
beginning of the promotion campaigns and only decreased after active SODIS promotion had
stopped. Interestingly, the analysis of relapse behavior in chapter 2 revealed that only early
relapsers suffered from a strongly decreased intention, whereas late relapsers as well as those
who continued using SODIS after the end of the SODIS campaign kept their high intention.
However, with the present data the question about the direction of the causality between
intention decrease and early relapse cannot be answered.
Summarizing, intention seems to serve quite well as the bottleneck between the
influences from the motivational phases on one side, and translating them into action and
influencing the behavior on the other side. The explained variances are within the range what
can be expected from previous research. Nevertheless, it should be worked on investigating
additional factors on both sides of the intention.
Within promotion campaigns, targeting intention can be consequently achieved with
targeting those factors that in turn influence intention. Direct influence could be realized with
asking people to set a fixed amount of (SODIS) water they want to consume. However, this type
of intervention would aim more at the commitment and implementation dimensions, which are
rather considered being part of the habit phase, which are investigated in chapter 3.

Discussion 170
Resource availability
Necessary resources for using SODIS are bottles, and for boiling water combustibles.
The influence of resource availability on intention and behavior was investigated for SODIS and
boiling within chapter 1. The results show that for forming of a positive intention, resource
availability is not considered by the individual. Only when the behavior is started to be
performed, it gains some influence. However, the observed influence was rather low. In general,
resources for SODIS and boiling were judged as being widely available in the periurban areas,
but more or less available in the rural areas. At the end of the Study II, still 50% of the people
claimed that one or more bottles were missing, which reduces the possible amount of water that
can be treated with SODIS. Structural interventions would be helpful – at least in the beginning
– to have these resources at hand when people have formed a positive intention and are ready
to try the behavior. Once the SODIS is accepted as such, other ways of organizing bottles can
be pointed out to the people, and help can be provided that people can finally organize bottles
or combustibles themselves.
The habit factors
During the course of the different chapters of this thesis, different habit indicators have
been used. The behavioral models of chapter 1 used perceived habit, which is a very general
indicator of habit. This was used to have the same predictor for all three water consumption
behaviors. The relapsers' habit in chapter 2 was investigated using additionally cognition
intensity, forgetting and dissonance, while the closer examination of the interventions' mode of
operation on behavior in concert with the habit factors in chapter 3 looked at the roles of
perceived habit, implementation intention, and strength of the felt commitment. The next part of
the discussion will focus on the importance of all these constructs for behavior.
According to the analyses of chapter 1, perceived habit explains roughly 30% of the
consumption of boiled water, 40% of the consumption of SODIS water and 50% of the
consumption of untreated water. Moreover, it is the strongest predictor of the consumed amount
of SODIS and untreated water (for boiling it is the intention). The analysis of relapse causes in
chapter 2 has also shown a strong difference between relapsers and continuers regarding
perceived habit. Knowing that perceived habit is such an important predictor of behavior
intensity, it can be assumed that a successful increase of the perceived habit would also
stimulate SODIS use. Moreover, the two structural models of chapter 3, calculated for
investigating the effects of the interventions prompt and public commitment on behavior, have
shown the important direct effect of perceived habit on behavior. In addition, these models have
revealed the mediating influence of perceived habit between the interventions, implementation
intention and the amount of consumed SODIS water. It is therefore evident that habit plays a

Discussion 171
key role among the behavior-near factors in influencing behavior. An additional role seems to be
the 'collection' of the influences of other habit related factors, as it has been observed for
implementation intention in the model testing the mode of operation of public commitments in
chapter 3. Here probably more research is needed to find determinants that cause people
perceiving a habit towards a certain behavior. Particularly, the link to the other three habit phase
indicators, cognition intensity, forgetting, and dissonance, which have not been included in the
models, should be investigated. Maybe, perceived habit can function as a 'collector' of habit
stage related information, like intention is the ‘collector’ of factors from the motivational phase.
In view of how easily perceived habit can be acquired with a simple question, it could be used
for developing tailored interventions depending on the amount of already perceived habit. As
the models of the mode of operation of prompts and public commitments have shown,
particularly prompts are strongly influencing habit formation. Additionally, other habit supporting
interventions could be developed, for example private commitment (see Mosler & Tobias,
2007a).
The habit factors implementation intention and commitment were only investigated
within the models of the mode of operation of prompts and public commitments in chapter 3.
According to these analyses, next to perceived habit, implementation intention is also an
important factor for influencing SODIS use intensity. Prompts influence behavior not only via
perceived habit, but also via implementation intention. For public commitments, the
implementation intention is even more important for eliciting their influence on behavior,
because they do not directly influence perceived habit. Instead, public commitments operate via
implementation intentions which in turn influence perceived habit. They do not influence habit
directly, because they miss the characteristic of an effective cue stimulus: they do not contain
the necessary action information and they are not placed at the place where the action is carried
out (Tobias, 2007).
The commitment factor performed a bit ambiguously in the models of the modes of
operation of the interventions. Before the interventions, it showed a slight negative influence on
SODIS behavior, after the interventions it did not show any relation to SODIS behavior, although
it was influenced by the intervention prompt. From the public commitment model, it had to be
removed due to strange behavior. One explanation may be the inappropriate measurement of
this factor. It is suspected that either the question imposed an uncomfortable feeling of
obligation and reactance occurred causing the negative influence on behavior, or the question
was completely misunderstood due to cultural specialties.
Both, implementation intention and commitment, only seem to influence behavior after
they had been specifically activated, for example by an intervention. In the calculated models, at
time point one of the model, no influence of implementation intention on behavior was found
and commitment even had a slight negative effect in one of the models. So, it seems to be of
particular importance to target these factors with interventions to have them exerting their
influence on behavior. Interestingly, implementation intention and commitment only increased

Discussion 172
marginally due to the interventions, however, the influence on behavior changed. The
explanation is probably that only due to an intervention the correct goal gets activated and helps
forming a goal-directed implementation intention.
Influencing implementation intention positively has been successfully achieved by the
both applied interventions prompt and public commitment. Therefore, these two are also
recommended to be used during future campaigns. Other implementation intention supporting
techniques like using formalized verbal implementation intention sentences ("In situation X I will
do Y"; Gollwitzer, 1999) have to be tested locally, if people understand the concept. It was tried
in Study II to use this kind of intervention to support the development of goal-directed
implementation intentions. However, already during the culture compatibility check with local
experts before the study, the concept was not well understood and it was recommended to drop
this type of intervention.
The other three habit related factors, cognition intensity, forgetting and dissonance
have been only investigated within the analysis of causes for relapse behavior in chapter 2. All
three factors show large differences between relapsers and people who continued SODIS use.
Moreover, these are the factors that have changed most dramatically between the time point
before the relapse and the one after (time frame 7 months). Forgetting increased, dissonance
and cognition intensity decreased. This applies to both types of relapse behavior, early (low)
and late (high) relapse, as well as the low user type. Only high (supposedly stable) users were
not affected by the change of these three habit factors. The implications are that relapsers did
not manage to maintain their acquired habit, and therefore at some point stopped using SODIS.
Also low users seem to be at risk to stop using SODIS soon. The causality between relapse and
the change of the habit factors has been made, because these are the ones among all factors
from the behavior change process that show the largest differences between relapsers and
users and the strongest negative change. Even within the overall population (that means, even
including continuers), in the descriptive statistics the development of these factors over time
shows a remarkable decline after the promotion campaign phase had ended. Before, all factors
were at a good medium level. This level was the same for the rural and the periurban population,
only in the rural population a measurement a long time after the end of the campaign phase had
not taken place. It can be assumed, that a similar change pattern of the three habit indicators
also within Study II would be observable if another measurement would be carried out now.
Possible interventions could be dissonance inducing methods like commitment
interventions (Brehm & Cohen, 1962; Heckhausen, 1991), preventing of forgetting with
reminders (prompts). Cognition intensity could be targeted with anything that helps keeping the
SODIS topic present in people's heads.
Overall, the need for including a separate habit phase with specific indicators when trying
to understand the complete behavior change process has been overwhelmingly confirmed with
the presented results regarding habit. There is still work to do to find out more about the

Discussion 173
presented aspects of habit, which are the most important factors, and how they are exactly
related to each other. It is highly recommended to focus on these issues during following
research. Also, the relation of how habit develops under different circumstances and in
response to different intervention strategies, respectively, has to be investigated. A first step
was taken with showing that prompts and public commitments operate at least via some of
these habit aspects, but many more steps have to be taken. This is particularly stressed,
because often only one or two aspects of habit are studied, and consequently not much is
known about interactions between all of these factors. Especially, cognition intensity, forgetting
and dissonance measures are seldom found in empirical studies. Another aspect that lacks a
certain state-of-the-art is the measurement of these habit factors. Some operationalizations of
the variables were 'only' developed with an idea about what was intended to capture, and which
could be the most appropriate and understandable formulation of the variable.
WATER CONSUMPTION BEHAVIOR
Naturally, when conducting a field study together with local institutions on the promotion
of SODIS, the most important and most valued success indicator is the behavior. The goal is to
promote SODIS use. As consequence, the outcome is often expressed in the percentage of
SODIS user after certain promotion campaigns had taken place. However, as we found during
the course of Study I, knowing the percentage of SODIS user is only one side of the success
indicators. The other two sides are: how much water is treated with SODIS? And: do people still
consume untreated water? On the development of these two behavioral indicators will be
focused in the last part of the discussion.
As the relation of psychological factors to the behavior of SODIS use has already been
discussed, the focus shall be now on the suspected influence of all applied external cues:
interventions and communication strategies. But first, the development of the water
consumption behavior will be described over time as an indicator of the general effect of the
promotion campaigns.
Campaign effects
The promotion campaigns that were applied during both studies can be described as a
mixture of different communication strategies, situational cues (habit supporting interventions)
and more or less standardized persuasion. In both studies, interpersonal and centralized
communication strategies were applied, in Study I in a controlled design and only one strategy
at a time, whereas in Study II application was rather randomly and confounded. Therefore, in
Study II people received information about SODIS via a higher number of different
communication channels. The two applied interventions, prompts and public commitments, were

Discussion 174
the same in both studies, only varying in their design. In Study I, both interventions were applied
in parallel to all communication strategies, in Study II they were tried to be applied to separate
groups. Overall, in Study I, a higher percentage of the investigated population had received an
intervention compared to Study II. The persuasive messages were mostly identical.
In Study I, in two evaluative panels during the time of promotion campaigns (panels 2 and
3), SODIS use was only measured dichotomous. Therefore, only one part of the success
indicators can be presented. SODIS user percentages increased clearly over time as long as
there was active SODIS promotion. The starting point was 5% SODIS users at the first panel.
After one month of active SODIS promotion, 37% used SODIS, and after another month of
promotion, 64%. After seven months without promotion activities, 43% were still using SODIS.
In the control group, which did not receive active SODIS promotion, user percentages of 13%
and 29% (after the first and second month, respectively), and 20% in the long-term analysis 7
months later were observed. The numbers of the control area of Study I indicate roughly the
effect and potential of the interviews. Study II does not provide such a clear data basis for
estimating the interviewer effect. Coming back to Study I, in the first panel, the overall
consumed SODIS water averaged across all people (including control group) was 1%. For the
next two panels, unfortunately, data is missing. After the seven inactive months, still 15% of the
total water consumption was SODIS water. Untreated water was initially consumed by 54% of
the population. This percentage declined to 22% during the time of the SODIS promotion
campaigns, and rose again up to 33% after the campaigns had stopped. However, the overall
amount of consumed untreated water was fairly low with 12% of the total water consumption
(32% at the beginning of the study).
In Study II, information on percentages of SODIS users and percentage of the amount of
SODIS water used, are available for all measurements. Initially, 3% of the population used
SODIS. At the second panel, 3.5 months later, already 25% used SODIS, although almost no
promotion activities had taken place. This result is assumed to be to a large part caused by the
interviewer. After 3 months with active SODIS promotion, 54% of the people used SODIS and in
the last panel, after another phase with active SODIS promotion, 83% stated they were using
SODIS. The percentage of SODIS treated water in the first panel was, as in Study I, 1% of the
total water consumption, rose first to 11%, then to 33%, and finally reached 47% in the overall
measured population. Untreated water consumption was admitted by 98% of the population
before the study. The percentage of people consuming untreated water declined over time to
only 55%, who were still consuming untreated water at the end of Study II. The steepest decline
was observed between the before-last and last measurement. It seems that first people had
started using SODIS, and only delayed in time they had stopped drinking untreated water. The
amount of consumed untreated water depends strongly on the amount of SODIS water: the
more SODIS water, the less untreated water gets consumed. An optimum of the total water

Discussion 175
consumption patters seems to be: 60 to 80% SODIS water, 20 to 30% boiled water and around
5% untreated water, which is preferred by almost 50% of the interviewed sample in Study II.
These percentages state the success of the applied promotion campaigns in both studies.
In the following, more detailed information is discussed on the different applied elements of the
promotion campaigns: communication strategies and interventions.
Effects of different communication strategies
In chapter 4, the analysis of the effectiveness of different communication channels in
Study I has shown the superiority of employing expert promoters compared to opinion leaders
or a health fair in obtaining quick and large changes regarding SODIS use. The promoters were
most effective in reaching people and convincing them to use SODIS. However, their long term
impact was only insignificantly larger than that of the opinion leaders. The opinion leaders
interestingly also initiated quite large changes regarding SODIS use. Although the percentage
of people using SODIS was lower due to the opinion leaders in comparison to the promoters,
the impact was impressive in the sense that the opinion leaders worked voluntarily and only
caused very little costs. They therefore achieved the best cost-effect ratio of all communication
strategies. Moreover, opinion leaders had a positive effect on interpersonal communication
about water among the people of a community. This effect is clearly attributable to the opinion
leaders, because in the areas where other communication strategies were applied, people did
not name their peers as a source of information. The type of big event communication strategy,
which was tested with a health fair, did not show the desired impact. Costs were twice as high
as employing the promoters, but the participation rate was only 20% among the interviewed
sample. Consequently, the impact on behavior was very modest, if not non-existent. The long
term effect of the health fair cannot be estimated, because a confound with promotion efforts
carried out by the interviewers occurred in the respective area.
Summarizing, it seems that interpersonal communication strategies have a stronger
impact on SODIS behavior compared to the centralized strategy health fair. They are more
effective in reaching people and have a better potential to change people’s behavior, while the
health fair, like it is already known from mass media communication (e.g. Alcalay, 1983; Griffin
& Dunwoody, 2000), may have the potential to inform people, but not to change their behavior.
This is at least true in the periurban setting where these communication strategies were studied.
One major characteristic of the investigated areas was the low number of peers people had
within their community. Maybe in a more connected community, a more participatory approach
for organizing a health fair would have the power to get more people attracted and involved, but
here it needs further research.

Discussion 176
In chapter 3, ignoring the nature of the communication channel from which an individual
received information about SODIS, it was found for both studies that each additional
communication channel increased the chances of using SODIS between 37 and almost 300%.
The effect of additional communication sources providing information about SODIS was much
stronger after the first phase of promotion campaigns (in Study I 294% and in Study II 236%
increased chance of using SODIS) than the second campaign phase (51% and 37%,
respectively). The long-term analysis of Study I showed neither an effect of recently perceived
SODIS communications, nor a residual effect of previously perceived SODIS communications
on SODIS use. The latter fact is also confirmed by the analysis of relapse behavior in chapter 2:
overall relapsers and continuers, as well as their subtypes, did not shown any differences
regarding previously perceived number of communication channels.
Consequently, it seems to be important to start a promotion campaign with massive
communication, using various communication channels simultaneously. Once people have been
reached, it seems not so important anymore or even slightly contradictory to have many
different information sources. However, also for the start of a campaign, it is assumed that the
amount of perceived communication channels can be increased infinitely. The relation between
number of communication channels and chances of using SODIS is not linear anymore above a
limit of 4 to 5 different communication channels (result of an earlier analysis of the dataset of
Study I; Tamas, 2006, p. 17), i.e. it is not possible to use 10 different communication channels
and expect increased chances of SODIS use of 3000%.
Effects of situational cues – prompts and public commitments
In both studies, two different situational cues were applied: prompts and public
commitments. Their direct effects on SODIS uptake and amount of water treated with SODIS
were analyzed in chapter 3.
If a household had received a prompt, chances of using SODIS were increased by
approximately 150 to 350%; the public commitment reached an effect of about 100 to 250%
increased chance of SODIS use. In Study I, prompts have shown a very constant effect of about
150% increased chances for SODIS use if the family possessed a prompt, even in the analysis
of the long-term effect. In Study II, the effect of the prompt increased over time from 150 to
350% of increased chance of SODIS use. The public commitment also showed a strong
increase in its effect on SODIS use during Study II. At the end of Study II, the households
having a public commitment were 100% SODIS user. But at that point, within the entire
population 83% were using SODIS.
In Study I, the effect of the public commitment did not occur until the end of the second
phase of SODIS promotion activities. Before, it seems that too few households had actually
received the public commitment and hung it outside their houses. One reason may have been –

Discussion 177
as it was reported by those who distributed intervention materials – that people liked the prompt
a lot more, and as soon as they had realized that also prompts existed, they preferred to have a
prompt instead of the public commitment. Secondly, maybe it was asked too much too early – to
hang a commitment outside their house already at the beginning of the study. However, this
problem was only observed in the periurban areas of Study I.
The long-term effect of the public commitment could not be tested either, because people
reported that it was torn down by wind and weather. So, it seems the prompt has a higher
potential to stay a long time in a household, and if the prompt is there, it also has an impact on
SODIS use. The results of the long-term analysis also show that previously applied
interventions do not have an effect on later behavior. This is in line with expectations for the
effectiveness of situational cues. The relapser analysis in chapter 2 supports the importance of
situational cues, because a) only 27% of relapsers still had a prompt in their household
compared to 40% of continuers, and b), late relapsers had the highest 'loss' of prompts. It is
argued that they have relied on the prompt as a reminder, but once the prompt was lost, they
forgot doing SODIS and became high relapsers. One central characteristic of high relapsers is
their readiness to act in terms of psychological variables: high problem awareness, high
motivation, and high intention, but missing external cues initiating behavior execution.
Prompts and public commitments seem to exert their influence on the decision to use
SODIS. Once people use SODIS, only weak direct influences on the amount of water treated
with SODIS were found. A prompt directly increases the percentage of SODIS water of the total
water consumption by 12% and a public commitment by 9%. This effect was only found in one
of the two analyzed measurements of Study II in chapter 3. It rather seems that on behavior
intensity prompts and public commitments operate via other factors. These are the behavior-
near factors of the habit stage of the behavior change process, as previously described.
Prompts indirectly influence SODIS behavior intensity via perceived habit and implementation
intention, whereas public commitments only influence implementation intention, which in turn
influences perceived habit, and therefore influences the SODIS behavior. The strengths of the
influences of prompts and public commitment on the behavior-near factors are of medium
intensity for public commitments, and of strong intensity for prompts. It can be concluded, that
prompts have a stronger influence on SODIS behavior intensity than public commitments. This
is not very surprising, since prompts are better situational cues, because they are placed at the
location of behavior execution and contain all necessary information to perform the behavior
correctly (Tobias, 2007).

Discussion 178
SUMMARY, OR: A 'PERFECT' SODIS PROMOTION CAMPAIGN
The behavioral factors and elements of the SODIS promotion campaigns that have
shown to be important for SODIS use can be summarized as follows:
− Among the cognitive beliefs, the belief about the taste of the water is important
for forming the intention towards all water consumption behaviors.
− The same applies for the affective component of attitude – people form their
intention largely based on their affect towards a certain water type.
− Intention is a central mediator between motivational factors and behavior.
− Resources such as bottles are only slightly important and only when SODIS is
used.
− Separately taking into account the habit factors adds significant insight to
understanding behavior intensity and occurrence of relapse.
− Among the habit factors, perceived habit plays a central role.
− Interpersonal communication is more effective and less costly than centralized
communication.
− Increased number of communication channels increases the chances of people
using SODIS, but only in the beginning of a promotion campaign (up to 4 or 5
different channels).
− Prompts are easily applicable interventions, they are accepted, people keep
them for quite a long time, and they show constant short- and long-term effects
on the decision to use SODIS. Moreover, they positively influence behavior
intensity via the habit factors implementation intention and perceived habit.
− Public commitments are possibly less accepted in a periurban population, but
also show comparable short-term influences on the decision to use SODIS.
However, they do not last as long as the prompts due to their outside use. As
the prompts, also public commitments influence behavior intensity, but only via
implementation intention, not via perceived habit.
In the following, these influences are illustrated using a small example of a promotion
campaign designed according to the presented results.
Every promotion campaign, no matter if promoting a product or a behavior, should be
adapted to the situation. Consequently, the first indispensable step towards developing an
effective campaign always should be an analysis of the current circumstances. What has been
the first panel measurement in the two studies of this thesis, should ideally take place longer
before the start of the promotion phase to have the opportunity using the information from the
first panel measurement to plan the contents of the promotion campaigns. For example, if
people already effectively treat their water with a certain method and do not consume untreated

Discussion 179
water at all, no SODIS promotion campaign is needed in terms of public health improvement.
Important aspects are:
a) the level of problem awareness,
b) if SODIS is known already or not and to which degree,
c) in case SODIS is known, what are people’s opinions (cognitive and affective
beliefs),
d) their intentions, and
e) their habits.
The water consumption pattern should also be assessed as detailed as possible. Further
useful information should be collected about their communication practices, media usage and
the like.
Given, for example, the situation that people consume a large amount of untreated water,
value untreated water quite positively, mostly do not know about SODIS, the area is rural and a
part of the people live very dispersed, but it has a popular radio station in the area, as it was
found in the beginning of Study II. In this case, a good strategy would be to have information
events in the communities to:
a) introduce the project officially, ideally with health officials,
b) to assure support from community leaders,
c) to find out, who already knows SODIS and who could be possible opinion leaders,
and
d) to assure that all have understood the general problem and to make people
familiar with SODIS (knowledge aspect).
Participatory workshops, as they have been performed by the Foundation SODIS in
Study II, have received a good feedback. The information event should be definitely
complemented by
a) a taste comparison between untreated, boiled and SODIS water (belief taste all
water types),
b) a fun factor instead of only providing information (affect all water types),
c) explicitly discuss the problem of recontamination due to missing cup washing
practices (Rufener, Mäusezahl, Mosler, & Weingartner, submitted), and
d) brainstorm where to get bottles from.
During the workshops, attractive prompts should be given to the people, but not without
explaining extensively what they are for and where they have to be placed.
Quite immediately after the workshops, employed expert promoters should go and visit as
many households as possible. The promoters should
a) make sure that people know the SODIS process well,

Discussion 180
b) give them bottles to start if needed,
c) assure the prompt is used correctly, and
d) should fix the next visit.
It is recommended, that the promoters start with the most interested people, who have
been identified at the workshops, and convince them to take the role as opinion leaders. The
idea is that after a while the opinion leaders take over more and more of the task of the
promoters, and the promoters become more and more redundant. This should also increase the
general exchange among people in a community, because the opinion leaders are community
locals. How long this process should take to have a thorough continuation of the promotion by
the opinion leaders has to be tested. Once opinion leaders have been identified, they can be
brought into the process by first accompanying the promoters to learn from them. Opinion
leaders should be rewarded, however not monetary, but symbolically with small incentives
(presents) and official credentials.
In parallel, a radio campaign could be launched, ideally in with the official support of the
Ministry of Health (number of communication channels). The radio campaign should contain
a) a fun part (affect),
b) the information of how long SODIS bottles should be exposed (the most
important aspect of knowledge),
c) and a note that already so-and-so many people in village XY use SODIS (to
increase the subjective and the injunctive norm, and to increase social exchange
among people).
One could also think about having a contest between villages. If enough resources are
available, school campaigns could also be included, because teachers are often viewed as
authorities and older kids are sometimes responsible for water in the family. However, the effect
of including schools still has to be tested.
Looking at the design of a promotion campaign over time, the massiveness of the initial
communication should be switched after a while to more targeted actions. If radio campaigns
had taken place or events or contests, they should be slowly removed after a few months,
preferably before the promoters get fully replaced by the opinion leaders (the time frame,
however, is unclear and has to be investigated). Targeted actions mean interpersonal
communications, either with small (community) meetings and/or household visits. Focus should
be laid on habit forming interventions like prompts or public commitments or others which
should increase cognition intensity to prevent forgetting. Assistance in planning when and
where to prepare SODIS and to define a responsible person should help to develop a goal-
directed implementation intention. Ideally, the responsibility of supervision and continuing of
SODIS use and hygiene is then embedded in the community and largely in the hands of the
opinion leaders.

Discussion 181
Moreover, every 2-3 months, an evaluation should take place to adjust the campaign
strategy to the stage of the behavior change process people are in. Last but not least, it is
always advisable to have a true control group to prove the effectiveness of the applied
measures. If it is a goal to systematically compare the effects of different strategies, it should be
assured that they are applied in a standardized procedure. The campaigns should last at least
one year or even longer.
LIMITATIONS & OPEN ISSUES
The results clearly shed some light on water consumption behavior in general and SODIS
use as one possible water type in particular. The behavior change process was investigated and
possible determinants for the consumption of different water types were found.
Recommendations on future SODIS promotion campaigns were given.
However, there is still a range of open questions and studies to carry out. Some
limitations already have been pointed out at the end of the chapters 1 to 4. First, these are
shortly summarized, and then additional open issues are pointed out.
Limitations
For chapter 1, it would have added insight into the behavior change process if a real
process analysis would have been carried out. However, shorter time intervals of
measurements would have been needed to better investigate relations over time. Chapter 2, the
analysis why people stopped using SODIS, in principle suffers from the same circumstance: the
missing information about what happened between panels 3 and 4 of Study I. However,
applying questionnaires itself would have been an intervention and maybe relapsers would not
have been observable in the same ‘natural’ pattern as it was possible in chapter 2.
A specific limitation for the analysis of the effects of the intervention materials (chapter 3)
is the sometimes low number of people who actually received the interventions. This was
caused by unforeseen irregularities during the distribution of the interventions. Therefore, it was
not possible to estimate the long term effects of public commitments.
The comparison of the three communication strategies with the control area (chapter 4)
was limited by the different community sizes and the almost unavoidable irregularities of the
sample size due to drop-outs and the enlargement of the sample. The percentages of people
who knew about SODIS at the beginning of the study were also quite different. Moreover, the
interviewers had to be involved in distributing the prompts.

Discussion 182
In general, the results have been calculated using two different samples: a periurban and
a rural one. These samples are different in some of their characteristics, especially in their
education, their lifestyle and their initial level of SODIS knowledge. Nevertheless, results from
both studies were combined. On one hand, this adds valuable insights into the results, on the
other hand in later studies the results calculated with a periurban sample should be confirmed
with a rural sample and vice versa.
Another limitation related to the two different samples this thesis is based on, is the
change of the measurement scale from 4- to 5-point for unipolar items and 7- to 9-point for
bipolar items. This seemed necessary to achieve more variance of the answers. To have
comparable mean values, scales were for both studies rescaled to scores between -1 and 1,
however, it cannot be excluded that some of the differences between Study I and II are due to
the different scales. Therefore, studies I and II were not directly comparable with each other.
There are also some validity insecurities regarding the operationalizations of some habit
indicators. For example, based on the results of chapter 4, it is suspected that the variable
commitment was not well understood by the people (or not in the intended sense).
Open issues
All the different communication channels that were used in Study II could be investigated
much more in detail. Unfortunately, a strong confounding of the different active communication
channels was observed, therefore an analysis with the present data would be limited in validity.
Future field studies could more systematically investigate the effects of radio, workshops, home
visits, school activities and others, which would be very valuable input to practitioners not only in
the field of SODIS promotion.
Another topic that urgently needs to be addressed is social influence and how this could
be used in a positive way. Obviously, a non-separable part of the social influence is the
interpersonal communication. Especially in a rural context, where every neighbor is certainly
always looking and interested in what the other neighbors are doing, and where exchange of
information via verbal channels is indispensible, because newspapers are non-existent, social
influence is certainly of importance. We know that during the both studies presented in this
thesis, it was not talked very frequently about SODIS. However, people do talk and the question
is, how talking about SODIS can be facilitated, and if an influence on behavior takes place. Here,
suitable theoretical communication models as well as empirical investigations are missing.
Another issue in the context of SODIS promotion is not only the analysis of SODIS
behavior, but as it was already tried in chapter 1, analyzing the entire water consumption pattern
and its predictors. There are more studies needed. For defining campaign effectiveness in the
sense that people’s health gets improved, it is important to achieve that untreated water

Discussion 183
consumption is reduced to a minimum. The reason is of course that no matter if people
consume SODIS water, if they also still consume untreated water, the positive health impact of
SODIS is severely weakened. More effort should be made to find out the important drivers of
untreated water consumption. If it is only the lack of an alternative, SODIS promotion campaigns
can further concentrate on SODIS promotion. The high correlations between the two water
consumption behaviors already indicate that the lack of a suitable alternative is an important
driver for untreated water consumption, however more data is needed.


References 185
REFERENCES
Aarts, H., & Dijksterhuis, A. (2000a). On the autoatic activation of goal-directed behavior: The
case of travel habit. Journal of Environmental Psychology, 20, 75-82.
Aarts, H., & Dijksterhuis, A. (2000b). Habits as knowledge structures: Automaticity in goal-
directed behavior. Journal of Personality and Social Psychology, 78(1), 53-63.
Aarts, H., Dijksterhuis, A., & Midden, C. (1999). To plan or not to plan? Goal achievement or
interrupting the performance of mundane behaviors. European Journal of Social
Psychology, 29(8), 971-979.
Aarts, H., Verplanken, B., & Van Knippenberg, A. (1998). Predicting behavior from actions in the
past: Repeated decision making or a matter of habit? Journal of Applied Social
Psychology, 28(15), 1355-1374.
Abraham, C., Norman, P., & Conner, M. (2000). Towards a psychology of health-related
behavior change. In P. Norman, C. Abraham & M. Conner (Eds.), Understanding and
changing health behavior: From health beliefs to self-regulation. Amsterdam: Harwood.
Abrahamse, W., Steg, L., Vlek, C., & Rothengatter, T. (2005). A review of intervention studies
aimed at household energy conservation. Journal of Environmental Psychology, 25(3),
273-291.
Acra, A., Karahagopian, Y., Raffoul, Z., & Dajani, R. (1980). Disinfection of oral rehydration
solutions by sunlight. The Lancet, 316(8206), 1257-1258.
Ajzen, I. (1985). From intentions to actions: A theory of planned behaviour. In J. Kuhl & J.
Beckmann (Eds.), Action control: From cognition to behaviour (pp. 11-39). Berlin:
Springer.
Ajzen, I. (1991). The theory of planned behavior. Organizational Behavior and Human Decision
Processes, 50(2), 179-211.
Ajzen, I. (2002a). Residual effects of past on later behavior: Habituation and reasoned action
perspectives. Personality and Social Psychology Review, 6(2), 107-122.
Ajzen, I. (2002b). Perceived behavioral control, self-efficacy, locus of control, and the theory of
planned behavior. Journal of Applied Social Psychology, 32(4), 665-683.
Ajzen, I., & Madden, T. J. (1986). Prediction of goal-directed behavior: Attitudes, intentions, and
perceived behavioral control. Journal of Experimental Social Psychology, 22(5), 453-474.
Alcalay, R. (1983). The impact of mass communication campaigns in the health field. Social
Science & Medicine, 17(2), 87-94.
Altherr, A.-M., Mosler, H.-J., Tobias, R., & Butera, F. (2008). Attitudinal and relational factors
predicting the use of solar water disinfection: A field study in Nicaragua. Health Education
& Behavior, 35(2), 207-220.
Armitage, C. J., & Conner, M. (2001). Efficacy of the Theory of Planned Behaviour: A meta-
analytic review. British Journal of Social Psychology, 40(4), 471-499.

References 186
Aronson, E., & O'Leary, M. (1982-1983). The relative effectiveness of models and prompts on
energy conservation: A field experiment in a shower room. Journal of Environmental
Systems, 12(3), 219-224.
Bagozzi, R. P. (1981). Attitudes, intentions, and behavior: A test of some key hypotheses.
Journal of Personality and Social Psychology, 41(4), 607-627.
Baltes, M. M., & Hayward, S. C. (1976). Application and evaluation of strategies to reduce
pollution: Behavioral control of littering in a football stadium. Journal of Applied
Psychology, 61(4), 501-506.
Bamberg, S. (1996). Habitualisierte Pkw-Nutzung: Integration des Konstrukts "Habit" in die
Theorie des geplanten Verhaltens [Habitualized car usage: Integrating the habit construct
into the theory of planned behavior]. Zeitschrift für Sozialpsychologie, 27(4), 295-310.
Bamberg, S. (2002). Effects of implementation intentions on the actual performance of new
environmental friendly behaviours - Results of two field experiments. Journal of
Environmental Psychology, 22(4), 399-411.
Bamberg, S., Ajzen, I., & Schmidt, P. (2003). Choice of travel mode in the theory of planned
behavior: The roles of past behavior, habit, and reasoned action. Basic and Applied
Social Psychology, 25(3), 175-187.
Bandura, A. (1982). Self-efficacy mechanism in human agency. American Psychologist, 37(2),
122-147.
Bargh, J. A., & Gollwitzer, P. M. (1994). Environmental control of goal-directed action: Automatic
and strategic contingencies between situations and behavior. In W. D. Spaulding (Ed.),
Nebraska symposium on motivation (Vol. 41, pp. 71-124). Lincoln: University of Nebraska
Press.
Bentler, P. M., & Speckart, G. (1979). Models of attitude-behavior relations. Psychological
Review, 86(5), 452-464.
Berney, M., Weilenmann, H.-U., & Egli, T. (2006). Flow-cytometric study of vital cellular
functions in Escherichia coli during solar disinfection (SODIS). Microbiology, 152(6),
1719-1729.
Berney, M., Weilenmann, H. U., Simonetti, A., & Egli, T. (2006). Efficacy of solar disinfection of
Escherichia coli, Shigella flexneri, Salmonella Typhimurium and Vibrio cholerae. Journal
of Applied Microbiology, 101(4), 828-836.
Borsari, B., & Carey, K. B. (2003). Descriptive and injunctive norms in college drinking: A meta-
analytic integration. Journal of Studies on Alcohol and Drugs, 64(3), 331-341.
Boyle, M., Sichel, C., Fernandez-Ibanez, P., Arias-Quiroz, G. B., Iriarte-Puna, M., Mercado, A.,
et al. (2008). Bactericidal effect of solar water disinfection under real sunlight conditions.
Applied and Environmental Microbiology, 74(10), 2997-3001.
Brandstätter, V., Lengfelder, A., & Gollwitzer, P. M. (2001). Implementation intentions and
efficient action initiation. Journal of Personality & Social Psychology, 81(5), 946-960.
Breckler, S. J., & Wiggins, E. C. (1989). Affect versus evaluation in the structure of attitudes.
Journal of Experimental Social Psychology, 25(3), 253-271.

References 187
Brehm, J. W. (1966). A theory of psychological reactance. New York: Academic Press.
Brehm, J. W., & Cohen, A. R. (1962). Explorations in cognitive dissonance. New York: Wiley.
Brehm, S. S., & Brehm, J. W. (1981). Psychological reactance: A theory of freedom and control.
New York: Academic Press.
Browne, M. W., & Cudeck, R. (1993). Alternative ways of assessing model fit. In K. A. Bollen & J.
S. Long (Eds.), Testing structural equation models (pp. 136-162). Newbury Park, CA:
Sage.
Burn, S. M. (1991). Social psychology and the stimulation of recycling behaviors: The block
leader approach. Journal of Applied Social Psychology, 21(8), 611-629.
Burn, S. M., & Oskamp, S. (1986). Increasing community recycling with persuasive
communication and public commitment. Journal of Applied Social Psychology, 16(1), 29-
41.
Calnan, M., & Rutter, D. R. (1988). Do health beliefs predict health behaviour? A follow-up
analysis of breast self-examination. Social Science & Medicine, 26(4), 463-465.
Carey, M. P., & Schroder, K. E. E. (2002). Development and psychometric evaluation of the
brief HIV knowledge questionnaire (HIV-KQ-18). AIDS education and prevention, 14, 174-
184.
Chasteen, A. L., Park, D. C., & Schwarz, N. (2001). Implementation intentions and facilitation of
prospective memory. Psychological Science, 12(6), 457-461.
Cialdini, R. B. (2001). Influence: Science and practice (Vol. 4). Boston, MA: Allyn and Bacon.
Cialdini, R. B. (2003). Crafting normative messages to protect the environment. Current
Directions in Psychological Science, 12(4), 105-109.
Cialdini, R. B., Reno, R. R., & Kallgren, C. A. (1990). A focus theory of normative conduct:
Recycling the concept of norms to reduce littering in public places. Journal of Personality
and Social Psychology, 58(6), 1015-1026.
Conner, M., & Armitage, C. J. (1998). Extending the theory of planned behavior: A review and
avenues for further research. Journal of Applied Social Psychology, 28(15), 1429-1464.
Conroy, R. M., Elmore-Meegan, M., Joyce, T., McGuigan, K. G., & Barnes, J. (1996). Solar
disinfection of drinking water and diarrhoea in Maasai children: A controlled field trial. The
Lancet, 348(9043), 1695-1697.
Conroy, R. M., Elmore-Meegan, M., Joyce, T., McGuigan, K. G., & Barnes, J. (1999). Solar
disinfection of water reduces diarrhoeal disease: An update. Archives of Disease in
Childhood, 81(4), 337-338.
Conroy, R. M., Elmore-Meegan, M., Joyce, T., McGuigan, K. G., & Barnes, J. (2001). Solar
disinfection of drinking water protects against cholera in children under 6 years of age.
Archives of Disease in Childhood, 85(4), 293-295.
Cook, S. W., & Berrenberg, J. L. (1981). Approaches to encouraging conservation behavior: A
review and conceptual framework. Journal of Social Issues, 37(2), 73-107.
Corbett, J. B. (2002). Motivations to participate in riparian improvement programs: Applying the
theory of planned behavior. Science Communication, 23(3), 243-263.

References 188
Cox, C. D., Cox, B. S., & Cox, D. J. (2005). Long-term benefits of prompts to use safety belts
among drivers exiting senior communities. Journal of Applied Behavior Analysis, 38(4),
533-536.
Craw, P. J., Leland, L. S. J., Bussell, M. G., Munday, S. J., & Walsh, K. (2006). The mural as
graffiti deterrence. Environment and Behavior, 38(3), 422-434.
Dahlstrand, U., & Biel, A. (1997). Pro-environmental habits: Propensity levels in behavioral
change. Journal of Applied Social Psychology, 27(7), 588-601.
De Groot, J., & Steg, L. (2007). General beliefs and the theory of planned behavior: The role of
environmental concerns in the TPB. Journal of Applied Social Psychology, 37(8), 1817-
1836.
De Young, R. (1988). Exploring the difference between recyclers and non-recyclers: The role of
information. Journal of Environmental Systems, 18(4), 341-351.
De Young, R. (1993). Changing behavior and making it stick: The conceptualization and
management of conservation behavior. Environment and Behavior, 25(4), 485-505.
DeLeon, I. G., & Fuqua, R. W. (1995). The effects of public commitment and group feedback on
curbside recycling. Environment and Behavior, 27(2), 233-250.
Dwyer, W. O., Leeming, F. C., Cobern, M. K., Porter, B. E., & Jackson, J. M. (1993). Critical
review of behavioral interventions to preserve the environment: Research since 1980.
Environment and Behavior, 25(3), 275-321.
Einstein, G. O., & McDaniel, M. A. (1995). Aging and prospective memory: Examining the
influences of self-initiated retrieval processes. Journal of Experimental Psychology /
Learning, Memory & Cognition, 21(4), 996.
Ellis, J. A. (1996). Prospective memory or the realization of delayed intentions: A conceptual
framework for research. In M. A. Brandimonte, G. O. Einstein & M. A. McDaniel (Eds.),
Prospective memory: Theory and applications (pp. 1-22). Hillsdale, NJ: Erlbaum.
Fabrigar, L. R., & Petty, R. E. (1999). The role of the affective and cognitive bases of attitudes in
susceptibility to affectively and cognitively based persuasion. Personality and Social
Psychology Bulletin, 25(3), 363-381.
Festinger, L. (1957). A theory of cognitive dissonance. Stanford: Stanford University Press.
Field, A. (2005). Discovering statistics using SPSS (2nd ed.). London, Thousand Oaks, New
Delhi: Sage Publications.
Fishbein, M., & Ajzen, I. (1975). Belief, attitude, intention, and behavior: An introduction to
theory and research. Reading, Mass: Addison-Wesley.
Flury-Kleubler, P., & Gutscher, H. (2001). Psychological principles of inducing behavior change.
In R. Kaufmann-Hayoz & H. Gutscher (Eds.), Changing things - moving people.
Strategies for promoting sustainable development at the local level (pp. 109-129). Basel:
Birkhäuser.
Fredricks, A. J., & Dossett, D. L. (1983). Attitude-behavior relations: A comparison of the
Fishbein-Ajzen and the Bentler-Speckart models. Journal of Personality and Social
Psychology, 45(3), 501-512.

References 189
Frey, D., Stahlberg, D., & Wortmann, K. (1990). Energieverbrauch und Energiesparen [Energy
consumption and energy saving]. In L. Kruse, C.-F. Graumann & E.-D. Lantermann (Eds.),
Ökologische Psychologie [Ecological psychology] (pp. 680-690). Munich: Psychologie
Verlags Union.
Frick, J. (2003). Umweltbezogenes Wissen: Struktur, Einstellungsrelevanz und
Verhaltenswirksamkeit [Environmental knowledge: Structure, attitude relevance and
behavioral relevance]. Unpublished Dissertation, University of Zurich, Zurich.
Fuchs, R. (1997). Psychologie und körperliche Bewegung [Psychology and physical activity].
Göttingen: Hogrefe.
Fuchs, R. (2003). Sport, Gesundheit und Public Health [Sport, well-being and public health].
Göttingen: Hogrefe.
Fuchs, R., Seelig, H., & Kilian, D. (2005). Selbstkonkordanz und Sportteilnahme: Eine
clusteranalytische Untersuchung verschiedener Formen des Dabeibleibens und
Abbrechens [Self-concordance and sports participation: A clusteranalytical exploration of
different forms of continuance and relapse]. Zeitschrift für Gesundheitspsychologie
[Journal of Health Psychology], 13(3), 126-138.
Fugazza, A. S. (2009). Warum wird die Anwendung von SODIS wieder abgebrochen? Am
Beispiel SODIS in Bolivien [Why do people stop using SODIS? The example of SODIS in
Bolivia]. Unpublished Lizentiatsarbeit (Master Thesis), University of Zurich, Zurich.
Gaafar, M. R. (2007). Effect of solar disinfection on viability of intestinal protozoa in drinking
water. Journal of the Egyptian Society of Parasitology, 37(1), 65-86.
Gamper, S. (2004). Acceptance, use and health impact of Solar Water Disinfection. A case
study from Rajoa and Chiniot (Report). Dübendorf: Eawag/Sandec.
Geller, E. S. (1981). Evaluating energy conservation programs: Is verbal report enough? The
Journal of Consumer Research, 8(3), 331-335.
Geller, E. S. (1987). Applied behavior analysis and environmental psychology: From strange
bedfellows to a productive marriage. In D. Stokols & I. Altmann (Eds.), Handbook of
environmental psychology (Vol. 1, pp. 361-388). New York: Wiley.
Geller, E. S. (1989). Applied behavior analysis and social marketing: An integration for
environmental preservation. Journal of Social Issues, 45(1), 17-36.
Gierl, H. (1987). Die Erklärung der Diffusion technischer Produkte [The explanation of the
diffusion of technical products]. Berlin: Duncker und Humblot.
Godin, G., & Kok, G. (1996). The theory of planned behavior: A review of its applications to
health-related behaviors. American Journal of Health Promotion, 11, 87-98.
Gollwitzer, P. M. (1993). Goal achievement: the role of intentions. In W. Stroebe & M. Hewstone
(Eds.), European Review of Social Psychology (Vol. 4, pp. 141-185). Munich: John Wiley
& Sons Ltd.
Gollwitzer, P. M. (1996). The volitional benefits of planning. In P. M. Gollwitzer & J. A. Bargh
(Eds.), The psychology of action: Linking cognition and motivation to behavior (pp. 287-
312). London: Guilford Press.

References 190
Gollwitzer, P. M. (1999). Implementation intentions: Strong effects of simple plans. American
Psychologist, 54(7), 493-503.
Goschke, T., & Kuhl, J. (1993). Representation of intentions: Persisting activation in memory.
Journal of Experimental Psychology: Learning, Memory and Cognition, 19, 1211-1226.
Goschke, T., & Kuhl, J. (1996). Remembering what to do: Explicit and implicit memory for
intentions. In M. A. Brandimonte, G. O. Einstein & M. A. McDaniel (Eds.), Prospective
memory: Theory and applications (pp. 53-91). Hillsdale, NJ: Erlbaum.
Graf, J., Meierhofer, R., Wegelin, M., & Mosler, H.-J. (2008). Water disinfection and hygiene
behaviour in an urban slum in Kenya: impact on childhood diarrhoea and influence of
beliefs. International Journal of Environmental Health Research, 18(5), 335-355.
Griffin, R. J., & Dunwoody, S. (2000). The relation of communication to risk judgment and
preventive behavior related to lead in tap water. Health Communication, 12(1), 81-107.
Grimm, B. (2004). Bottles for our health. Report of the SODIS dissemination project. Phase II:
April 2003 – March 2004: JDA Kokand.
Grimm, B. (2006). Health impact study. Uzbekistan 2004 – 2006: JDA Kokand.
Haller, L., & Hutton, G. (2004). Evaluation of the costs and benefits of water and sanitation
improvements at the global level. Geneva: WHO.
Hansmann, R., & Scholz, R. W. (2003). A two-step informational strategy for reducing littering
behavior in China. Environment and Behavior, 35(6), 752-762.
Heaselgrave, W., Patel, N., Kilvington, S., Kehoe, S. C., & McGuigan, K. G. (2006). Solar
disinfection of poliovirus and Acanthamoeba polyphaga cysts in water - a laboratory study
using simulated sunlight. Letters in Applied Microbiology, 43(2), 125-130.
Heckhausen, H. (1991). Motivation and action. Berlin, Germany: Springer Verlag.
Heckhausen, H., & Gollwitzer, P. M. (1987). Thought contents and cognitive functioning in
motivational versus volitional states of mind. Motivation and Emotion, 11(2), 101-120.
Heckhausen, H., & Kuhl, J. (1985). From wishes to action: The dead ends and short cuts on the
long way to action. In M. Frese & J. Sabini (Eds.), Goal-directed behavior: Psychological
theory and research on action (pp. 134-160, 367-395). Hillsdale, N.J.: Erlbaum.
Heri, S., & Mosler, H.-J. (2008). Factors affecting the diffusion of solar water disinfection: A field
study in Bolivia. Health Education & Behavior, 35(4), 541-560.
Herzog, T. A., Abrams, D. B., Emmons, K. M., Linnan, L. A., & Shadel, W. G. (1999). Do
processes of change predict smoking stage movements? A prospective analysis of the
transtheoretical model. Health Psychology, 18(4), 369-375.
Hobbins, M. (2003). The SODIS health impact study (Summary Report). Basel: Swiss Tropical
Institute.
Hoffmeyer-Zlotnik, J. H. P. (1997). Random-Route-Stichproben nach ADM [Random-route
sampling according to ADM]. In S. Gabler & J. H. P. Hoffmeyer-Zlotnik (Eds.),
Stichproben in der Umfragepraxis [Samples in Survey Research] (pp. 33-42). Opladen:
Westdeutscher Verlag.

References 191
Homburg, A., & Matthies, E. (1998). Umweltpsychologie [Environmental psychology]. Weinheim,
München: Juventa Verlag.
Hopper, J. R., & McCarl Nielsen, J. (1991). Recycling as altruistic behavior: Normative and
behavioral strategies to expand participation in a community recycling program.
Environment and Behavior, 23(2), 195-220.
Huber, A. C., Tamas, A., Mosler, H.-J., & Meyer, B. (in preparation). The modes of operation of
prompts and public commitment: A field study in Bolivia.
Inauen, J. (2007). How prompts and public commitment affect the use of solar water disinfection:
A time series analysis. Unpublished Lizentiatsarbeit (Master Thesis), University of Zurich,
Zurich.
Johnston, J. J., Hendricks, S. A., & Fike, J. M. (1994). Effectiveness of behavioral safety belt
interventions. Accident Analysis and Prevention, 26(3), 315-323.
Jöreskog, K., & Sörbom, D. (1993). Structural equation modeling with the SIMPLIS command
language. Hillsdale, NJ: Lawrence Erlbaum Associates.
Jöreskog, K., & Sörbom, D. (1996). PRELIS2: User's reference guide. Chicago: Scientific
Software International.
Jöreskog, K., & Sörbom, D. (2003). LISREL 8.54: SSI Central.
Kabra, H. (2005, April 15). Pure water for all. The Hindu Business Line, .
Kaiser, F. G., & Gutscher, H. (2003). The proposition of a general version of the theory of
planned behavior: Prediction ecological behavior. Journal of Applied Social Psychology,
33(3), 586-603.
Katz, E., & Lazarsfeld, P. F. (1955). Personal influence: The part played by people in the flow of
mass communications. Glencoe, IL: Free Press.
Katzev, R. D., & Johnson, T. R. (1983). A social-psychological analysis of residential electricity
consumption: The impact of minimal justification techniques. Journal of Economic
Psychology, 3(3-4), 267-284.
Katzev, R. D., & Pardini, A. U. (1988). The comparative effectiveness of reward and
commitment approaches in motivating community recycling. Journal of Environmental
Systems, 17(2), 93-113.
Kehoe, S. C., Barer, M. R., Devlin, L. O., & McGuigan, K. G. (2004). Batch process solar
disinfection is an efficient means of disinfecting drinking water contaminated with Shigella
dysenteriae type I. Letters in Applied Microbiology, 38(5), 410-414.
Kelly, J. A., St. Lawrence, J. S., Diaz, Y. E., Stevenson, L. Y., Hauth, A. C., Brasfield, T. L., et al.
(1991). HIV risk behavior reduction following intervention with key opinion leaders of
population: An experimental analysis. American Journal of Public Health, 81(2), 168-171.
Klöckner, C. A., Matthies, E., & Hunecke, M. (2003). Problems of operationalizing habits and
intergrating habits in normative decision-making models. Journal of Applied Social
Psychology, 33(2), 396-417.

References 192
Knussen, C., Yule, F., MacKenzie, J., & Wells, M. (2004). An analysis of intentions to recycle
household waste: The roles of past behaviour, perceived habit, and perceived lack of
facilities. Journal of Environmental Psychology, 24(2), 237-246.
Landua, D. (1993). Veränderungen von Zufriedenheitsangaben in Panelbefragungen: Analyse
über nicht beabsichtigte Effekte des Längsschnittdesigns [Change in reports of
contentedness: An analysis of unintended effects of longitudinal measurement designs].
Kölner Zeitschrift für Soziologie und Sozialpsychologie [Cologne Journal of Sociology and
Social Psychology], 3, 553-571.
Lazarsfeld, P. F., & Merton, R. K. (1954). Friendship as a social process: A substantive and
methodological analysis. In M. Berger, T. Abel & C. H. Page (Eds.), Freedom and control
in modern society (pp. 18-66). New York: Van Nostrand.
Levy-Storms, L., & Wallace, S. P. (2003). Use of mammography screening among older
Samoan women in Los Angeles county: A diffusion network approach. Social Science &
Medicine, 57(6), 987-1000.
Lippke, S., & Sniehotta, F. F. (2003). Ernährungsverhalten aus handlungsorientierter Sicht: Das
Multistadienmodell der Gesundheitsverhaltensänderung [Diet behavior from an action-
oriented point of view: The multi stage model of health behavior change]. Zeitschrift für
Gesundheitspsychologie [Journal of Health Psychology], 11(4), 143-152.
Lippke, S., Ziegelmann, J., & Schwarzer, R. (2004). Behavioral intentions and action plans
promote physical exercise: A longitudinal study with orthopedic rehabilitation patients.
Journal of Sport & Exercise Psychology, 26(3), 470-483.
Lippke, S., Ziegelmann, J. P., & Schwarzer, R. (2005). Stage-specific adoption and
maintenance of physical activity: testing a three-stage model. Psychology of Sport and
Exercise, 6(5), 585-603.
Logan, G. D. (1980). Attention and automaticity in Stroop and priming tasks: Theory and data.
Cognitive Psychology, 12(4), 523-553.
Lonnen, J., Kilvington, S., Kehoe, S. C., Al-Touati, F., & McGuigan, K. G. (2005). Solar and
photocatalytic disinfection of protozoan, fungal and bacterial microbes in drinking water.
Water Research, 39(5), 877-883.
Luszczynska, A., & Schwarzer, R. (2003). Planning and self-efficacy in the adoption and
maintenance of breast self-examination: A longitudinal study on self-regulatory cognitions.
Psychology & Health, 18(1), 93 - 108.
MacKenzie, T. D., Ellison, R. T., & Mostow, S. R. (1992). Sunlight and cholera. The Lancet,
340(8815), 367.
Maddux, J. E., Brawley, L., & Boykin, A. (1995). Self-efficacy and health behavior. Prevention,
promotion and detection. In J. E. Maddux (Ed.), Self-efficacy, Adaptation, and Adjustment:
Theory, Research, and Application (pp. 173-202). New York: Plenum.
Mahmood, M. S., & Lodhi, T. E. (2005). Promoting SODIS: Pakistan. In Examples of successful
experiences in providing safe drinking water (Vol. 11, pp. 171-178). New York: UNDP.

References 193
Mäntylä, T. (1996). Activating actions and interrupting intentions: Mechanisms of retrieval
sensitization in prospective memory. In M. A. Brandimonte, G. O. Einstein & M. A.
McDaniel (Eds.), Prospective memory: Theory and applications (pp. 93-113). Hillsdale,
NJ: Erlbaum.
Marsh, R. L., Hicks, J. L., & Hancock, T. W. (2000). On the interaction of ongoing cognitive
activity and the nature of an event-based intention. Applied Cognitive Psychology, 14(7),
S29-S41.
McGuigan, K. G., Joyce, T. M., Conroy, R. M., Gillespie, J. B., & Elmore-Meegan, M. (1998).
Solar disinfection of drinking water contained in transparent plastic bottles: Characterizing
the bacterial inactivation process. Journal of Applied Microbiology, 84(6), 1138-1148.
McGuigan, K. G., Mendez-Hermida, F., Castro-Hermida, J. A., Ares-Mazas, E., Kehoe, S. C.,
Boyle, M., et al. (2006). Batch solar disinfection inactivates oocysts of Cryptosporidium
parvum and cysts of Giardia muris in drinking water. Journal of Applied Microbiology,
101(2), 453-463.
Meacham, J. A, & Colombo, J. A. (1980). External retrieval cues facilitate prospective
remembering in young children. Journal of Educational Research, 73(5), 299-301.
Meierhofer, R., & Wegelin, M. (2002). Solar Water Disinfection: A guide for the application of
SODIS. (SANDEC Rep. No. 06/02). Dübendorf, Switzerland: EAWAG/SANDEC.
Retrieved July 15, 2007, from http://www.sodis.ch/files/SODIS_Manual_english.pdf.
Menard, S. (1995). Applied logistic regression analysis (Sage university paper series on
quantitative applications in the social sciences, 07-106). Thousand Oaks, CA: Sage.
Méndez-Hermida, F., Castro-Hermida, J. A., Ares-Mazás, E., Kehoe, S. C., & McGuigan, K. G.
(2005). Effect of batch-process solar disinfection on survival of cryptosporidium parvum
oocysts in drinking water. Applied and Environmental Microbiology, 71(3), 1653-1654.
Mercado, A. (2005). Solar disinfection: Latin America. In Examples of successful experiences in
providing safe drinking water (Vol. 11, pp. 157-169). New York: UNDP.
Michie, S., Dormandy, E., French, D. P., & Marteau, T. M. (2004). Using the theory of planned
behaviour to predict screening uptake in two contexts. Psychology & Health, 19(6), 705–
718.
Montes, P., & Dorado, C. (2007). Chuquisaca: Situación actual, evaluación y perspectivas
[Chuquisaca: Current situation, evaluation and perspectives]. La Paz: Weinberg S.R.L.
Manufacturas y Imprentas.
Moore, G. C., & Benbasat, I. (1991). Development of an instrument to measure the perceptions
of adopting an information technology innovation. Information Systems Research, 2(3),
192-222.
Moser, S., Heri, S., & Mosler, H.-J. (2005). Determinants of the diffusion of SODIS: A
quantitative field study in Bolivia. Retrieved 12.03.2008, from
http://www.sodis.ch/files/Factors_SODIS-Diff_Bolivia.pdf

References 194
Moser, S., & Mosler, H.-J. (2008). Differences in influence patterns between groups predicting
the adoption of a solar disinfection technology for drinking water in Bolivia. Social Science
& Medicine, 67(4), 497-504.
Mosler, H.-J., & Gutscher, H. (1998). Umweltpsychologische Interventionsformen für die Praxis
[Intervention methods from environmental psychology for practical use].
Umweltpsychologie [Environmental Psychology], 2(2), 64-79.
Mosler, H.-J., Gutscher, H., & Artho, J. (2001). Wie können viele Personen für eine kommunale
Umweltaktion gewonnen werden? [How can many people be won over for a communal
environmental action?] Umweltpsychologie [Environmental Psychology], 5(2), 122-140.
Mosler, H.-J., Tamas, A., Tobias, R., Caballero Rodriguez, T., & Guzman Miranda, O. (2008).
Deriving interventions on the basis of factors influencing behavioral intentions for waste
recycling, composting and reuse in Cuba. Environment and Behavior, 40(4), 522-544.
Mosler, H.-J., & Tobias, R. (2007a). Umweltpsychologische Interventionsformen neu gedacht
[Rethinking forms of interventions of environmental psychology]. Umweltpsychologie
[Environmental Psychology], 11(1), 35-54.
Mosler, H.-J., & Tobias, R. (2007b, 12.11.2007). How do commitments work? An agent based
simulation using data from a recycling campaign in Santiago de Cuba. Paper presented
at the 2007 International Conference on Artificial Intelligence, Las Vegas, USA.
Myers, R. (1990). Classical and modern regression with applications (2nd ed.). Boston, MA:
Duxbury.
Olson, J. M., & Zanna, M. P. (1993). Attitudes and attitude change. Annual Review of
Psychology, 44, 117-154.
Ouellette, J. A., & Wood, W. (1998). Habit and intention in everyday life: The multiple processes
by which past behavior predicts future behavior. Psychological Bulletin, 124(1), 54-74.
Pahmeier, I. (1994). Drop-out und Bindung im Breiten- und Gesundheitssport: Günstige und
ungünstige Bedingungen für eine Sportpartizipation [Drop-out and commitment in mass
sports activities: Supporting and hindering conditions for sports partizipation].
Sportwissenschaft [Sports Science], 24(2), 117-150.
Park, H. S., & Smith, S. W. (2007). Distinctiveness and influence of subjective norms, personal
descriptive and injunctive norms, and societal descriptive and injunctive norms on
behavioral intent: A case of two behaviors critical to organ donation. Human
Communication Research, 33(2), 194-218.
Passanisi, N., Prout, M., & Holm, L. J. (2001). The New England Division. Tell a friend program
implementation evaluation. Cancer Practice, 9(1), 64-71.
Pavlov, I. P. (1927). Conditioned reflexes. New York: Oxford University Press.
Petty, & Wegener, D. T. (1998). Attitude change: multiple roles for persuasion variables. In D. T.
Gilbert, S. T. Fiske & G. Lindzey (Eds.), The handbook of social psychology (pp. 322-390).
New York: Oxford University Press.
Petty, R. E., & Cacioppo, J. T. (1986). Communication and persuasion: Central and peripheral
routes to attitude change. New York: Springer Verlag.

References 195
Prochaska, J. O., & Di Clemente, C. C. (1982). Transtheoretical therapy: Toward a more
integrative model of change. Psychotherapy: Theory, Research, Practice, Training, 19(3),
276-288.
Prochaska, J. O., & DiClemente, C. C. (1983). Stages and processes of self-change of smoking:
Toward an integrative model of change. Journal of Consulting & Clinical Psychology,
51(3), 390-395.
Prochaska, J. O., DiClemente, C. C., & Norcross, J. C. (1992). In search of how people change:
Applications to addictive behaviours. American Psychologist, 47(9), 1102-1114.
Prochaska, J. O., Velicer, W. E., Rossi, J. S., Goldstein, M. G., Marcus, B. H., Rakowski, W., et
al. (1994). Stages of change and decisional balance for 12 problem behaviors. Health
Psychology, 13(1), 39-46.
Rainey, R. C., & Harding, A. K. (2005). Acceptability of solar disinfection of drinking water
treatment in Kathmandu Valley, Nepal. International Journal of Environmental Health
Research, 15(5), 361-372.
Reiter, S. M., & Samuel, W. (1980). Littering as a function of prior litter and the presence of
absence of prohibitive signs. Journal of Applied Social Psychology, 10(1), 45-55.
Rhodes, R. E., & Courneya, K. S. (2003). Investigating multiple components of attitude,
subjective norm, and perceived control: An examination of the theory of planned
behaviour in the exercise domain. British Journal of Social Psychology, 42(1), 129-146.
Rise, J., Thompson, M., & Verplanken, B. (2003). Measuring implementation intentions in the
context of the theory of planned behavior. Scandinavian Journal of Psychology, 44, 87-95.
Rogers, E. M. (1983). Diffusion of innovations (3rd ed.). New York: Free Press.
Rogers, E. M. (1995). Diffusion of innovations (4th ed.). New York: Free Press.
Rogers, E. M. (2003). Diffusion of innovations (5th ed.). New York: Free Press.
Rogers, E. M., & Kincaid, D. L. (1981). Communication networks: Toward a new paradigm for
research. New York: Free Press.
Rogers, R. W. (1983). Cognitive and physiological processes in fear appeals and attitude
change: A revised theory of protection motivation. In J. T. Cacioppo & R. E. Petty (Eds.),
Social Psychophysiology: A sourcebook (pp. 153-176). New York: Guilford Press.
Rogers, R. W., & Prentice-Dunn, S. (1997). Protection motivation theory. In D. S. Gochman
(Ed.), Handbook of health behavior research I: Personal and social determinants (pp.
113-123). New York: Plenum Press.
Ronis, D. L., Yates, J. F., & Kirscht, J. P. (1989). Attitudes, decisions, and habits as
determinants of repeated behavior. In A. R. Pratkanis, S. J. Breckler & A. G. Greenwald
(Eds.), Attitude structure and function (pp. 213-239). Hillsdale: Erlbaum.
Rose, A., Roy, S., Abraham, V., Holmgren, G., George, K., Balraj, V., et al. (2006). Solar
disinfection of water for diarrhoeal prevention in southern India. Archives of Disease in
Childhood, 91(2), 139-141.
Rothman, A. J. (2000). Toward a theory-based analysis of behavioral maintenance. Health
Psychology, 19(1, Supplement 1), 64-69.

References 196
Rufener, S., Mäusezahl, D., Mosler, H.-J., & Weingartner, R. (submitted). Drinking water quality
between source and point-of-consumption – drinking cups as a high potential
recontamination risk: A field study in Bolivia. Epidemiology and Infection.
Ruiter, R. A. C., Abraham, C., & Kok, G. (2001). Scary warnings and rational precautions: A
review of the psychology of fear appeals. Psychology & Health, 16(6), 613–630.
Ryan, R. M., & Deci, E. L. (2000). Self-determination theory and the facilitation of intrinsic
motivation, social development, and well-being. American Psychologist, 55(1), 68-78.
Sachs, L. (1978). Angewandte Statistik: Statistische Methoden und ihre Anwendung (5th ed.).
Berlin: Springer.
Schahn, J. (1993). Die Kluft zwischen Einstellung und Verhalten beim individuellen
Umweltschutz [The gap between attitude and behavior when it comes to individual
environmental protection behavior]. In J. Schahn & T. Giesinger (Eds.), Psychologie für
den Umweltschutz [Psychology for environmental protection]. Weinheim: Psychologie-
Verlag-Union.
Scheirer, M. A. (1990). The life cycle of an innovation: Adoption versus discontinuation of the
fluoride mouth rinse program in schools. Journal of Health and Social Behavior, 31(2),
203-215.
Schermelleh-Engel, K., Moosbrugger, H., & Müller, H. (2003). Evaluating the fit of structural
equation models: Tests of significance and descriptive goodness-of-fit measures.
Methods of Psychological Research Online, 8(2), 23-74.
Scheuthle, H., & Kaiser, F. G. (2003). Umweltpsychologisch intervenieren [Interventions based
on environmental psychology]. In A. E. Auhagen & H.-W. Bierhoff (Eds.), Angewandte
Sozialpsychologie: Das Praxishandbuch [Applied psychology: The handbook for practive]
(pp. 575-591). Weinheim: Beltz / PVU.
Schultz, P. W., Oskamp, S., & Mainieri, T. (1995). Who recycles and when? A review of
personal and situational factors. Journal of Environmental Psychology, 15(2), 105-121.
Schüz, B., Sniehotta, F. F., Mallach, N., Wiedemann, A. U., & Schwarzer, R. (in press).
Predicting transitions from preintentional, intentional and actional stages of change.
Health Education Research, 24(1), 64-75.
Schwartz, S. H. (1973). Normative explanations of helping behavior: A critique, proposal, and
empirical test. Journal of Experimental Social Psychology, 9(4), 349-364.
Schwartz, S. H. (1977). Normative influence on altruism. In L. Berkowitz (Ed.), Advances in
experimental social psychology (Vol. 10, pp. 221-279). New York: Academic Press.
Schwarzer, R. (1992). Self-efficacy: Thought control of action. Washington, DC: Hemisphere.
Schwarzer, R. (2001). Social-cognitive factors in changing health-related behaviors. Current
Directions in Psychological Science, 10(2), 47-51.
Schwarzer, R. (2008). Modeling health behavior change: How to predict and modify the
adoption and maintenance of health behaviors. Applied Psychology: An International
Review, 57(1), 1-29.

References 197
Sheeran, P. (2002). Intention-behavior relations: A conceptual and empirical review. In W.
Stroebe & M. Hewstone (Eds.), European Review of Social Psychology (Vol. 12, pp. 1-
36). Chichester, UK: Wiley.
Sheeran, P., Milne, S., Webb, T. L., & Gollwitzer, P. M. (2005). Implementation intentions and
health behaviours. In M. Conner & P. Norman (Eds.), Predicting health behaviour:
Research and practice with social cognition models (2nd ed., pp. 276-323). Buckingham,
England: Open University Press.
Sheeran, P., Webb, T. L., & Gollwitzer, P. M. (2005). The interplay between goal intentions and
implementation intentions. Personality and Social Psychology Bulletin, 31(1), 87-98.
Shippee, G., & Gregory, W. L. (1982). Public commitment and energy conservation. American
Journal of Community Psychology, 10(1), 81-93.
Smith, R. J., Kehoe, S. C., McGuigan, K. G., & Barer, M. R. (2000). Effects of simulated solar
disinfection of water on infectivity of Salmonella typhimurium. Letters in Applied
Microbiology, 31(4), 284-288.
SODIS Reference Center (2008a). Solar Water Disinfection - The method. Retrieved
31.10.2008, from http://www.sodis.ch/Text2002/T-TheMethod.htm
SODIS Reference Center (2008b). Health improvements in SODIS projects. Retrieved
31.10.2008, from http://www.sodis.ch/Text2002/T-HealthImpact.htm
SODIS Reference Center (2008c). SODIS Use: Costs (Technical Note #16). Retrieved
31.10.2008, from http://www.sodis.ch/files/note16.pdf
Sommer, B., Mariño, A., Solarte, Y., Salas, M. L., Dierolf, C., Valiente, C., et al. (1997). SODIS -
an emerging water treatment process. Journal of Water Supply Research and
Technology-Aqua, 46(3), 127-137.
Tamas, A. (2006). Estudio de estrategias de difusión e intervención de SODIS en Cochabamba
y San Julian [Study of diffusion and intervention strategies of SODIS in Cochabamba and
San Julian] (Intermediate report for the Foundation SODIS, Bolivia). Dübendorf:
Eawag/SIAM.
Tamas, A. (2008). Reporte final del proyecto "Agua segura y manos limpias", Chuquisaca,
Bolivia [Final report of the project "Safe water and clean hands", Chuquisaca, Bolivia]
(Final report). Dübendorf: Eawag/SIAM.
Tamas, A., Tobias, R., & Mosler, H.-J. (accepted). Promotion of Solar Water Disinfection:
Comparing the effectiveness of different strategies in a longitudinal field study in Bolivia.
Health Communication.
Thyer, B. A., & Geller, E. S. (1987). The "buckle-up" dashboard sticker: An effective
environmental intervention for safety belt promotion. Environment and Behavior, 19(4),
484-494.
Tobias, R. (2007). Situative kognitive Wirkungen auf die Verhaltenswahl. Empirisch fundierte
Computersimulation der Wirkung von Gewohnheiten, Erinnerungshilfen, Vorsätzen,
Selbstverpflichtungen und situativen Normen [Situational cognitive effects on behavior
selection. Empirically founded computer simulation of the effects of habits, memory aids,

References 198
implementation intentions, self-commitment and situational norms]. Dissertation,
University of Zurich, Zurich.
Tolman, E. C., & Honzik, C. H. (1930). ‚Insight' in rats. In C. H. Honzik (Ed.), University of
California Publications in Psychology (Vol. 4, pp. 215-232). Berkeley: University Press.
Tonglet, M., Phillips, P. S., & Read, A. D. (2004). Using the theory of planned behaviour to
investigate the determinants of recycling behavior: A case study from Brixworth, UK.
Resources, Conservation and Recycling, 41(3), 191-214.
Tornatzky, L. G., & Klein, K. J. (1982). Innovation characteristics and innovation adoption
implementation: A meta-analysis of findings. IEEE Transactions on Engineering
Management, 29(1), 28-45.
Trafimow, D., & Sheeran, P. (1998). Some tests of the distinction between cognitive and
affective beliefs. Journal of Experimental Social Psychology, 34(4), 378-397.
Triandis, H. C. (1977). Interpersonal behavior. Monterey, CA: Brooks/Cole Publishing Company.
Triandis, H. C. (1980). Values, attitudes, and interpersonal behavior. In J. H. E. Howe & M. M.
Page (Eds.), Allgemeine Psychologie (pp. 323-372). Bern: Hans Huber.
United Nations (2003). Millennium Development Goals (MDGs). Retrieved 09.07.2007, from
http://www.un.org/millenniumgoals/
Valente, T. W., & Saba, W. P. (1998). Mass media and interpersonal influence in a reproductive
health communication campaign in Bolivia. Communication Research, 25(1), 96-124.
Van Der Pligt, J., & De Vries, N. K. (1998). Belief importance in expectancy-value models of
attitudes. Journal of Applied Social Psychology, 28(15), 1339-1354.
Verplanken, B., & Orbell, S. (2003). Reflections on Past Behavior: A Self-Report Index of Habit
Strength. Journal of Applied Social Psychology, 33(6), 1313-1330.
Vining, J., & Ebreo, A. (1990). What makes a recycler? A comparison of recyclers and
nonrecyclers. Environment and Behavior, 22(1), 55-73.
Wang, T. H., & Katzev, R. D. (1990). Group commitment and resource conservation: Two field
experiments on promoting recycling. Journal of Applied Social Psychology, 20(4), 265-
275.
Wellin, E. (1955). Water boiling in a Peruvian town. In B. D. Paul (Ed.), Health, culture and
community. New York: Russell Sage Foundation.
Wenninger, G. (2000). Lexikon der Psychologie: In fünf Bänden [Encyclopedia of Psychology: In
five volumes]. Heidelberg: Spektrum Akademischer Verlag GmbH.
West, R. (2005). Time for a change: Putting the transtheoretical (stages of change) model to
rest. Addiction, 100(8), 1036-1039.
WHO (2003). European health for all database (HFA-DB). Retrieved 9.10.2008, from
http://data.euro.who.int/hfadb/
WHO (2007). Combating waterborne disease at the household level. Retrieved 31.10.2008,
2008, from http://www.who.int/household_water/advocacy/combating_disease.pdf
WHO (2008). Household water treatment and safe storage. Retrieved 31.10.2008, from
http://www.who.int/household_water/en/

References 199
Witmer, J. F., & Geller, E. S. (1976). Facilitating paper recycling: Effects of prompts, raffles, and
contests. Journal of Applied Behavior Analysis, 9(3), 315-322.
Ziegelmann, J. P., Luszczynska, A., Lippke, S., & Schwarzer, R. (2007). Are goal intentions or
implementation intentions better predictors of health behavior? A longitudinal study in
orthopedic rehabilitation. Rehabilitation Psychology, 52(1), 97-102.
Zwane, A. P., & Kremer, M. (2007). What works in fighting diarrheal diseases in development
countries? A critical review. In S. Devarajan & G. Feder (Eds.), Research Observer (Vol.
22(1), pp. 1-24). Washington, DC: The World Bank.

Curriculum Vitae 200
CURRICULUM VITAE
Andrea Tamas Born 9th September 1977 in Leipzig, Germany German Citizen Professional experience
since Nov 08 Postdoc Position Swiss Federal Institute for Aquatic Science and Technology (Eawag), Department Water and Sanitation in Developing Countries (Sandec)
Aug 04 – Oct 08 PhD Thesis Swiss Federal Institute for Aquatic Science and Technology (Eawag), Department Systems Analysis, Integrated Assessment and Modelling (Siam)
Apr 04 – Jul 04 Research Assistant
University of Zurich, Department of Social Psychology Apr 03 – Aug 03 Internship
Institute of Work Research and Organizational Consulting (Zurich, Switzerland)
Sep 99 – May 03
Student Research Assistant and Diploma Thesis Max-Planck-Institute for Human Cognitive and Brain Sciences (Leipzig, Germany)
Sep 99 – Dec 99
Internship Advice Centre for Adolescents and Families, Youth Welfare Office (Leipzig, Germany)
Education
Apr 09 PhD in Psychology University of Zurich, Faculty of Arts, Department of Psychology Supervision: Prof. Dr. H.-J. Mosler (Eawag), Prof. Dr. Heinz Gutscher
(University of Zurich) Title: Successful promotion of solar water disinfection (SODIS)
Oct 03 Diploma in Psychology
University of Leipzig, Faculty of Biology, Pharmacy and Psychology Diploma Thesis: The 4-finger-Stroop: A variation of the colour-word-interference-task – validation study with functional Magnetic Resonance Imaging (fMRI)

Curriculum Vitae 201
Jan 03 Certified Trainer for "Coaching in social psychological based communication trainings" Psychologisches Zentrum GbR (Leipzig, Germany)
Jun 96 Abitur
Wilhelm-Oswald-Gymnasium (Leipzig, Germany) Various
Languages German (Mother tongue) English (fluent) Spanish (fluent)
Memberships IAESTE Student Network Switzerland
IPU (Initiative Psychology in Environmental Issues) IAPS (International Association for People Environment Studies)
Publications (peer reviewed)
in prep Tamas, A., Meyer, J. & Mosler, H.-J.: Predictors of treated and untreated water consumption in Bolivia (in: Integrative Psychological and Behavioral Science)
in prep Huber, A. C., Tamas, A., Mosler, H.-J. & Meyer, B.: The modes of operation of prompts and public commitment: A field study in Bolivia.
submitted Mosler, H.-J., Contzen, N., Kraemer, S. & Tamas, A.: Factors affecting informal interpersonal communication about a health innovation: disseminating solar water disinfection in Zimbabwe (in: Critical Studies in Media Communication)
submitted Tamas, A. & Mosler, H.-J.: Why do people stop treating their contaminated drinking water with solar water disinfection (SODIS)? (in: Health Psychology)
accepted Tamas, A., Tobias, R. & Mosler, H.-J.: Promotion of Solar Water Disinfection: Comparing the effectiveness of different strategies in a longitudinal field study in Bolivia (in: Health Communication)
2008 Mosler, H.-J., Tamas, A., Tobias, R., Caballero Rodriguez, T. & Guzman Miranda, O.: Deriving interventions on the basis of factors influencing behavioral intentions for waste recycling, composting and reuse in Cuba (in: Environment and Behavior, 40(5), 522-544)
Conferences
2009 Tamas, A. & Mosler, H.-J.: SODIS Promotion – Investigating the behavior change process (Paper at the Disinfection 2009, Atlanta, U.S.A.)
2008 Tamas, A.: Investigating interpersonal communication behavior as a precondition of sustainable diffusion of an innovation (Paper at the 20th IAPS International Conference, Rome, Italy)
2008 Tamas, A.: Successful long-term adoption of SODIS – evaluating different commitment interventions in rural Bolivia (Paper at the XXIX International Congress of Psychology, Berlin, Germany)
2008 Tamas, A., Huber, A. C. & Mosler, H.-J.: Promotion and adoption of SODIS in 2 areas of Bolivia with psychological behavior change strategies (Poster at the International Conference on Research for Development, Berne, Switzerland)
Curriculum Vitae 202
2008 Tamas, A. & Mosler, H.-J.: Comparing different communication strategies to promote Solar Water Disinfection (SODIS) (Poster at the Annual Conference of the North South Centre: Research for Development, Zurich, Switzerland)
2008 Tamas, A., Mosler, H.-J. & Tobias, R.: Promotion of a sustainable water disinfection method in Bolivia (Poster at the 9th Swiss Global Change Day, Berne, Switzerland)
2007 Tamas, A.: Adoption and behavior continuation of a healthy innovation: The example SODIS (Solar Water Disinfection) (Paper at the 7th biennial Conference on Environmental Psychology, Bayreuth, Germany)
2006 Tamas, A. & Mosler, H.-J.: Changing unhealthy habits – the effects of prompts and public self-commitment on drinking safe water (Paper at the 19th IAPS International Conference, Alexandria, Egypt)
2006 Tamas, A., Mosler, H.-J. & Tobias, R.: Diffusion of Solar Water Disinfection (SODIS) in Bolivia – Changing behaviour on a household level (Poster at the 26th International Congress of Applied Psychology, Athens, Greece)
2005 Tamas, A. & Mosler, H.-J.: Qualitative and quantitative analysis of factors that promote or hinder recycling, composting, and reusing waste in households of Santiago de Cuba (Paper at the 6th biennial Conference on Environmental Psychology, Bochum, Germany)
2005 Tamas, A., Mosler, H.-J., Tobias, R., Caballero Rodriguez, T. & Guzman Miranda, O.: Factors determining the intension to reuse, separate and compost household waste in the city of Santiago de Cuba (Paper at the Waste - The Social Context, Edmonton, Alberta, Canada)


