Embed Size (px)
Citation preview

Design & Print Studio
Successful PowerPoint conference postersHow to make the most of our templates and achieve the best results
This guide contains …
When to use our templates
Good practice
Fair examples
Poor examples
Before and after and our premium design service
The University’s PowerPoint templates for conference posters are designed and managed by the Design & Print Studio (DPS).
Our aim is to produce templates that are easy to use, but still produce a finished poster that looks professional and is easy for an audience to understand.
DPS can also print your posters for you. Normally, we will print any poster based on the template, but this guide helps you ensure that your poster meets a good standard of legibility and credibility. In very rare circumstances where posters fall well below these standards, we may not be able to print it without a few changes first. In these cases, we will always offer advice and support to help you improve the poster and get it off to print as soon as possible.
If you have any queries about the templates, please do get in touch with [email protected].
Quick disclaimer: in order to illustrate various design concepts, the examples shown in this presentation have been amended by DPS and are not actual examples of our colleagues’ work.

This section gives you advice about when you should (and shouldn’t) use the University’s conference poster templates:
Successful PowerPoint conference posters
When to use the templates
When to use the templates: <•When the University is the sole contributor to the research.
•When collaborating with other universities: if Reading staff are doing the work and it will not cause controversy, use the University templates and add in partner institutions.
•When you are working for official University sub-brands (e.g. TSBE, CfAM). These sub-brands have their own custom University poster templates. DPS will have these on file if you need them.
Don’t use the templates: =• If your poster is not led by the University of Reading.
• If the conference organiser has issued a specific poster template (not just simple instructions or sizes) and thus the design is conference-led, not author-led.
Author 1 | Author 2 | Author 3 (edit this list on View > Master > Slide Master. In Office 2007 use View > Slide Master)
Go to View > Master > Slide Master (View > Slide Master in Office 2007) to insert your unit name here
This is an example of a short, informative split over two lines
PowerPoint is bullet-driven PowerPoint is only really comfortable dealing with four levels
of bullet. It does not understand the concept of ‘normal’ paragraphs. Obviously, this is not very useful when building a poster .
This paragraph of text is in fact a bullet point. By putting the cursor immediately before the first word in a bullet point, you can press ‘Backspace’ and then the ‘Tab’ key to remove the bullet and align the paragraph correctly. This is the only way to generate consistently-styled text in PowerPoint. Other methods (such as the ‘Format Painter’ brush) are only sporadically successful at this task.
So how do I insert a heading? The heading above is not part of the default formatting options on
the master page of this file. This is because PowerPoint has no concept of multiple ‘headings’ on a page. When you type text into this template, it will only ever insert bullet points. To address this issue, we have created three levels of heading in the text box on the far right of the poster. You can copy and paste these into your main text box to break up your copy into sections.
Important: When you paste a heading into your text, a small icon will appear next to it. Click on this icon to view a short list of options. Always choose ‘Keep Source Formatting’ to maintain to correct size and style of the Heading you are pasting in. Also, remember that, just like other text in PowerPoint, you will need to insert a ‘Tab’ character before the first word of your heading in order for it to line up correctly.
This is an example of Heading 2
This text is another ‘normal’ paragraph, and can follow any of the heading levels.
This is heading 3, deliberately misaligned (ie without a ‘Tab’ character before it). Notice that the second line is indented correctly, but the first line is wrong
This is heading 3 as it should look
What if you do want to use bullets? This paragraph is a bullet point with the bullet deleted, but it is
recommended that research posters use bullets whenever appropriate to help simply complex arguments or theories.
• This text is identical to the above, but we have clicked the ‘Bullets’ button in the tool bar to make it a bullet. However, a bullet that sits outside the normal left margin of the text is a bit strange. It is usually better to indent all bullets to at least level 2 of the hierarchy.
• This one is the same as the above, but we have clicked the ‘Increase indent’ button to increase the level of the bullet. • You can also increase the indent by hitting the tab key
1. On this one, we have clicked the ‘Numbering’ button in the formatting toolbar.
2. This generates a numbered list instead of bullets.
1. You can also nest numbers by pressing the ‘Tab’ key
2. Another example.
• Use the ‘Decrease Indent’ button to return back up the hierarchy.
This paragraph of text is in fact a bullet point. By putting the cursor immediately before the first word in a bullet point, you can press ‘Backspace’ and then the ‘Tab’ key to remove the bullet and align the paragraph correctly. This is the only way.
Heading 3
Heading 2
Heading 3
References 1. Author’s name, Book title, (Publisher: Year) pp. XX-YY
2. Author’s name, ‘Article title’, Journal title, publication info, pp. AA-BB
3. Researcher’s name, Institution
Acknowledgements • Write here anyone you would like to thank. Unfortunately, it works best if this list is bulleted
Contact information • Department of XXXXXXXXXXX, University of Reading, Whiteknights, RG6 6,
• Email: [email protected]
• www.reading.ac.uk/xxxxxxxxxxxx
Don’t delete these headings, you will need them!
Author 1 | Author 2 | Author 3 | Author 4
Department of Chemistry
MDSC: Tg Elucidation Modulated differential scanning calorimetry was conducted at an average cooling rate of 3 °C
min-1 with an amplitude of ± 1.0 °C and a period of 60 s. Samples were heated isothermally at 100 °C for 5 minutes, then cooled to -70 °C. These conditions offer a high heat flow exchange and multiple heating and cooling rates in a single cycle. The MDSC thermogram of straight-chain Polymer 1 is shown (Figure 3), with total, reversible and non-reversible heat flow.
Summary The glass transition temperatures of a series of novel carboranylene-containing polymers have
been determined by DSC analysis. Binomial correlations of Tg with crosslinking have been derived for Polymers 1 and 2, and a significant improvement in Tg accuracy has been achieved through the employment of temperature-modulated DSC (MDSC). The temperature difference, ΔT, is
then proportional to the heat flow.
Heat flow following temperature modulation measures reversible heat capacity. Total heat capacity can be extracted from MDSC and the reversible heat capacity subtracted to calculate non-reversible heat capacity. Detailed accounts of MDSC can be found in the literature.2,3
Polycarbosilanes and polycarbosiloxanes Polymers containing carbon to silicon covalent bonds and m-carboranylene icosohedra
(C2B10H10) in the backbone are called poly(m-carborane-1,7-diylcarbosilane)s. Analogous polymers with Si-O backbone bonds are called poly(m-carborane-1,7-diylcarbosiloxane)s. These polymers are of interest as potential thermally stable, low Tg materials. A series of these polymers, both straight-chain and crosslinked, has been prepared (Figure 1).
Correlations between crosslinking and glass transition temperature (Tg) of these polymers are
of interest in material design, where polymers with a desired Tg can be designed and synthesised.
Thermal transitions of carborane-containing poly(carbosilane)s and poly(carbosiloxane)s
Thermal transitions are not always discrete like those of linear poly(dimethylsiloxane) [-120 °C (Tg), -80 °C (Tc) and -40 °C (Tm)].1 Heat flow changes associated with simultaneous transitions are observed together in thermograms with consequentially ambiguous onset-, end- and mid-points. Polymers 1 to 4 presented here undergo simultaneous thermal tensions and glass transitions on cooling. Accurate determination of Tg values, necessary to derive correlations between Tg and crosslinking in these polymers, is not possible using conventional DSC analysis. To accurately determine Tg values of these materials it is first necessary to separate heat flow change associated with a glass transition from heat flow change associated with relaxations/tensions, achievable through employment of temperature-modulated DSC (MDSC).
Temperature-modulated DSC Modulated differential scanning calorimetry (MDSC) can separate enthalpies of transitions that
occur reversibly from those that occur irreversibly by employing a sinusoidal oscillation in temperature, superimposed on a conventional constant heat rate δTb / δ t = <q>, where Tb is the temperature of the heating chamber (Figure 2). The sample temperature (Ts) is defined at steady state by the following expression:
where T0 is the start temperature, Cs is the heat capacity of the sample plus pan, K is Newton’s
law constant for heat flux, A is the maximum amplitude of Ts(t) modulation, ω is the angular modulation and ε is the phase shift relative to the temperature oscillation of the heater.2
A similar expression for the reference temperature (Tr) can be written, where Ar is the maximum amplitude and φ is the phase shift.
Thermal transition determination of carboranylene-containing poly(carbosiloxane)s and poly(carbosilane)s
References 1. J. Friedrich and J. F. Rabolt, Macromolecules, 1987, 20, 1975-1979.
2. B. Wunderlich, Y. Jin and A. Boller, Thermochim. Acta, 1994, 238, 277-293.
3. I. Okazaki and B. Wunderlich, Macromolecules, 1997, 30, 1758-1764 and references therein
Contact information • Department of Chemistry, University of Reading, Whiteknights, RG6 6AH.
• Email: [email protected]
• www.reading.ac.uk/chemistry
Figure 1 – Straight chain polymers whose thermal transitions have been analysed by MDSC. Unlabelled icosohedron vertices correspond to BH groups and black dots correspond to carbon atoms.
)sin()( 0 tAKCqtqTtT s
s
)sin()( 0 tAKCqtqTtT r
sr
sr TTT
Figure 3 – MDSC thermogram (left) of Polymer 1 (100 °C to -70 °C) and expansions (right). Total heat flow (green) is separated into reversible (blue) and non-reversible (red) components.
Figure 4 – Graph of crosslinker concentration vs Tg measured by total heat flow analysis (DSC) and reversible heat flow analysis (MDSC).
Figure 2 – A sinusoidal temperature modulation (red) superimposed on a constant heat rate (green).
Sample Crosslinker concentration Tg: DSC Tg: MDSC
/ mol % / °C / °C Polymer 1 0 -38.49 -36.77
Polymer 1 / 1 1 -39.42 -38.50
Polymer 1 / 2 2 -40.22 -39.22
Polymer 2 0 -49.68 -51.14
Polymer 2 / 1 1 -49.94 -48.84
Polymer 2 / 2 2 -49.82 -48.42
Polymer 2 / 3 3 -47.65 -47.46
Polymer 2 / 4 4 -48.83 -46.94
Polymer 2 / 5 5 -48.05 -46.68
Polymer 3 0 -36.12 -33.37
Polymer 4 0 13.23 16.80
Table 1 – Tg values of Polymers 1 to 4 measured by change in total heat flow (DSC) and change in reversible heat flow (MDSC).
MDSC thermograms of Polymers 1 to 4, including crosslinked derivatives of Polymers 1 and 2, were obtained and determined Tg values are presented (Table 1). The mean difference in Tg measured by total heat flow (DSC) and reversible heat flow (MDSC) is 1.6 °C, but the non-uniformity of this error causes, more interestingly, a vast difference in the derived binomial correlation of Tg with crosslinker concentration (Figure 4). This would have negative repercussions for polymer design, for which accurate transition temperatures are sought.
Examples of the University poster templates in use.
Example of a conference-led poster template.
Honglin Dong1, Ian Rowland1, Linda V. Thomas2 and Parveen Yaqoob1 1Department of Food and Nutritional Sciences, The University of Reading, Whiteknights PO Box 226, Reading RG6 6AP, UK 2Yakult UK Ltd, Artemis, Odyssey Business Park, West End Rd, Ruislip HA4 6QE, UK
Immunomodulatory effects of a probiotic drink containing Lactobacillus casei Shirota in healthy older volunteers
Introduction Modulation of host immunity is an important potential mechanism by
which probiotics confer health benefits [1]. Human trials suggest that some probiotic strains enhance immune function, and this is especially true for the older population [2,3,4]. However, the effects of probiotics are suggested to be strain-specific and variable, depending on the immune parameter assessed.
This study investigated the effects of Lactobacillus casei Shirota (LcS) in the form of Yakult on a wide range of parameters of immune function in healthy subjects aged 55-75y.
Methods • Placebo-controlled, single-blind crossover study with 4 week
intervention and 4 week washout.
• 30 subjects aged 55-75y, 18 female, 12 male , BMI 18-30 kg/m2.
• Intervention consisted of 2 x 65 ml Yakult Light per day (1.3×10¹⁰ LcS) or 2 x 65 ml skimmed UHT milk in a sterile container labelled ‘test milk’ (Yakult 43 kcal/100ml, skimmed milk 35 kcal/100ml).
• Analysis for salivary sIgA (ELISA), white blood cell phenotypes (flow cytometry), natural killer (NK) cell activity (flow cytometry-based assay), T lymphocyte activation and proliferation (flow cytometry), and cytokine production (flow cytometry).
Results Salivary sIgA: Yakult had no effect of salivary sIgA in volunteers <65y,
but showed a borderline significant increase in volunteers >65y (Fig. 1).
NK cell activity: NK cell activity was increased after Yakult consumption relative to baseline on a per cell basis at an effector:target cell ratio of 100:1 (P<0.01); however, NK cell activity was not significantly different between the placebo and Yakult groups (Fig. 2).
NK cell population: Yakult resulted in a shift in the NK cell population, with a relatively lower proportion of CD8+ NK cells and a higher proportion of CD8- NK cells (Table 1).
Phagocytosis: There was no effect of Yakult on the % of cells engaged in phagocytosis (data not shown). Lymphocyte activation: Yakult enhanced activation of mitogen-stimulated T helper cells relative to placebo, as assessed by expression of the activation marker, CD69. and there was a trend for the same effect in cytotoxic T cells (data not shown). Lymphocyte proliferation: There was no effect of Yakult on lymphocyte proliferation (data not shown). Cytokine production: There was a tendency for IL-10 production to be reduced by the placebo and increased by Yakult, but this did not reach statistical significance (P=0.07). However, there was a significant increase in the ratio of IL-10 to IL-12 after Yakult compared both with placebo (P<0.01) and with baseline (P<0.05), which indicates a shift towards a more anti-inflammatory profile after Yakult consumption (Fig. 3). There were no significant changes in any other cytokines (data not shown).
0.0 0.5 1.0 1.5 2.0
>66 y ≤65 y >66 y ≤65 y
Placebo Yakult
saliv
ary s
IgA
(mg/
ml)
BeforeAfterP=0.076
Fig. 1 The effect of Yakult supplement on salivary sIgA secretion in different age groups. Data are mean SE. Female n =18, Male n=12. Comparison by paired t-test.
0.00.51.01.52.02.5
Placebo Yakult
Spec
ific ly
sis
%/N
K ce
ll pro
porti
on * Fig. 2 Effect of Yakult consumption on NK cell activity on a per cell basis. Data are mean SE. Effector/Target =100/1.*P<0.05 compared with baseline by paired t-test. >66y n =12, ≤65y n =18
Treatment Placebo Yakult
Before After Before After Th %/Lym 50.33 ± 1.80 49.77 ± 2.10 49.25 ± 1.94 51.45 ± 2.15◊ Tc %/Lym 23.23 ± 1.70 23.64 ± 1.88 23.69 ± 1.69 21.20 ± 1.72*
CD8+ %/CD56+ 76.38 ± 1.51 77.87 ± 1.47 79.50 ± 1.40 74.30 ± 1.84◊
CD8- %/CD56+ 23.21 ± 1.50 21.34 ± 1.42 20.11 ± 1.41 24.56 ± 1.68◊
Table 1. Effect of Yakult on phenotype of lymphocytes
Data are mean SEM for n=30. P=0.01 for change from baseline; ◊P≤0.05 Yakult vs placebo.
Fig. 3 The effect of Yakult consumption on the change of IL-10 to IL-12 ratio. The data are mean SE. **P<0.01 compared with placebo group by paired t-test.
In conclusion, Yakult containing the probiotic LcS may improve innate immunity and acquired immunity in older people. Further studies are required to evaluate the immunomodulatory effects of LcS on the incidence and severity of infection, and the mechanisms by which LcS modulates immune function. References 1.Corthésy B., Gaskins HR., Mercenier A. (2007). J. Nutr. 137: 781S-790S. 2.Klein A., Friedrich U., et al. (2008). European Journal of Clinical Nutrition 62(5): 584-593. 3.Takeda K. and Okumura K. (2007). Journal of Nutrition 137(3): 791S-793S. 4.Gill HS., Rutherfurd KJ., et al. (2001). Am J Clin Nutr 74(6): 833-9. 5.Addison E., et al. (2005) Immunology 116:254-361.
** *
-20 -10
0 10 20 30 40 50
Placebo Yakult IL
-10/
IL-1
2
*
*
**
Poster Reference Number: 27/204 Area: Gut: An Open Door to Nutrition
Acknowledgement.: Honglin Dong is funded by an MRC Dorothy Hodgkin fellowship and by Yakult UK
Anonymous Author 1 | Anonymous Author 2, Anonymous Author 3 : School of Psychology, Cardiff University
School of Psychology & Clinical Language Sciences
Problems are encountered when the position in which items classified as intrusion errors are graphed in the same way. It is not immediately clear how intrusion errors should be generated using a model such as SIMPLE, but a further experiment showed that subjects were capable of generating items before estimating whether they were part of the TBR list or not. (Figure 3).
Figure 3: Results of asking subjects to recall all the items they remembered and then label them, as TBR (accept) or TBI (reject)
If distracters are simply items with a higher threshold of acceptance their recall can be modelled in the same way as TBR items. However, if this is done the serial position curves are flat (Figure 4), and do not provide a good fit to the data for oral recall.
Figure 4: Intrusions by presentation position and output modality. Only the related item condition is presented here as insufficient intrusions occurred in unrelated conditions. Oral recall produced reliably more intrusions than written recall and this interacted significantly with serial position.
Discussion Data from a free recall task where only correct items are considered
and disruption is caused by concurrent irrelevant information can be modelled reasonably well regardless of output type. Intrusion errors that also appear in the free recall protocol are less easy to model, in part because of their interaction with output type (beyond the scope of most models) but also because there is no clear mechanism for a consideration stage, at which the source of interfering information is considered and where such information may be excluded if appropriate.
References 1. Beaman, C. P. (2004). The irrelevant sound phenomenon revisited: What role for working memory
capacity? Journal of Experimental Psychology: Learning, Memory & Cognition, 30, 1106-1118
2. Brown, G. D. A., Neath, I., & Chater, N. (2007). A temporal ratio model of memory. Psychological Review, 114, 539-576.
3. Marsh, J. E., Hughes, R. W., & Jones, D. M. (2008). Auditory distraction in semantic memory: A process-based approach. Journal of Memory and Language, 58, 682-700
Contact information • School of Psychology & Clinical Language Sciences, University of Reading,
Earley Gate, Whiteknights, Berkshire, RG6 6 6AL, United Kingdom
• Email: [email protected]
• www.reading.ac.uk/psychology/about/staff/c-p-beaman.aspx
Abstract An experiment demonstrates how free recall of visually-presented,
categorically-related lists of words is disturbed by the presence of auditory distracters which subjects were instructed to ignore. Auditory distracters from the same category as the to-be-recalled items produced the most disturbance to recall and the most intrusion errors. Additionally, the points at which these intrusion errors occured differed dependent upon whether recall was written or spoken. A variant of the SIMPLE (Scale Invariant Memory and Perceptual LEarning) model (Brown, Neath & Chater, 2007) is applied to these data.
Experiment In free recall tasks, to-be-ignored (TBI) items disrupt correct recall of
lists of exemplars drawn from single semantic categories, especially if the distracting items are semantically similar to the to-be-remembered (TBR) exemplars. Moreover, in such tasks, TBI items are frequently falsely recalled (Beaman, 2004; Marsh, Hughes, & Jones, 2008).
This experiment looks at how the timing of TBI items affects their appearance in oral and written recall protocols. Fifteen items were visually presented at a rate of 1 item/second. Recall was cued 5s later. A sequence of TBI items from the same category as the TBR items was presented simultaneously. Figure 1 shows the number of correct recalls at each serial position relative to a control condition in which the TBI items were from a different category.
Figure 1: Serial position function for correct recalls.
These data are broadly compatible across recall modalities. In both cases there was a statistically significant effect of the relatedness of the TBI list. It is straightforward to fit an extant model of free recall to these data if only these correct recalls are considered. Figure 2 shows fits obtained using the SIMPLE model (see Brown et al., 2007, for details) . Free parameters (c, threshold, noise) were estimated by minimizing Summed Square Error using the Nelder-Mead method.
Figure 2: Fits of the model to correct recall by serial position.
Auditory Distraction during Semantic Processing: Data and a Model
00.10.20.30.40.50.60.70.80.9
1 2 3 4 5 6 7 8 9 10 11 12 13 14 15
Prob
abili
ty C
orre
ct R
ecal
l
Serial Position
Oral Recall
Unrelated
Related
00.10.20.30.40.50.60.70.80.9
1 2 3 4 5 6 7 8 9 10 11 12 13 14 15
Prob
abili
ty C
orec
t Rec
all
Serial Position
Written Recall
Unrelated
Related
00.10.20.30.40.50.60.70.80.9
1
1 2 3 4 5 6 7 8 9 10 11 12 13 14 15
Prob
abili
ty C
orre
ct R
ecal
l
Serial Position
Unrelated Items, Oral Recall
Data
Model
00.10.20.30.40.50.60.70.80.9
1
1 2 3 4 5 6 7 8 9 10 11 12 13 14 15
Prob
abili
ty C
orre
ct R
ecal
l
Serial Position
Related Items, Oral Recall
Data
Model
00.10.20.30.40.50.60.70.80.9
1
1 2 3 4 5 6 7 8 9 10 11 12 13 14 15
Prob
abili
ty C
orre
ct R
ecal
l
Serial Position
Related Items, Written Recall
Data
Model
00.10.20.30.40.50.60.70.80.9
1 2 3 4 5 6 7 8 9 10 11 12 13 14 15
Prob
abili
ty C
orre
ct R
ecal
l
Serial Position
Unrelated Items, Written Recall
Data
Model
0
2
4
6
8
10
12
Correct Acceptance False Acceptance Correct Rejection False Rejection Repetition
Mea
n O
utpu
t Pos
ition
.
Recall Decision as a Function of Output Position (Related Condition)
0
0.02
0.04
0.06
0.08
0.1
0.12
1 2 3 4 5 6 7 8 9 10 11 12 13 14 15
Prob
abili
ty In
trus
ion
Erro
r
Serial Position
Oral Recall
Data
Model
0
0.02
0.04
0.06
0.08
0.1
0.12
1 2 3 4 5 6 7 8 9 10 11 12 13 14 15
Prob
abili
ty In
trus
ion
Erro
r
Serial Position
Written Recall
Data
Model
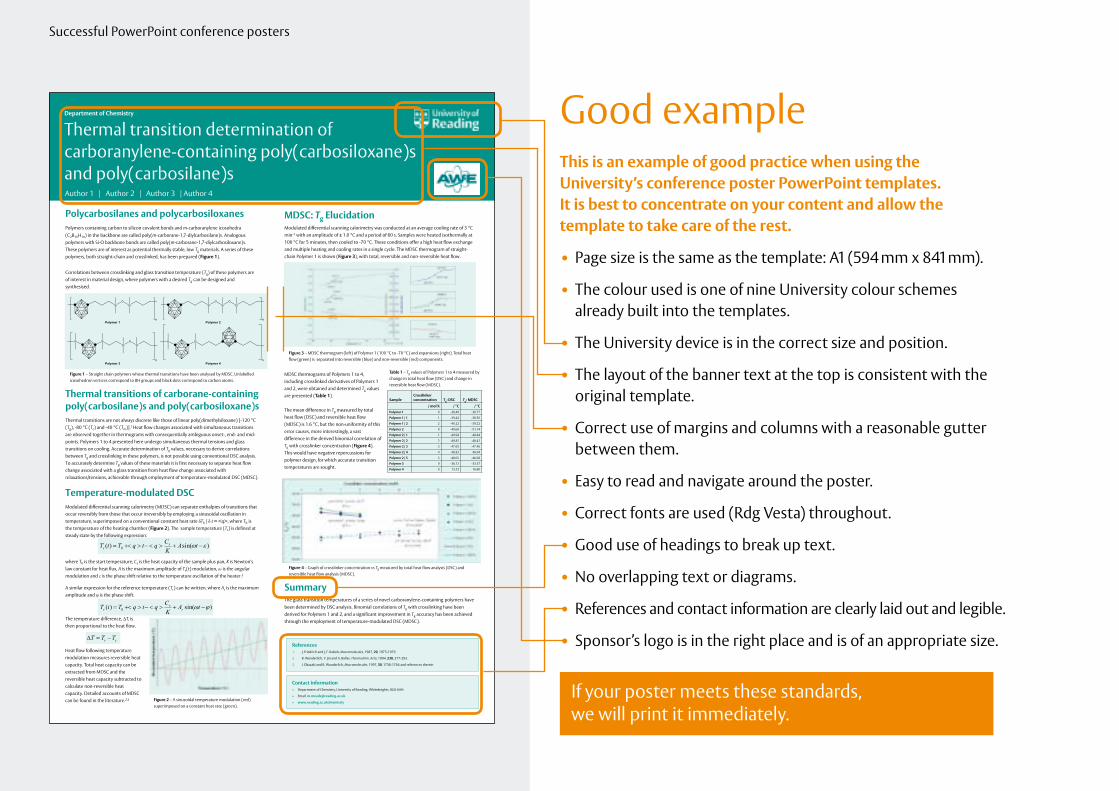
This is an example of good practice when using the University’s conference poster PowerPoint templates. It is best to concentrate on your content and allow the template to take care of the rest.
•Page size is the same as the template: A1 (594 mm x 841 mm).
•The colour used is one of nine University colour schemes already built into the templates.
•The University device is in the correct size and position.
•The layout of the banner text at the top is consistent with the original template.
•Correct use of margins and columns with a reasonable gutter between them.
•Easy to read and navigate around the poster.
•Correct fonts are used (Rdg Vesta) throughout.
•Good use of headings to break up text.
•No overlapping text or diagrams.
•References and contact information are clearly laid out and legible.
•Sponsor’s logo is in the right place and is of an appropriate size.
Successful PowerPoint conference posters
Author 1 | Author 2 | Author 3 | Author 4
Department of Chemistry
MDSC: Tg Elucidation Modulated differential scanning calorimetry was conducted at an average cooling rate of 3 °C
min-1 with an amplitude of ± 1.0 °C and a period of 60 s. Samples were heated isothermally at 100 °C for 5 minutes, then cooled to -70 °C. These conditions offer a high heat flow exchange and multiple heating and cooling rates in a single cycle. The MDSC thermogram of straight-chain Polymer 1 is shown (Figure 3), with total, reversible and non-reversible heat flow.
Summary The glass transition temperatures of a series of novel carboranylene-containing polymers have
been determined by DSC analysis. Binomial correlations of Tg with crosslinking have been derived for Polymers 1 and 2, and a significant improvement in Tg accuracy has been achieved through the employment of temperature-modulated DSC (MDSC). The temperature difference, ΔT, is
then proportional to the heat flow.
Heat flow following temperature modulation measures reversible heat capacity. Total heat capacity can be extracted from MDSC and the reversible heat capacity subtracted to calculate non-reversible heat capacity. Detailed accounts of MDSC can be found in the literature.2,3
Polycarbosilanes and polycarbosiloxanes Polymers containing carbon to silicon covalent bonds and m-carboranylene icosohedra
(C2B10H10) in the backbone are called poly(m-carborane-1,7-diylcarbosilane)s. Analogous polymers with Si-O backbone bonds are called poly(m-carborane-1,7-diylcarbosiloxane)s. These polymers are of interest as potential thermally stable, low Tg materials. A series of these polymers, both straight-chain and crosslinked, has been prepared (Figure 1).
Correlations between crosslinking and glass transition temperature (Tg) of these polymers are
of interest in material design, where polymers with a desired Tg can be designed and synthesised.
Thermal transitions of carborane-containing poly(carbosilane)s and poly(carbosiloxane)s
Thermal transitions are not always discrete like those of linear poly(dimethylsiloxane) [-120 °C (Tg), -80 °C (Tc) and -40 °C (Tm)].1 Heat flow changes associated with simultaneous transitions are observed together in thermograms with consequentially ambiguous onset-, end- and mid-points. Polymers 1 to 4 presented here undergo simultaneous thermal tensions and glass transitions on cooling. Accurate determination of Tg values, necessary to derive correlations between Tg and crosslinking in these polymers, is not possible using conventional DSC analysis. To accurately determine Tg values of these materials it is first necessary to separate heat flow change associated with a glass transition from heat flow change associated with relaxations/tensions, achievable through employment of temperature-modulated DSC (MDSC).
Temperature-modulated DSC Modulated differential scanning calorimetry (MDSC) can separate enthalpies of transitions that
occur reversibly from those that occur irreversibly by employing a sinusoidal oscillation in temperature, superimposed on a conventional constant heat rate δTb / δ t = <q>, where Tb is the temperature of the heating chamber (Figure 2). The sample temperature (Ts) is defined at steady state by the following expression:
where T0 is the start temperature, Cs is the heat capacity of the sample plus pan, K is Newton’s
law constant for heat flux, A is the maximum amplitude of Ts(t) modulation, ω is the angular modulation and ε is the phase shift relative to the temperature oscillation of the heater.2
A similar expression for the reference temperature (Tr) can be written, where Ar is the maximum amplitude and φ is the phase shift.
Thermal transition determination of carboranylene-containing poly(carbosiloxane)s and poly(carbosilane)s
References 1. J. Friedrich and J. F. Rabolt, Macromolecules, 1987, 20, 1975-1979.
2. B. Wunderlich, Y. Jin and A. Boller, Thermochim. Acta, 1994, 238, 277-293.
3. I. Okazaki and B. Wunderlich, Macromolecules, 1997, 30, 1758-1764 and references therein
Contact information • Department of Chemistry, University of Reading, Whiteknights, RG6 6AH.
• Email: [email protected]
• www.reading.ac.uk/chemistry
Figure 1 – Straight chain polymers whose thermal transitions have been analysed by MDSC. Unlabelled icosohedron vertices correspond to BH groups and black dots correspond to carbon atoms.
)sin()( 0 tAKCqtqTtT s
s
)sin()( 0 tAKCqtqTtT r
sr
sr TTT
Figure 3 – MDSC thermogram (left) of Polymer 1 (100 °C to -70 °C) and expansions (right). Total heat flow (green) is separated into reversible (blue) and non-reversible (red) components.
Figure 4 – Graph of crosslinker concentration vs Tg measured by total heat flow analysis (DSC) and reversible heat flow analysis (MDSC).
Figure 2 – A sinusoidal temperature modulation (red) superimposed on a constant heat rate (green).
Sample Crosslinker concentration Tg: DSC Tg: MDSC
/ mol % / °C / °C Polymer 1 0 -38.49 -36.77
Polymer 1 / 1 1 -39.42 -38.50
Polymer 1 / 2 2 -40.22 -39.22
Polymer 2 0 -49.68 -51.14
Polymer 2 / 1 1 -49.94 -48.84
Polymer 2 / 2 2 -49.82 -48.42
Polymer 2 / 3 3 -47.65 -47.46
Polymer 2 / 4 4 -48.83 -46.94
Polymer 2 / 5 5 -48.05 -46.68
Polymer 3 0 -36.12 -33.37
Polymer 4 0 13.23 16.80
Table 1 – Tg values of Polymers 1 to 4 measured by change in total heat flow (DSC) and change in reversible heat flow (MDSC).
MDSC thermograms of Polymers 1 to 4, including crosslinked derivatives of Polymers 1 and 2, were obtained and determined Tg values are presented (Table 1). The mean difference in Tg measured by total heat flow (DSC) and reversible heat flow (MDSC) is 1.6 °C, but the non-uniformity of this error causes, more interestingly, a vast difference in the derived binomial correlation of Tg with crosslinker concentration (Figure 4). This would have negative repercussions for polymer design, for which accurate transition temperatures are sought.
Good example
If your poster meets these standards, we will print it immediately.
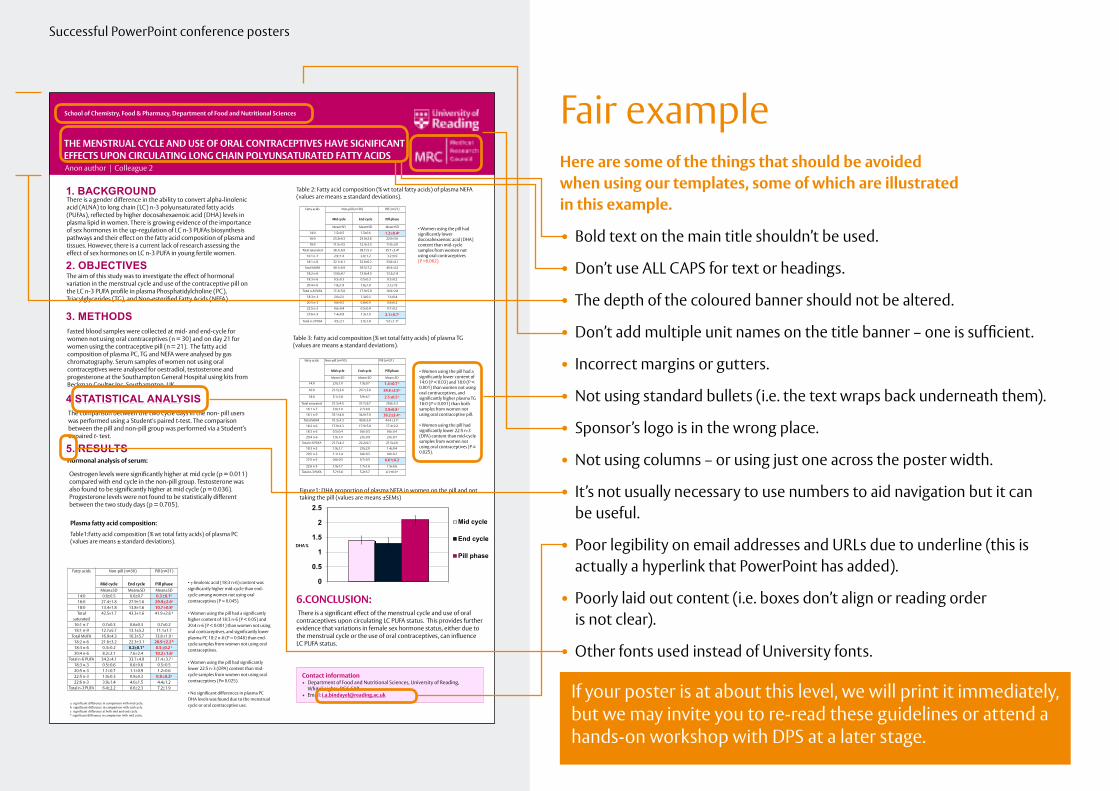
Here are some of the things that should be avoided when using our templates, some of which are illustrated in this example.
•Bold text on the main title shouldn’t be used.
•Don’t use ALL CAPS for text or headings.
•The depth of the coloured banner should not be altered.
•Don’t add multiple unit names on the title banner – one is sufficient.
• Incorrect margins or gutters.
•Not using standard bullets (i.e. the text wraps back underneath them).
•Sponsor’s logo is in the wrong place.
•Not using columns – or using just one across the poster width.
• It’s not usually necessary to use numbers to aid navigation but it can be useful.
•Poor legibility on email addresses and URLs due to underline (this is actually a hyperlink that PowerPoint has added).
•Poorly laid out content (i.e. boxes don’t align or reading order is not clear).
•Other fonts used instead of University fonts.
Successful PowerPoint conference posters
Fair exampleAnon author | Colleague 2
School of Chemistry, Food & Pharmacy, Department of Food and Nutritional Sciences
THE MENSTRUAL CYCLE AND USE OF ORAL CONTRACEPTIVES HAVE SIGNIFICANT EFFECTS UPON CIRCULATING LONG CHAIN POLYUNSATURATED FATTY ACIDS
1. BACKGROUND
Contact information • Department of Food and Nutritional Sciences, University of Reading,
Whiteknights, RG6 6AP • Email: [email protected]
There is a gender difference in the ability to convert alpha-linolenic acid (ALNA) to long chain (LC) n-3 polyunsaturated fatty acids (PUFAs), reflected by higher docosahexaenoic acid (DHA) levels in plasma lipid in women. There is growing evidence of the importance of sex hormones in the up-regulation of LC n-3 PUFAs biosynthesis pathways and their effect on the fatty acid composition of plasma and tissues. However, there is a current lack of research assessing the effect of sex hormones on LC n-3 PUFA in young fertile women.
The aim of this study was to investigate the effect of hormonal variation in the menstrual cycle and use of the contraceptive pill on the LC n-3 PUFA profile in plasma Phosphatidylcholine (PC), Triacylglycerides (TG), and Non-esterified Fatty Acids (NEFA).
Fasted blood samples were collected at mid- and end-cycle for women not using oral contraceptives (n = 30) and on day 21 for women using the contraceptive pill (n = 21). The fatty acid composition of plasma PC, TG and NEFA were analysed by gas chromatography. Serum samples of women not using oral contraceptives were analysed for oestradiol, testosterone and progesterone at the Southampton General Hospital using kits from Beckman Coulter Inc, Southampton, UK
The comparison between the two cycle days in the non- pill users was performed using a Student's paired t-test. The comparison between the pill and non-pill group was performed via a Student’s unpaired t- test.
Oestrogen levels were significantly higher at mid cycle (p = 0.011) compared with end cycle in the non-pill group. Testosterone was also found to be significantly higher at mid cycle (p = 0.036). Progesterone levels were not found to be statistically different between the two study days (p = 0.705).
Plasma fatty acid composition:
Table1:Fatty acid composition (% wt total fatty acids) of plasma PC (values are means ± standard deviations).
a significant difference in comparison with mid cycle. b significant difference in comparison with end cycle. c significant difference at both mid and end cycle. * significant difference in comparison with mid cycle.
Table 2: Fatty acid composition (% wt total fatty acids) of plasma NEFA (values are means ± standard deviations).
Table 3: Fatty acid composition (% wt total fatty acids) of plasma TG (values are means ± standard deviations).
6.CONCLUSION: There is a significant effect of the menstrual cycle and use of oral contraceptives upon circulating LC PUFA status. This provides further evidence that variations in female sex hormone status, either due to the menstrual cycle or the use of oral contraceptives, can influence LC PUFA status.
0
0.5
1
1.5
2
2.5
Mid cycle
End cycle
Pill phase
Figure1: DHA proportion of plasma NEFA in women on the pill and not taking the pill (values are means ±SEMs)
Hormonal analysis of serum:
4. STATISTICAL ANALYSIS
3. METHODS
5. RESULTS
Fatty acids Non-pill (n=30) Pill (n=21)
Mid cycle
End cycle
Pill phase
MeanSD MeanSD MeanSD 14:0 0.60.5 0.60.7 0.3 0.1a 16:0 27.41.8 27.91.6 29.9 2.6c 18:0 13.41.8 13.81.6 10.7 0.8c Total
saturated 42.51.7 43.31.6 41.9 2.6 b
16:1 n-7 0.70.3 0.60.3 0.70.2 18:1 n-9 12.75.7 13.15.2 11.11.7
Total MUFA 16.94.3 16.35.7 13.8 1.9 c 18:2 n-6 21.63.2 22.33.1 20.9 2.2 b 18:3 n-6 0.30.2 0.20.1* 0.5 0.2 c 20:4 n-6 8.22.1 7.62.4 10.2 1.6c
Total n-6 PUFA 34.24.1 33.74.9 37.4 3.7 c 18:3 n-3 0.50.6 0.60.6 0.50.5 20:5 n-3 1.10.7 1.10.9 1.20.6 22:5 n-3 1.00.3 0.90.3 0.8 0.2a 22:6 n-3 3.91.4 4.01.5 4.41.2
Total n-3 PUFA 6.42.2 6.62.3 7.21.9
• γ-linolenic acid (18:3 n-6) content was significantly higher mid-cycle than end-cycle among women not using oral contraceptives (P = 0.045). • Women using the pill had a significantly higher content of 18:3 n-6 (P < 0.05) and 20:4 n-6 (P < 0.001) than women not using oral contraceptives, and significantly lower plasma PC 18:2 n-6 (P = 0.048) than end-cycle samples from women not using oral contraceptives. • Women using the pill had significantly lower 22:5 n-3 (DPA) content than mid-cycle samples from women not using oral contraceptives (P= 0.025). • No significant differences in plasma PC DHA levels was found due to the menstrual cycle or oral contraceptive use.
• Women using the pill had significantly lower docosahexaenoic acid (DHA) content than mid-cycle samples from women not using oral contraceptives (P =0.002).
Fatty acids Non-pill (n=30) Pill (n=21)
Mid cycle
End cycle
Pill phase
MeanSD MeanSD MeanSD
14:0 1.50.5 1.50.6 1.2 0.4a 16:0 23.24.3 23.02.8 22.03.0
18:0 11.54.5 12.43.5 11.02.0
Total saturated 38.26.9 38.75.3 35.7 3.4b
16:1 n-7 2.91.4 2.81.2 3.20.9
18:1 n-9 32.16.1 32.06.2 33.64.1
Total MUFA 40.16.9 39.57.2 40.44.2
18:2 n-6 13.04.7 13.94.3 13.21.9
18:3 n-6 0.50.3 0.50.3 0.50.2
20:4 n-6 1.81.9 1.81.9 2.71.9
Total n-6 PUFA 17.25.8 17.95.9 18.92.8
18:3 n-3 2.02.5 1.30.5 1.50.4
20:5 n-3 0.60.5 0.80.9 0.60.2
22:5 n-3 0.60.4 0.50.4 0.70.2
22:6 n-3 1.40.9 1.31.0 2.1 0.7c
Total n-3 PUFA 4.53.1 3.91.8 5.0 1.1b
Fatty acids Non-pill (n=30) Pill (n=21)
Mid cycle
End cycle
Pill phase
MeanSD MeanSD MeanSD
14:0 2.01.0 1.90.7 1.4 0.7 c
16:0 21.52.6 20.73.6 24.8 2.9 c
18:0 5.12.8 5.94.7 2.5 0.5 c
Total saturated 31.34.5 31.76.7 29.83.3
16:1 n-7 3.01.0 2.70.8 3.90.8 c 18:1 n-9 35.14.8 34.07.0 38.2 3.4 c
Total MUFA 41.34.3 40.85.0 44.4 3.7c
18:2 n-6 17.94.3 17.95.8 17.42.2
18:3 n-6 0.50.4 0.60.5 0.60.4
20:4 n-6 1.91.0 2.00.9 2.00.7
Total n-6 PUFA 21.74.3 22.26.1 21.52.6
18:3 n-3 1.91.7 2.02.0 1.40.4
20:5 n-3 1.11.4 0.80.5 0.60.2
22:5 n-3 0.80.5 0.70.5 0.6 a0.2 22:6 n-3 1.91.7 1.71.6 1.50.6
Total n-3 PUFA 5.73.8 5.23.7 4.1 0.9 a
• Women using the pill had a significantly lower content of 14:0 (P < 0.03) and 18:0 (P < 0.001) than women not using oral contraceptives, and significantly higher plasma TG 16:0 (P = 0.001) than both samples from women not using oral contraceptive pill. • Women using the pill had significantly lower 22:5 n-3 (DPA) content than mid-cycle samples from women not using oral contraceptives (P = 0.025).
2. OBJECTIVES
DHA %
If your poster is at about this level, we will print it immediately, but we may invite you to re-read these guidelines or attend a hands-on workshop with DPS at a later stage.
1. BACKGROUND
2. OBJECTIVES
3. METHODS
4 STATISTICAL ANALYSIS
5. RESULTS

This is an example of poor practice when using the University’s PowerPoint conference poster templates. Clearly there are problems with this file, some examples of which are listed here.
•University fonts not used at all
•Device has been stretched, covered, altered or moved.
•Completely different colour schemes used, i.e. not University colour schemes from the template.
•Fully justified body text, rather than left-aligned.
•Centred text (titles, subtitles).
•Legibility of content has been lost.
•Page size has been altered from template (keep it at A1 in the file but ask DPS to print at a different size, if required).
•Top banner content has been altered, i.e. black text on colour.
Successful PowerPoint conference posters
Author 1 | Author 2 |
Name of School
Breeding system Work at Reading by Andrew McCubbin with the above electrophoretic analysis has shown that the S1S2 incompatibility system no longer operates in the Mediterranean. Thus, self pollination and fertilisation is possible. In the northern hemisphere, the species is usually hummingbird hawk moth pollinated. Seed set always appears very successful with the ripe capsules full of numerous small fertile seeds. Colonisation Nicotiana glauca is able to colonise rapidly, especially areas rich in nitrogen such as ruderal environments. It uses the nitrogen through high levels of nitrate reductase enzyme. It also has ability to extract water from the soil with an extensive root system, as that illustrated of a young plant dug up in Las Negras, Almería, Spain.
• Colonisation
• Nicotiana glauca is able to colonise rapidly, especially areas rich in nitrogen such as ruderal environments. It uses the nitrogen through high levels of nitrate reductase enzyme. It also has ability to extract water from the soil with an extensive root system, as that illustrated of a young plant dug up in Las Negras, Almería, Spain.
• Rapid growth rate
• Photosynthesis measurements with an in situ infra red gas analyzer give the above graph that shows the rate of photosynthesis (measured as µmoles.m‾².s‾¹) against time with light (photon flux density measured as µmoles.m‾².s‾¹) for the very large juvenile leaves, produced after cutting back in ochre-yellow and the smaller mature leaves in green. The mature leaves show a higher rate of photosynthesis and respiration in all cases, especially early morning.
• Toxicity
• Despite a record of possessing nicotine, this is not the case and Nicotiana glauca contains the related extremely poisonous pyridine alkaloid anabasine (c. 1000 times more toxic than nicotine to mammals). However, this alkaloid is not poisonous to birds or the hummingbird hawk moth, Macroglossum stellatarum. Several human deaths have been reported as having been associated with this plant.
•
•
1. Anabasine, 2. Nicotine
What if you do want to use bullets? This paragraph is a bullet point with the bullet deleted, but it is
recommended that research posters use bullets whenever appropriate.
• This text is identical to the above, but we have clicked the ‘Bullets’ button in the tool bar to make it a bullet. However, a bullet that sits outside the normal left margin of the text is a bit strange. It is usually better to indent all bullets to at least level 2 of the hierarchy.
• This one is the same as the above, but we have clicked the ‘Increase indent’ button to increase the level of the bullet.
− You can also increase the indent by hitting the tab key 1. On this one, we have clicked the ‘Numbering’ button in the formatting
toolbar. 2. This generates a numbered list instead of bullets.
1. You can also nest numbers by pressing the ‘Tab’ key 2. Another example.
• Use the ‘Decrease Indent’ button to return back up the hierarchy.
This paragraph of text is in fact a bullet point. By putting the cursor immediately before the first word in a bullet point, you can press ‘Backspace’ and then the ‘Tab’ key to remove the bullet and align the paragraph correctly. This is the only way.
References 1. Author’s name, Book title, (Publisher: Year) pp. XX-YY
2. Author’s name, ‘Article title’, Journal title, publication info, pp. AA-BB
3. Researcher’s name, Institution
Acknowledgements • Write here anyone you would like to thank. Unfortunately, it works best if this list is bulleted
Contact information • Department of XXXXXXXXXXX, University of Reading, Whiteknights, RG6 6
• Email: [email protected]
• www.reading.ac.uk/xxxxxxxxxxxx
PowerPoint is bullet-driven PowerPoint is only really comfortable dealing with four levels of
bullet. It does not understand the concept of ‘normal’ (un-bulleted) paragraphs. Obviously, this is not very useful when building a poster.
This paragraph of text is in fact a bullet point. By putting the cursor immediately before the first word in a bullet point, you can press ‘Backspace’ and then the ‘Tab’ key to remove the bullet and align the paragraph correctly. This is the only way to generate consistently-styled text in PowerPoint. Other methods (such as the ‘Format Painter’ brush) are only sporadically successful at this task.
So how do I insert a heading? The heading above is not part of the default formatting options on the
master page of this file. This is because PowerPoint has no concept of multiple ‘headings’ on a page. When you type text into this template, it will only ever insert bullet points. To address this issue, we have created three levels of heading in the text box on the far right of the poster. You can copy and paste these into your main text box to break up your copy into sections.
Important: When you paste a heading into your text, a small icon will appear next to it. Click on this icon to view a short list of options. Always choose ‘Keep Source Formatting’ to maintain to correct size and style of the Heading you are pasting in. Also, remember that, just like other text in PowerPoint, you will need to insert a ‘Tab’ character before the first word of your heading in order for it to line up correctly.
This is an example of Heading 2
This text is another ‘normal’ paragraph, and can follow any of the heading levels.
This is heading 3, deliberately misaligned (ie without a ‘Tab’ character before it). Notice that the second line is indented correctly, but the first line is wrong
This is heading 3 as it should look
Getting your poster printed
We offer advice on using this template as well as a full colour printing and laminating service.
To get your poster printed, please contact the Design & Print Studio at [email protected]
This is an example of a short, informative split over two lines
Heading 1 Heading 2 Heading 3
Don’t delete these headings, you will need them!
Poor example
If your poster has a lot of these kinds of problems, we may not be able to print it. Instead, we will ask you to review these guidelines again and re-submit a new version. Alternatively, you can commission one of our team to bring it in line with University guidelines for you, as part of our premium design service (see next page).
Successful PowerPoint conference posters
Anonymous Author 1 | Anonymous Author 2, School of Psychology Cardiff University | Anonymous Author 3 , School of Psychology Cardiff University
School of Psychology & Clinical Language Sciences
Problems are encountered when the position in which items
classified as intrusion errors are graphed in the same way. It is
not immediately clear how intrusion errors should be generated
using a model such as SIMPLE, but a further experiment showed
that subjects were capable of generating items before estimating
whether they were part of the TBR list or not. (Figure 3).
Figure 3: Results of asking subjects to recall all the items they
remembered and then label them, as TBR (accept) or TBI (reject)
If distracters are simply items with a higher threshold of
acceptance their recall can be modelled in the same way as TBR
items. However, if this is done the serial position curves are flat
(Figure 4), and do not provide a good fit to the data for oral
recall.
Figure 4: Intrusions by presentation position and output
modality. Only the related item condition is presented here
as insufficient intrusions occurred in unrelated conditions.
Oral recall produced reliably more intrusions than written
recall and this interacted significantly with serial position.
Discussion.
Data from a free recall task where only correct items are
considered and disruption is caused by concurrent irrelevant
information can be modelled reasonably well regardless of
output type. Intrusion errors that also appear in the free recall
protocol are less easy to model, in part because of their
interaction with output type (beyond the scope of most models)
but also because there is no clear mechanism for a consideration
stage, at which the source of interfering information is
considered and where such information may be excluded if
appropriate.
References 1. Beaman, C. P. (2004). The irrelevant sound phenomenon revisited: What role for working
memory capacity? Journal of Experimental Psychology: Learning, Memory & Cognition, 30,
1106-1118
2. Brown, G. D. A., Neath, I., & Chater, N. (2007). A temporal ratio model of memory.
Psychological Review, 114, 539-576.
3. Marsh, J. E., Hughes, R. W., & Jones, D. M. (2008). Auditory distraction in semantic memory: A
process-based approach. Journal of Memory and Language, 58, 682-700
Contact information • School of Psychology & Clinical Language Sciences, University of Reading, Earley Gate,
Whiteknights, Berkshire, RG6 6 6AL, United Kingdom
• Email: [email protected]
• www.reading.ac.uk/psychology/about/staff/c-p-beaman.aspx
Abstract: An experiment demonstrates how free recall of visually-
presented, categorically-related lists of words is disturbed by the presence of auditory distracters which subjects were instructed to ignore. Auditory distracters from the same category as the to-be-recalled items produced the most disturbance to recall and the most intrusion errors. Additionally, the points at which these intrusion errors occured differed dependent upon whether recall was written or spoken. A variant of the SIMPLE (Scale Invariant Memory and Perceptual LEarning) model (Brown, Neath & Chater, 2007) is applied to these data.
Experiment.
In free recall tasks, to-be-ignored (TBI) items disrupt correct recall
of lists of exemplars drawn from single semantic categories,
especially if the distracting items are semantically similar to the
to-be-remembered (TBR) exemplars. Moreover, in such tasks, TBI
items are frequently falsely recalled (Beaman, 2004; Marsh,
Hughes, & Jones, 2008).
This experiment looks at how the timing of TBI items affects their
appearance in oral and written recall protocols. Fifteen items
were visually presented at a rate of 1 item/second. Recall was
cued 5s later. A sequence of TBI items from the same category as
the TBR items was presented simultaneously. Figure 1 shows the
number of correct recalls at each serial position relative to a
control condition in which the TBI items were from a different
category.
Figure 1: Serial position function for correct recalls..
These data are broadly compatible across recall modalities. In
both cases there was a statistically significant effect of the
relatedness of the TBI list. It is straightforward to fit an extant
model of free recall to these data if only these correct recalls are
considered. Figure 2 shows fits obtained using the SIMPLE model
(see Brown et al., 2007, for details) . Free parameters (c, threshold,
noise) were estimated by minimizing Summed Square Error using
the Nelder-Mead method.
Figure 2: Fits of the model to correct recall by serial position.
Auditory Distraction during Semantic Processing: Data and a Model
00.10.20.30.40.50.60.70.80.9
1 2 3 4 5 6 7 8 9 10 11 12 13 14 15
Prob
abili
ty C
orre
ct R
ecal
l
Serial Position
Oral Recall
Unrelated
Related
00.10.20.30.40.50.60.70.80.9
1 2 3 4 5 6 7 8 9 10 11 12 13 14 15
Prob
abili
ty C
orec
t Rec
all
Serial Position
Written Recall
Unrelated
Related
00.10.20.30.40.50.60.70.80.91
1 2 3 4 5 6 7 8 9 10 11 12 13 14 15
Prob
abili
ty C
orre
ct R
ecal
l
Serial Position
Unrelated Items, Oral Recall
Data
Model
00.10.20.30.40.50.60.70.80.91
1 2 3 4 5 6 7 8 9 10 11 12 13 14 15
Prob
abili
ty C
orre
ct R
ecal
l
Serial Position
Related Items, Oral Recall
Data
Model
00.10.20.30.40.50.60.70.80.91
1 2 3 4 5 6 7 8 9 10 11 12 13 14 15
Prob
abili
ty C
orre
ct R
ecal
l
Serial Position
Related Items, Written Recall
Data
Model
00.10.20.30.40.50.60.70.80.9
1 2 3 4 5 6 7 8 9 10 11 12 13 14 15
Prob
abili
ty C
orre
ct R
ecal
l
Serial Position
Unrelated Items, Written Recall
Data
Model
0
2
4
6
8
10
12
Correct Acceptance False Acceptance Correct Rejection False Rejection Repetition
Mea
n O
utpu
t Pos
ition
.
Recall Decision as a Function of Output Position (Related Condition)
0
0.02
0.04
0.06
0.08
0.1
0.12
1 2 3 4 5 6 7 8 9 10 11 12 13 14 15
Prob
abili
ty In
trus
ion
Erro
r
Serial Position
Oral Recall
Data
Model
0
0.02
0.04
0.06
0.08
0.1
0.12
1 2 3 4 5 6 7 8 9 10 11 12 13 14 15
Prob
abili
ty In
trus
ion
Erro
r
Serial Position
Written Recall
Data
Model
Anonymous Author 1 | Anonymous Author 2, Anonymous Author 3 : School of Psychology, Cardiff University
School of Psychology & Clinical Language Sciences
Problems are encountered when the position in which items classified as intrusion errors are graphed in the same way. It is not immediately clear how intrusion errors should be generated using a model such as SIMPLE, but a further experiment showed that subjects were capable of generating items before estimating whether they were part of the TBR list or not. (Figure 3).
Figure 3: Results of asking subjects to recall all the items they remembered and then label them, as TBR (accept) or TBI (reject)
If distracters are simply items with a higher threshold of acceptance their recall can be modelled in the same way as TBR items. However, if this is done the serial position curves are flat (Figure 4), and do not provide a good fit to the data for oral recall.
Figure 4: Intrusions by presentation position and output modality. Only the related item condition is presented here as insufficient intrusions occurred in unrelated conditions. Oral recall produced reliably more intrusions than written recall and this interacted significantly with serial position.
Discussion Data from a free recall task where only correct items are considered
and disruption is caused by concurrent irrelevant information can be modelled reasonably well regardless of output type. Intrusion errors that also appear in the free recall protocol are less easy to model, in part because of their interaction with output type (beyond the scope of most models) but also because there is no clear mechanism for a consideration stage, at which the source of interfering information is considered and where such information may be excluded if appropriate.
References 1. Beaman, C. P. (2004). The irrelevant sound phenomenon revisited: What role for working memory
capacity? Journal of Experimental Psychology: Learning, Memory & Cognition, 30, 1106-1118
2. Brown, G. D. A., Neath, I., & Chater, N. (2007). A temporal ratio model of memory. Psychological Review, 114, 539-576.
3. Marsh, J. E., Hughes, R. W., & Jones, D. M. (2008). Auditory distraction in semantic memory: A process-based approach. Journal of Memory and Language, 58, 682-700
Contact information • School of Psychology & Clinical Language Sciences, University of Reading,
Earley Gate, Whiteknights, Berkshire, RG6 6 6AL, United Kingdom
• Email: [email protected]
• www.reading.ac.uk/psychology/about/staff/c-p-beaman.aspx
Abstract An experiment demonstrates how free recall of visually-presented,
categorically-related lists of words is disturbed by the presence of auditory distracters which subjects were instructed to ignore. Auditory distracters from the same category as the to-be-recalled items produced the most disturbance to recall and the most intrusion errors. Additionally, the points at which these intrusion errors occured differed dependent upon whether recall was written or spoken. A variant of the SIMPLE (Scale Invariant Memory and Perceptual LEarning) model (Brown, Neath & Chater, 2007) is applied to these data.
Experiment In free recall tasks, to-be-ignored (TBI) items disrupt correct recall of
lists of exemplars drawn from single semantic categories, especially if the distracting items are semantically similar to the to-be-remembered (TBR) exemplars. Moreover, in such tasks, TBI items are frequently falsely recalled (Beaman, 2004; Marsh, Hughes, & Jones, 2008).
This experiment looks at how the timing of TBI items affects their appearance in oral and written recall protocols. Fifteen items were visually presented at a rate of 1 item/second. Recall was cued 5s later. A sequence of TBI items from the same category as the TBR items was presented simultaneously. Figure 1 shows the number of correct recalls at each serial position relative to a control condition in which the TBI items were from a different category.
Figure 1: Serial position function for correct recalls.
These data are broadly compatible across recall modalities. In both cases there was a statistically significant effect of the relatedness of the TBI list. It is straightforward to fit an extant model of free recall to these data if only these correct recalls are considered. Figure 2 shows fits obtained using the SIMPLE model (see Brown et al., 2007, for details) . Free parameters (c, threshold, noise) were estimated by minimizing Summed Square Error using the Nelder-Mead method.
Figure 2: Fits of the model to correct recall by serial position.
Auditory Distraction during Semantic Processing: Data and a Model
00.10.20.30.40.50.60.70.80.9
1 2 3 4 5 6 7 8 9 10 11 12 13 14 15
Prob
abili
ty C
orre
ct R
ecal
l
Serial Position
Oral Recall
Unrelated
Related
00.10.20.30.40.50.60.70.80.9
1 2 3 4 5 6 7 8 9 10 11 12 13 14 15
Prob
abili
ty C
orec
t Rec
all
Serial Position
Written Recall
Unrelated
Related
00.10.20.30.40.50.60.70.80.9
1
1 2 3 4 5 6 7 8 9 10 11 12 13 14 15
Prob
abili
ty C
orre
ct R
ecal
l
Serial Position
Unrelated Items, Oral Recall
Data
Model
00.10.20.30.40.50.60.70.80.9
1
1 2 3 4 5 6 7 8 9 10 11 12 13 14 15
Prob
abili
ty C
orre
ct R
ecal
l
Serial Position
Related Items, Oral Recall
Data
Model
00.10.20.30.40.50.60.70.80.9
1
1 2 3 4 5 6 7 8 9 10 11 12 13 14 15
Prob
abili
ty C
orre
ct R
ecal
l
Serial Position
Related Items, Written Recall
Data
Model
00.10.20.30.40.50.60.70.80.9
1 2 3 4 5 6 7 8 9 10 11 12 13 14 15
Prob
abili
ty C
orre
ct R
ecal
l
Serial Position
Unrelated Items, Written Recall
Data
Model
0
2
4
6
8
10
12
Correct Acceptance False Acceptance Correct Rejection False Rejection Repetition
Mea
n O
utpu
t Pos
ition
.
Recall Decision as a Function of Output Position (Related Condition)
0
0.02
0.04
0.06
0.08
0.1
0.12
1 2 3 4 5 6 7 8 9 10 11 12 13 14 15
Prob
abili
ty In
trus
ion
Erro
r
Serial Position
Oral Recall
Data
Model
0
0.02
0.04
0.06
0.08
0.1
0.12
1 2 3 4 5 6 7 8 9 10 11 12 13 14 15
Prob
abili
ty In
trus
ion
Erro
r
Serial Position
Written Recall
Data
Model
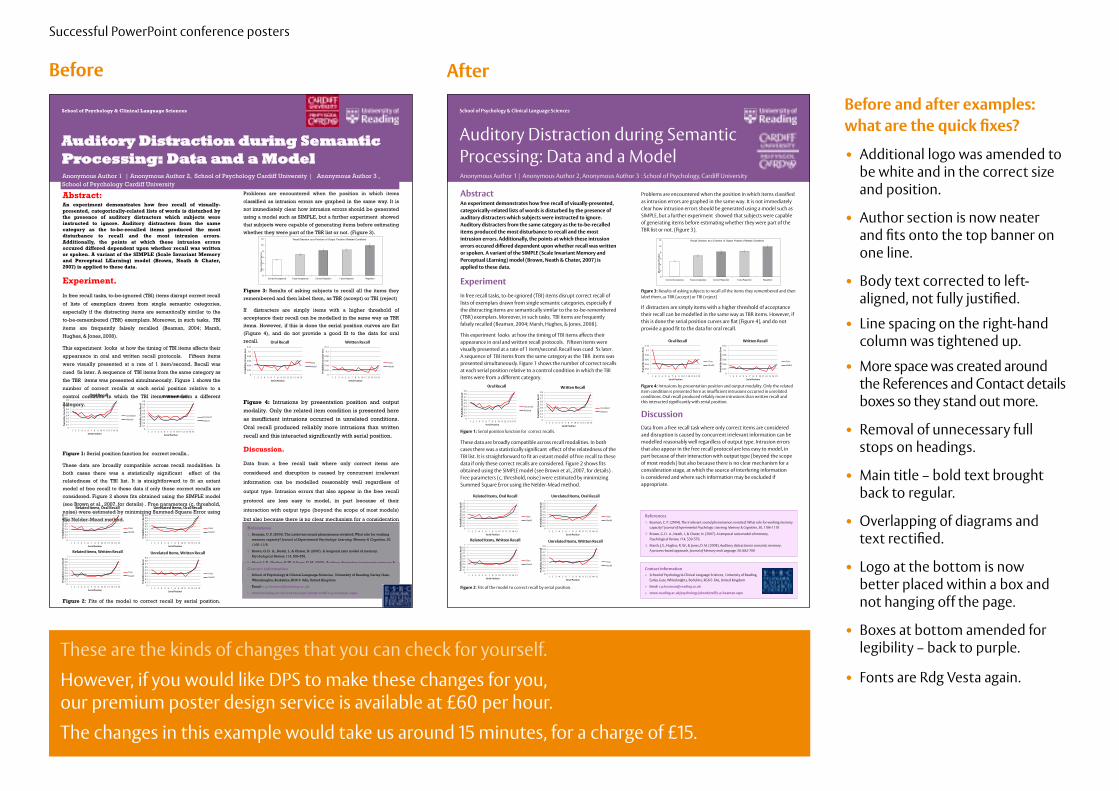
Before and after examples: what are the quick fixes?
• Additional logo was amended to be white and in the correct size and position.
• Author section is now neater and fits onto the top banner on one line.
• Body text corrected to left-aligned, not fully justified.
• Line spacing on the right-hand column was tightened up.
• More space was created around the References and Contact details boxes so they stand out more.
• Removal of unnecessary full stops on headings.
• Main title – bold text brought back to regular.
• Overlapping of diagrams and text rectified.
• Logo at the bottom is now better placed within a box and not hanging off the page.
• Boxes at bottom amended for legibility – back to purple.
• Fonts are Rdg Vesta again.
These are the kinds of changes that you can check for yourself.However, if you would like DPS to make these changes for you, our premium poster design service is available at £60 per hour.The changes in this example would take us around 15 minutes, for a charge of £15.
Before After