Embed Size (px)
Citation preview
Successes and Failures of Family Business in Slovakia
Alena Tóthová1*, and Miroslav Tóth2
1University of Economics in Bratislava, Faculty of Business Management, Department of Business
Finance, Dolnozemská cesta 1/b, 852 35 Bratislava, Slovak Republic 2University of Economics in Bratislava, Faculty of Business Management, Department of Business
Finance, Dolnozemská cesta 1/b, 852 35 Bratislava, Slovak Republic
Abstract. Family businesses are part of the world's economies, with an
estimated 70-90% share of total performance. The history of family
business in Slovakia is not continuous, so we can examine its level from
the last 30 years of experience at most. The paper is focused on research of
financial results of Slovak family enterprises, their confrontation with other
types of enterprises, searching for trends in the level of their financial
indicators and finally on the dependence between results and environment.
In the research were used several methods, from which we can name
mainly analysis, synthesis, comparison, mathematical-statistical methods.
The obtained outputs are intended to identify strengths and weaknesses of
family business in Slovakia.
1 Introduction
The tradition of family business in Czechoslovakia was violently discontinued during
socialism, but after 1989, the family business of family members started to slowly start
again. The beginnings were difficult because most Slovaks did not have enough
professional knowledge or the necessary skills for doing business. The isolation of Slovakia
has caused the loss of an overview of the level and forms of business in the global world.
Despite these obstacles, family businesses have gradually become an important component
of the Slovak economy over the past thirty years. The following data briefly characterizes
the importance of Slovak family businesses.
1.1 Current state of family business in Slovakia
An important source of up-to-date data on Slovak family businesses is the studies of SBA -
Slovak Business Agency, an agency focused on supporting small and medium-sized
enterprises. Interesting knowledge is also brought by repeatedly conducted surveys of
consulting company KPMG International with a global scope, directly focused on family
business. Trustworthy facts about family businesses are complemented by surveys by PwC
(PricewaterhouseCoopers). Outputs of the above companies declare that about one-eighth
* Corresponding author: [email protected],
SHS Web of Conferences 83, 01068 (2020)
Current Problems of the Corporate Sector 2020https://doi.org/10.1051/shsconf/20208301068
© The Authors, published by EDP Sciences. This is an open access article distributed under the terms of the CreativeCommons Attribution License 4.0 (http://creativecommons.org/licenses/by/4.0/).
of family businesses in Slovakia are medium-sized enterprises, approximately 15% are
small enterprises and up to 70% are micro-enterprises. Much of the family business is
already established on the market, as 34% of respondents surveyed have a history of more
than 20 years and another 32% are over 10 years old. In terms of the preferred form of
family business in Slovakia, the prevalence of the use of limited liability companies, which
is seen by up to 73% of family businesses, can be seen. More than half of family businesses
operate by owning only one family member. The importance of family businesses in the
European context is clearly stated by the European Commission's estimates of a 60% share
of family businesses in all European businesses. Family businesses themselves are aware of
their strength. Most think that they provide stability to the wider economy. The
characteristics of family businesses, their strengths and weaknesses, succession problems,
profitability, competitive struggle, the struggle for skilled labour, innovation and
technological progress, the challenges of penetrating international markets, the
imperfections of legislation on this type of business and many other open In its scientific
work, questions are addressed not only by a significant part of the professional public [1-
12], but also by many representatives of practice.
Presented state of family business in Slovakia, combined with the state of family
business in the European context, further extend the knowledge stemming from the research
of financial indicators of family businesses. The range of financial indicators is very broad
and therefore the assessment of the status of family businesses from a financial point of
view can be very diverse. The following is a brief illustration of what the financial
indicators on family businesses reveal.
1.2 Financial Indicators of Slovak Family Enterprises
Financial indicators provide an indication of the level of success / failure of family
businesses. By examining the financial indicators, it is possible to identify the financial
condition of family businesses, its development trends, the complexity and nature of
interrelationships between the results of family businesses, the dependence of financial
results and the degree of severity of the dependence.
For research of the mentioned areas we chose family enterprises engaged in industrial
production, namely the production of grape wine (SK NACE 11020). Industrial production
is the backbone of the Slovak economy, which is also reflected in the selection of a sample
of family businesses for research. The production of grape wine in Slovakia has been
internationally successful in recent years, it has the potential of growth, so it is important to
deal with the financial condition of family businesses in the given industry. The sample of
family businesses examined is linked by several characteristics. These are family
businesses with the same activity, employing 10 to 19 employees, with a turnover of up to €
0.8 million.
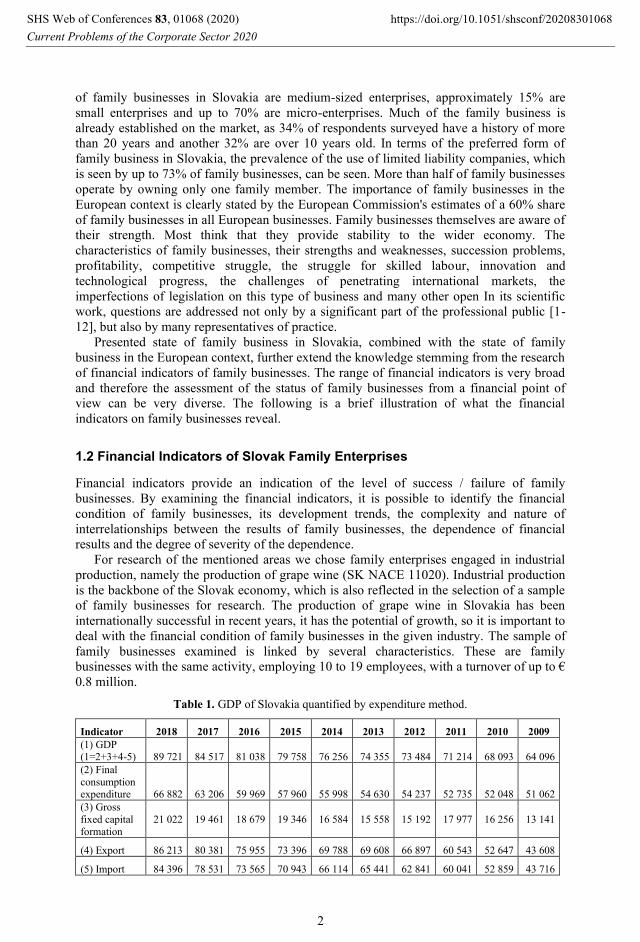
Table 1. GDP of Slovakia quantified by expenditure method.
Indicator 2018 2017 2016 2015 2014 2013 2012 2011 2010 2009
(1) GDP (1=2+3+4-5) 89 721 84 517 81 038 79 758 76 256 74 355 73 484 71 214 68 093 64 096
(2) Final
consumption
expenditure 66 882 63 206 59 969 57 960 55 998 54 630 54 237 52 735 52 048 51 062
(3) Gross
fixed capital
formation
21 022 19 461 18 679 19 346 16 584 15 558 15 192 17 977 16 256 13 141
(4) Export 86 213 80 381 75 955 73 396 69 788 69 608 66 897 60 543 52 647 43 608
(5) Import 84 396 78 531 73 565 70 943 66 114 65 441 62 841 60 041 52 859 43 716
SHS Web of Conferences 83, 01068 (2020)
Current Problems of the Corporate Sector 2020https://doi.org/10.1051/shsconf/20208301068
2
The Slovak economy and the environment of grape production in Slovakia are
represented by the indicators shown in Tables 1 and 2, taken from the SO SR. Statistical
office of the Slovak Republic
The data in Table 1 show the uneven trend in Slovakia's GDP growth. The main reasons
for GDP growth have changed over time. In most cases, the main driver of GDP was
investment, then exports and sometimes domestic consumption. The contribution of grape
wine production to the Slovak economy is shown in Table 2.
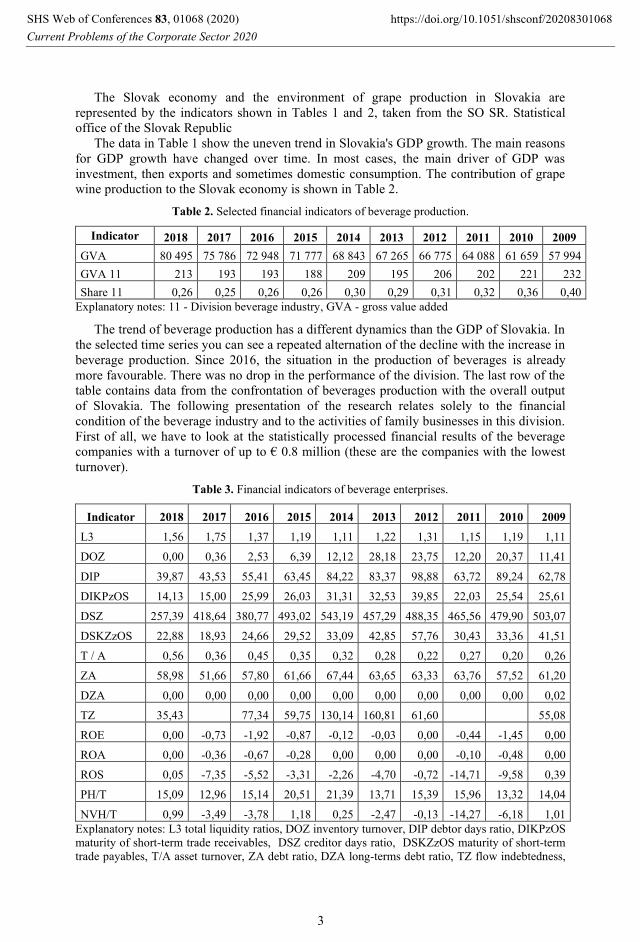
Table 2. Selected financial indicators of beverage production.
Indicator 2018 2017 2016 2015 2014 2013 2012 2011 2010 2009
GVA 80 495 75 786 72 948 71 777 68 843 67 265 66 775 64 088 61 659 57 994
GVA 11 213 193 193 188 209 195 206 202 221 232
Share 11 0,26 0,25 0,26 0,26 0,30 0,29 0,31 0,32 0,36 0,40
Explanatory notes: 11 - Division beverage industry, GVA - gross value added
The trend of beverage production has a different dynamics than the GDP of Slovakia. In
the selected time series you can see a repeated alternation of the decline with the increase in
beverage production. Since 2016, the situation in the production of beverages is already
more favourable. There was no drop in the performance of the division. The last row of the
table contains data from the confrontation of beverages production with the overall output
of Slovakia. The following presentation of the research relates solely to the financial
condition of the beverage industry and to the activities of family businesses in this division.
First of all, we have to look at the statistically processed financial results of the beverage
companies with a turnover of up to € 0.8 million (these are the companies with the lowest
turnover).
Table 3. Financial indicators of beverage enterprises.
Indicator 2018 2017 2016 2015 2014 2013 2012 2011 2010 2009
L3 1,56 1,75 1,37 1,19 1,11 1,22 1,31 1,15 1,19 1,11
DOZ 0,00 0,36 2,53 6,39 12,12 28,18 23,75 12,20 20,37 11,41
DIP 39,87 43,53 55,41 63,45 84,22 83,37 98,88 63,72 89,24 62,78
DIKPzOS 14,13 15,00 25,99 26,03 31,31 32,53 39,85 22,03 25,54 25,61
DSZ 257,39 418,64 380,77 493,02 543,19 457,29 488,35 465,56 479,90 503,07
DSKZzOS 22,88 18,93 24,66 29,52 33,09 42,85 57,76 30,43 33,36 41,51
T / A 0,56 0,36 0,45 0,35 0,32 0,28 0,22 0,27 0,20 0,26
ZA 58,98 51,66 57,80 61,66 67,44 63,65 63,33 63,76 57,52 61,20
DZA 0,00 0,00 0,00 0,00 0,00 0,00 0,00 0,00 0,00 0,02
TZ 35,43 77,34 59,75 130,14 160,81 61,60 55,08
ROE 0,00 -0,73 -1,92 -0,87 -0,12 -0,03 0,00 -0,44 -1,45 0,00
ROA 0,00 -0,36 -0,67 -0,28 0,00 0,00 0,00 -0,10 -0,48 0,00
ROS 0,05 -7,35 -5,52 -3,31 -2,26 -4,70 -0,72 -14,71 -9,58 0,39
PH/T 15,09 12,96 15,14 20,51 21,39 13,71 15,39 15,96 13,32 14,04
NVH/T 0,99 -3,49 -3,78 1,18 0,25 -2,47 -0,13 -14,27 -6,18 1,01
Explanatory notes: L3 total liquidity ratios, DOZ inventory turnover, DIP debtor days ratio, DIKPzOS
maturity of short-term trade receivables, DSZ creditor days ratio, DSKZzOS maturity of short-term
trade payables, T/A asset turnover, ZA debt ratio, DZA long-terms debt ratio, TZ flow indebtedness,
SHS Web of Conferences 83, 01068 (2020)
Current Problems of the Corporate Sector 2020https://doi.org/10.1051/shsconf/20208301068
3
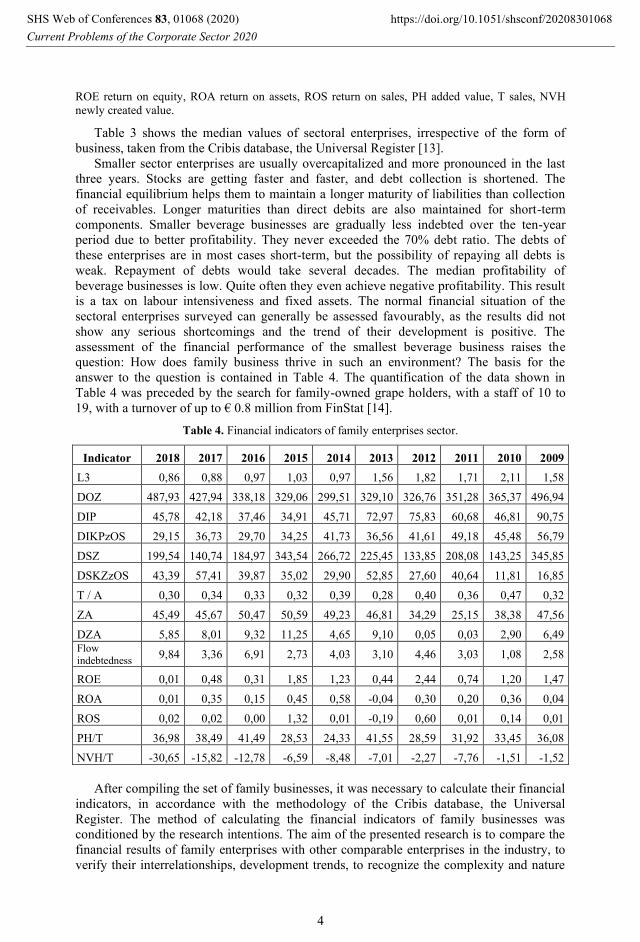
ROE return on equity, ROA return on assets, ROS return on sales, PH added value, T sales, NVH
newly created value.
Table 3 shows the median values of sectoral enterprises, irrespective of the form of
business, taken from the Cribis database, the Universal Register [13].
Smaller sector enterprises are usually overcapitalized and more pronounced in the last
three years. Stocks are getting faster and faster, and debt collection is shortened. The
financial equilibrium helps them to maintain a longer maturity of liabilities than collection
of receivables. Longer maturities than direct debits are also maintained for short-term
components. Smaller beverage businesses are gradually less indebted over the ten-year
period due to better profitability. They never exceeded the 70% debt ratio. The debts of
these enterprises are in most cases short-term, but the possibility of repaying all debts is
weak. Repayment of debts would take several decades. The median profitability of
beverage businesses is low. Quite often they even achieve negative profitability. This result
is a tax on labour intensiveness and fixed assets. The normal financial situation of the
sectoral enterprises surveyed can generally be assessed favourably, as the results did not
show any serious shortcomings and the trend of their development is positive. The
assessment of the financial performance of the smallest beverage business raises the
question: How does family business thrive in such an environment? The basis for the
answer to the question is contained in Table 4. The quantification of the data shown in
Table 4 was preceded by the search for family-owned grape holders, with a staff of 10 to
19, with a turnover of up to € 0.8 million from FinStat [14].
Table 4. Financial indicators of family enterprises sector.
Indicator 2018 2017 2016 2015 2014 2013 2012 2011 2010 2009
L3 0,86 0,88 0,97 1,03 0,97 1,56 1,82 1,71 2,11 1,58
DOZ 487,93 427,94 338,18 329,06 299,51 329,10 326,76 351,28 365,37 496,94
DIP 45,78 42,18 37,46 34,91 45,71 72,97 75,83 60,68 46,81 90,75
DIKPzOS 29,15 36,73 29,70 34,25 41,73 36,56 41,61 49,18 45,48 56,79
DSZ 199,54 140,74 184,97 343,54 266,72 225,45 133,85 208,08 143,25 345,85
DSKZzOS 43,39 57,41 39,87 35,02 29,90 52,85 27,60 40,64 11,81 16,85
T / A 0,30 0,34 0,33 0,32 0,39 0,28 0,40 0,36 0,47 0,32
ZA 45,49 45,67 50,47 50,59 49,23 46,81 34,29 25,15 38,38 47,56
DZA 5,85 8,01 9,32 11,25 4,65 9,10 0,05 0,03 2,90 6,49 Flow
indebtedness 9,84 3,36 6,91 2,73 4,03 3,10 4,46 3,03 1,08 2,58
ROE 0,01 0,48 0,31 1,85 1,23 0,44 2,44 0,74 1,20 1,47
ROA 0,01 0,35 0,15 0,45 0,58 -0,04 0,30 0,20 0,36 0,04
ROS 0,02 0,02 0,00 1,32 0,01 -0,19 0,60 0,01 0,14 0,01
PH/T 36,98 38,49 41,49 28,53 24,33 41,55 28,59 31,92 33,45 36,08
NVH/T -30,65 -15,82 -12,78 -6,59 -8,48 -7,01 -2,27 -7,76 -1,51 -1,52
After compiling the set of family businesses, it was necessary to calculate their financial
indicators, in accordance with the methodology of the Cribis database, the Universal
Register. The method of calculating the financial indicators of family businesses was
conditioned by the research intentions. The aim of the presented research is to compare the
financial results of family enterprises with other comparable enterprises in the industry, to
verify their interrelationships, development trends, to recognize the complexity and nature
SHS Web of Conferences 83, 01068 (2020)
Current Problems of the Corporate Sector 2020https://doi.org/10.1051/shsconf/20208301068
4
of the interrelationships between family enterprises, Finally, we proceeded to quantify the
median values of family business indicators. The median values represent whole sets of
enterprises and can serve the desired confrontation.
Family grape holdings cannot be permanently overcapitalised. The last three years have
shown a discrepancy between current assets and current liabilities. The mismatch
undermines the financial stability of the family businesses under review. Removal of stocks
has been protracted, and this period has been increasing more and more over the last two
years. The scales of financing the selected set of enterprises are partly offset by shorter
collection of total receivables compared to the maturity of all liabilities. Significantly
longer maturity of liabilities increases the scope for cash inflow into the company. It is
assumed that an adequate amount of cash flows into the enterprise during a long maturity
period. The supplier-customer relations of family businesses are not so favourably
consolidated for them. Only roughly in the last half of the time series will they collect cash
more quickly than they use to pay short-term liabilities to suppliers. Immediately after the
global crisis and for about the next three years, family businesses were not able to raise
funds from their customers in due time. The low turnover of assets is given by the nature of
the activity, its demands on the asset. The indebtedness of family businesses has not
changed very much over the last ten years and almost does not exceed 50% at all. The debt
portfolio also includes long-term debt, which, given the difficulty of maintaining the
stability of financing, can be considered a positive situation.
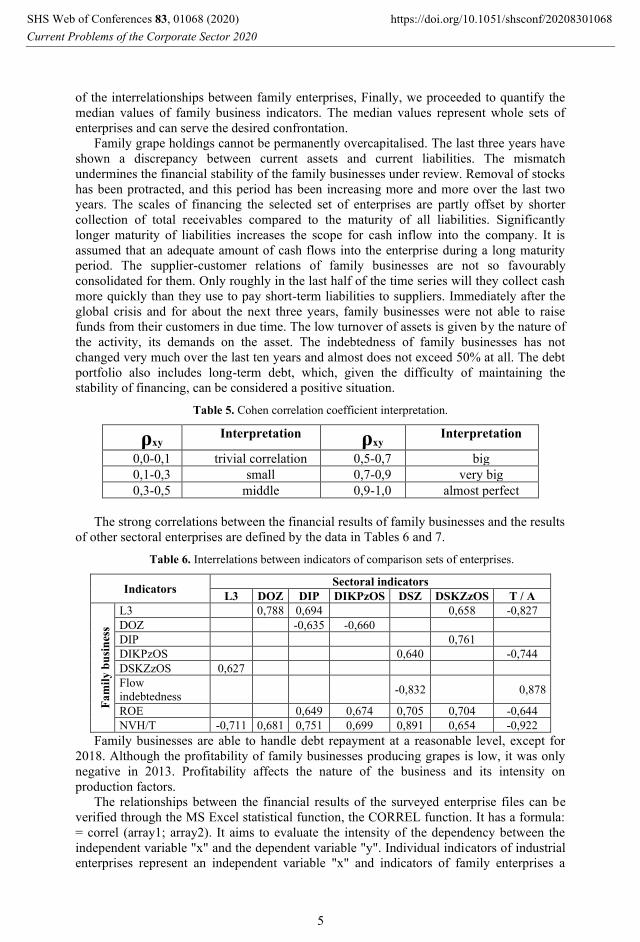
Table 5. Cohen correlation coefficient interpretation.
ρxy Interpretation ρxy
Interpretation
0,0-0,1 trivial correlation 0,5-0,7 big
0,1-0,3 small 0,7-0,9 very big
0,3-0,5 middle 0,9-1,0 almost perfect
The strong correlations between the financial results of family businesses and the results
of other sectoral enterprises are defined by the data in Tables 6 and 7.
Table 6. Interrelations between indicators of comparison sets of enterprises.
Indicators Sectoral indicators
L3 DOZ DIP DIKPzOS DSZ DSKZzOS T / A
Fa
mil
y b
usi
nes
s
L3 0,788 0,694 0,658 -0,827
DOZ -0,635 -0,660
DIP 0,761
DIKPzOS 0,640 -0,744
DSKZzOS 0,627
Flow
indebtedness -0,832 0,878
ROE 0,649 0,674 0,705 0,704 -0,644
NVH/T -0,711 0,681 0,751 0,699 0,891 0,654 -0,922
Family businesses are able to handle debt repayment at a reasonable level, except for
2018. Although the profitability of family businesses producing grapes is low, it was only
negative in 2013. Profitability affects the nature of the business and its intensity on
production factors.
The relationships between the financial results of the surveyed enterprise files can be
verified through the MS Excel statistical function, the CORREL function. It has a formula:
= correl (array1; array2). It aims to evaluate the intensity of the dependency between the
independent variable "x" and the dependent variable "y". Individual indicators of industrial
enterprises represent an independent variable "x" and indicators of family enterprises a
SHS Web of Conferences 83, 01068 (2020)
Current Problems of the Corporate Sector 2020https://doi.org/10.1051/shsconf/20208301068
5
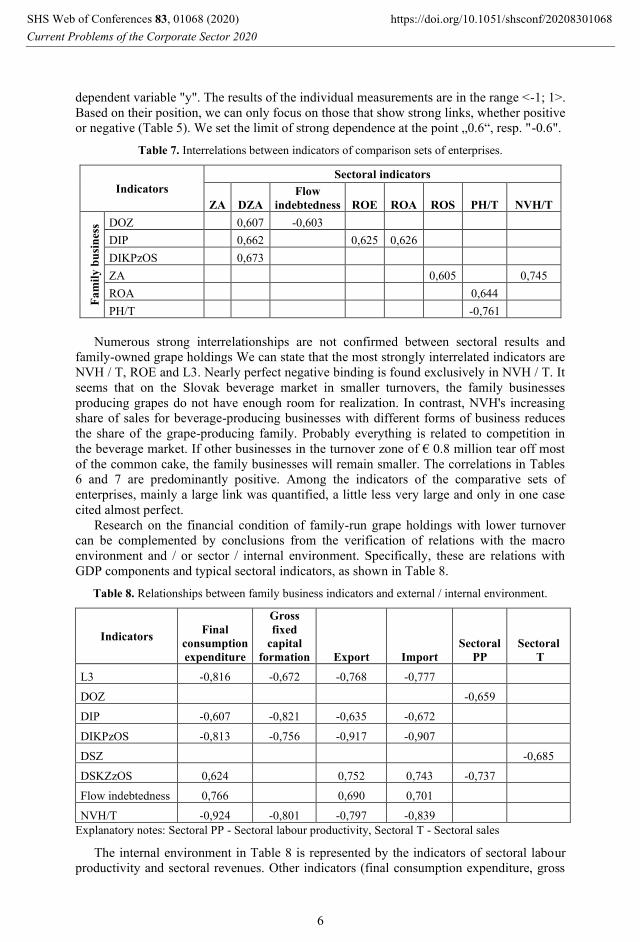
dependent variable "y". The results of the individual measurements are in the range <-1; 1>.
Based on their position, we can only focus on those that show strong links, whether positive
or negative (Table 5). We set the limit of strong dependence at the point „0.6“, resp. "-0.6".
Table 7. Interrelations between indicators of comparison sets of enterprises.
Indicators
Sectoral indicators
ZA DZA
Flow
indebtedness ROE ROA ROS PH/T NVH/T
Fa
mil
y b
usi
nes
s DOZ 0,607 -0,603
DIP 0,662 0,625 0,626
DIKPzOS 0,673
ZA 0,605 0,745
ROA 0,644
PH/T -0,761
Numerous strong interrelationships are not confirmed between sectoral results and
family-owned grape holdings We can state that the most strongly interrelated indicators are
NVH / T, ROE and L3. Nearly perfect negative binding is found exclusively in NVH / T. It
seems that on the Slovak beverage market in smaller turnovers, the family businesses
producing grapes do not have enough room for realization. In contrast, NVH's increasing
share of sales for beverage-producing businesses with different forms of business reduces
the share of the grape-producing family. Probably everything is related to competition in
the beverage market. If other businesses in the turnover zone of € 0.8 million tear off most
of the common cake, the family businesses will remain smaller. The correlations in Tables
6 and 7 are predominantly positive. Among the indicators of the comparative sets of
enterprises, mainly a large link was quantified, a little less very large and only in one case
cited almost perfect.
Research on the financial condition of family-run grape holdings with lower turnover
can be complemented by conclusions from the verification of relations with the macro
environment and / or sector / internal environment. Specifically, these are relations with
GDP components and typical sectoral indicators, as shown in Table 8.
Table 8. Relationships between family business indicators and external / internal environment.
Indicators Final
consumption
expenditure
Gross
fixed
capital
formation Export Import
Sectoral
PP
Sectoral
T
L3 -0,816 -0,672 -0,768 -0,777
DOZ -0,659
DIP -0,607 -0,821 -0,635 -0,672
DIKPzOS -0,813 -0,756 -0,917 -0,907
DSZ -0,685
DSKZzOS 0,624 0,752 0,743 -0,737
Flow indebtedness 0,766 0,690 0,701
NVH/T -0,924 -0,801 -0,797 -0,839
Explanatory notes: Sectoral PP - Sectoral labour productivity, Sectoral T - Sectoral sales
The internal environment in Table 8 is represented by the indicators of sectoral labour
productivity and sectoral revenues. Other indicators (final consumption expenditure, gross
SHS Web of Conferences 83, 01068 (2020)
Current Problems of the Corporate Sector 2020https://doi.org/10.1051/shsconf/20208301068
6
capital formation, exports, imports) represent the macro environment of Slovakia. The
strong impact of the internal environment on the family businesses examined was only
confirmed by the turnover of stocks and the repayment of liabilities. Better utilization of the
workforce within the sector benefits the grape family business from faster stock picking and
short-term trade payables. Increasing labour productivity is reflected in business revenues.
Revenue from implementation is due to the removal of production and a larger volume of
sales can be better used to pay off liabilities. The impact of the macro environment on the
selected family business is somewhat clearer and more numerous. The relationships with
the macro-environment are mostly negative. Increasing domestic consumption, increasing
investment and exports have demonstrably shortened the collection of all receivables,
including trade receivables, to family businesses, but also worsens overall liquidity. The
better-named macroeconomic indicators press strongly to extend the maturities of short-
term liabilities to of all debts. Paradoxically, more performance in the economy reduces the
share of newly created value of family businesses in sales. What is it given? Nature of
activity and competition. Increasing demand hides increasing demand, which all business
entities want to use. But the business being monitored is only slightly profitable, almost to
the edge, which does not allow businesses to create enough of their own resources.
Businesses must therefore seek foreign resources in order to make the most of the growing
demand. At the same time, foreign sources are being favoured by favourable conditions on
financial markets, materialized in attractive conditions for obtaining foreign sources. Low
profitability and more debt must automatically aim to extend the debt settlement period.
Better times in the country's economy encourage the optimistic mood of economic agents,
and as a result, it may be expected to provide or tolerate a longer reimbursement period by
suppliers for higher purchases. What family families producing grape can certainly not be
pleased to find is that, despite optimism, rising household spending, increasing investment
in long-term assets and more intensive exports, they fail to change the share of newly
created value in sales to such an extent as to improve their profitability. Now is the time to
draw attention to the competitive struggle between businesses with less turnover in grape
production. It turns out that increasing domestic consumption is not necessarily directed
towards the production of the most vulnerable family businesses, investment in fixed assets
usually reduces operating costs, but also increases the cost of wear and tear. The cost
savings are not likely to be so high as to sufficiently exceed labour requirements and the
cost of wear and tear on fixed assets.
2 Conclusion
The facts presented in this paper clearly demonstrate the importance of family
businesses not only for the Slovak economy, but also for the world economy. Family
business has its specifics, which brings certain advantages but also disadvantages. Surveys
and studies by reputable companies discuss in detail the rules for the functioning of family
businesses, their financial decision-making, mentioning unused opportunities and the most
important challenges for the future. The knowledge base of the surveys is connected with
the results of the examination of financial indicators of a selected sample of Slovak family
businesses. The paper deals with the evaluation of financial condition of family businesses,
its development trends, mutual relations between the results of their external and internal
environment. Presented data and method of their processing are an example of analytical
work with parameters of family businesses.
SHS Web of Conferences 83, 01068 (2020)
Current Problems of the Corporate Sector 2020https://doi.org/10.1051/shsconf/20208301068
7
Acknowledgement
The article is a partial result of research within the VEGA projects n. 1/0240/20 „Financial Aspects of
Sustainable Business - Enterprise Succession Solution for Small and Medium-sized Enterprises“
share 50% and
VEGA MŠ SR n. 1/0708/20 “Socio-economic determinants of sustainable consumption and
production in terms of impact on performance and competitiveness of enterprises” share 50 %.
References
1. B. Maury, Family Ownership and Firm Performance: Emperical Evidence from
Western European Corporations. Journal of Corporate Finance 12, pp. 321-341. ISSN
0929-1199. (2006).
2. R. C Anderson, D. M. Reeb, Founding‐ family ownership and firm performance:
Evidence from the S&P 500. The Journal of Finance 58, Issue 3, pp. 301-1328. ISSN
1540-6261. (2003)
3. K. Birdi et al., The impact of human resource and operational management practices on
company productivity: a longitudinal study. Personnel Psychology 61, Issue 3, pp.
467-501. ISSN 1744-6570. F. De Lillo, F. Cecconi, G. Lacorata, A. Vulpiani,
Sedimentation speed of inertial particles in laminar and turbulent flows. EPL, 84, 314-
381 (2008)
4. B. Leavy, Outsourcing strategy and a learning dilemma. Production and Inventory
Management Journal 4, 50-54 (1996).
5. O. Hart, The Costs and Benefits of Ownership: A Theory of Vertical and Lateral
Integration. Journal of Political Economy 94, 4, 691-719 (1986).
6. C. Lynch, Logistics Outsoucing – A Management Guide. Council of Logistics
Management, Oak Brook (2000).
7. KPMG, Enterprise European family business barometer Succession top of mind as
business families eye their legacy 2019 Eighth edition home.kpmg/familybusiness
www.europeanfamilybusinesses.eu (2020)
8. E. Arrigo, Global Sourcing in Fast Fashion Retailers: Sourcing Locations and
Sustainability Considerations. Sustainability 12, 508 (2020).
9. M. Aoki, Horizontal vs. Vertical Information Structure of the Firm. American
Economic Review 76, 5, 971-983 (1986).
10. M. Pankowska, Information Technology Outsourcing Chain: Literature Review and
Implications for Development of Distributed Coordination. Sustainability 11, 1460
(2020).
11. A. M. Abubakr, A. T. Abbas, T. Italo, M. S. Soliman, M. Luqman, H. Hegab,
Sustainable and Smart Manufacturing: An Integrated Approach. Sustainability 12,
2280 (2020).
12. M. W. Rutherford, D. F. Kuratko, D. T. Holt, Examining the Link Between
“Familiness” and Performance: Can the F-PEC Untangle the Family Business Theory
Jungle?. Entrepreneurship Theory and Practice 32, pp. 1089–1109. ISSN 1540-6520,
(2008)
13. Cribis, Universal register. https://www2.cribis.sk/ExtendedSearch.aspx
14. Finstat, Database of companies and organizations. https://finstat.sk/databaza-firiem-
organizacii
SHS Web of Conferences 83, 01068 (2020)
Current Problems of the Corporate Sector 2020https://doi.org/10.1051/shsconf/20208301068
8