Embed Size (px)
Citation preview
SUCCESS OF FIRST-GENERATION COLLEGE STUDENTS IN A SELECTIVE
DOCTOR OF OPTOMETRY PROGRAM
by
Sharon T. Joyce
Bachelor of Arts, Chatham University, 1991
Master of Education, University of Pittsburgh, 1996
Submitted to the Graduate Faculty of
the School of Education in partial fulfillment
of the requirements for the degree of
Doctor of Education
University of Pittsburgh
2017

UNIVERSITY OF PITTSBURGH
SCHOOL OF EDUCATION
This dissertation was presented
by
Sharon T. Joyce
It was defended on
March 24, 2017
and approved by
W. James Jacob, Ph.D., Associate Professor, School of Education
Charlene Travato, Ph.D., Clinical Associate Professor, School of Education
Richard C. Van Sluyters, O.D., Ph.D., Professor, Optometry and Vision Science,
University of California, Berkeley
Dissertation Chair: John C. Weidman, Ph.D. Professor, School of Education
ii

Copyright © by Sharon T. Joyce
2017
iii
What happens when former first-generation college (FGC) students successfully
graduate from college and then aim for post-undergraduate education? The purpose of this
dissertation is to compare differences between FGC students and non-FGC admissions profiles
regarding end-of-first-year performance at UC Berkeley’s School of Optometry. The aims of this
research project were to a) compare academic performance of FGC and non-FGC students based
on GPAs from the end of their first professional school year, and b) examine the relationships
among gender, ethnicity, participation in pre-optometry preparatory programs, undergraduate
GPA, undergraduate institutional selectivity, Optometry Admissions Test (OAT) scores, and
end-of-year GPAs within these two populations. In 2011, all current students at UC Berkeley’s
School of Optometry were asked to participate in this research study; surveys from 233 students
were collected. A P-value of <0.05 was considered significant for all statistical tests.
Comparison of Optometry Degree (OD) GPA as an overall academic performance of optometry
academics showed no statistical difference between FGC and non-FGC students (p=0.37). Also,
comparison of underrepresented status noted no significant difference between FGC and non-
FGC students (p=0.20). Self-reported ethnicity (p=0.04), Carnegie Classification Tier (p=0.001)
and attendance at Opto-Camp, a preparatory program offered prior to entering the OD program
SUCCESS OF FIRST-GENERATION COLLEGE STUDENTS IN A SELECTIVE
DOCTOR OF OPTOMETRY PROGRAM
Sharon T. Joyce, EdD
University of Pittsburgh, 2017
iv
(p=0.04), were all significant and associated with a lower OD GPA. Finally, the correlation of
Undergraduate GPA and Optometry Admissions Test (OAT) AA Score with OD GPA was
examined; undergraduate GPA had a significant positive correlation (r=0.33) with OD GPA
(p=.0001). OAT AA Score also had a significant positive correlation (r=0.38) with OD GPA
(p=.0001). While this study is encouraging that FGC students performed just as well as non-
FGC students, future study on Berkeley Optometry students must consider the program’s distinct
demographics. There is a lack of scholarship pertaining to FGC students who have made it into
post-undergraduate studies, often investigating deficiencies in their preparation and look for
“traditional” measures of success. Future studies should include metrics that measure factors like
resilience as a predictor of persistence, and characteristics like empathy, which is necessary for
those who aspire to be in the health professions.
v
TABLE OF CONTENTS
PREFACE .................................................................................................................................... IX
1.0 INTRODUCTION ........................................................................................................ 1
1.1 FIRST GENERATION COLLEGE STUDENTS ............................................ 1
1.2 FIRST GENERATION COLLEGE STUDENTS POST-
UNDERGRADUATE PURSUITS AND ASPIRATIONS ................................................ 4
2.0 OPTO-CAMP ............................................................................................................... 7
3.0 FGC STUDENTS IN OPTOMETRY PROGRAMS .............................................. 13
4.0 METHODOLOGY ..................................................................................................... 20
4.1.1 Study Respondents ........................................................................................ 24
4.1.2 Statistical Methods ........................................................................................ 27
5.0 RESULTS ................................................................................................................... 28
6.0 DISCUSSION ............................................................................................................. 36
APPENDIX A .............................................................................................................................. 40
APPENDIX B .............................................................................................................................. 42
APPENDIX C .............................................................................................................................. 46
APPENDIX D .............................................................................................................................. 49
BIBLIOGRAPHY ....................................................................................................................... 51
vi
LIST OF TABLES
Table 1. Carnegie Classifications Tiers, using these subclassifications: More Selective, Selective,
and Inclusive ................................................................................................................................. 21
Table 2. Study Respondents: Demographic Results for the Classes of 2011-2014 ...................... 25
Table 3. Subanalyses Based upon Parents’ Educational Attainment ............................................ 29
Table 4. OD GPA Compared to Study Factors ............................................................................. 31
Table 5. Data Based on Two Groups: Minority and Majority ...................................................... 33
Table 6. OD GPA Correlations ..................................................................................................... 35
Table 7. Admissions Data, Classes of 2011-2014 ........................................................................ 37
vii

LIST OF FIGURES
Figure 1. Pitt Survey ..................................................................................................................... 50
viii
PREFACE
I am eternally grateful to Dr. John Weidman for his patience and support over the time it
has taken to see this project to completion. He’s been an exceptional advisor and a treasure to
the School of Education at the University of Pittsburgh. I wish him well on his retirement and am
glad he stuck around to see me graduate!
To my committee members, Drs. Charlene Travato, W. James Jacob, and Richard Van
Sluyters, thank you all for your thoughtful reviews of my work, your suggestions to make this
dissertation better, and your words of encouragement. In particular, to RCVS, thank you for
being an involved mentor and supervisor in my career development at Cal.
To Dr. John Feiner from the University of California, San Francisco, thank you for
helping me with the statistical analysis for this project. Your assistance was instrumental in
moving this project forward and I am forever appreciative of your time and attention to make
sure the data analysis came together.
To Dr. Jeffery Loo from the Fong Library at UC Berkeley’s School of Optometry, in
addition to your librarian superpowers, your positivity and pep talks energized me to finish this
project more than you’ll ever know. Thank you.
To Deans Dr. Dennis Levi and Dr. John Flanagan, thank you for your support of the
Opto-Camp program and for your words of wisdom to keep me on track to finish my
dissertation.
ix
To the amazing students in the Optometry and Vision Science programs, thanks for
supporting this project and for being a source of joy and happiness in my years at Cal.
To all who have attended Opto-Camp, especially to the FGC students, and to future Opto-
Campers, you inspire me and I thank you for sharing so much of yourselves with me. It has been
an honor to grow this program and share in your successes.
To my Admissions and Student Affairs Office (ASAO) colleagues, thank you for being
part of Opto-Camp, for believing in the value of the program and for seeing the potential in all
who attend. Thank you for supporting me in the pursuit of this doctoral degree and thanks for
making our workplace a community of caring. Thanks to Heather Iwata, Kait Guthrie, Carissa
Caloud, Kailin Hu, Ariana Lee, Donna Lee, and Lisbeth Woodington.
To my amazing group of friends, too many to name, it’s time to celebrate! Thanks in
particular to my BFF of over 40 years, Lisa Kersavage, for being a faithful cheerleader as this
project waxed and waned.
To my family, Mom, Susan and Frank, and Brian and Elaine and Joe Rollins, thank you
for your encouragement and love.
Finally, to the two loves of my life, my M&Ms, Mark and Matthew. Mark, your patience
and support have been unwavering and I thank you for all you have done to keep this dream of
earning my EdD alive. From having the initial thought to use Opto-Camp as my topic, to
availing me of resources, to answering my questions about conducting research, you’ve been
nothing short of incredible. Matthew, thanks for always making me smile big grins that I didn’t
think were possible. While I am thrilled to be earning this degree, you will always be the best
piece of work I’ve ever produced.
x

This dissertation is dedicated to my brother, Stephen, the other half of a photo that was to
be taken of “Dr. Joyce’s brothers” and to my dad, Donald, who would have been so proud of
this accomplishment. I know you’re both with me in spirit.
xi
1.0 INTRODUCTION
This dissertation compared differences between first-generation college (FGC) students
and non-FGC admissions profiles and their end-of-first-year performance at the University of
California, Berkeley, School of Optometry. This research involved collecting and comparing
data from the classes of 2011 to 2014 that compared the academic performance of FGC and non-
FGC students based on their grade point averages (GPAs) from the end of their first professional
school year. The secondary study aims included examining the effects of gender, ethnicity,
participation in pre-optometry preparatory programs, undergraduate GPA and undergraduate
institutional selectivity, and Optometry Admissions Test (OAT) scores on their GPAs.
1.1 FIRST GENERATION COLLEGE STUDENTS
First-generation students, as defined by the National Center for Education Statistics and
for the purpose of this study, are those “whose parents’ highest level of education is a high
school diploma or less. In cases where parents have different levels of education, the maximum
education level of either parent determines how the student is categorized” (U.S. Department of
Education, 1998, p.7).
While there are descriptive data on the demographics of FGC students in post-secondary
settings related to factors such as race and gender, there is a dearth of information that has looked
1

specifically at FGC students who have post-undergraduate aspirations. Additionally, questions
such as how many FGC students attend college and finish within a reasonable time frame remain
largely unanswered because organizations, such as Integrated Postsecondary Education Data
System (IPEDS), cannot keep pace with the ever-changing landscape of higher education
(Engle, 2016).
The most comprehensive study providing demographic information about undergraduate
education pertinent to this project comes from the Higher Education Research Institute (HERI)
report published in 2007, “First in My Family: A Profile of First-Generation College Students at
Four-Year Institutions Since 1971.” Two major findings from this report are as follows (Saenz,
Hurtado, Barrera, Wolf, & Young, 2016, p. 9):
• The proportion of first-generation students within the overall population of first-time, full-time entering college freshman at four-year institutions has steadily declined since 1971, reflecting increasing levels of education among the U.S. population.
• However, differences between racial/ethnic groups are cause for concern. Specifically, since 1975, African Americans show the greatest decline in their representation of first-generation college students—a declining rate that is of concern because it is faster than the relative proportion of African American adults without a college education as well as the decline of first-generation students in other racial/ethnic groups. Hispanics remain the least educated group (69.1 percent of Hispanic adults lacked a college education in 2005) and have the highest proportion of first-generation college students (38.2 percent) at four-year colleges of any racial/ethnic group.
The report also presented gender statistics: “in 2005, 16.9 percent of all women and 14.7 percent
of all men among entering college students were first-generation” (p. 23).
As a population, FGC students are more likely to come from low-income households, be
part of an underrepresented group, and have lower degree aspirations (Terenzini, Springer,
Yeager, Pascarella, & Nora, 1996). Other studies have indicated that FGC students have lower
self-esteem (Hurley, 2002) and have difficulties adjusting to higher education because they are
unfamiliar with the world of academia (Arredondo, 1999).
2
Additionally, unlike non-FGC students, FGC students have assimilation issues and often
have to straddle two worlds, where new and old cultural norms clash (Rendon, 1992). While
spanning multiple cultures creates resiliency in FGC students (Tugend, 2016), it can also create
an inner tension whereby FGC students may experience subtle discouragement to become more
socially and economically mobile (London, 1996). More controversial is the work of Ogbu,
which originally speculated that black students, particularly males, create an oppositional
relationship where formal education is concerned in an effort to avoid the stigma of “acting
white” (Foley, 2004). Although this theory was later reworked into a model that concurred with
earlier research surrounding the inner-conflict of higher education attainment for FGCs, feeling
put down for being smart and studious have been cited by FGC students (Fauteux, 2012).
Moreover, in 2010 and according to the U.S. Department of Education, half of the college
population is made up of FGC students. Furthermore, again in 2010, the National Center for
Education Statistics released data indicating that underrepresented groups made up the largest
demographics of students with parents holding a high school education or less: 48.5%
Latino/Hispanic students, 45% of Black/African-American students; 32% of Asian students; and
35% of Native Americans. Among Caucasian students, 28% were first-generation college
students (Lynch, 2013).
As an example of the growth of FGC students, in 2000, there were 9,073 first-generation
applicants to the University of California, Berkeley campus (out of 33,351 total applicants). The
campus admitted 11,481 applicants that year of whom 2,676 were FGC students; 4,676 enrolled
of whom 1,219 were FGCs. In 2010, there were 14,982 first-generation applicants to the same
campus (out of 50,374 total applicants); the campus admitted 12,988 applicants that year and
2,675 were FGC students while 5,024 enrolled and 1,171 were FGCs. For all the University of
3
California schools in 2001, there were 21,220 FGC applicants in the pool for admission and in
2010, this number reached 35,844 (University of California, Office of the President, 2011).
1.2 FIRST GENERATION COLLEGE STUDENTS POST-UNDERGRADUATE
PURSUITS AND ASPIRATIONS
What happens when former FGC students overcome the many hurdles presented in their
undergraduate studies, successfully graduate from college, and then aim for post-undergraduate
education? Only a limited number of studies have looked specifically at FGC students, whether
linked or not to race, and at their performance in graduate school and/or professional degree
programs. Most were only speculative on the post-undergraduate pursuits and aspirations of
FGC students.
In one study (Tate et al., 2014), 175 McNair Scholars1, across multiple institutions and
multiple class years, were surveyed; factors such as “research self-efficacy” (a FGC student’s
confidence in his or her abilities related to research skills, e.g. data analysis and technical
writing) and “family values,” which was interpreted in this study as situations wherein FGC
students might be driven to honor their families by attaining an education that leads to better
career opportunities, were the only factors of statistical significance in FGC students’ choosing
1 The McNair Scholars Program is a federal TRIO program funded at 151 institutions across the United States and Puerto Rico by the U.S. Department of Education. It is designed to prepare undergraduate students for doctoral studies through involvement in research and other scholarly activities. McNair participants are either first-generation college students with financial need, or members of a group that is traditionally underrepresented in graduate education and have demonstrated strong academic potential. The goal of the McNair Scholars Program is to increase graduate degree awards for students from underrepresented segments of society.
4

to pursue graduate studies. It was also noted that because McNair participants are actively
supported and encouraged to attend graduate school, respondents should skew toward having a
goal of pursuing post-undergraduate aspirations.
Another study was found that even when respondents were of the same race and socio-
economic status, and had the same undergraduate GPA, FGC students were significantly less
likely to apply to graduate school or a professional degree program (Carlton, 2015). In that
study, the link to student debt was statistically significant: “First-generation students are less
likely to apply to graduate or professional school programs because the amount of money owed
to their undergraduate institutions significantly affects their future plans” (p. 5). Furthermore,
according to the researcher, it is reasonable to speculate that FGC students are wholly
responsible for paying off their undergraduate loans, accumulating more debt for additional
education is daunting, and they want to start earning a paycheck upon graduation.
A study by Seay, Lifton, Wuensch, Bradshaw, and McDowelle (2008) found that FGC
students enrolled in graduate programs (excluding medicine) at a public research university in
the southeast differed from non-FGC students on five characteristics: they didn't enter their
graduate studies straight from their undergraduate education, they were significantly more likely
to be enrolled as a part-time student, they were employed full-time, they self-reported being
financially independent, and they had a higher probability of having children. While these
characteristics have been used to explain attrition risks in undergraduate FGC students, this study
didn’t examine the retention and persistence of the graduate students who were surveyed.
Finally, a Master’s candidate at San Jose State University thoughtfully chronicled the
experiences of six FGC students who were pursuing graduate degrees and concluded that all of
his subjects reported needing “emotional support, reality confirmation, and listening support
5

more than anything” (Lancaster, 2010, p. 69). He also reported that peer-to-peer interactions
became increasingly more important due to the shared experience of being an FGC student, now
a graduate student, and he observed that all of the students struggled with time management
(Lancaster, 2010).
Because of the dearth of scholarly work on former FGC students and how they perform
as graduate students, this dissertation research is all the more meaningful a contribution toward
ensuring their success. It can also open conversations among professionals in enrollment
management; admissions committees strive to select incoming classes that are not only
academically prepared, but also diverse and reflective of students’ varied life experiences, which
can be an even more consequential endeavor when thinking about supporting former FGC
students. According to Brus (2006), “Retention means that a nontraditional student navigated
successfully through graduate school; retention also measures the cumulative impact of many
successful interventions and support services provided by the institution” (p. 43).
6

2.0 OPTO-CAMP
With over 25 years of experience in higher education, in roles spanning admissions,
academic advising, student affairs, financial aid, and career services in five distinct academic
settings, I have been passionate about equipping students with a firm foundation for managing
their lives inside and outside of the classroom. I am equally engaged in creating climates that are
thoughtfully inclusive, particularly in my role over the last 10 years in admissions and student
services at the School of Optometry at the University of California, Berkeley. Part of my
responsibilities has included finding ways to improve diversity in the student body.
In 2005, the Association of Schools and Colleges of Optometry (ASCO) spearheaded a
diversity mini-grant program to support creative and novel ways to attract underrepresented
students to the profession of optometry. With the intention of building a pipeline of
underrepresented and/or FGC students, I created a program called Opto-Camp; this program
targeted both underrepresented and FGC students to open up pathways more broadly and to
ensure that the program would not violate California Proposition 209, which, although far-
reaching, could have implications for the Opto-Camp program if selection was race-based.
My grant proposal was selected for funding and was funded through the next six cycles
until the diversity mini-grant program ended. By then, the program had gained enough attention
from corporations in the field of vision and eye care services that Vision Service Plan (VSP)
became the sponsor of Opto-Camp at Berkeley Optometry. Since the inaugural Opto-Camp
7

cohort in 2006, 600 prospective students have attended this unique summer program. Details on
the program can be found in Appendix A.
In 2011, a brief outcomes survey of the program was conducted and it was found that
87% of Opto-Camp attendees were pursuing a career in the health sciences. However, there
hasn’t been a more in-depth analysis of how former Opto-Campers perform in our program, and
overall, how FGC students perform at Berkeley Optometry. Given the efforts that have been
made to create a program to support FGC students on their trajectory into optometric programs,
how do end-of-year GPAs for those who participated in Opto-Camp and the overall academic
success of first-generation college and non-FGC students at Berkeley Optometry compare after
the first year?
Again, in order to address disparities in the profession on optometry, in 2006, Berkeley
Optometry launched Opto-Camp. The goal was, and remains, to introduce FGC pre-health
science majors to optometry as a potential career track and to prepare them to be successful
applicants to optometry school. Opto-Camp is also open to undergraduate students outside of UC
Berkeley.
The objective of Opto-Camp is to provide a residential experience with opportunities for
the participants to learn about the profession of optometry and the process of becoming an
optometrist. Additionally, by enjoining key faculty and staff members to participate in this
program, we hoped to heighten diversity awareness within Berkeley Optometry.
Furthermore, regardless of where Opto-Campers ultimately choose to pursue their
graduate studies, this program strives to increase diversity within the healthcare professions in
order for Berkeley Optometry to reach its own goal of a more inclusive program and to raise
awareness of optometry as an excellent profession.
8

The Opto-Camp program has served as a template for other schools to replicate with the
collective end-goal of increasing diversity across all optometry programs. In fact, the Illinois
College of Optometry, The Ohio State University College of Optometry, and Pacific University
College of Optometry have developed their own summer programs using Berkeley Optometry’s
innovative start as a model. As a result, these programs are now gathered into a Consortium for
Optometry Summer Enrichment Programs to promote developing and implementing
activities/programs to recruit and/or retain underrepresented students, the financially
disadvantaged, and FGC students pursuing the profession.
An underlying principle of Opto-Camp is that there is a huge benefit in bringing
prospective optometry students on campus to experience what pursuing an OD degree entails.
From Berkeley Optometry’s perspective, Opto-Camp continues to be a successful program; the
participants enjoy the social aspects of Opto-Camp, acquire knowledge regarding the field of
optometry, learn about the admissions process, and complete the program with new skill sets in
interviewing and time and stress management.
Opto-Camp also provides a great opportunity for Berkeley Optometry to rally around a
significant outreach program for underrepresented and/or first-generation college students, as
noted by the number of faculty, staff, and students who volunteer and continue to participate in
many of the modules spread out over the program.
Given the statistics that indicate that FGC students are significantly less likely to graduate
(Ishiyama & Hopkins, 2003), and that FGC students, who are also low-income, have even lower
chances of doing so (Choy, 2000), is the Opto-Camp program at UC Berkeley a success?
Because participants are linked by taking the same seminars and participate in team
building activities, it would appear that the program fosters a strong learning community (Tinto,
9
1998) The structure of Opto-Camp is beneficial: “Learning communities not only promote
shared and connected learning among students, but they also help students form supportive peer
groups that extend beyond the classroom, become more actively involved in the classroom
learning even after class, and increase the quality of their learning” (Ishiyama & Hopkins 2003,
p. 396). The proposition of creating learning communities on a campus, such as UC Berkeley’s
Opto-Camp, can be imperative when all students experience a sense of being “lost” at such a
large academic institution. This is surely compounded for FGC students who “enter a world
where they are less likely to experience many of the conditions that other research indicates are
positively related to persistence, performance, and learning” (Terenzini et al., 1996, p. 18).
Furthermore, Opto-Camp participants create virtual learning communities and supportive
networks through Facebook groups; every cohort that has gone through the summer program has
created its own associated Facebook group, and the participants continue to support each other
by offering advice on prerequisite courses, bolstering the confidence of others through the
application process to optometry programs as well as other health science programs, and stay
connected as a network for life, which affirms the notion that peer-to-peer relationships sustain
these students as they navigate applying, matriculating, and persisting in schools and colleges of
optometry or other graduate programs.
This is aligned, too, with Weidman’s (1989) notion of academic and non-academic
experiences being key to persistence and is echoed by a finding from the Biology Scholars
Program at UC Berkeley; “We found repeated evidence in the interview transcripts, with African
American students as well as with students from other racial and ethnic groups, that the Biology
Scholars Program is viewed by these students as a crucially important bulwark of support as they
10
go through the demanding, and often discouraging, early premedical curriculum” (Barr &
Matsui, 2008, p. 9).
Additionally, the commitment to engaging faculty as mentors, either through structured
research projects or more informally through panel discussions, promotes career pathways. It has
been well documented that encouraging high-risk students, who again are often FGC students, in
undergraduate research projects not only helps develop problem-solving skills but can provide a
bonding experience through forging student-faculty relationships (Volkwein & Carbone, 1994).
In 2015, a highly proactive program was created at the University of California, Irvine. Called
the First Generation Faculty Initiative, it aimed to help the entering freshmen, 60% who were
identified as FGC students, make an easier transition to college life by connecting students to
supportive mentors. From the Dean of Students at UC Irvine: “We wanted to do something that
would really show how many faculty and students we have who were the first in their family to
go to college…students can see their experiences are normal. They are not on their own”
(Freeling, 2015, n.p.).
Particularly on the UC Berkeley campus, where prerequisite courses for health science
majors are crowded and, for an FGC student, potentially daunting (Lunceford, 2011), these
efforts towards retention at the undergraduate level and future promotion into a graduate school
are indeed impactful. Additionally, because FGC students have what is termed an “accumulated
disadvantage,” that is, a “lack of access to social and cultural capital that would have informed
them of the importance of academic prestige” (Holley & Gardner, 2012, p. 88), Opto-Camp, as a
preparatory program, means to level this disadvantage.
Finally, but of utmost significance are the opportunities to de-mystify the “Berkeley
brand” and the cost associated with attending a program in the health professions. Prior to
11
attending this preparatory program, attendees self-report feelings of insecurity and anxiety about
attending a program at UC Berkeley; Berkeley is far too prestigious for them to imagine
attending someday for a doctoral degree in optometry or being able to even afford an advanced
degree, regardless of whether at Berkeley or somewhere else. At the end of the program, they
feel welcomed by the School of Optometry community at UC Berkeley, report being less
intimidated about applying to our institution, and feel more confident about being able to finance
an advanced degree due to the comprehensive “Financing Your OD Degree” workshop they
attend, which helps them overcome the fear of incurring more debt, which is a typical barrier to
FGC students pursuing post-undergraduate education.
While Opto-Camp has been lauded, there are obviously some skewed results given that
the participants are motivated to attend a health professional program. As noted by Goss (2014):
The national focus on elite and other selective post-secondary institutions
obscures the enormity of the positive work other institutions provide and undermines the
valuable information they can share about successful strategies for first-generation
college students…stated differently, we need to develop solutions for the 90 percent of
the students who are not in the top 10 percent of the class (Goss, K. 2014, n.p.).
12
3.0 FGC STUDENTS IN OPTOMETRY PROGRAMS
As noted earlier, most FGC students are from an underrepresented population.
Consequently, it is urgent that more of these students be encouraged to pursue professional
degrees in the health sciences in order to improve care among disadvantaged populations. As
Strayhorn (2000) observed, “Underrepresented minority physicians are more likely to provide
medical care to minority, economically disadvantaged and sicker patients and to practice in
physician-shortage areas where access to medical care is limited” (p. 355).
In Optometry, the total number of full-time students enrolled during academic year 2012-
2013 was 6,555; the percentage of Black or African American full-time students was 3.1% and
Hispanic/Latinos was 4.6%. American Indian/Alaskan Natives were not highlighted data in the
2012 report (Association of Schools and Colleges of Optometry, Annual Student Data Report,
2013). Unfortunately, aggregate data on FGC students isn’t included in these annual reports.
Data from the inaugural Optometry Admissions Test (OAT) newsletter in 2016 disclosed
demographic information regarding OAT test-takers. The majority of test takers identified as
White (59%), followed by Asians (35%) (Damari, 2016).
Over the past two decades, Berkeley Optometry has gradually transformed into a
program that predominantly consists of students from a single ethnicity and gender group.
During the five years between 2008 and 2012, 334 students entered the OD program; 79% were
female, 67% were Asian, 16% were Caucasian, 6% were Hispanic, and 1% (4 students) were
13
African American. While the high percentage of female students is shared among optometry
schools, the skew toward Asian students is more pronounced for Berkeley. Nationwide, in 2011,
64% of enrolled OD students enrolled in an OD program were female, 56% of enrolled students
were Caucasian, and 28% were Asian (Association of Schools and Colleges of Optometry,
2011). Five years later, these numbers have remained constant; in the 2015-2016 ASCO
Students Data Report, 67% of the pool was female, 54% were Caucasian, and 28% Asian
(Association of Schools and Colleges of Optometry, 2016).
The lack of gender diversity has raised concerns for its impact on the optometry
profession. There is a prevalent notion that female optometrists tend to prefer working in a retail
setting that allows for schedule flexibility rather than opening their own practice. This could lead
to fewer private practices nationwide as retail chains grow to dominate the industry, leading to a
decline in perceived quality of service by customers (Arunkumar et al., 2012).
However, the lack of racial diversity, which is also a link to FGC status, is even more
concerning. Cultural differences can create communication barriers between patients and
doctors. The alarmingly few students from underrepresented communities could, in the long run,
affect the overall ocular health of these groups. As summarized by a Berkeley Optometry
African American alumna, “The quality of eye care eventually comes down to how effectively a
doctor communicates with a patient. If there is a communication gap, it doesn’t matter how good
the doctor’s technical expertise is, there will be problems either in executing the service or in
patients following the instructions, and the service will fall apart” (Arunkumar et al., 2012, p. 4).
As optometry is one of the fastest growing professions in the United States, Berkeley
Optometry’s admissions team and admissions committee are tasked with recruiting,
matriculating, and graduating arguably the most competitive pool of optometrists in the nation.
14
Most schools and colleges of optometry utilize GPAs, OAT scores, and on-site assessments, such
as interviews and essays, to predict admissibility and the ability to persist in optometric training
(Craig et al., 2008).
In 2006, and again in 2008, teams of Berkeley Optometry students, as part of an OD
thesis (Predictors of Performance in Optometry School: A Study at the University of California,
Berkeley and Predictors of Performance in Optometry School, A Study at the University of
California, Berkeley, Part Two), analyzed data from the classes of 2004 and 2005, and then from
the classes of 2004 to 2007, to look at predictors of performance in this rigorous optometric
training program. From the study in 2006:
Data analyzed included pre- and post-admissions criteria for the graduating
classes of 2004 and 2005, these being the most complete data set available for analysis at
the start of the study. Pre-admission criteria analyzed included GPA in prerequisite
courses, OAT Academic Average scores, interview scores, and on-site essay scores.
Post-admissions criteria analyzed were clinic GPA (grades received in clinic during the
third and fourth year) as well as cumulative GPA (grades received during all four years of
optometry school). Didactic GPA (grades in ‘non-clinical courses’) could not be
included because these data were unavailable for analysis (Kang et al., 2006, p. 4).
In this study, the student researchers obtained statistically significant data validating the
predictive power of pre-admissions criteria to optometry school with some slight positive
correlation. Highest correlation to post-admission GPA, specifically cumulative GPA for the
Class of 2005, was found when prerequisite GPA and the total science score on the OAT were
combined. Combined scores on both pre-admission interviews yielded a significant correlation
to a lesser degree to the clinic GPA for the Class of 2004. Positive correlation was also found
15

between prerequisite GPA, OAT score, interview score, and essay to clinic GPA for the Class of
2005 as well as essay score to cumulative GPA of the Class of 2004, but to a lesser degree.
(Kang et al., 2006, p. 6).
A subsequent project examining Berkeley Optometry’s admissions data was performed
shortly thereafter with new findings:
Although the results of Part One demonstrated that the admissions process was in
fact functioning correctly, Part Two of the study was initiated to determine if the results
would remain true with a larger data set. Because the size of each incoming class is
approximately sixty students, the previous study had a limited amount of data for
analysis. (Craig et al., 2008, p. 2)
The data set used in the 2008 study included 224 Berkeley Optometry graduates from the
classes of 2004-2007; the data set in 2006 included 109 graduates.
The results of the study conducted in 2008 added new insight into the admissions process
and the selection of students:
Part Two revealed that the subjective components of candidate’s profiles – the on-
site essay and interview – are the strongest predictors for clinical GPA. This finding
emphasizes the notion that it takes more than high test scores and GPA to succeed in
optometry school. Oral and written communication skills, along with ethical values, and
professionalism are some of the essential skills necessary in clinical settings that are not
readily apparent in an applicant. (Craig et al., 2008, p. 8)
The University of Houston College of Optometry (UHCO) conducted three
studies, published in Optometric Education, in 1985, 1990, and 1992, all concerned with
predicting academic success. In 1985, the researcher concluded:
16
Preoptometry GPA, which provides the most comprehensive measure of
intellectual achievement over time, was the best forecaster of GPA after two years at the
UHCO. The conclusion is a well-documented one: past (academic) performance is the
best predictor of future (academic) performance, as long as the predicted activity is
similar to the past activities. (Kegel-Flom, 1985, p. 905).
This study also found correlations between academic success and how well the UHCO
students performed on the standardized test for optometry school admissions (Optometry College
Admissions Test/ OCAT) as well as results from the California Psychological Inventory (CPI).
Kegel-Flom (1985) concluded:
The prediction of grades in optometry school, and indeed all professional schools,
will derive from these three factors: preprofessional grades, standardized achievement
test scores, and a quantitative measure of personal traits which relate to academic
achievement. Whereas the exact weighting of each variable in a predictive equation
depends upon the individual school, maximum predictive validity will be based upon
these three factors. (p. 901)
Demographic information was not included as part of this study.
Kegel-Flom subsequently looked at data from 1981-1986 at UHCO to predict the
academic performance of Asian, Black, and Hispanic optometry students. After looking at
academic records for 567 students, there were some concerning results: “Academic drop-out
rates for non-minority students was 4.6%; for Asian students, 15.2%; for Black students, 40%;
and for Hispanics, 28.6%” (1990, p. 201). She went on to say:
Asian students, although academically similar to nonminority entrants, differed
significantly in lower OCAT scores on verbal ability and in lower scores on the
17

personality inventory. These differences may help us understand why Asian students
were overrepresented among academic drop-outs despite their strong academic
qualifications, as a group, at entry…Black and Hispanic students scored significantly
lower than Asian and nonminority students on nearly all academic ability and
achievement measures at admission; thus, their overrepresentation in the dropout pool
was not unexpected. Hispanic student dropouts had particularly low scores on OCAT
physics, verbal ability, quantitative ability, and study/reading as well as low personality
inventory scores. And, as a group, they had earned their undergraduate grades at less
competitive institutions than did the average student. (pp. 211-212).
This study’s discussion section advocated for remediation and deceleration programs to
allow underrepresented students to persist in optometric degree programs.
Finally, in 1992, Kegel-Flom was interested in looking at leadership qualities and
success in UHCO’s program. Personality inventories of 269 students entering University of
Houston College of Optometry (UHCO) from 1988 through 1990 were analyzed for personality
type according to Gough’s two-vector system (V1 = extroversion/introversion; V2 = norm-
favoring/norm-doubting, which results in four types or life styles: Alpha, Beta, Gamma and
Delta. Although some sex and ethnic differences were found {not statistically significant}, most
(71%) optometry students were Alphas (extroverted/norm-favoring), accepted leaders who strive
to maintain and advance consensual values. Alphas achieved well in classroom and clinic and
were student leaders. A lesser number (10%), mostly women, were Gammas; extroverted but
norm-questioning, Gammas can provide creative and progressive leadership. Remaining types
were Betas (15%) and Deltas (4%), both introverted types who avoid leadership positions. (p.
991). This study found that at UHCO, students identified as Alphas received the highest
18

percentage of clinical accolades and awards and were more likely to be in student leadership
roles within the program.
In 2013, after the advent and adoption of a centralized application service for all schools
and colleges of optometry, “OptomCAS,” the Michigan College of Optometry (MCO) conducted
a study looking at 37 variables calculated by the OptomCAS application and found that, in this
order, these variables were the greatest predictors of grades over the four-year course of study at
MCO as well as graduation: “1) OAT academic average score, 2) OAT reading comprehension
score, 3) math GPA, 4) biology GPA, 5) undergraduate non-science GPA, 6) sophomore non-
science GPA, 7) sophomore total GPA, and 8) junior non-science GPA” (Buckingham & Bush,
2013, p. 98).
While previous research efforts have been useful for examining the quantitative and
qualitative factors that are predictors of success in optometric programs, the main findings all
point to the same factors, OAT scores and undergraduate GPAs, as being the strongest predictors
of success, academically and clinically. FGC status has never been a consideration in any of
these studies. Given the rise of FGC students into post-secondary education, their rise into the
health professions is inevitable and also poses newer (and potentially revised) conversations
around what constitutes success as an optometry student. Also, unique to Berkeley Optometry is
the highly Asian and highly female student population, which differs from previous studies that
had demographic data that included more white and male optometry students.
19

4.0 METHODOLOGY
While the research projects in 2006 (Kang et al., 2006) and 2008 (Craig et al., 2008) were
useful to the admissions committee at Berkeley Optometry and helped hone the overall review
process into one that now has 13 independent evaluators providing insight into an applicant’s
candidacy, arguably the most holistic and thorough review process among all schools and
colleges of optometry, there hasn’t been a study conducted at the school, or within any other
program, to assess how well FGC students fare as first-year students. Such a study can offer
insight into how well underrepresented students perform and how well students who attended
one of the handful of summer preparatory programs offered by some OD programs perform.
I received Institutional Review Board (IRB) approval in 2011 to conduct a comparative
study examining data between FGC and non-FGC students. I also received internal approval at
Berkeley Optometry from the former dean, Dr. Dennis Levi, who headed the departmental
research review committee. The purpose of this study was to compare differences between FGC
and non-FGC admissions profiles and their end-of-first-year performance at Berkeley Optometry
for those in classes of 2011 to 2014.
This study considered applicant data, which were collected when the subjects initially
applied to Berkeley Optometry. Specifically, their undergraduate prerequisite GPA and their
OAT academic average score, AA, which averages scores among these subject areas: Biology,
General Chemistry, Organic Chemistry, Reading Comprehension, Physics, and Quantitative
20
Reasoning and is part of the standardized testing required of all optometry school applicants.
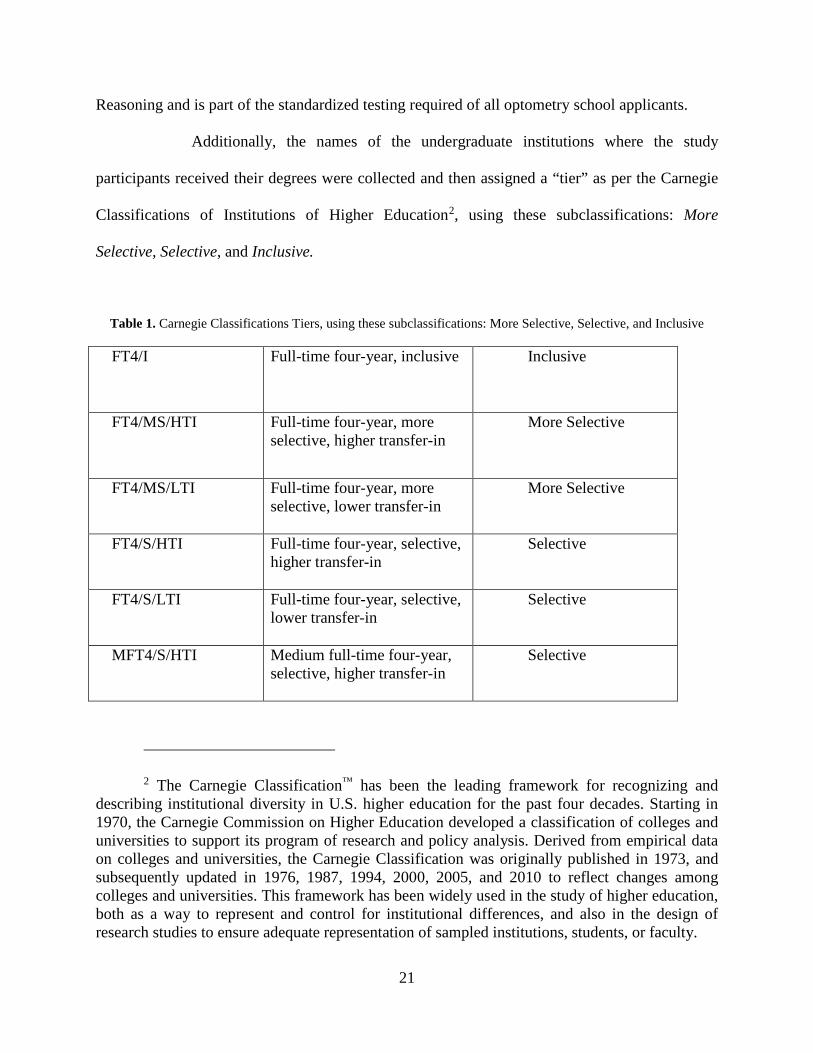
Additionally, the names of the undergraduate institutions where the study
participants received their degrees were collected and then assigned a “tier” as per the Carnegie
Classifications of Institutions of Higher Education2, using these subclassifications: More
Selective, Selective, and Inclusive.
Table 1. Carnegie Classifications Tiers, using these subclassifications: More Selective, Selective, and Inclusive
FT4/I
Full-time four-year, inclusive
Inclusive
FT4/MS/HTI
Full-time four-year, more selective, higher transfer-in
More Selective
FT4/MS/LTI
Full-time four-year, more selective, lower transfer-in
More Selective
FT4/S/HTI
Full-time four-year, selective, higher transfer-in
Selective
FT4/S/LTI
Full-time four-year, selective, lower transfer-in
Selective
MFT4/S/HTI
Medium full-time four-year, selective, higher transfer-in
Selective
2 The Carnegie Classification™ has been the leading framework for recognizing and describing institutional diversity in U.S. higher education for the past four decades. Starting in 1970, the Carnegie Commission on Higher Education developed a classification of colleges and universities to support its program of research and policy analysis. Derived from empirical data on colleges and universities, the Carnegie Classification was originally published in 1973, and subsequently updated in 1976, 1987, 1994, 2000, 2005, and 2010 to reflect changes among colleges and universities. This framework has been widely used in the study of higher education, both as a way to represent and control for institutional differences, and also in the design of research studies to ensure adequate representation of sampled institutions, students, or faculty.
21
Finally, as the literature indicates, FGC students are also more than likely to be from an
underrepresented population; therefore, participants’ self-reported racial identity, from their
admissions application, is included.
In 2011, all current students at Berkeley Optometry, the classes of 2011, 2012, 2013, and
2014 (n=255) at that time, were asked to participate in this research study, which was supported
by my department of employment, the Admissions and Student Affairs Office (ASAO).
Participants were contacted during class and in person. Preempting the students’ classes with
prior permission from the instructor(s), I provided an explanation of the study to them (see
Appendix B). The consent forms and surveys were then administered (see Appendix C and D).
The Class of 2011 was contacted during their Old Home Week, an event leading up to
graduation, and also via email through the class listserv. Those who agreed to participate were
instructed to reply individually to my email and attach their signed consent and survey. The
survey asked all participants to disclose their parents’ educational levels, if known, and also
inquired if they had attended any preparatory programs designed to enhance their candidacy for
admission to graduate school.
In 2008, when OptomCAS was launched, I was one of five on the steering committee to
create the centralized application. This centralized, common application specifically asks if
prospective optometry students are FGC students and, as schools and colleges of optometry are
permitted to ask up to 10 supplemental questions, Berkeley Optometry asks applicants to share
information regarding their preparation to attend the OD program at UC Berkeley. Thus, I
already had access to relevant data (students’ names, entering undergraduate GPA, parental
higher educational attainment and if they attended any preparatory programs for graduate school
studies) in individual student records as this information was collected through the OptomCAS
22
application and downloaded into our secured database.
Following IRB procedures, I requested consent from students in the classes of 2013 and
2014 to use information from their OptomCAS applications as well information from their UC
Berkeley student records, specifically their first year Optometry GPAs. I also asked them to
complete a consent form and corresponding survey.
For the Classes of 2011 and 2012, I collected students’ names, parental higher
educational attainment, and attendance at any preparatory programs for graduate school studies,
as well as their consent to use information from their UC Berkeley student records and their first-
year Optometry GPA. I also asked them to complete a consent form and the same survey that the
Classes of 2013 and 2014 were asked to complete to ensure consistency across all four
optometry classes. There wasn’t a waiting period between informing the prospective participants
about the study and obtaining consent, as this was a minimal impact study.
The data generated from the collected surveys from those who consented (names, FGC
status, attendance at preparatory programs for graduate school studies, entering undergraduate
prerequisite GPA, OAT AA score, undergraduate institution and tier, race and gender, and first-
year Optometry GPA) were migrated into a secured Excel spreadsheet. Additionally, names
were replaced and coded by a random number generator to ensure greater confidentiality.
I administered the in-person surveys during their normal class time with respective
instructors’ permission. Non-participating subjects were advised that they could work quietly on
something else during the time allotted (5 minutes) to complete the survey. All subjects were
asked to bring the survey to the front of the room after five minutes. For the Class of 2011, in
addition to meeting in person, I sent an email via the class listserv requesting their participation
and noted they would have a week's time to reply. School records indicated 255 who were
23
eligible to participate; I successfully gathered survey from 233 students (91.4% response rate).
The respondents were distributed as follows: for 2011: n= 53 (8 FGC), 1 declined to
answer, so this participant’s data were removed; 2012: n=59 (18 FGC); 2013: n= 55 (16 FGC), 1
declined to answer, so this participant’s data were removed; 2014: n= 66 (19 FGC,) 3 declined to
answer so the participants’ data were removed. Additionally, five students had obtained their
undergraduate degrees from outside of the United States and were removed from the study: Class
of 2011, two students from Canada; Class of 2012, one student from China; Class of 2014, two
students from Canada.
4.1.1 Study Respondents
As Table 2 indicates, there were 224 participants in this study, with 31% self-reporting as
FGC students. In this demographic snapshot, 80% of the participants were female and the
largest self-reported ethnicity was Chinese/Chinese American, 38%, followed by
White/Caucasian at 17.9%; the smallest self-reported ethnic populations were American
Indian/Native, Latino/Latino America, Polynesian/Pacific Islander and Puerto Rican, all were a
n=1. Overall, underrepresented populations, which for this study were African American,
American Indian/Native, Latino/Latino America, Mexican American, and Puerto Rican
represented only 5.8% of the total population.
Responses from all four classes were fairly evenly distributed, with 22.3% respondents
from the Class of 2011, 25.9% from the Class of 2012, 24.1% from the Class of 2013 and 27.7%
from the Class of 2014. With regards to the participants’ Carnegie Classification of their
respective undergraduate institutions, a majority, 92%, of the students in this study attended a
“More Selective” college or university to earn their Bachelor’s Degree, with almost equal
24
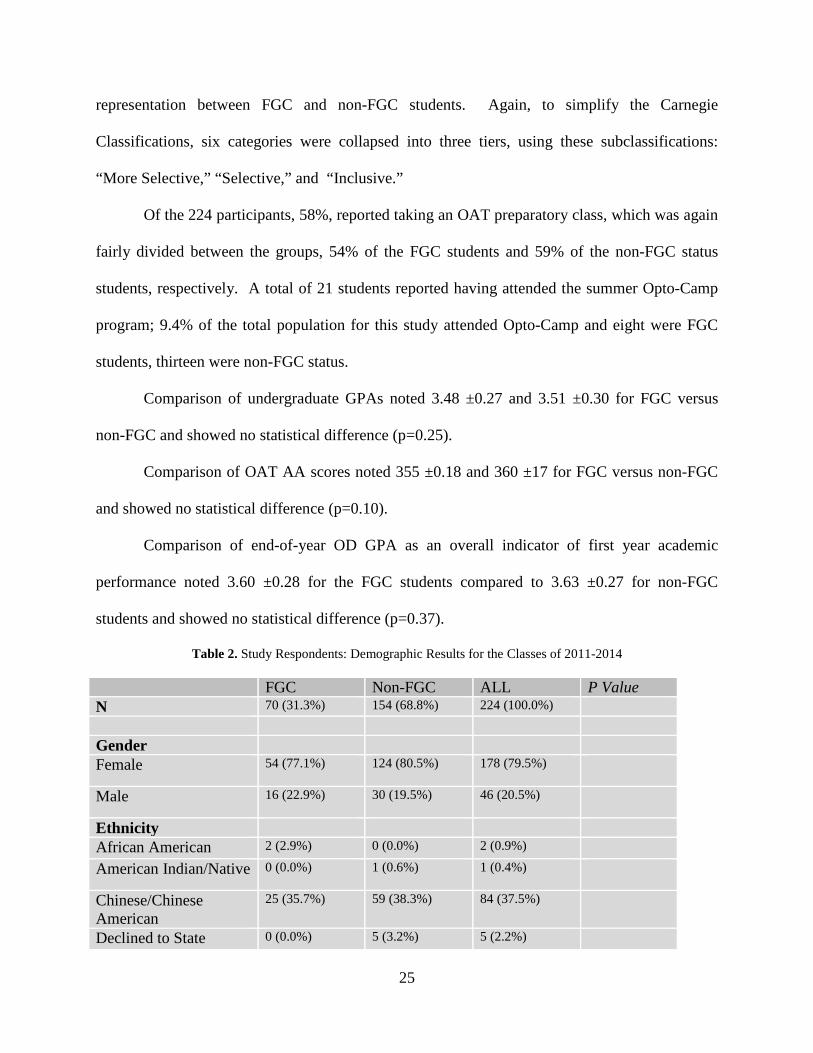
representation between FGC and non-FGC students. Again, to simplify the Carnegie
Classifications, six categories were collapsed into three tiers, using these subclassifications:
“More Selective,” “Selective,” and “Inclusive.”
Of the 224 participants, 58%, reported taking an OAT preparatory class, which was again
fairly divided between the groups, 54% of the FGC students and 59% of the non-FGC status
students, respectively. A total of 21 students reported having attended the summer Opto-Camp
program; 9.4% of the total population for this study attended Opto-Camp and eight were FGC
students, thirteen were non-FGC status.
Comparison of undergraduate GPAs noted 3.48 ±0.27 and 3.51 ±0.30 for FGC versus
non-FGC and showed no statistical difference (p=0.25).
Comparison of OAT AA scores noted 355 ±0.18 and 360 ±17 for FGC versus non-FGC
and showed no statistical difference (p=0.10).
Comparison of end-of-year OD GPA as an overall indicator of first year academic
performance noted 3.60 ±0.28 for the FGC students compared to 3.63 ±0.27 for non-FGC
students and showed no statistical difference (p=0.37).
Table 2. Study Respondents: Demographic Results for the Classes of 2011-2014
FGC Non-FGC ALL P Value N 70 (31.3%) 154 (68.8%) 224 (100.0%)
Gender
Female 54 (77.1%) 124 (80.5%) 178 (79.5%)
Male 16 (22.9%)
30 (19.5%) 46 (20.5%)
Ethnicity
African American 2 (2.9%) 0 (0.0%) 2 (0.9%)
American Indian/Native 0 (0.0%) 1 (0.6%) 1 (0.4%)
Chinese/Chinese American
25 (35.7%) 59 (38.3%) 84 (37.5%)
Declined to State 0 (0.0%) 5 (3.2%) 5 (2.2%)
25
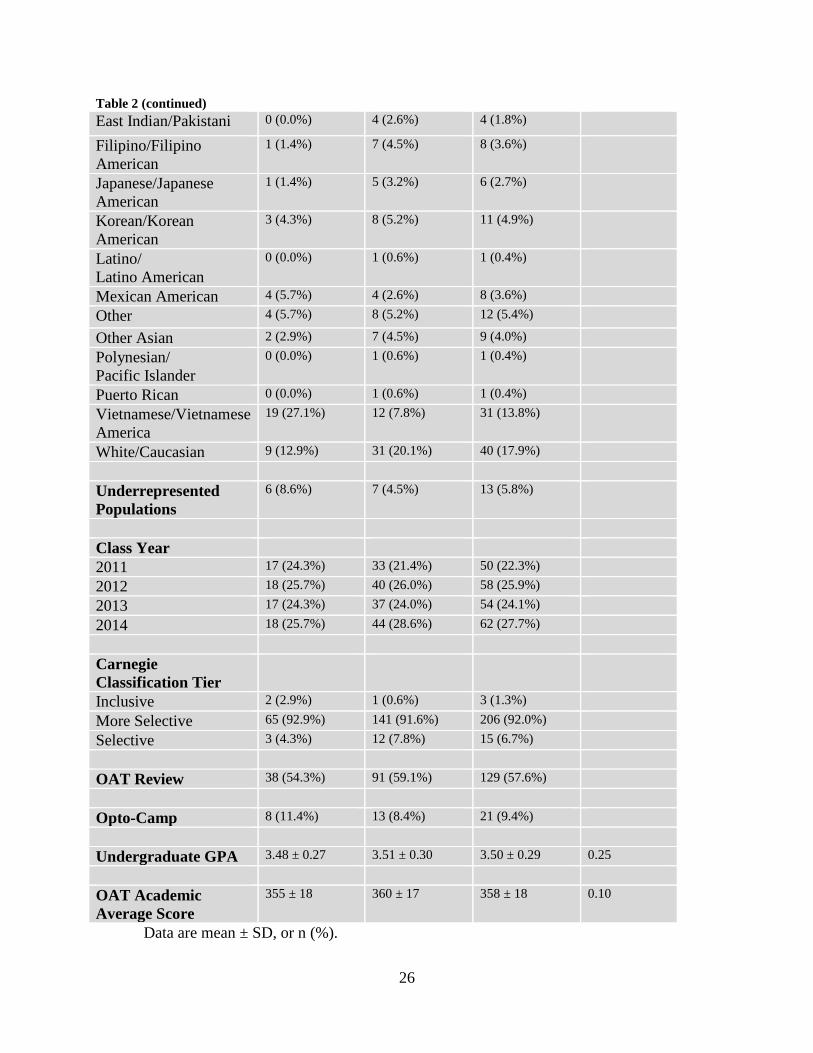
Table 2 (continued) East Indian/Pakistani 0 (0.0%) 4 (2.6%) 4 (1.8%)
Filipino/Filipino American
1 (1.4%) 7 (4.5%) 8 (3.6%)
Japanese/Japanese American
1 (1.4%) 5 (3.2%) 6 (2.7%)
Korean/Korean American
3 (4.3%) 8 (5.2%) 11 (4.9%)
Latino/ Latino American
0 (0.0%) 1 (0.6%) 1 (0.4%)
Mexican American 4 (5.7%) 4 (2.6%) 8 (3.6%) Other 4 (5.7%) 8 (5.2%) 12 (5.4%)
Other Asian 2 (2.9%) 7 (4.5%) 9 (4.0%) Polynesian/ Pacific Islander
0 (0.0%) 1 (0.6%) 1 (0.4%)
Puerto Rican 0 (0.0%) 1 (0.6%) 1 (0.4%) Vietnamese/Vietnamese America
19 (27.1%) 12 (7.8%) 31 (13.8%)
White/Caucasian 9 (12.9%) 31 (20.1%) 40 (17.9%)
Underrepresented Populations
6 (8.6%) 7 (4.5%) 13 (5.8%)
Class Year 2011 17 (24.3%) 33 (21.4%) 50 (22.3%) 2012 18 (25.7%) 40 (26.0%) 58 (25.9%) 2013 17 (24.3%) 37 (24.0%) 54 (24.1%)
2014 18 (25.7%) 44 (28.6%) 62 (27.7%)
Carnegie Classification Tier
Inclusive 2 (2.9%) 1 (0.6%) 3 (1.3%)
More Selective 65 (92.9%) 141 (91.6%) 206 (92.0%) Selective 3 (4.3%) 12 (7.8%) 15 (6.7%)
OAT Review 38 (54.3%) 91 (59.1%) 129 (57.6%)
Opto-Camp 8 (11.4%) 13 (8.4%) 21 (9.4%)
Undergraduate GPA 3.48 ± 0.27 3.51 ± 0.30 3.50 ± 0.29 0.25
OAT Academic Average Score
355 ± 18 360 ± 17 358 ± 18 0.10
Data are mean ± SD, or n (%).
26
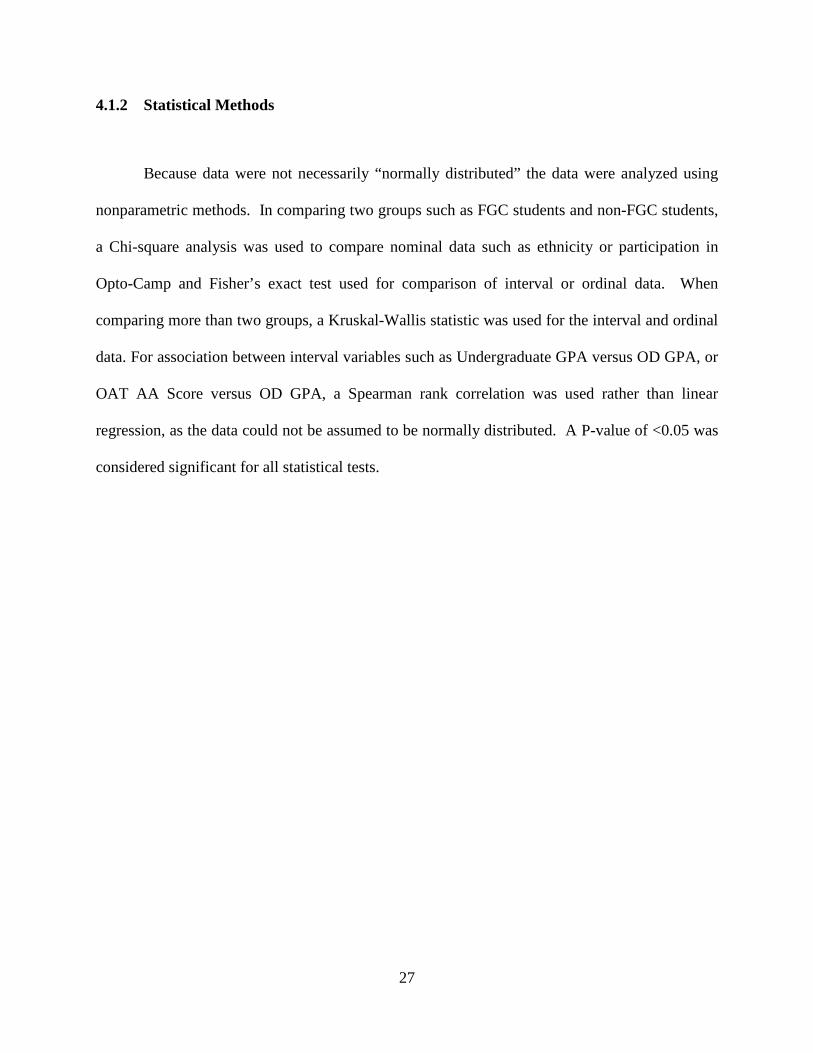
4.1.2 Statistical Methods
Because data were not necessarily “normally distributed” the data were analyzed using
nonparametric methods. In comparing two groups such as FGC students and non-FGC students,
a Chi-square analysis was used to compare nominal data such as ethnicity or participation in
Opto-Camp and Fisher’s exact test used for comparison of interval or ordinal data. When
comparing more than two groups, a Kruskal-Wallis statistic was used for the interval and ordinal
data. For association between interval variables such as Undergraduate GPA versus OD GPA, or
OAT AA Score versus OD GPA, a Spearman rank correlation was used rather than linear
regression, as the data could not be assumed to be normally distributed. A P-value of <0.05 was
considered significant for all statistical tests.
27
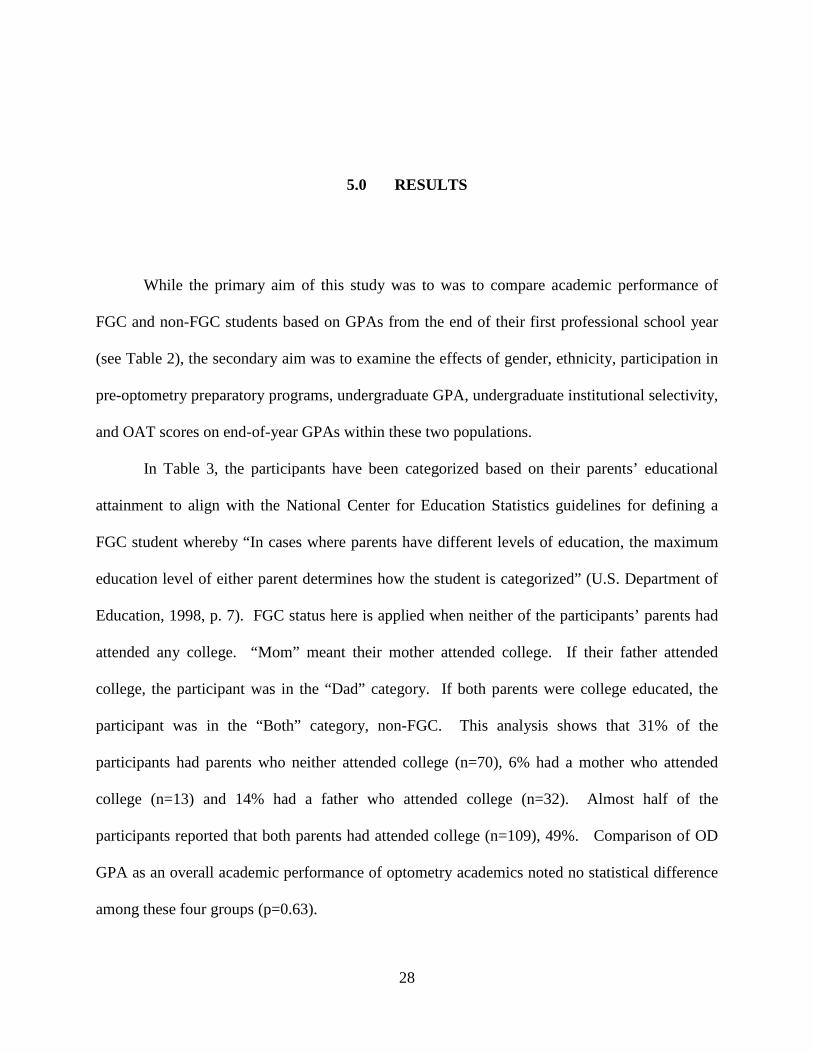
5.0 RESULTS
While the primary aim of this study was to was to compare academic performance of
FGC and non-FGC students based on GPAs from the end of their first professional school year
(see Table 2), the secondary aim was to examine the effects of gender, ethnicity, participation in
pre-optometry preparatory programs, undergraduate GPA, undergraduate institutional selectivity,
and OAT scores on end-of-year GPAs within these two populations.
In Table 3, the participants have been categorized based on their parents’ educational
attainment to align with the National Center for Education Statistics guidelines for defining a
FGC student whereby “In cases where parents have different levels of education, the maximum
education level of either parent determines how the student is categorized” (U.S. Department of
Education, 1998, p. 7). FGC status here is applied when neither of the participants’ parents had
attended any college. “Mom” meant their mother attended college. If their father attended
college, the participant was in the “Dad” category. If both parents were college educated, the
participant was in the “Both” category, non-FGC. This analysis shows that 31% of the
participants had parents who neither attended college (n=70), 6% had a mother who attended
college (n=13) and 14% had a father who attended college (n=32). Almost half of the
participants reported that both parents had attended college (n=109), 49%. Comparison of OD
GPA as an overall academic performance of optometry academics noted no statistical difference
among these four groups (p=0.63).
28
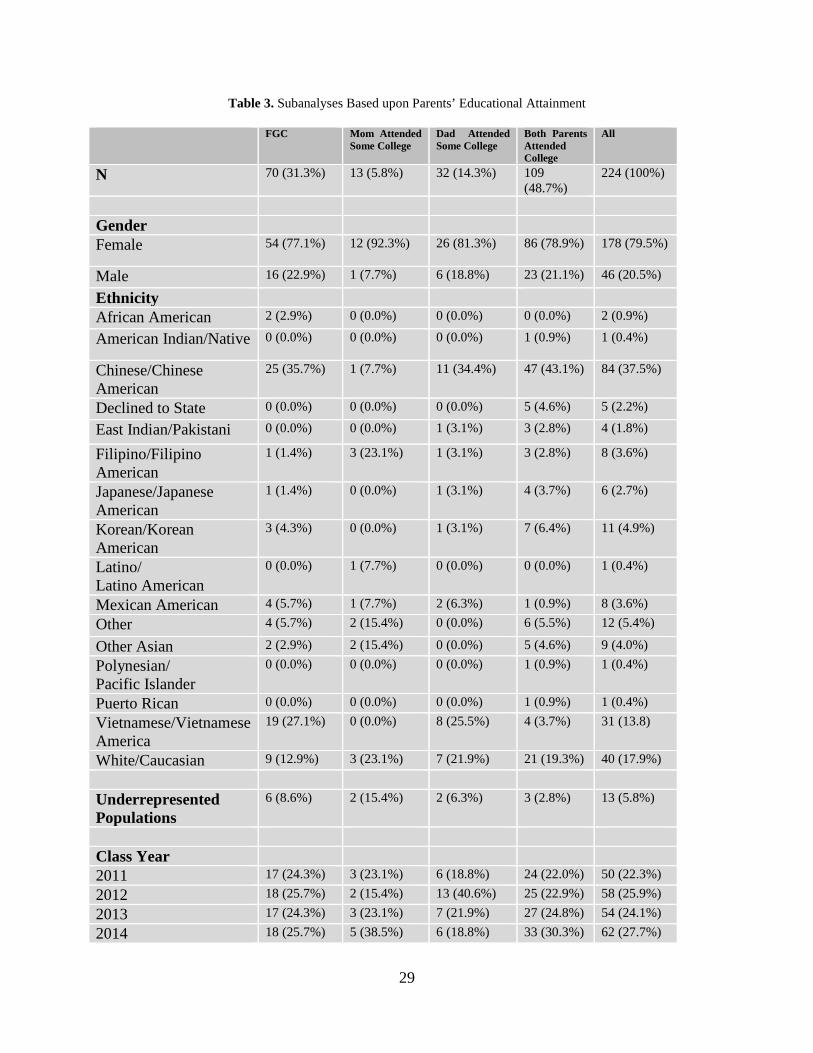
Table 3. Subanalyses Based upon Parents’ Educational Attainment
FGC Mom Attended Some College
Dad Attended Some College
Both Parents Attended College
All
N 70 (31.3%) 13 (5.8%) 32 (14.3%) 109 (48.7%)
224 (100%)
Gender
Female 54 (77.1%) 12 (92.3%) 26 (81.3%)
86 (78.9%) 178 (79.5%)
Male 16 (22.9%) 1 (7.7%) 6 (18.8%) 23 (21.1%) 46 (20.5%)
Ethnicity
African American 2 (2.9%) 0 (0.0%) 0 (0.0%) 0 (0.0%) 2 (0.9%)
American Indian/Native 0 (0.0%) 0 (0.0%) 0 (0.0%) 1 (0.9%)
1 (0.4%)
Chinese/Chinese American
25 (35.7%) 1 (7.7%) 11 (34.4%)
47 (43.1%) 84 (37.5%)
Declined to State 0 (0.0%) 0 (0.0%) 0 (0.0%) 5 (4.6%) 5 (2.2%)
East Indian/Pakistani 0 (0.0%) 0 (0.0%) 1 (3.1%) 3 (2.8%) 4 (1.8%)
Filipino/Filipino American
1 (1.4%) 3 (23.1%) 1 (3.1%) 3 (2.8%) 8 (3.6%)
Japanese/Japanese American
1 (1.4%) 0 (0.0%) 1 (3.1%) 4 (3.7%) 6 (2.7%)
Korean/Korean American
3 (4.3%) 0 (0.0%) 1 (3.1%)
7 (6.4%) 11 (4.9%)
Latino/ Latino American
0 (0.0%) 1 (7.7%) 0 (0.0%) 0 (0.0%) 1 (0.4%)
Mexican American 4 (5.7%) 1 (7.7%) 2 (6.3%) 1 (0.9%) 8 (3.6%) Other 4 (5.7%) 2 (15.4%) 0 (0.0%) 6 (5.5%) 12 (5.4%)
Other Asian 2 (2.9%) 2 (15.4%) 0 (0.0%) 5 (4.6%) 9 (4.0%) Polynesian/ Pacific Islander
0 (0.0%) 0 (0.0%) 0 (0.0%) 1 (0.9%) 1 (0.4%)
Puerto Rican 0 (0.0%) 0 (0.0%) 0 (0.0%) 1 (0.9%) 1 (0.4%) Vietnamese/Vietnamese America
19 (27.1%) 0 (0.0%) 8 (25.5%) 4 (3.7%) 31 (13.8)
White/Caucasian 9 (12.9%) 3 (23.1%) 7 (21.9%) 21 (19.3%) 40 (17.9%)
Underrepresented Populations
6 (8.6%) 2 (15.4%) 2 (6.3%) 3 (2.8%) 13 (5.8%)
Class Year
2011 17 (24.3%) 3 (23.1%) 6 (18.8%) 24 (22.0%) 50 (22.3%) 2012 18 (25.7%) 2 (15.4%) 13 (40.6%) 25 (22.9%) 58 (25.9%) 2013 17 (24.3%) 3 (23.1%) 7 (21.9%) 27 (24.8%) 54 (24.1%) 2014 18 (25.7%) 5 (38.5%) 6 (18.8%) 33 (30.3%) 62 (27.7%)
29
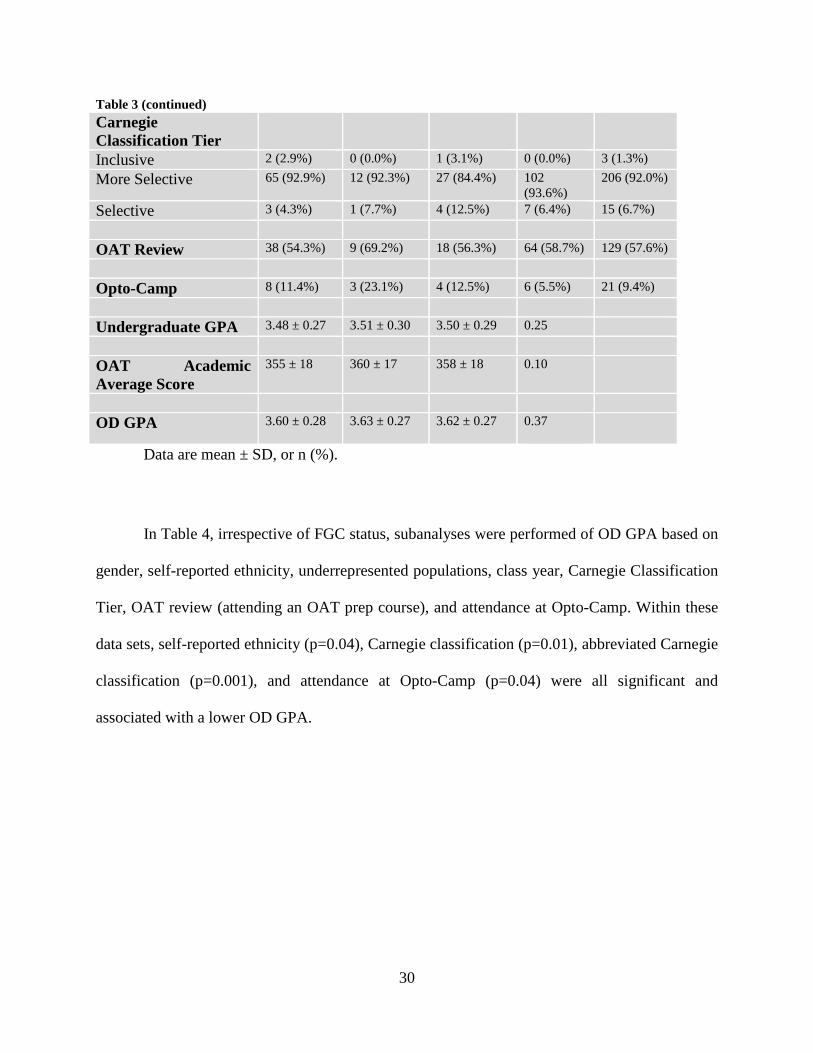
Table 3 (continued) Carnegie Classification Tier
Inclusive 2 (2.9%) 0 (0.0%) 1 (3.1%) 0 (0.0%) 3 (1.3%) More Selective 65 (92.9%) 12 (92.3%) 27 (84.4%) 102
(93.6%) 206 (92.0%)
Selective 3 (4.3%) 1 (7.7%) 4 (12.5%) 7 (6.4%) 15 (6.7%)
OAT Review 38 (54.3%) 9 (69.2%) 18 (56.3%) 64 (58.7%) 129 (57.6%)
Opto-Camp 8 (11.4%) 3 (23.1%) 4 (12.5%) 6 (5.5%) 21 (9.4%)
Undergraduate GPA 3.48 ± 0.27 3.51 ± 0.30 3.50 ± 0.29 0.25
OAT Academic Average Score
355 ± 18 360 ± 17 358 ± 18 0.10
OD GPA 3.60 ± 0.28 3.63 ± 0.27 3.62 ± 0.27 0.37
Data are mean ± SD, or n (%).
In Table 4, irrespective of FGC status, subanalyses were performed of OD GPA based on
gender, self-reported ethnicity, underrepresented populations, class year, Carnegie Classification
Tier, OAT review (attending an OAT prep course), and attendance at Opto-Camp. Within these
data sets, self-reported ethnicity (p=0.04), Carnegie classification (p=0.01), abbreviated Carnegie
classification (p=0.001), and attendance at Opto-Camp (p=0.04) were all significant and
associated with a lower OD GPA.
30
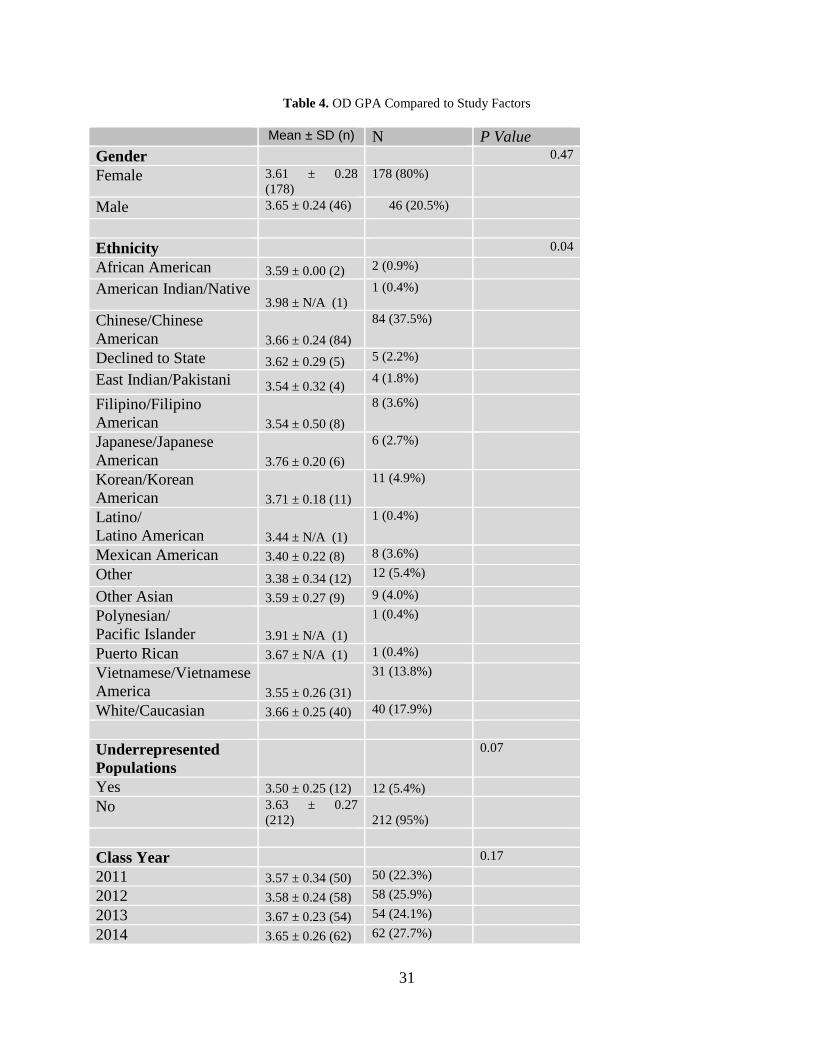
Table 4. OD GPA Compared to Study Factors
Mean ± SD (n) N P Value Gender 0.47 Female 3.61 ± 0.28
(178) 178 (80%)
Male 3.65 ± 0.24 (46) 46 (20.5%)
Ethnicity 0.04 African American 3.59 ± 0.00 (2) 2 (0.9%)
American Indian/Native 3.98 ± N/A (1)
1 (0.4%)
Chinese/Chinese American 3.66 ± 0.24 (84)
84 (37.5%)
Declined to State 3.62 ± 0.29 (5) 5 (2.2%)
East Indian/Pakistani 3.54 ± 0.32 (4) 4 (1.8%)
Filipino/Filipino American 3.54 ± 0.50 (8)
8 (3.6%)
Japanese/Japanese American 3.76 ± 0.20 (6)
6 (2.7%)
Korean/Korean American 3.71 ± 0.18 (11)
11 (4.9%)
Latino/ Latino American 3.44 ± N/A (1)
1 (0.4%)
Mexican American 3.40 ± 0.22 (8) 8 (3.6%) Other 3.38 ± 0.34 (12) 12 (5.4%)
Other Asian 3.59 ± 0.27 (9) 9 (4.0%) Polynesian/ Pacific Islander 3.91 ± N/A (1)
1 (0.4%)
Puerto Rican 3.67 ± N/A (1) 1 (0.4%) Vietnamese/Vietnamese America 3.55 ± 0.26 (31)
31 (13.8%)
White/Caucasian 3.66 ± 0.25 (40) 40 (17.9%)
Underrepresented Populations
0.07
Yes 3.50 ± 0.25 (12) 12 (5.4%)
No 3.63 ± 0.27 (212) 212 (95%)
Class Year 0.17 2011 3.57 ± 0.34 (50) 50 (22.3%) 2012 3.58 ± 0.24 (58) 58 (25.9%) 2013 3.67 ± 0.23 (54) 54 (24.1%)
2014 3.65 ± 0.26 (62) 62 (27.7%)
31
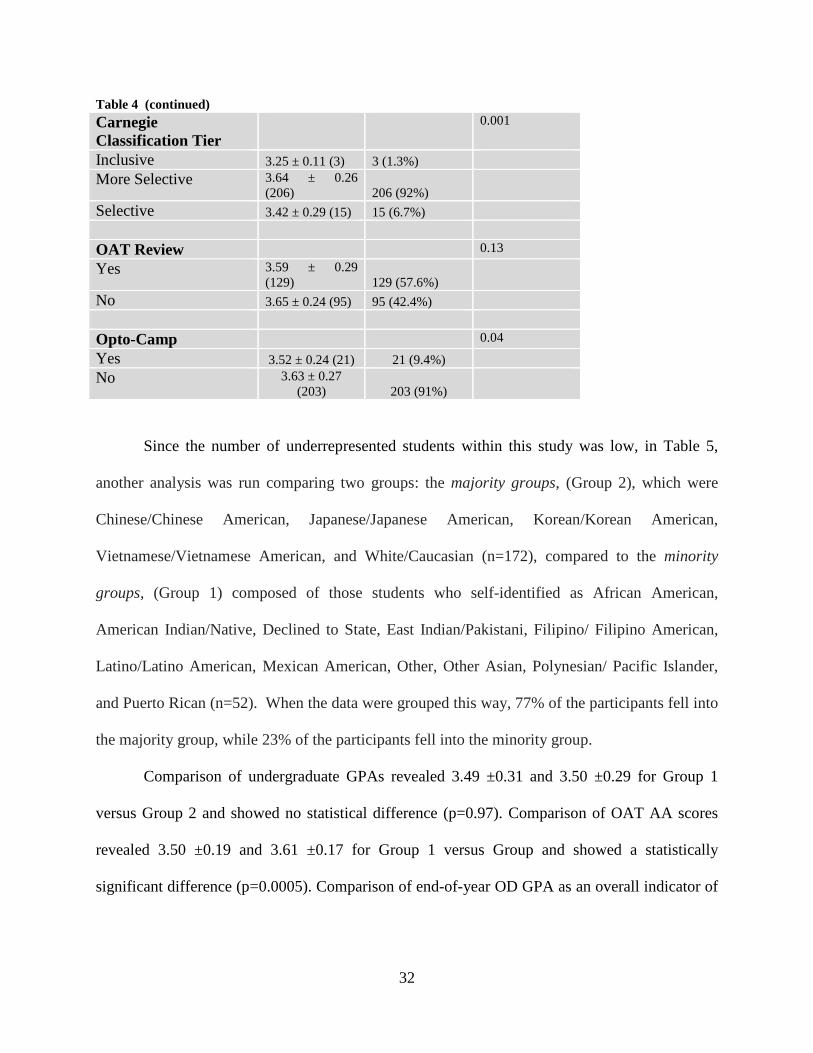
Table 4 (continued) Carnegie Classification Tier
0.001
Inclusive 3.25 ± 0.11 (3) 3 (1.3%) More Selective 3.64 ± 0.26
(206) 206 (92%)
Selective 3.42 ± 0.29 (15) 15 (6.7%)
OAT Review 0.13 Yes 3.59 ± 0.29
(129) 129 (57.6%)
No 3.65 ± 0.24 (95) 95 (42.4%)
Opto-Camp 0.04 Yes 3.52 ± 0.24 (21) 21 (9.4%) No 3.63 ± 0.27
(203) 203 (91%)
Since the number of underrepresented students within this study was low, in Table 5,
another analysis was run comparing two groups: the majority groups, (Group 2), which were
Chinese/Chinese American, Japanese/Japanese American, Korean/Korean American,
Vietnamese/Vietnamese American, and White/Caucasian (n=172), compared to the minority
groups, (Group 1) composed of those students who self-identified as African American,
American Indian/Native, Declined to State, East Indian/Pakistani, Filipino/ Filipino American,
Latino/Latino American, Mexican American, Other, Other Asian, Polynesian/ Pacific Islander,
and Puerto Rican (n=52). When the data were grouped this way, 77% of the participants fell into
the majority group, while 23% of the participants fell into the minority group.
Comparison of undergraduate GPAs revealed 3.49 ±0.31 and 3.50 ±0.29 for Group 1
versus Group 2 and showed no statistical difference (p=0.97). Comparison of OAT AA scores
revealed 3.50 ±0.19 and 3.61 ±0.17 for Group 1 versus Group and showed a statistically
significant difference (p=0.0005). Comparison of end-of-year OD GPA as an overall indicator of
32
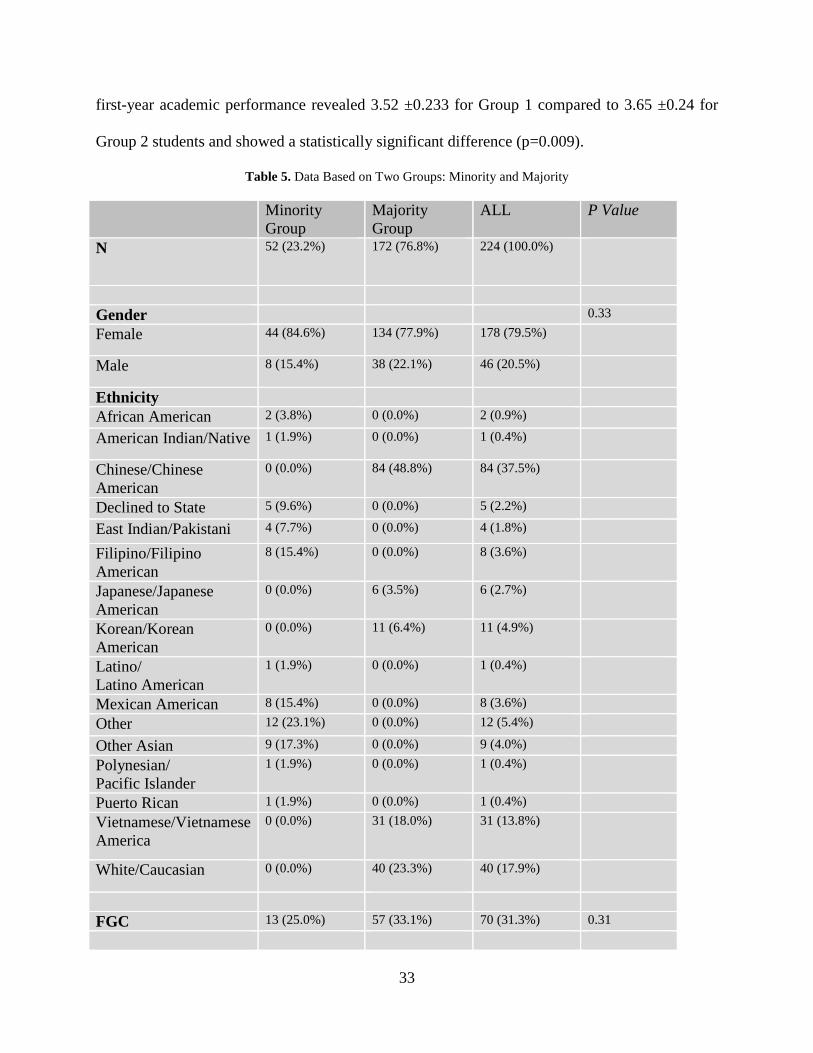
first-year academic performance revealed 3.52 ±0.233 for Group 1 compared to 3.65 ±0.24 for
Group 2 students and showed a statistically significant difference (p=0.009).
Table 5. Data Based on Two Groups: Minority and Majority
Minority Group
Majority Group
ALL P Value
N 52 (23.2%) 172 (76.8%)
224 (100.0%)
Gender 0.33
Female 44 (84.6%) 134 (77.9%) 178 (79.5%)
Male 8 (15.4%)
38 (22.1%) 46 (20.5%)
Ethnicity
African American 2 (3.8%) 0 (0.0%) 2 (0.9%)
American Indian/Native 1 (1.9%) 0 (0.0%) 1 (0.4%)
Chinese/Chinese American
0 (0.0%) 84 (48.8%)
84 (37.5%)
Declined to State 5 (9.6%) 0 (0.0%) 5 (2.2%)
East Indian/Pakistani 4 (7.7%) 0 (0.0%) 4 (1.8%)
Filipino/Filipino American
8 (15.4%) 0 (0.0%) 8 (3.6%)
Japanese/Japanese American
0 (0.0%) 6 (3.5%) 6 (2.7%)
Korean/Korean American
0 (0.0%) 11 (6.4%) 11 (4.9%)
Latino/ Latino American
1 (1.9%) 0 (0.0%) 1 (0.4%)
Mexican American 8 (15.4%) 0 (0.0%) 8 (3.6%)
Other 12 (23.1%) 0 (0.0%) 12 (5.4%)
Other Asian 9 (17.3%) 0 (0.0%) 9 (4.0%)
Polynesian/ Pacific Islander
1 (1.9%) 0 (0.0%) 1 (0.4%)
Puerto Rican 1 (1.9%) 0 (0.0%) 1 (0.4%) Vietnamese/Vietnamese America
0 (0.0%) 31 (18.0%)
31 (13.8%)
White/Caucasian 0 (0.0%) 40 (23.3%) 40 (17.9%)
FGC 13 (25.0%) 57 (33.1%) 70 (31.3%) 0.31
33
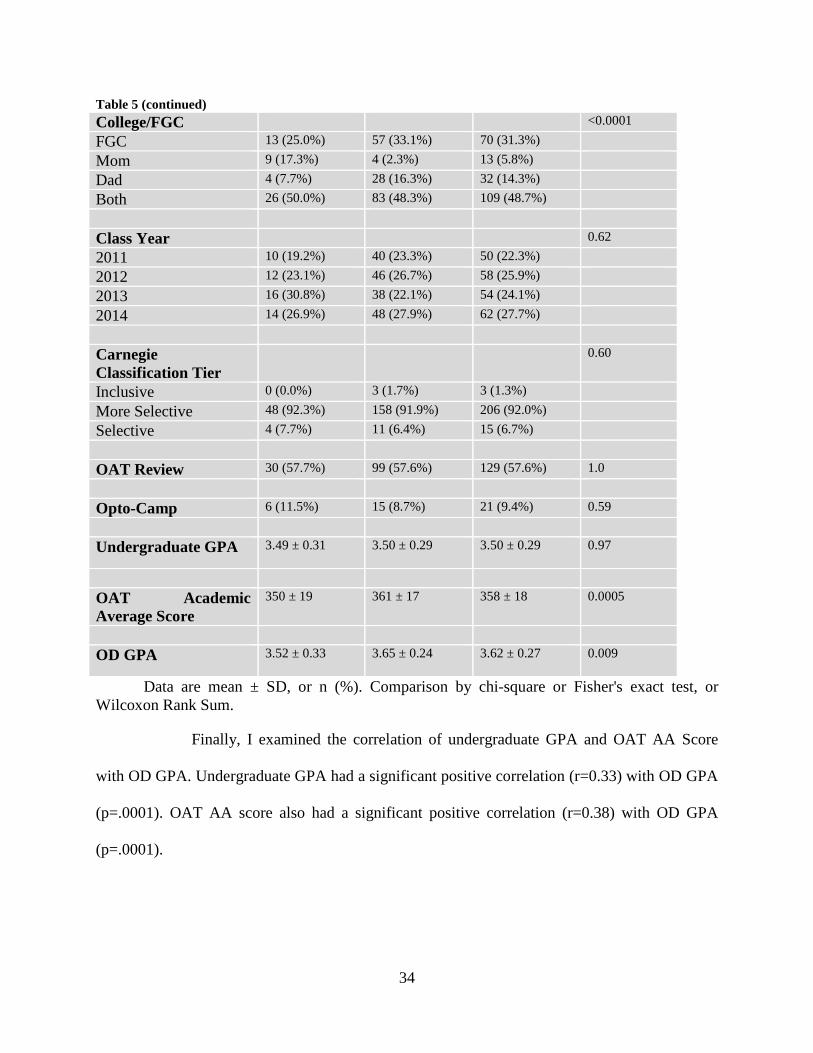
Table 5 (continued) College/FGC <0.0001
FGC 13 (25.0%) 57 (33.1%) 70 (31.3%) Mom 9 (17.3%) 4 (2.3%) 13 (5.8%) Dad 4 (7.7%) 28 (16.3%) 32 (14.3%) Both 26 (50.0%) 83 (48.3%) 109 (48.7%)
Class Year 0.62 2011 10 (19.2%) 40 (23.3%) 50 (22.3%) 2012 12 (23.1%) 46 (26.7%) 58 (25.9%) 2013 16 (30.8%) 38 (22.1%) 54 (24.1%)
2014 14 (26.9%) 48 (27.9%) 62 (27.7%)
Carnegie Classification Tier
0.60
Inclusive 0 (0.0%) 3 (1.7%) 3 (1.3%)
More Selective 48 (92.3%) 158 (91.9%) 206 (92.0%) Selective 4 (7.7%) 11 (6.4%) 15 (6.7%)
OAT Review 30 (57.7%) 99 (57.6%) 129 (57.6%) 1.0
Opto-Camp 6 (11.5%) 15 (8.7%) 21 (9.4%) 0.59
Undergraduate GPA 3.49 ± 0.31 3.50 ± 0.29
3.50 ± 0.29 0.97
OAT Academic Average Score
350 ± 19
361 ± 17
358 ± 18 0.0005
OD GPA 3.52 ± 0.33
3.65 ± 0.24
3.62 ± 0.27 0.009
Data are mean ± SD, or n (%). Comparison by chi-square or Fisher's exact test, or Wilcoxon Rank Sum.
Finally, I examined the correlation of undergraduate GPA and OAT AA Score
with OD GPA. Undergraduate GPA had a significant positive correlation (r=0.33) with OD GPA
(p=.0001). OAT AA score also had a significant positive correlation (r=0.38) with OD GPA
(p=.0001).
34

Table 6. OD GPA Correlations
Mean ± SD, or r N P Value
Undergraduate GPA 0.33
224 (100.0%)
< 0.0001
OAT Academic Average Score
0.38
224 (100.0%)
< 0.0001
Analysis by Wilcoxn Rank Sum, Kruskall-Wallis, or Spearman rank correlation.
35

6.0 DISCUSSION
Based upon a sampling of Optometry students from the Classes of 2011 through 2014,
there was no significant difference in academic performance based on FGC status, as indicated
by the end-of-year GPA for first-year students. Additionally, there was no significant difference
in academic performance, as indicated by underrepresented population status (p=.07). However,
there may have been a difference in this latter finding with a larger sample size, which is a
possibility that underscores the larger issue of preparing and recruiting underrepresented students
to the profession of optometry.
Admission to Berkeley Optometry is highly competitive. Thus, as in the 2006 (Kang et
al., 2006) and 2008 (Craig, et al., 2008) OD thesis studies, the prerequisite GPAs and OAT
scores of the incoming students were very similar and quite strong, particularly when compared
to the overall applicant pools in those particular admissions cycles. For example, in the Fall of
2010, there were 274 applicants and the average GPA of those prospective students applying to
Berkeley Optometry was a 3.34, whereas for admitted students, the average GPA was a 3.45.
Nationally, of the 14 schools and colleges of optometry reporting OAT AA scores, the average
was a 3.09 (Association of Schools and Colleges of Optometry, 2010-2011).
Table 6 shows Berkeley Optometry’s applicants for the classes of 2011-2014.
36
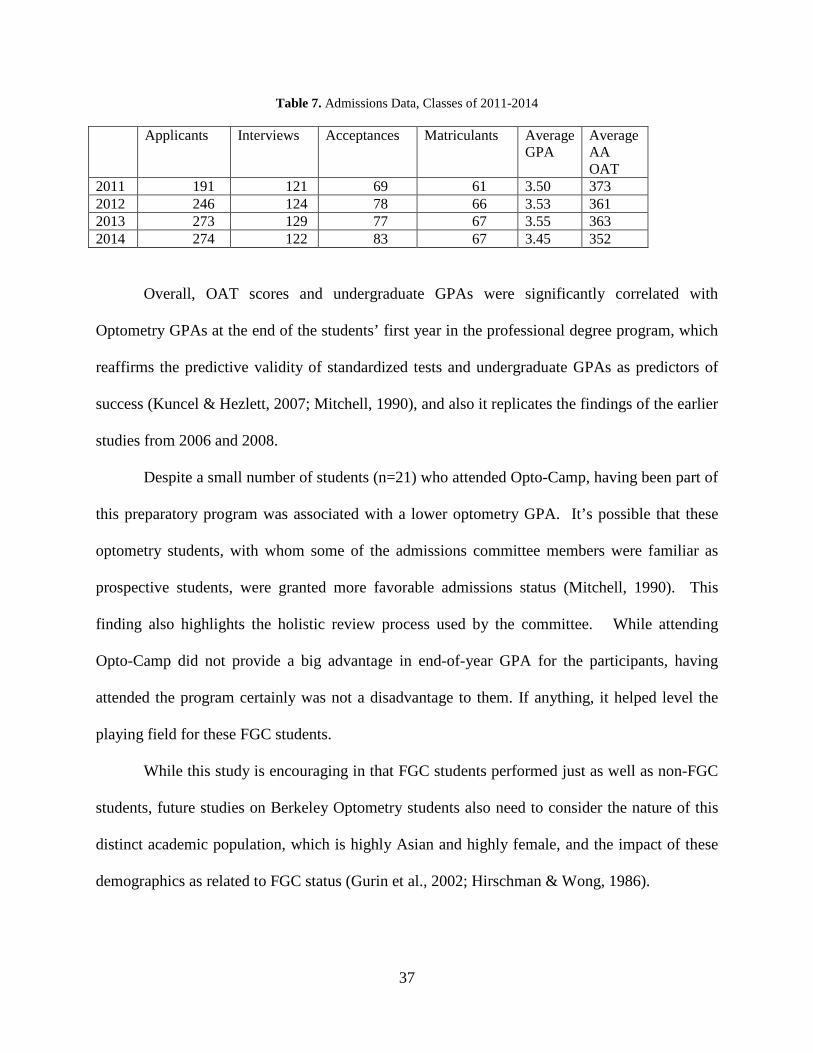
Table 7. Admissions Data, Classes of 2011-2014
Applicants Interviews Acceptances Matriculants Average GPA
Average AA OAT
2011 191 121 69 61 3.50 373 2012 246 124 78 66 3.53 361 2013 273 129 77 67 3.55 363 2014 274 122 83 67 3.45 352
Overall, OAT scores and undergraduate GPAs were significantly correlated with
Optometry GPAs at the end of the students’ first year in the professional degree program, which
reaffirms the predictive validity of standardized tests and undergraduate GPAs as predictors of
success (Kuncel & Hezlett, 2007; Mitchell, 1990), and also it replicates the findings of the earlier
studies from 2006 and 2008.
Despite a small number of students (n=21) who attended Opto-Camp, having been part of
this preparatory program was associated with a lower optometry GPA. It’s possible that these
optometry students, with whom some of the admissions committee members were familiar as
prospective students, were granted more favorable admissions status (Mitchell, 1990). This
finding also highlights the holistic review process used by the committee. While attending
Opto-Camp did not provide a big advantage in end-of-year GPA for the participants, having
attended the program certainly was not a disadvantage to them. If anything, it helped level the
playing field for these FGC students.
While this study is encouraging in that FGC students performed just as well as non-FGC
students, future studies on Berkeley Optometry students also need to consider the nature of this
distinct academic population, which is highly Asian and highly female, and the impact of these
demographics as related to FGC status (Gurin et al., 2002; Hirschman & Wong, 1986).
37

Moreover, unlike other studies of graduate students who were formerly FGC students,
our population has a very limited number of students who are parents or who work full-time in
addition to attending their optometric studies. The optometry program is a full-time course of
study; there isn’t an option of attending part-time.
Over half of the FGC students did take an OAT prep course, which could indicate a high
level of motivation and investment and/or a high level of test anxiety and apprehension; future
studies that capture information regarding standardized testing preparatory courses should ask if
the subjects received a fee waiver to asses the impact of such programs on entrance and success
in health professional programs. Research shows that “the utility and value of commercial test
preparation courses in medicine have not been demonstrated, and that evaluation apprehension in
the medical profession and aggressive marketing practices are most likely responsible for
commercial course prosperity” (McGaghie et al., p. 203). At our Opto-Camp program, we have
vacillated between having representatives from a test preparation company give presentations on
taking the OAT to not including them in the program. Some of the participants reported an
appreciation for learning more about study techniques and hearing about the fee waiver program
the company offers, while others reported that these presentations have been too much of a “sales
pitch.”
Other limitations from this study include a relatively small sample size and the
homogeneity of students in Berkeley Optometry’s program. Overall, FGC students were only
31% of the group and underrepresented students were only 5.4%. This project wasn’t a
randomized trial, rather a narrow study of an elite program. While this assertion does not
diminish this research study, it does emphasize the need for a larger longitudinal study. By
expanding to a multi-institutional study, in partnership with other schools and colleges of
38

optometry that host summer preparatory programs for FGC students, limitations from this study
could be mitigated and allow for a more meaningful subanalysis for comparison of FGCs to non-
FGCs.
Furthermore, the OptomCAS’s centralized admissions applicant service is in its eighth
year and since FGC status is collected, a wealth of data remains untouched regarding the success
of FGC students at gaining admission into OD programs and the outcomes when they are
admitted.
Overall, there is such a lack of scholarship pertaining to FGC students who have been
accepted into post-undergraduate studies that it raises the possibility of an assumption that these
students have negotiated the problems they faced as undergraduate students, negating further
study. If further studies are pursued, it would be useful to have a term that better defines this
category, such as Former First-Generation College (FFGC), which is more appropriate and
descriptive.
Finally, the measures used to look at FGC students and, when applicable, FFGC students,
often investigate deficiencies in their preparation and look for “traditional” measures of success.
It would be useful instead to look at metrics that measure the impact of factors critical to success
in the health professions: resilience as a predictor of persistence as well as personality
characteristics, such as empathy, both of which are critical for those who aspire to be in the
health professions, like optometry.
39

APPENDIX A
OPTO-CAMP DETAILS
• Participants must be enrolled for the fall at an accredited four-year college or university,
or a junior college.
• Preferential consideration will be given to those applicants who will be entering into their
senior year of college, then to those who will be juniors, and then to those who will be
sophomores.
• We also consider applications from those who have already completed their
undergraduate studies so that “non-traditional” students are also able to participate.
• Out-of-state prospective Opto-Campers are welcomed and encouraged to apply.
• A declared, or anticipated, major in the Sciences is preferred, but not required.
• Preferential consideration will be given to applicants who are the first in their family to
pursue post-high school education.
• Preferential consideration will also be given to applicants who have a 2.8, or higher,
cumulative GPA.
40

Finally, financial aid information and/or parental information, when applicable, is
collected with the objective of providing scholarships for those candidates who are economically
disadvantaged – Pell grant recipients are given the highest consideration.
41

APPENDIX B
PITT STUDY SCRIPT
Study Scripts In-person explanation by PI to the Classes of 2012, 2013 and 2014, and the survey
administered in students' classes with prior permission from the Instructor to interrupt class for the first five minutes. Email sent to the Class of 2011, via the class listserv, and administered in-person during Old Home Week (a week of planned activities leading up to Graduation).
Classes of 2013 and 2014:
"Good morning, students. As some of you may know, I am completing my doctoral degree through the University of Pittsburgh, in Pittsburgh, Pennsylvania. My research is focused on first-generational students and their rise into graduate school. Specifically, the purpose of this study is to compare differences in admissions profiles and subsequent academic progression through UC Berkeley’s School of Optometry.
I will compare GPAs of those who have already been identified are first-generation
college students, as per your OptomCAS application to Berkeley Optometry, versus those who did not identify as first-generation college students and also compare academic performance, as per your first year Berkeley Optometry GPAs in the OD program.
Although my position as the Director of Admissions and Student Affairs already affords
me access to this information, it would be inappropriate for me to conduct research utilizing your personal information without your consent. Therefore, I am asking for your consent to collect and use data such as your name, parental higher educational attainment and if you attended any preparatory programs for graduate school studies, as well as your Optometry GPA.
If you agree to participate, please complete the consent form that I will pass out
momentarily and the corresponding survey. There is little risk involved in this study. The major potential risk is a breach of
confidentiality, but I will do everything possible to protect your privacy by migrating all
42

collected data into a secured database to be accessed only by myself and all participants' names will be recoded as numbers determined by a random number generator. The survey data will be retained for a minimum of seven years.
Furthermore, your identity will not be revealed in any description or publications of this
research. Results will not be shared with your instructors or University administrators, and will have no effect on your standing at this University. It is possible that authorized representatives from the University of Pittsburgh Research Conduct and Compliance Office (including the University of Pittsburgh IRB) may review your data for the purpose of monitoring the conduct of this study. In very unusual cases, your research records may be released in response to an order from a court of law.
Your participation in this study is completely voluntary, even after signing the consent
form. You may refuse to take part in the study, or choose to voluntarily withdraw, prior to data analysis, which in that case, your information will be removed from the data set. Your decision will not affect your relationship with the School of Optometry. If you choose not to participate, simply return the consent form and survey blank when I call time after 5 minutes."
Classes of 2011 and 2012:
"Good morning, students. As some of you may know, I am completing my doctoral degree through the University of Pittsburgh, in Pittsburgh, Pennsylvania. My research is focused on first-generational students and their rise into graduate school. Specifically, the purpose of this study is to compare differences in admissions profiles and subsequent academic progression through UC Berkeley’s School of Optometry.
I will compare entering undergraduate GPAs of those who identify as first-generation
college students, versus those who are not and also compare academic performance, as per your first year Berkeley Optometry GPAs in the OD program.
Although my position as the Director of Admissions and Student Affairs already affords
me access to some of this information, it would be inappropriate for me to conduct research utilizing your personal information without your consent. Therefore, I am asking for your consent to use information from a survey I will distribute momentarily that will collect your name, parental higher educational attainment and if you attended any preparatory programs for graduate school studies, as well as access to your undergraduate entering and first year Optometry GPAs.
If you agree to participate, please complete a consent form and the corresponding survey
that I will pass out momentarily. There is little risk involved in this study. The major potential risk is a breach of
confidentiality, but I will do everything possible to protect your privacy by migrating all collected data into a secured database to be accessed only by myself and all participants' names will be recoded as numbers determined by a random number generator. The survey data will be retained for a minimum of seven years.
43
Furthermore, your identity will not be revealed in any description or publications of this research. Results will not be shared with your instructors or University administrators, and will have no effect on your standing at this University. It is possible that authorized representatives from the University of Pittsburgh Research Conduct and Compliance Office (including the University of Pittsburgh IRB) may review your data for the purpose of monitoring the conduct of this study. In very unusual cases, your research records may be released in response to an order from a court of law.
Your participation in this study is completely voluntary, even after signing the consent
form. You may refuse to take part in the study, or choose to voluntarily withdraw, prior to data analysis, which in that case, your information will be removed from the data set. Your decision will not affect your relationship with the School of Optometry. If you choose not to participate, simply return the consent form and survey blank when I call time after 5 minutes."
E-mail to Class of 2011:
"Dear Class of 2011. Congratulations again on your recent Graduation! As some of you may know, I am completing my doctoral degree through the University
of Pittsburgh, in Pittsburgh, Pennsylvania. My research is focused on first-generational students and their rise into graduate school. Specifically, the purpose of this study is to compare differences in admissions profiles and subsequent academic progression through UC Berkeley’s School of Optometry.
I will compare entering undergraduate GPAs of those who identify as first-generation
college students, versus those who are not and also compare academic performance, as per your first year Berkeley Optometry GPAs in the OD program.
Although my position as the Director of Admissions and Student Affairs already affords
me access to some of this information, it would be inappropriate for me to conduct research utilizing your personal information without your consent. Therefore, I am asking for your consent to use information from a survey, attached to this message, that will collect your name, parental higher educational attainment and if you attended any preparatory programs for graduate school studies, as well as access to your Optometry GPA.
If you agree to participate, please complete a consent form and the corresponding survey,
both pieces are attached as one document. Please return these items within a week's time from today's date.
There is little risk involved in this study. The major potential risk is a breach of
confidentiality, but I will do everything possible to protect your privacy by migrating all collected data into a secured database to be accessed only by myself and all participants' names will be recoded as numbers determined by a random number generator. The survey data will be retained for a minimum of seven years.
44
Furthermore, your identity will not be revealed in any description or publications of this research. Results will not be shared with your instructors or University administrators, and will have no effect on your standing at this University. It is possible that authorized representatives from the University of Pittsburgh Research Conduct and Compliance Office (including the University of Pittsburgh IRB) may review your data for the purpose of monitoring the conduct of this study. In very unusual cases, your research records may be released in response to an order from a court of law.
Your participation in this study is completely voluntary, even after signing the consent
form. You may refuse to take part in the study, or choose to voluntarily withdraw, prior to data analysis, which in that case, your information will be removed from the data set. Your decision will not affect your relationship with the School of Optometry. If you choose not to participate, simply disregard this message from me. If I do not hear back from you within a week's time, I will assume that you have chosen not to participate."
45
APPENDIX C
PITT CONSENT FORM
CONSENT TO ACT AS A SUBJECT IN A RESEARCH STUDY TITLE: First-Generation College Students Progression Into Graduate School PRINCIPAL INVESTIGATOR: Sharon T. Joyce, Department of Administrative and
Policy Studies, Graduate Student, University Of Pittsburgh, School Of Education, [email protected], 415.377.2483
FACULTY MENTOR: John C. Weidman, Professor of Education and of Sociology,
University Of Pittsburgh, School Of Education, Department of Administrative and Policy Studies, 5910 Wesley W. Posvar Hall, Pittsburgh, PA 15260, [email protected], 412.648.1772
The purpose of this study is to compare differences in admissions profiles and subsequent
academic progression through UC Berkeley’s School of Optometry. I will compare entering undergraduate GPAs of those who are first-generation college students, versus those who are not and also compare academic performance (first year Berkeley Optometry GPAs) in the OD program of all who agree to participate in this project; students/graduates in the Classes of 2011, 2012, 2013 and 2014 will be asked to participate in this research study.
If you agree to participate, you will complete a brief survey that will take less than five
minutes to complete. The survey will ask you to disclose your parents’ educational levels, if known, and also ask if you attended any preparatory programs designed to enhance your candidacy for admission to graduate school. While this information was already collected for the Classes of 2013 and 2014 through the OptomCAS application, it would be inappropriate for me to use information gathered from OptomCAS applications without prior consent. Therefore, I am asking all participants to complete the same consent form and survey to ensure consistency across all respondents. Additionally, as I plan to use entering undergraduate GPAs and first year Optometry GPAs as part of my data analysis, I am further asking for the consent of all participants to use these individual GPAs.
46

There is little risk involved in this study. The major potential risk is a breach of confidentiality, but I will do everything possible to protect your privacy. All information pertaining to your involvement in this study will be kept confidential and data from those who have agreed to participate (name, class year, entering undergraduate GPA as per your application record, parental higher educational attainment, if you attended any preparatory programs for graduate school studies and your first year Optometry GPA), will be migrated into a password protected Excel file that only I will have access. Additionally, participants’ names will be replaced and coded by a random number generator to ensure greater confidentiality and again, only I will have access to the coded names in another password protected Excel file.
Furthermore, your identity will not be revealed in any description or publications of this
research. Individual results will not be shared with your instructors or University administrators, and will have no effect on your standing at this University. It is possible that authorized representatives from the University of Pittsburgh Research Conduct and Compliance Office may review your data for the purpose of monitoring the conduct of this study. In very unusual cases, your research records may be released in response to an order from a court of law.
Your participation in this study is completely voluntary, even after signing the consent
form. You may refuse to take part in the study, or choose to voluntarily withdraw, prior to data analysis, which in that case, your information will be removed from the data set. Your decision will not affect your relationship with the School of Optometry. If you choose not to participate, simply return the consent form and survey blank.
There are no costs to you for participating in this study, and you will receive no direct
benefit from participating in this study. When my research has concluded, a copy of my dissertation will be available for review at the School of Optometry Fong Library.
47
If you have questions about this research study, you may contact the investigators listed at the beginning of this consent form. If you have questions about your rights as a research subject, please contact the Human Subjects Protection Advocate at the University of Pittsburgh IRB Office, 1.866.212.2668.
*************************************************************************** SUBJECT’S CERTIFICATION
• I have read the consent form for this study and any questions I had, including explanation of all
terminology, have been answered to my satisfaction. A copy of this consent form will be provided to me.
• I understand that I am encouraged to ask questions about any aspect of this research study
during the course of this study, and that those questions will be answered by the researchers listed on the first page of this form.
• I understand that my participation in this study is voluntary and that I am free to refuse to
participate or to withdraw my consent and discontinue my participation in this study at any time without affecting my future relationship with this institution. To withdraw your consent, simply email Sharon Joyce at [email protected] and your collected data will be removed from the study prior to data analysis.
• I agree to participate in this study.
_________________________________ Subject’s Printed Name _________________________________ ____________ Subject’s Signature Date
48

APPENDIX D
PITT SURVEY
UNIVERSITY OF CALIFORNIA, BERKELEY
BERKELEY • DAVIS • IRVINE • LOS ANGELES • MERCED • RIVERSIDE • SAN DIEGO • SAN FRANCISCO SANTA BARBARA • SANTA CRUZ
First-Generation College Students Progression Into Graduate School
Survey Questions _________________________________ ____________ Subject’s Printed Name Graduation Year Have your parents graduated from a four-year college or university? Yes, my mother graduated from a four-year college or university. No, my mother did not graduate from a four-year college or university. Information unknown. Yes, my father graduated from a four-year college or university. No, my father did not graduate from a four-year college or university. Information unknown. Have you attended any preparatory programs designed to enhance your candidacy for
admission to graduate school? Undergraduate Programs Biology Scholars Program (BSP) Illinois College of Optometry, Focus on Your Future OAT Review Course, Kaplan OAT Review Course, Other Please List: _________________________________
49
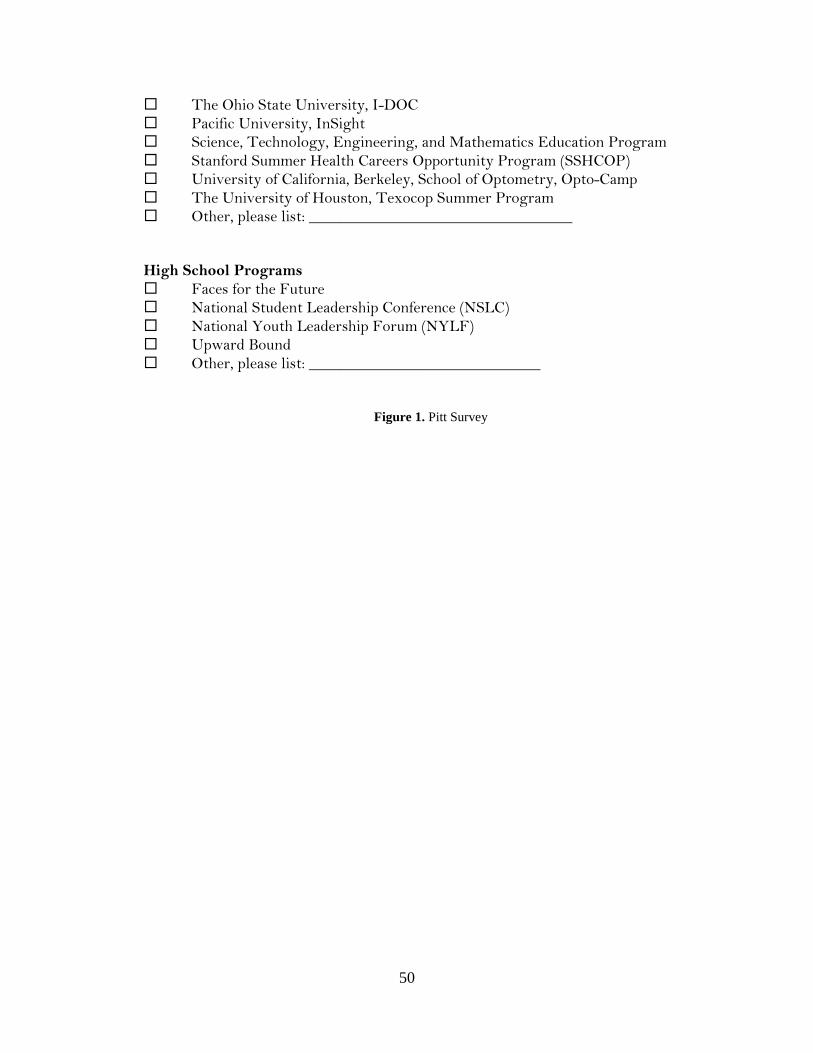
The Ohio State University, I-DOC Pacific University, InSight Science, Technology, Engineering, and Mathematics Education Program Stanford Summer Health Careers Opportunity Program (SSHCOP) University of California, Berkeley, School of Optometry, Opto-Camp The University of Houston, Texocop Summer Program Other, please list: _________________________________ High School Programs Faces for the Future National Student Leadership Conference (NSLC) National Youth Leadership Forum (NYLF) Upward Bound Other, please list: _____________________________
Figure 1. Pitt Survey
50
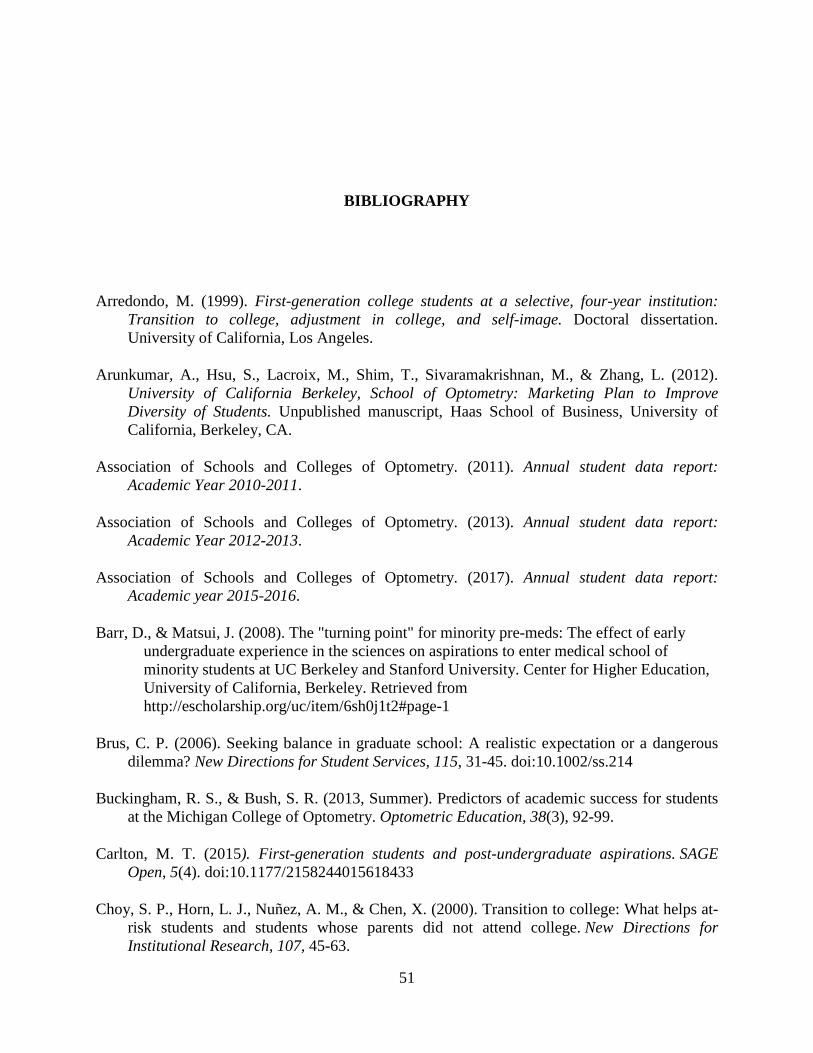
BIBLIOGRAPHY
Arredondo, M. (1999). First-generation college students at a selective, four-year institution: Transition to college, adjustment in college, and self-image. Doctoral dissertation. University of California, Los Angeles.
Arunkumar, A., Hsu, S., Lacroix, M., Shim, T., Sivaramakrishnan, M., & Zhang, L. (2012).
University of California Berkeley, School of Optometry: Marketing Plan to Improve Diversity of Students. Unpublished manuscript, Haas School of Business, University of California, Berkeley, CA.
Association of Schools and Colleges of Optometry. (2011). Annual student data report:
Academic Year 2010-2011.
Association of Schools and Colleges of Optometry. (2013). Annual student data report: Academic Year 2012-2013.
Association of Schools and Colleges of Optometry. (2017). Annual student data report:
Academic year 2015-2016. Barr, D., & Matsui, J. (2008). The "turning point" for minority pre-meds: The effect of early
undergraduate experience in the sciences on aspirations to enter medical school of minority students at UC Berkeley and Stanford University. Center for Higher Education, University of California, Berkeley. Retrieved from http://escholarship.org/uc/item/6sh0j1t2#page-1
Brus, C. P. (2006). Seeking balance in graduate school: A realistic expectation or a dangerous
dilemma? New Directions for Student Services, 115, 31-45. doi:10.1002/ss.214 Buckingham, R. S., & Bush, S. R. (2013, Summer). Predictors of academic success for students
at the Michigan College of Optometry. Optometric Education, 38(3), 92-99.
Carlton, M. T. (2015). First-generation students and post-undergraduate aspirations. SAGE Open, 5(4). doi:10.1177/2158244015618433
Choy, S. P., Horn, L. J., Nuñez, A. M., & Chen, X. (2000). Transition to college: What helps at-
risk students and students whose parents did not attend college. New Directions for Institutional Research, 107, 45-63.
51

Craig, L., Jaso, S. &Nguyen, H. (2008). Predictors of performance in optometry school: A study
at the University of California At Berkeley, Part Two. Unpublished manuscript, School of Optometry, University of California, Berkeley, CA.
Damari, D. (2016, Summer). Introducing the First Optometry Admission Test (OAT) Newsletter.
Optometry Admissions Test, 1, 2. Engle, J. (2016). Answering the call: Institutions and states lead the way toward better measures
of postsecondary performance. Bill & Melinda Gates Foundation, 22.
Fauteux, N. (2012). Opportunity knocks: Pipeline programs offer minority students a path to dentistry. Diverse: Issues in Higher Education, 29(19), 10-11.
Foley, D. (2004). Ogbu’s theory of academic disengagement: Its evolution and its critics.
Intercultural Education, 15(4), 385-397. Freeling, N. (2015, September 22). First-generation students hear from faculty who have “been
there.” Retrieved from http://www.universityofcalifornia.edu/news/5429/first-generation-students-hear-faculty-who-have-been-there
Goss, K. (2014, July 28). The Problem With Percentages and Education: Which Students Merit
Our Attention? Retrieved from http://www.huffingtonpost.com/karen-gross/college-graduation-rates_b_5403768.html
Gurin, P., Dey, E., Hurtado, S., & Gurin, G. (2002). Diversity and higher education: Theory and
impact on educational outcomes. Harvard Educational Review, 72(3), 330-367. Hurley, P. S. (2002). Comparing the graduate degree choices and influences of first-generation
college students and children of college graduates. Los Angeles, CA: University of California, Los Angeles.
Hirschman, C., & Wong, M. G. (1986). The extraordinary educational attainment of Asian-
Americans: A search for historical evidence and explanations. Social Forces, 65(1), 1. Holley, K., & Gardner, S. (2012). Navigating the pipeline: How socio-cultural influences impact
first-generation doctoral students. Journal of Diversity in Higher Education, 5(2), 112-121. Ishiyama, J. T., & Hopkins, V. M. (2003). Assessing the impact of a graduate school preparation
program on first-generation, low-income college students at a public liberal arts university. Journal of College Student Retention: Research, Theory & Practice, 4(4), 393-405.
Kang, E., Kim, S., & Son, H. (2006). Predictors of performance in optometry school: A study at
the University of California, Berkeley. Unpublished manuscript, School of Optometry, University of California, Berkeley, CA.
52
Kegel-Flom, P. (1985). Predicting optometry school grades from intellectual and nonintellectual
admission variables. Optometry and Vision Science, 62(12), 901-907. Kegel-Flom, P. (1990). Predicting the academic performance of Asian, Black, and Hispanic
optometry students. Optometry and Vision Science, 67(3), 207-213. Kegel-Flom, P. (1992). What kinds of leaders are entering optometry schools? Optometry and
Vision Science, 69(12), 991-996. Kuncel, N. R., & Hezlett, S. A. (2007). ASSESSMENT: Standardized tests predict graduate
students’ success. Science, 315(5815), 1080-1081. Lancaster, C. M. (2010). First-generation college students, graduate school, and social support.
Retrieved from http://scholarworks.sjsu.edu/etd_theses/3772 London, H. B. (1996). How college affects first-generation students. About Campus 1(5), 9-23. Lunceford, B. (2011). When first-generation students go to graduate school. New Directions for
Teaching and Learning, 127, 13-20. Lynch, M. (2013). It’s tough to trailblaze: Challenges of first-generation college students.
Diverse Issues in Higher Education. Retrieved from http://diverseeducation.com/article/50898/
McGaghie, W. C., Downing, S. M., & Kubilius, R. (2004). What is the impact of commercial
test preparation courses on medical examination performance? Teaching and Learning in Medicine,16(2), 202-211.
Mitchell, K. J. (1990). Traditional predictors of performance in medical school. Academic
Medicine, 65(3), 149-58. Rendon, L. I. (1992). From the barrio to the academy: Revelations of a Mexican American
“scholarship girl.” New Directions for Community Colleges, 80, 55-64. Saenz, V. B., Hurtado, S., Barrera, D., Wolf, D., & Yeung, F. (2007). First in my family: A
profile of first-generation college students at four-year institutions since 1971. Los Angeles, CA: Cooperative Institutional Research Program, Higher Education Research Institute.
Scholars, M. (n.d.). About. Retrieved January, 2017, from https://mcnairscholars.com/about/ Seay, S. E., Lifton, D. E., Wuensch, K. L., Bradshaw, L. K., & McDowelle, J. O. (2008). First-
generation graduate students and attrition risks. The Journal of Continuing Higher Education,56(3), 11-25. doi:10.1080/07377366.2008.10400158
53
Strayhorn, G. (2000). A pre-admission program for underrepresented minority and disadvantaged students: Application, acceptance, graduation rates and timeliness of graduating from medical school. Academic Medicine, 75(4), 355-361.
Tate, K. A., Fouad, N. A., Marks, L. R., Young, G., Guzman, E., & Williams, E. G. (2014).
Underrepresented first-generation, low-income college students' pursuit of a graduate education: Investigating the influence of self-efficacy, coping efficacy, and family influence. Journal of Career Assessment, 23(3), 427-441.
Terenzini, P. T., Springer, L., Yaeger, P. M., Pascarella, E. T., & Nora, A. (1996). First-
generation college students: Characteristics, experiences, and cognitive development. Research in Higher Education, 37(1), 1-22.
Tinto, V. (1998). Classrooms as communities: Exploring the educational character of student
persistence. The Journal of Higher Education, 68(6), 599-623. Tugend, A. (2016, August 27). The struggle to be first: First-gen students may be torn between
college and home. California Magazine. Retrieved from https://alumni.berkeley.edu/california-magazine/spring-2015-dropouts-and-drop-ins/struggle-be-first-first-gen-students-may-be
University of California, Office of the President. (2011). University of California applicants,
admits and new enrollees by campus, first generation freshmen fall 1994. Retrieved from http://accountability.universityofcalifornia.edu/documents/accountabilityreport11.pdf
U.S. Department of Education. National Center for Education Statistics. First Generation
Students: Undergraduates Whose Parents Never Enrolled in Postsecondary Education, NCES 98-082, by Anne-Marie Nunez and Stephanie Cuccaro-Alamin. Project officer: C. Dennis Carroll. Washington DC: 1998.
Volkwein, J. F., & Carbone, D. A. (1994). The impact of departmental research and teaching climates on undergraduate growth and satisfaction. The Journal of Higher Education, 65, 147-167.
Weidman, J. (1989). Undergraduate socialization: A conceptual approach. Higher education:
Handbook of Theory and Research, 5, 289-322.
54