Embed Size (px)
Citation preview

IMS Health Strategic Management Review prepared for Bayer Board Meeting
© 2006, IMS HEALTH INCORPORATED OR ITS AFFILIATES. ALL RIGHTS RESERVED. IMS CONFIDENTIAL AND PROPRIETARY INFORMATION
Success in a period of Global Uncertainty
Graham Lewis, Vice President Global Pharma Strategy
1st
May 2009
Prepared for PLG 25th
Anniversary meeting: London

Presentation prepared for PLG anniversary presentation 1st May 20092
This presentation is based on IMS MIDAS data and IMS Market Prognosis forecasts
Some caveats
•
MIDAS data is mainly based on country retail and hospital panels.
−
Retail data is mainly sourced from wholesalers, but in some countries (eg, Russia) this is supplemented by pharmacy panels
−
Hospital data is mainly sourced from dispensing pharmacy panels in EU5 and in sales-in for the other countries in this presentation
•
This includes the prescription market, and parts of the OTC and diagnostic market in some countries
•
Drugs supplied through other channels, such as direct to doctor,
clinics and homecare may be under-represented in our audits
•
All data is at ex manufacturer prices in Local Currency US dollars.
•
All forecasts are in constant US$ and based on March 2009 updated figures.
Presentation prepared for PLG anniversary presentation 1st May 20093
The IMS perspective for tomorrow’s Pharmaco
agenda Future success will not come from yesterday’s behaviours
•
The Pharma market has changed due to availability of good low cost alternatives for most common conditions and increasing payer control of prescribing
•
R&D players find it difficult to replace sales lost to generics when exclusivity goes as new products are fewer and less successful
•
Growth opportunities lie in areas of unmet need –
specific, mainly specialist driven, therapy areas and Emerging markets
•
Even in these areas, companies need to adapt their approach to the realities of the new environment−
Earlier preparation for launch to take account of the need to gain payer acceptance as well as physician adoption
−
Realignment of commercial models−
Strategy to leverage Emerging markets to drive growth
The global economic crisis amplifies and adds urgency to the need for action on these issues
Presentation prepared for PLG anniversary presentation 1st May 20094
Today’s discussion
•
Impact of economic crisis on the pharmaceutical market
•
Global Pharmaceutical outlook
•
Key market dynamics
•
Conclusions
Presentation prepared for PLG anniversary presentation 1st May 20095
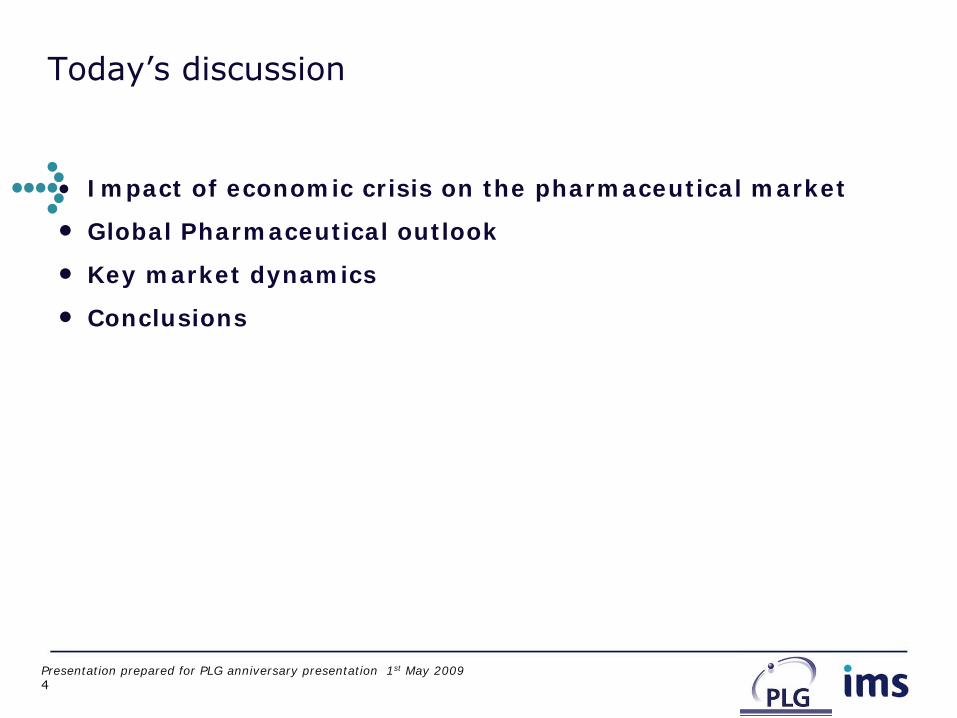
The financial crisis and accompanying recession has changed expectations about future growth
•
The pharma market will be impacted through a combination of patient and policy responses, but there was limited evidence in 2008 of this impact
•
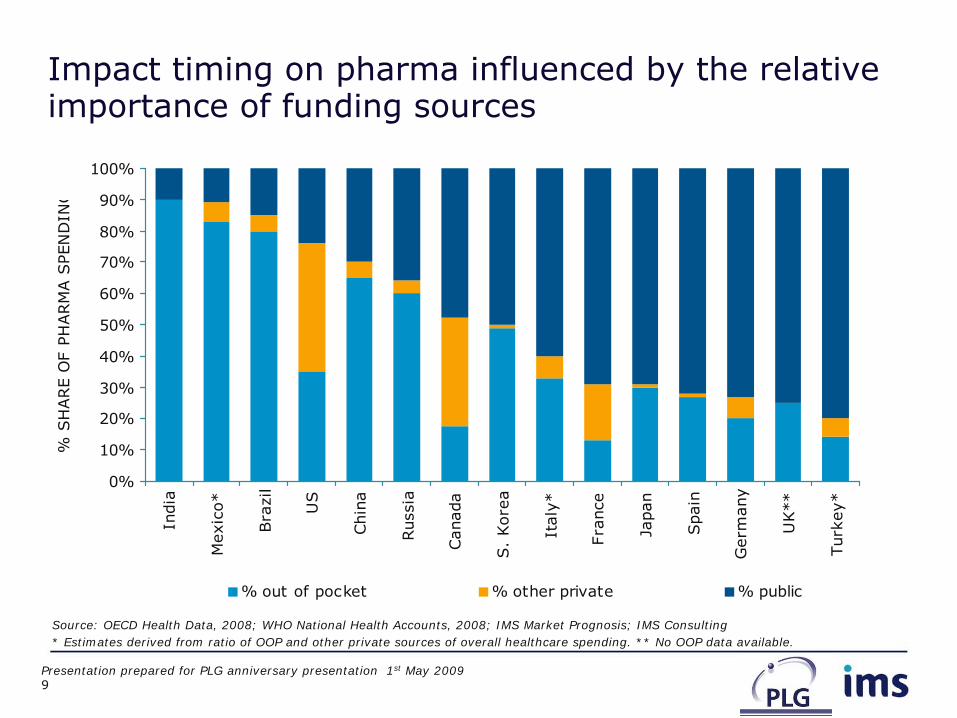
In the short term, the relative importance of the cash-pay/out of pocket market will determine impact, while in the longer term changes in GDP and tax revenues will influence growth in the pharmaceuticals market
•
Sensitivity analysis combined with event modeling highlight key country differences in short and long-term responsiveness of markets to the crisis
Overall, global sales are expected to show a 2% lower growth rate in 2009 than the 4-5% rate forecast in September 2008 though there are significant
variations between these markets
How will the economic downturn affect AstraZeneca performance across your region?
Source: IMS Health Consulting 2009

Presentation prepared for PLG anniversary presentation 1st May 20096
Pharma will be impacted through a combination of patient and policy responses
Impact
Longer term policy
responses
Short term policy
responses
Patient response
ENVIRONMENTDeclining consumer
spending triggers changes in patient
behavior and choice
Lower GDP and growing budget deficits trigger
short-term responses,
especially if there are pre-existing
funding challenges
Ability to support long-term strategic
healthcare initiatives is
compromised by concerns about
long-term economic decline

Presentation prepared for PLG anniversary presentation 1st May 20097
The economic crises impact all stakeholders The danger for Pharma is losing share of voice!
Patients1
2
3
4
Stakeholders
• Reduced spend on promotion • Rationalisation of product lines• Possibility of mergers/acquisitions
• Cash-flow and credit issues•
Reduced inventories to minimise financial exposure• Increase in distribution costs • Consolidation among local distributors
• Changed prescribing practices • Increase in generic / therapeutic substitution
Likely reactions
Manufacturers
Distributors
Healthcare Providers
• Significant increase in price sensitivity• ‘Down-trading’
to cheaper drugs or generics• Deferral of treatment
5 Payers• Shifting costs to patients• Increased focus on evidence and value• Formulary control intensifies

Presentation prepared for PLG anniversary presentation 1st May 20098
0
20
40
60
80
100
120
140
160
180
1997 1998 1999 2000 2001 2002 2003
Vo
lum
e S
U (
Bn
s)
-11.1%
Country Pharma Growth Rate 1997-98
Indonesia -13.4%
Thailand -20.7%
South Korea -15.1%
Malaysia -8.7%
Philippines -7.1%
Singapore -5.4%
Taiwan +11.2%
Hong Kong +11.6%
Total 8 Countries -11.1%
ASEAN markets lost ~11% volume within year IMS is developing sensitivity indicators for emerging
markets
Source: IMS Health MIDAS MAT December 2009
‘Tsunamai’
perspective
Presentation prepared for PLG anniversary presentation 1st May 20099
0%
10%
20%
30%
40%
50%
60%
70%
80%
90%
100%In
dia
Mexic
o*
Bra
zil
US
Chin
a
Russ
ia
Canada
S.
Kore
a
Italy
*
Fra
nce
Japan
Spain
Germ
any
UK**
Turk
ey*
% S
HARE O
F P
HARM
A S
PEN
DIN
G
% out of pocket % other private % public
Impact timing on pharma influenced by the relative importance of funding sources
Source: OECD Health Data, 2008; WHO National Health Accounts, 2008; IMS Market Prognosis; IMS Consulting* Estimates derived from ratio of OOP and other private sources of overall healthcare spending. ** No OOP data available.

Presentation prepared for PLG anniversary presentation 1st May 200910
Today’s discussion
•
Impact of economic crisis on the pharmaceutical market
•
Global Pharmaceutical outlook
•
Key market dynamics
•
Conclusions
Presentation prepared for PLG anniversary presentation 1st May 200911
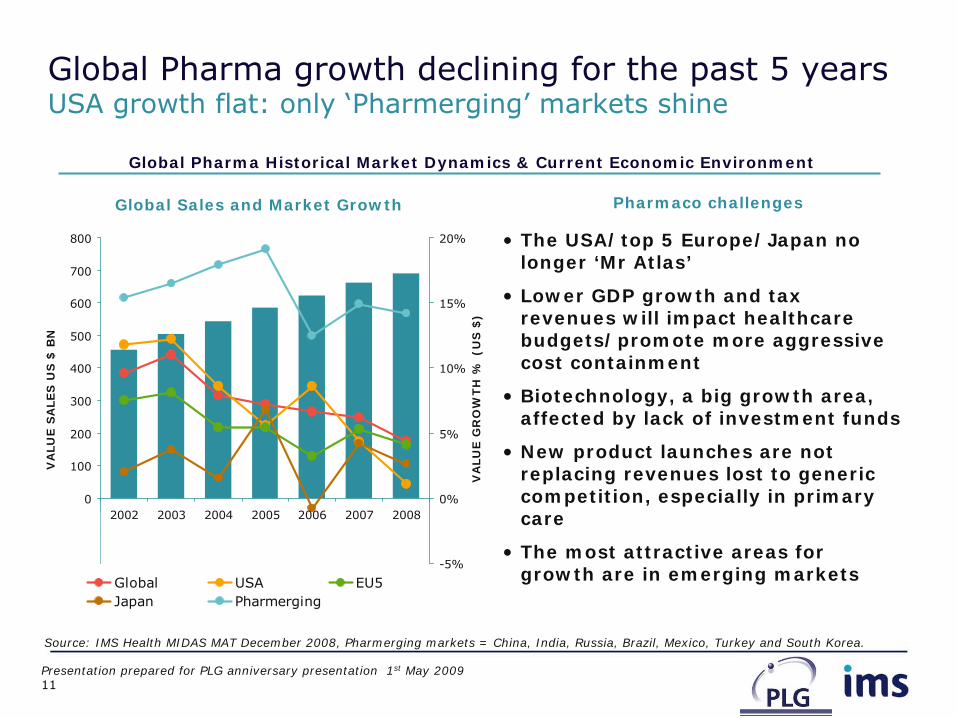
Global Pharma growth declining for the past 5 years USA growth flat: only ‘Pharmerging’
markets shine
Source: IMS Health MIDAS MAT December 2008, Pharmerging markets = China, India, Russia, Brazil, Mexico, Turkey and South Korea.
Global Sales and Market Growth Pharmaco challenges
Global Pharma Historical Market Dynamics & Current Economic Environment
•
The USA/top 5 Europe/Japan no longer ‘Mr Atlas’
•
Lower GDP growth and tax revenues will impact healthcare budgets/promote more aggressive cost containment
•
Biotechnology, a big growth area, affected by lack of investment funds
•
New product launches are not replacing revenues lost to generic competition, especially in primary care
•
The most attractive areas for growth are in emerging markets
-200
-100
0
100
200
300
400
500
600
700
800
2002 2003 2004 2005 2006 2007 2008
VA
LU
E S
ALE
S U
S $
BN
-5%
0%
5%
10%
15%
20%
VA
LU
E G
RO
WT
H %
(U
S $
)
Global USA EU5Japan Pharmerging

Presentation prepared for PLG anniversary presentation 1st May 200912
52%
27%
9%
-19%
11%
15%
16%
15%
8%
5%
16%
8%
13%
15%
13%
16%21%
30%
51%
11% 15%21%
20%
-1%
-20%
-10%
0%
10%
20%
30%
40%
50%
60%
70%
80%
90%
100%
2006 2007 2008 2009(f)
Contr
ibuti
on t
o g
row
th (
%)
US EU5 Japan Canada
Rest of Europe* "Pharmerging" Rest of World
US will make no contribution to growth in 2009, “Pharmerging”
markets contribute around 50%
Contribution to global growth, Const US$
US39%
EU518%
Japan11%
Canada2%
Rest of Europe*
10%
Pharmerging
12%
Rest of World
8%
2009 Market share, US$
Source: IMS Health, Market Prognosis, Mar 2009, *Turkey & Russia excluded from Europe, included in “Pharmerging”

Presentation prepared for PLG anniversary presentation 1st May 200913
Thru’
next 5 years, growth opportunities will continue to move away from traditional pharma markets
Japan
Size: US$82-100bn
Growth: 1-4 %
North America
Size: US$ 274-346bn
Growth: -1-2%
Global market
Size: $766-962bn
3-6% CAGR
Source: IMS Health, Market Prognosis, March 2009.
Western Europe
Size: US$ 177-219bn
Growth: 2-5%
Latin America
Size: US$ 54-70bn
Growth: 10-13 %
Central & East Europe
Size: US$ 54-71bn
Growth: 8-11 %
Middle East & Africa
Size: US$ 16-20bn
Growth: 5-8%Asia Pacific
Size: US$98-122bn
Growth: 13-16 %
Global: IMS Regional Pharmaceutical Outlook in 2012 (US$ Billions)

Presentation prepared for PLG anniversary presentation 1st May 200914
EU5 will feel the effect over the next few years, with 2010 most affected
•
Low co-pays in France and UK mutes impact of GDP contraction
•
Lower private spending growth in Italy likely to impact out of pocket market
•
The German pharma market is expected to be relatively resilient to economic factors
2007 2008 2009 2010 2011 2012
5.3% 4 – 5% 3 – 4% 3 – 5% 3 – 5% 2 – 5%
Basecase pharma market forecast: (September 2008)
Potential impact areas:
Source: IMS Health Market Prognosis March 2009; Economist Intelligence Unit (EIU). Sept 2008, March 2009 macroeconomic forecasts. IMS Health Consulting 2009.
Macroeconomic estimates:(June 2008 estimates in basecase forecasts)
2007 2008 2009 2010 2011 2012 2013
5.3% 4.1% 2 – 3% 1 – 3% 2 – 4% 2 – 5% 2 – 5%March Forecast:
-2%
0%
2%
4%
2007 2008 2009 2010 2011 2012
EU
5 m
ark
ets
GD
P
Gro
wth
June 2008 outlook December 2008 outlook

Presentation prepared for PLG anniversary presentation 1st May 200915
Pharmerging markets look to be more resilient to the economic downturn after a small dip in 2009
Expansion of healthcare access will continue: China key
•
Fast growing pharmerging economies are exposed to global economic turmoil
•
Most still expect relatively strong GDP growth despite 2-3% slowdown from June 2008 outlook
•
South Korea is an outlier with a 5% slowdown in GDP growth to nearly -2%
•
China and India growth continue to lead the pharmerging markets
•
Russia dips sharply related to oil and gas price volatility
2007 2008 2009 2010 2011
14.1% 14.2% 14 - 15% 13 - 15% 12 - 15%
Basecase pharma market forecast: (September 2008)
Potential impact areas:
Source: IMS Health Market Prognosis March 2009; Economist Intelligence Unit (EIU). Sept 2008, March 2009 macroeconomic forecasts. IMS Health Consulting 2009. *Russia numbers using alternative scenario from Jan 09
Macroeconomic estimates:(June 2008 estimates in basecase forecasts)
2007 2008 2009 2010 2011 2012 2013
14.1% 14.2% 13-14% 13-15% 13-15% 13-16% 12 – 15%March* Forecast:
0%
2%
4%
6%
8%
10%
2007 2008 2009 2010 2011 2012
Ph
arm
erg
ing
mark
ets
G
DP
Gro
wth
June 2008 outlook December 2008 outlook
Presentation prepared for PLG anniversary presentation 1st May 200916
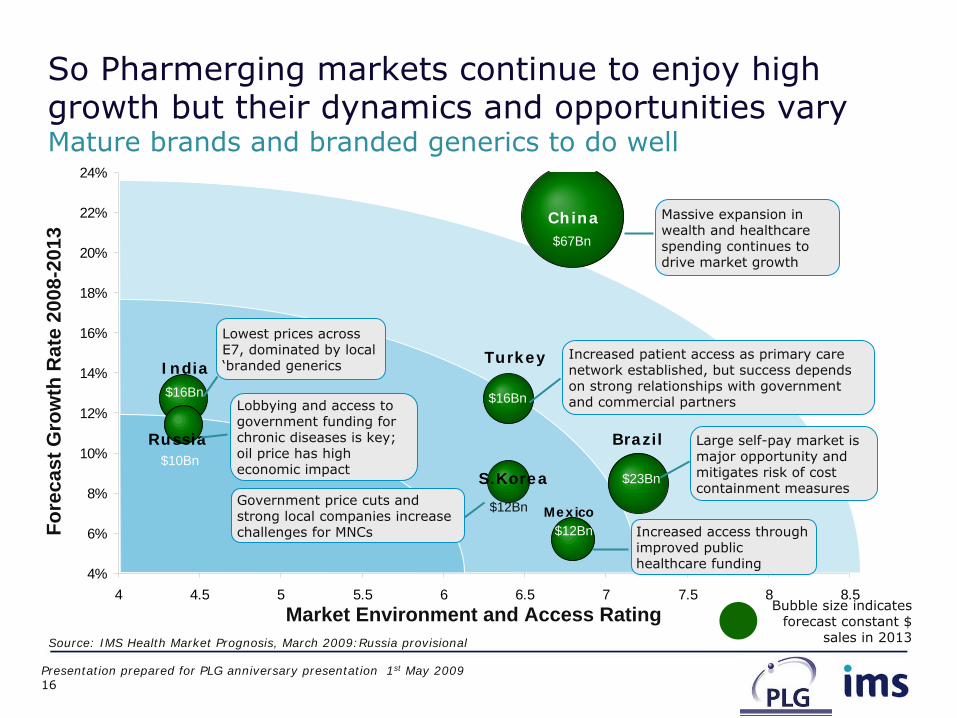
So Pharmerging markets continue to enjoy high growth but their dynamics and opportunities vary
Mature brands and branded generics to do well
Source: IMS Health Market Prognosis, March 2009:Russia provisional
Market Environment and Access Rating Bubble size indicatesforecast constant $
sales in 2013
Fore
cast
Gro
wth
Rat
e 20
08-2
013
4%
6%
8%
10%
12%
14%
16%
18%
20%
22%
24%
4 4.5 5 5.5 6 6.5 7 7.5 8 8.5
China
BrazilRussia
IndiaTurkey
S.Korea
Mexico$12Bn
$16Bn
$23Bn$10Bn
$16Bn
$12Bn
$67Bn
Lobbying and access to government funding for chronic diseases is key; oil price has high economic impact
Lowest prices across E7, dominated by local ‘branded generics
Government price cuts and strong local companies increase challenges for MNCs
Massive expansion in wealth and healthcare spending continues to drive market growth
Increased patient access as primary care network established, but success depends on strong relationships with government and commercial partners
Large self-pay market is major opportunity and mitigates risk of cost containment measures
Increased access through improved public healthcare funding

Presentation prepared for PLG anniversary presentation 1st May 200917
Today’s discussion
•
Impact of economic crisis on the pharmaceutical market
•
Global Pharmaceutical outlook
•
Key market dynamics
•
Conclusions
Presentation prepared for PLG anniversary presentation 1st May 200918
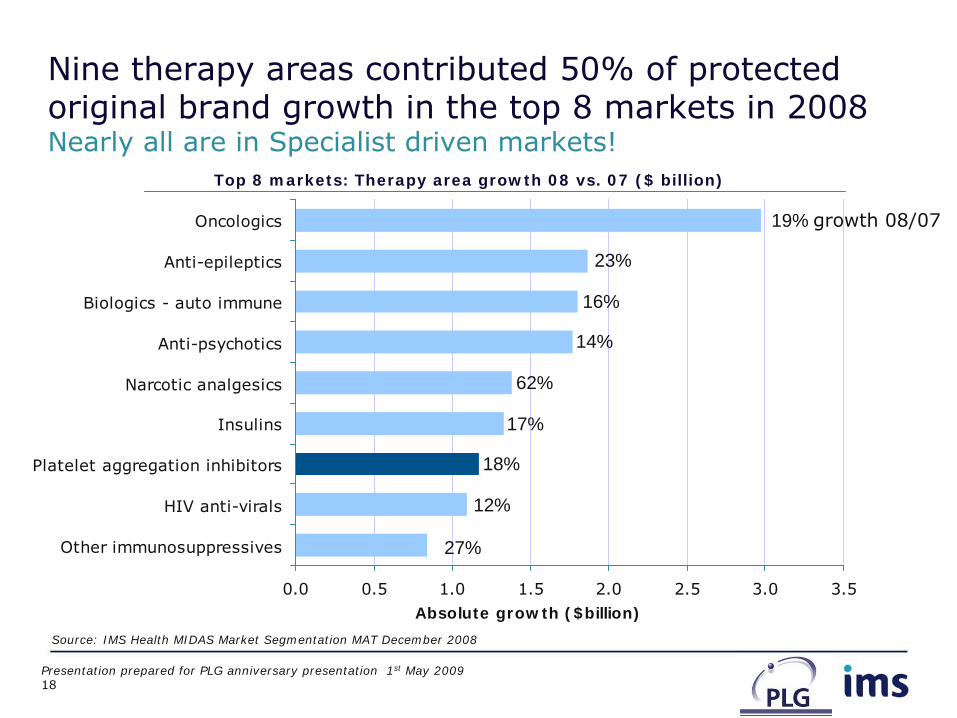
Nine therapy areas contributed 50% of protected original brand growth in the top 8 markets in 2008
Nearly all are in Specialist driven markets!
0.0 0.5 1.0 1.5 2.0 2.5 3.0 3.5
Oncologics
Anti-epileptics
Biologics - auto immune
Anti-psychotics
Narcotic analgesics
Insulins
Platelet aggregation inhibitors
HIV anti-virals
Other immunosuppressives
Absolute growth ($billion)
19%
23%
14%
16%
62%
17%
18%
12%
27%
Source: IMS Health MIDAS Market Segmentation MAT December 2008
growth 08/07
Top 8 markets: Therapy area growth 08 vs. 07 ($ billion)

Presentation prepared for PLG anniversary presentation 1st May 200919
And NCEs
are increasingly in specialist driven areas Numbers falling overall
2125
2217
23
14
7
1913 13 12
2318
19
2014
1423
1521
1513
0
5
10
15
20
25
30
35
40
45
1998 1999 2000 2001 2002 2003 2004 2005 2006 2007 2008
Nu
mb
er
of
NC
E la
un
ch
es
Primary care driven Specialist driven
Global: NCE launches across primary and specialist driven care
Source: IMS Health MIDAS MAT December 2008

Presentation prepared for PLG anniversary presentation 1st May 200920
Europe increases its share of biotech market, while Japan and North America declines
36%
54%
5%
1%3%
61%
29%
2%7%
1%
54%58%62%
61%61%
36%32%
29%
29%
29%
6%
5%
6%
7%
7%
4%
3%
3%
3%
0%
0%
0%
0%
0
10
20
30
40
50
60
70
80
2004 2005 2006 2007 2008
SA
LE
S U
S$
BN
North America Europe Japan R+H Africa/Asia/Australia Latin America
Source: IMS Health, MIDAS, MAT Dec 2008

Presentation prepared for PLG anniversary presentation 1st May 200921
Specialist areas continue to lead growth of major sectors
Primary care driven
Global RankSalesUS$bn
%MarketShare
%Growth
Top 10 188.3 44.0 2.3
Lipid regulators 33.8 7.9 (2.3)
Acid pump inhibitors 26.5 6.2 0.6
Respiratory agents 25.9 6.0 6.3
Angiotensin II antag. 22.9 5.3 12.6
Antidepressants 20.3 4.8 0.6
Antidiabetics, oral 13.8 3.2 3.7
Platelet aggr. inhib. 13.6 3.2 10.3
Non-narcotic analgesics 11.2 2.6 3.6
Cephalosporins & combs. 10.1 2.4 1.3
Calcium antagonists, plain 10.1 2.4 (13.3)
Specialist driven
Global RankSalesUS$bn
%MarketShare
%Growth
Top 10 168.9 57.0 7.8
Oncologics 48.2 16.3 11.3
Antipsychotics 22.9 7.7 8.0
Anti-epileptics 16.9 5.7 9.7
Autoimmune agents 15.9 5.4 16.9
Antidiabetic,injectable 13.5 4.5 16.5
HIV antivirals 12.2 4.1 11.9
Erythropoietins 11.5 3.9 (13.9)
Narcotic analgesics 10.6 3.6 8.8
Immunostim AG EX Int 8.9 3.0 6.1
Bone regulators 8.4 2.8 (8.9)
Source: IMS Health MIDAS MAT December 2008

Presentation prepared for PLG anniversary presentation 1st May 200922
Pharmerging represents lifeline for Primary care driven Pharmacos
Source: IMS Health MIDAS MAT December 2008
Pharmerging market reforms focus on improving access to medicines, But, primary care remains central to key reform initiatives
0%
10%
20%
30%
40%
50%
60%
70%
80%
90%
100%
2004 2005 2006 2007 2008
Primary vs. Specialist Driven Care Dynamics, LCD$ Const
0%
10%
20%
30%
40%
50%
60%
70%
80%
90%
100%
2004 2005 2006 2007 2008
Top 8 Markets Pharmerging
VALU
E M
ARKET S
HARE %
VALU
E M
ARKET S
HARE %
Primary Driven Care Specialist Driven Care

Presentation prepared for PLG anniversary presentation 1st May 200923
0%
10%
20%
30%
40%
50%
60%
70%
80%
1997 1998 1999 2000 2001 2002 2003 2004 2005 2006 2007 2008
FIRST NCE LAUNCH YEAR
% N
CEs
LAU
NCH
ED
*
China India Brazil Mexico Russia Korea Turkey
But only half of NCEs older than 5 years have reached the Pharmerging markets
Reflection of more niche products, price conservatism
Source: IMS Health, New Product Focus; MIDAS Dec 2008. *NCEs launched in country any time after original launch.
46%
35%
21%
6%

Presentation prepared for PLG anniversary presentation 1st May 200924
Today’s discussion
•
Impact of economic crisis on the pharmaceutical market
•
Global Pharmaceutical outlook
•
Key market dynamics
•
Conclusions

Presentation prepared for PLG anniversary presentation 1st May 200925
The pharmaceutical industry is facing unprecedented change around the globe
•
Regulatory and safety concerns
•
Generics often first line therapy
•
Pricing pressures
•
Payers eclipsing doctors as decision makers
•
Slowing industry innovation
•
Shifting portfolios from primary care to specialist-driven therapies
Environmental Pressures
•
Outsourcing and labor reduction to reduce costs
•
Entry into new markets –
biosimilars, services
•
Focus on pharmerging markets
•
M&A to enhance the pipeline and reduce cost
•
Redesigning the commercial model
Industry Challenges

Presentation prepared for PLG anniversary presentation 1st May 200926
Many companies have reacted to these new realitiesThe most radical restructuring has been UCB
Bristol-Myers Squibb to
close more than 50% of 27 manufacturing facilities by 2010 (12/07)
Elan shifting efforts from traditional sales to commercial model based on clinical support & education (04/08)
Schering – Plough eliminating 20% of its US sales force (09/08)
Astra Zeneca to eliminate additional 1,400 jobs and close plants in Spain, Belgium and Sweden (11/08)
Novo Nordisk to lay off a "significant number" of workers at its Hayward, California site (1/08)
Sanofi-Aventis reductions will trim about one-third of the drug maker's sales force in the country (06/08)
Novartis cutting 550 U.S. sales jobs and announced a wide-ranging executive shake-up (10/08)
Astra Zeneca targeting another 6,000 global work force positions in the next four years (01/09)
J&J cutting 4% of workforce in 2009 (01/08)
Pfizer to
cut about 500 jobs by 2011, mainly sales representatives who sell to doctors(5/08)
Merck loses 7,200 jobs as credit crisis leads to cutbacks in medical spending (10/08)
Glaxo-Smith Kline cutting 1,000 jobs in its US sales force by the end of the year (11/08)
Novartis organizing around payers and providers and putting less emphasis on physicians (03/08)
Boehringer Ingelheim to cut 200 representatives from Neurology field force (07/08)
Pfizer Replacing current business units (10/08)
Glaxo-Smith Kline reported a 7.1% drop in Q408 net profit, and will cut more jobs and costs (01/09)

Presentation prepared for PLG anniversary presentation 1st May 200927
IMS research reveals that Pharma must first take a radical look at their commercial assets
Low High
Low
High
Commodity
Transitional
Differentiated
Value Proposition
Co
st B
urd
en
•
Commodity: Classes with products that are minimally differentiated and where payers have a great stake in prescribing decisions
•
Transitional: Classes between the two extremes likely to undergo significant change. In many countries, this is the largest segment.
•
Differentiated: Classes that are characterized by significant product innovation and high perceived differentiation where no generics are available and payers exert little influence on treatment decisions
Strategic markets
Source: IMS Health Consulting 2009

Presentation prepared for PLG anniversary presentation 1st May 200928
The old order gradually giving way China and Brazil move up in top 10:UK falls sharply
2000 2008 (f)2013
1 USA USA USA
2 Japan Japan Japan
3 France France China
4 Germany Germany Germany
5 Italy Italy France
6 UK Spain Spain
7 Spain China Italy
8 Canada UK Brazil
9 Brazil Canada Canada
10 China Brazil UK
11 Mexico Turkey Venezuela
12 Australia Korea Turkey
13 Poland Mexico India
14 India Australia Mexico
15 South Korea India South Korea
Global Pharmaceutical Market Ranks to 2012
= Pharmerging MarketsSource: IMS Health, Market Prognosis, March 2009. Canada, US, Spain, France, Germany, UK, Italy, Japan, Brazil, India, China, South Korea, Turkey and Mexico to March 2009. All other country forecasts as at September 08.

Presentation prepared for PLG anniversary presentation 1st May 200929
0
10
20
30
40
50
60
1998 1999 2000 2001 2002 2003 2004 2005 2006 2007 MAT9/2008
ABS G
RO
WTH
CO
NST U
S$ B
N
NCEs years 1-5 NCEs years 6-10 NCEs years 11-15 all other products
Source: IMS Health, MIDAS September 2008
The inability of new products to replace sales of off patent brands will drive ‘real’
restructuring
You ‘aint’
seen nothing yet
34% 31%
Strategic markets

Presentation prepared for PLG anniversary presentation 1st May 200930
Healthcare payers intensify scrutiny of cost benefit as HTAs play larger role across the Globe
Attention shifting to specialist care areas
Source: IMS Health, Market Prognosis September 2008, IMS Consulting
Prospect of comparative effectiveness reviews
Review of Top-up payments; PPRS renegotiation completed
Increased competition for generics through competitive agreements; National treatment guidelines in Cancer and Diabetes
10% price reduction on brands; delisting of OTCs; co-pay for brands when generic available; increasing HTAs
Round of HTAs for 08/09 for Hypertension, PPIs, Osteo, GI
Mandatory submission of cost-
effectiveness/cost-benefit analyses for formulary access
Increased price monitoring by the NPPA
Private-label (store-brand) generics significantly alter commercial environment
Adopt NICE and IQWiG models; Currency devaluation forces reference prices up
Focus on developing domestic generics industry
Update of reimbursement drug list; tenders system controls costs
Regional contracting; IQWiG extends evaluations to new drugs
Lower pure generic prices offset by higher brand prices
Generic price discounts could change from -30% to -50%
Increased price premiums for innovative mechanisms of action; semi-annual generic approvals

Presentation prepared for PLG anniversary presentation 1st May 200931
But across Europe, there is no detectable trend in how HTAs work
So local insight is critical
Level of HTA influence on price and access outcomes* •
Currently, there is no standard in place to evaluate health technologies –
neither for clinical trial evaluation nor for health economic modeling there is a homogeneous standard
•
Even established HTA bodies such as NICE or IQWiG, vary in the standards they use -
and authorities interpret and use results in different ways
•
Consequently, the impact on price and access varies significantly across markets but also across different HTAs
performed within one market by one HTA institution
Source: IMS Health Consulting research among a number of P&R authority officials and industry affiliates in 2008. *Direct Impact

Presentation prepared for PLG anniversary presentation 1st May 200932
However, payers will demand a generic as first line in many key primary care areas
Most NCE’s
second line or niche
Source: IMS Disease Analyser Germany, UK, 1st line use defined as new to pharmacotherapy – ARBs=Angiotensin II receptor antagonists (antihypertensive class)
Percentage of first line patients receiving a generic, now and by 2012, in key primary care areas
0%
20%
40%
60%
80%
100%
HYPERTENSION - ARBs OSTEOPOROSIS ASTHMA /COPD DYSLIPIDEMIA DEPRESSION
UK Generic first line 2007 UK Generic first line 2012 German Generic first line 2007 German Generic first line 2012
Strategic markets

Presentation prepared for PLG anniversary presentation 1st May 200933
0
100
200
300
400
500
600
700
800
2004 2005 2006 2007 2008
VO
LUM
E S
ALE
S S
TAN
DARD
UN
ITS B
N
Non-generic products Generic products
Generics make up one half of volume sales, but only 15% of sales
Lower at actual prices!
0
100
200
300
400
500
600
700
800
2004 2005 2006 2007 2008
VALU
E S
ALE
S U
S$BN
2004-2008 Volume growth Value growth
Generics 32% 54%
Non-generics -2% 25%
Source: IMS Health, MIDAS, Market Segmentation, Rx only, Dec 2008
Strategic markets

Presentation prepared for PLG anniversary presentation 1st May 200934
Pharmacos
of all kinds see generics as a growth sector but it’s not as simple as that
•
R+D players seeking to extend mature brand lifecycles in emerging markets
− Losec
−Voltaren
•
R+D players considering biosimilars: eg Merck/Lonza
•
R+D players see branded generics as ‘line extensions’
as they seek to adapt ‘strategic’
portfolios to emerging markets
−Daiichi Sankyo acquire Ranbaxy
−Other Indian companies up for sale
−Sanofi Aventis buys into Latin America
−GSK regional acquisitions and Aspen marketing deal

Presentation prepared for PLG anniversary presentation 1st May 200935
Generic companies face strategic dilemmas and unforeseen challenges
•
Biosimilars
late and lack potential to usurp originators especially as
R+D players emerge
•
Strategic markets for generics become low price commodity markets and widespread adoption of contracting systems will accelerate this process.
•
Emerging markets offer strong growth for branded generics but local companies have ensured that international generic players are unsuccessful,esp
China
−
Dr Reddy’s
−
Teva
Could Teva (top 10 US player by end 2009), Novartis, Sanofi Aventis and GSK dominate generics globally by 2013?

Presentation prepared for PLG anniversary presentation 1st May 200936
Successful strategies will require decisions on where and how to play
How well are you placed to defend and expand your business?
Congruence
“What constitutes Success”
Business Model“How to Play”
•
What aspiration does your company have across geographies?
•
What would constitute success?
•
What is the time frame for investment and returns?
•
Where are the opportunity spaces in target therapy areas?
•
Is the promotional budget sufficient and well directed?
•
Are you intimate with regulatory processes?
•
What is the appropriate organizational structure?
•
What is the most productive approach for sales force?
•
Which investments should be prioritised?
PortfolioFootprint
“Where to Play
Source: IMS Health Consulting 2009

IMS Health Strategic Management Review prepared for Bayer Board Meeting
© 2006, IMS HEALTH INCORPORATED OR ITS AFFILIATES. ALL RIGHTS RESERVED. IMS CONFIDENTIAL AND PROPRIETARY INFORMATION
Thank You
Graham Lewis, Vice President Global Pharma Strategy
Prepared for PLG 25th
Anniversary meeting: London