Embed Size (px)
Citation preview

Review paper
UDC 550.347.62
Subsurface structural mapping using gravity
data of the northern edge of the Congo craton,
South Cameroon
Charles Antoine Basseka1, Yves Shandini 2 and Jean Marie Tadjou 2,3
1 University of Douala, Faculty of Science, Department of Earth Sciences, Douala, Cameroon
2 University of Yaounde I, Faculty of Science, Department of Physics, Yaounde, Cameroon
3 National Institute of Cartography (NIC) – Cameroon, Yaounde, Cameroon
Received 28 January 2011, in final form 25 May 2011
In this work, the subsurface structures in a part of the northern edge ofthe Congo craton in South Cameroon between the latitudes 2° 30' to 4° 30' Nand the longitudes 11° to 13° E, has been estimated by the interpretation ofgravity data. For quantitative interpretation of the sources of the anomaly, a3D density model of the upper crust was designed by means of forward model-ling and inversion constrained by surface geology and results from Eulerdeconvolution and spectral analysis methods. The Bouguer anomaly map ofthe area is characterized by elongated SW–NE trending negative gravityanomaly which correspond to a collapsed structure associated with a graniticintrusion beneath the center of the region and by various gravity highs associ-ated with an uplift of the Pan-African basement in the north and delimited bya strong gradient in relation with the tectonic boundary between the Congocraton and the Pan-African belt. Our result demonstrated that tectonic struc-tures associated to observed gravity anomalies in the region were put in placeduring a major continental collision.
Keywords: Bouguer anomaly, Congo craton, Euler deconvolution, spectralanalysis, 3D gravity modelling
1. Introduction
The Congo craton is one of the areas of the world which has preserved theearliest formed crust. In South Cameroon, the Congo craton which is very wellexposed is belted on its northern edge by a pan-African mobile belt (Figure 1).In this region, the evolution is well constrained by the collision between theCongo craton and the mobile belt (Poidevin, 1983; Nzenti et al., 1984; Rolin,1995; Penaye et al., 1993; Trompette, 1994; Castaing et al., 1994; Abdelsalamet al., 2002; Basseka, 2002; Toteu et al., 2001, 2004, 2006). This collision yieldsto an overthrusting of the pan-African units onto the craton of about 50 to
GEOFIZIKA VOL. 28 2011
150 km (Nédelec et al., 1986; Manguelle-Dicoum et al., 1992; Shandini et al.,2010). A large proportion of older basement in South Cameroon is most likelyconcealed throughout much of the area by pan-African formations, whichobscures most direct geological signatures of the basement architecture. Inter-pretation of geophysical data can provide indirect insight into the underlyinggeology. The most relevant geophysical studies were carried out in study areato determine by audio-magnetotelluric investigations the subsurface structureof the schist-granite contact and the Congo craton boundary (Manguelle--Dicoum et al., 1992; Mbom-Abane, 1997) and to define the crustal densityacross the tectonic and also to identify the important trends and structures inthe gravity anomaly field the depths of gravimetric sources (Tadjou et al.,2004, 2009). The later used density modeling restricted mainly to regional 2Ddirect interpretations and put special interest on the central portion of thestudy area because of the presence of an elongated gravity low in the completeBouguer anomaly map. Despite conclusions provided in these studies, thereare still uncertainties in the underlying geology structure since the characterof the different tectonic units are still debate matters (e.g. Toteu et al., 2007).
This paper aims to clarify the structural organization of the area by pro-posing a comprehensive structural sketch integrating all available surface andsubsurface geology together with gravity data. A constrained 3D density modelof the upper crust along the transition zone between the Congo craton and thePan-African belt in south Cameroon area was carried out based on completeBouguer anomaly data by means of modelling and inversion.
2. Geological setting
The area under study lies in south Cameroon and is made up of two geo-tectonic units: the Neoproterozoic mobile belt in the northern part that is rep-resented by the Yaoundé group and the Ntem Complex in the southern part,which is the northwestern corner of the Congo craton (Figure 1).
The Ntem complex represents the northwestern part of the Congo cratonin Central Africa and is very well exposed in Southern Cameroon (Maurizot etal., 1985; Basseka, 2002). It is divided into two main structural units: the NyongUnit, to the northwest end, and the Ntem Unit, in the south-central area. TheNtem Unit is dominated by massive and banded plutonic rocks of the charnoc-kite suite and by intrusive tonalites, trondhjemites and granodiorites (TTG).Some of these bodies were dated at ca. 2.9 Ga (Delhal and Ledent, 1975;Lasserre and Soba, 1976; Toteu et al., 1994).
The igneous plutons contain large xenoliths of supracrustal rocks inter-preted as remnants of greenstone belts and dated at ca. 3.1 Ga (Tchameni etal., 2004). All these magmatic bodies were intruded by late K-rich granitoids(2.7–2.5 Ga; Tchameni et al., 2000; Shang et al., 2001). Younger metadoleriticdykes are related to the Palaeoproterozoic event (Vicat et al., 1996).
230 C. A. BASSEKA ET AL.: SUBSURFACE STRUCTURAL MAPPING USING GRAVITY DATA
The Yaoundé group is a huge allochtonous nappe thrusted southward ontothe Congo craton at ca. 620 to 600 Ma (Toteu et al., 1994, 2006). It compriseslow- to high-grade garnet-bearing schist, gneisses and orthogneisses transform-ed under a medium- to high- pressure metamorphism reaching the granulitefacies (Toteu et al., 2004). The structural data show a definite deformation onthe surface, which is characterized by flat structures gently sloping to theNorth with a generalized tilting towards the South or South-West, indicating asignificant overlap of intermediate formations on the basement of the Ntemcomplex. This deformation is seen by the presence of folds sloping to the North(Maurizot et al., 1985).
3. Gravity data and analysis
Gravity data used in this study were acquired between 1963 and 1968, dur-ing a detailed gravity survey of Cameroon and Central Africa undertaken by the“Office de la Recherche Scientifique et Technique d’Outre-Mer” (ORSTOM).Data from other sources were incorporated to achieve a meaningful gravity
GEOFIZIKA, VOL. 28, NO. 2, 2011, 229–245 231
Figure 1. Simplified geological map of southwestern Cameroon (modified after Maurizot et al.,1985).

data distribution of the region and these include data acquired by Hedberg(1969), Albouy and Godivier (1981), Okereke (1984), US Defense MappingAgency (1987). In the study area, the data set consists of 617 irregularlyspaced gravitational acceleration (Figure 2).
The raw gravity data study was acquired with the Worden or Lacoste andRomberg gravimeters with a resolution of 0.01 mGal. They were collected at4 km intervals from all gravity stations including base stations, on all availableroads and tracks in the area. All gravity measurements are tied to the Interna-tional Gravity Standardization Network 1971 (IGSN71) datum after correc-tion of luni-solar effect and instrumental drift. The measurement accuracy isabout 0.5 mGal. To determine the Free-Air anomaly, the linear vertical gradi-ent of 0.3086 mGal/m was used to approximate free-air correction. Elevationvalues were obtained with Wallace and Tiernan altimeters. A reduction den-sity of 2670 kg/m3 was used for the Bouguer correction. The data were theninterpolated to regularly spaced grid using a finite element algorithm (Briggs,1974; Inoue, 1986). The resulting Bouguer anomaly map of the study area isshown in Figure 3. Table 1 shows the raw gravimetric data and the reductionsresults performed related to section 1 (Figure 5).
The complete Bouguer anomaly map is shown in Figure 3. The map pointsout mainly three distinctive areas: a predominant gravity low trending SW–NEto E–W in the centre bounded by gravity highs on the north and the southsides. This anomaly is located within areas occupied by the Ntem complex for-mations to the south as well as by the Yaoundé group formations at the northeast. This particular distribution urged us to look for its origin in order to betterunderstand the subsurface geology of the area. It’s interesting to observe that
232 C. A. BASSEKA ET AL.: SUBSURFACE STRUCTURAL MAPPING USING GRAVITY DATA
Figure 2. Study area map showing the gravity stations (dots).

the main negative anomaly (Figure 2) in the southwest has the shape and oc-curs over outcrops of the Archean to Paleoproterozoic K-rich granites (knownas So’o granites). The central negative zone is surrounding by positive areas.In the northern side, gravity highs, bounded by relatively steep gradients oc-
GEOFIZIKA, VOL. 28, NO. 2, 2011, 229–245 233
Table 1. Results of the different reductions performed on raw gravity data of section 1 presented in
Figure 5.
Latitude
(°)
Elevation
(m)
Raw gravity
(mGal)
Free-air anomaly
(mGal)
Bouguer anomaly
(mGal)
2.835 709 977822 –3.3 –82.6
3.3567 662 977836 –9.2 –83.3
3.4167 654 977840 –8.0 –81.2
3.445 675 977838 –4.6 –80.1
3.4917 669 977839 –5.6 –80.4
3.52 661 977840 –7.1 –81.0
3.5217 642 977845 –8.0 –79.9
3.5433 683 977836 –5.2 –81.6
3.5633 694 977833 –5.0 –82.6
3.795 703 977851 13.4 –65.3
3.9267 727 977861 29.7 –51.7
4.4633 434 977929 –0.3 –48.9
Figure 3. Bouguer anomaly map of the study area.

cur over or near higher metamorphic formations of the Yaoundé group (granu-lites, migmatites and micaschists). The presence of high gravity gradients,which occur over these basic intrusive rocks, suggests the existence of a suturezone between two blocks of the crust (Kennedy, 1984). The southern positiveanomaly trending SW–NE, seems to represent the signature of dense rocks(charnockites) in this zone.
To assess significant local anomalies, separation of regional from residualgravimetric data was performed to enhance localized anomalies. The regio-nal/residual separation was made by polynomial fitting. The regional surfaceis expressed mathematically as a two-dimensional polynomial of an order thatdepends on the regional geology complexity.
Figure 4 shows the regional field of the gravity data obtained from theBouguer gravity field by developing polynomial of the 3rd degree. Meanwhile,the residual component determined by subtracting the regional gravity fromthe Bouguer gravity is displayed in Figure 5.
The regional structure is characterized by a broad negative gravity in thecentre bounded by gradients increasing towards the west and the north. Itmay be inferred from these observations that the basement is deepening to-wards the centre of the region. Indeed, using spectral analysis of gravity data,Tadjou et al. (2009) obtained the crustal thickness beneath the northern edgeof the Congo craton to vary from 25 km in the west to 32 km in the north and47 km in the centre of the craton. The regional map must reflect of the thin-ning of the crust in the central part of the region.
234 C. A. BASSEKA ET AL.: SUBSURFACE STRUCTURAL MAPPING USING GRAVITY DATA
Figure 4. Regional anomaly map of the study area.

The residual gravity map is characterized by four sets of negative residualanomalies: starting with an arcuate shaped band west to southwest of the map,a NW–SE trending unit centred at (12.4° E, 3.8° N) in the north of Bengbis, aSE unit and NE band. All the negative residual anomalies in the southern partof the area may be due the So’o granitic rocks, which have a low density con-trast with respect to the surrounding rocks in the basement (Mbom Abane,1997; Tadjou et al., 2004); the NE negative band may be associated to Pan Afri-can formations.
4. Method
To delineate the subsurface structure of the area, we have taken two ap-proaches. These approaches are the Euler method to delineate structures andthe spectral analysis to constrain depth of perturbing body source. Results ofthese methods, together with available geological information, are used tobuild 3D conceptual structural model to help in understanding the subsurfacestructure of the study area.
4.1. Euler deconvolution
The objective of the 3D Euler deconvolution process is to produce a mapshowing the locations and the corresponding depth estimations of geologicsources of magnetic or gravimetric anomalies in a two-dimensional grid (Reidet al., 1990). The calculation of the Euler source points is based on Euler’s ho-
GEOFIZIKA, VOL. 28, NO. 2, 2011, 229–245 235
Figure 5. Residual anomaly map of the study area showing studied profiles (P1, P2 and P3) andselected 3-D density model cross sections (S1 and S2).

mogeneity equation (1) and results in clusters used to constrain the overall ge-ometry of the model. 3D form of Euler’s equation can be defined (Reid et al.,1990) as:
xg
xy
g
yz
g
zg x
g
xy
g
yz
g
zb
¶+ + + = + + +h h0 0 0 (1)
where
g
x,
g
yand
g
zare the derivatives of the field in the x, y, and z directions;
b is the base level of the field. h is the structural index value that needs to bechosen according to a prior knowledge of the source geometry. By consideringfour or more neighbouring observations at a time (an operated window),source location (x0, y0, and z0) and b can be computed by solving a linearsystem of equations generated from equation (1). Then by moving the operatedwindow from one location to the next over the anomaly, multiple solutions forthe same source are obtained.
4.2. Power spectrum analysis
Power spectrum analysis was carried out through 2D Fast Fourier Trans-formation to estimate depths for the structures which cause the measuredanomaly. According to this method, as described by Spector and Grant (1970),the depth of a perturbing body source is obtained from the negative slope ofthe linear relationship between the logarithmic power spectrum and the wave-number of the gravity field.
4.3. 3D modeling and inversion
For three-dimensional gravity modelling and inversion, we used the inter-active computer program Grablox by Pirttijärvi (2004) based on a 3D blockmodel. The program Grablox uses two major inversion methods, namely, sin-gular value decomposition (SVD) and Occam inversion (Hjelt, 1992). In eachmethod three possible ways to parameterise the model (height, density andheight + density inversions) are available. As gravity anomalies result fromthe sum of all the gravity effects in the subsurface, gravity data inversion hasa non-unique solution (e.g. Skeels, 1947; Chakraborty and Agarwal, 1992;Strykowski, 1998). The way to reduce the instability and to guarantee theuniqueness of the solution is to integrate geological and geophysical con-straints into the forward modeling. The geological constraints (density values)used for the study area were determined from the density values published insome recent works (Mbom Abane, 1997; Tadjou et al., 2004). Geophysical con-straining focused on direct interpretation of the gravity field by Euler decon-volution and power spectrum analysis results. A starting model was built upby approximate the region by 8 km ´ 8 km ´ 1 km blocks. The initial densitydistribution was progressively changed by means of a trial-and-error proce-
236 C. A. BASSEKA ET AL.: SUBSURFACE STRUCTURAL MAPPING USING GRAVITY DATA

dure using Grablox program to compute the Bouguer anomaly of the modeland to compare it to the observed Bouguer anomaly. When the best fitting be-tween the observed and calculated gravity was made as good as possible, inver-sion was carried. The objective of the 3-D gravity inversion is to optimize thedensity of the minor blocks so that the difference between the measured andthe computed data is minimized. The Grablox program uses a density inver-sion method based on the old SVD based algorithm.
5. Results and discussion
5.1. Euler method
In this study, we have applied upward continuation with a distance of0.5 km as a smoothing filter implemented to reduce the effect of noise and en-hance signal to noise ratio of the observed data. We are seeking the gravime-tric contacts that may delineate the basement in the study area. In the Eulermethod, the structural index must be assumed as prior information. Thomp-son (1982) and Reid et al. (1990) showed that the optimum structural indexusually yields the tightest clustering of the solutions. Therefore, we have as-signed a value of 1.0 as a structural index to locate the possible gravimetriccontacts. For this study, we used an overlapping moving window of 2.5 km by2.5 km for Euler depth estimation. Figure 6 shows the Euler source locationswith circles coloured by the estimated depth values.
GEOFIZIKA, VOL. 28, NO. 2, 2011, 229–245 237
Figure 6. Euler solutions from the residual gravity data.
It is noted that the solutions are generally well clustered. In the northernarea, the dense clustering of solutions is observed along the rims of the short--wavelength anomalies, suggesting that it should be associated with small-scale,structural deformation. The basement lineaments associated with positiveanomalies in this region represent a combination of NW–SE pattern with amore complex arcuate lineaments style. Such lineaments could be created bycrustal faulting during the Pan-African orogeny and could correspond to deep--seated basement structures related to the inferred tectonic boundary separat-ing the Craton and the mobile belt. The two negative anomalies south-westand north-east show clustering of solution predominantly in the NE–SW andNW–SE directions respectively. These structures could be related to faultingassociated with the put in place of granitic rocks in the upper brittle crust. Inthe southern area, the map shows clustering of predominantly NE–SW andNW–SE directions respectively in the south-west and south-east regions.
The brands of anomalies in the north-eastern and south-western parts ofthe study area are not showing significant solution clusters because of thepoor data coverage in these regions.
5.2. Power spectrum analysis
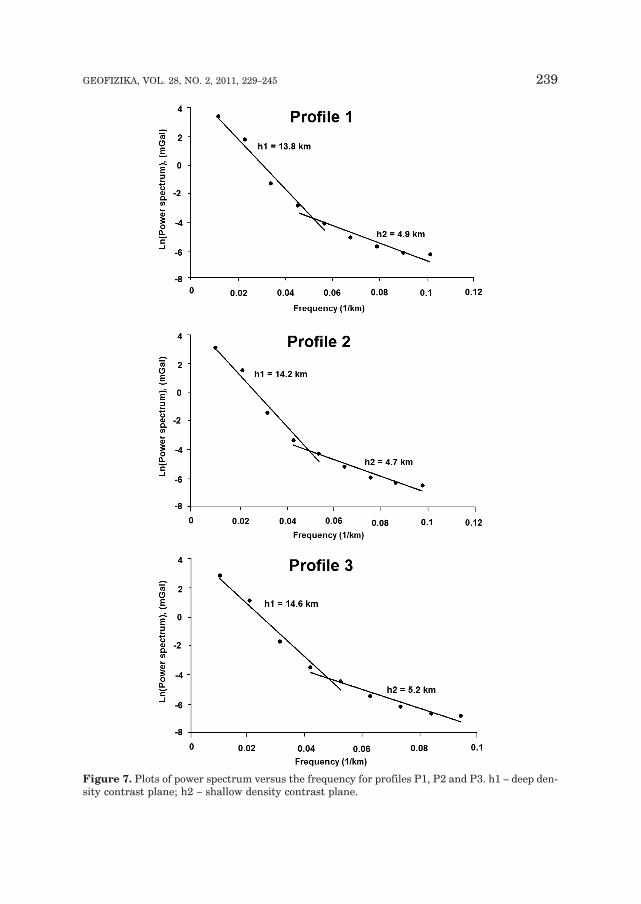
We put the main focus of the spectral analysis on the constraining of thedepth of perturbing bodies responsible of the northern positive anomalies. In-deed, the source of these causing masses is not yet clear. Two profiles (P1, P2)were chosen according to the principal directions of the northern positiveanomalies. Results show two tendencies for the correlation between energyand wavenumber (Figure 7). The mean depth estimates for the deepest discon-tinuities obtained for profiles P1 and P2 13.8 km, 14.2 km and respectively.
These depths may be interpreted as inter-basement density variations as-sociated with the northern margin of the Congo craton, or the upflit of the up-per mantle in the northern part of the area. These results are consistent withthose obtained by Nnange et al. (2000) who determined a major density dis-continuity in the crust beneath the Congo craton area at depth 13 ± 1 km us-ing spectral analysis of new gravity data in Cameroon. The shallowest depthsobtained for the different profiles are 4.9 km, 4.7 km. These depths can be in-terpreted as mean depths of bodies responsible for the observed positive grav-ity anomalies in the northern part of the area.
5.3. 3D modeling and inversion
We put the main focus of the modeling on the shallower structures. The3D modelling and inversion results are particularly informative for the struc-ture of the study area. The model obtained is shown in two vertical sections(S1 and S2) trending N–S (Figures 8 and 9).
The main features modeled beneath the region in the southern part arelower density bodies (1) with densities ranging from 2600 kg/m3 to 2650 kg/m3.
238 C. A. BASSEKA ET AL.: SUBSURFACE STRUCTURAL MAPPING USING GRAVITY DATA
GEOFIZIKA, VOL. 28, NO. 2, 2011, 229–245 239
Figure 7. Plots of power spectrum versus the frequency for profiles P1, P2 and P3. h1 – deep den-sity contrast plane; h2 – shallow density contrast plane.

These bodies are correlated to granitic intrusion in the upper crust whichcan reach 5 km and 7 km for sections S1 and S2 respectively. Such bodies mayrepresent granitic magma intrusion along fractures in the upper, brittle, partof the crust. The negative Bouguer anomalies observed over the entire regioncan thus be attributed to the thickness of the crust associated with a graniticintrusion with a low density contrast beneath the center of the region. To-wards the south, a body with densities between 2800 kg/m3 and 2900 kg/m3
was modeled as a basement high extended laterally beneath the So’o granites.
240 C. A. BASSEKA ET AL.: SUBSURFACE STRUCTURAL MAPPING USING GRAVITY DATA
Figure 8. 3D density model cross section (S1). (1) So’o granites; (2) Charnockites; (3) Pan-Africanformations; (4) Deep structures in Pan-African belt. In the upper box are shown the measured andcalculated gravity anomalies.

Its structure follows the trend of Bouguer gravity high in the southern part ofgravity maps and represents charnockite formations. Pan-African formations(3) with densities between 2650 kg/m3 and 2800 kg/m3 outcrop in the northernborder of the model; these formations overlay So’o granites.
Constrained by Euler deconvolution source points obtained for this workas well as the spectral analysis results, high-density bodies were modeled be-neath the Pan-African formations. A density ranging of 2900–3000 kg/m3 wascalculated through inversion and assigned to the given body resulting on a
GEOFIZIKA, VOL. 28, NO. 2, 2011, 229–245 241
Figure 9. 3D density model cross section (S2). (1) So’o granites; (2) Charnockites; (3) Pan-Africanformations; (4) Deep structures in Pan-African belt. In the upper box are shown the measured andcalculated gravity anomalies.

better fit between measured and calculated gravity. The presence of such ma-terial at depths of about 5 km may represent high density heterogeneities inthe upper crust brought on by the effects of the Pan-African collision. Theseeffects may be comprised of an important mantle-crust interaction at the vi-cinity of the northern edge of the Congo craton. The basement high marks theboundary between these two structural units. These bodies thus materialisethe suture zone and can be interpreted as granulites rocks to have been put inplace at the root of the collision zone. The proposed model put into evidence inthe northern margin of the Congo craton a deep structure corresponding to aclassical model of collision suture as has been suggested for the western mar-gin of the West-African craton and Pan-African belt (Lesquier and Louis,1982; Bonvalot et al., 1991).
6. Conclusion
In this paper, we attempted to give a new insight on the structural settingof the northern edge of the Congo craton in south Cameroon area. Two gen-eral observations were made concerning gravity anomalies within and at theboundaries of the Congo craton: firstly, anomalies within the craton area arenegative relative to those in the adjacent zones; secondly, various anomalies areseparated by high gravity gradients, which suggest major fault zones along theboundaries. Based in these observations, the zone is probably a subsided orrifted area in which the subsidence might have been accompanied by intrusionof granitic bodies with assigned density in the range 2600–2650 kg/m3 andwith thicknesses reaching 7 km. The geophysical study suggests that the deepstructure of the northern margin of the Congo craton is a product of an activecollision margin; this collision has provoked considerable overthrusting of thePan-African formations onto the Congo craton formations.
References
Abdelsalam, M. G., Liégeois, J. P. and Stern, R. J. (2002): The Saharan Metacraton, J. Afr. Earth
Sci., 34, 119–136, DOI: 10.1016/S0899-5362(02)00013-1.Albouy, Y. and Godivier, R. (1981): Cartes gravimétriques de la République Centrafricaine,
ORSTOM, Paris, 80 pp.Basseka, C. A. (2002): Position tectonique, caractéristiques géophysiques et géochimiques des
complexes précambriens au Sud-Cameroun, Thèse de Doctorat / PhD Thesis, Univ. Russe del’Amitié des Peuples, 119 pp.
Bonvalot, S., Villeneuve, M. and Albouy, Y. (1991): Interprétation gravimétrique de la Sierra-Le-one: Mise en evidence d’une suture de collision dans la chaîne panafricaine des Rokelides, C. R.
Acad. Sci. Paris, 312, 841–848.Briggs, I. C. (1974): Machine contouring using minimum curvature, Geophysics, 39, 39–48.Castaing, C., Feybesse, J. L., Thieblemont, D., Triboulet, C. and Chèvremont, P. (1994): Paleogeo-
graphical reconstructions of the Pan-African/Brasiliano orogen: closure of an oceanic domainor intracontinental convergence between major blocks?, Precambrian Res., 67, 327–344, DOI:10.1016/0301-9268(94)90095-7.
242 C. A. BASSEKA ET AL.: SUBSURFACE STRUCTURAL MAPPING USING GRAVITY DATA
Chakraborty, K. and Agarwal, B. N. P. (1992): Mapping of crustal discontinuities by wavelenghtfiltering of the gravity field, Geophys. Prosp., 40, 801–822, DOI: 10.1111/j.1365-2478.1992.tb00553.x.
Collignon, F. (1968): Gravimetrie et reconnaissance de la République Fédérale du Cameroun,ORSTOM, Paris, 35 pp.
Crenn, Y. (1957): Mesures gravimétriques et magnétiques dans la partie centrale de l’A.O.F. inter-pretation geologique, Publi. Serie Geophys. ORSTOM, Paris, 43 pp.
Delhal, J. and Ledent, L. (1975): Données géochronologiques sur le complexe calcomagnésien dusud Cameroun. Musée Royal d’Afrique Centrale, Belgique. Rapp. Annuel, 71–75.
Hedberg, J. D. (1969): A geological analysis of Cameroon trend, PhD Thesis, Princeton University,New York, USA, 154 pp.
Hjelt, S. E. (1992): Pragmatic inversion of geophysical data. Springer-Verlag, Germany, 262 pp.
Inoue, H. (1986): A least-squares smooth fitting for irregularity spaced data: finite element ap-proach using the cubic B-spline basics, Geophysics, 51, 2051–2060.
Kennedy, W. Q. (1964): The structural differentiation of Africa in the Pan-African (±500 millionyears) tectonic episode, in 8th Annual Report, Research Institute of African Geology, Universityof Leeds, UK, 48–49.
Lasserre, M. and Soba, D. (1976): Age Libérien des granodiorites et des gneiss à pyroxènes duCameroun Meridional, Bull. BRGM, Orleans, 4, 17–32.
Lesquier, A. and Louis, P. (1982): Anomalies gravimetriques et collision continentale au Précam-brien, Geoexploration, 20, 275–293.
Manguelle-Dicoum, E., Bokosah, A. S. and Kwende-Mbanwi, T. E. (1992): Geophysical evidencefor a major Precambrian schist – granite boundary in southern Cameroon, Tectonophysics,205, 437–446, DOI: 10.1016/0040-1951(92)90447-E.
Maurizot, P., Abessolo, A., Feybesse, J. L., Johan, V. and Lecomte, P. (1985): Etude et prospectionminiere du sud-ouest Cameroun. Synthese des travaux de 1978 à 1985, Rapp. BRGM, Orleans,85 CMR 066, 274 pp.
Mbom-Abane, S. (1997): Investigations géophysiques en bordure du craton du Congo (régiond’Abong Mbang / Akonolinga, Cameroun) et implications structurales, Thèse de doctorat,Université de Yaoundé I, Cameroun, 180 pp.
Nédélec, A., Macaudière, J., Nzenti, J. and Barbey, P. (1986): Évolution structurale et méta-morphique des scihtes de Mbalmayo (Cameroun). Implications pour la structure de la zone mo-bile panafricaine d’Afrique centrale au contact du craton du Congo, C. R. Acad. Sci. Paris, 303,75–80.
Nnange, J. M., Ngako, V., Fairhead, J. D. and May Ebinger, C. J. D. A. (2000): Depths to density dis-continuities beneath the Adamawa Plateau region, Central Africa, from spectral analyses of newand existing gravity data, J. Afr. Earth Sci., 30, 887–901, DOI: 10.1016/S0899-5362(00)00058-0.
Nzenti, J. P., Barbey, P., Jegouzo, P. and Moreau, C. (1984): Un nouvel exemple de ceinturegranulitique dans une chaîne protérozoïque de collision: Les migmatites de Yaoundé au Came-roun, C. R. Acad. Sci. Paris, 299, 1197–1199.
Okereke, C. S. (1984): A gravity study of the lithospheric structure beneath the West Africa riftsystem in Nigeria and Cameroon, PhD Thesis, University of Leeds, UK, 272 pp.
Pirttijärvi, M. (2004): GRABLOX: Gravity interpretation and modelling software based on 3Dblock model. Version 1.5a. User’s guide. Archive Report, Q 16.2/2004/2, Geological Survey ofFinland, 39 pp.
Penaye, J., Toteu, S. F., Van Schmus, W. R. and Nzenti, J. P. (1993): U–Pb and Sm–Nd prelimi-nary geochronologic data on the Yaoundé series, Cameroon: Re-interpretation of the granuliticrocks as the suture of a collision in the “Centrafrican belt”, C. R. Acad. Sci. Paris, 317,789–794.
GEOFIZIKA, VOL. 28, NO. 2, 2011, 229–245 243

Poidevin, J. L. (1983): La tectonique Pan-Africaine à la bordure nord du craton congolais: l’oroge-nèse des Oubanguides, in Colloque on the African geology, 12, Musée Royal de l’AfriqueCentrale, Tervuren, Belgium. Abstract, 75.
Reid, A. B., Allsop, J. M., Granser, H., Millett, A. J. and Somerton., I. W. (1990): Magnetic inter-pretation in three dimensions using Euler deconvolution, Geophysics, 55, 80–91, DOI: 10.1190/1.1442774.
Shandini, N. Y., Tadjou, J. M., Tabod, C. T. and Fairhead, J. D. (2010): Gravity data interpretationin the northern edge of the Congo craton, South-Cameroon, Anuário do Instituto de Geociên-
cias, 33(1), 73–82.
Shang, C. K., Satir, M, Siebel, W., Taubald, H., Nsifa, N. E., Westphal, M. and Reitter, E. (2001):Genesis of K-rich granitoids in Sangmelima region, Ntem complex (Congo craton), Cameroon,Terra Nostra, 5, 60–63.
Skeels, D. C. (1947): Ambiguity in gravity interpretation, Geophysics, 12, 43–56.
Spector, A. and Grant, F. S. (1970): Statistical models for interpreting aeromagnetic data, Geo-
physics, 35, 293–302, DOI: 10.1190/1.1440092.
Strykowski, G. (1998): Experiences with a detailed estimation of the mass density contrasts and ofthe regional gravity field using geometrical information from seismograms, Phys. Chem. Earth,23, 845–856, DOI: 10.1016/S0079-1946(98)00104-9.
Tadjou, J. M.; Manguelle-Dicoum, E.; Tabod, C. T., Nouayou, R., Kamguia, J., Njandjock, N. P.and Ndougsa, M. T. (2004): Gravity modelling along the northern margin of the Congo craton,South-Cameroon, J. Cameroon Acad. Sci., 4, 51–60.
Tadjou, J. M., Nouayou, R., Kamguia, J., Kande, H. L. and Manguelle Dicoum, E. (2009): Gravityanalysis of the boundary between the Congo craton and the Pan-African belt of Cameroon,Austrian J. Earth Sci., 102, 71–79.
Tchameni, R., Mezger, K., Nsifa, E. N. and Pouclet, A. (2000): Neoarchaean crustal evolution inthe Congo Craton: Evidence from K-rich granitoids of the Ntem complex, southern Cameroon,J. Afr. Earth Sci., 30, 133–147, DOI: 10.1016/S0899-5362(00)00012-9.
Tchameni, R., Pouclet, A., Mezger, K., Nsifa, N. E. and Vicat, J. P. (2004): Monozircon and Sm-Ndwhole rock ages from the Ebolowa greenstone belts: Evidence for the terranes older than 2.9Ga in the Ntem complex (Congo craton, South Cameroon), J. Cameroon Acad. Sci. 4, 213–224.
Thompson, D. T. (1982): EULDPH: A new technique for making computer-assisted depth esti-mates from magnetic data, Geophysics, 47, 31-37.
Trompette, R. (1994): Geology of Western Gondwana (2000–500 Ma): Pan-African–Braziliano ag-
gregation of South America and Africa. Balkema, Rotterdam, 350 pp.
Toteu, S. F., Van Schmus, W. R., Penaye, J. and Nyobé, J. B. (1994): U-Pb and Sm-Nd evidence forEburnian and Pan-African high-grade metamorphism in cratonic rocks of southern Cameroon,Precambrian Res., 67, 321–347, DOI: 10.1016/0301-9268(94)90014-0.
Toteu, S. F., Van Schmus, W. R., Penaye, J. and Michard, A. (2001): New U-Pb, and Sm-Nd datafrom north-central Cameroon and its bearing on the pre-Pan African history of central Africa,Precambrian Res., 108, 45–73, DOI: 10.1016/S0301-9268(00)00149-2.
Toteu, S. F., Penaye, J. and Poudjom, Y. D. (2004): Geodynamic evolution of the Pan-African beltin central Africa with special reference to Cameroon, Can. J. Earth Sci., 41, 73–85, DOI:10.1139/e03-079.
Toteu, S. F., Penaye, J., Deloule, E., Van Schmus, W. R. and Tchameni, R. (2006): Diachronousevolution of volcano-sedimentary basins north of the Congo craton: Insights from U-Pb ionmicroprobe dating of zircons from the Poli, Lom and Yaoundé groups (Cameroon), J. Afr. Earth
Sci., 44, 428–442, DOI: 10.1016/j.jafrearsci.2005.11.011.
Toteu, S., Yongue Fouateu, R., Penaye, J., Seme Mouangue, A. C., Van Schmus, W. R., Tchakounte,J., Deloule, E. and Stendal, H. (2007): Reply to the comment by Mvondo et al. on “U-Pb datingof plutonic rocks involved in the nappe tectonics in southern Cameroon: Consequence for the
244 C. A. BASSEKA ET AL.: SUBSURFACE STRUCTURAL MAPPING USING GRAVITY DATA

Pan-African orogenic evolution of the central African fold belt by Toteu et al., 2006” (Journalof African Earth Sciences, 44, 479-493), J. Afr. Earth Sci., 48, 53–54, DOI: 10.1016/j.jafrearsci.2007.03.003.
Vicat, J.-P., Léger, J.-M., Nsifa, E., Piguet, P., Nzenti, J.-P., Tchameni, R. and Pouclet, A. (1996):Distinction, au sein du craton congolais du Sud-Ouest du Cameroun, de deux épisodes dolériti-ques initiant les cycles orogéniques éburnéen (Paléoprotérozoïque) et panafricain (Néoproté-rozoïque), C. R. Acad. Sci. Paris, 323 IIa, 575–582.
SA@ETAK
Dubinsko kartiranje na temelju gravimetrijskih podataka
na podru~ju sjevernog ruba Kongo kratona, ju`ni Kamerun
Charles Antoine Basseka, Yves Shandini i Jean Marie Tadjou
U ovom radu se pomo}u gravimetrijskih podataka procjenjivala struktura kore udijelu sjevernog ruba kratona Konga u ju`nom Kamerunu, smje{tenom izme|u 2° 30' i4° 30' N te 11° i 13° E. U svrhu kvantitativne interpretacije uzro~nika anomalije na-pravljen je 3D model gusto}a gornje kore na temelju modeliranja i inverzije. Rezultatiinverzije su ograni~eni povr{inskim geolo{kim podacima i rezultatima Eulerove dekon-volucije i spektralne analize. Kartu Bouguerovih anomalija istra`ivanog podru~ja ka-rakterizira izdu`ena negativna gravimetrijska anomalija pru`anja SW–NE, koja je uz-rokovana uru{enom strukturom povezanom s intruzijom granita u sredi{njem dijelupodru~ja. Razli~ite pozitivne anomalije povezane su s izdizanjem Panafri~ke podloge usjevernom dijelu, a ome|ene su velikim gradijentom uzrokovanim tektonskom grani-com izme|u kratona Konga i Panafri~kog pojasa. Rezultati pokazuju da su tektonskestrukture koje uzrokuju opa`ene gravimetrijske anomalije (na istra`ivanom podru~ju)nastale tijekom kolizije (sudara) kontinenata.
Corresponding author’s address: Charles Antoine Basseka, University of Douala, Faculty of Sciences Depart-ment of Earth Sciences, P. O. Box 24 157 Douala, Cameroon, e-mail: [email protected]
GEOFIZIKA, VOL. 28, NO. 2, 2011, 229–245 245


![Mapping Subsurface Alteration Using Gravity and · PDF fileMapping Subsurface Alteration Using Gravity and Magnetic Inversion Models Williams, N. [1], Dipple, G. [1] _____ 1. Mineral](https://img.dokumen.tips/doc/110x75/5abe32647f8b9ad8278cdba9/mapping-subsurface-alteration-using-gravity-and-subsurface-alteration-using.jpg)