Embed Size (px)
Citation preview
Working togetherfor a safer world
Subsea Expo – Assessing “The Domino Effect” through
UKCS Pipeline Network Modelling
Christina Smitton – Lloyd’s Register
Development Engineering Team Lead
Subsea Expo January 2017
Assessing ‘The Domino Effect’ through UKCS
Pipeline Network Modelling
• What is the Domino Effect?
• Pipeline network modelling
• The Network
• Model Inputs & Outputs
• Interesting findings
• Future use

Subsea Expo January 2017
Understanding The Domino Effect
Despite significant cost reductions, nearly half of the UKCS
Oil fields are likely to be operating at a loss in 2016 at
prevailing prices. While this represents about a sixth of total
oil production, these fields collectively provide a significant
proportion of the infrastructure used to transport oil and gas
ashore. Were a number of these fields to cease production,
their interconnectivity would mean many more could become
sub-commercial, known as the ‘domino effect’
Oil & Gas UK Activity Survey 2016

Subsea Expo January 2017
Field A OPEX
Understanding The Domino Effect
Host OPEX Pipeline OPEX Terminal OPEXTotal Field
OPEX
Field A
Field B
Field C
$ / bbl or p/therm
% of total cost
based on throughput
Cost share Basis or Tariff Basis

Subsea Expo January 2017
Understanding The Domino Effect
Export pipeline to
terminal
Area A
Area BArea C As one field ceases production,
knock on effect on immediate
surrounding fields………
………. and potential effect on all
fields in that have connectivity
to the same system

Subsea Expo January 2017
The Domino Effect in Action
LOGGS system COP
planned for end of 2018
Knock-on effect for Pickerill
and Murdoch (CMS)
systems – premature
closure potential

Subsea Expo January 2017
Pipeline Network Modelling
• Why?
- Need to understand longevity of export routes
- Investors who may be purchasing fields
- Any potential new field coming online
- Operators understanding of when change to cost share may occur
• What purpose?
• Infrastructure Code of Practice
– valid for the next five years
• Great uncertainty beyond this point
• LR Network Model serves this longer
term view and highlights where
potential risks may exist

Subsea Expo January 2017
The Network
• 4 key networks
• West of Shetland
• Northern and Central NS
• Southern North Sea
• Irish Sea
• ~ 70 pipeline systems come onshore to UK
• ~ 320 fields currently in production
• Fields produce to oil and gas pipelines –
both considered
• Various cross border connections also
included

Subsea Expo January 2017
The Model Inputs
Subsea Expo January 2017
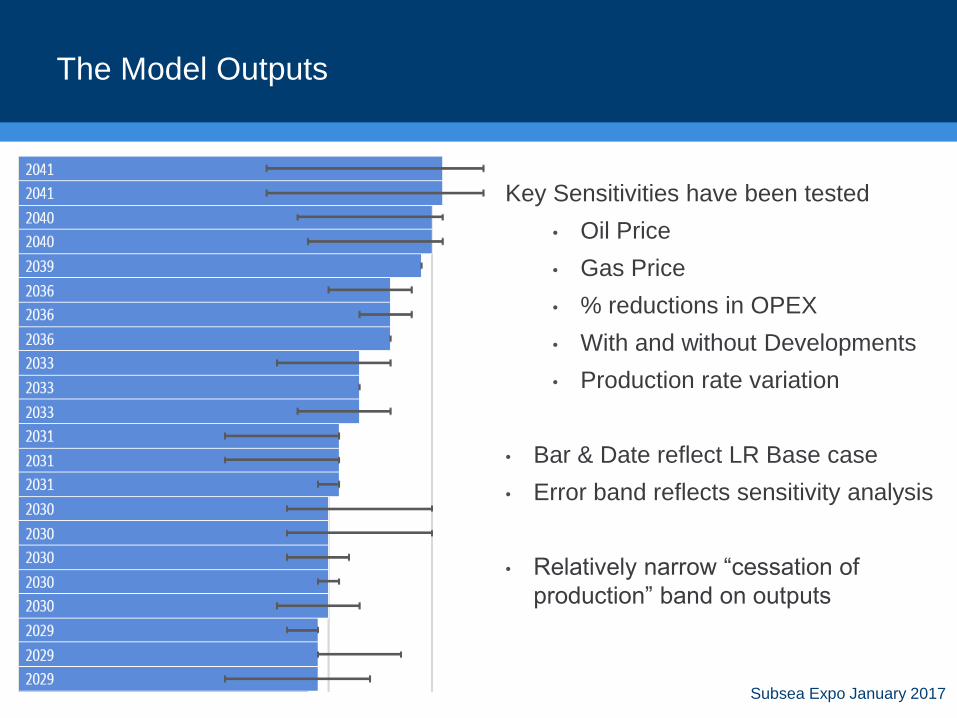
The Model Outputs
Key Sensitivities have been tested
• Oil Price
• Gas Price
• % reductions in OPEX
• With and without Developments
• Production rate variation
• Bar & Date reflect LR Base case
• Error band reflects sensitivity analysis
• Relatively narrow “cessation of
production” band on outputs

Subsea Expo January 2017
Future Use
Field development planning
• Identifying capacity within pipelines
• Determining COP dates for major infrastructure
• Helping to chose which evacuation route is more robust in terms of future production
• Identifying clustering opportunities for small pool opportunities
Prolonging Critical Infrastructure
• Identifying critical infrastructure hubs
• Identifying which aspects of OPEX will help prolong
production
• Rationalising infrastructure
Decommissioning
• Identifying decommissioning
activity & spend
Working togetherfor a safer world
Christina Smitton
Development Engineering Team Lead
Lloyd’s Register
Questions?