Embed Size (px)
Citation preview

145
4
Introduction
Mexico has experienced two major macroeconomic crises in the last
two decades. The 1994–95 Tequila Crisis and the 2008–09 global finan-
cial crisis had important implications for the functioning of subna-
tional debt markets. In the Tequila Crisis, the macroeconomic shock
affected subnationals through higher interest rates on their debt and the
simultaneous reduction in their federal transfers. These shocks made
their debt unsustainable, and the federal government intervened with
an ambitious restructuring program. In 2009, the global crisis did not
affect interest rates in Mexico, but the slowdown in economic activity
and the decline in the price of oil reduced federal transfers to subnation-
als considerably, dramatically affecting their repayment capacity. In this
context, an innovative mechanism was designed to smooth the shock
and ensure the sustainability of local public finances. These episodes
hold important lessons for policy makers interested in designing debt
management mechanisms for subnational debt in developing countries.
They also shed light on the behavior of subnational debt markets in
periods of stress, and policy responses that can be used in dealing with
recovery during a crisis.
Ernesto Revilla
Subnational Debt Management in Mexico: A Tale of Two Crises

146 Until Debt Do Us Part
This chapter contributes to the study of the Mexican Fiscal Federal-
ism Framework in Mexico. While Giugale and Webb (2000) and Revilla
(2012) presented general overviews of Mexican intergovernmental rela-
tions, this chapter is part of a new wave of efforts to study aspects of
intergovernmental fiscal relations in the country. In particular, it adds
to the few studies that have been done on subnational debt in Mexico.
Among these, Giugale, Korobow, and Webb (2000) describe the “new
subnational regulatory framework in Mexico,” in place since 2000. In
addition, Hernández, Díaz-Cayeros, and Gamboa (2002a) study the
determinants and consequences of the 1995 bailout, while Giugale,
Hernández, and Oliveira (2000) give an overall overview of the subna-
tional debt market at the dawn of the century.
This chapter more closely relates to the literature on subnational
debt restructuring, as in Liu and Waibel (2009); Prasad, Goyal, and
Prakash (2004); and Ter-Minassian and Craig (1997). In particular, it
adds a developing country dimension to those studies of subnational
debt markets after the global crises, such as the ones in Canuto and Liu
(2010a, 2010b). Together with the other chapters in this volume, this
chapter sheds light on the very difficult questions and dilemmas that
policy makers face when dealing with subnational debt markets after
macroeconomic crises, especially in developing countries.
The chapter is structured as follows. Section two describes the
Mexican fiscal federalism framework. Section three describes the
restructuring of subnational debt after the Tequila Crisis. Section four
describes the response after the global crisis. Section five discusses the
similarities, differences, lessons, and conclusions for subnational debt
management.
The Fiscal Federalism Framework in Mexico
All intergovernmental fiscal relations systems are different and con-
strained by the local culture, politics, and the economics of the institu-
tional setup. Mexico’s fiscal federalism is defined by a very large vertical
imbalance, an enormous dependence of subnationals on federal trans-
fers, and on a low level of subnational debt, all of which influenced the
objectives and constraints of the policies implemented during the two
crises discussed in this chapter.

Subnational Debt Management in Mexico: A Tale of Two Crises 147
Mexico is a federal country divided into 31 sovereign states and one
federal district. Each state is composed of municipalities, which are the
basic political unit and which have some sovereign autonomy over their
political and fiscal development. Being political subdivisions of states,
municipalities are extremely heterogeneous in their level of develop-
ment.1 The fiscal federalism framework in this three-tier government
structure consists of the set of laws, rules, and institutions that allocate
spending and tax responsibilities, and the transfers and the institutional
framework for subnational debt.
A salient feature of Mexico’s fiscal federalism framework is the strong
dependence of state and municipality finances on federal transfers
(see, for example, Giugale and Webb [2000], Revilla [2012], and refer-
ences therein). On average, the share of resources from federal sources
accounts for 85 percent of total revenues for subnationals. This strong
dependence on federal resources has remained mostly constant over
time. This feature of Mexico’s federalism is the main characteristic that
determines the politics and economics of current and future reforms on
the subject.
Table 4.1 shows the composition of the annual flow of resources
to subnationals in Mexico. As can be seen, around 85 percent of rev-
enues for states and municipalities come from federal transfers, around
11 percent from own-source revenues, and borrowing accounts for only
5 percent of annual flow, on average. Federal transfers can be grouped
into three main channels: (a) earmarked transfers; (b) nonearmarked
transfers; and (c) a smaller, but growing, component of new transfers
for specific purposes and infrastructure.2
Nonearmarked transfers, called participaciones, are the biggest item
in states’ budgets and the biggest line item in the federal budget. They
consist of a set of funds that vary in size and composition. The biggest
one accounts for 86 percent of the total and is called the General Par-
ticipation Fund (Fondo General de Participaciones). It is calculated as
20 percent of a federal pool of revenues that are shared3 and distrib-
uted according to a formula that correlates per capita transfers to the
level of economic activity (measured by growth in states’ gross domes-
tic product [GDP]) while giving incentives to increase own-source
revenue.4 The rest of the funds are smaller and include a fund for
municipalities, one to give incentives to improve tax administration

148 Until Debt Do Us Part
Table 4.1 Subnationals’a Resources in Mexico billion pesos 2006–10
2006 2007 2008 2009 2010 Compositionb (%) As % of GDPb
Total resources 895 911 1,080 1,100 1,169 100 8.9
Federal transfers 785 781 943 936 973 83 7.4
Nonearmarked transfers (participaciones) 329 333 423 421 437 37 3.3
Earmarked transfers (aportaciones)c 388 379 420 439 461 39 3.5
Otherd 68 70 99 76 74 6 0.6
Convenios 44 56 73 76 74 6 0.6
Excedentes 24 13 26 — — 0 0.0
Own-source revenue 93 103 120 116 133 11 1.0
Financinge 17 26 17 49 63 5 0.5
Memorandum items
Federal budget 2,264 2,486 2,861 2,817 2,960 100 23
Federal nonoil revenue 1,015 1,205 1,358 1,508 1,492 50 11
Sources: Ministry of Finance; Mexico and states’ public accounts.Note: — = not available, GDP = gross domestic product.a. States and municipalities.b. Values correspond to 2010.c. Includes resources for education expenses in the Federal District, where education has not been decentralized.d. Includes special decentralization agreements and excess revenue surplus.e. Corresponds to registered debt with the Ministry of Finance and includes all debt approved by local legislatures; it does
not include short-term loans (for cash management) or contingent liabilities (that is, pensions).
at the local level, compensatory funds for states where oil is extracted,
and a redistributive fund for the 10 poorest states. For a complete
description, see table 4A.1.
Earmarked transfers, called aportaciones, consist of eight funds and
are itemized in “Ramo 33”5 of the federal budget. There are special
funds for education, health, social development, and public security.
The biggest one is the Fund for Basic Education, which accounts for
59 percent of the total. This fund, and the Fund for Health Services
(Fondo de Aportaciones para los Servicios de Salud), is meant to cover
the wage bill for paying teachers and medical professionals who were
transferred to states in the 1990s with the decentralization of education
and health. There is widespread agreement that the large amount of
money spent through these funds has not contributed to more efficient

Subnational Debt Management in Mexico: A Tale of Two Crises 149
service delivery, that the assignments among states are extremely
inefficient, and that there is some level of corruption in the spending
of these resources (see IMCO 2010). For a complete description of ear-
marked transfers, see table 4A.2.
Regarding own-source revenues of subnationals in Mexico, the first
salient fact is the low level of own tax effort by states and municipalities.
The level of subnational own revenue is low by international standards
and relative to its potential. The main tax handle of municipalities is the
property tax. Mexican municipalities collect 0.2 percent of GDP. This fig-
ure is the lowest in Latin America (Bolivia collects 0.3 percent of GDP,
Brazil 0.7 percent, Colombia 1.3 percent, and Argentina 1.7 percent)
and one of the lowest in the world (the Organisation for Economic Co-
operation and Development average is 2 percent of GDP) (ECLAC 2009;
OECD 2010). In practical terms, only the Federal District and some big
municipalities collect the property tax efficiently, and the vast majority of
local governments in the country do not collect it at all. This remains one
of the biggest challenges for the Mexican fiscal federalism framework.6
For states, the main taxes are the payroll tax7 and the administra-
tion of federal taxes on vehicles and gasoline, from which the states
are allowed to keep the revenue. States have other local taxes such as a
lodging tax (important in states with high rates of tourism), taxes on
the use of old motor vehicles, and taxes on local lotteries and games.
However, the revenue collected from these taxes does not represent sig-
nificant resources. For details on states’ local revenues in Mexico, see
table 4A.3.
Subnational debt in Mexico is low by all accounts and relative to inter-
national standards; the stock of subnational debt in Mexico accounts
for 79 percent of annual nonearmarked transfers, or 2.9 percent of
GDP. Figure 4.1 shows the stock of debt for subnationals in Mexico in
2011. Although subnational debt as a share of nonearmarked transfers
increased from 50.7 percent in 2008 to 79.2 percent in 2011—the debt
as share of GDP increased from 1.7 percent in 2008 to 2.9 percent in
2011—subnational debt in Mexico is low when comparing with coun-
tries such as Brazil, China, and India.8
The debt in figure 4.1 includes all direct liabilities that are incurred
by subnationals that are registered with the Federal Ministry of Finance
and that were approved by their local legislatures. It does not include

150 Until Debt Do Us Part
Figure 4.1 Subnational Debt in Mexico, by State, 2011
Source: Ministry of Finance, Mexico.Note: GDP = gross domestic product. Data include municipal debt.
Average: 79 percent
0
50
100
150
200
250
Perc
ent
300
Coahuila
Quintana R
oo
Nuevo Le
ón
Chihuahua
Nayari
t
Mich
oacán
Sonora
Distrit
o Federa
l
Veracru
z
Baja C
alifo
rniaTo
tal
Jalisc
o
Chiapas
Tamau
lipas
Durango
Colima
Méx
ico
Aguasc
alien
tes
Zacate
cas
Baja C
alifo
rnia
Sur
San Lu
is Po
tosí
Pueb
la
Guanaju
ato
Sinalo
a
Oaxac
a
Morel
os
Hidalgo
Guerrero
Yucatán
Querétar
o
Campec
he
Tabasc
o
Tlaxca
la
a. As a share of nonearmarked transfers
Average: 2.9 percent
Perc
ent
0
1
2
3
4
5
6
7
8
9b. As a share of state’s GDP
Coahuila
Nayari
t
Quintana R
oo
Chiapas
Mich
oacán
Veracru
z
Sonora
Chihuahua
Nuevo Le
ón
Zacate
cas
Méx
ico
Colima
Baja C
alifo
rniaTo
tal
Jalisc
o
Durango
Oaxac
a
Tamau
lipas
Distrit
o Federa
l
Baja C
alifo
rnia
Sur
Aguasc
alien
tes
Pueb
la
Sinalo
a
San Lu
is Po
tosí
Morel
os
Hidalgo
Guerrero
Guanaju
ato
Yucatán
Querétar
o
Tabasc
o
Campec
he
Tlaxca
la

Subnational Debt Management in Mexico: A Tale of Two Crises 151
short-term loans (incurred and paid in full within the fiscal year and
used mostly for cash management), or contingent liabilities such as
pensions or supplier’s credit, both of which can pose risks. If short-
term debt is not officially registered as debt, it could potentially be
used to finance current expenditures. In addition, short-term debt was
exempted from a higher risk rating and the need to establish prudential
reserves. Although state retirement plans represent only 2.3 percent of
total retirement accounts in the country, there is a risk that they might
become unsustainable in the next decade.
There is a great diversity in terms of the structure and financial sus-
tainability of state retirement schemes. A majority of state retirement
plans operate as defined benefit plans, which are, in general, unfunded
liabilities of state governments. There are no recent studies that esti-
mate the amount of these liabilities. However, according to the con-
clusions of a meeting of the National Fiscal Convention (Convención
Nacional Hacendaria), Hewitt Associates estimated that states’ pensions
in 1998 accounted for around 25 percent of GDP. Nearly one-third of
state retirement plans operate as funded defined benefit plans, but only
7 percent of states have defined contribution schemes based on indi-
vidual retirement accounts.
As can be seen in figure 4.1, the stock of subnational debt in Mexico
is only 79 percent of annual nonearmarked transfers, or 2.9 percent of
GDP. At first glance, this low level of debt represents a puzzle from the
point of view of economic theory, given the shocks that subnation-
als faced during the crisis and the need for infrastructure investment.9
Some observers of the Mexican fiscal federalism framework have
concluded that some kind of hidden bailouts must exist in Mexico
simultaneously with incentives for subnationals to rent-seek from the
federation as an instrument to smooth fiscal shocks and close year-end
budgets (see Hernández, Díaz-Cayeros, and Gamboa 2002a, 2002b).
These grants would make debt unnecessary as a mechanism to balance
the fiscal accounts.
Table 4.2 shows the structure of the stock of subnational debt in
Mexico. The total stock of subnational debt is collateralized with federal
transfers or with a future flow of local taxes. That is, no lender gives an
unsecured loan to a subnational in Mexico. Three-quarters of the total
stock of state and municipality debt in Mexico has federal transfers as

152 Until Debt Do Us Part
collateral. The income pledged is usually the nonearmarked transfers,
but some earmarked funds are starting to be used as well.10 As regards
the creditors, private commercial banks hold 51 percent of the debt,
government development banks hold 24 percent, and the rest is place-
ments with the markets (mainly bonds or securitized notes). Since 2005,
this composition has remained almost unchanged.
In Mexico, the institutional framework for subnational debt starts
with the 1917 Constitution, which mandates a “golden rule” for state
and municipal debt: all indebtedness must be used to finance “produc-
tive public investments.” What this means in practice (and whether it
includes modern debt operations such as refinancing or debt buy-
backs) has been the subject of much debate among lawyers, including
the Supreme Court, state treasuries, and investment bankers who advise
subnationals on the flexibility of the constitutional rule.11 The Constitu-
tion also prohibits states and municipalities from borrowing in foreign
currency or from a foreign creditor.12
Below the constitutional level, Mexico’s subnational debt framework
was reformed in 2000. The old framework was based on the concept
of the mandato (mandates). This meant that the federal government
Table 4.2 Subnational Debt Structure in Mexico, 2011 billion pesos, and percentage
Creditor
Collateral
Federal transfersa Own revenue Total % of GDP
Commercial banks 186 15 201 1.5
Development banks 86 6 92 0.7
Securitizations 18 40 58 0.4
Trust funds 8 11 19 0.1
Otherb 19 2 21 0.2
Total 317 74 391 2.9
% of GDP 2.4 0.6 2.9
Source: Ministry of Finance, Mexico.Note: GDP = gross domestic product.a. Includes debt collateralized with nonearmarked transfers (participaciones) and with FAIS and FAFEF, which
are earmarked funds (aportaciones) that may be collateralized; see table 4A.2.b. Includes Sofoles (Limited Purpose Financial Institutions), Sofomes (Multiple Purpose Financial Institutions),
and suppliers.

Subnational Debt Management in Mexico: A Tale of Two Crises 153
acted as a trustee in servicing state debt that had been collateralized
with participaciones.13 What happened in practice was that the mandato
was perceived by the markets as a guarantee by the federal government
on subnational debt. Not surprisingly, as argued in Giugale, Korobow,
and Webb (2000), this perception of a federal bailout created two prob-
lems: (a) banks had the incentive to make loans, since they perceived
them to be risk free; and (b) subnationals also had the expectation of
a bailout since it was not credible that the federal government would
in fact reduce transfers.14 To eliminate these problems, several reforms
were implemented from 1997 to 2000 (for a detailed account of these
reforms, see Guigale, Hernández, and Oliveira [2000]).
The reforms regarding the new regulatory framework for subna-
tional debt, in place since 2000, were based on two main concepts:
an explicit renunciation of federal bailouts and a new system aimed
toward a correct evaluation by lenders of idiosyncratic subna-
tional risk. These objectives were pursued through (a) the elimina-
tion of the mandatos; (b) establishment of a link between the capital
risk weighting of bank loans to subnationals and their credit rating;
(c) and a requirement to register subnational loans with the Minis-
try of Finance, conditional on being current on fiscal transparency
requirements.15
Ten years after the establishment of the new regulatory structure,
it can be said that Mexico’s subnational debt framework is more of a
hybrid between a rules-based and a market-based system. Indeed, it can
be described as a quasi-market-based system that rests on the following
three distinct characteristics.16
The first characteristic is the credible threat of no federal bailout. This
was accomplished with the elimination of the mandato (the instruction
that subnationals gave to the federal government to service their debt
for them, out of their transfers) and the creation of intercepts (which,
in practice, are set up as trust funds established by the subnational and
their creditors).
The second characteristic is the increased transparency of the sub-
national debt market. All collateralized debt must be registered with the
Ministry of Finance (conditional on having been approved by the local
congress, and the state being up-to-date in transparency requirements).
If it is not registered, then the loan is automatically risk weighted by

154 Until Debt Do Us Part
regulators at the penalty rate of 150 percent, which not only raises the
cost of the loan directly but also makes the bank credit committees
reluctant to lend at all. States have found that there is a strong incentive
to register loans that are not legally required to be registered, since this
often results in better credit conditions from the lenders. Therefore, the
Mexican registry of subnational public debt is quite accurate in listing
all outstanding claims.17 This process has resulted in increased transpar-
ency of the Mexican subnational debt market. Thus, the general public
and opposition parties have imposed a certain amount of fiscal disci-
pline on local governments with this mechanism.
The third characteristic that defines the regulatory regime is that
many of the constraints on the market are the result of the pruden-
tial regulation of banks, rather than the result of direct fiscal rules on
subnationals.18 In particular, a capital risk weight is assigned to loans
to subnationals depending on the credit rating of the loan. Therefore,
the pricing of credit should be a function of the creditworthiness of the
state or municipality. Almost all of them now get credit ratings, since
not having a credit rating also leads to the penalty capital weighting of
150 percent.19
The combination of the described rules and mechanisms imple-
mented in Mexico has ensured an orderly and functional subnational
debt market. Notwithstanding the low stock of subnational debt, as
in any comparison among Mexican states, there is a wide heterogene-
ity across states in their indebtedness level, and some states continue to
face fiscal adjustment challenges.20 Nonetheless, the level of subnational
debt does not appear to pose a significant systemic or macroeconomic
problem.
In fact, the relevant policy question might very well be the oppo-
site: is subnational debt in Mexico suboptimal, given increased needs
for development and infrastructure? The answer is beyond the scope of
this chapter. However, the low amount of subnational debt in Mexico
(as a percentage of GDP) is the second salient fact of its fiscal federalism
framework, and frames the policy responses that were taken under the
extreme macroeconomic shocks suffered during the 1994–95 Tequila
Crisis and more recently with the “great recession” of 2008–09. The dif-
ferent policy responses regarding the safeguarding of the subnational
debt market are detailed in the following two sections.

Subnational Debt Management in Mexico: A Tale of Two Crises 155
The 1994–95 Tequila Crisis and the Restructuring of Subnational Debt
For Mexico, 1994 was a disastrous year. It included the assassinations of
the official party’s presidential candidate and of its leader, the rise of an
armed insurrection in the southern state of Chiapas, and the continual
deterioration of foreign investors’ perceptions. With a fixed exchange
rate, these events led to a massive run on foreign reserves. On Decem-
ber 19, 1994, Mexico suffered one of its greatest macroeconomic shocks
in its history when the fixed exchange rate regime was abandoned. In
1995, the GDP dropped 6.2 percent in real terms compared to the pre-
vious year. Inflation reached 52 percent that same year. The Mexican
peso lost 49.7 percent of its value in December 1994, and throughout
1995 the currency depreciated an additional 49 percent. The nomi-
nal value of the exchange rate, which was 3.4 pesos per dollar at the
beginning of December 1994, reached 7.7 pesos per dollar by the end
of December 1995. International reserves at the central bank dropped
from US$30 billion at the beginning of 1994 to only US$6 billion in
December 1994. The impact on interest rates was astounding, as well:
interest rates of a one-month Treasury bill reached more than 80 percent
during 1995.
The crisis brought painful costs in terms of increased poverty, a costly
bank restructuring, and a difficult economic environment for firms and
families. It is no surprise that under these conditions, states and munici-
palities faced dire financial circumstances, and, given that their debt was
mostly contracted at a variable rate, their obligations became unsus-
tainable overnight. Figure 4.2 shows the interest rate of a one-month
Treasury bill, and the impact of the crisis on GDP and consumption,
employment, and the exchange rate.
Subnationals faced two main direct shocks that made them unable
to service their debts. First, the extraordinary rise in interest rates made
their debt untenable, since most of it was contracted at variable rates.
Second, given that the main source of income was the participaciones
(which fluctuate with the federal taxes that are shared), the impact
of the crisis on federal revenue implied that in 1995, federal nonear-
marked transfers were 22 percent lower in real terms than in 1994.
With lower income sources and higher interest payments, the specter

Figure 4.2 The Macroeconomic Impact of the 1994–95 Tequila Crisis in Mexico
Source: Banco de México.Note: GDP = gross domestic product. A Cete is a credit title issued by the federal government.
3
5
7
9c. Mexican peso, 1994–96
Jan–94
Mar–94
May–94
Aug–94
Oct–94
Jan–95
Mar–95
May–95
Aug–95
Oct–95
Jan–96
Mar–96
May–96
Aug–96
Oct–96
Dec–96
Peso
s pe
r dol
lar
3
4
5
6
7
8
Jan–93
Apr–93
Jul–93Oct–
93Jan
–94Apr–
94Jul–94Oct–
94Jan
–95Apr–
95Jul–95Oct–
95
b. Unemployment rate, 1993–95
Perc
ent
d. Interest rate of a 28-day Cete, 1994–96
020406080
100
Jan–94
Apr–94Jul–94
Oct–94
Jan–95
Apr–95Jul–95
Oct–95
Jan–96
Apr–96Jul–96
Oct–96
Perc
ent
a. GDP and consumption growthin Mexico, 1992–95
–16–12–8–40
Perc
ent
48
Jan–92
Apr–92
Jul–92Oct–
92Jan
–93Apr–
93Jul–93Oct–
93Jan
–94Apr–
94Jul–94Oct–
94Jan
–95Apr–
95Jul–95Oct–
95
GDP Consumption
156

Subnational Debt Management in Mexico: A Tale of Two Crises 157
of default loomed larger. In this context, the federal government inter-
vened to engineer an important restructuring process that was based on
the following four main pillars. The following series of interventions
did not occur as a single event, but were spread over the recovery period
of the crisis.
First, the federal program included a direct restructuring mecha-
nism. In this way, the federal government, through the Ministry of
Finance, restructured around 90 percent of the outstanding subnational
debt (in an amount equivalent to US$8 billion at 2009 prices). The
restructuring lowered the interest rate to a fixed 10.5 percent nominal
rate and increased the maturity from an average of 6.6 years (see
Fedelino and Ter-Minassian 2010) to 15 and 20 years. It was structured
by Banobras, the federal government’s development bank that lends to
subnational governments.
Second, to help states deal with the decrease in federal transfers (par-
ticipaciones) caused by the lower federal collection of shared taxes, the
federal government gave an extraordinary transfer to all states in 1995
and 1996 of approximately US$1 billion (2009 prices) for each year,
equivalent to 10 percent of annual transfers.
Third, the federal government, again through Banobras, engineered
an extraordinary loan for states collateralized with nonearmarked
transfers. The loan was equivalent to US$500 million (2009 prices) or
5 percent of annual transfers. It would be paid out of one-year transfers
and at the federal government’s cost of financing.
Fourth, the federal government resorted to extraordinary discre-
tional transfers to some states that were negotiated independently and
usually not reported. By definition, this “hidden bailout” is difficult to
quantify because there are no data and it does not appear in traditional
accounting or reports of subnationals. However, Hernández, Díaz-
Cayeros, and Gamboa (2002b) try to quantify these “secret” transfers21
using reductions in debt stocks that are unmatched by state government
surpluses, and differences in interest rates before and after debt rene-
gotiations, since interest rates negotiated after the crisis varied among
states. Hernández, Díaz-Cayeros, and Gamboa also argue that some of
the new credit obtained via official development banks was used for
current expenditures and not investment (as the law mandates), which
would amount to an indirect bailout. Finally, when considering the

158 Until Debt Do Us Part
determinants of these hidden bailouts, they find that the size of the bail-
out was related to the size of the state and to the previous level of fiscal
indiscipline (with states that had bigger deficits getting more support),
but not to political variables.
The bailout worked in preventing the meltdown of subnational debt
markets, thus preserving the functioning of local governments and ser-
vice delivery. In studying the consequences of the bailout (both the open
and hidden parts), Hernández, Díaz-Cayeros, and Gamboa (2002b) find
two important consequences. First, there were distributional effects,
with higher per capita extraordinary transfers given to states with higher
per capita GDP. Hence, poorer states (less indebted) received less in
extraordinary support. Second, as with any bailout, some moral hazard
problems were created, since the bailout did not resolve structural fis-
cal imbalances. It consisted basically of a one-year relief program. After
the crisis, subnational governments kept incurring deficits because they
anticipated they would be bailed out again.
These special bailouts came from a large discretionary account for the
presidency, which had traditionally been in the budget. After the ruling
party lost control of Congress in 1997, however, this practice stopped,
and that contributed to the decision to move to the hybrid rules- and
market-based system described earlier.
The “Great Recession” of 2008–09 and Subnational Debt in Mexico
As in most countries, the global crisis of 2008–09 caused deep macro-
economic management problems for Mexico. The impact was severe:
growth slowed to a painful minus 6.1 percent in 2009, and the public
finances of all levels of government suffered accordingly. However, a
few things had changed since the Tequila Crisis. One decade of sound
macroeconomic management that achieved much needed fiscal and
monetary space, combined with a different transmission channel and
the external origin of the crisis, produced a very different effect on the
subnational debt market. Table 4.3 summarizes the similarities and dif-
ferences of both crises.
What was fundamentally different in the 2008–09 crisis for sub-
nationals was the absence of an interest rate shock. The one-month

Table 4.3 Two Crises: Implications for the Subnational Debt Market in Mexico
Tequila Crisis, 1995 Global financial crisis, 2008–09
Origin Domestic Foreign
Cause Reversion of large capital inflows together with some financial vulnerabilities:
• Semifixed exchange rate• Large current account deficit resulting from a huge credit
expansion• Substantial rise in interest rates in the United States• Accumulated political tensions during 1994a
• Global asset price bubbles and low interest rates• Subprime mortgage crisis in the United States• Excessive leveraging leading to serial defaults• Weak regulation of financial markets
Macroeconomic impact for Mexico
• Currency depreciation of 117 percentb
• GDP dropped 6.2 percent in real terms• Inflation exceeded 50 percent• Interest rates reaching 80 percentc
• Currency depreciation of 49 percentd
• GDP dropped 6.1 percent in real terms• Inflation of 4 percent• Interest rate fluctuations between 4 and 8 percentc
Impact on Mexican credit markets
• Complete dry-up of local credit• Banking crisis
• Dry-up of foreign credit, but less impact on local credit mar-kets since local banks remained strong throughout the crisis
Impact on subnational credit markets
• Severe dislocation• States unable to repay debt service because of: ° Higher interest payments ° Less capacity for repayment, as revenues dropped
• Significant effort to contain the impact• States suffered only through a lower capacity to service
payments, but Rainy Day Funds were used to smooth the shock.
Note: GDP = gross domestic product.a. Gil-Díaz 1998. b. From December 1994 to December 1995. c. Rate on one-month Treasury bill. d. Maximum depreciation during 2009. However, the Mexican peso recovered part of its value throughout 2009.
159

160 Until Debt Do Us Part
Treasury bill fluctuated from 4 to 8 percent from 2008 to 2010. This is
in contrast to what happened during the Tequila Crisis, when the rate
increased from 10 percent at the beginning of 1994 to above 80 percent
by the first quarter of 1995. This meant that there was no immediate
increase in the cost of servicing the debt for states and municipali-
ties. The shock, however, came through a different set of channels that
affected the revenue of subnational governments and, hence, the pos-
sibility of servicing that debt.
First, a dramatic decrease in the price of oil meant significantly lower
oil revenues, which are shared among levels of government.22 In 2009,
federal government oil revenue dropped 32 percent in real terms. Sec-
ond, the slowdown of economic activity implied a significant reduction
in federal tax revenue, which is also shared. Federal nonoil tax revenue
during 2009 decreased 10.5 percent in real terms. The combined impact
of these shocks on federal revenue meant significantly reduced transfers
for subnationals. Without the use of Rainy Day Funds (RDFs) (see dis-
cussion below), transfers in 2009 would have decreased 15 percent in real
terms. Given their almost complete dependence on federal resources, this
implied a momentous reduction in their capacity to service their debt
and finance government operations. In the absence of federal interven-
tion, many states would have defaulted on their debt. Figure 4.3 shows
the deterioration in subnational credit ratings, and therefore on credit
conditions, during the crisis.23
Under this scenario, the federal government could have provided a
direct bailout of the states via extraordinary transfers or a combination
of the mechanisms discussed in the previous section, or it could have
forced or been instrumental in a system-wide restructuring of subna-
tional debt. The solution, however, came from a different and innova-
tive mechanism: the coordinated sale of future federal surplus revenues
that belong to the states.
The coordinated, collective mechanism has been developed to
smooth the shock on local public finance. The Mexican macroeco-
nomic management framework was significantly improved in 2005
with the approval of a Federal Fiscal Responsibility Law. Among
other things, the law mandated a balanced federal government budget
and created RDFs for the federation and for subnationals. The fund-
ing of the RDFs was through annual federal surplus revenue (both oil

Subnational Debt Management in Mexico: A Tale of Two Crises 161
and federal tax) when, in any given year, receipts exceed the program.
Although the size of the funds in terms of GDP was small (reach-
ing 0.7 percent of GDP for the federal RDF, and 0.2 percent of GDP
for the subnational RDF), by 2008 the federal fund had accumulated
86 billion pesos and the subnational fund—the Fund for the Stabilization
of the Federal Revenue for the Federal Entities (Fondo de Estabilización
de los Ingresos de las Entidades Federativas, FEIEF)—had accumulated
25 billion pesos.24 The funds were designed to be used to smooth out
temporary decreases in federal revenues, which was the case in 2009.
To understand the size of the macroeconomic shock for Mexico
caused by the global crisis, consider the difference between expectations
for 2009, formed in the fall of 2008, as reflected in the macroeconomic
forecasts included in the budget, and the observed data for the close of
that fiscal year. The federal budget for 2009 included both a real GDP
Figure 4.3 Deteriorating Subnational Credit Scores in Mexico during the Global Financial Crisis Number of increases in subnational ratings minus decreases
Sources: Fitch Ratings; Standard & Poor’s.Note: Increases in graph (+1 for each positive change in rating), decreases (-1 for each negative change in rating), changes
in economic outlook (+/-0.25).
–15
–10
–5
0
5
10
15
Dec–05
Feb–06
Apr–06
Jun–06
Aug–06
Oct–06
Dec–06
Feb–07
Apr–07
Jun–07
Aug–07
Oct–07
Dec–07
Feb–08
Apr–08
Jun–08
Aug–08
Oct–08
Dec–08
Feb–09
Apr–09
Jun–09
Aug–09
Oct–09
Dec–09
Feb–10
Apr–10
Jun–10
Aug–10

162 Until Debt Do Us Part
growth forecast of 1.8 percent and an average price of oil of US$70
per barrel for the year. When 2009 ended, growth was a full 6 percent-
age points lower, while the price of oil averaged US$53 per barrel. This
implied a gap of 480 billion pesos in the federal government balance,25
and a reduction in federal nonearmarked transfers for subnationals of
70 billion pesos (or 15 percent) relative to the budget. In the absence
of a smoothing mechanism, chaos would have ensured for states and
municipalities. As in other parts of the world,26 services would have to
be cut dramatically; taxes raised; subnational workers would have been
laid off, with the associated political cost; and defaults would have been
inevitable.
The first line of defense to smooth the decrease in federal transfers
and prevent problems in the subnational debt market was to use savings
in the state’s RDF, the above-mentioned FEIEF. Soon it became clear that
the entire available balance in the fund (25 billion pesos) would not be
enough to cover the expected decrease in transfers for that year (a gap of
70 billion pesos between state aggregate budget transfers and expected
transfers was projected by June 2009). The federal government, under
pressure from states and municipalities, and under financial stress of its
own, was considering more traditional avenues for restructuring sub-
national obligations as described in the previous section, to close the
projected gap: a generalized extraordinary transfer, a restructuring of
subnational debt to lower payments, and giving much needed space to
local treasuries, or a direct loan to states. They all had their drawbacks.
An extraordinary transfer would put additional pressure on the fed-
eral government’s finances, and would completely shift the cost of the
crisis onto the federation. A restructuring of subnational debt would
have been difficult to achieve given the decentralized nature of the
market, the heterogeneity of lenders, and the diverse exposure of states.
A direct loan by the federation to subnationals had the disadvantage
that the federal government would have to put the asset on its books at a
time when its fiscal position was weak—in relative terms—and the loan
would have had to be standard in the sense that each state would have
had to get local legislative approval (a difficult process that was com-
plicated by federal and local politics and slow and difficult timing, and
would not have been successful because some states were already at their
locally established debt limit27). Also, the proceeds from the financing

Subnational Debt Management in Mexico: A Tale of Two Crises 163
would have had to conform to the constitutional golden rule and be
used for infrastructure.28
Instead of using one of the traditional avenues for restructuring,
the federal government, together with the states, engineered an inno-
vative mechanism that satisfied the following criteria: (a) involvement
of the subnationals’ own balance sheets in the smoothing of shocks;29
(b) giving subnationals a direct substitute of nonearmarked transfers;30
and (c) making it fast, credible, and efficient. The process was as follows:
the federal government used its coordination powers to harmonize the
needs of all subnationals for additional financing and put them on a
path to access the market collectively at a low cost of finance. The spe-
cific mechanism used was the leveraging of the RDF for states, that is,
the FEIEF.
Since the FEIEF belongs to the states, and is funded by a future flow
of income (the sequence of future annual excess surplus that corre-
sponds to subnationals), it was an effective vehicle to bring to present
value future resources. Essentially, the correct response to a transitory
fiscal gap is to use debt financing to avoid increasing taxes or reducing
expenditure.31 However, no state by itself would have had access to the
markets, or would have done so at high prices, given the deterioration of
liquidity in the credit markets at the time. The federal government coor-
dinated the states—and municipalities—to agree to the selling of future
flows of their RDF for a present value amount to be received and used as
nonearmarked transfers in 2009.
States and municipalities, through the Mexican National Asso-
ciation of State’s Secretaries of Treasury,32 (Comisión Permanente de
Funcionarios Fiscales) orchestrated the operation with the advice and
coordination assistance of the federal government. The whole struc-
turing process, from initial design to its closing, took four months.
Subnationals obtained 40 billion pesos in the market33 (equivalent
to 10 percent of annual nonearmarked transfers), to be paid back in
13 years (or sooner if the future flows toward the RDF are larger than
expected) at a cost of financing similar to that of the federation—and
about 200 basis points lower than the average cost of finance for sub-
nationals in Mexico.34 This substantial amount of resources almost
completely closed the gap in nonearmarked transfers, bringing it to
minus 2.2 percent (compared to the budget forecast), an astoundingly

164 Until Debt Do Us Part
small shortfall given the worst crisis since the Great Depression in the
1930s. In fact, the federal government had a substantially bigger fiscal
gap to close that year, and for all practical purposes, the Mexican sub-
nationals did not suffer the impact of the global crisis in their finances.
Debt continued to be served on time, and there was no dislocation in
the subnational credit market.
Figure 4.4 compares the fall in nonearmarked transfers in each of
the crises. Whereas the Tequila Crisis reduced nonearmarked transfers
by 22 percent relative to the previous year (and hence the restructur-
ing program described in the previous section was implemented), the
global crisis, in the absence of policy intervention, would have reduced
transfers by 15 percent in 2009 relative to 2008. However, with the
mechanism described (using the subnational RDF, current and future),
transfers were reduced only 5 percent in real terms relative to 2008. This
shock was then easily absorbed by subnational governments.
Figure 4.5 shows the evolution of the expectations of the end-of-year
gap between observed transfers and the budget forecast, during 2009.
Each point on the lines represents the expected gap for 2009 as of the
month indicated. The lower line represents the gap without the use of
the RDF, and the upper line represents the expected gap with the inno-
vative use of the RDF. Several conclusions can be drawn.
Figure 4.4 Fall in Transfers Relative to Previous Year in Mexico during the 1994–95 Tequila Crisis and the 2008–09 Global Financial Crisis
Source: Ministry of Finance, Mexico.Note: w.o. RDF = without Rainy Day Fund.
RDF
Mechanism
–30
–20
–10
01995
%, r
eal t
erm
s
2009w.o. RDF
2009Actual
TotalRDF

Subnational Debt Management in Mexico: A Tale of Two Crises 165
First, one can see the evolution of the crisis and how it was worsening
during the first half of the year. At its worst point (June 2009), nonear-
marked transfers were expected to be 20 percent lower than what was
forecasted in the budget. This would have been a substantial blow to
subnational governments. Second, in the last half of 2009, there was
a slight recovery in the economy, which was reflected in improved
expectations; but still, without the RDF transfers, it would have been
12.6 percent lower than budgeted. Third, as mentioned, the RDF oper-
ation almost closed the gap completely and, by the end of the year,
transfers were only 2.2 percent lower than budgeted.
After the operation, subnational debt markets continued functioning
normally and debt continued to be serviced. As the recovery occurred,
credit conditions gradually improved, beginning in the second quarter
of 2010 (see figure 4.3 earlier). The innovative use of credit markets and
the involvement of the subnational governments’ own balance sheets in
the debt management have contributed to preserving the health and sta-
bility of the subnational debt markets. The stability of the subnational
Figure 4.5 Federal Transfers: Evolution of Expectations in Mexico during the Global Financial Crisis, 2009 Expectation of end-of-year gap, formed in each month
Source: Ministry of Finance, Mexico.Note: RDF = Rainy Day Fund.
–25
–20
–15
–10
–5
Perc
ent
0
–2.2withRDF
–12.6without
RDF
Jan Feb
Mar AprMay Jun Jul
AugSe
pOct
NovDec

166 Until Debt Do Us Part
debt markets has also been helped by the improved macroeconomic
management in the country prior to the crisis and the turnaround eco-
nomic growth. In 2010 and 2011, the Mexican economy grew at 5.4 and
3.9 percent, respectively.
Lessons and Conclusions
Subnational debt markets perform essential functions, expanding the
resources of local governments to finance infrastructure and facilitating
the transfer of resources across time to smooth out transitional fiscal
shocks. They also pose risks, particularly if the central government has
to bail out local governments in times of stress.
In reality, however, all debt markets will fail from time to time. That
is why a well-structured regulatory framework needs to take into con-
sideration both the ex-ante rules for getting into debt, and the ex-post
mechanisms to deal with insolvency and restructuring. Governments
will deal with crises constrained by the mechanisms in place, the nature
of the crisis, and the tools available at the time. Learning from other
times and places is of value to add to the toolkit of policy makers,
improve the current set of institutions, and prevent further dislocation
in markets.
Mexico experienced two major macroeconomic crises in the last two
decades, both of which had important bearings on the subnational debt
market. While the two episodes affected local governments substantially,
the policy responses were markedly different and therefore had distinct
consequences. This chapter explored Mexico’s approach to subnational
debt management in each of those crises.
One of the main lessons of the 1995 experience is that if a bailout of
subnational governments is necessary, it should not be addressed exclu-
sively to closing the year-over-year deficits in primary balance. Instead,
the main focus should be solving the structural fiscal imbalances of
states. This means that the expenditure path must be determined by the
expected flow of future income. The federal government should con-
dition the extraordinary transfers to certain results, such as reducing
unnecessary expenses (a “structural adjustment” strategy).
The global crisis introduced a different set of challenges to ensuring
the orderly functioning of the subnational credit market. In this case,

Subnational Debt Management in Mexico: A Tale of Two Crises 167
since interest rates remained low, the channel affecting subnational
finances was in their repayment capacity because of the lower resources
that states and municipalities had available in 2009. In this case, the fed-
eral government did not resort to a traditional bailout or to extraor-
dinary transfers, but used its coordinator function to achieve a more
efficient outcome: the subnational governments got directly involved
to bring to present value the future flow of revenue of their RDF. This
innovative mechanism ensured that states’ own balance sheets were used
to smooth the fiscal shock. Also, the use of the (present and future) RDF
implied that subnational governments in Mexico did not suffer signifi-
cant fiscal consequences from the global crisis. Given the fiscal conse-
quences on governments around the world, of economies advanced
and developing, this is remarkable. Nonetheless, the uncertainty of
the global recovery poses challenges to macroeconomic management,
including the management of public finance at both the federal and
subnational levels.
The desired level of RDFs is a complex subject. A range of factors
influence the level, including macroeconomic and market conditions,
fiscal policy objectives, and the size and duration of macroeconomic
shocks. In the case of Mexico, the success of leveraging the RDF might
imply a lower optimal long-run level of RDFs—since one could bring to
present value future flows of the fund. (The large RDFs might become
a temptation for politicians to spend.) However, one would be averse
to having to depend on access to markets specifically at the time when
one is experiencing a fiscal shock. Mexico had a solid fiscal position
coming into the crisis, and hence had extraordinary access to markets
even in the downturn (consider also the path of interest rates and access
to credit for the 2008–09 global crisis, shown in table 4.3). But crises
come in different shapes and have different transmission channels, so
this might imply a larger optimal long-run level of RDFs. Hopefully, the
Mexican experience contributes to the larger debate on the optimal size
of stabilization funds.
Another important lesson is the consideration of the relative ben-
efits of a rules-based mechanism for subnational debt regulation com-
pared to a market-based mechanism. Mexico has evolved into a hybrid,
quasi-regulated market system. In this regulatory framework, the
major ingredients are the federal threat of no bailout, the transparency

168 Until Debt Do Us Part
of markets and, more important, the regulation of the market via the
prudential regulation of banks. This appears to have worked. Subna-
tional debt, at its low levels, does not appear to pose a macroeconomic
or systemic threat. Indeed, it is the fact that it has a relatively low value
(at 2.9 percent of GDP) that is surprising, given the infrastructure needs
of subnationals in Mexico.
A country’s macroeconomic framework has an important bearing
on its subnational debt markets. The important elements of the macro-
economic management framework for the health and evolution of sub-
national debt markets are (a) the fiscal position and debt stock of the
federal government, (b) the currency regime, (c) monetary policy, and
(d) economic growth. Future challenges for Mexico include translating
the success of macroeconomic management at the federal level to create
a more dynamic and transparent subnational debt market that contrib-
utes more effectively to the financing of infrastructure at the local level
and, hence, to the economic growth and development of the country.

Table 4A.1 “Ramo 28.” Nonearmarked Transfers (Participaciones Federales), Mexico
Fund Purpose Funding Distribution criteria Destination Share of totala (%)
FGP Revenue sharing with states and municipalities
20 percent of RFPb State GDP growth; local revenue (level and growth)
State and municipalc
86
FFM Revenue sharing with municipalities 1 percent of RFPb Municipal revenue (water and property tax)
Municipal 4
FOFIE Incentive for enforcement of tax laws 1.25 percent of RFPb Measures of local effort of enforcement of tax law
State and municipalc
5
3.17 percentd Resources for oil-producing municipalities
3.17 percent of a special oil royalty
Municipal revenue (water and property tax)
Municipal 0.3
0.136 percente Resources for borderline municipalities
0.136 percent of RFPb Municipal revenue (water and property tax)
Municipal 0.7
FEXHI Compensate for oil and gas extraction
0.6 percent of main oil royalty
Oil and gas production State and municipalc
1
IEPS “Sin tax” revenue sharing with states and municipalities
8 percent of tobacco; 20 percent of beer and alcohol
Local consumption of those goods
State and municipalc
2
FOCO Compensate the 10 poorest states 2/11 of local gasoline tax collection
Inverse of nonoil GDP per capita
State and municipalc
1
Source: Ministry of Finance, Mexico.Note: FGP = General Participation Fund (Fondo General de Participaciones), FFM = Fund for Municipal Aid (Fondo de Fomento Municipal), FOFIE = Tax Enforcement Fund (Fondo de
Fiscalización), FEXHI = Fund for Oil Extraction (Fondo de Extracción de Hidrocarburos), GDP = gross domestic product, IEPS = “Sin Tax” Revenue Sharing (Impuesto Especial sobre la Producción y Servicios), FOCO = Compensation Fund (Fondo de Compensación).
a. Shares calculated based on data for 2010. b. Shared Federal Revenue (Recaudación Federal Participable, RFP): The pool of federal revenues that is shared with states and municipalities includes the income tax, the value-added
tax, all other federal taxes, and oil revenues. It does not include revenue from public enterprises, federal government financing, or certain other sources of nontax revenue. c. States are required by law to share at least 20 percent of these resources with municipalities.d. 3.17 percent of special oil royalty (3.17 percent del Derecho Adicional). e. 0.136 percent of RFP (0.136 percent de la RFP).
Annex
169

Table 4A.2 “Ramo 33.” Earmarked Transfers (Aportaciones Federales), Mexico
Purpose Funding Distribution criteria DestinationShare of totala
(%)
FAEB Elementary education Theoretically, enough money to cover payrollc
Student enrollment and state spending on education
State 59
FASSA Health services Theoretically, enough money to cover payrollc
Health indicators; number of health workers
State 12
FAIS Social and rural infrastructure 0.303 percent of RFPb Poverty index State 9
2.197 percent of RFPb Municipal
FORTAMUNDF Municipal strengthening 2.35 percent of RFPb Population Municipal 9
FASP Public security Budget negotiation process Population; delinquency and criminality indexes
State 2
FAETA Promote adult education and literacy
Theoretically, enough money to cover payroll
Schooling and workers State 1
FAM Social assistance and education infrastructure
0.814 percent of RFPb Social vulnerability index State 3
FAFEF Financial needs and pensions 1.4 percent of RFPb Inverse of GDP per capita State 5
Source: Ministry of Finance, Mexico. Note: FAEB = Fund for Elementary Education (Fondo de Aportaciones para la Educación Básica), FASSA = Fund for Health Services (Fondo de Aportaciones para los Servicios de Salud),
FAIS = Fund for Social Infrastructure (Fondo de Aportaciones para Infraestructura Social), FORTAMUNDF = Fund for Municipal Strengthening (Fondo para el Fortalecimiento Munici-pal y de las Demarcaciones Territoriales del D.F.), FASP = Fund for Public Security (Fondo de Aportaciones para la Seguridad Pública), FAETA = Fund for Adult Education (Fondo de Aportaciones para la Educación Tecnológica y de Adultos), FAM = Fund for Social Assistance (Fondo de Aportaciones Múltiples), FAFEF = Fund for State Strengthening (Fondo de Aportaciones para el Fortalecimiento de las Entidades Federativas), GDP = gross domestic product.
a. Shares calculated based on 2010 data. b. Shared Federal Revenue (Recaudación Federal Participable, RFP): The pool of federal revenues that is shared with states and municipalities includes the income tax, the value-added
tax, all other federal taxes, and oil revenues. c. These funds were created to cover states’ education and health payrolls after the decentralization of these sectors in the 1990s. The size of these funds has usually been determined by
political forces during the federal budget negotiation process, and almost all states argue that the resources they receive from these funds are insufficient to fully cover their payroll.
170

Table 4A.3 Mexican States’ Total Local Revenue: Own-Source and Coordinated Federal Taxesa million pesos
2005 2006 2007 2008 2009 2010
Total local revenue 106,762 124,420 138,213 160,687 165,433 184,338
Own revenue 81,894 92,892 103,262 119,667 115,552 132,829
Taxes 34,818 39,160 44,396 47,864 49,417 57,706
Payroll 20,178 23,276 27,567 30,227 31,523 36,466
Other taxes 4,761 6,065 6,729 7,113 7,851 9,684
Use of motor vehicles (> 10 years) 721 1,295 1,299 1,360 1,344 1,361
Lodging 788 866 1,054 1,104 1,110 1,337
Personal property 992 1,170 1,275 1,299 1,267 1,235
Otherb 2,259 2,734 3,101 3,350 4,130 5,752
Property tax and property sales taxc 9,879 9,818 10,100 10,523 10,042 11,556
Nontax revenued 47,075 53,732 58,865 71,803 66,135 75,123
Coordinated federal taxesa 24,868 31,528 34,952 41,020 49,881 51,509
Vehicle-related taxes 20,873 23,989 25,827 26,175 24,515 23,773
Federal tax on use of motor vehicles 15,262 18,814 20,245 21,100 20,448 19,093
Tax on new vehicles 5,611 5,175 5,582 5,075 4,067 4,680
Fuel tax — — — 5,080 15,334 17,482
Other coordinated federal taxese 3,995 7,539 9,125 9,765 10,032 10,254
Sources: Ministry of Finance, Mexico; states’ public accounts.Note: — = not available.a. “Coordinated federal taxes” are federal taxes (the base and rate are defined by the federal government) administered and fully collected by state governments. In that sense, they
behave (and are sometimes considered as) local revenue.b. Includes taxes on lotteries and games, special profession taxes, state tax on use of motor vehicles, etc.c. Considers the revenue from the property tax and the property sales tax in the Federal District, where these taxes are collected at the state level. For the rest of the states, they
are collected at the municipal level.d. Alcohol, drivers’, and other licenses; received; state-owned enterprises; fines and charges; and other.e. Federal income tax and value-added tax for low-income firms, federal taxes in coastline areas, special fund for the tax on new vehicles.
171
172 Until Debt Do Us Part
Notes The findings, interpretations, and conclusions expressed in this work are those
of the authors and do not necessarily reflect the views of The World Bank, its
Board of Executive Directors, the governments they represent, or any other
institutions with which the external authors may be affiliated.
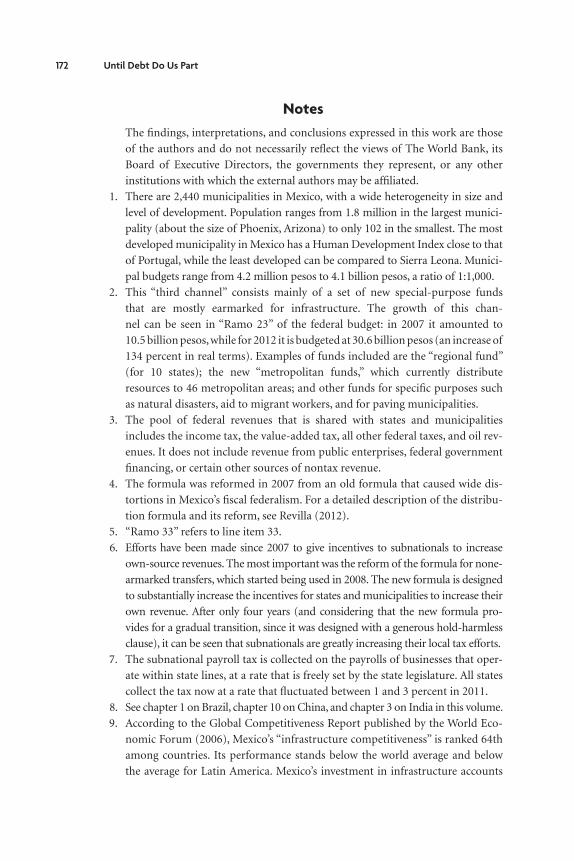
1. There are 2,440 municipalities in Mexico, with a wide heterogeneity in size and
level of development. Population ranges from 1.8 million in the largest munici-
pality (about the size of Phoenix, Arizona) to only 102 in the smallest. The most
developed municipality in Mexico has a Human Development Index close to that
of Portugal, while the least developed can be compared to Sierra Leona. Munici-
pal budgets range from 4.2 million pesos to 4.1 billion pesos, a ratio of 1:1,000.
2. This “third channel” consists mainly of a set of new special-purpose funds
that are mostly earmarked for infrastructure. The growth of this chan-
nel can be seen in “Ramo 23” of the federal budget: in 2007 it amounted to
10.5 billion pesos, while for 2012 it is budgeted at 30.6 billion pesos (an increase of
134 percent in real terms). Examples of funds included are the “regional fund”
(for 10 states); the new “metropolitan funds,” which currently distribute
resources to 46 metropolitan areas; and other funds for specific purposes such
as natural disasters, aid to migrant workers, and for paving municipalities.
3. The pool of federal revenues that is shared with states and municipalities
includes the income tax, the value-added tax, all other federal taxes, and oil rev-
enues. It does not include revenue from public enterprises, federal government
financing, or certain other sources of nontax revenue.
4. The formula was reformed in 2007 from an old formula that caused wide dis-
tortions in Mexico’s fiscal federalism. For a detailed description of the distribu-
tion formula and its reform, see Revilla (2012).
5. “Ramo 33” refers to line item 33.
6. Efforts have been made since 2007 to give incentives to subnationals to increase
own-source revenues. The most important was the reform of the formula for none-
armarked transfers, which started being used in 2008. The new formula is designed
to substantially increase the incentives for states and municipalities to increase their
own revenue. After only four years (and considering that the new formula pro-
vides for a gradual transition, since it was designed with a generous hold-harmless
clause), it can be seen that subnationals are greatly increasing their local tax efforts.
7. The subnational payroll tax is collected on the payrolls of businesses that oper-
ate within state lines, at a rate that is freely set by the state legislature. All states
collect the tax now at a rate that fluctuated between 1 and 3 percent in 2011.
8. See chapter 1 on Brazil, chapter 10 on China, and chapter 3 on India in this volume.
9. According to the Global Competitiveness Report published by the World Eco-
nomic Forum (2006), Mexico’s “infrastructure competitiveness” is ranked 64th
among countries. Its performance stands below the world average and below
the average for Latin America. Mexico’s investment in infrastructure accounts

Subnational Debt Management in Mexico: A Tale of Two Crises 173
for only 3.2 percent of GDP, and compares poorly to the investment of coun-
tries like Chile (5.8 percent of GDP) and China (7.3 percent of GDP).
10. Particularly from the Fund for Social Infrastructure (Fondo de Aportaciones
para Infraestructura Social) and the Fund for State Strengthening (Fondo de
Aportaciones para el Fortalecimiento de las Entidades Federativas). Of the total
206 billion pesos collateralized with transfers, only 5 billion (2.3 percent) pesos
are collateralized with earmarked transfers.
11. See Fitch Ratings (2011); Mexican Congressional Budget Office (Centro de
Estudios de Finanzas Públicas) (CEFP 2009); and Velázquez (2005) and refer-
ences contained therein.
12. If a state borrows from an international financial institution, the credit must
be channeled through federal government development banks first (so that the
forex risk is borne by the federal government and the state does not have any
direct obligation to a foreign entity).
13. In theory, the federal government could deduct subnationals’ debt service pay-
ments from the transfers to the states.
14. Especially because most of the participaciones are used for current expenditure,
so a reduction in them would leave a state unable to operate and provide basic
services.
15. The relevant laws and regulations are the Fiscal Coordination Law (Ley de
Coordinación Fiscal), the Public Debt Law (Ley de Deuda Pública), and the
Regulation of Article 9 of the Fiscal Coordination Law.
16. The author is indebted to discussions with Emilio Pineda for this interpretation.
17. The registered debt, as mentioned elsewhere in this chapter, includes all explicit
loans obtained by subnationals from private commercial banks, government
development banks, and the market that were approved by local legislatures.
It does not contain contingent (implicit) liabilities, such as pensions, or unse-
cure short-term loans used for cash management. The registered debt can be
accessed online at http://www.hacienda.gob.mx/Estados/Paginas/Deuda.aspx.
18. Subnational fiscal rules for the case of Mexico have the added disadvantage that
the accounting practices of local governments are widely heterogeneous and, in
some cases, deeply flawed. There is an accounting harmonization process that
was set up in 2008 with a constitutional reform that will modernize accounting
procedures at all levels of government. As of 2012, states have progressed slowly
toward accounting harmonization.
19. These banking regulations were put in place in 1999–2000, as part of the prior
actions for the 1999 Decentralization Adjustment Loan from the World Bank.
They had to be done through financial sector regulation, over which the fed-
eral government has authority, because constitutionally the federal government
could not impose such rules directly on the states.
20. In 2011, it was revealed that Coahuila, a northern state, falsified documents to
hide the true size of its debt. In reality, in the previous two years it had accu-
mulated a debt of $35 billion pesos (295 percent of its annual nonearmarked

174 Until Debt Do Us Part
transfers, or 9 percent of its GDP), while reporting only $7 billion pesos. While
this case highlights the need to strengthen the transparency of subnational
financial reporting, it does not change the overall view of the Mexican sub-
national debt market as one of low indebtedness without significant systemic
risks.
21. In some cases, the extraordinary support could have taken the form of a direct
transfer, a renegotiation of debt with a federal development bank (including a
reduction in interest and principal or the outright forgiveness of the debt), or
support through a budgetary mechanism (for example, reducing the share of
subnational expenditure in projects that combine federal and local resources,
that is, a reduction in the pari passu of programs, and so forth).
22. The price of Mexican oil suffered a dramatic fall as the crisis hit financial markets,
dropping from a maximum of US$130 per barrel in July 2008 to a minimum of
US$28 per barrel in December of the same year. Data source: Bloomberg.
23. As in any subnational debt market, there is the question of whether credit rat-
ings truly reflect state’s idiosyncratic credit risks (and these, in turn, fiscal risks).
While a detailed analysis of the informational content of subnational credit rat-
ings in Mexico is beyond the scope of this chapter, we consider the observed
ratings as a good approximation of the credit quality of subnationals at a given
moment in time.
24. Total funds amounted to US$8.4 billion, at the exchange rate for December 31,
2008, of 13.82 pesos per dollar.
25. This gap for the federal government was finally closed with the use of the federal
RDF, with additional debt, a cut in expenditure, and nonrecurrent revenues.
26. “In the United States the estimated collective gap between states’ income and obli-
gations for 2011 will be $55 billion dollars. This means that more than 30 states
are projecting a 2011 shortfall of 10 percent or more as a percentage of this year’s
budget. Many states have already used a big proportion of their RDFs: according
to the same report, 14 states are expected to have reserves of less than 1 percent of
their annual spending. In order to close the budget gap, states in the U.S. are sup-
posed to make serious expenditure cuts, which might be a difficult job given the
upward pressures arising from certain areas, particularly Medicaid” (“The Other
Financial Crisis,” Time, 175 (25), June 28, 2010).
27. For example, the debt of the State of Mexico and the Federal District is at the
higher boundary, so there was no space for additional financing.
28. Which, given the fungibility of money, would not have been a problem for
those states with significant investment programs. However, some states would
not have had space to use it otherwise.
29. In the sense of imposing, or making credible, a hard budget constraint on states.
30. This criterion gives economic efficiency to the restructuring process. Since
nonearmarked transfers are the freest form of financing for subnationals, they
would use the proceeds to finance their own budgetary priorities during the
crisis, as defined by their own legislature process.
Subnational Debt Management in Mexico: A Tale of Two Crises 175
31. Provided, of course, that the transitory fiscal gap does not materially reduce the
present value of receipts.
32. This is the main representative body in the Mexican national fiscal federalism
system. It consists of eight states’ ministers of finance who represent the 32. It
has powers to decide, as representative of the states, and it coordinates with the
federation all relevant topics of fiscal federalism in the country.
33. Given that (according to the Federal Fiscal Responsibility Law) FEIEF is to be
used as a perfect substitute of nonearmarked transfers, the funds obtained from
the operation had the same nature: they could—and were—used legally as
nonearmarked transfers (and not for infrastructure).
34. The loan was paid in full in only two years—by mid-2011 (11 years ahead of
schedule)—because of the favorable evolution of oil prices, which increased the
repayment capacity of subnationals.
BibliographyAhmad, Ehtisham, José Antonio Gonzalez Anaya, Giorgio Brosio, Mercedes Garcia-
Escribano, Ben Lockwood, and Ernesto Revilla. 2007. “Why Focus on Spending
Needs Factors? The Political Economy of Fiscal Transfer Reforms in Mexico.”
Working Paper WP/07/252, International Monetary Fund, Washington, DC.
Canuto, Otaviano, and Lili Liu. 2010a. “Subnational Debt Finance and the Global
Crisis.” PREM Economic Premise 13, World Bank, Washington, DC, May.
———. 2010b. “Subnational Debt Finance: Make It Sustainable.” In The Day After
Tomorrow: A Handbook on the Future of Economic Policy in the Developing World,
ed. Otaviano Canuto and Marcelo Giugale, 219–38. Washington, DC: World Bank.
CEFP (Centro de Estudios de las Finanzas Públicas). 2009. La Deuda Subnacional en
México. Mexico City: CEFP.
ECLAC (Economic Commission for Latin America and the Caribbean). 2009.
Estadísticas e Indicadores Económicos CEPALSTAT. Santiago: ECLAC.
Fedelino, Annalisa, and Teresa Ter-Minassian. 2010. “Making Fiscal Decentralization
Work: Cross-Country Experiences.” Occasional Paper 271, International Mon-
etary Fund, Washington, DC.
Fitch Ratings. 2011. Marco institucional de los gobiernos subnacionales en México.
Special Report, New York, September 14.
Gil-Díaz, Francisco. 1998. “The Origin of Mexico’s 1994 Financial Crisis.” The CATO
Journal 17 (3): 303–13.
Giugale, Marcelo, Fausto Hernández, and Joao de Carmo Oliveira. 2000. “Subna-
tional Borrowing and Debt Management.” In Fiscal Decentralization in Mexico:
Achievements and Challenges, ed. Steven Webb and Marcelo Giugale, 237–70.
Washington, DC: World Bank.
Giugale, Marcelo, Adam Korobow, and Steven Webb. 2000. “A New Model for Mar-
ket-Based Regulation of Subnational Borrowing: The Mexican Approach.”
Policy Research Working Paper 2370, World Bank, Washington, DC.
176 Until Debt Do Us Part
Giugale, Marcelo, and Steven Webb. 2000. Achievements and Challenges of Fiscal
Decentralization: Lessons from Mexico. Washington, DC: World Bank.
Hernández, Fausto, Alberto Díaz-Cayeros, and Rafael Gamboa. 2002a. “Determi-
nants and Consequences of Bailing Out States in Mexico.” Eastern Economic
Journal 28 (3): 365–80.
———. 2002b. “Fiscal Decentralization in Mexico: The Bailout Problem.” Research
Network Working Paper R-447, Inter-American Development Bank, Washington,
DC.
IMCO (Mexican Institute for Competitiveness). 2010. The Black Box of Public
Spending. State Competitiveness Index 2010. Mexico City: IMCO.
Liu, Lili, Abha Prasad, Francis Rowe, and Signe Zeikate. 2009. “Subnational Debt
Management in Low Income Countries in Transition to Market Access.” In
Debt Relief and Beyond, ed. Carlos Braga and Doerte Doemeland, 343–72.
Washington, DC: World Bank.
Liu, Lili, and Michael Waibel. 2008. “Subnational Borrowing, Insolvency and Regu-
lation.” In Macro Federalism and Local Finance, ed. Anwar Shah, 215–44. Wash-
ington, DC: World Bank.
———. 2009. “Subnational Insolvency and Governance: Cross-Country Experi-
ences and Lessons.” In Does Decentralization Enhance Service Delivery and
Poverty Reduction?, ed. Ehtisham Ahmad and Giorgio Brosio, 333–76. Chelten-
ham, U.K.: Edward Elgar.
OECD (Organisation for Economic Co-operation and Development). 2010. Revenue
Statistics 2010. Paris: OECD Publishing.
Prasad, Abha, Rajan Goyal, and Anupam Prakash. 2004. “States’ Debt and Debt
Relief.” Economic and Political Weekly 39 (26): 2726–36.
Revilla, Ernesto. 2012. “Mexico’s Fiscal Federalism.” Draft. Ministry of Finance,
Mexico. Available via email: [email protected].
Ter-Minassian, Teresa, and Jon Craig. 1997. “Control of Subnational Government
Borrowing.” In Fiscal Federalism in Theory and Practice: A Collection of Essays, ed.
Teresa Ter-Minassian, 156–74. Washington, DC: International Monetary Fund.
Velázquez, César. 2005. State Public Debt Laws and Fiscal Performance: The Case of
Mexico. Mexico City: Universidad Iberoamericana.
World Economic Forum. 2006. The Global Competitiveness Report, 2006–2007.
Geneva: World Economic Forum.