Embed Size (px)
Citation preview

Submission for Verification of AgBalance™ Analysis Under
NSF Protocol P352, Part B
Corn Production in Iowa AgBalance™ Analysis Final Report - February 2013
Submitted by:
BASF Corporation Product Stewardship
100 Park Avenue, Florham Park, NJ, 07932
Prepared by:
Thomas Laginess, Senior Sustainability Specialist
Martin Mascianica, Regional Project Leader
Markus Frank, Global Sustainability Leader
Fred Moore, Regional Marketing Manager

Copyright © 2013 BASF Corporation
1
Table of Contents
1. Purpose and Intent of this Submission ..................................................... 3 2. Content of this Submission ....................................................................... 3 3. BASF's AgBalance™ Methodoloy………………………………………………………. 3
3.1. Overview …………………………………………………………………………………………………..3 3.2. Preconditions ..…………………………………………….…………………………………………… 3 3.3. Work Flow .............…………………………………………..……………………………………….6
4. Study Goals, Decision Criteria and Target Audience ................................. 6 4.1. Study Goals .................................................................................................. 6 4.2. Design Criteria ............................................................................................. 7 4.3. Target Audience ........................................................................................... 7
5. Customer Benefit, Alternatives, System Boundaries and Scenarios ......... 8 5.1. Customer Benefit .......................................................................................... 8 5.2. Alternatives…………………………………………………………………………………………………8 5.3. System Boundaries ....................................................................................... 9
5.4 Scenario Analyses …………………………………………………………………………………….10 6. Input Parameters and Assumptions ....................................................... 10
6.1. Input Parameters.........................................................................................10 6.2 Cost Inputs……………………………………………………………………………………..…..……14
6.3 Social Inputs…………………………………………………………………………………..…..……14 7. Data Sources ........................................................................................... 16
7.1 Environmental…………………………………………………………………………………………..16 7.2 Amounts and Costs…………………………………………………………………………………...16
8. AgBalance™ Analysis Results and Discussion ......................................... 18 8.1. Environmental Impact Results ......................................................................18 8.1.1. Primary energy consumption .....................................................................18 8.1.2. Raw material consumption ........................................................................18 8.1.3. Air Emissions ...........................................................................................20 8.1.3.1. Global Warming Potential (GWP) ...........................................................20 8.1.3.2. Photochemical ozone creation potential (smog) .......................................20 8.1.3.3. Ozone depletion potential (ODP) ............................................................21 8.1.3.4. Acidification potential (AP) ....................................................................21 8.1.4. Water emissions ......................................................................................23 8.1.5. Solid waste generation .............................................................................23 8.1.6. Land Use .................................................................................................24 8.1.7. Eco-Toxicity potential ...............................................................................25 8.1.8. Risk potential ...........................................................................................27 8.1.9. Consumptive Water Use ...........................................................................28 8.1.10. Biodiversity ..............................................................................................29 8.1.11. Soil .........................................................................................................29 8.1.12. Environmental Fingerprint .........................................................................30 8.2. Economic Cost Fingerprint ............................................................................31 8.3. Social Fingerprint .........................................................................................33 8.4. AgBalance™ Analysis Portfolio ......................................................................35
8.5 Scenario Analyses …………………………………………………………………………..………..37 8.5.1 Scenario#1 - Reduction of yield in 2010 by 5% …………………………..….…..37 8.5.2 Scenario#2 - Comparison of tillage differences in 2010 ………………………..39

Copyright © 2013 BASF Corporation
2
8.5.3 Scenario#3 - Comparison of conservative tillage 2000 & 2010.……………..41 8.5.4 Scenario#4 – Yield for 2000 set at the same yield as 2010..…….…………..43
9. Data Quality Assessment………………………………………………………….45 9.1. Data Quality Statement ................................................................................45
10. Sensitivity and Uncertainty Analysis ..................................................... 46 10.1. Sensitivity and Uncertainty Considerations .....................................................46 10.2. Critical Uncertainties ....................................................................................48
11. Limitations of AgBalance™ Study Results ............................................... 48 11.1. Limitations ..............................................................................................48
12. References .............................................................................................. 49 Appendix A……………………………………………………………………..………………………51

Copyright © 2013 BASF Corporation
3
1. Purpose and Intent of this Submission
1.1. The purpose of this submission is to provide a written report of the methods and findings of BASF Corporation’s “Corn Production in Iowa AgBalance™ Analysis”, with the intent of having it verified under the requirements of NSF Protocol P352, Part B: Verification of AgBalance™ Analysis Studies.
1.2. The Corn Production AgBalance™ Analysis was performed by BASF according to the methodology validated by NSF International under the requirements of Protocol P352. More information on BASF’s methodology and the NSF validation can be obtained at http://www.nsf.org/info/eco_efficiency.
2. Content of this Submission
2.1. This submission outlines the study goals, procedures, and results for the Corn Production AgBalance™ Analysis study, which was conducted in accordance with BASF Corporation’s AgBalance™ methodology. This submission will provide a discussion of the basis of the eco-analysis preparation and verification work.
2.2. As required under NSF P352 Part B, along with this document, BASF is submitting the final computerized model programmed in Microsoft® Excel. The computerized model, together with this document, will aid in the final review and ensure that the data and critical review findings have been satisfactorily addressed.
3. BASF’s AgBalance™ Methodology
3.1. Overview:
BASF AgBalance™ involves measuring the life cycle environmental impacts, life cycle costs and life cycle social aspects for product alternatives for a defined level of output. At a minimum, BASF AgBalance™ evaluates the environmental impact of the production, use, and disposal of a product or process in the areas of energy consumption, resource consumption, emissions, eco-toxicity, land use, water use, soil and biodiversity. The AgBalance™ analysis evaluates the life cycle costs associated with the product or process by calculating the costs related to, at a minimum, materials, labor, manufacturing, waste disposal, and energy. AgBalance™ also includes social aspects dealing with agricultural metrics, which are not part of the Protocol P352.
3.2. Preconditions:
The basic preconditions of this AgBalance™ Analysis are that all alternatives that
are being evaluated are being compared against a common functional unit or Customer Benefit (CB). This allows for an objective comparison between the various alternatives. The scoping and definition of the Customer Benefit are aligned with the goals and objectives of the study. Data gathering and constructing the system boundaries are consistent with the CB and consider the environmental, economic and social impacts of each alternative over their life cycle in order to achieve the specified CB. The social aspects in AgBalance™ are also based on the relevant

Copyright © 2013 BASF Corporation
4
agricultural data for the specific CB. An overview of the scope of the environmental, economic and social assessments is defined below.
3.2.1. Environmental Burden Metrics:
For BASF AgBalance™ environmental burden is characterized using thirteen
categories, at a minimum, including: primary energy consumption, raw material consumption, global warming potential (GWP), ozone depletion potential (ODP), acidification potential (AP), photochemical ozone creation potential (POCP), water emissions, solid waste emissions, eco-toxicity potential, land use, water use, soil and biodiversity. These are shown below in Figure 1. Metrics shown in yellow represent the eight main categories of environmental burden that are used to construct the environmental fingerprint, burdens in blue represent all elements of the emissions category, and burdens in green show the catergories evaluated within air emissions.
Figure 1. Environmental Impact categories
3.2.2. Economic Metrics: It is the intent of the BASF AgBalance™ methodology to assess the economics of
products or processes over their life cycle and to determine an overall total cost of ownership for the defined customer benefit ($/CB). The approaches for calculating costs vary from study to study. When chemical products of manufacturing are being compared, the sale price paid by the customer is predominately used. When different production methods are compared, the relevant costs include the purchase and installation of capital equipment, depreciation, and operating costs. The costs incurred are summed and combined in appropriate units (e.g. dollar or EURO)

Copyright © 2013 BASF Corporation
5
without additional weighting of individual financial amounts. The BASF AgBalance™ methodology will incorporate: • the real costs that occur in the process of creating and delivering the product to
the consumer; • the subsequent costs which may occur in the future (due to tax policy changes,
for example) with appropriate consideration for the time value of money; and • Costs having ecological aspect, such as the costs involved to treat wastewater
generated during the manufacturing process.
In AgBalance™, costs are quantified for each alternative. These alternatives are then aggregated and totaled to show the total cost of each alternative as it relates to the common customer benefit (CB).
3.2.3. Social Metrics:
Social parameters are not addressed specifically in the ISO LCA standards. There are no other consensus standards that can be referenced to define the criteria for a social LCA. AgBalance™ represents BASF’s best attempts to create a social LCA framework through the identification and use of relevant factors associated with life cycle principles. Even though there are no industry standards available, important developments from different groups like the UNEP/SETAC working group or existing standards in the Agro-sector like RISE were considered.
The social assessment in AgBalance™ is built on the SEEBALANCE® scheme for
social LCA, which was developed in 2005 by the Universities of Karlsruhe and Jena, the Öko-Institut (Institute for Applied Ecology) Freiburg and BASF.1,2
For AgBalance™, this set of social parameters has been extended and in parts
modified to address specific agricultural sustainability topics, e.g., access to land, level of organization or international trade with agricultural products. These topics were initially identified through a stakeholder process in 2009 and 2010, organized by BASF, and were subsequently discussed with leading experts. Feedback from this process was then integrated into the development of these indicators.
Social factors as part of AgBalance™ means integrating social parameters into
the assessment model, taking all three pillars of sustainability into account, as originally proposed in the definition of sustainability by the UN Brundtland commission. The strength of a life cycle approach is that the social aspects are evaluated along the life cycle or a defined life cycle. The assessment of social indicators shows the sustainability risks or weaknesses, as well as strengths of any given alternative. It is worth noting that any alternatives that reflect conditions conflicting with legal rights or basic human rights will not be assessed in an AgBalance™ study.
For all social indicators, the production volumes are related quantitatively to a
given industry sector (e.g., ‘occupational diseases per kg product’). With this approach, it is possible to relate the inputs and outputs from the environmental life cycle assessment to the individual social indicators. For this study, the social input
Copyright © 2013 BASF Corporation
6
data can be found in Table 5 later in this document. The additional social indicators in AgBalance™ are not part of the NSF Protocol P352.
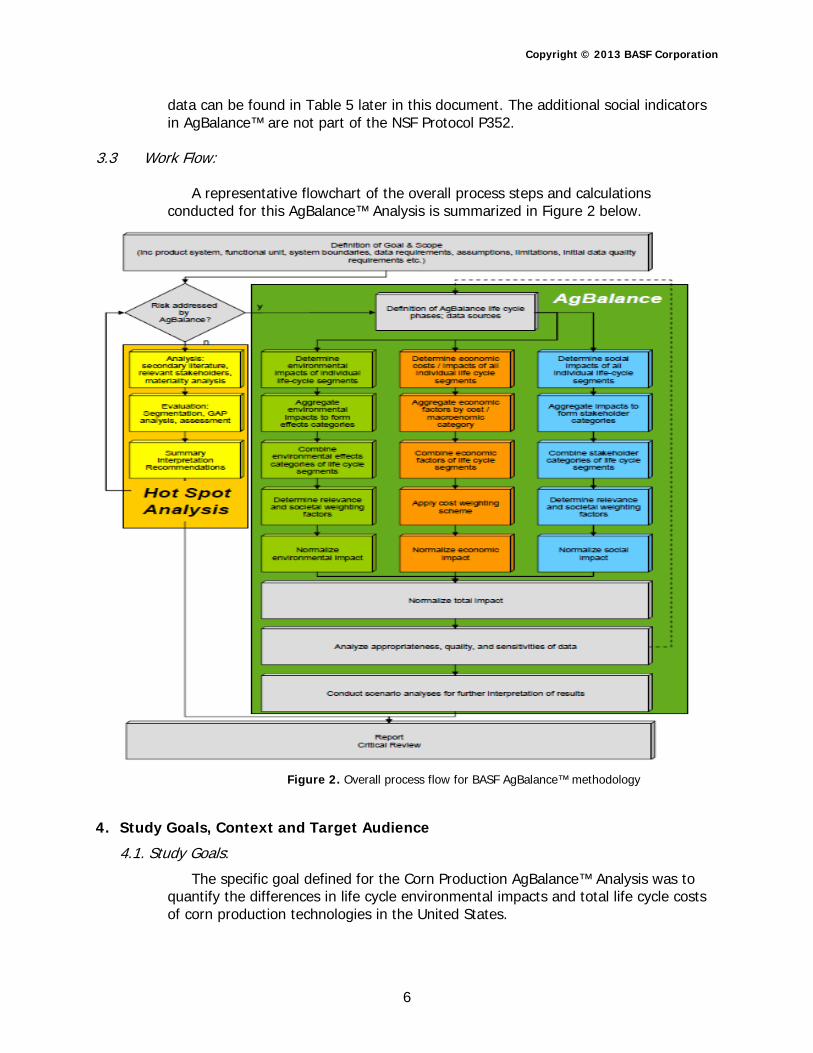
3.3 Work Flow:
A representative flowchart of the overall process steps and calculations conducted for this AgBalance™ Analysis is summarized in Figure 2 below.
Figure 2. Overall process flow for BASF AgBalance™ methodology
4. Study Goals, Context and Target Audience
4.1. Study Goals:
The specific goal defined for the Corn Production AgBalance™ Analysis was to quantify the differences in life cycle environmental impacts and total life cycle costs of corn production technologies in the United States.
Copyright © 2013 BASF Corporation
7
The study specifically compares the corn production in Iowa in 2000 vs. 2010. The study considered application of the Corn Production in the state of Iowa because roughly 20% of the United States corn production is grown in Iowa. Thus most of the data used in the study is from Iowa State University research on corn production.
The major factor influencing the environmental and cost impact between the two years is the yield increase in the production of corn. Iowa State University data shows an increase of 21.7% from 2000 to 2010 in corn production yield.3,4 This University information is based on average data collected for the specific years and is published on a yearly basis.
Study results will be used as the basis to guide further product development and marketing decisions that will result in more sustainable production of corn. As well as provide the necessary information to allow a clear comparison between the environmental life cycle, total cost impacts and social aspects as measured by BASF’s AgBalance™ tool. It will also facilitate the clear communications of these results to key stakeholders in the agricultural industry who are challenged with evaluating and making strategic decisions related to the sustainable development associated with production of corn.
4.2 Design Criteria:
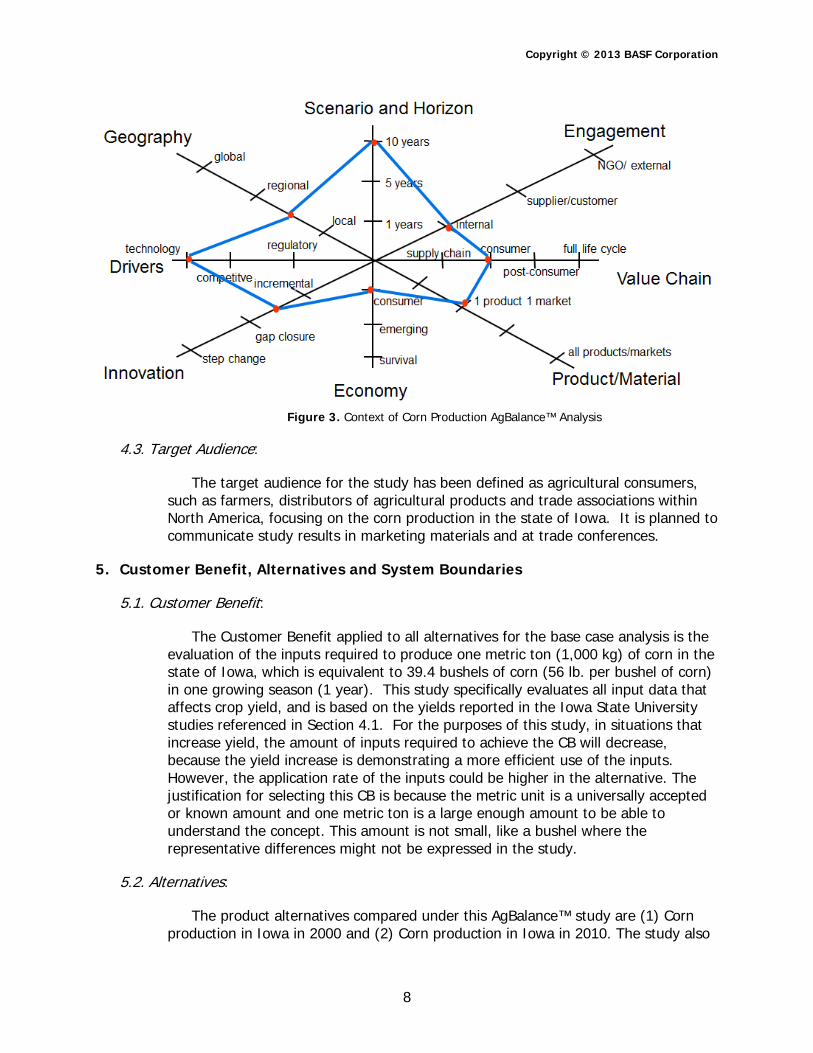
The context of this AgBalance™ study compared the life cycle environmental, cost impacts and social aspects for production of one metric ton (1,000 kg) of corn. The corn production study used data mainly documented by Iowa State University for the production of corn. The data in the study included general data such as yield; seeding such as seed used in corn planting; fertilizers and plant protection such as amounts of N-P-K fertilizer, herbicides, insecticides, additives and applicable emissions. Fuel use in tilling and harvesting such as diesel use for tractor, diesel use for combine and transportation were evaluated. The study relied on internal information and MSDSs were utilized for non-BASF supplier information. The study was technology driven and goals, target audience, and context for decision criteria used in this study are displayed in Figure 3.
Copyright © 2013 BASF Corporation
8
Figure 3. Context of Corn Production AgBalance™ Analysis
4.3. Target Audience:
The target audience for the study has been defined as agricultural consumers, such as farmers, distributors of agricultural products and trade associations within North America, focusing on the corn production in the state of Iowa. It is planned to communicate study results in marketing materials and at trade conferences.
5. Customer Benefit, Alternatives and System Boundaries
5.1. Customer Benefit:
The Customer Benefit applied to all alternatives for the base case analysis is the evaluation of the inputs required to produce one metric ton (1,000 kg) of corn in the state of Iowa, which is equivalent to 39.4 bushels of corn (56 lb. per bushel of corn) in one growing season (1 year). This study specifically evaluates all input data that affects crop yield, and is based on the yields reported in the Iowa State University studies referenced in Section 4.1. For the purposes of this study, in situations that increase yield, the amount of inputs required to achieve the CB will decrease, because the yield increase is demonstrating a more efficient use of the inputs. However, the application rate of the inputs could be higher in the alternative. The justification for selecting this CB is because the metric unit is a universally accepted or known amount and one metric ton is a large enough amount to be able to understand the concept. This amount is not small, like a bushel where the representative differences might not be expressed in the study.
5.2. Alternatives:
The product alternatives compared under this AgBalance™ study are (1) Corn production in Iowa in 2000 and (2) Corn production in Iowa in 2010. The study also

Copyright © 2013 BASF Corporation
9
looks at the tillage process in both years and these are defined in the study as conventional tillage and conservative tillage. Conservative tillage is broken down into minimal tillage and no-tillage. The percentage of this are evaluated in the study alternatives and are based on data from the actual farming process reported in the specific years. These alternatives were selected as they represent technology advanacement and social changes in farming.
5.3. System Boundaries:
The system boundaries define the specific elements of the production phases that were considered as part of the analysis. The elements for the use and disposal of one metric ton of corn were not evaluated in this study. The system boundaries for the two alternatives evaluated in this study are shown in Figures 4. Sections identified in gray were excluded from the analysis as they represented identical impacts for both alternatives (e.g. transportation, drying, storage, processing and secondary uses). The justification for these boundaries is that these are the major impact categories for the production of corn and the only difference between the two alternatives is the data used for the different years. The use and disposal of the corn was not evaluated because the CB of one metric ton for both alternatives was the same.
The Eco-toxicity potential of the input chemicals is defined to be evaluated in the Use phase only. This Use phase is the Use phase of the respective life cycles of the input chemicals used in the production of 1 metric ton of corn for both Year 2000 and 2010. This is not the Use phase of defined system boundaries of this study.
Figure 4. System boundaries - Corn Production 2000 & 2010
Copyright © 2013 BASF Corporation
10
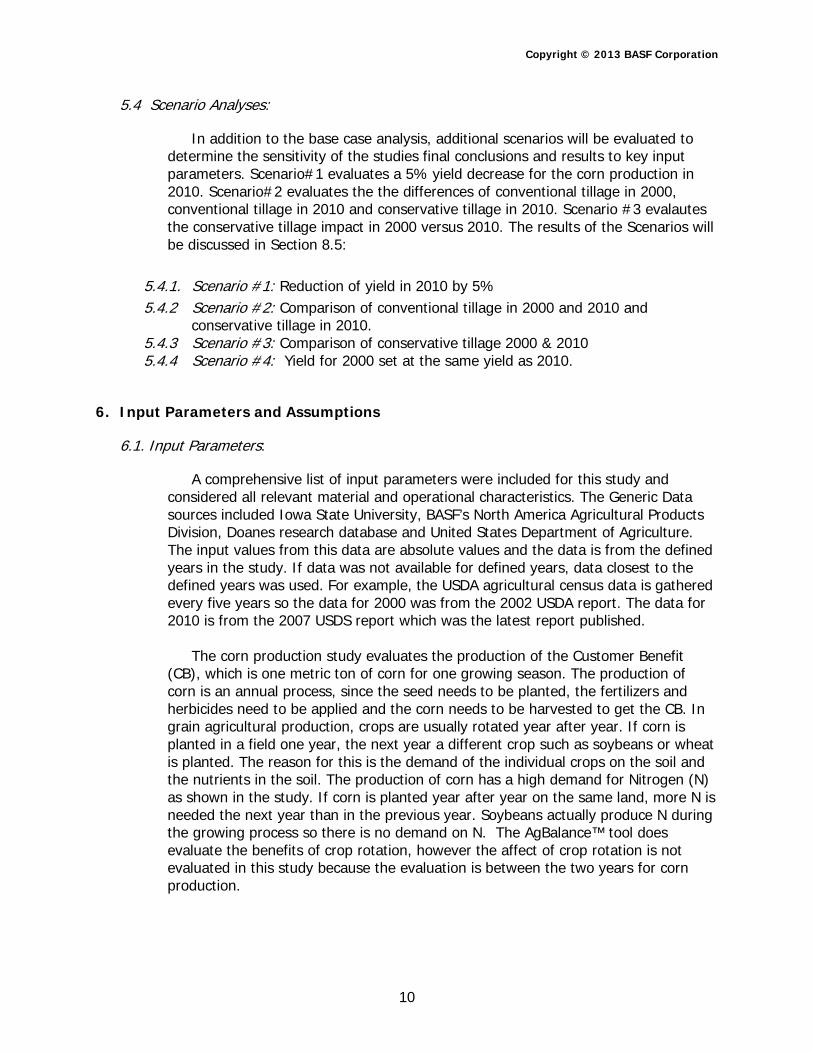
5.4 Scenario Analyses:
In addition to the base case analysis, additional scenarios will be evaluated to determine the sensitivity of the studies final conclusions and results to key input parameters. Scenario#1 evaluates a 5% yield decrease for the corn production in 2010. Scenario#2 evaluates the the differences of conventional tillage in 2000, conventional tillage in 2010 and conservative tillage in 2010. Scenario #3 evalautes the conservative tillage impact in 2000 versus 2010. The results of the Scenarios will be discussed in Section 8.5:
5.4.1. Scenario #1: Reduction of yield in 2010 by 5% 5.4.2 Scenario #2: Comparison of conventional tillage in 2000 and 2010 and
conservative tillage in 2010. 5.4.3 Scenario #3: Comparison of conservative tillage 2000 & 2010 5.4.4 Scenario #4: Yield for 2000 set at the same yield as 2010.
6. Input Parameters and Assumptions
6.1. Input Parameters:
A comprehensive list of input parameters were included for this study and considered all relevant material and operational characteristics. The Generic Data sources included Iowa State University, BASF’s North America Agricultural Products Division, Doanes research database and United States Department of Agriculture. The input values from this data are absolute values and the data is from the defined years in the study. If data was not available for defined years, data closest to the defined years was used. For example, the USDA agricultural census data is gathered every five years so the data for 2000 was from the 2002 USDA report. The data for 2010 is from the 2007 USDS report which was the latest report published.
The corn production study evaluates the production of the Customer Benefit (CB), which is one metric ton of corn for one growing season. The production of corn is an annual process, since the seed needs to be planted, the fertilizers and herbicides need to be applied and the corn needs to be harvested to get the CB. In grain agricultural production, crops are usually rotated year after year. If corn is planted in a field one year, the next year a different crop such as soybeans or wheat is planted. The reason for this is the demand of the individual crops on the soil and the nutrients in the soil. The production of corn has a high demand for Nitrogen (N) as shown in the study. If corn is planted year after year on the same land, more N is needed the next year than in the previous year. Soybeans actually produce N during the growing process so there is no demand on N. The AgBalance™ tool does evaluate the benefits of crop rotation, however the affect of crop rotation is not evaluated in this study because the evaluation is between the two years for corn production.

Copyright © 2013 BASF Corporation
11
6.1.1. Cultivation Parameters:
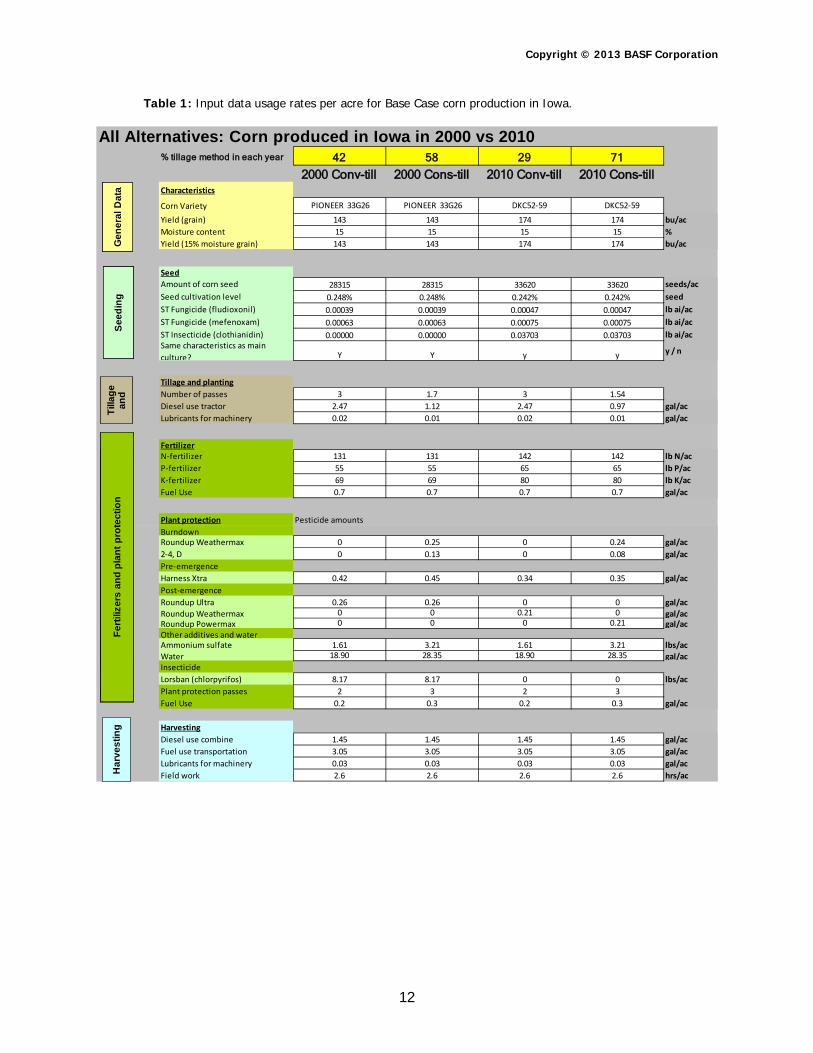
In this analysis, the cultivation parameters for each year are evaluated as conventional tillage and conservative tillage. Conservative tillage consists of minimal tillage and no-till. The number of passes across a field varies between the tillage processes. In conventional tillage the ground would need to be worked twice and then planted for a total of 3 passes. In conservative tillage there could be one pass for working the ground and 1 pass for planting and no-till would be 1 pass for planting. In the two alternatives, these tillage processes are broken down to the actual percentage that is reported for production of corn in Iowa. The percentage of minimal tillage and no-till in the conservative tillage is also calculated based on data from Iowa and used for the tillage fuel use.
Inputs for seeds, fertilizers and plant protection, per area unit for each of the alternatives, was used as the input amounts. The input amounts used per acre (ac) are shown in Table 1. The Base Case compares the data from Year 2000 and Year 2010.
The eco-toxicity input values were calculated based on the methodology
described in Section 8.1.7. The values were then multiplied by the amounts used in the production of the CB and were only based on the active ingredients of the plant protection products. Table 2 shows the eco-toxicity values used for tha active ingredients in the plant protection products.
The corn seed variety changed from 2000 to 2010 to reflect the changes
made in the genetics of corn seed in the 10 years. In 2000, the Pioneer 33G26 variety was mainly planted in Iowa and this corn seed was Roundup® Ready. This meant that it had a genetic trait to be glyphosate resistance, which glyphosate is the active ingredient in Roundup®. In 2010, the Dekalb DKC52-59 variety was mainly planted in Iowa and this variety had the genetic trait of VT3, which means it had 3 genetic traits. These traits were glyphosate resistance, ear worm protection (above the ground protection) and root worm protection (below the ground protection). The main advantage of the VT3 corn seed was the elimination of insecticides in the soil during planting.
Copyright © 2013 BASF Corporation
12
Table 1: Input data usage rates per acre for Base Case corn production in Iowa.
All Alternatives: Corn produced in Iowa in 2000 vs 2010% tillage method in each year 42 58 29 71
2000 Conv-till 2000 Cons-till 2010 Conv-till 2010 Cons-tillCharacteristics
Corn Variety PIONEER 33G26 PIONEER 33G26 DKC52-59 DKC52-59
Yield (grain) 143 143 174 174 bu/acMoisture content 15 15 15 15 %Yield (15% moisture grain) 143 143 174 174 bu/ac
SeedAmount of corn seed 28315 28315 33620 33620 seeds/acSeed cultivation level 0.248% 0.248% 0.242% 0.242% seedST Fungicide (fludioxonil) 0.00039 0.00039 0.00047 0.00047 lb ai/acST Fungicide (mefenoxam) 0.00063 0.00063 0.00075 0.00075 lb ai/acST Insecticide (clothianidin) 0.00000 0.00000 0.03703 0.03703 lb ai/acSame characteristics as main culture? Y Y y y y / n
Tillage and plantingNumber of passes 3 1.7 3 1.54Diesel use tractor 2.47 1.12 2.47 0.97 gal/acLubricants for machinery 0.02 0.01 0.02 0.01 gal/ac
FertilizerN-fertilizer 131 131 142 142 lb N/ac P-fertilizer 55 55 65 65 lb P/acK-fertilizer 69 69 80 80 lb K/ac Fuel Use 0.7 0.7 0.7 0.7 gal/ac
Plant protection Pesticide amountsBurndownRoundup Weathermax 0 0.25 0 0.24 gal/ac2-4, D 0 0.13 0 0.08 gal/acPre-emergenceHarness Xtra 0.42 0.45 0.34 0.35 gal/acPost-emergenceRoundup Ultra 0.26 0.26 0 0 gal/acRoundup Weathermax 0 0 0.21 0 gal/acRoundup Powermax 0 0 0 0.21 gal/acOther additives and waterAmmonium sulfate 1.61 3.21 1.61 3.21 lbs/acWater 18.90 28.35 18.90 28.35 gal/acInsecticideLorsban (chlorpyrifos) 8.17 8.17 0 0 lbs/acPlant protection passes 2 3 2 3Fuel Use 0.2 0.3 0.2 0.3 gal/ac
HarvestingDiesel use combine 1.45 1.45 1.45 1.45 gal/acFuel use transportation 3.05 3.05 3.05 3.05 gal/acLubricants for machinery 0.03 0.03 0.03 0.03 gal/acField work 2.6 2.6 2.6 2.6 hrs/ac
gene
ral D
ata
ferti
lizer
s an
d pl
ant p
rote
ctio
n se
edin
gG
ener
al D
ata
Ferti
lizer
s an
d pl
ant p
rote
ctio
n Se
edin
gTi
llage
an
dge
nera
l Dat
aH
arve
stin
gfe
rtiliz
ers
and
plan
t pro
tect
ion
seed
ing
Gen
eral
Dat
aFe
rtiliz
ers
and
plan
t pro
tect
ion
Seed
ing
Tilla
ge
and

Copyright © 2013 BASF Corporation
13
Table 2: Input data values for Eco-toxicity of chemicals for corn production in Iowa.
Chemicals Eco-Toxicity Value Fludioxonil 2660 Mefenoxam 225 Clothianidin 97 Glyphosate-isopropylammonium 177 2,4-D, Isopropylamine Salt 18 Acetochlor 7611 Atrazine 11406 Chlorpyrifos Methyl 6605
Table 3 shows the input amounts for biodiversity and soil as part of the AgBalance™ analysis. Most of the data for soil is the same for the two alternatives since the soil has not changed in Iowa in the 10 years of the evaluation. A soil compaction score is determined based on the soil texture, number of days with field capacity, depth of impermeable layer, soil organic matter content, type of land use and stocking rate. Since the values are all the same for both alternatives, the score was the same and normalized to 1 for soil compaction. The only differences in soil between the two years are the loss from wind erosion and humus amount left on field. The humus amount is calculated based on the yield amounts from the two years.
Table 3: Input data for soil and biodiversity for corn production in Iowa.
All Alternatives: Corn produced in Iowa in 2000 vs 2010% tillage method in each year 42 58 29 71
2000 Conv-till 2000 Cons-till 2010 Conv-till 2010 Cons-tillBiodiversity Payments received for AES 95.83 95.83 119.68 119.68 $/acProtected areas' share at country's area 6.39 6.39 6.60 6.60
%
Maximum yield potential 195 195 195 195 bu/acNumber of endangered species 113 113 113 113 #
SoilSoil nutrient supply class of phosphate (see table to the right) B B B BNitrogen mineralized in soil 100 100 100 100 lbs/ac
Soil textureHeavy clay loam and
Clay soils (clay content > 27%)
Heavy clay loam and Clay soils (clay content
> 27%)
Heavy clay loam and Clay soils (clay content
> 27%)
Heavy clay loam and Clay soils (clay content
> 27%)
Number of days with field capacity<125 <125 <125 <125
Depth to impermeable layer >80 cm >80 cm >80 cm >80 cmSoil organic matter content 3-6% 3-6% 3-6% 3-6%Type of land use Arable land Arable land Arable land Arable landStocking rate (if livestock is considered) No livestock No livestock No livestock No livestockAverage precipitation (in/year) 30 30 30 30 in/yearTypical slope of hillside in the related area 3 3 3 3
%
Loss from Wind Erosion 10.374 10.374 10.127 10.127 t/ac/year
Bio
dive
rsity
Soi
l

Copyright © 2013 BASF Corporation
14
6.2. Cost Inputs
6.2.1. User Costs
User costs were evaluated for each alternative based on the fixed costs and variable costs per acre. Table 4 lists the total cost including fixed cost and the operating costs are the variable costs. The total cost minus the variable costs was calculated as the fixed costs. The other costs in Table 3 were used for the social aspects of the corn production AgBalance™.
Table 4: Input data cost and revenue for corn production in Iowa.
6.3. Social Inputs
6.3.1. Social metrics
Since this is an AgBalance™ study there are metrics with social factors evaluated for each alternative based on the factors defined in the AgBalance™ methodology. The input data for these metrics were based on data from farms in Iowa and if data was found for farmers raising corn, then this specific data was used. Table 5 lists the input data used in each of the alternatives based on a specific unit. In the final analysis, these values are set to the CB just as the environmental and economic values are set to the CB.
All Alternatives: Corn produced in Iowa in 2000 vs 2010% tillage method in each year 42 58 29 71
2000 Conv-till 2000 Cons-till 2010 Conv-till 2010 Cons-tillCostsTotal operating cost $/ac 272.00 272.00 534.64 534.64 $/acTotal cost including fixed $/ac 403.85 403.85 692.75 692.75 $/acCapital investments 59.11 59.11 58.75 58.75 $/yearDepreciations 29.77 29.77 60.19 60.19 $/yearMachinery costs FIXED 16.51 16.51 30.11 30.11 $/yearMachinery costs VARIABLE 18.57 18.57 33.87 33.87 $/year
General repair costs 4.13 4.13 7.52 7.52 $/yearMaintainance 2.06 2.06 3.76 3.76 $/yearEH&S programs and regulatory costs 500.00 500.00 500.00 500.00
$/year
IIllness & injury costs (medical, legal, lost time) 11.30 11.30 20.53 20.53
$/year
Property protection & warehousing costs 14.72 14.72 17.02 17.02
$/year
Costs for extra disposal 0 0 0 0 $/yearTraining costs 500.00 500.00 500.00 500.00 $/yearOther costs 10.14 10.14 20.32 20.32 $/year
Direct costs0 0 0 0
$/t of product
Economic Farm profits per year -7.45 -7.45 107.42 107.42 $/acSubsidies (not for AES) 85.58 85.58 28.50 28.50 $/acType & conditions os subsidies 0 0 0 0 $/acGross value of production (selling prices)per unit area 264.55 264.55 642.06 642.06
$/ac
0 0 0 0
Tota
l Cos
ts

Copyright © 2013 BASF Corporation
15
Table 5: Input social factors for corn production in Iowa.
All Alternatives: Corn produced in Iowa in 2000 vs 2010% tillage method in each year 42 58 29 71
2000 Conv-till 2000 Cons-till 2010 Conv-till 2010 Cons-tillSocial
Working accidents1.98227E-05 1.98227E-05 1.98227E-05 1.98227E-05
no./working hour
Occupational diseases8.33395E-07 8.33395E-07 8.33395E-07 8.33395E-07
no./working hour
Workers' wages (medium qualification level) 9.3 9.3 12.96 12.96
$/hour
Number of employees 82991 82991 71924 71924 no. in yearNumber of full-time equivalents 30482 30482 25133 25133 no. in yearTime spent for professional training 19193 19193 24672 24672
days/year
Number of memberships 7000 7000 7000 7000 no. in yearNumber of different member organizations 48 48 48 48
no. in year
% of leased land of total agricultural area 59 59 60 60
%
Land lease 120.00 120.00 184.00 184.00 $/ac
Percentage of women among farm proprietors 5.85 5.85 7.96 7.96
%
Number of people w/ disabilities employed 0 0 0 0
no./working hour
Students /trainees in dedicated education / training for agriculture
3490 3490 4180 4180no. in year
Total contributions to old-age insurance 7256.73 7256.73 13243.2 13243.2
$/year
Total contributions to accidents insurance 5591.00 5591.00 12561.00 12561.00
$/year
Total contributions to health insurance 1697.14 1697.14 3730.62 3730.62
$/year
Soci
al

Copyright © 2013 BASF Corporation
16
7. Data Sources
7.1. Environmental:
The environmental impacts for the production of the two alternatives were calculated from eco-profiles (a.k.a. life cycle inventories) for the individual components and for fuel usage. Life cycle inventory data for these eco-profiles were from several data sources, including BASF specific manufacturing data and customer supplied data. For the seed treatment and chlorpyrifos, surrogate eco-profiles for the insecticides and fungicides were used from Ecoinvent since these were small amounts and data for specific chemicals were not available. Overall, the quality of the data was considered medium-high to high. None of the eco-profile data was considered to be of low data quality. A summary of the eco-profiles is provided in Table 6.
Table 6: Summary of eco-profiles used in the corn production AgBalance™ analysis
Eco-Profile Source, Year Comments Seed Treatment 2010 Ecoinvent database Diesel Use - US US Avg., 1996 Boustead database5 Lubricants for Machinery 1996 Boustead database5 Urea Fertilizer Agrium, 2005 Boustead database5 DAP Fertilizer U of Minnesota., 2002 Boustead database5 K-Fertilizer DE Avg., 1997 Boustead database5 Water BASF well data, 1995 Boustead database5 Glyphosate 1997 Boustead database5
Acetochlor DE Avg., 1997
BASF, 2006 Boustead database5 Atrazine DE avg., 1997 Boustead database5
2,4-D herbicide DE Avg., 1997
BASF, 2006 Boustead database5 Ammonium sulfate DE Avg., 1996 Boustead database5 Crop oil DE Avg., 1996 Boustead database5 Chlorpyrifos 2010 Ecoinvent database BASF data sources are internal data, while the others are external to BASF. Internal data is confidential to BASF; however, full disclosure can be provided to NSF International for verification purposes.
7.2. Amounts and Costs:
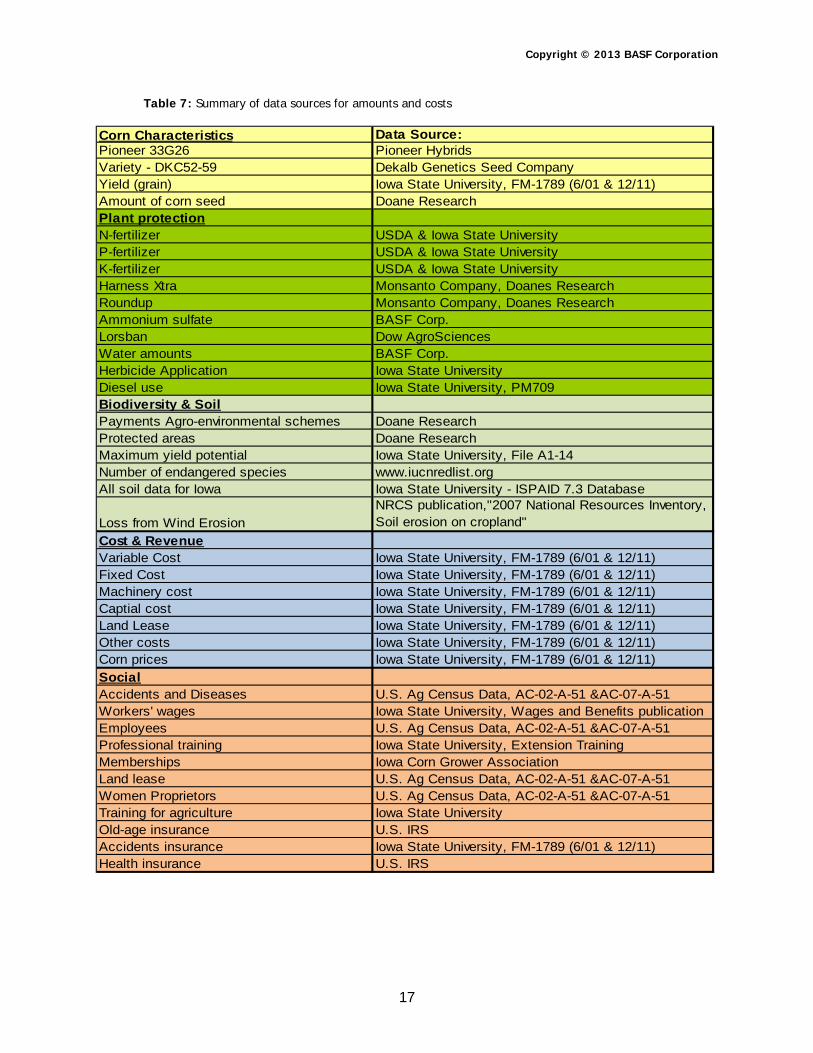
The data sources for the amounts and costs of the individual components were obtained from the BASF Agricultural Products Division. A summary of the source of this data is provided in Table 7.
Copyright © 2013 BASF Corporation
17
Table 7: Summary of data sources for amounts and costs
Corn Characteristics Data Source:Pioneer 33G26 Pioneer HybridsVariety - DKC52-59 Dekalb Genetics Seed CompanyYield (grain) Iowa State University, FM-1789 (6/01 & 12/11)Amount of corn seed Doane ResearchPlant protectionN-fertilizer USDA & Iowa State UniversityP-fertilizer USDA & Iowa State UniversityK-fertilizer USDA & Iowa State UniversityHarness Xtra Monsanto Company, Doanes ResearchRoundup Monsanto Company, Doanes ResearchAmmonium sulfate BASF Corp.Lorsban Dow AgroSciencesWater amounts BASF Corp.Herbicide Application Iowa State UniversityDiesel use Iowa State University, PM709Biodiversity & SoilPayments Agro-environmental schemes Doane ResearchProtected areas Doane ResearchMaximum yield potential Iowa State University, File A1-14 Number of endangered species www.iucnredlist.orgAll soil data for Iowa Iowa State University - ISPAID 7.3 Database
Loss from Wind Erosion NRCS publication,"2007 National Resources Inventory, Soil erosion on cropland"
Cost & RevenueVariable Cost Iowa State University, FM-1789 (6/01 & 12/11)Fixed Cost Iowa State University, FM-1789 (6/01 & 12/11)Machinery cost Iowa State University, FM-1789 (6/01 & 12/11)Captial cost Iowa State University, FM-1789 (6/01 & 12/11)Land Lease Iowa State University, FM-1789 (6/01 & 12/11)Other costs Iowa State University, FM-1789 (6/01 & 12/11)Corn prices Iowa State University, FM-1789 (6/01 & 12/11)SocialAccidents and Diseases U.S. Ag Census Data, AC-02-A-51 &AC-07-A-51Workers' wages Iowa State University, Wages and Benefits publicationEmployees U.S. Ag Census Data, AC-02-A-51 &AC-07-A-51Professional training Iowa State University, Extension TrainingMemberships Iowa Corn Grower AssociationLand lease U.S. Ag Census Data, AC-02-A-51 &AC-07-A-51Women Proprietors U.S. Ag Census Data, AC-02-A-51 &AC-07-A-51Training for agriculture Iowa State UniversityOld-age insurance U.S. IRSAccidents insurance Iowa State University, FM-1789 (6/01 & 12/11)Health insurance U.S. IRS

Copyright © 2013 BASF Corporation
18
8. AgBalance™ Results and Discussion
8.1. Environmental Impact Results:
The environmental impact results for the Corn Production AgBalance™ are generated as defined in Section 3.2.1., Environmental Burden Metrics. The results discussed in Section 8.1.1 through 8.3 (depicted in Figures 5 through 22) are for the Base Case only and do not represent any of the Scenarios.
8.1.1. Primary energy consumption:
Energy use is predominamtly affected by the fertilizer production and the amount of fertilizer that is needed per customer benefit. There was an energy reduction of 10% in 2010 operations when compared to 2000 operations. More fertilizer was used in 2010 than in 2000, but due to the increase in yield the amount of fertilizer per CB was smaller. There is also a reduction from the plant protection, harvesting and tillage and planting. The energy reduction from plant protection was in the reduction of the amounts. In the other operations, the energy reduction is mainly from less fuel use, this is due to higher yields and the amounts based on 1 ton of corn as the CB. Figure 5 shows the key drivers for the primary energy consumption. Renewable energy sources were analyzed in this study, but made up only 3% of the total energy sources.
Figure 5. Primary energy consumption.
8.1.2. Raw material consumption:
Figure 6 shows that the key driver for the raw material or resource consumption is dominated by the production of fertilizers and the relevant energy carriers. More than 60 g of fertilizer (N, P, K) were used per kg of corn (>60 kg per CB) in 2010 and more than 65 g of fertilizer per kg of corn in 2000.

Copyright © 2013 BASF Corporation
19
Per the BASF AgBalance™ methodology, individual raw materials are weighted according to their available reserves and current consumption profile. These weighting factors are appropriate considering the context of this study. Phosphorous is the main resource that dominates raw material consumption (apart from energy carriers like coal, lignite, oil and gas). Within the different resources assessed Phosphorous is weighted highly since it is scarce. Figure 7 shows the overall use of individual raw materials for the production of corn in 2000 and 2010.
Figure 6. Raw Material consumption by Module.
Figure 7. Raw Material consumption by Type.
Copyright © 2013 BASF Corporation
20
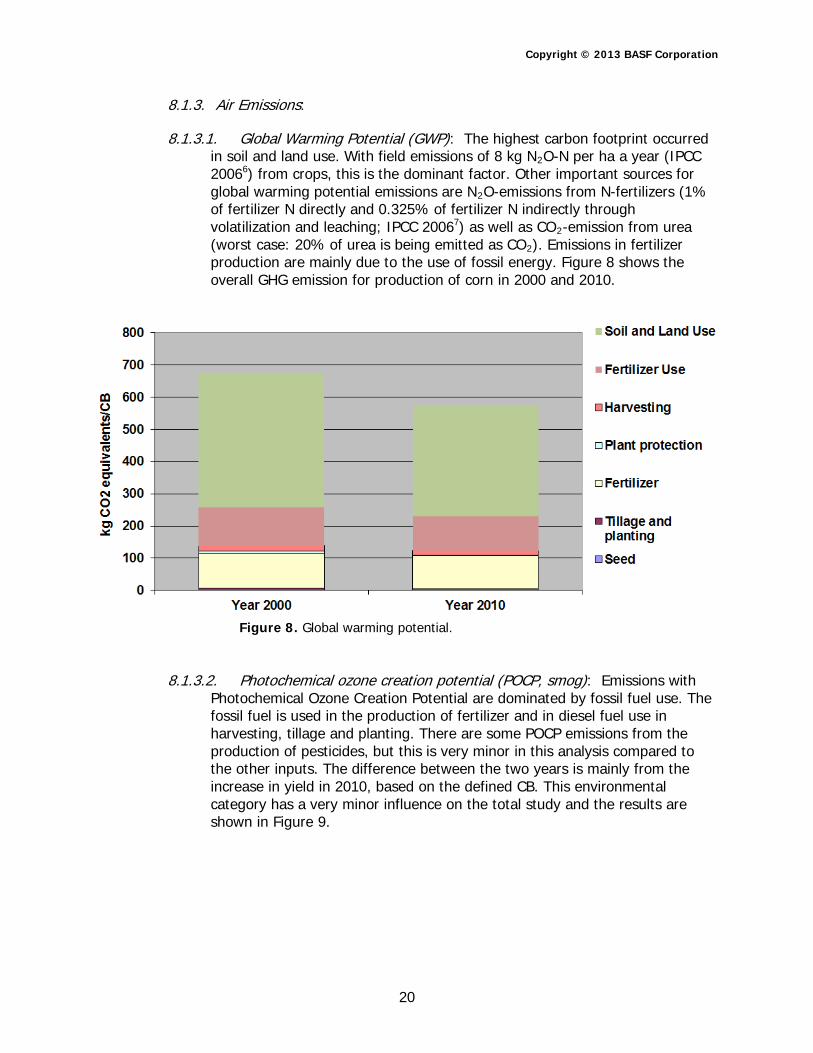
8.1.3. Air Emissions:
8.1.3.1. Global Warming Potential (GWP): The highest carbon footprint occurred in soil and land use. With field emissions of 8 kg N2O-N per ha a year (IPCC 20066) from crops, this is the dominant factor. Other important sources for global warming potential emissions are N2O-emissions from N-fertilizers (1% of fertilizer N directly and 0.325% of fertilizer N indirectly through volatilization and leaching; IPCC 20067) as well as CO2-emission from urea (worst case: 20% of urea is being emitted as CO2). Emissions in fertilizer production are mainly due to the use of fossil energy. Figure 8 shows the overall GHG emission for production of corn in 2000 and 2010.
Figure 8. Global warming potential.
8.1.3.2. Photochemical ozone creation potential (POCP, smog): Emissions with Photochemical Ozone Creation Potential are dominated by fossil fuel use. The fossil fuel is used in the production of fertilizer and in diesel fuel use in harvesting, tillage and planting. There are some POCP emissions from the production of pesticides, but this is very minor in this analysis compared to the other inputs. The difference between the two years is mainly from the increase in yield in 2010, based on the defined CB. This environmental category has a very minor influence on the total study and the results are shown in Figure 9.

Copyright © 2013 BASF Corporation
21
Figure 9. Photochemical ozone creation potential.
8.1.3.3. Ozone depletion potential (ODP): Overall, the ODP emissions are very small and are dominated by the production of other plant protection agents (halogenated hydrocarbons) in 2000. The plant protection agents are the insecticides and herbicides. This environmental category has a very minor influence also and the results are shown in Figure 10.
Figure 10. Ozone depletion potential.
8.1.3.4. Acidification potential (AP): It can be seen in Figure 11 that overall, NH3- and NOx emissions from fertilizer use are dominant. According to literature8, 2% of N-fertilizers are emitted as NH3 and 2% as NOx respectively. Another
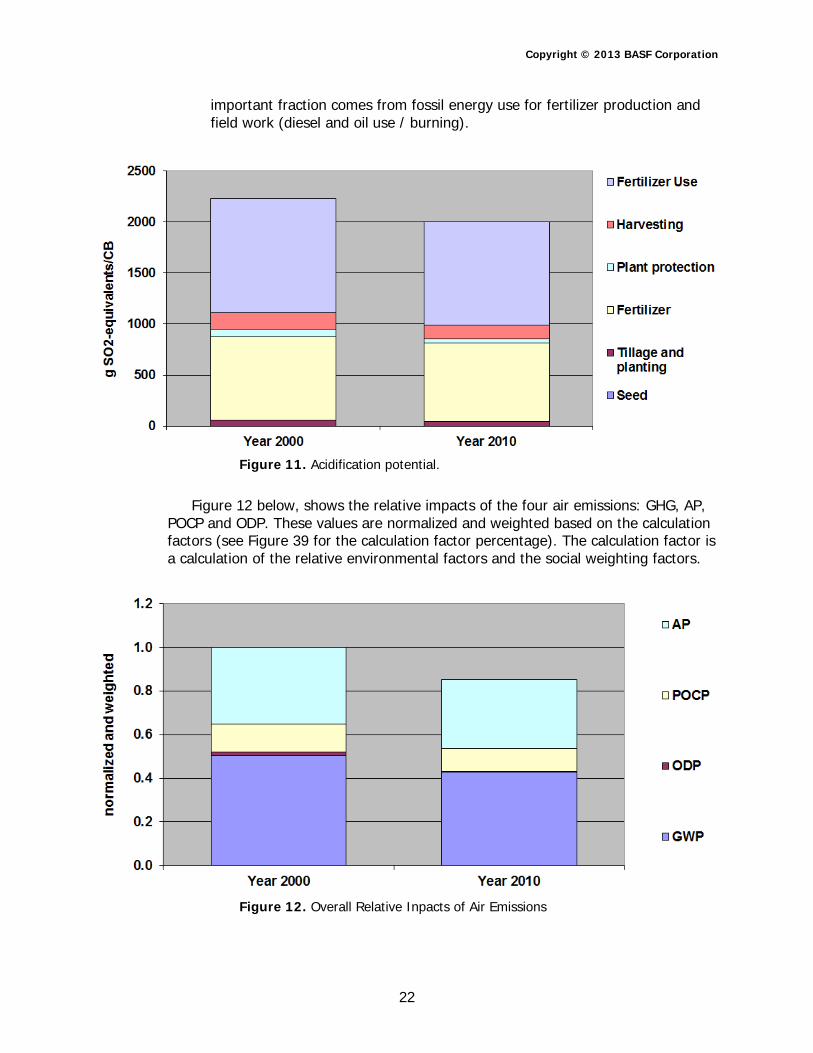
Copyright © 2013 BASF Corporation
22
important fraction comes from fossil energy use for fertilizer production and field work (diesel and oil use / burning).
Figure 11. Acidification potential.
Figure 12 below, shows the relative impacts of the four air emissions: GHG, AP, POCP and ODP. These values are normalized and weighted based on the calculation factors (see Figure 39 for the calculation factor percentage). The calculation factor is a calculation of the relative environmental factors and the social weighting factors.
Figure 12. Overall Relative Inpacts of Air Emissions

Copyright © 2013 BASF Corporation
23
8.1.4. Water emissions:
Figure 13 displays that water emissions changes are dominated by fertilizer use and some from pesticide use. The main substances of concern emitted from fertilizers are leaching through the soil and from heavy metals. From pesticides the concern is from carbon compounds. These carbon compounds from pesticides are evaluated for the amount of water needed or the Chemical Oxygen Demand (COD) to acceptable levels. According to literature sources9 mineral fertilizers contain a substantial amount of heavy metals (up to 2 g per kg). A worst case scenario was used here. Up to 10% of fertilizer N (depending on climate and region) ends up as a water emission and up to 1% of fertilizer P ends up as water emission.10 Both the N-water-emissions and P-water-emissions are included as part of the AgBalance™ base case.
Figure 13. Water emissions.
8.1.5 Solid waste generation:
Solid waste emissions have minor influence on the overall result. Solid wastes (chemicals) generated in fertilizer and plant protection production are the dominating factors. These waste values include municipal, hazardous and mining waste. Hazardous waste is generated from production of pesticides, fertilizers and diesel fuel. Figure 14 displays the solid waste emissions for the two alternatives.

Copyright © 2013 BASF Corporation
24
Figure 14. Solid waste generation.
8.1.6 Land use:
As displayed in Figure 15, land use is assessed for each alternative. Land use is one of the most important environmental categories for agricultural processes assessed with AgBalance™. The land use impact assessment takes into account an Ecosystem Damage Potential11,12 (EDP), with damage functions and generic characterization factors for quantifying damages to ecosystems from land occupation and land transformation. EDP is based on an assessment of the impacts of land use on species diversity.
The land use in the study is quite significant to the overall study with the calculation factor being 25%. The majority of the land use changes between 2000 and 2010 are due to the increase in yield and less land is needed per CB. The land use reduction is over 35% in 2010 compared to 2000. Land use for production of fertilizers is negligible to the overall land use amounts. The units for the land use metric are square meters each year/CB (one metric ton of corn).

Copyright © 2013 BASF Corporation
25
Figure 15. Land use – EDP assessment.
8.1.7 Eco-Toxicity potential:
The Eco-toxicity potential for the corn production in Year 2000 and Year 2010 were analyzed for the Use phases only of their respective life cycles. In agricultural production, chemicals are intentionally released into the environment, i.e., fertilizers and pesticides. As a result, eco-toxicity is integrated within the AgBalance™ methodology. The method used for the determination of the eco-toxicity potential follows the basic rules of the European Union Risk Ranking System (EURAM).13 This evaluation is based on water solubility, water/octanol partition coefficient, biodegradability and toxicity towards water organisms, plants, bacteria. These data are usually available in the material safety data sheets. The scoring system is based on the principles of environmental risk assessment (i.e. risk as the product of hazard and exposure) and the ultimate end-point in the environment. This includes an assessment of biodegradability, according to the OECD criteria (inherent/readily biodegradable/persistent).
For the toxicity of the chemicals used by the farmer in the Use phase, these values are assessed in the Social parameters for toxicity potential to the farmer. The toxicity scoring for the farmer uses the R-phrase for the toxicity of the final products and the relevant material quantities. This value is then assesed with other social factors for the farmer/employees and the final number is normalized to 1.0 for the worse case alternative, see Figure 22.
For the toxicity production phase of the raw materials, not only were the final toxicity of the products considered but the entire pre-chain of chemicals required to manufacture the products were considered as well. These values are assessed in AgBalance™ but are not part of the overall environmental rating, like they were in EEA.

Copyright © 2013 BASF Corporation
26
The use of nanoparticles were not evaluated in the chemical inputs for any of the alternatives, therefore the toxicity of nanoparticles was not evaluated in the study results.
The application of the insecticide in Year 2000 to the soil has a major impact on the eco-toxicity, compared to Year 2010, when no insecticide was applied to the soil. The hybrid seed technology allows for the seed to be insect resistant and thus no insecticide is needed for the plant. The eco-toxicity of the insecticide used in 2000 was evaluated, however the eco-toxicity of the plant hybrid used in 2010 was not evaluated since the resistance is built into the plant structure.
As to be expected the application of the materials (fertilizer, herbicides, insecticides and fungicide) during the Use phase contributed the largest amount to the ecotoxicity potential for each alternative. Figure 16 shows the ecotoxicity of the two alternatives.
Figure 17 shows the overall toxicity potential score for each alternative and how the scoring is distributed across the life cycle stages. The values have been normalized and weighted. For the weighting, the human health toxicity was weighted as 50% of the total toxicity potential with the Use phase making up 70% of this total and Production phase making up 30% of this total. The eco-toxicity made up the other 50% of the total toxicity potential with all of this being the Use phase. Consistent with the discussion above, the Use phase is the most significant and disposal was not evaluated. A high safety standard was assumed for the manufacturing processes for the raw materials. For the Use phase, an allowance was made to take into consideration the open nature of the application process. For the normalization, the highest toxicity potential alternative was set to a value of 1 and the other alternative was proportioned to this value.
Figure 16. Overall Eco-toxicity potential

Copyright © 2013 BASF Corporation
27
Figure 17. Overall Toxicity potential - Life Cycle Phases
8.1.8 Risk potential (Occupational Illnesses and Accidents potential):
All the materials and activities accounted for in the various life cycle stages were assigned specific NACE codes. NACE (Nomenclature des Activities Economiques) is a European nomenclature which is very similar to the NAICS codes in North America. The NACE codes are utilized in classifying business establishments for the purpose of collecting, analyzing, and publishing statistical data related to the business economy and is broken down by specific industries. Specific to this impact category, the NACE codes track, among other metrics, the number of working accidents, fatalities and illnesses and diseases associated with certain industries (e.g. chemical manufacturing, petroleum refinery, inorganics etc.) per defined unit of output. By applying these incident rates to the amount of materials required for each alternative, a quantitative assessment of risk is achieved.
In Figure 18, the greatest Occupational Illnesses and Accident potential occurs in the production of fertilizers. The field work also contributes to the risk potential for occupational illnesses and accidents, but this does not include the cultivation process.
Copyright © 2013 BASF Corporation
28
Figure 18. Occupational Illnesses and Accidents
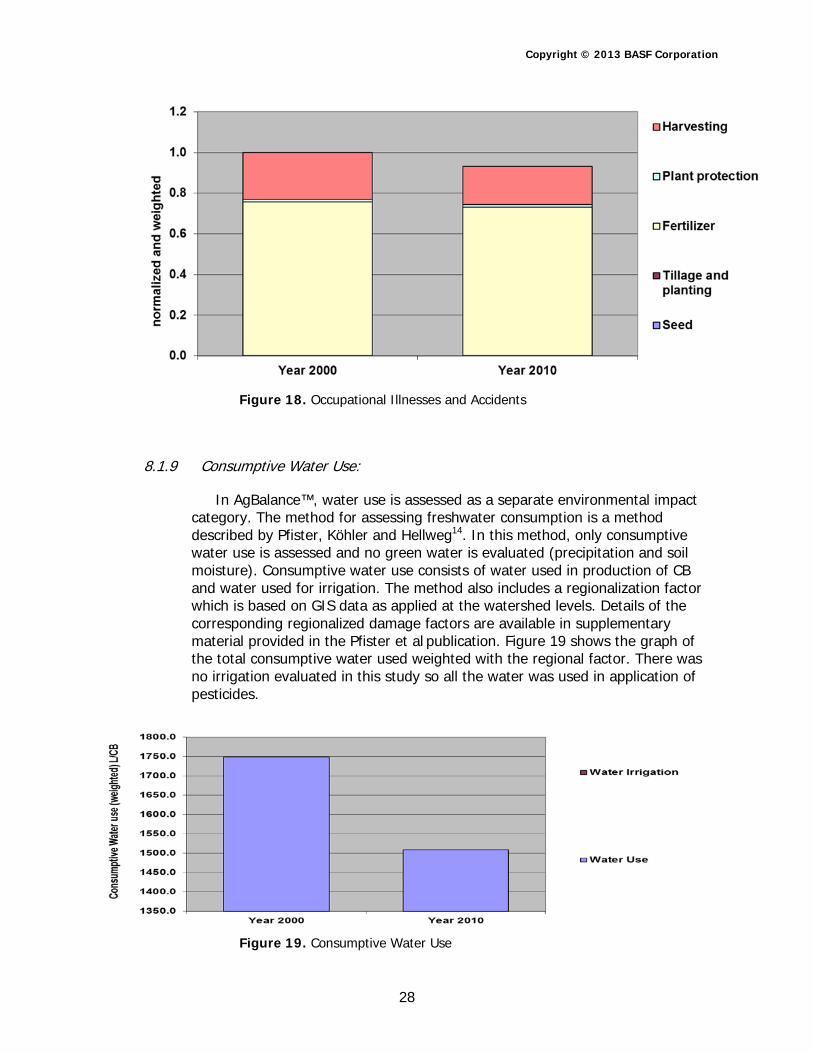
8.1.9 Consumptive Water Use:
In AgBalance™, water use is assessed as a separate environmental impact category. The method for assessing freshwater consumption is a method described by Pfister, Köhler and Hellweg14. In this method, only consumptive water use is assessed and no green water is evaluated (precipitation and soil moisture). Consumptive water use consists of water used in production of CB and water used for irrigation. The method also includes a regionalization factor which is based on GIS data as applied at the watershed levels. Details of the corresponding regionalized damage factors are available in supplementary material provided in the Pfister et al publication. Figure 19 shows the graph of the total consumptive water used weighted with the regional factor. There was no irrigation evaluated in this study so all the water was used in application of pesticides.
Figure 19. Consumptive Water Use

Copyright © 2013 BASF Corporation
29
8.1.10 Biodiversity:
By definition, biodiversity cannot scientifically be quantified in its totality. Therefore, any quantification of “biodiversity” is an approximation, requiring the relevant elements of biodiversity to be defined and the appropriate indicators used. In AgBalance™, the impact of agricultural activity on biodiversity is assessed as a relative function, constructed from the Biodiversity State Indicator, which is a factor based on the number of endangered species. Further indicators have the potential to increase or decrease biodiversity. The factors evaluated in this AgBalance™ study were Biodiversity State Indicator (establish baseline), Agri-Environmental Schemes, Protected Areas, Eco-toxicity, Farming intensity, Nitrogen Surplus, Potential for intermixing and Crop Rotation. Crop rotation was not evaluated in this study so the values for Potential for intermixing and Crop Rotation were the same for 2000 and 2010. The actual normalized values for the biodiversity assessments from the study are shown in Table 8.
Table 8: Normalized Biodiversity values for corn production in Iowa.
8.1.11 Soil:
The AgBalance™ methodology for the Soil impact category uses different indicators, which are designed to capture the main impacts to long-term soil quality as a result of human agricultural activity on arable landt. These indicators consist of: Soil Organic Matter balance, Nutrients (N, P, K) balance, Soil Compaction Potential, and Erosion. Table 9 shows the normailized values for the soil assessment from the study.
Biodiversity Year 2000 Year 2010Biodiversity indicator 0.94 0.94
Agri-environmental schemes 1.30 1.17Protected areas 1.00 1.00
Crop rotation 0.60 0.60Eco-tox potential 0.60 1.00Farming intensity 0.67 0.63
Intermixing potential 0.83 0.83Nitrogen Surplus 0.85 0.88
Result biodiversity 0.21 0.30Normalized biodiversity 1.00 0.70

Copyright © 2013 BASF Corporation
30
Table 9: Normalized Soil values for corn production in Iowa.
8.1.12 Environmental fingerprint:
Following normalization, or normalization and weighting with regards to the emissions categories, the relative impact for all eight of the environmental categories for each alternative was calculated. The actual environmental category values from the study are shown in Table 10 and the graph of these values are shown in the environmental fingerprint, Figure 20. A value of 1 represents the alternative with the highest impact in the concerning category, all other alternatives are rated in relation to 1.
The 2010 corn production is better than 2000 corn production in all the environmental categories as shown in the environmental fingerprint. As discussed previously in the individual impact categories, the higher yield in 2010 corn production clearly is the main impact on the environmental life cycle impacts due to less inputs needed to produce the CB of one ton of corn. The greatest environmental advantages in 2010 corn production over 2000 corn production can be noticed in the following categories:
• Eco-toxicity • Land use • Biodiversity
Table 10: Normalized environmental category values for corn production in Iowa.
Soil Year 2000 Year 2010Nutrients:N 1.00 1.00Nutrients:P 0.83 0.81Nutrients:K 1.00 1.00
Humus 1.00 0.59Compaction 1.00 1.00
Erosion 1.00 0.98Result soil 0.97 0.90
Normalized aggregated soil 1.00 0.92
Data for environmental fingerprint Year 2000 Year 2010
Energy Consumption 1.00 0.89Emissions 1.00 0.88Eco-Toxicity Potential 1.00 0.48Resource Consumption 1.00 0.90Land Use 1.00 0.65Water Use (No irrigation) 1.00 0.86Biodiversity 1.00 0.70Soil 1.00 0.92

Copyright © 2013 BASF Corporation
31
Figure 20. Environmental fingerprint corn production.
8.2 Economic Cost Fingerprint:
The life cycle cost data for AgBalance™ are generated as defined in Section 5 of the BASF AgBalance™ methodology and described in section 6.2 above. The results of the life cycle cost analysis found that the cost in 2010 were lower due to the increase in yield. See Table 3 in section 6.2 above for production cost (fixed and variable) for 1 acre in both 2000 and 2010. Figure 21 represents the graph of the costs for each of the alternatives based on the total cost.
For each alternative, the macro-economic indicators are quantified according to the principles outlined below. The resulting values in USD/ha are then summed up, according to the formula: Macro-economic Indicator Result (a) [USD/ha] = Farm Profits (a) [USD/ha] – Subsidies (a) [USD/ha] + Productivity (a) [USD/ha]. Here (a) denotes the specific result for a given alternative.
The macroeconomic indicator value is aggregated with the costs to the economic score of each alternative. Figure 22 shows the graph of the fixed, variable and macro-economic “costs”. In the case of this study, the profits from 2000 were a negative number, therefore the farm net worth expressed in $/ha was added to the equation in order to get a positive value and to show the impact of a negative profit on the net worth of the farm. Table 11 lists all the cost result values used in the economic cost fingerprint.

Copyright © 2013 BASF Corporation
32
Figure 21. Corn production costs
Table 11: Economic cost fingerprint values for corn production in Iowa.
Fixed cost/CB USD/CBVariable cost/CB USD/CBTotal cost (fix + variable)/CB USD/CBProfit/CB USD/CBProfit/ha USD/haIowa Farm Net Worth (Ave) USDIowa Farm Net Worth/ha USD/haSubsidies (not for AES)/CB USD/CBSubsidies (not for AES)/ha USD/haNet Worth+Profit-Subsidies/ha USD/haMacro-Economic Costs/ha USD/ha
Average Farm size in Iowa (ha) ha
294.21 70.39
1238211.00
2642.47 5292.24
553 600
2123.1132.79
2652.27
5097.306.45
5303.59
-2.85 24.30-18.40 265.33
475337.00
50.52 35.77104.22 120.96154.75 156.74

Copyright © 2013 BASF Corporation
33
Figure 22. Economy Fingerprint corn production
8.3 Social Fingerprint:
The assessment of social impacts in the up- and downstream processes in AgBalance™ is based on the SEEBALANCE® method15,16. This approach to social assessment is based on a sectoral assessment, where key social figures from different industry segments are related to their corresponding production volumes. The resulting social profiles for processes or products then assume a format, equivalent to the eco-profiles, used in the environmental part. See Table 12 for the result values for the corn production social fingerprint data and Figure 23 for the corn production social fingerprint.
For all social indicators, a quantitative relationship is made for the production volumes of a given industry sector (e.g. ‘occupational diseases per kg product’). With this approach, it is possible to relate the inputs and outputs from the environmental life cycle assessment to the social indicators. To this end, different statistical databases are combined to connect social indicators to production volumes. The link between products and corresponding social impacts is made by a sector assessment. It is based on the ‘Nomenclature générale des activités économiques dans les Communautés Européennes’ (NACE, general nomenclature of economical activities in the European Community), an initiative that classifies all industries into different sectors, or the ISIC, the International Standard Industrial Classification. All products can be linked to these NACE/ISIC codes, using the product classification list (CPA =
Copyright © 2013 BASF Corporation
34
Classification of Products by Activity). The numbers for the official statistics in Europe are frequently stored in this format.
Table 12: Social fingerprint values for corn production in Iowa.
Figure 23. Social Fingerprint corn production
Ag Modul Unit Year 2000 Year 2010Working hours h / CB 0.713 0.622
Country USA USA
Farmer Working Accidents number / CB 1.42E-05 1.17E-05Occupational Diseases number / CB 5.98E-07 4.91E-07Toxicity Potential points / CB 9.08E+01 8.63E+01Wages PPP Dollar / CB 6.63 8.06Professional Training h / CB 1.82E-03 2.83E-03Organization normalized 1.00 0.87
Consumer Residues in Food&Feed rating 1.00 1.00Residues of GMO in Food rating 0.03 0.03
Local/Nat. Commun. Access to Land EUR / CB 20.77 20.31Employment hours / CB 1.94 1.78Gender Equality %dev 44.15 42.04Integration working years / CB 0.00 0.00
International Commun Imports from Devel. Countries EUR -1.79E+09 -3.50E+09Fair Trade EUR / CB 0.00 0.00Child Labor working years / CB 0.00 0.00
Future Generations Trainees h / CB 5.50E-05 8.00E-05Social Security EUR / CB 4.98 8.83

Copyright © 2013 BASF Corporation
35
8.4 AgBalance™ Analysis Portfolio (Single Score):
At the highest aggregated level, the results of the environmental, social and economic assessments are presented as Single Score diagrams. This format is also used to illustrate the total socio-eco-efficiency score of the AgBalance™ evaluation, see Figure 24. This format offers a high degree of clarity and has been introduced as a new feature within AgBalance™. Conventional portfolio-diagrams (eco-efficiency) are also created and documented in the study report, see Figure 25. The normalized values from the environmental, social, and economic fingerprint are aggregated into a single relative score through the use of relevance, societal factors and the E/C or S/C scaling factors. Given that the analysis features multiple criteria and a plethora of single results, it is vitally important to show the final conclusions in a transparent and easy-to-understand way. Otherwise, it would be impossible for the reader of an AgBalance™ study to easily aggregate.
The results in Figure 24 show the individual scores of the Ecology, Society and Economy of the AgBalance™ study. The Year 2010 has the best results compared to 2000 in all of these graphs due to the normalized value being lower. In these graphs, the better score is closer to 0.6 and a worst score is closer to 1.4. These are established based on the normalized values being centered at 1 or the individual normalized value being divided by the average score of all the alternatives. The Total Score graph shows the sum of the Ecology, Society and Economy assessments with each having equal weighting of 33.33%.
For a clearer understanding of how weighting and normalization is determined and applied please reference Section 8 of BASF’s Part A submittal to P-352. Specific to this study, the worksheets “Relevance” and “Evaluation” in the Eco-efficiency model provided to NSF as part of this verification process should be consulted to see the specific values utilized and how they were applied to determine the appropriate calculation factors. Specific to the choice of environmental relevance factors and social weighting factors applied to this study, factors for the USA (national average) were utilized. The environmental relevance values utilized were last reviewed in 2007 and the social weighting factors were recently updated in 2009 by an external, qualified 3rd party.
Figure 25 displays the Base Case (BC) eco-efficiency portfolio, which shows the results when all six individual environmental categories are combined into a single relative environmental impact and combined with the life cycle cost impact. Because environmental impact and cost are equally important, the most eco-efficient alterative is the one with the largest perpendicular distance above the diagonal line and the results from this study find that corn Production in 2010 is the more eco-efficient alternative due to its combination of lower environmental burden and having the lowest life cycle cost.

Copyright © 2013 BASF Corporation
36
Figure 24. Total socio-eco-efficiency score of the AgBalance™ – Corn Production
Figure 25. Eco-Efficiency Portfolio Base Case – Corn Production

Copyright © 2013 BASF Corporation
37
8.5 Scenario Analysis:
In addition to the base case analysis, additional scenarios were evaluated to determine the sensitivity of the studies final conclusions and results to key input parameters. These scenarios are hypothetical technological or operational improvements.
8.5.1 Scenario #1: 5% reduction of corn production yield from the base case in 2010.
In this scenario analysis the yield for the 2010 operations is decreased by 5%, based on other data sources for Iowa corn production showing yield in 2010 at 165 bu/acre (Base case had 174 bu/acre for yield). This scenario shows that yield has a major impact on the analysis since the CB is a fixed amount and any decrease in yield would increase the environmental and cost burden. The socio-eco-efficiency score can be seen in Figure 26 and the difference between the two alternatives is less than the base case. Year 2010 is still better than the Year 2000 in all the assessments. Figure 27 shows the Eco-efficiency Portfolio results of Scenario #1 and the changes from the base case. Figure 28 shows the Environmental Fingerprint of Scenario #1, with the Year 2000 being slightly better than the base case but still not better than Year 2010.
Figure 26. Total socio-eco-efficiency score corn production – Scenario #1

Copyright © 2013 BASF Corporation
38
Figure 27. Eco-Efficiency Portfolio corn production – Scenario #1
Figure 28. Environmental fingerprint corn production – Scenario #1

Copyright © 2013 BASF Corporation
39
8.5.2 Scenario #2: Comparison of conventional tillage in 2000, conventional tillage in 2010 and conservative tillage in 2010.
In this scenario analysis, the different tillage options were analyzed individualy to show the impact of the tillage processes on the study. The socio-eco-efficiency score can be seen in Figure 29. The impact of the two years tillage operations is quite interesting where Year 2000 Conv. tillage is better than Year 2010 in the Society assessment. However in Ecology and Economy, Year 2010 is still better than Year 2000 independent of the tillage operations and the Total Score is still better in Year 2010. The slight Ecology difference between Conventional and Conservative tillage in 2010 has to do with more pesticide application in Conservative tillage, since the ground is not being worked to kill weeds. There is a slight change in the environmental fingerprint compared to the base case where Year 2010 conservative tillage has a greater use and impact on water use, due to the water use on additional application of pesticides. The cost of the tillage evaluation from the base case has not changed, but the environmental impact does shift based on tillage practices. Figure 30 shows the Eco-efficiency Portfolio results of Scenario #2 and Figure 31 shows the Environmental Fingerprint of Scenario #2.
Figure 29. Total socio-eco-efficiency score corn production – Scenario #2

Copyright © 2013 BASF Corporation
40
Figure 30. Eco-Efficiency Portfolio corn production – Scenario #2
Figure 31. Environmental fingerprint corn production – Scenario #2

Copyright © 2013 BASF Corporation
41
8.5.3 Scenario #3: Comparison of conservative tillage operations in 2000 versus conservative tillage in 2010.
In this scenario analysis, the conservative tillage for 2000 was compared against conservative tillage in 2010. From the anlysis, the conservative tillage has very minimal impact from the base case. There is a minor change in the Society assement compared to the base case and a little shift in the portfolio where the alternatives move slightly closer. In the environmental fingerprint the scenario analysis is just the same as the base case. Figure 32 shows the socio-eco-efficiency score of Scenario #3, Figure 33 shows the Eco-efficiency Portfolio results of Scenario #3 and Figure 34 shows the Environmental Fingerprint of Scenario #3.
Figure 32. Total socio-eco-efficiency score corn production – Scenario #3

Copyright © 2013 BASF Corporation
42
Figure 33. Eco-Efficiency Portfolio corn production – Scenario #3
Figure 34. Environmental fingerprint corn production – Scenario #3

Copyright © 2013 BASF Corporation
43
8.5.4 Scenario #4: Yield for 2000 set at the same yield as 2010.
In this scenario analysis, the yield for both 2000 and 2010 was set to the yield data from 2010 (174 bushel/acre). From the anlysis, the socio-eco-efficiency score is still better for Year 2010 over Year 2000 in all the assessments, although the Ecology and Economy are much closer and a slight change in Society as compared to Base Case. The Eco-efficiency portfolio in Scenario #4 however shows that Year 2000 was better than Year 2010 compared to the Base Case. For the environmental fingerprint Year 2000 was better for the environmental categories that affect the corn production and not the AgBalance metrics. Figure 35 shows the socio-eco-efficiency score of Scenario #4, Figure 36 shows the Eco-efficiency Portfolio results of Scenario #4 and Figure 37 shows the Environmental Fingerprint of Scenario #4.
Figure 35. Total socio-eco-efficiency score corn production – Scenario #4

Copyright © 2013 BASF Corporation
44
Figure 36. Eco-Efficiency Portfolio corn production – Scenario #4
Figure 37. Environmental fingerprint corn production – Scenario #4

Copyright © 2013 BASF Corporation
45
9. Data Quality Assessment
9.1. Data Quality Statement:
The data used for parameterization of the corn production AgBalance™ was sufficient with most parameters of high data quality. Moderate data is where industry average values or assumptions pre-dominate the value. No critical uncertainties were identified within the parameters and assumptions that could have a significant effect on the results and conclusions. The data is from agricultural production of corn in the state of Iowa and most of the data is from 2000 and 2010 sources. There are a few sources with data before 2000, see Appendix A for data sources and years. Table 13 provides a summary of the data quality for the corn production study.
Table 13: Data quality evaluation for Corn production parameters.
Corn Characteristics Quality Statement Data Source:Pioneer 33G26 High Pioneer HybridsVariety - DKC52-59 High Dekalb Genetics Seed CompanyYield (grain) High Iowa State University, FM-1789 (6/01 & 12/11)Amount of corn seed High Doane ResearchPlant protectionN-fertilizer High USDA & Iowa State UniversityP-fertilizer High USDA & Iowa State UniversityK-fertilizer High USDA & Iowa State UniversityHarness Xtra High Monsanto Company, Doanes ResearchRoundup High Monsanto Company, Doanes ResearchAmmonium sulfate Mod-High BASF Corp.Lorsban High Dow AgroSciencesWater amounts High BASF Corp.Herbicide Application Mod-High Iowa State UniversityDiesel use Mod.-High Iowa State University, PM709Biodiversity & SoilPayments Agro-environmental schemes Mod.-High Doane ResearchProtected areas Moderate Doane ResearchMaximum yield potential Moderate Iowa State University, File A1-14 Number of endangered species Mod.-High www.iucnredlist.orgAll soil data for Iowa Moderate Iowa State University - ISPAID 7.3 Database
Loss from Wind Erosion ModerateNRCS publication,"2007 National Resources Inventory, Soil erosion on cropland"
Cost & RevenueVariable Cost Mod-High Iowa State University, FM-1789 (6/01 & 12/11)Fixed Cost Mod-High Iowa State University, FM-1789 (6/01 & 12/11)Machinery cost Moderate Iowa State University, FM-1789 (6/01 & 12/11)Captial cost High Iowa State University, FM-1789 (6/01 & 12/11)Land Lease High Iowa State University, FM-1789 (6/01 & 12/11)Other costs Mod.-High Iowa State University, FM-1789 (6/01 & 12/11)Corn prices High Iowa State University, FM-1789 (6/01 & 12/11)SocialAccidents and Diseases Mod.-High U.S. Ag Census Data, AC-02-A-51 &AC-07-A-51Workers' wages Moderate Iowa State University, Wages and Benefits publicationEmployees Mod.-High U.S. Ag Census Data, AC-02-A-51 &AC-07-A-51Professional training Moderate Iowa State University, Extension TrainingMemberships Mod.-High Iowa Corn Grower AssociationLand lease High U.S. Ag Census Data, AC-02-A-51 &AC-07-A-51Women Proprietors High U.S. Ag Census Data, AC-02-A-51 &AC-07-A-51Training for agriculture Moderate Iowa State UniversityOld-age insurance Mod.-High U.S. IRSAccidents insurance Moderate Iowa State University, FM-1789 (6/01 & 12/11)Health insurance Mod.-High U.S. IRS

Copyright © 2013 BASF Corporation
46
10. Sensitivity and Uncertainty Analysis
10.1. Sensitivity and Uncertainty Considerations:
A sensitivity analysis of the final results indicates that the environmental impacts were more influential or relevant in determining the final relative eco-efficiency positions of the alternatives. This conclusion is supported by reviewing the BIP Relevance (or GDP-Relevance) factor calculated for the study. The BIP Relevance indicates for each individual study whether the environmental impacts or the economic impacts were more influential in determining the final results of the study. For this study, the BIP Relevance indicated that the environmental impacts were significantly more influential in impacting the results than the economic impacts (reference the “Evaluation” worksheet in the Excel model for the BIP Relevance calculation). The main assumptions and data related to environmental impacts were:
• Yield
• Emissions
• Fertilizer Application Rates
As the data quality related to these main contributors were of high to moderate high quality and scenario variations were run related to them (see section 8.4) , this strengthened our confidence in the final conclusions indicated by the study. Looking at the relevance factors of the study, see Figure 38, indicates that the impact with the highest environmental relevance was land use, followed by emissions and toxicity potential. This is to be expected, as the study dealt with the production of a crop and the use of fertilizers. When the social weighting factors, Figure 39, are combined with the relevance factors, emissions had the greatest overall impact on the study at 29%, with water emissions being the greatest impact in the emissions category. In the air emissions, GWP and AP are considered the two most important air emissions. The calculation factors, Figure 40, considers both the social weighting factors and the environmental relevance factors, indicate which environmental impact categories were having the largest affect on the final outcome. Calculation factors are utilized in converting the environmental fingerprint results (Figure 20) into the final, single environmental score as reflected in the total socio-eco-efficiency score (Figure 24) as well as the portfolio (Figure 25). The impacts with the highest calculation factors were similar to the environmental relevance factors, with regards to the six main impact categories. The emissions factor was slightly higher than the land use in the calculation factors. The input parameters that were related to these impact categories have sufficient data quality to support a conclusion that this study has a low uncertainty. The social weighting factors considered for this study did influence some minor reprioritization of the impact categories represented in the emissions and air emissions sub-categories.
Most of the input parameters for this study were mainly taken from data gathered at Iowa State University, which would be considered highly credible. The production of corn is an annual process and crops are usually rotated year after
Copyright © 2013 BASF Corporation
47
year. In this study, the evaluation was done for one growing season and the next crop was not evaluated.
Figure 38. Environmental Relevance factors that are used in the sensitivity and uncertainty analysis.
Figure 39. Social weighting factors that are used in the sensitivity and uncertainty analysis.
Energy 3% Resources 3%
Emissions 26%
Toxicity 20%
Risk 13%
Land Use 35%
Air 17%
Water 81%
Wastes 1%
GWP 53%
ODP 0% POCP 6%
AP 41%
Main Categories Emissions Air Emissions
Relevance Factor
Energy 17%
Resources 18%
Emissions 23%
Toxicity 20%
Risk 9%
Land Use 12%
Air 40%
Water 35%
Wastes 25%
GWP 36%
ODP 26%
POCP 15%
AP 23%
Main Categories Emissions Air Emissions
Social Weighting Factor

Copyright © 2013 BASF Corporation
48
Figure 40. Calculation factors that are used in the sensitivity and uncertainty analysis.
10.2. Critical Uncertainties:
There were no significant critical uncertainties from this study that would limit the findings or interpretations of this study. The data quality, relevance and sensitivity of the study support the use of the input parameters and assumptions as appropriate and justified.
11 Limitations of AgBalance™ Study Results 11.1. Limitations:
These corn production AgBalance™ results and its conclusions are based on the
specific comparison of the production, for the described customer benefit, alternatives and system boundaries. Transfer of these results and conclusions to other production methods or products is expressly prohibited. In particular, partial results may not be communicated so as to alter the meaning, nor may arbitrary generalizations be made regarding the results and conclusions.
Energy 8%
Resources 9%
Emissions 29%
Toxicity 20%
Risk 13%
Land Use 25%
Air 31%
Water 63%
Wastes 6%
GWP 51%
ODP 2% POCP 11%
AP 36%
Main Categories Emissions Air Emissions
Calculation Factor

Copyright © 2013 BASF Corporation
49
12. References 1. Kölsch, D; Saling, P.; Kicherer A.; Grosse-Sommer, A.; Schmidt, I.; Int. J. Sustainable
Development, 2008, 11, 1, 1. 2. Schmidt, I., Meurer, M., Saling, P. Reuter, W., Kicherer, A. and Gensch C-O. ‘SEEBALANCE®
managing sustainability of products and processes with the socio-eco-efficiency analysis by BASF, Greener Management International; 2005.
3. Iowa State University, 2000 Iowa Cost and Returns, FM-1789, June 2001
4. Iowa State University, 2010 Iowa Cost and Returns, FM-1789, Revised December 2011. 5. Boustead Consulting Ltd UK, The Boustead Model 5.1.2600.2180 LCA database. 6. Intergovernmental Panel on Climate Change, 2006 IPCC Guidelines for National Greenhouse
Gas Inventories, Chapter 11: N20 Emissions from Managed Soils, and CO2 Emissions from Lime and Urea Application, Table 11.1, page 11.11, 2006.
7. Intergovernmental Panel on Climate Change, 2006 IPCC Guidelines for National Greenhouse
Gas Inventories, Volume 4, Chapter 11: N20 Emissions from Managed Soils, and CO2 Emissions from Lime and Urea Application, Table 11.3, page 11.24, 2006.
8. Klöpffer,W.; Department of the Environment/Federal Environment Agency Austria: Life Cycle
Assessment of Genetically Engineered Products based on Comprehensive Assessment of Possible Environmental Impacts, internal BASF Ref.-ID 3411, 1999.
9. Levels of Nonnutritive Substances in Fertilizers, Report to the Legislature, Washington State Department of Agriculture and Washington State Department of Ecology, December 2007 http://agr.wa.gov/PestFert/Publications/docs/2007Non-NutritiveFertRptFINAL.pdf
10. FAO Corporate Document Repository, Control of water pollution from agriculture- FAO
irrigation and drainage paper 55, Chapter 3: Fertilizers as water pollutants, 1996. http://www.fao.org/docrep/W2598e/w2598e06.htm
11. Koellner, T., and Scholz, R., Assessment of Land Use Impacts on the Natural Environment, Part 1: An Analytical Framework for Pure Land Occupation and Land Use Change, International Journal LCA 12(1) 16-23, 2007.
12. Koellner, T., and Scholz, R., Assessment of Land Use Impacts on the Natural Environment,
Part 2: Generic Characterization Factors for Local Species Diversity in Central Europe, International Journal LCA 2006.
13. Saling, P.; Maisch, R.; Silvani, M.; König, N. Int. J. LCA, 10(5), 364-371 (2005).
14. Pfister, S. Koehler, A. and Hellweg, S., Assessing the Environmental Impacts of Freshwater
Consumption in LCA, Environmental Science & Technology Publication, American Chemical Society, April 23, 2009.

Copyright © 2013 BASF Corporation
50
15. Kölsch, D; Saling, P.; Kicherer A.; Grosse-Sommer, A.; Schmidt, I.; Int. J. Sustainable Development, 2008, 11, 1, 1.
16. Schmidt, I., Meurer, M., Saling, P. Reuter, W., Kicherer, A. and Gensch C-O. ‘SEEBALANCE®
managing sustainability of products and processes with the socio-eco-efficiency analysis by BASF, Greener Management International; 2005.

Copyright © 2013 BASF Corporation
51
Appendix A: Data Sources used for input data: General Data
• Iowa State University, 2000 Iowa Cost and Returns, FM-1789, June 2001. • Iowa State University, 2010 Iowa Cost and Returns, FM-1789, Revised December 2011.
Seeding
• Doane Research wbsite database, www.doane.com, 2000 and 2010 data. • Dekalb Seed Corn, DKC52-59 Brand (VT3) brochure, April 2012. • Maxim® 4FS Fungicide Label, Syngenta Crop Protection, LLC, pages 1-20, 2011. • Maxim® 4FS Fungicide Safety Data Sheet, Syngenta Crop Protection, LLC, pages 1-5,
Nov. 2011. • ApronXL® Fungicide Label, Syngenta Crop Protection, LLC, pages 1-15, 2012. • ApronXL® Fungicide Safety Data Sheet, Syngenta Crop Protection, LLC, pages 1-5,
Nov. 2010. • Poncho® 600 Insecticide Label, Bayer CropScience, LP, pages 1-7, 2010. • Poncho® 600 Insecticide, Safety Data Sheet, Bayer CropScience, LP, pages 1-7, Oct.
2006. Tillage and Planting
• Iowa State University - University Extension, Machinery Management-Fuel Required for Field Operations, PM-709, Revised April 2001.
Fertilizers
• United States Department of Agriculture (USDA) Economic Research Service Website – http://www.ers.usda.gov/data-products/fertilizer-use-and-price.aspx#26730, U.S. Fertilizer Use and Price, Tables 7, 8, 10, 12, 14, (May 2011)
• USDA- National Agricultural Statistics Service, 2011 Iowa Agricultural Statistics Bulletin, Page 71.
• Iowa State University - University Extension, Machinery Management-Fuel Required for Field Operations, PM-709, Revised April 2001.
Plant protection • Harness® Xtra Herbicide Label, Monsanto Company, pages 1-9, 2012. • Harness® Xtra Herbicide Safety Data Sheet, Monsanto Company, pages 1-13, May 2010. • Roundup Ultra® Herbicide Label, Monsanto Company, pages 1-19, 2010. • Roundup Ultra ® Herbicide Safety Data Sheet, Monsanto Company, pages 1-9, Feb.
2011. • Roundup Weathermax® Herbicide Label, Monsanto Company, pages 1-54, 2009. • Roundup Weathermax® Herbicide Safety Data Sheet, Monsanto Company, pages 1-9,
Sept. 2008. • Roundup PowerMax® Herbicide Label, Monsanto Company, pages 1-54, 2010. • Roundup PowerMax® Herbicide Safety Data Sheet, Monsanto Company, pages 1-9,
May 2011.

Copyright © 2013 BASF Corporation
52
• Weedone® LV4 EC Herbicide Label, Nufarm Inc., pages 1-14. • Weedone® LV4 EC Herbicide Safety Data Sheet, Nufarm Inc, pages 1-6, Jan. 2007. • Lorsban® 15G Insecticide Label, Dow AgroSciences LLC, pages 1-10, Sept. 2008. • Lorsban® 15G Insecticide Safety Data Sheet, Dow AgroSciences LLC, pages 1-5, June
2006. • Iowa State University - University Extension, Machinery Management-Fuel Required for
Field Operations, PM-709, Revised April 2001. Harvesting
• Iowa State University - University Extension, Machinery Management-Fuel Required for Field Operations, PM-709, Revised April 2001.
Biodiversity
• Doane Research wbsite database, www.doane.com, 2000 and 2010 data. • Iowa State University - University Extension, Ag Decision Maker - Iowa Corn and
Soybean County Yields, File A1-14, Table 1, March 2012. • IUCN red list website, www.iucnredlist.org.
Soil
• Iowa State University website database, www.extension.iastate.edu/soils/ispaid, ISPAID 7.3 Database and ISPAID 7.3 Database Sorted by Count, 2000 and 2010.
• National Resource Conservation Service, 2007 National Resources Inventory-Soil Erosion, April 2010.
Cost
• Iowa State University, 2000 Iowa Cost and Returns, FM-1789, June 2001. • Iowa State University, 2010 Iowa Cost and Returns, FM-1789, Revised December 2011. • Iowa State University - University Extension, Estimating Farm Machinery Costs, pages
1-8, (Nov. 2009) • Iowa State University - University Extension, Ag Decision Maker - Cash Corn and
Soybean Prices, page 2, Table 1, (Feb. 2010) Social
• U.S. Department of Agriculture, 2002 Census of Agriculture, AC-02-A-51, June 2004. • U.S. Department of Agriculture, 2007 Census of Agriculture, AC-07-A-51, Dec. 2009. • Iowa State University - University Extension, Wages and Benefits for Farm Employees,
FM 1862, March 1999. • Iowa State University - University Extension, Wages and Benefits for Farm Employees,
FM 1862, June 2006. • Iowa State University – Departmental Data, Fact Book 2000-2001. • Iowa State University – Departmental Data within College, Fact Book 2010-2011. • Iowa State University, 2000 Iowa Cost and Returns, FM-1789, June 2001. • Iowa State University, 2010 Iowa Cost and Returns, FM-1789, Revised December 2011.