Embed Size (px)
Citation preview
Submission 29 - Reserve Bank of Australia (RBA) - Competition in the Australian Financial System - Public
inquirySubmission to the Productivity Commission
Inquiry
September 2017
1. IntroductionThe Reserve Bank welcomes the opportunity to provide a submission to the Productivity Commission’s Inquiry into Competition in the Financial System. The scope of the Terms of Reference is broad and so this submission focuses on those areas that most closely relate to the Bank’s mandate. In particular, it largely draws on a view of the financial system gained by the Bank through its monitoring of financial intermediation and the promotion of financial stability. As a consequence, the focus of much of the submission is the banking system as a whole. In line with the specific markets highlighted in the Terms of Reference, the submission examines mortgage lending, consumer deposits and small and medium enterprise (SME) lending in more detail.
The Bank (and its Payments System Board) is also the primary regulator of the payments system in Australia. The submission provides some perspectives on competition in the payments system and describes the Bank’s activities in this area.
The Australian banking system is relatively concentrated by international standards, but in line with countries such as Canada and Sweden. The major Australian banks are more profitable than many of their peers internationally, though this partly reflects the more favourable economic conditions that prevailed in Australia in the period following the global financial crisis and a comparatively simple asset mix, with lower exposure to trading and institutional banking. Net interest margins are, however, higher than in a number of other countries. On some measures, the Australian banks also appear to operate more efficiently than many overseas banks.
The major banks have generally been more profitable than smaller authorised deposit-taking institutions (ADIs) since the global financial crisis, but the gap has narrowed recently. This partly reflects the lower funding costs of the major banks, with the difference narrowing recently through a combination of an easing in financial conditions and regulatory changes.
Competitive influences and conditions vary from market to market. In particular:
Even though there have been no significant new entrants in recent years, competition in deposit markets has been relatively strong since the financial crisis as ADIs have sourced a greater share of funding from deposits rather than wholesale debt securities. Regulatory changes have also
Submission 29 - Reserve Bank of Australia (RBA) - Competition in the Australian Financial System - Public inquiry | 1

encouraged this trend. While the effects have varied between deposit products, average deposit rates relative to the cash rate have risen, while average account fees have fallen; competition has also occurred through related services, such as payments technology.
The major banks gained market share in the mortgage market in the aftermath of the crisis, in part reflecting their better access to funding (as non-bank lenders in particular lost access to low-cost wholesale funding markets) along with mergers by two of the majors with smaller institutions. However, even though there have been no new major entrants, a narrowing of funding cost differentials, increased use of brokers and consolidation among smaller institutions appear to have boosted competitive pressures more recently. There is some evidence that competition led to some weakening in lending standards in the period leading up to the end of 2014, but an increased regulatory focus has seen this reversed; smaller lenders have gained market share as a result.
While there has recently been strong competition for large business lending as a consequence of the entry of new foreign banks and expansion in activity by some existing foreign banks, competition appears to be less vigorous for small business lending – reflecting the complexity of this market. There is potential for government initiatives on open banking and comprehensive credit reporting to influence this market.
Competition in the retail payments system, in which financial institutions are significant players, is reasonably strong. Nevertheless, in some areas of the payments system competition can result in perverse outcomes. The Bank has therefore taken regulatory action over the past 15 years to address some of these anomalies and it continues to monitor competition closely.
A number of themes in this submission are likely to be relevant to the Commission’s work:
Periods of heightened competition in the Australian financial system have typically been driven by new entrants rather than established players. The entry of mortgage originators, foreign banks offering online deposit accounts and, recently, Asian banks offering large business loans have all had a significant effect on competition in their respective markets.
Smaller banks experienced a rise in funding costs relative to the major banks through the financial crisis, but this has narrowed in recent times.
Bundling of products can be convenient for consumers, but can make switching of individual products difficult and, by obscuring the pricing of individual products, it can support cross-subsidisation between more and less competitive markets.
Information problems – both in relation to lenders’ knowledge of the riskiness of potential borrowers and customers’ awareness of alternative products – inhibit competition. Measures aimed at open banking and comprehensive credit reporting are likely to be beneficial, along with measures to increase transparency of interest rates.
Differential pricing between customers, particularly in favour of new customers, is relatively common. Differential pricing can reflect risks, but it is also likely that some customers are not sufficiently aware of the possibility of a better deal or are reluctant to switch providers. Measures to increase transparency or reduce switching costs could help to address this.
Financial technology (fintech) providers have the potential to increase competition in a variety of ways, including by competing directly in under-served markets, facilitating greater transparency and reducing the cost of switching providers. However, at this stage fintech firms generally
2 RESERVE BANK OF AUSTRALIA
remain small and their performance is untested over a full cycle. Significant efforts have been made by the government and the Australian Securities and Investments Commission (ASIC) to facilitate these providers.
The remainder of this submission consists of the following sections. Chapter 2 revisits the Financial System Inquiry and identifies developments since that time. Chapter 3 makes some general observations about the nature of competition in the finance sector, highlights some of the complexities in assessing competition, and presents some high-level indicators relevant to assessing competition. Chapter 4 discusses several important recent influences on competition, while Chapter 5 examines the mortgage, deposit and lending markets. Chapter 6 discusses competition in the payments system and the role of the Reserve Bank as regulator. Chapter 7 draws together some key themes.
Submission 29 - Reserve Bank of Australia (RBA) - Competition in the Australian Financial System - Public inquiry | 3

2. Developments since the Financial System InquiryCompetition in the financial system was last considered by the Financial System Inquiry (FSI), which reported in 2014. This provides a useful benchmark for recent progress on competition.
The FSI Final Report concluded that competition was generally adequate, but noted that high concentration and increasing vertical integration in some parts of the financial system had the potential to limit the benefits of competition (Financial System Inquiry 2014). Since 2014, concentration in some banking markets has declined modestly (see the ‘Assessing Competition in the Financial System’ chapter). Vertical integration has also reduced somewhat as the major banks have divested some wealth management businesses.1
A number of FSI recommendations had a bearing on competition. Some were focused on the regulatory system, given the FSI’s observation that policy settings with respect to Australia’s financial system did not focus on the benefits of competition. The FSI recommended making competition a specific focus of ASIC and encouraged regulators to clearly explain in annual reports how competition was considered in their decision making processes. It recommended that the state of competition in the financial system be reviewed every three years (leading to the current inquiry).
The FSI noted that reforms that increased the resilience of the financial system, especially for the larger banks, would work to reduce the perception of an implicit guarantee, thereby reducing competitive distortions. It recommended regulatory settings that would lower the probability of a bank failure through ensuring Australian bank capital ratios are unquestionably strong, and reduce the cost of failure, by ensuring banks maintained sufficient loss-absorbing capacity. The Inquiry similarly recommended reducing the differences in risk weights on mortgage lending between banks using model-based weights (the large banks) and other ADIs.
Other competition-focused recommendations included:
developing a national strategy for a federated style model of trusted digital identities
graduating fundraising regulation to facilitate crowdfunding for both debt and equity
supporting data-driven business models through an inquiry into the costs and benefits of increasing data access
supporting expanded positive credit data sharing and, if voluntary participation is inadequate, considering mandated participation.
In respect of the payments system, the Inquiry recommended:
enhancing graduation of retail payments regulation by clarifying thresholds for regulation
clarifying and broadening card interchange regulation and lowering interchange fees.
1 In 2016 NAB sold 80 per cent of its life insurance business, in 2017 Westpac sold part of its stake in BT Investment Management, while ANZ has announced plans to divest its Australian wealth management business.
4 RESERVE BANK OF AUSTRALIA
The government’s response to the FSI Final Report followed most of the recommendations (TheAustralian Government 2015). Significant progress has been made on implementation since that time, including:
implementation by the Australian Prudential Regulation Authority (APRA) in 2016 of changes to mortgage risk weights for ADIs using model-based weights (APRA 2015)
the recent announcement by APRA of changes to capital requirements to ensure that Australia’s banks are ‘unquestionably strong’ (APRA 2017a)
establishing an expectation that regulators report each year on how they have taken account of competition in their decisions
establishing a regulatory framework for crowdsourced equity funding, allowing small business greater access to capital – the government is currently seeking to extend the framework to proprietary companies
establishing an independent review to recommend an approach to establishing an open banking regime in Australia (The Treasury 2017)
supporting the uptake of the current voluntary comprehensive credit reporting regime; a failure to meet a target of 40 per cent voluntary reporting by the end of 2017 will result in the government legislating a mandatory regime (The Australian Government 2017)
establishment by the Reserve Bank of a revised regime for interchange regulation, which has broadened the application of regulation and lowered interchange fees (see the ‘Competition in the Payments System’ chapter) (RBA 2016b).
In addition, as part of the 2017/18 Budget, the Australian Government announced measures:
establishing a dedicated unit within the Australian and Competition and Consumer Commission to undertake regular in-depth inquiries into specific financial system competition issues
legislating an enhanced ‘regulatory sandbox’ to allow businesses to test for a period of 24 months a wide range of new financial products and services (The Australian Government2017).
Further, in August APRA initiated a consultation on the possibility of introducing a phased approach to authorisation, which would provide a restricted licence while an entity is developing the full range of resources and capabilities necessary to meet the requirements of the prudential framework (APRA2017b).
Collectively these measures suggest substantial progress on further enhancing competition in the financial system since the 2014 FSI Final Report.
Submission 29 - Reserve Bank of Australia (RBA) - Competition in the Australian Financial System - Public inquiry | 5

3. Assessing Competition in the Financial SystemThis section takes a system-wide perspective of competition. It examines the broad trends in the sector and characteristics that have a bearing on competition. It then notes challenges in assessing competition before presenting available indicators for Australia.
Long-term trends The Australian financial system has changed significantly since the period of financial deregulation in the 1980s. This is evident in two important trends.2 First, the financial sector has increased in importance, with assets rising from around the level of annual GDP prior to the period of deregulation, to be approaching four times GDP today (Graph 1). Second, the institutional structure of the financial system has changed, with the importance of banks steadily growing. Today banks account for more than half of the total assets of the financial system, up from one-third in 1980, and their lending accounts for around 90 per cent of total credit (Graph 2). Over the same period, the relative importance of non-bank financial intermediaries has declined (including credit unions, building societies and registered financial corporations – institutions that grew strongly prior to the 1980s, partly as a result of being subject to fewer regulations than banks).
Graph 1
05 / 0695 / 9685 / 8675 / 7665 / 66 15 / 160
100
200
300
400
%
0
100
200
300
400
%
Asse ts of F inanc ia l InstitutionsP er cent to nom ina l G D P
B anksN on-bank financ ia l corpora tions *C redit un ions & bu ild ing societies*
R eg is te red financia l corpora tions*S uperannuation & managed fundsO ther financia l institutions
The non-bank financial corporations series includes credit unions &building societies and registered financial corporations prior to 1999/00
Sources: ABS; APRA; RBA
Graph 2
2 010200 31 9961 989198 2 201 72 0
4 0
6 0
8 0
%
20
40
60
80
%
Bank Lend ingS hare o f to ta l cred it
Source: RBA
There has been a considerable rationalisation of credit unions and building societies (which are now prudentially regulated as ADIs), associated with regulatory changes and competitive pressures. This rationalisation has occurred through a number of mergers and acquisitions within the sector, as well as a number of credit unions and building societies converting to mutual banks. Today the share of financial intermediation outside the prudentially regulated sectors is very small.
This section focuses predominantly on competition in the banking system, but, as will be discussed, competitive outcomes can be significantly influenced by competition from outside the sector.
Characteristics of the finance sector Competition can generally be expected to deliver a range of benefits, including: better allocation of resources; more technically efficient and low-cost production; better quality and variety of services;
2 For more information on longer-term trends in the financial system, see (RBA 2006).
6 RESERVE BANK OF AUSTRALIA

greater adaptability and, in the finance sector’s case, greater availability of credit. However, there are a number of characteristics and behaviours that have a bearing on the level and nature of competition in the finance sector. Some of the more important are outlined below.
i. Economies of scale. Large institutions can operate more efficiently than smaller institutions in some regards, for instance by spreading fixed costs (e.g. branch networks, information technology (IT) and investment in brand recognition) across a larger asset or revenue base. This means that a small number of large banks might be an efficient, low-cost market structure (Jayaratne, J and P1998). Scale also helps the major banks achieve lower funding costs because they are more diversified and, therefore, less risky and they are better recognised by potential investors resulting in debt that is more liquid. There is also the perception of an implicit government guarantee on the basis that they could be ‘too big to fail’. The higher the fixed costs in a particular area of business (e.g. SME credit assessment capabilities or research and development), the greater the advantage to scale.
ii. Economies of scope and product bundling. Institutions can also reduce costs by offering a number of related products. The major banks provide a full suite of intermediation and transactional products across a wide range of customer types. They have also diversified into mortgage broking, stockbroking, wealth management and advisory services, in part to take advantage of shared distribution channels. This diversification is accompanied by cross-selling and the bundling of products into a package for customers, for example an offset account and a credit card with a home loan or card acquiring services with a business loan. While bundling can be beneficial for customers, it can also reduce competition in individual product markets by making customers less willing to switch providers, particularly if there is a degree of cross-subsidisation between products.
iii. Information problems. One of the main roles played by financial intermediaries is to efficiently gather information about the credit risk of potential borrowers. However, their knowledge of the borrower increases with the length and breadth of the relationship between the institution and the borrower (Dell’Ariccia and Marquez 2001). The borrower may therefore find it difficult to switch to another institution that has less information and might be less willing to lend. The challenges intermediaries face with assessing credit risk are particularly acute for SME loans. Assessment of SME loans requires evaluations across a large variety of markets, business models and other idiosyncratic factors, while available information will be limited compared with larger firms. Initiatives that make information about the borrower more readily available to other potential lenders (such as those on comprehensive credit reporting and open data) therefore have the potential to increase competition.
Another form of information problem is that customers might not have full information about the products and prices offered by other providers, preventing them from making an informed choice. For instance, transparency in the small business and home loan markets can be poor given the prevalence of unadvertised discounts to the standard variable rate, in many cases negotiated directly. Under these circumstances a customer will have difficulty determining the competitive price without incurring large search costs.
iv. Switching costs. The perceived cost of switching between financial institutions limits competition. Costs include searching for a suitable new provider, proving identity to the new institution and redirecting existing payment arrangements. Product bundling and information problems also make switching more difficult.
Submission 29 - Reserve Bank of Australia (RBA) - Competition in the Australian Financial System - Public inquiry | 7

v. Differential pricing between customers. Institutions take advantage of a lack of transparency or switching costs to charge different customers different prices, regardless of the cost of providing the service or the risks involved. It is common to provide lower loan pricing or higher deposit pricing to new customers than established customers on the assumption that established customers might be less informed or unwilling to switch. Examples are ‘honeymoon’ mortgage rates, reduced rates on credit card balance transfers and bonus interest rates offered for an initial period on new deposit accounts. In this case, established and less mobile customers are subsidising low margins (or loss leaders) for new customers.
A further important feature of the finance sector is that it carries inherent risks and vulnerabilities, which, as demonstrated by the global financial crisis, can have a large negative effect on the real economy if not managed well. Competitive forces can aggravate these vulnerabilities if they encourage a weakening of lending standards (Berger, Klapper and Turk-Ariss 2009). Prudential regulation can address this effect by constraining banks’ behaviour (Agoraki, Delis and Pasiouras2011), and in doing so may place some constraints on competition. Given the ability of regulatory requirements to moderate the effect of increased competition on lending standards, it is reasonable to expect that well-considered enhancements to competition are likely to be sustainable (i.e. not offset by an increase in risks). Nonetheless, the broader effects of measures to promote competition should be considered.
Challenges in assessing competitionThere are a number of challenges in making an assessment of competition in the financial system. One is that competition tends to be procyclical. In times of optimism, new competitors are attracted to the market by the expectation of high returns in an environment where demand is strong. Innovation is likely also to be strong and the market share of established players will be eroded. A tendency to underprice risk at such times often contributes to this dynamic. However, this level of competition tends not to be sustainable in more challenging times, resulting in a period of consolidation. For instance, new entry and strong competition in the housing credit market prior to the financial crisis resulted in an increasing market share for smaller players up until 2008. However, they were unable to maintain that share in the more difficult market conditions that followed.
This period also highlights the fact that the locus of competition can change with the financial cycle. As competition for lending eased during the crisis, competition strengthened in deposit markets in response to tighter funding conditions. An assessment of competition at any point in time should be mindful of these dynamics.
A number of additional challenges arise when seeking to examine specific markets:
Suitably defining the market in which parties compete. For instance, the market for loans to large corporates is part of a broader market for finance with clearly available non-intermediated alternatives. Similarly, the market for deposits as an investment (rather than for transactional purposes) is part of a broader investment market, including superannuation, investment funds and direct investment in securities or higher-risk options such as shares or property.
Banks’ abilities to substitute fee and non-fee income. For example, banks might compete for housing loans by waiving application fees rather than lowering interest rates, making it difficult to assess competition on interest rates alone. A bank’s revenue on a credit card product can include interest paid by cardholders, fees paid by cardholders (offset by any rewards paid) and fees paid
8 RESERVE BANK OF AUSTRALIA

indirectly by merchants, all of which can be rebalanced to maximise the profitability of the product.
Isolating competition effects in lending and pricing. Lending volumes and interest rates contain information about risk and liquidity, as well as competition. These can vary over time and across jurisdictions; disentangling these effects can be challenging.
Competition indicators for the Australian banking systemThis section considers a range of indicators that could provide some insights on competition in the financial system, including concentration, operational efficiency, profitability and margins.
ConcentrationA common starting point for considering competition is the level of concentration within a market.
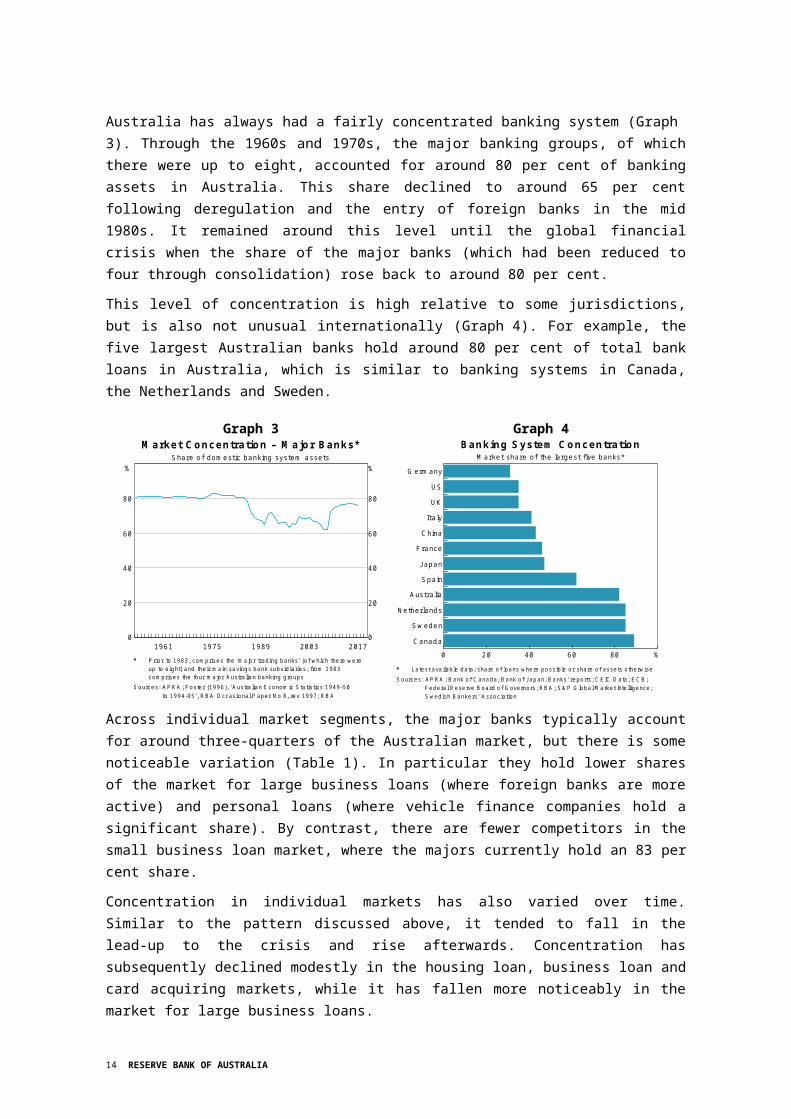
Australia has always had a fairly concentrated banking system (Graph 3). Through the 1960s and 1970s, the major banking groups, of which there were up to eight, accounted for around 80 per cent of banking assets in Australia. This share declined to around 65 per cent following deregulation and the entry of foreign banks in the mid 1980s. It remained around this level until the global financial crisis when the share of the major banks (which had been reduced to four through consolidation) rose back to around 80 per cent.
This level of concentration is high relative to some jurisdictions, but is also not unusual internationally (Graph 4). For example, the five largest Australian banks hold around 80 per cent of total bank loans in Australia, which is similar to banking systems in Canada, the Netherlands and Sweden.
Graph 3
20 0319 89197 519 6 1 201 70
20
40
60
80
%
0
20
40
60
80
%
M arke t Concentra tion – M a jor Banks*Sha re o f dom e st ic ba nk ing sys tem asse ts
Prior to 1983, comprises the ‘major trading banks’ (of which there wereup to eight) and their main savings bank subsidiaries; from 1983comprises the four major Australian banking groups
Sources: APRA ; Foster (1996), ‘Australian Economic Statistics 1949-50to 1994-95’, RBA Occasional Paper No 8, rev 1997; RBA
Graph 4
0 20 40 60 80 %Ca nad a
S w ed en
Nether la nds
A us tra lia
S pain
Ja pan
F rance
China
Ita ly
UK
US
G erm a ny
Bank ing System Concentra tionM ark e t share of the larg est f ive banks*
Latest available data; share of loans where possible or share of assets otherwiseSources: APRA ; Bank of C anada; Bank of Japan; Banks’ reports; C EIC D ata; ECB;
Federal Reserve Board of Governors; RBA ; S&P Global Market Inte lligence;Swedish Bankers’ Association
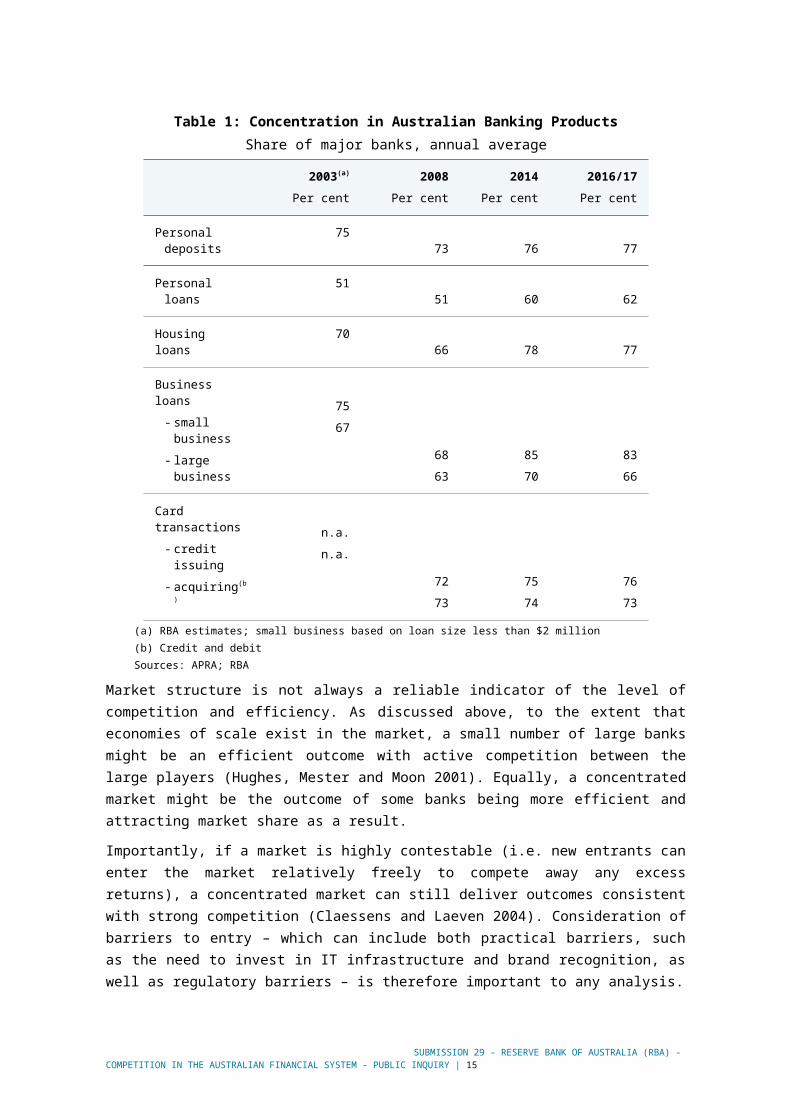
Across individual market segments, the major banks typically account for around three-quarters of the Australian market, but there is some noticeable variation (Table 1). In particular they hold lower shares of the market for large business loans (where foreign banks are more active) and personal loans (where vehicle finance companies hold a significant share). By contrast, there are fewer competitors in the small business loan market, where the majors currently hold an 83 per cent share.
Concentration in individual markets has also varied over time. Similar to the pattern discussed above, it tended to fall in the lead-up to the crisis and rise afterwards. Concentration has subsequently
Submission 29 - Reserve Bank of Australia (RBA) - Competition in the Australian Financial System - Public inquiry | 9

declined modestly in the housing loan, business loan and card acquiring markets, while it has fallen more noticeably in the market for large business loans.
Table 1: Concentration in Australian Banking ProductsShare of major banks, annual average
2003(a)
Per cent2008
Per cent2014
Per cent2016/17Per cent
Personal deposits
7573 76 77
Personal loans 51 51 60 62
Housing loans 70 66 78 77
Business loans- small
business- large
business
7567
6863
8570
8366
Card transactions
- credit issuing- acquiring(b)
n.a.n.a. 72
737574
7673
(a) RBA estimates; small business based on loan size less than $2 million(b) Credit and debitSources: APRA; RBA
Market structure is not always a reliable indicator of the level of competition and efficiency. As discussed above, to the extent that economies of scale exist in the market, a small number of large banks might be an efficient outcome with active competition between the large players (Hughes,Mester and Moon 2001). Equally, a concentrated market might be the outcome of some banks being more efficient and attracting market share as a result.
Importantly, if a market is highly contestable (i.e. new entrants can enter the market relatively freely to compete away any excess returns), a concentrated market can still deliver outcomes consistent with strong competition (Claessens and Laeven 2004). Consideration of barriers to entry – which can include both practical barriers, such as the need to invest in IT infrastructure and brand recognition, as well as regulatory barriers – is therefore important to any analysis.
Operational efficiencyThere is at least tentative evidence that concentration in the Australian market is consistent with operational efficiency. Two metrics used to compare operational efficiency are the cost-to-income and cost-to-asset ratios (Graph 5).3 Australian banks appear relatively efficient by international measures, with cost-to-income and cost-to-asset ratios of around 45 per cent and 0.5 per cent, respectively. This is towards the bottom end of these measures across a range of countries.4 However,
3 Variation in banks’ cost-to-income ratios can also reflect differences in banks’ margins and pricing power. Cost-to-asset ratios do not suffer from this drawback.
4 For more information on developments in the cost-to-income ratios of the major Australian banks, see (RBA2014a).
10 RESERVE BANK OF AUSTRALIA

drawing strong conclusions from such metrics is difficult, partly because variation in both ratios can reflect differences in business models (as well as regulatory and institutional differences). For example, banks with a greater focus on traditional lending activity, including Australian banks, tend to have lower cost-to-income and cost-to-asset ratios than banks that focus on other activities, such as investment banking and wealth management.
These qualifications are less of a concern when making comparisons among Australian banks, given the relatively similar nature of their business models. The major banks have nonetheless maintained cost-to-income ratios that are below those of other Australian banks (Graph 6). Economies of scale explain part of this difference. For example, the major banks may have achieved greater efficiencies through spreading their fixed costs across a greater asset or revenue base.
Graph 5
C ost-to-assets ra tio (LHS )C ost-to-income ra tio (R H S)
S w ede n Japan NewZea la nd
A us tra lia UK C anada US E uroA rea
0.0
0.5
1.0
1.5
%
20
40
60
80
%
Large Banks’ Cost Ra tios*20 16
Weighted averages across selected large banks headquartered ineach jurisdiction
Sources: RBA ; S&P Global Market Inte lligence
Graph 6
201 320 1 0200 720 04 20 1 625
50
75
%
25
50
75
%Austra lian Banks’ Cost-to -incom e Ra tio
M a jor ba nks
O ther A us tra lia n ba nks
Source: APRA
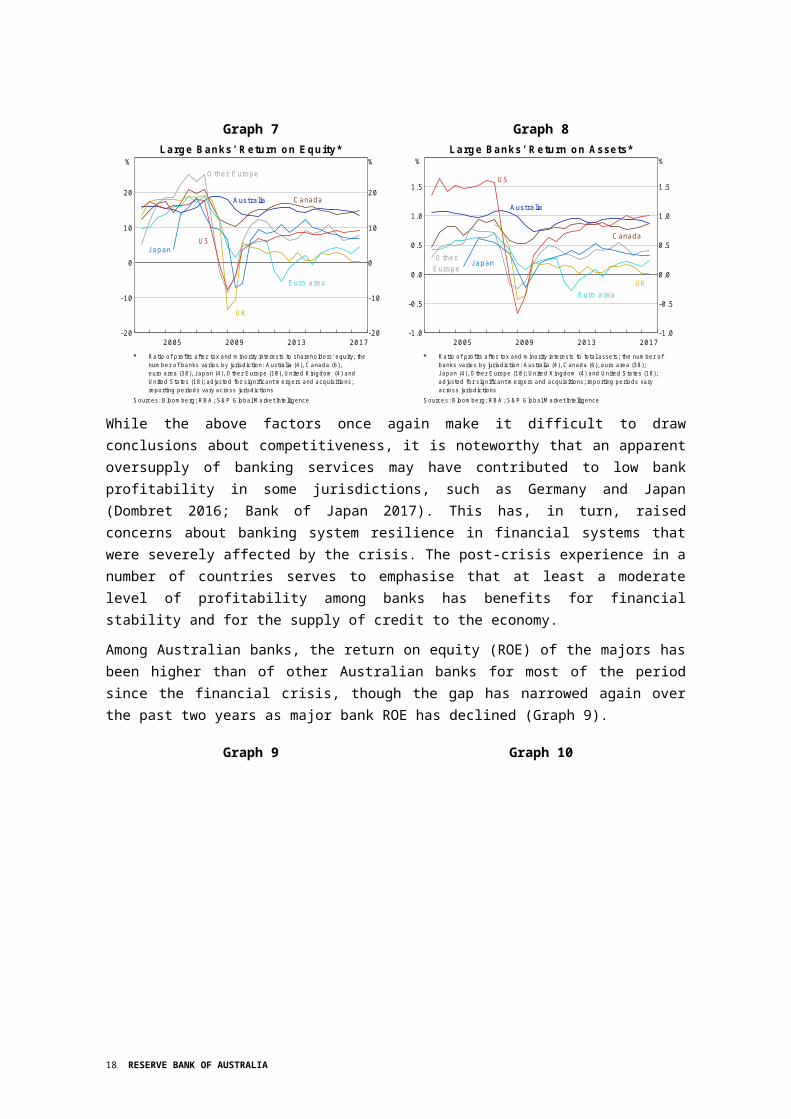
ProfitabilityProfitability measures can provide an indication of whether Australian banks are operating in a more or less competitive environment than elsewhere. However, cross-country comparisons of profitability continue to be shaped by the effects of the global financial crisis. While prior to the crisis aggregate measures were similar across countries, major Australian banks’ returns have been significantly higher than those in many other jurisdictions since the crisis – a reflection of the fact that the Australian banking system did not experience the same high level of losses that affected banks in many other countries following the crisis (Graph 7 and Graph 8).
The difference in returns in some cases also reflects differences in the asset mix held by banks. Some assets continue to generate comparatively low returns, in part due to lower levels of leverage than prevailed pre-crisis. Returns for Australian and Canadian banks, which have comparatively simple structures, or lower exposure to trading and institutional banking, have been higher than most other jurisdictions since the crisis.
Submission 29 - Reserve Bank of Australia (RBA) - Competition in the Australian Financial System - Public inquiry | 11
Graph 7
20 13200 9200 5 20 17-20
-10
0
10
20
%
-20
-10
0
10
20
%Large Banks’ Re turn on Equity *
A us tra lia C anada
Ja panUS
UK
O ther E urope
E uro area
Ratio of profits after tax and minority interests to shareholders' equity; thenumber of banks varies by jurisdiction: Australia (4), Canada (6),euro area (38), Japan (4), Other Europe (10), United Kingdom (4) andUnited States (18); adjusted for significant mergers and acquisitions;reporting periods vary across jurisdictions
Sources: Bloomberg; RBA ; S&P Global Market Inte lligence
Graph 8
20 13200 92005 20 17-1.0
-0 .5
0.0
0.5
1.0
1.5
%
-1 .0
-0 .5
0.0
0.5
1.0
1.5
%Large Banks’ Re turn on Asse ts*
US
A us tra lia
UK
Ja panO therE uro pe
C a nad a
E uro area
Ratio of profits after tax and minority interests to total assets; the number ofbanks varies by jurisdiction: Australia (4), Canada (6), euro area (38);Japan (4), Other Europe (10); United Kingdom (4) and United States (18);adjusted for significant mergers and acquisitions; reporting periods varyacross jurisdictions
Sources: Bloomberg; RBA ; S&P Global Market Inte lligence
While the above factors once again make it difficult to draw conclusions about competitiveness, it is noteworthy that an apparent oversupply of banking services may have contributed to low bank profitability in some jurisdictions, such as Germany and Japan (Dombret 2016; Bank of Japan 2017). This has, in turn, raised concerns about banking system resilience in financial systems that were severely affected by the crisis. The post-crisis experience in a number of countries serves to emphasise that at least a moderate level of profitability among banks has benefits for financial stability and for the supply of credit to the economy.
Among Australian banks, the return on equity (ROE) of the majors has been higher than of other Australian banks for most of the period since the financial crisis, though the gap has narrowed again over the past two years as major bank ROE has declined (Graph 9).
Graph 9
2011200 620 01199619911986 2016-10
0
10
20
%
-10
0
10
20
%Austra lian Banks’ Re turn on Equity *
O ther A us tra lian banks
M a jor banks
Fiscal years from 2003 onwards; prior data are as reported in banks’financial statements
Sources: APRA; Banks’ annual reports; RBA
Graph 10Austra lian Banks’ Profitab ility and Leverage
R eturn on asse ts
0.5
1.0
1.5
%
0.5
1.0
1.5
%
M ajo r banks
Leve ra ge ra tio *
20 14201120082005 20 173
4
5
6
%
3
4
5
6
%
O the r Aus tra lian ba nks
Tier 1 capital as a share of total assets; break in March 2008 due to theintroduction of Basel II; break in March 2013 due to the introduction ofBasel III
Source: APRA
One factor explaining the divergence in ROE between the major banks and other banks over much of the past decade is capital levels or leverage (i.e. non-risk-weighted assets relative to capital, or inversely for the ‘leverage ratio’, capital to non-risk-weighted assets). While a number of regulatory measures have resulted in increased capital requirements for the major banks over recent years, smaller Australian banks have nonetheless still operated with a higher leverage ratio (i.e. higher
12 RESERVE BANK OF AUSTRALIA
capital) than the majors since around 2008 (Graph 10). This places downward pressure on smaller banks’ ROE (Atkin and Cheung 2017). This higher leverage ratio partly reflects the fact that the smaller banks’ assets carry a higher average regulatory risk weight (requiring them to hold more capital to meet the same risk-weighted capital ratio). This, in turn, partly reflects use by the major banks (and Macquarie Bank) of the internal ratings-based (IRB) approach to credit risk, which allows them to use their own models to determine risk weights. The smaller banks use the ‘standardised’ approach, which generally results in higher risk weights.5 The average mortgage risk weight under the IRB approach was increased in 2016 to narrow the gap between the IRB weights and the standardised mortgage risk weights.6 In addition to meeting an FSI recommendation (aimed at improving competitive neutrality), this has enhanced the resilience of ADIs using the IRB approach and aligns with the direction of work being undertaken by the Basel Committee on Banking Supervision (APRA2015).
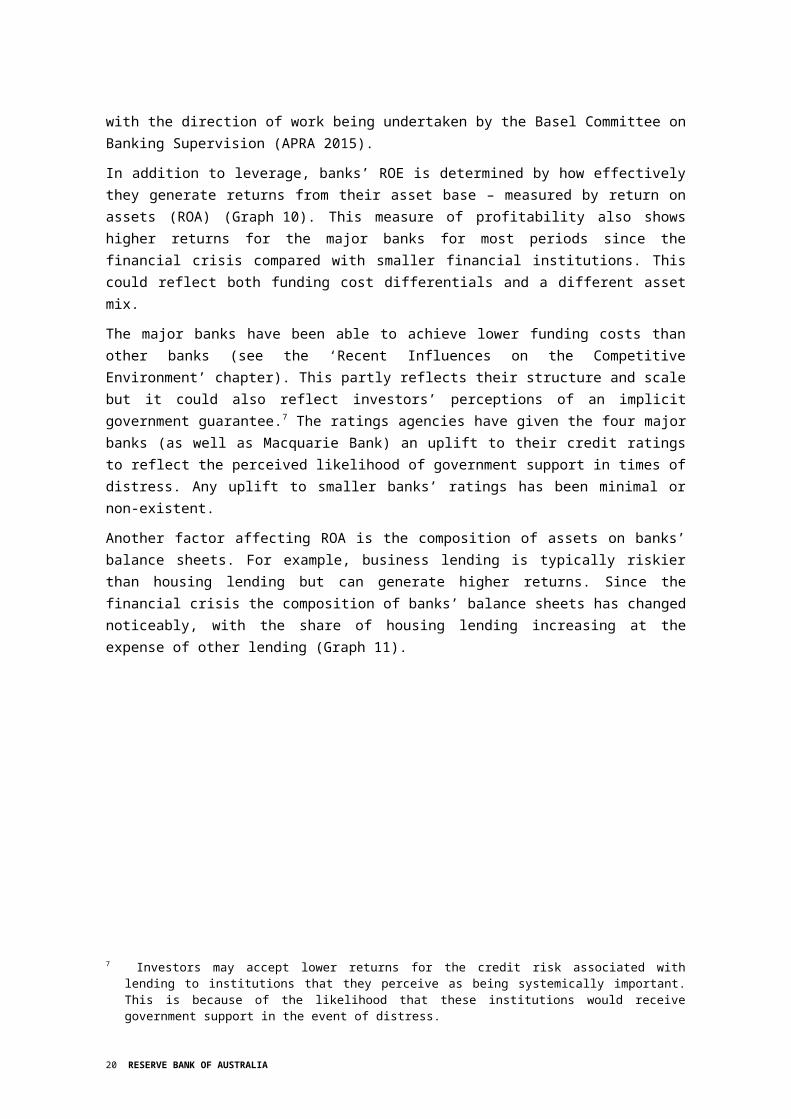
In addition to leverage, banks’ ROE is determined by how effectively they generate returns from their asset base – measured by return on assets (ROA) (Graph 10). This measure of profitability also shows higher returns for the major banks for most periods since the financial crisis compared with smaller financial institutions. This could reflect both funding cost differentials and a different asset mix.
The major banks have been able to achieve lower funding costs than other banks (see the ‘Recent Influences on the Competitive Environment’ chapter). This partly reflects their structure and scale but it could also reflect investors’ perceptions of an implicit government guarantee.7 The ratings agencies have given the four major banks (as well as Macquarie Bank) an uplift to their credit ratings to reflect the perceived likelihood of government support in times of distress. Any uplift to smaller banks’ ratings has been minimal or non-existent.
Another factor affecting ROA is the composition of assets on banks’ balance sheets. For example, business lending is typically riskier than housing lending but can generate higher returns. Since the financial crisis the composition of banks’ balance sheets has changed noticeably, with the share of housing lending increasing at the expense of other lending (Graph 11).
5 For example, the average risk weight on the major banks’ IRB residential mortgage exposures was less than 20 per cent prior to September 2016 (at June 2017 this had increased to 25 per cent, see below) compared with an average risk weight of around 40 per cent on exposures measured under the standardised approach at all banks.
6 For more information on regulatory measures on residential mortgages in Australia, see (RBA 2015a).7 Investors may accept lower returns for the credit risk associated with lending to institutions that they perceive as
being systemically important. This is because of the likelihood that these institutions would receive government support in the event of distress.
Submission 29 - Reserve Bank of Australia (RBA) - Competition in the Australian Financial System - Public inquiry | 13
Graph 11Austra lian Banks’ Lending
B y ins titut ion type , share of gross loans and advances
Ho us ing
20122007 201720
40
60
%
M ajor ba nks
Non-hous ing *
20 122007 201720
40
60
%
O ther A us tra lia n banks
Includes business loans, personal loans, revolving credit, leasefinancing and other lending
Source: APRA
MarginsNet interest margin (NIM), which reflects the difference in banks’ average lending and borrowing rates, provides an indication of the profitability of banks’ lending activities, and so can shed some light on the degree of competitive pressure banks face.
The major banks’ NIM declined sharply in the decades following deregulation and leading up to the financial crisis, consistent with rising competitive pressures (Graph 12). Since then, there have been significant changes to both the composition of banks’ assets and funding, and the interest rates that apply to them. Nonetheless, the overall interest margin has remained relatively stable. While the major banks have had lower funding costs than smaller ADIs and higher returns on some loan assets over this period, they have at the same time increased their holdings of relatively low-yielding liquid assets, partly in response to regulation (Debelle 2015).
Graph 12
201220072002199719921987 20171
2
3
4
5
%
1
2
3
4
5
%
Banks’ Ne t In te rest M argin*D om est ic ope ra t ions
M a jor banks
R eg iona l banks
AGAAP to 2006 then IFRS; yearly to 1998 (2001) for majors (regionals)then half-yearly; majors include St George Bank from 1993 andBankwest from 2009
Sources: Banks' financial reports; RBA
Graph 13
201320092005 20170
1
2
3
%
0
1
2
3
%Banks’ Ne t In te rest M argins*
Jap an
C anada
UK
E uro a rea
A ust ra lia
US
C anada
W eighted average across selected large banks headquartered ineach jurisdiction
Sources: RBA ; S&P Global Market Intelligence
In contrast to the relatively stable NIM of the major banks, regional banks have increased their NIM in recent years, partly reflecting a decrease in their funding costs. Many banks are expecting an increase
14 RESERVE BANK OF AUSTRALIA
in their NIM as a result of increases in housing lending rates to investors and interest-only borrowers in recent months.
Australian major banks’ NIM is in the range of the large banks in other countries and is close to that of Canada’s large banks, which have similar asset and funding compositions to Australia’s major banks (as well as a similar level of concentration)(Graph 13). It is nonetheless higher than European and Japanese banks. Once again, however, international comparisons need to be treated with some caution, because differences can reflect a range of factors, including the types of funding used and the riskiness and performance of loans granted.
Narrower measures of profitability, such as the spreads of lending rates to the cash rate, have shown divergent trends in recent years (Graph 14). Over the past few years, the spread on large business lending has declined as competition has emerged from foreign banks. However, the average spreads on small business and housing lending have risen as lenders have increased interest rates to control the flow of lending to some borrowers and to recover the costs of higher capital holdings.
While spreads on variable-rate home loans have been rising, once discounts are factored in, the rates offered by Australian banks are within the range of those in other advanced economies (Graph 15. 8
Graph 14
201 2200 720 0219 97 201 70
1
2
3
4
5
6
%
0
1
2
3
4
5
6
%
Variable Inte rest Ra tesSp re ad to the ca sh ra te
Sm a ll bus iness
Housing
S m all bus ines s(ou tstand ing )**
(SVR )*
Ho using
(SVR )*
La rge bus iness(outs tand ing )**
(outs tand ing )**
Average of major banks’ advertised standard variable reference ratesRBA estimate of average rate paid ; all lenders
Sources: ABS; APRA ; Banks’ websites; Perpetual; RBA
Graph 15
201 3200 9200 5200 119 97 201 70
10 0
20 0
30 0
40 0
bp s
0
10 0
20 0
30 0
40 0
bp s
In te rest Spreads on Va riab le -ra te M ortgagesNew loa ns , sp rea d to po licy ra te , s ix m onth ro lling avera ge *
US
UK
Ire land
C ana da
New Zea la nd
Austra lia
Aus tra lia(d iscount)
(SVR )
First mortgage interest rate on housing loans to new customers; loancharacteristics vary across jurisdictions
Sources: APRA ; Bank of Canada; Bank of England; Board of Governorsof the Federal Reserve System; Central Bank of Ireland; Perpetual;RBA ; RBNZ
8 Interest margins on variable-rate housing loans are often not directly comparable, in part because the typical mortgage product differs across countries and the size of discounts to posted rates is often unobserved. Moreover, the features offered on mortgages can differ significantly across countries. For example, loans with redraw facilities and flexible repayment structures are common in Australia but are relatively scarce in most European countries.
Submission 29 - Reserve Bank of Australia (RBA) - Competition in the Australian Financial System - Public inquiry | 15

4. Recent Influences on the Competitive EnvironmentThe potential sources of competition for the major banks include smaller ADIs, foreign banks and new entrants from outside the banking sector. However, the competitive pressure imposed by these sources has varied over time. This section considers three factors that have recently influenced the level of competition: the funding cost differences between large and small ADIs; the significant contraction of the residential mortgage-backed securities (RMBS) market (which had supported lending by both smaller ADIs and mortgage originators prior to the crisis); and competition from foreign banks, which has been influential in some markets.
Funding costsThe extent of competition between financial institutions is heavily influenced by conditions in funding markets – both through the effect on lending markets and the effect on banks’ relative funding costs. As funding conditions become more constrained or costly, competition in lending markets typically eases. This was seen during the global financial crisis when access to short- and long-term wholesale funding markets was highly restricted.
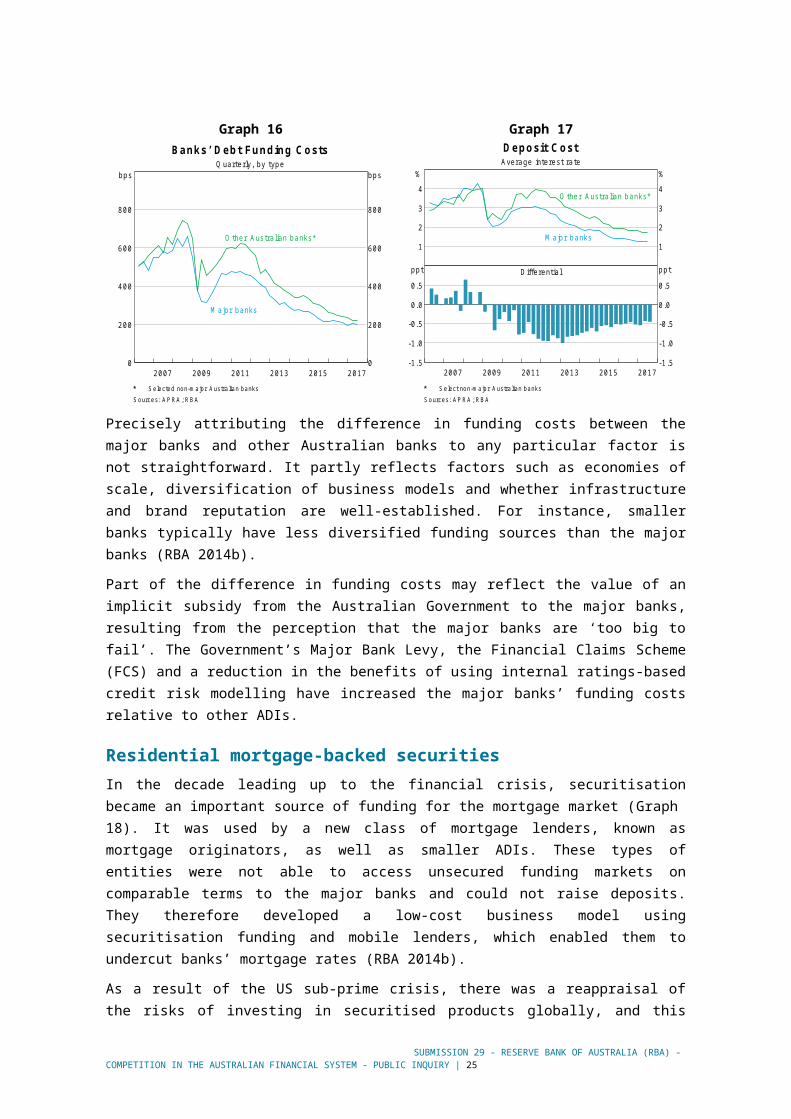
In addition, smaller banks’ funding costs rose relative to the major banks through the crisis, reflecting different funding mixes and perceptions of risk (Graph 16). This has affected smaller banks’ profitability and capacity to compete.9 Over recent years, the differential between the major banks’ and smaller banks’ funding costs, including deposit costs, has narrowed (Graph 17).
Graph 16
20 1520 1320 1120 09200 7 20 170
20 0
40 0
60 0
80 0
bps
0
20 0
40 0
60 0
80 0
bp s
Banks’ Debt Funding CostsQ ua rte rly , by type
M a jor ba nks
O ther A us tra lian banks *
Selected non-major Australian banksSources: APRA ; RBA
Graph 17Deposit Cost
A vera ge intere st ra te
1
2
3
4%
1
2
3
4%
O ther A us tra lian ba nks *
M a jo r banks
D if fe rentia l
201 5201 320 1 120 0920 07 201 7-1.5
-1 .0
-0 .5
0.0
0.5
pp t
-1 .5
-1 .0
-0 .5
0.0
0.5
pp t
Select non-major Australian banksSources: APRA ; RBA
Precisely attributing the difference in funding costs between the major banks and other Australian banks to any particular factor is not straightforward. It partly reflects factors such as economies of scale, diversification of business models and whether infrastructure and brand reputation are well-established. For instance, smaller banks typically have less diversified funding sources than the major banks (RBA 2014b).
9 For a discussion of how funding costs and composition have changed through time and vary across lenders, see the Reserve Bank’s FSI submission (RBA 2014b) and Bulletin articles (Cheung 2017; Wilkins, Gardner and Chapman2016).
16 RESERVE BANK OF AUSTRALIA

Part of the difference in funding costs may reflect the value of an implicit subsidy from the Australian Government to the major banks, resulting from the perception that the major banks are ‘too big to fail’. The Government’s Major Bank Levy, the Financial Claims Scheme (FCS) and a reduction in the benefits of using internal ratings-based credit risk modelling have increased the major banks’ funding costs relative to other ADIs.
Residential mortgage-backed securitiesIn the decade leading up to the financial crisis, securitisation became an important source of funding for the mortgage market (Graph 18). It was used by a new class of mortgage lenders, known as mortgage originators, as well as smaller ADIs. These types of entities were not able to access unsecured funding markets on comparable terms to the major banks and could not raise deposits. They therefore developed a low-cost business model using securitisation funding and mobile lenders, which enabled them to undercut banks’ mortgage rates (RBA 2014b).
As a result of the US sub-prime crisis, there was a reappraisal of the risks of investing in securitised products globally, and this also affected Australian markets. Access to securitisation funding was curtailed and the cost of securitisation funding rose relative to other forms of funding. While the Australian government provided some support for the RMBS market to ensure that it continued to function, issuance volumes were significantly reduced. Unlike ADIs, which have more diversified funding models and could switch into deposit funding, mortgage originators were left with limited funding volumes and were no longer able to compete on price.
Graph 18Austra lian RM BS
Issuanc e* M ajor banksO ther banksNon-banks
10
20
$b
10
20
$b
Prim ary m arke t pr ic ing**
201420 1120 082005 20170
100
200
300
bps
0
100
200
300
bps
B ank conform ing dea ls
Non-conform ing de a lsNon-bank conform ing dea ls
Latest quarter issuance to dateFace-value weighted monthly average of the primary market spreadto bank bill swap rate for AAA rated notes
Source: RBA
Use of the RMBS market as a source of funding has increased recently, mostly due to issuance by smaller ADIs and non-ADIs, which have gained market share in the mortgage market. The increased use of RMBS is likely to be partly a reflection of accommodative financial conditions, which have resulted in stronger demand for, and a declining cost of issuing, RMBS. However, RMBS costs remain higher than before the financial crisis and relative to other forms of funding. Growth in the market appears to be constrained by limited demand from both domestic investors and non-residents, many of which prefer covered bonds (RBA 2014b; Aylmer 2016). Recent regulatory changes, which will take effect in 2018, have been designed to help improve the functioning and resilience of the securitisation market (APRA 2016).
Submission 29 - Reserve Bank of Australia (RBA) - Competition in the Australian Financial System - Public inquiry | 17
Foreign banksForeign banks have played a role in shaping the competitive landscape in Australian banking markets since they were first allowed to enter in the mid 1980s. At the time, foreign banks were seen as a catalyst for competition for business and retail lending, although their entry had little initial effect on the latter (Fraser 1994). In the 1990s, the entry of foreign banks into the online deposit market saw a rise in competition, with deposit rates increasing relative to the cash rate. In the lead-up to the financial crisis, foreign banks expanded their market share in the commercial property sector as lending to this sector grew rapidly (RBA 2014b). More recently, foreign banks from Asia have competed strongly in some segments of the business lending markets.
There have been few changes in foreign bank access or ownership rules in recent decades (RBA2014b). Instead, participation of foreign banks in Australian markets has been heavily influenced by conditions faced by their parent entities and in their home economies. Prior to the financial crisis, European and US bank participation in Australian banking markets had increased rapidly as their home economies experienced strong growth. However, as a result of the crises in these regions, these institutions quickly reduced their Australian exposures.
More recently, as Asian economies have grown strongly, Asian banks have expanded overseas, including into Australia. As in previous cycles, some foreign banks have access to low-cost funding through their parent entity and are looking to expand their operations, while others appear to be accepting a lower return on equity than Australian banks (Graph 19).
Graph 19
201 420 11200 820 05 20 1 70
20 0
40 0
60 0
80 0
bp s
0
20 0
40 0
60 0
80 0
bp s
Banks’ Debt Fund ing CostsQ ua rte r ly , by type
M a jor ba nks
F ore ig n ba nks
Sources: APRA ; RBA
Foreign ownership limits on Australian major banks have been confirmed by successive Australian governments since the Wallis Inquiry in 1997. Furthermore, the ownership structure of the banking system is not a critical determinant of the level of competition. There are also significant hurdles to allowing substantial foreign banks to operate in retail markets (Davis 2007; RBA 2014b).
18 RESERVE BANK OF AUSTRALIA

5. Deposits, Mortgages and SME LendingThis section examines competition in the markets specifically identified in the Inquiry’s Terms of Reference – deposits, mortgage lending and SME lending.
DepositsFinancial market conditions and banks’ access to wholesale funding markets have a large impact on deposit markets. As a result of these factors, competition for deposits intensified during the financial crisis, despite the market becoming more concentrated. As the supply of funding in wholesale markets increased over recent years, competition for deposits has eased, although there are indications that a relatively high degree of competition has persisted. Some indicators of this include the high price of deposits relative to other forms of funding, low levels of fee income derived from deposits and a high level of investment in payment services that are attached to transactional deposits. Regulatory developments, such as the introduction of the FCS and Basel liquidity standards, have also bolstered competition for deposits. There are, nonetheless, some features of deposit markets that indicate the strength of competition varies across products and across customers. These include the entry of foreign banks into wholesale but not retail deposit markets, pricing structures for retail deposits that favour new over existing depositors and the prevalence of bundling.
Developments since the financial crisisFinancial market conditions have a large impact on deposit markets (Graph 20). The tighter supply of funding in wholesale markets and a push by creditors for banks to shift to longer-term and more stable sources of funding during the global financial crisis resulted in greater demand for domestic deposits, particularly from the major banks. In the post-crisis period, the funding composition of banks continued to shift significantly towards deposits. This was partly a result of a change in the preferences of depositors, as they shifted out of poorly performing assets. Banks also attracted deposits by increasing interest rates (Graph 21). The average interest rate paid on deposits relative to the cash rate rose by around 2 percentage points from their level prior to the crisis, to be just below the level of the cash rate.
Graph 20
2014201120082005 20170
10
20
30
40
50
60
%
0
10
20
30
40
50
60
%
Fund ing Com position of Banks in Austra lia *S hare of to ta l fund ing
D om est ic depos its
S ho rt -te rm deb t**
E quityS ecurit isa t ion
Long - te rm deb t
Adjusted for movements in foreign exchange rates; tenor of debt isestimated on a residual maturity basisIncludes deposits and intragroup funding from non-residents
Sources: APRA ; RBA ; Standard & Poor ’s
Graph 21
201 2200 720 02199 7 20 17-4
-3
-2
-1
0
1
%
-4
-3
-2
-1
0
1
%
Deposit In te rest Ra tesM ajor ba nks , sp read to the cash rate
3 -m onth te rm de po s it*
A verage outs tand ing rate
Advertised rate; $10,000 depositSources: APRA ; Canstar ; Major banks; RBA
Submission 29 - Reserve Bank of Australia (RBA) - Competition in the Australian Financial System - Public inquiry | 19
However, since 2013 banks’ access to wholesale funding markets has improved, meaning that banks’ need to compete for deposits has reduced somewhat. This can be seen most clearly in the decline in the indicative deposit rate relative to money market rates, although the differential remains higher than before the financial crisis (Graph 22).
Graph 22
20 15201 3201 1200 9200 7 20 17-150
-100
-50
0
50
100
150
bps
-15 0
-10 0
-50
0
50
100
150
bps
M ajor Banks’ Deposit Ra tesSp re ad s over m oney m ark et ra tes of equiva lent m atur ity
A t -ca ll sa vings de po s its *
Term de po s it‘spe c ia ls ’
Spread to cash rate; existing customers only; excludes temporarybonus rates
Sources: Bloomberg; RBA
New entrantsThe entry of new banks following the Wallis Inquiry resulted in an intensification of competition in deposit markets, notably through foreign banks competing for the provision of online deposits. These products have remained in the market, although many banks have also maintained branch networks to collect deposits.
In the absence of further new entry in the retail deposit market, the major banks have taken a larger market share of the deposit market since the financial crisis (Graph 23). Part of this increase in share is due to the acquisition of smaller ADIs, but it is also in part cyclical. Further, there appear to be greater natural and regulatory barriers to entry in the retail deposit market than in the wholesale market, such as the need to set up a subsidiary, establish a brand and meet other regulatory requirements.
While it is more difficult for foreign bank entrants to compete for retail deposits, they are able to raise wholesale deposits (restricted to these by their licences) and have gained some market share in this segment (Graph 24). However, because they also have access to other funding options, including their parent entities, their demand for Australian dollar wholesale deposit funding is limited.
20 RESERVE BANK OF AUSTRALIA

Graph 23
201 3200 920 05 20 1760
65
70
75
80
%
60
65
70
75
80
%
M ajor Banks Deposits*M ark e t share
B us ine ss &gove rnm ent
Hous eho lds
Not seasonally adjusted or break-adjustedSources: APRA ; RBA
Graph 24
20 13200 920 0 5 20 176
7
8
9
%
6
7
8
9
%
Fore ign Bank DepositsS ha re of to ta l de po s its *
Excludes FX and intra group depositsSources: APRA ; RBA
Price competitionIn addition to cyclical forces, deposit pricing is influenced by the liquidity of deposits. Banks face liquidity risk because the maturity of their liabilities, including deposits, is shorter than the maturity of their assets, such as loans.
Banks pay higher interest rates on deposits that expose them to less liquidity risk – that is, those that are more stable and less likely to be withdrawn by the depositor (Table 2). Among other factors, this is influenced by type of depositor (wholesale or retail), the term to maturity (at-call or term) and the purpose of the deposit (savings or transactional). The relative interest rates on deposits have also recently been influenced by liquidity regulations, which treat retail (households, small businesses and self-managed superannuation funds) and longer maturity deposits as more stable than other deposit types (Atkin and Cheung 2017). These regulations will tend to lead to differentiation in pricing across deposit types. Offsetting this to some degree is the fact that there appears to have been less price differentiation within some deposit categories since the financial crisis. This is consistent with stronger deposit competition over this period (RBA 2014b).
ADIs that have access to the different segments of the deposit market can substitute between them, at least to some degree. For example, the major banks have the greatest capacity to substitute since they can raise deposits in most segments of the deposit market. This substitutability ensures that the interest rates on most deposits tend to move together.
Retail depositors’ ability to assess which ADIs are offering the best deals in deposit markets has improved as comparison websites have developed. Furthermore, there is transparency in the terms and conditions that retail customers receive. Nevertheless, there are also pricing structures, such as introductory rates and temporary specials, which favour new over existing customers. These pricing structures are indicative of banks’ response to customer inertia.
Submission 29 - Reserve Bank of Australia (RBA) - Competition in the Australian Financial System - Public inquiry | 21

Table 2: Distribution of Australian Dollar DepositsBy counterparty and type, at July 2017
Transaction
Per cent
SavingsPer cent
TermPer cent
Total$ billion
SharePer cent
Household 21 13 13 865 47
Business 13 4 12 534 29
Superannuation 3 3 5 225 12
Government 2 0 2 77 4
Other financial institutions
2 2 3 121 7
Total(a) 42 23 36 1821 100
(a) Excludes intragroup, bank and other ADI depositsSources: APRA; RBA
Non-price competitionCompetition for deposits need not occur solely through deposit interest rates. Banks also compete on fees and charges, other account-related services, innovation and new product offerings. Considering these broader indicators, it appears that there has been competition among incumbents over the past few years.
Consistent with the stronger competition on deposit interest rates since the financial crisis, fees on deposit accounts have been at historically low levels in recent years. As banks increased their share of deposit funding through the financial crisis, and raised the relative interest rate on deposits, they also lowered the average fees that they charge on deposit accounts. As a ratio of the value of deposits, these fees have come down from over 50 basis points to around 10 basis points.
For transactional deposit products, there have also been a range of innovations in payment technologies, such as contactless card and mobile phone payments and the New Payments Platform (NPP), which is scheduled to commence operations around the end of 2017.10 These innovations in account-related services are likely to be needed to attract or retain deposits. For banks, the investment in new technology often involves large fixed costs, which are more easily defrayed by larger banks due to their economies of scale and scope.
RegulationsThe introduction of deposit insurance (the FCS) and tighter liquidity regulations for banks (Basel liquidity standards) have both influenced competition in the deposit market. The FCS is likely to have enhanced competition to the extent that it has reduced perceptions that deposits at some institutions are safer than others. More recently, regulatory changes such as the Basel III liquidity standards have incentivised banks to source more stable deposit funding, such as retail and longer maturity deposits.
10 The NPP is a new 24-hour payment system that will provide real-time, data rich payments between customer accounts, with simple payment addressing capabilities. The system has been developed by 13 banks (including the Reserve Bank) over several years and is expected to become operational in late 2017. See <www.nppa.com.au > .
22 RESERVE BANK OF AUSTRALIA

MortgagesCompetition for mortgage lending has been driven by many factors. A reduction in the funding cost differential between the major banks and other ADIs, increased use of brokers and consolidation among smaller lenders (which has improved their efficiency) have likely boosted competitive pressures over recent years. Conversely, product bundling and a lack of transparency in the pricing of mortgages (with the prevalence of large unadvertised discounts in interest rates from advertised standard variable rates), are impediments to competitive outcomes. Dynamics in lending standards have also been a factor recently.
Developments since the financial crisisThe major banks’ share of the mortgage market increased sharply through the financial crisis as mortgage originators’ lending declined and major banks acquired some smaller lenders (Graph 25).
Graph 25
20 1320 0920 05 201 750
60
70
80
%
50
60
70
80
%
M ajor Banks’ Housing Loan Approva ls*M a rke t share
To ta l ap prova ls
O w ner -occup ie r
Excludes refinancing ; not seasonally adjusted or break-adjustedSources: APRA ; RBA
Since the crisis, the major banks’ share has declined a little. This has mainly been due to an increase in the shares of incumbent smaller Australian banks, foreign banks and non-ADIs; there have not been any significant new entrants. Some of these lenders, such as non-ADIs, specialise in lending to higher-risk borrowers (Aylmer 2016). The increase in the volume of activity for smaller lenders is likely to improve their economies of scale and capacity to compete. More accurate measurement of the scale of activity undertaken by some non-ADIs in the mortgage market will result from changes to the Financial Sector (Collection of Data) Act 2001.
Increasing use of the broker market to originate loans by smaller lenders and consolidation among credit unions and building societies over recent years are also likely to boost the efficiency of these entities. In contrast, many foreign banks have little or no presence in the Australian mortgage market despite being able to leverage the home-lending infrastructure in their home markets. In the past, new entrants might have found it more costly to set up new retail operations, requiring a branch network and name recognition, than to set up wholesale banking businesses to provide services to existing wholesale clients.
Increased use of brokers by borrowers has resulted in greater competition among lenders via this loan origination channel. Smaller lenders have made greater use of this distribution channel than the major banks because it is lower cost than a branch network (Graph 26). For borrowers, brokers
Submission 29 - Reserve Bank of Australia (RBA) - Competition in the Australian Financial System - Public inquiry | 23
reduce search costs by efficiently comparing deals across lenders. The introduction of a wider range of mortgage products, partly in response to prudential regulations, has increased the benefits for consumers of using brokers.
Graph 26
201 5201 3201 1200 9 2 01 73 0
3 5
4 0
4 5
5 0
5 5
%
3 0
3 5
4 0
4 5
5 0
5 5
%
Th ird -party Orig ina ted Loan Approva lsShare o f ho us ing loan a pp ro va ls
M a jo r b anks
O ther le nde rs
Sources: APRA ; RBA
Lending standardsDevelopments in lending standards have also had an effect on competition recently. As housing credit growth increased after 2012, strong competition for mortgage lending resulted in a weakening in lending standards and increased risk-taking by both housing lenders and borrowers. However, over the past few years banks have reassessed their approach to the risks in mortgage lending. This has been partly driven by prudential regulations designed to reduce risks in the mortgage market, which have been effective in tightening lending standards. It has also been driven by changes in lenders’ risk appetite as a result of several developments, including a rise in non-performing loans and a focus on risks of oversupply in some apartment markets. As a consequence of these developments, there has been a broad tightening in lending standards, and reduced supply of credit for various market segments. This includes the investor, non-resident, high-LVR and interest-only segments, as well as some regions.
The major banks were among the lenders that were competing strongly in many of these segments. They, and other lenders, have tightened their lending criteria, raised interest rates and pulled back from higher-risk lending. As they have done so, some smaller lenders (some of which have a lower risk appetite than the major banks), have regained market share, supported by strong ongoing demand for housing credit.
There have been other effects of the tightening in lending standards by ADIs. One has been a reduction in the level of refinancing. This followed a period of very strong growth in refinancing from 2012 through to mid 2015 when lenders, including the major banks, actively competed for each other’s existing customers through greater price discounting, fee waivers and cash back for refinanced loans. Another effect has been that some borrowers, such as non-residents, are no longer able to access credit from ADIs and have instead sought credit from non-ADIs.
24 RESERVE BANK OF AUSTRALIA
Price competitionThe typical Australian mortgage offered by the major banks is priced with reference to a benchmark standard variable rate (SVR). Major banks typically offer advertised and unadvertised discounts below the benchmark rate, with the discount dependent on factors such as the loan size and LVR, the number of products the customer has with the bank and other borrower or product attributes. Many smaller lenders do not offer unadvertised discounts, partly because of the higher costs involved in negotiating these agreements. Unadvertised discounts also appear to be offered in some overseas mortgage markets, such as in the United Kingdom and Canada.
The difference between the major banks’ SVR and the average rate paid by borrowers is significant and has changed through time. Since 2010 the average discount for all loans from a standard variable interest rate on a principal-and-interest loan for an owner-occupier has increased from around 60 basis points to around 90 basis points. The average discount for new borrowers exceeds that of existing borrowers and a large proportion of the discount is unadvertised (Graph 27).
Graph 27Variab le Housing Inte rest Rates*
B a lance -w e ighted average ra te on securitised loans
O w ner -occup ie r
2015 2016 20173 .8
4 .0
4 .2
4 .4
4 .6
4 .8
5 .0
%
New loans
O uts tand ing
Inves to r
2015 2016 20173 .8
4 .0
4 .2
4 .4
4 .6
4 .8
5 .0
%
For principal-and-interest and interest-only loans; data to July 2017Sources: RBA ; Securitisation system
Borrowers’ capacity to source the best deal and assess the benefits of switching providers has been assisted by the introduction of brokers and comparison websites. However, it is not clear that there is sufficient transparency in the mortgage market for existing borrowers to easily assess whether they have a good deal or whether they should consider refinancing.
A notable recent development has been a re-emergence of significant variation in interest rates between different borrowers and loan types in the mortgage market, reflecting both regulation and a reassessment of risk (Kent 2017). Lending rates for investors and interest-only borrowers now have a significant premium relative to owner-occupier and principal-and-interest loans. This has in part occurred in response to APRA measures designed to limit the flow of new lending in these categories . However, banks have sought to manage lending flows by adjusting pricing to both new loans and existing loans. The interest rate increases have boosted banks’ spread on housing lending and banks’ margins, but this at least in part reflects the higher risk of these loans. In contrast, there has reportedly been stronger price competition for owner-occupiers taking principal-and-interest loans.
Submission 29 - Reserve Bank of Australia (RBA) - Competition in the Australian Financial System - Public inquiry | 25

Small business lendingUnlike the market for large business loans, where competition appears to have intensified recently, competition for small business lending appears not to have changed much since the financial crisis. This is likely to be partly due to the greater structural impediments that this market has to overcome, such as information asymmetries. Comprehensive credit reporting, open data, innovations from new providers of finance that are making greater use of technology, and the government’s initiative to increase access to crowdsourced equity financing have the potential to increase competition for small business finance. On the other hand, product bundling and a low level of transparency in lending rate outcomes across different segments of the small businesses loan market are likely to be inhibiting competition.
Defining the small business lending marketDefining the small business segment is somewhat difficult due to the presence of alternative definitions of a small business (Simon and Moore 2015). For ADIs, lending to businesses in amounts lower than $1–2 million dollars is typically categorised as a small business loan. An alternative measure of small business lending is lending to unincorporated businesses.
The business lending market can also be decomposed along a number of dimensions, such as by industry and age of business. The intensity of competition within a particular segment or industry is likely to be influenced by the number and types of lending participants and their risk appetites. While the major banks tend to offer lending products to most segments of the small business loan market, many smaller local and foreign lenders tend to specialise. One example is the large market share in lending to the agricultural sector by foreign banks. Assessing the nature of competition in each of these segments is beyond the scope of this submission.
Credit risk and information costsThe average spread on small business loans is significantly higher than for large business loans. One reason for this is that small businesses are inherently riskier. Another is that the fixed costs to a lender (and borrower) of originating a loan and undertaking a credit risk assessment is a higher proportion of the loan than for a large business.
Some of the higher costs of originating loans and undertaking credit assessments could be overcome through comprehensive credit reporting or open data initiatives. Large businesses typically do not face the same information barriers to financing that small businesses face, since they often have greater regulatory reporting requirements and an established financial track record. Furthermore, the costs of loan origination for a large business are small relative to the revenue generated for the bank by the business. Increased use of brokers by smaller businesses and various forms of government assistance have helped deal with this information problem.
Access to finance Small businesses surveys tend to indicate that access to finance is currently not seen to be a significant issue. However, it is often a concern for some small businesses that are new or that are seeking to expand (Simon and Moore 2015).
Small businesses have more limited debt financing options than large businesses and this significantly changes the nature of competition for loans. As substitutes for bank loans, large businesses may access syndicated loan or corporate bond markets. Small businesses may source equipment finance
26 RESERVE BANK OF AUSTRALIA

from specialist companies and trade credit or they may use personal finance such as credit cards and home loans (Fitzpatrick and Lien 2013; Simon and Moore 2015). Recent innovations in the provision of credit to small businesses by fintech companies appear to have not yet gained much market share (ASIC 2016).
Many small businesses have limited collateral, other than a family home, against which they can secure a loan. At the same time, many banks have a low appetite for lending unsecured to small businesses, partly because of the limited financial data available. Without sufficient equity or collateral, many small businesses will receive only limited loan funding.
Small businesses also have more restricted access to external equity financing than large businesses. In some cases owners are also reluctant to take on external equity finance due to concerns that they will lose control of their business. The government’s initiative to widen access to crowdsourced equity financing will improve the range of equity financing options available to some small businesses.
Price competitionThe significant repricing of risk on all lending through the financial crisis has been more lasting for small businesses (Graph 28). This is likely to be partly a result of natural barriers to entry to this market. It is notable that in recent years there has been strong competition for large business lending from Asian banks, which has seen the major banks lose share and margin (Graph 28 and Graph 29). This contrasts with the market for small business lending, which remains relatively concentrated and where there has been little overall change in the spread between the average lending rate and the cash rate for a number of years.
There can also be a large dispersion in the interest rates offered to small businesses (RBA 2014b). Among other factors, this is likely to be due to differences in borrower or product risks. However, small businesses face significant search costs in determining whether they have the best deal. A reported increased use of brokers will assist them in reducing these search costs. However, a lack of transparency in lending rate outcomes across small business segments makes it difficult for borrowers to determine whether they have a good deal or the benefits of switching providers.
Submission 29 - Reserve Bank of Australia (RBA) - Competition in the Australian Financial System - Public inquiry | 27

Graph 28
201 3200 9200 5 20 1765
70
75
80
85
%
65
70
75
80
85
%M ajor Banks’ Business Lending Shares*
Uninco rpora te dbus inesses
P riva teno n- f inanc ia l bus ine sses
Seasonally adjusted and break-adjustedSources: APRA ; RBA
Graph 29
201 3200 920 05 201 70
100
200
300
400
bp s
0
10 0
20 0
30 0
40 0
bp s
M ajor Banks’ Outstanding Lending Ra tesS p rea d to ca sh rate
La rg e bus iness
S m a ll bus ine ss
Sources: APRA ; Bloomberg; Financia l Reports; RBA ; UBS AG, AustralianBranch
Product bundlingA bank’s lending arrangement with a business customer is often only a small part of an overall relationship that involves deposit and transactional banking products (Simon and Moore 2015). Banks have a strong incentive to provide products in addition to loans to small businesses since around 40 per cent of fee income that banks earn from businesses accrues from deposits and merchant services (Fitzpatrick and White 2017).
The ability to bundle products to small businesses is a means by which larger banks can restrict competition, since small businesses may find it more difficult to switch between alternative providers of financial services and obtain competitive prices on all of their products.
Alternatively, product bundling can also reflect other factors such as economies of scope that lower the costs of providing financial services to small businesses. Banks have indicated they have a preference to have lending relationships with small business customers with whom they have transactional banking relationships because they have greater insight into the credit risk associated with that customer. Regulatory changes that provide incentives for banks to source a larger share of more stable funding from retail deposits have also resulted in increased competition for small business deposits.
Brokers and fintech Small businesses often lack the expertise or resources to identify their financing needs. Increased use of brokers has lowered the search costs and increased price competition in some segments of the small business loans market.
The relatively high interest rates and information barriers faced by small businesses (including search costs) have also stimulated new innovative finance providers. These finance providers seek to reduce the information costs faced by small businesses and lenders by greater use of technology. There are a variety of different models including peer-to-peer, marketplace and payments-based providers. It is apparent that much of the technology locally is replicating models developed in the United States and United Kingdom. However, it is not clear that innovative finance providers have made significant inroads into Australian loan markets.
28 RESERVE BANK OF AUSTRALIA

Some banks have indicated that they are looking into ways in which they might utilise some of the new technology in order to reduce the cost of loan origination for small businesses. This technology might also stimulate the entry of new banks into the small business lending markets, through lowering the cost of risk assessments (and loan origination) or through generating economies of scale (through more efficient loan application processing).
Submission 29 - Reserve Bank of Australia (RBA) - Competition in the Australian Financial System - Public inquiry | 29
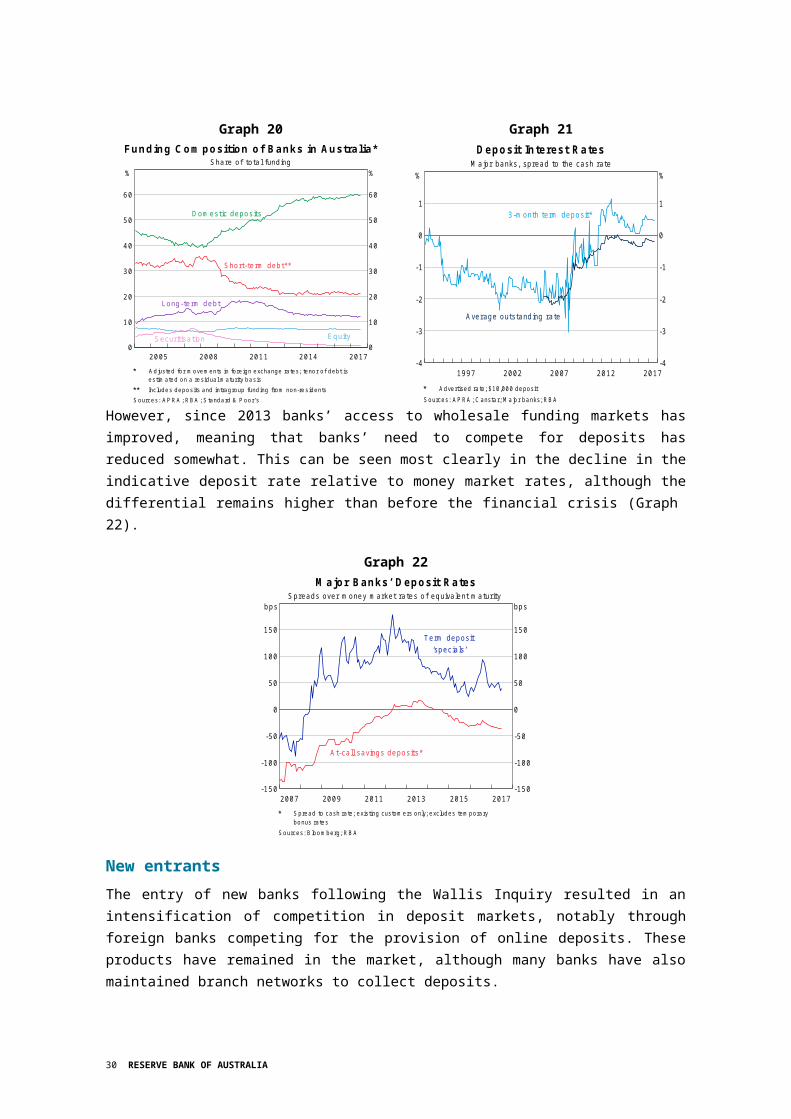
6. Competition in the Payments SystemThe Reserve Bank is the primary regulator of the payments system and competition is a key part of its regulatory mandate. The Bank has taken a number of actions since the early 2000s to enhance competition and efficiency in the payments system, mostly in relation to card schemes. While the nature of competition in payment systems can be complex due to the structure of the industry and the role played by network effects, the Bank’s overall assessment is that competition in retail payment systems is reasonably strong at present. The Bank, nevertheless, continues to monitor competitive conditions in the payments system and is prepared to take action, where it is in the public interest, to address any competition concerns that arise.
The role of the Payments System BoardThe promotion of competition in the payments system is a key part of the mandate of the Payments System Board (PSB) of the Reserve Bank. The PSB is responsible for the Reserve Bank’s payments system policy, including in relation to clearing and settlement facilities. The PSB is required to exercise its responsibilities in a way that best contributes to:
controlling risk in the financial system
promoting the efficiency of the payments system
promoting competition in the market for payment services, consistent with the overall stability of the financial system.
In practice, most of the competition issues that the PSB has dealt with relate to retail payment systems, where matters of competition and efficiency are key, compared with high-value payment systems and clearing and settlement facilities, where safety and stability are more critical.11 This section therefore focuses on the work of the Bank and the PSB in promoting competition in the retail payments system.
The approach of the PSB has been to encourage the industry to undertake reform on its own where possible, with the PSB using its powers only when it considers this to be in the public interest to do so to help manage risk and promote efficiency, competition and stability in the payments system. As a result, the PSB has made only limited use of its formal regulatory powers over the past two decades.
In discharging its responsibilities, the PSB is mindful of the responsibilities of other regulators. The Australian Competition and Consumer Commission (ACCC) has broad responsibility for competition and access issues in all industries under the Competition and Consumer Act 2010. The Bank and the ACCC have entered into a Memorandum of Understanding to ensure appropriate coordination between the two agencies in relation to competition issues in the payments system.
The Bank’s regulatory reforms in the card payments marketFrom the early 2000s, the Bank began implementing a series of reforms in the payment cards market as part of its mandate to promote competition and efficiency in the payments system. These reforms included the introduction of benchmarks for interchange fees, which are fees paid by the merchant’s financial institution (the acquirer) to the cardholder’s financial institution (the issuer) every time a 11 Competition issues do, however, periodically arise in other parts of the system, including in relation to the clearing
and settlement of Australian cash equities.
30 RESERVE BANK OF AUSTRALIA
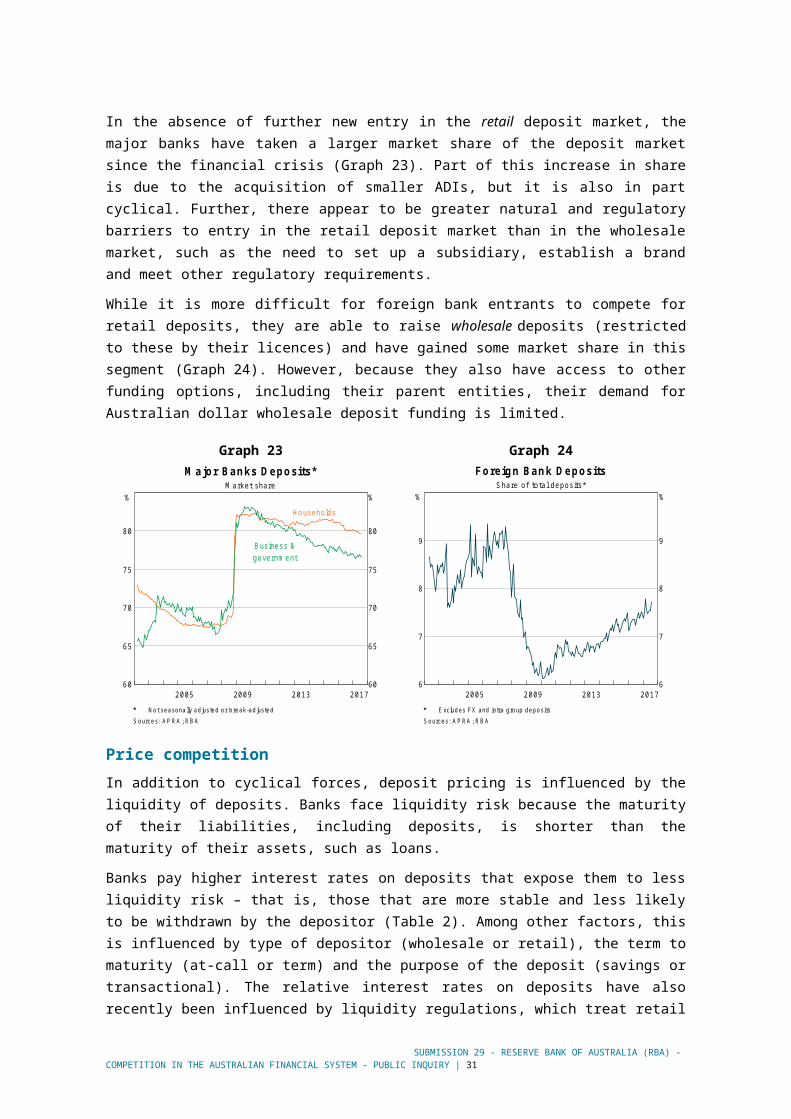
card payment is made. The benchmarks were aimed at increasing the transparency of interchange fees and limiting their tendency to rise. The reforms also involved changes to certain restrictive rules in card networks to provide merchants with the freedom to choose which cards they would accept and to apply surcharges on card transactions. By choosing to not accept a particular card type or to surcharge more expensive cards, merchants are able to provide signals to cardholders to choose less costly payment methods, and to schemes and acquirers to ensure that merchant service fees are competitive.
The Bank has also implemented access regimes for various card schemes aimed at reducing barriers to entry for entities wishing to issue cards or provide acquiring services to merchants.12 For instance, in 2006 the Bank introduced an access regime for the eftpos network to facilitate entry given that new participants had to undertake bilateral negotiations with multiple incumbents who had little incentive to assist them.13 The Bank has subsequently revised or revoked many of these access regimes when it was satisfied the card schemes had put in place improved access arrangements for new entrants.14
In 2015–16, the Bank undertook a comprehensive review of its card payments regulation, which resulted in several changes to the interchange and surcharging regulations (RBA 2016b). These included the introduction of ceilings on individual interchange fees as a supplement to the existing weighted-average benchmarks, a more tightly defined limit on the maximum surcharges that merchants can impose, and requirements for acquirers to provide merchants with greater transparency over their payment costs. The review also prompted additional reforms to enhance competitive neutrality in the payments card market by extending interchange fee regulation to American Express companion cards issued by banks. Though these cards do not involve interchange fees, they incorporate payments that are economically equivalent to interchange fees.
In recent years, the Bank has negotiated voluntary undertakings to deal with competition concerns in relation to dual-network debit cards, which are ATM/debit cards with point-of-sale debit functionality from two payment networks (eftpos and one of either MasterCard or Visa). The PSB was concerned that actions by particular networks with respect to these cards had the potential to inhibit competition, limit consumer choice and increase payment costs. Accordingly, in 2013, the Bank secured voluntary undertakings from the relevant schemes in which they agreed not to prevent issuers from including contactless applications of other schemes on debit cards and to not stand in the way of merchants exercising choice in the networks they accept and in how their contactless transactions are routed (RBA 2013). In 2016–17, the Bank undertook a public consultation in response to concerns about possible restrictions by schemes on the use of dual-network cards in mobile wallets(RBA 2016a). Following discussions with industry participants, the Bank received voluntary commitments from relevant participants that addressed these concerns without the need for regulatory intervention (RBA 2017).
12 An access regime is a regulation that seeks to ensure that new participants are able to access a payment system on fair and reasonable terms.
13 In the early 2000s, the Bank also implemented access regimes for the credit card networks with the aim of removing some restrictions on participation imposed by the credit card networks that unnecessarily inhibited competition and could not be justified as protecting the safety of the system. These access regimes involved the creation of a special class of financial institutions, to be authorised by APRA, to conduct only credit card activities.
14 The eftpos access regime was revoked in September 2015. Access regimes for the credit card networks were varied, effective January 2015, giving the card networks more flexibility to establish their own access eligibility and assessment criteria.
Submission 29 - Reserve Bank of Australia (RBA) - Competition in the Australian Financial System - Public inquiry | 31

Competition in the payments marketCompetition in payment systems is complex and multifaceted as it occurs at different levels and between different participants in those systems. At the broadest level, there is competition between different payment methods, such as credit and debit cards, bank transfers, cheques and cash. Payment methods have varying levels of convenience, cost and other attributes that make them more or less appealing to users. These differences have contributed to some noticeable shifts in consumer payment preferences, which the Bank has documented in its triennial Consumer Payments Surveys(Doyle et al 2017). One consistent trend over the past decade has been a shift away from paper-based payment methods, such as cash and cheques, and towards electronic methods, such as credit and debit cards.
Within the payment cards market there is competition between different card schemes and also between the participants within those schemes, namely card issuers and acquirers.15 The card schemes, such as Visa, MasterCard, and eftpos, compete to increase the issuance, acceptance and use of cards that utilise their payment networks. This competition can be reflected in the fees schemes charge and in the incentives and other benefits they provide to issuers, acquirers and/or merchants. Separately, there is competition between card issuers and between acquirers. In card issuance, competition is reflected in the pricing, rewards and other product features that apply to different types of cards. Acquirers mostly compete over the payment services and products they provide to merchants and the fees they charge (merchant service fees).
As the Bank has discussed elsewhere, the structure and competitive dynamics of card schemes can result in pricing outcomes that are economically counterintuitive.16 Where the market structure is such that there are multiple schemes whose cards are widely accepted and where consumers may hold one scheme’s cards but not the other, competition tends to involve offering incentives to a consumer to use a particular scheme’s cards (Guthrie and Wright 2007). In four-party card schemes, interchange fees are typically paid by the merchant’s financial institution (the acquirer) to the cardholder’s financial institution (the issuer) every time a payment is made. Therefore, a scheme that increases its interchange fees enables the card issuer to offer more generous incentives to cardholders, which can increase use of its cards. Competition between well-established payment card schemes can therefore lead to the perverse result of increasing the price of payment services to merchants (thereby leading to higher retail prices for consumers). This dynamic was evident in Australia before the Bank’s regulation of interchange fees and is observable today in markets such as the United States where credit card interchange fees are not regulated.
Card schemesPayment cards (debit, credit and charge cards) are the most frequently used retail payment method in Australia. The Bank’s Consumer Payments Survey showed that 52 per cent of consumer payments were made with payment cards in 2016, compared with 26 per cent in 2007 (Doyle et al 2017).
MasterCard and Visa are the two largest credit card schemes in Australia, with a combined market share of a little over 80 per cent of the value of credit and charge card transactions (Graph 30). They operate as four-party arrangements, relying on banks and other financial institutions to separately
15 Acquirers are institutions that provide merchants with facilities to accept card payments. The biggest participants in the cards market are both card issuers and acquirers, but there are some institutions that are only involved in card issuing or acquiring.
16 For a more detailed description of the competitive implications of interchange fees, see ‘Box A: Interchange Fees’ in (RBA 2015b).
32 RESERVE BANK OF AUSTRALIA
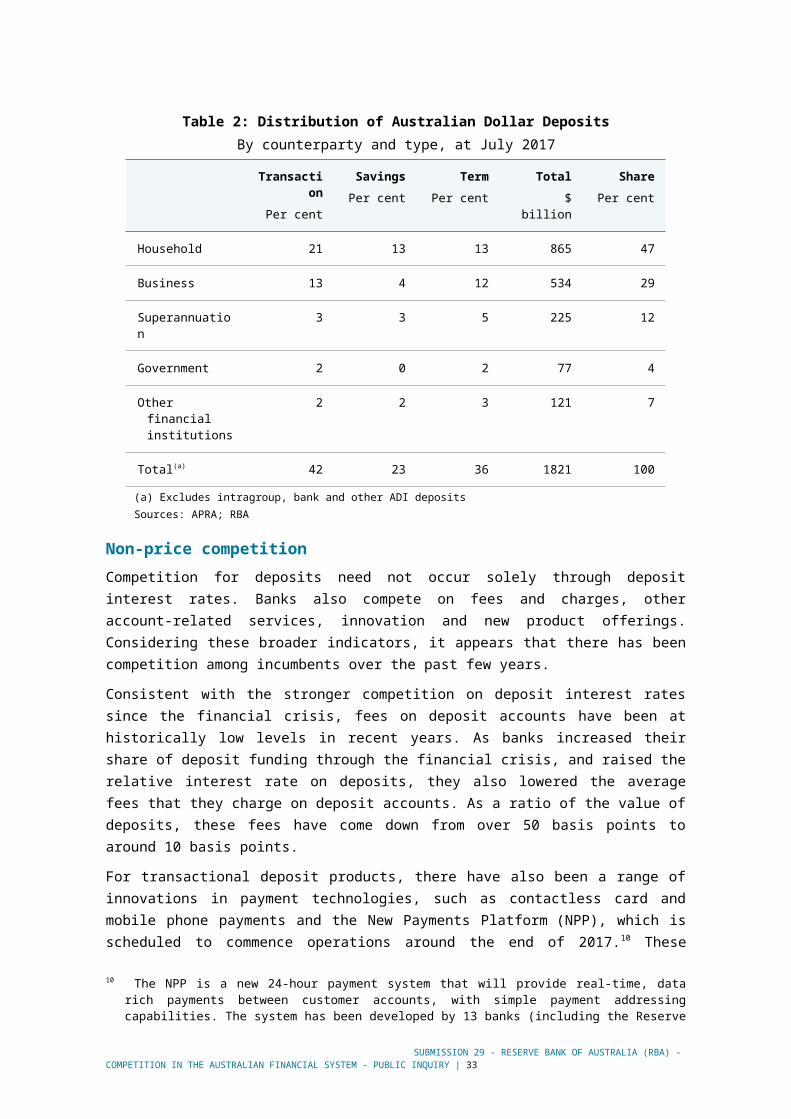
issue their cards and provide acquiring services. In contrast, American Express and Diners Club operate as three-party arrangements, where they act as the card issuer and acquirer themselves. Some banks also issue American Express companion cards for which American Express remains the sole acquirer. The introduction of companion cards by the major banks in 2004 and 2009 coincided with visible increases in American Express’ market share.
Graph 30M arke t Sha res of Ca rd Schem es*
Va lue of credit and charge ca rd purchasesM asterC ard and V isa **
80
85
%
80
85
%
Am erican E xp res s and D iners C lub
201320092005 201710
15
20
%
10
15
20
%
Excludes scheme debit after March 2008, which resulted in a 1.5percentage point break; darker lines are seasonally adjusted estimatesIncludes Bankcard before 2007
Source: RBA
MasterCard, Visa and eftpos compete in the debit card market (the American Express and Diners Club schemes do not include debit cards). MasterCard and Visa debit card transactions have generally grown at a faster rate than eftpos transactions over the past decade, with their combined market share rising to a little over 60 per cent. This largely reflects MasterCard and Visa’s relatively early introduction of contactless and online payments functionality, whereas eftpos only recently began offering contactless functionality and is still developing online payments functionality.
A high degree of concentration in a few card schemes is a characteristic of many payments markets. Payment systems have strong network effects that can make it difficult for new schemes to develop or enter the market. Consumers tend to only want to hold a card if there are many merchants that accept it, while merchants tend to only accept a brand of card as a means of payment if many potential customers hold it. UnionPay, which is one of the largest card schemes globally by virtue of its dominance in China, has been gradually building merchant acceptance in Australia by focusing on merchant segments with heavy exposure to inbound Chinese tourism. However, few UnionPay-branded credit cards have been issued locally, which is indicative of the challenges of establishing a new card scheme in the presence of these strong network effects.
Card issuing17
As in the broader banking market, the major banks are the largest card issuers in Australia. Spending on credit and debit cards issued by the major banks accounts for nearly 80 per cent of the value of card transactions, with this share remaining fairly stable over the past decade (Graph 31). Credit and charge card issuance is slightly less concentrated than the overall card market, partly reflecting the presence of American Express and Diners Club, which, as mentioned before, typically issue credit and charge cards directly to cardholders (rather than through a financial institution).
17 The Bank provided detailed information and observations about competition in the credit card market in its ‘2015 Submission to the Senate Inquiry into Matters Relating to Credit Card Interest Rates’ (RBA 2015c).
Submission 29 - Reserve Bank of Australia (RBA) - Competition in the Australian Financial System - Public inquiry | 33

Graph 31Paym ent Cards – Issu ing M arke t Shares*
B y va lue o f tra nsa ct ions , qua rte r ly
T o ta l
200 7 201 70
20
40
60
80
%
M a jo r b anks
C red it
2 00 7 2 017
No n-banks
D e b it
200 7 201 70
20
40
60
80
%
O the r banksand C UB S
Includes debit, credit and charge cardsSource: RBA
Credit card issuers compete for cardholders in various ways, including in relation to fees, reward points and other product benefits (e.g. travel insurance). Strong competition is evident in the frequency and range of offers that, for instance, waive annual fees for the first year or give sign-on bonuses in the form of frequent flyer points. Most notably, many credit card issuers offer a zero per cent (or significantly reduced) interest rate for balances transferred from another credit card for a set period of time. Around 70 per cent of the consumer credit cards that the Bank monitors have some form of active balance transfer offer.
Debit card issuance is a little more concentrated than the overall card market. This partly reflects that debit cards are issued as part of a bundle of transactional account services and are not offered or priced as standalone products like credit and charge cards. Accordingly, switching debit cards usually involves changing to a new transaction account, which can be inconvenient in terms of re-establishing direct debits and credits. While the industry has introduced arrangements to facilitate account switching, use of these arrangements is reportedly quite low. This could indicate a lack of customer awareness or a perception that the benefits from switching are not that significant. Looking forward, the New Payments Platform (NPP) and the introduction of an open banking regime may facilitate the development of services that make account switching easier (see below).18
Credit card interest ratesThe Reserve Bank’s primary responsibilities with respect to credit cards relate to the payment, rather than lending, function of these cards. Nonetheless, it is worth making a few observations regarding interest rates on credit cards.19
There is significant variation in the advertised interest rates on credit cards, reflecting the wide range of products offered, with some bunching of the rates on standard cards around 20 per cent and around 13 per cent for lower-rate cards. These rates have changed very little since 2010, despite a fall of over 3 percentage points in the cash rate over this period. The actual interest rates paid on credit cards will be lower than advertised rates to the extent that cardholders switch cards to take advantage of low- or zero-rate balance transfer offers or pay their balances in full every month. On 18 Recently, the House of Representatives Standing Committee on Economics recommended that the government,
following the introduction of the NPP, consider whether additional account-switching tools are required to improve competition in the banking sector (House of Representatives 2016).
19 For more detail about credit card interest rates, see (RBA 2015c).
34 RESERVE BANK OF AUSTRALIA
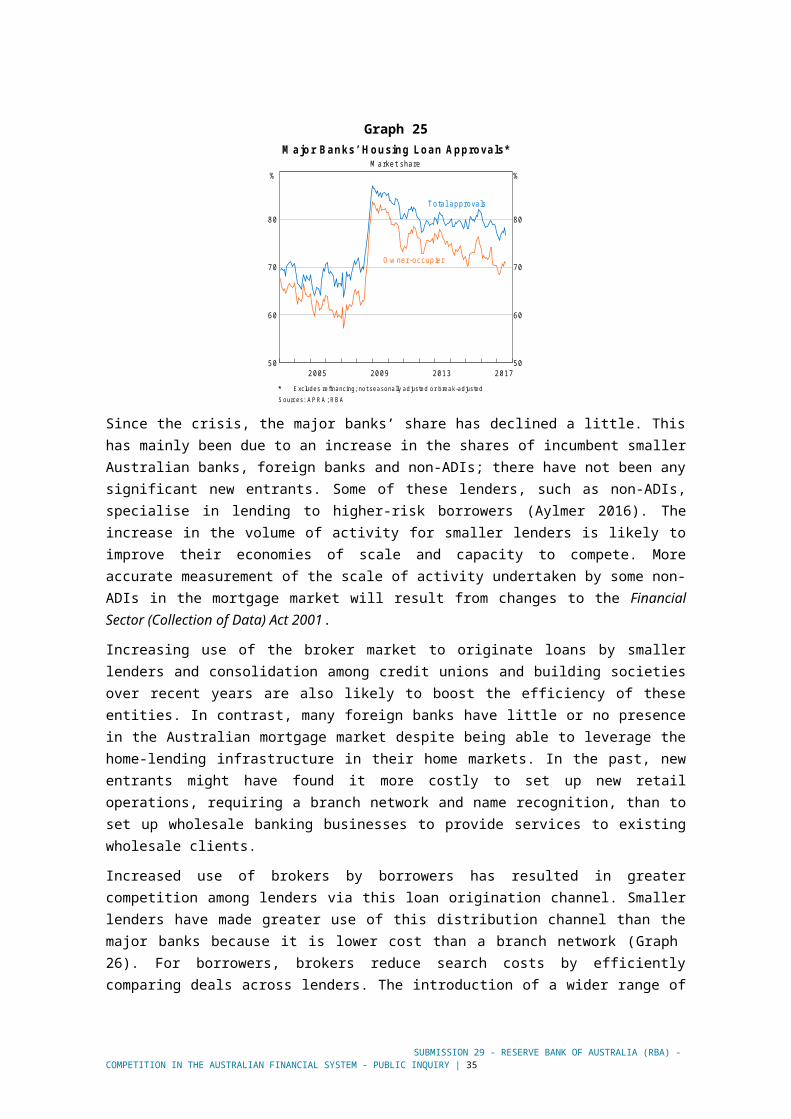
average, the outstanding rate on the entire credit card portfolio is around 11 per cent (or about 18 per cent for those cardholders who pay interest).
While issuers compete actively for new customers, credit card interest rates are relatively sticky and do not follow changes in issuers’ funding costs as closely as other lending rates. This is consistent with international experience and has been studied before (Ausubel 1991). A likely reason is the existence of a significant number of consumers who are either not well informed of the credit card options available to them or are reluctant to switch providers to seek a lower rate. While there are numerous credit card comparison websites, many consumers may be more focused on accumulating rewards, frequent flyer points or other benefits from card use. Issuers therefore have little incentive to compete on interest rates given that rates are not a determining factor in choosing a credit card for many individuals who (possibly mistakenly) do not expect to build up significant interest-accruing balances.
Card acquiringThe major banks are also the largest card acquirers in Australia, but their share of this market – at about 75 per cent of the value of card transactions – is a bit lower than their share of the card-issuing market, and has declined over the past decade (Graph 32). The decline in the major banks’ share partly reflects growth in the market share of American Express cards, which are acquired directly by American Express. In addition, two large Australian retailers have implemented payment-switching capability that allows them to ‘self-acquire’ transactions. A specialist acquirer, Tyro, also entered the market following the Bank’s initial access reforms in the early 2000s, and has since obtained a banking licence and is now offering a wider range of business banking products. Other specialist acquirers have entered the market more recently, notably Adyen and First Data, although their market shares are still small.
One indicator of competition in the card-acquiring market is the level of merchant service fees, which acquirers charge to merchants for every card payment they process. Since the Bank started regulating MasterCard and Visa interchange fees in the early 2000s, average (credit and debit) merchant service fees for these networks have roughly halved, to around 70 basis points (Graph 33). Most of this decline occurred in the years immediately following the reforms and was larger than the decline in interchange fees, suggesting strong competition between acquirers. Furthermore, average merchant service fees for American Express and Diners Club have also fallen since the reforms, by around 90 and 60 basis points, respectively, despite them not being directly regulated.
Submission 29 - Reserve Bank of Australia (RBA) - Competition in the Australian Financial System - Public inquiry | 35

Graph 32Paym ent Cards – Acquiring M arke t Shares*
B y va lue o f tra nsac tions , q uarte rly
T o ta l
2 007 2 0170
2 0
4 0
6 0
8 0
%
M a jor b anks
C re d it
2007 2 017
Non-b anks
D eb it
200 7 2 0170
2 0
4 0
6 0
8 0
%
O ther banksand C UB S
Includes debit, credit and charge cardsSource: RBA
Graph 33
201 3200 920 05 201 7-0.5
0.0
0.5
1.0
1.5
2.0
2.5
%
-0 .5
0 .0
0 .5
1 .0
1 .5
2 .0
2 .5
%
M erchant Se rvice FeesP er cent o f tra nsac tio n va lue s acq uire d
M aste rC ard and V isa
ef tp os
A m eric an E xp res s
D iners C lub
Source: RBA
Besides lower merchant fees, competition in card acquiring is also apparent in the increasing range of products and services being made available to merchants. For example, recently some acquirers have been offering more innovative options for accepting card payments at the point of sale or online, such as mobile card readers and online invoicing and payments solutions. Acquirers also commonly compete by offering discounted ‘bundled’ pricing on payment and non-payment services, such as a package that combines acquiring services, terminal rental, a business loan and insurance. While these packages provide additional convenience, and possibly better overall pricing, they may also act as an impediment to merchants switching to a different acquirer. A merchant will be less inclined to look for a better deal on its acquiring services if that would mean that it also has to renegotiate a number of other banking services at the same time.
One area where competition is yet to emerge is in the provision of least-cost transaction routing to merchants. Different card transactions have different costs for merchants, with debit cards usually having lower merchant service fees than credit cards. In addition, debit transactions that are processed through the domestic eftpos system are on average less expensive than transactions processed through the international MasterCard and Visa systems, reflecting both lower interchange fees and lower scheme fees (the fee that the merchant’s bank pays to the payment network). In ‘contact’ or ‘dip and PIN’ transactions involving dual-network debit cards, the cardholder chooses whether the transaction goes via eftpos (if they push CHQ or SAV) or the international network (if they push CR). However, with the introduction of contactless cards, the cardholder and merchant no longer influence the routing of the transaction – it is determined by the network priority that is preset by the card-issuing bank when it sends the card out. Initially, the international schemes were the only networks with contactless functionality, so a contactless debit transaction could only go via their networks. However, eftpos has now rolled out contactless functionality on almost all debit cards and almost all terminals are now enabled for eftpos contactless transactions. With international scheme transactions typically being more expensive for merchants, merchants report that the shift from contact to contactless transactions has resulted in a significant increase in payment costs for debit transactions and many merchants are now increasingly interested in their banks providing them with the ability to send debit transactions via the lower-cost network even if that network is not the first-priority contactless network on the card. The Bank understands that a number of acquirers are currently considering providing least-cost routing to merchants, a development which would contribute to a more competitive and efficient payments system. As noted above, one element of the
36 RESERVE BANK OF AUSTRALIA

undertakings provided by the three debit card networks in 2013 in relation to dual-network debit cards was that schemes would not prevent merchants from exercising choice in routing contactless transactions.
Competition in the ATM systemThe ATM system is another part of the payments system where the Bank has intervened to address competition concerns. In 2009, the Bank put in place an ATM access regime aimed at making it easier for new participants to join the system and introducing greater competition in fees by allowing ATM owners to charge cardholders directly for using their ATMs (and at the same time removing hidden interchange fees that were passed on to the cardholder in a non-transparent way). One outcome of these reforms was an increase in the number of ATMs as participants took advantage of the new pricing flexibility to place them in locations where they would not previously have been commercially viable. The number of ATMs in Australia has increased by about 25 per cent since 2008, to around 33,000 at end 2016 (Graph 34, left panel).
Graph 34ATM s in Austra lia
Num ber of AT M s
20122007 201715
20
25
30
35
’000 Num ber of AT M w ithd raw a ls *Yearly
20112006 2016600
675
750
825
900
m
Includes both domestic and international ATM cash withdrawals onAustralian-issued cards
Sources: Australian Payments Network; RBA
While the number of ATMs is still close to its peak, the use of ATMs has been declining rapidly in recent years reflecting a broader decline in the use of cash for transactions as consumers increasingly opt to use electronic means of payment (Graph 34, right panel) (Doyle et al 2017). The structure of the ATM industry has also changed since the original reforms were introduced, with the development of switches and other hub-based infrastructure making it easier for new entrants to join the ATM system without having to establish direct bilateral connections with all other participants. These changes mean that facilitating access for new participants has become less of an issue and so the Bank has recently been in discussions with the industry about the future of the ATM access framework, including exploring the scope to transition to a self-regulatory model in the future.
Technology and innovationDriven by advances in information and communications technology, the payments market has been going through a period of rapid innovation and technology evolution in recent years. Competition is increasingly being reflected in new customer-facing product innovations and technologies, introduced both by existing participants and challengers that are seeking either to gain a foothold in existing payment systems or attract business away from those systems. For example, among incumbents
Submission 29 - Reserve Bank of Australia (RBA) - Competition in the Australian Financial System - Public inquiry | 37

there has been a focus on the deployment of contactless ‘tap and go’ and mobile payments functionality in recent years.
The number of contactless card payments has increased strongly in recent years, largely because of the growing use of contactless cards for lower-value payments. The 2016 Consumer Payments Survey showed that nearly two-thirds of all point-of-sale card payments were contactless. Similarly, mobile payments technology has attracted significant investment in recent years. Almost all financial institutions in Australia have internet banking mobile apps, which facilitate mobile payments. Third-party mobile wallet apps, such as Apple Pay, Android Pay and Samsung Pay, have all been recently launched in Australia, although they are not available across all banks or card schemes.
New entrants into the payments market have also been driving innovation in retail payments. Firms such as PayPal and POLi, which offer customers new ways to make online payments that may be more convenient, have experienced strong growth over recent years, although from a low base. In addition to online payments, new entrants are active in other parts of the payment system, including merchant services and card payments processing (such as Square), card acquiring (such as Tyro) and remittances (such as OFX and TransferWise). As would be expected, however, the types of innovations that are succeeding in Australia reflect the initial structure of, and gaps in, our payments system. For example, with almost all Australians having bank accounts and payment cards, services similar to Kenya’s M-Pesa system, where customers’ funds are held by a mobile phone operator, have gained little traction here. Furthermore, given the high use of cards and high penetration of payment card terminals in even the smallest retailers, it remains to be seen whether there will be demand for QR-based payments which have grown rapidly in China where card terminals are much less ubiquitous.
Digital currencies are another area of innovation in retail payments, although their use and merchant acceptance is extremely limited at present in Australia. Digital currencies have displayed high levels of price volatility and some security issues that are likely to make them unappealing for many consumers. Nonetheless, as technology improves and industry practices evolve, it is possible that they may become more widely used, providing competition to other payment methods; this is more likely for cross-border payments than for domestic use. Recent changes in some policy settings, such as the removal of the double incidence of GST on digital currency transactions, may encourage the development of more products and services related to digital currencies (ATO 2017).
Looking forward, the Australian Government has recently announced that it intends to introduce an open banking regime in Australia (The Treasury 2017). Allowing consumers to securely share their personal banking data with other service providers could facilitate the development of innovative services and promote the entry of new players into the payments market. Fintech firms, for example, could develop services that provide personalised product comparisons, facilitate account switching, or allow customers to securely make online payments direct from their bank account as an alternative to other payment methods. Given the potential benefits for innovation, competition and efficiency in the payments system, the Bank is strongly supportive of an open banking regime.
Despite these positive developments, there are some challenges. Some fintech firms have suggested that access to banking services is difficult where the firm’s business model relates to payments. Partly, this may be the natural response of incumbents, which, in any industry, generally have little incentive to cooperate with new competitors. In addition, some banks have indicated that they are reluctant to deal with bitcoin-related start-ups due to the risks arising from AML/CTF regulation and international enforcement.
38 RESERVE BANK OF AUSTRALIA

Innovation in payments networks and the New Payments PlatformSome innovations in the payments market, such as a new wireless card acquiring terminal, can be characterised as proprietary in nature. The decision to innovate is largely based on the expected benefit to the innovator, for example lower costs or greater revenue to the participant that introduces the new type of terminal (RBA 2011). Since the innovator can implement the technology and receive the benefits without coordinating with many other participants in the system, competitive pressures are likely to encourage proprietary innovation.
In contrast, innovations in the cooperative systems and arrangements that underlie most payment systems are more difficult to achieve since they require agreements across many participants. An investment in cooperative infrastructure might not align with individual banks’ investment cycles or banks may have concerns that investing in a standardised technology could give competitors an advantage. The need to coordinate can result in innovation being slower than desirable and, in some cases, new technologies may not be implemented at all.
To encourage greater cooperation in payments innovation, in 2012 the Bank published a set of high-level strategic objectives for the payments industry following a Strategic Review of Innovation in the Payments System.20 These objectives addressed a number of gaps in the payments system, including the ability to make real-time payments on a 24/7 basis with simpler addressing and richer data.
The NPP, currently under development by a group of 13 financial institutions, is the industry’s main vehicle for addressing the Bank’s initial set of strategic objectives. One of the ‘core criteria’ that the Bank specified for the NPP was that it ‘should be based on efficient, secure and open hub-type architecture, capable of supporting fair and open access’. Accordingly, it has been designed to provide a platform for the development of innovative payment services over coming years. In particular, it will be capable of supporting specialised overlay services, tailored to meet the specific payment needs of different groups of users.
The governance of the NPP – including an independent chair and representation of industry stakeholders catering for the interests of large, medium and smaller institutions – will support open access and competition from various payment system participants to utilise the platform. The Bank, which is also represented on the Board of the NPP, will continue to monitor the progress of the platform, including its arrangements around access and support for competition. At some point after the NPP is operational, it will be appropriate for the Bank to assess how well the NPP has met the initial set of strategic objectives and whether there are other areas where cooperative industry approaches to innovation in the payments system are needed.
20 See ‘Box E: Initial Strategic Objectives’ in (RBA 2012).
Submission 29 - Reserve Bank of Australia (RBA) - Competition in the Australian Financial System - Public inquiry | 39

7. Summary of Key ThemesThe discussion in the preceding chapters highlights that periods of more intense competition in individual markets have typically come from new models and new entrants rather than existing players, for example:
The growth of the RMBS market and entry of mortgage originators led to strong competition in mortgage markets in the mid-to-late 1990s.
The adoption of online savings accounts – initially by foreign banks – led to greater competition in deposit markets.
The recent entry of some Asian banks into corporate lending has increased competition in that market.
New entrants, particularly those with new business models or low costs, are therefore likely to be important in determining the future competitive environment. Such entry cannot be easily engineered; the role of authorities is to provide a supportive regulatory and competitive environment, with no unnecessary impediments, while ensuring that the system remains safe, both systemically and for individual customers.
The Commission’s Terms of Reference is broad and its enquiries could follow many potential paths. The following provides a brief summary of areas contemplated in this submission that are likely to be of interest to the Commission.
Foreign banks. As noted above, foreign banks have been important in some episodes of more intense competition. However, their participation can be contingent on developments in their home jurisdictions. The small business market could most benefit from foreign entrants at present. Greater access to the credit and payment histories of borrowers might be beneficial to this. There is also scope for foreign entrants to compete more actively in the mortgage market – though the Bank would not wish to see this result in the erosion of lending standards.
Fintech. There is some scope for fintech lenders to add to competition in under-served markets, including by using new techniques for distribution and credit assessment. Fintech developments can also help to increase transparency and reduce impediments to switching providers. The sustainability of these new techniques and players needs to be assessed over a full cycle. We note that considerable effort has been made to accommodate new players through ASIC’s ‘regulatory sandbox’ and Innovation Hub, legislation to support crowdsourced funding and APRA’s consultation on its authorisation framework. Support is also available through various ‘incubators’. In the Bank’s view, these initiatives are striking an appropriate balance. The ability for start-ups to experiment with a concept at relatively low cost and quickly move on if it does not prove successful (‘fast failure’) is important for supporting innovation. In the longer term, however, a firm cannot and should not expect to rely on lighter regulation than its competitors to sustain its business.
Funding costs and implicit guarantees. The lower funding cost of the major banks has constrained the ability of smaller ADIs to compete since the crisis. This differential has, however, narrowed recently, as smaller banks’ funding costs have declined more quickly than those of the major banks. Regulatory measures, such as higher capital requirements for the major banks, higher risk-weights on mortgage lending and the bank levy, have contributed to this. The Financial Claims Scheme also minimises retail depositors’ concern about the safety of deposits in smaller institutions.
40 RESERVE BANK OF AUSTRALIA

Information problems and transparency. Efforts underway to promote open banking and comprehensive credit reporting in order to reduce information problems could also help improve competition as will greater transparency of lending rates. The latter will be addressed under current data initiatives and proposed legislative changes.
Price differentiation. Banks appear to be able to differentiate freely between old and new customers, suggesting that established customers are not sufficiently aware of the possibility of a better deal or are reluctant to switch providers. This could result in established customers cross-subsidising new customers. Greater transparency, as discussed above, would be beneficial as will improvements in switching through digital identity and the NPP.
Bundling. Product bundling is also an inhibitor to switching and competition, though it can be convenient for customers. Consideration could be given to whether current practices strike an appropriate balance.
Reserve Bank of Australia15 September 2017
Submission 29 - Reserve Bank of Australia (RBA) - Competition in the Australian Financial System - Public inquiry | 41

ReferencesAgoraki M, M Delis and F Pasiouras (2011), ‘Regulations, competition and bank risk-taking in transition countries’, Journal of Financial Stability, pp 38–48.
APRA (2015), ‘APRA increases capital adequacy requirements for residential mortgage exposures under the internal ratings-based approach’, Media Release No 15.19, 20 July.
APRA (2016), ‘Revised Standard on Securitisation’, November. Available at <http://www.apra.gov.au/MediaReleases/Pages/16_43.aspx>.
APRA (2017a), ‘APRA announces ‘unquestionably strong’ capital benchmarks’, Media Release No 17.23, 19 July.
APRA (2017b), ‘APRA consults on changes to authorising new entrants to banking industry’, Media Release No 17.31, 15 August. Available at <http://www.apra.gov.au/MediaReleases/Pages/17_31.aspx>.
ASIC (2016), ‘Survey of marketplace lending providers’, June.
Atkin T and B Cheung (2017), ‘How Have Australian Banks Responded to Tighter Capital and Liquidity Requirements?’, RBA Bulletin, June, pp 41–50.
ATO (2017), ‘GST – removing the double taxation of digital currency’, 10 July. Available at <https://www.ato.gov.au/General/New-legislation/In-detail/Indirect-taxes/GST/GST---removing-the-double-taxation-of-digital-currency/>.
Ausubel L (1991), ‘The Failure of Competition in the Credit Card Market’, The American Economic Review, 81(1), pp 50–81.
Aylmer C (2016), ‘Towards a more Transparent Securitisation Market’, Australian Securitisation Conference, Sydney, 22 November.
Bank of Japan (2017), ‘Financial System Report’, April. Available at <https://www.boj.or.jp/en/research/brp/fsr/data/fsr170419a.pdf>.
Berger A, L Klapper and R Turk-Ariss (2009), ‘Bank Competition and Financial Stability’, Journal of Financial Services Research, 35(2), pp 99–118.
Cheung B (2017), ‘Developments in Banks’ Funding Costs and Lending Rates’, RBA Bulletin, March, pp 45–50.
Claessens S and L Laeven (2004), ‘What Drives Bank Competition? Some International Evidence’’, Journal of Money, Credit and Banking, 36(3), pp 563–583.
Davis K (2007), ‘Banking Concentration, Financial Stability and Public Policy’, in , Proceedings of a Conference, Reserve Bank of Australia.
42 RESERVE BANK OF AUSTRALIA
Debelle G (2015), ‘Some Effects of the New Liquidity Regime’, 28th Australasian Finance and Banking Conference, Sydney, 16 December.
Dell’Ariccia G and R Marquez (2001), ‘Flight to Quality or to Captivity: Information and Credit Allocation’, IMF Working Paper.
Dombret A (2016), ‘Are there too many banks? The banking sector after the financial crisis’, Speech given at the general meeting of the Austrian Society for Bank Research, 27 September.
Doyle M-A, C Fisher, E Tellez and A Yadav (2017), ‘How Australians Pay: Evidence from the 2016 Consumer Payments Survey’, RBA Research Discussion Paper No 2017-04.
Financial System Inquiry (2014), ‘Financial System Inquiry Final Report’, November. Available at <http://fsi.gov.au/publications/final-report/>.
Fitzpatrick A and B Lien (2013), ‘The Use of Trade Credit by Businesses’, RBA RBA Bulletin, September, pp 39–46.
Fitzpatrick R and G White (2017), ‘Banking Fees in Australia’, RBA Bulletin, June, pp 35–40.
Fraser B (1994), ‘Foreign Banks in Australia’, Talk to the Overseas Bankers’ Association of Australia, Melbourne.
Guthrie G and J Wright (2007), ‘Competing Payment Schemes’, Journal of Industrial Economics, 55(1), pp 37–67.
House of Representatives (2016), ‘Review of the Four Major Banks: First Report’, Standing Committee on Economics, November.
Hughes J, L Mester and C Moon (2001), ‘re scale economies in banking elusive or illusive?: Evidence obtained by incorporating capital structure and risk-taking into models of bank production’, Journal of Banking & Finance, 25(12), pp 2169–2208.
Jayaratne, S J and P (1998), ‘Entry Restrictions, Industry Evolution, and Dynamic Efficiency: Evidence From Commercial Banking’, The Journal of Law & Economics, 41(1), pp 239–274.
Kent C (2017), ‘Some Innovative Mortgage Data’, in , Moody’s Analytics Australia Conference 2017, Sydney.
RBA (2006), ‘The Structure of the Australian Financial System’, Financial Stability Review, March, pp 49–61.
RBA (2011), ‘Strategic Review of Innovation in the Payments System’, June.
RBA (2012), ‘Strategic Review of Innovation in the Payments System: Conclusions’, June.
RBA (2013), ‘Dual-network Debit Cards’, Media Release No 2013-16, 21 August. Available at <https://www.rba.gov.au/media-releases/2013/mr-13-16.html>.
Submission 29 - Reserve Bank of Australia (RBA) - Competition in the Australian Financial System - Public inquiry | 43

RBA (2014a), ‘Box B: Australian Major Banks’ Cost-to-income Ratios’, Financial Stability Review, September, pp 35–38.
RBA (2014b), ‘Submission to the Financial System Inquiry’, March.
RBA (2015a), ‘Box C The Regulatory Capital Framework for Residential Mortgages’, Financial Stability Review, October, pp 52–55.
RBA (2015b), ‘Review of Card Payments Regulation’, March.
RBA (2015c), ‘Submission to the Senate Inquiry into Matters Relating to Credit Card Interest Rates’, August.
RBA (2016a), ‘Dual-Network Cards and Mobile Wallet Technology’, December.
RBA (2016b), ‘Review of Card Payments Regulation: Conclusions Paper’, May.
RBA (2017), ‘Payments System Board Update: May 2017 Meeting’, Media Release No 201-10, 19 May. Available at <https://www.rba.gov.au/media-releases/2017/mr-17-10.html>.
Simon J and A Moore (2015), ‘Small business Conditions and Finance’, in , Proceedings of a Conference, Reserve Bank of Australia, Sydney.
Stewart C, B Robertson and A Heath (2013), ‘Trends in the Funding and Lending Behaviour of Australian Banks’, RBA Research Discussion Paper No 5.
The Australian Government (2015), ‘Improving Australia’s Financial System, Government response to the Financial System Inquiry’, October.
The Australian Government (2017), ‘Building an accountable and competitive banking system’, 9 May. Available at <http://sjm.ministers.treasury.gov.au/media-release/044-2017/>.
The Treasury (2017), ‘Review into open banking in Australia’. Available at <https://treasury.gov.au/review/review-into-open-banking-in-australia/>.
Wilkins K, G Gardner and B Chapman (2016), ‘Developments in Banks’ Funding Costs and Lending Rates’, RBA Bulletin, March, pp 21–30.
44 RESERVE BANK OF AUSTRALIA