Embed Size (px)
Citation preview
8/2/2019 Submission 1 101340
http://slidepdf.com/reader/full/submission-1-101340 1/21
Interim Project Report
January 23rd, 2012
In partial fulfillment of the requirements of the course
“Rural Marketing”
of Master of Business Administration (Full Time)
Title:
Fertilization Industry
Faculty Guide: Submitted By:
Prof. Bhavani Shankar Ravi Patel
101340MBA FT 10-12

8/2/2019 Submission 1 101340
http://slidepdf.com/reader/full/submission-1-101340 2/21
Contents
Introduction ..................................................................................................................................... 3
Consumption and Production .......................................................................................................... 3
Fertilizer Types ............................................................................................................................... 5
Different Types of Fertilizers.......................................................................................................... 6
FERTILIZER CONSUMPTION – INDIA & REST OF THE WORLD ....................................... 7
GROWING DEMAND OF FERTILIZERS AND IMPORT DEPENDENCE .............................. 7
GOVERNMENT’S LATEST DECLARATION ON FERTILIZER POLICY .............................. 8
NUTRIENT BASED SUBSIDY (NBS) POLICY ......................................................................... 9
POSSIBLE EFFECTS OF NBS...................................................................................................... 9
Fertilization Production ................................................................................................................ 11
Raw Materials and Intermediates Requirements in the Manufacture of fertiliser Materials ........ 11
Indian Fertilizer Company Profiles ............................................................................................... 13
Public Sector ................................................................................................................................. 13
Cooperative sector ........................................................................................................................ 13
Management of Working Capital In IFFCO and KRIBHCO - A Comparative Study ................. 14
Products offered by IFFCO ........................................................................................................... 14
Products offered by KRIBHCO .................................................................................................... 15
Questionnaire ................................................................................................................................ 15
Analysis: ....................................................................................................................................... 17
Conclusion: ................................................................................................................................... 21

8/2/2019 Submission 1 101340
http://slidepdf.com/reader/full/submission-1-101340 3/21
Introduction
The Indian fertilizer industry has helped in the growth of the Indian economy. The
fertilizer sector by enhancing the agricultural productivity has in turn resulted in
providing a major support to the farmers who are primarily dependent on agriculture.Fertilizers have also played a pivotal role in India's food Security.
For the Indian government, food has been the primary objective owing to its huge
population. In India, therefore the fertilizer industry has wielded immense influence, like
no other sectors in India. To cater to the needs of the individual, government top priority
has been towards production of food grain. Since the poor farmers could not afford to buy
expensive fertilizing agents, the government's interventionist policy helped in providing
the farmers fertilizers at a reasonable cost. The government formulated the RetentionPrice-Cum Subsidy scheme which has been a major impetus for the fertilizing industry
since 1977 to 1992.
Consumption and Production
The following data compares the consumption against the production of fertilizers in
India over the years.
Increase in fertilizer consumption:
1950-51: .07mn Mts
1975-76: 2.9mn Mts
2005-06: 20.3mn Mts
Increase in fertilizer production:
1951-52: .04 million Mts
1975-76: 1.8mn Mts
2005-06: 15.5mn Mts

8/2/2019 Submission 1 101340
http://slidepdf.com/reader/full/submission-1-101340 4/21
These periods also witnessed a rapid increase in food grain production, which was
estimated to be initially 121 million tons from 52 million tons and finally increased to
208 tons.
At present the government has formulated a new pricing scheme (NPS) replacing the
RPS. The fertilizer industry of India is not same in terms of stock, its yield, and
technology. Because of this, the urea plants have been assorted into groups to reduce
them from being diverse and incomparable under the NPS scheme. The NPS has been
modified, promoting further investment in the Indian fertilizer sectors.
The Fertilizer Association of India (FAI) has been set up a model which is based on
several factors that include fertilizer prices, high yielding areas, irrigated areas, fertilizer
nutrient prices and previous years' fertilizer consumption. An estimate of the demand and
supply till the end of the 11 th five year plan is given in the chart below:
Year Supply
N+P
Demand
N+P+K
Demand
Supply
Gap
N+P+K
Demand
of K
2007-08 16950 23125 8835 2660
2008-09 17585 24085 9305 2805
2009-10 18595 25035 9405 2965
2010-11 19912 25960 9178 3130
2011-12 19965 26900 10235 3300

8/2/2019 Submission 1 101340
http://slidepdf.com/reader/full/submission-1-101340 5/21
Today, India stands as the third largest fertilizer consumer and producer of the world. It
has been observed that the subsidies on Indian fertilizer have been rising at constant rate.
This is due to the rise in the cost of production and the inability of the government to
raise the maximum retail price of the fertilizers. The population of the country is rapidly
increasing at 1.5% annually. This requires higher production of food grains. The total
cropped area is only 30% of the net geographical area, which is not enough for increasing
the agricultural productivity. Now, the main focus is on the improvement of the farm
income, for which the fertilizer industry needs to lay more stress on the agricultural
activities in the country. This will also help to improve terms between the government
agencies and the fertilizer industry in India.
Fertilizer Types
Soil amendments are made by adding fertilizer to the soil but there are different types of
fertilizers. There is bulky organic fertilizer such as cow manure, bat guano, bone meal,
organic compost and green manure crops. And then there is also chemical fertilizer which
is also referred to as inorganic fertilizer and is made up with different formulations to suit
a variety of specified uses. Though many governments and agricultural departments go to
great lengths to increase the supply of organic fertilizers, such as bulky organic manures
and composting materials, there is just not enough of these fertilizers available to meet
the existing and future fertilizer needs. Compared to organic compost, chemical or
inorganic fertilizers also have the added advantage of being less bulky. Being less bulky
makes chemical fertilizer easier to transport, both overland and from the soil into the
plants itself, because they get to be available to the plant relatively quickly when
incorporated as part of the plant-food constituents. Chemical fertilizer usually comes in
either granular or powder form in bags and boxes, or in liquid formulations in bottles.
The different types of chemical fertilizers are usually classified according to the three
principal elements, namely Nitrogen (N), Phosphorous (P) and Potassium (K), and may,
therefore, be included in more than one group.

8/2/2019 Submission 1 101340
http://slidepdf.com/reader/full/submission-1-101340 6/21
Different Types of Fertilizers
The different types of fertilizers with all its specifications and cautions that should be
kept in mind should not detract us from the joys of gardening. Thus to make it easier on
most gardeners and since this website is dedicated to the home gardener and growing ourown gardens the following section is geared towards the home gardener.
The different types of chemical and organic fertilizers that are usually commercially
available in most countries can be categorized further into:
Complete inorganic fertilizers: – these types of inorganic fertilizers contain all
three major macronutrients, Nitrogen (N), Phosphorous (P) and Potassium (K). On the
containers you will find that these macronutrients are depicted as a ratio, e.g. 2:3:2 (22).Complete inorganic fertilizers are usually applied at a rate of 60g/m2 or roughly 4
tablespoons per square meter.
Special purpose fertilizer: – these types of fertilizer are formulated especially to
target certain plants' requirements or certain soil deficiencies. Of the examples that come
to mind here are the Blue Hydrangea Food, and straight fertilizer that is made up of one
particular plant nutrient for example lawn fertilizer.
Liquid fertilizers: – these types of fertilizer come in a variety of formulations andeven include organic fertilizer, complete fertilizer as well as special purpose fertilizer.
Some examples of liquid fertilizer are Nitrosol and African Violet Food.
Slow-release fertilizer: – these types of fertilizer are formulated to release their
nitrogen at a steady pace. On the packs of this fertilizer that are available commercially it
will usually be depicted as 3:1:5 (SR) where the SR indicates slow-release.
Fertilizer with insecticide: – these types of fertilizer that are prepared and
combined with an insecticide. One such example is Wonder 4:1:1 (21) + Karbaspray.
The reason why there are so many different types of chemical fertilizers in different
formulations is because different plants require different nutrients and different pH levels
in the soil. However, organic fertilizers have more diversity, and these types of fertilizers

8/2/2019 Submission 1 101340
http://slidepdf.com/reader/full/submission-1-101340 7/21
do not burn plant roots, get into ground water, or affect surrounding growth as is the case
when using the different types of chemical fertilizer and NPK amendments.
FERTILIZER CONSUMPTION – INDIA & REST OF THE WORLD
Fertilizer is a key input in increasing productivity in agriculture. The agricultural
production of the country went up from 50.82 million tonnes in 1951 – 52 to around 200
million tonnes during 2000-01 and it is on record that more than 50% of this enhanced
production has come from the increased use of fertilizers. It is needless to mention that
for every additional unit of fertilizer consumption, increase in agricultural production
ranges between 8.09 to 12% or more. The average growth in consumption of fertilizer
nutrients in our country have steadily increased from 1st to 3rd Five year plan period
which dropped substantially to 10% level during the 4th plan period and remained
stagnant up to the 5th Plan Period. The growth rate again dropped abnormally to only
2.4% at the end of 8th plan period. The growth rate was 4.9% per annum during the 10th
five year plan period which was higher than the previous two plan periods. In absolute
terms, though consumption of plant nutrient (N+P+K) per hectare of arable land in our
country increased significantly from 100 kg per during 2002-03 to 116.51 kg during2007-08, it is far behind the developed countries and even the developing countries.
There is therefore ample scope and necessity to increase the consumption of fertilizer
nutrients to bring the country back to a position of self-sufficiency and gradually
transform it in to a food grain surplus nation.
GROWING DEMAND OF FERTILIZERS AND IMPORT
DEPENDENCE
The domestic production of Urea and DAP are quite insufficient to meet the requirement.
The consumption of total fertilizer nutrients (N2+P2O5 + K2O) touched an all time high
level of 22.04 million tonnes during 2006-07 attaining a growth of 8.4% over the
8/2/2019 Submission 1 101340
http://slidepdf.com/reader/full/submission-1-101340 8/21
previous year. It has resulted in significant widening of the gap between consumption and
domestic production of fertilizers forcing the country to resort to heavy import of all the
three major fertilizers, viz, Urea, DAP and MOP. The import of Urea touched an all time
high level of 4.72 million tonnes. Import of DAP & MOP was to the tune of 2.88 million
tonnes and 3.45 million tonnes respectively.
As a result of over dependence on import, the prices of urea and DAP in the international
market has jacked up in the recent past to a record high. Urea Price, which was US$
280.75 fob per MT in January 2007 increased to US$ 403.75 fob per MT in January 2008
and US $ 815 fob per MT in August 2008. Price of DAP, which was US $ 320.5 per MT
in January 2007 increased to US$ 802 per MT in January 2008 and US $ 1331 per MT in
May 2008. MOP price, which prevailed at US $ 170 fob per MT in January 2007 went up
to US $ 328 fob per MT in January 2008 and US$ 945 fob per MT in October 2008.
Sharp increase in international prices of finished fertilizers has proved beyond doubt that
self reliance in fertilizer production cannot be compromised.
The working group for XIth plan period has projected a demand of 28.755 million tonnes
of urea by the end year of the plan period i.e. 2011-12. The demand of DAP would be
around 9.51 million tonnes by that time. Similarly the projected demand of Complex
Fertilizers, SSP and MOP would be to the tune of 9.33, 4.56 and 3.74 million tonnes
respectively. The policy decision for both nitrogenous and phosphatic sector should be so
formulated that domestic production becomes sufficient to meet the demand.
GOVERNMENT’S LATEST DECLARATION ON FERTILIZER
POLICY
The Union Government through a press release dated 18/02/2010 announced urea price
rise by 10% and declared urea will continue to be under the current MRP regime whilenutrient based subsidy (NBS) policy for decontrolled Phosphatic and Potassic fertilizer
has been announced with effect from 1st April 2010. It has also been declared that
subsidy will continue to be disbursed through the industry. Under this regime the subsidy
on the nutrients shall remain fixed and the retail price of the subsidized fertilizer will be
decided by the companies. The intent of the Government to move towards NBS in

8/2/2019 Submission 1 101340
http://slidepdf.com/reader/full/submission-1-101340 9/21
fertilizer sector was announced in the Budget Speech of 2009-10 by the Finance Minister
and now this cabinet decision. It has been widely discussed and deliberated upon for
quite a long period. There have been mixed reaction to the decision with the
manufacturers welcoming it and most of the trade unions and kishan sabhas opposing the
move.
The Government has claimed that the NBS regime is expected (a) to promote balanced
fertilization (b) increase agricultural productivity through higher usage of secondary and
micro nutrients (c) develop new innovative fertilizer products (d) depict the actual
demand of fertilizes in the country (e) promote realistic pricing of fertilizer products in
the international market and (f) attract fresh investments in the sector.
NUTRIENT BASED SUBSIDY (NBS) POLICY
It has been decided to fix the subsidy on the fertilizer nutrients ‘N’ – Nitrogen, ‘P’ –
Phosphorous, ‘K’ – Potash and ‘S’ Sulphur contents. The NBS regime will be applicable
to DAP, MOP, TSP, SSP and the 12 grades of complex fertilizers which are already
covered under the current subsidy regime. The secondary and micro nutrients in such
fertilizers will attract a separate per tonne subsidy. Since the subsidy on the nutrients
shall remain fixed, the selling price of fertilizers at farm gate level will be decontrolledand will be determined by market forces and the retail price of the subsidized fertilizer
will be decided by the companies.
POSSIBLE EFFECTS OF NBS
As a result of this policy decision of the Government, prices of fertilizers will spiral
upwards. Any product allowed to be imported freely and allowed to be marketed freely
will attain market price around the Import Parity Price (IPP) plus the import duties and
cost of transportation from place of import to the distribution centre minus nutrient
subsidy within a short period. That is to say the market will deepen and will settle around
the IPP.

8/2/2019 Submission 1 101340
http://slidepdf.com/reader/full/submission-1-101340 10/21
The maximum retail price (MRP) of DAP and MOP as on date is Rs.9350/- and
Rs.4355/- per tonne. Since April 2008, the Government granted IPP to the DAP
manufacturers and the difference between the international price and MRP was being
paid as subsidy to the importers and manufacturers under the then concession scheme.
Now some procedure will be adopted to pay subsidy on DAP & MOP considering DAP’s
‘N’ and ‘P’ and MOP`s ‘P’ content which will remain fixed and the importers /
manufacturer will be allowed to decide the MRP which will naturally hover around the
import price minus the subsidy granted which will never be at the level of the present
MRP since the nutrient subsidy shall remain fixed.
Similar will be the conditions with the complex fertilizers (NPK fertilizers) which again
will be sold at a price fixed by the importers and manufacturers. Thus the present level of
MRP will show a sharp increase. The price of Urea which is the richest nitrogenous
fertilizer and which has the maximum tonnage consumed has been increased from
Rs.4830/- to Rs.5310/- per tonne. As a result of sharp increase in the MRPs of all brands
of fertilizer including Urea the cost of production of all crops shall have a sharp rise and
the effect thereon is well understood. Due already to higher cost of agricultural inputs and
non-remunerative support price the agriculture community specially the small and
marginal farmers have lost interest on agriculture and there are instances of gradual
concentration of land in the hand of big farmers/multinationals. This in turn is sure toaffect the food security of the country to a larger extent.

8/2/2019 Submission 1 101340
http://slidepdf.com/reader/full/submission-1-101340 11/21
Fertilization Production
At present, there are 64 large size fertilizer units in the country, manufacturing a wide range of
nitrogenous and phosphatic/complex fertilizers. Of these, 39 units produce urea, 18 units produce
DAP and complex fertilizers, 7 units produce low analysis straight nitrogenous fertilizers and 9
of the above units produce ammonium sulphate as a by-product. Besides, there are about 79
small and medium scale units producing single superphosphate. The total installed capacity of
fertilizer production in the country which was 104.98 lakh tonnes of nitrogen and 29.51 lakh
tonnes of phosphate as on 1.4.98 has risen to 110.71 lakh tonnes of nitrogen and 36.48 lakh
tonnes of phosphate as on 29.2.2000.
The production of nitrogenous fertilizers during 1998-99 was 104.80 lakh tonnes of nitrogen and
that of phosphatic fertilizers 31.41 lakh tonnes of phosphate. The production target for 1999-
2000 was fixed at 110.67 lakh tonnes of nitrogen and 33.45 lakh tonnes of phosphate,
representing a growth rate of 5.6% in nitrogen and 6.5% in phosphate, as compared to the actual
production in 1998-99. As against this, the actual production upto February 2000 was at 101.16
lakh tonnes of nitrogen and 30.40 lakh tonnes of phosphate. Taking ‘N’ &’P’ together, there was
an overall growth of 5.3% over the production during the corresponding period of last year2010.
Raw Materials and Intermediates Requirements in the Manufacture of
fertiliser Materials
Intermediate Raw materials/Intermediate
Ammonia Natural gas
Naphtha
Fuel Oil
Coal
) 860Nm3/te
0.9-1.02
0.91
3.62
Sulphuric Acid Sulphur
Pyrites
0.345
0.90
Phosphoric Acid Rock 3.3

8/2/2019 Submission 1 101340
http://slidepdf.com/reader/full/submission-1-101340 12/21
H2SO4 2.85
Nitric Acid NH3 0.292
Optimum fertilizer application plays a key role in improving the productivity of various
crops. It is a critical component of the strategy for self-sufficiency in foodgrains to feed a
rapidly growing population. Concerted efforts in this direction have resulted in a
substantial increase in agricultural production and productivity. From a modest level of
52 million tonnes in 1951-52, the foodgrain production in 1996-97 rose to the level of
199.3 million tonnes but again decreased to 193.1 million tonnes during 1997-98. The
increase in fertilizer consumption has contributed significantly to a more or less sustained
improvement in the production of foodgrains in the country.
Although the average per hectare consumption of fertilizer nutrients has increased from
less than 1 Kg. in 1951-52 to about 86.1 Kg. in 1997-98, even this level of fertilizer use is
low with reference to the objective of accelerating the growth in the agriculture sector, as
well as the consumption levels prevailing in other countries, including some of the
developing countries in Asia. Moreover, the consumption of chemical fertilizers in the
country is unevenly distributed, being much higher in regions with assured irrigation. In
view of the limited scope for increasing the land area under cultivation, further increases
in agricultural production can be achieved only through better water management,
expansion of the area under irrigation, improved farming practices, research and
development in the use of scientific inputs and seeds, and last but not the least, more
extensive and balanced use of fertilizers through fertilizer education. Hence, the critical
importance of the fertilizer sector in the Indian economy, especially in creating a
prosperous rural base.

8/2/2019 Submission 1 101340
http://slidepdf.com/reader/full/submission-1-101340 13/21
Indian Fertilizer Company Profiles
There are nine public sector undertakings and two cooperative societies under the
administrative control of the Department of Fertilizers. At present , there are 63 large size
fertilizer units in the country, manufacturing a wide range of nitrogenous and phosphatic/ complex fertilizers. Of these, 38 units produce urea whereas 9 units produce ammonium
sulphate as a by-product. Besides, there are about 79 small and medium scale units
producing single superphosphate.
Public Sector
NFL PPL
FACT PPCL
RCF
HFC
MFL FCI
SAIL HCL
NLC FCIL
Cooperative sector
IFFCO
KRIBHCO

8/2/2019 Submission 1 101340
http://slidepdf.com/reader/full/submission-1-101340 14/21
Management of Working Capital In IFFCO and KRIBHCO - A
Comparative Study
The Indian Fertiliser Industry entered into the hundredth year of its existence in the
year 2006. The industry had a very humble beginning in 1906, when the
manufacturing unit of Single Super Phosphate (SSP) was set up in Ranipet near
Chennai with annual capacity of 600 MT. The Fertiliser & Chemicals Travancore
of India Ltd. (FACT) at Cochin in Kerala and the Fertiliser Corporation of India
(FCI) in Sindri in Bihar were the first large sized fertiliser plants set up in forties
and fifties with a view to establish an industrial base to achieve self-sufficiency in
food grains. Subsequently, green revolution in the late sixties gave an impetus to
the growth of fertiliser industry in India. In seventies and eighties, a significant
addition to the fertiliser production capacity was witnessed. There has been
spectacular growth in the production capacity and production of fertilisers,
particularly during eighties and early nineties to meet the rising demand of
fertilisers. The Indian fertiliser industry is one of the best in the world in terms of
capacity utilisation.
Products offered by IFFCO
UREA
NPK
DAP
Bio fertilizer

8/2/2019 Submission 1 101340
http://slidepdf.com/reader/full/submission-1-101340 15/21
Products offered by KRIBHCO
Urea
Ammonia
Bio-fertiliser
Argon
Seeds
Questionnaire
I. General Information
1. Name of the interviewee: Date:
2. Address:
II. Personal Information
3. Type of family: (a) Joint (b) Nuclear
4. Number of family members:
5. Details of the family members:
Occupation Literate
Farming Others Adult Children
Male
Female
Illiterate
Male
Female

8/2/2019 Submission 1 101340
http://slidepdf.com/reader/full/submission-1-101340 16/21
III. Assets, Income, Loan, Expenditure Details
6. Land availability and irrigation facility details
(a) Own (b) Lease (c) Irrigated
7. Annual income from employment of all family members:
(a) Below 10000 (b) 10000 – 20000 (c) 20000 – 30000 (d) 30000 – 40000 (e) Above 40000
8. Income from dairying if available
(a) Below 10000 (b) 10000 – 20000 (c) 20000 – 30000 (d) 30000 – 40000 (e) Above 40000
9. Do you have a bank account? Yes / No Bank Name:
10. Loan if any taken from Bank
11. Details of assets: Radio / TV / Air Cooler/ Two Wheeler / Four Wheeler/ Tractor
Others if any
IV. Questions relating to concerned Product / Service
12. How do you know about the product / service?
(a) Radio (b) TV (c) Retailer (d) Friend/ Opinion leader (e) Others
13. Criteria for selection of a product / service
(a) Superior quality (b) Price (c) Influence of brand (d) Availability (e) Credit
14. Who takes the purchase decision in the family
(a) Head of family (b) Mother (c) Children
15. Frequency of purchase of product/ service
(a) Weekly (b) Monthly (c) Six months (d) Yearly
16. Money spent on each purchase (Enquire the details)
(a) less than 5000
(b) 5000 to 8000
(c) 8000 to 12000
(d) 12000 or above
17. Are you satisfied with current product / service
(a) Yes (b) No

8/2/2019 Submission 1 101340
http://slidepdf.com/reader/full/submission-1-101340 17/21
18. Have you recommended the product / service you use to friends and relatives?
(a) Yes (b) No
Analysis:
The analysis from the questionnaire was being carried out at Nanpur, 25km from Narol ,
Ahmedabad.
The analysis from the questionnaire was being carried out at Nanpur, 25km from Narol ,
Ahmedabad.
A sample of around 20 people from the village was carried out to know about their
response to the use of fertilizers.
60% of the farmers live in a nuclear family where as 40 % of them live in a joint family.
Most of the farmers own their own land.
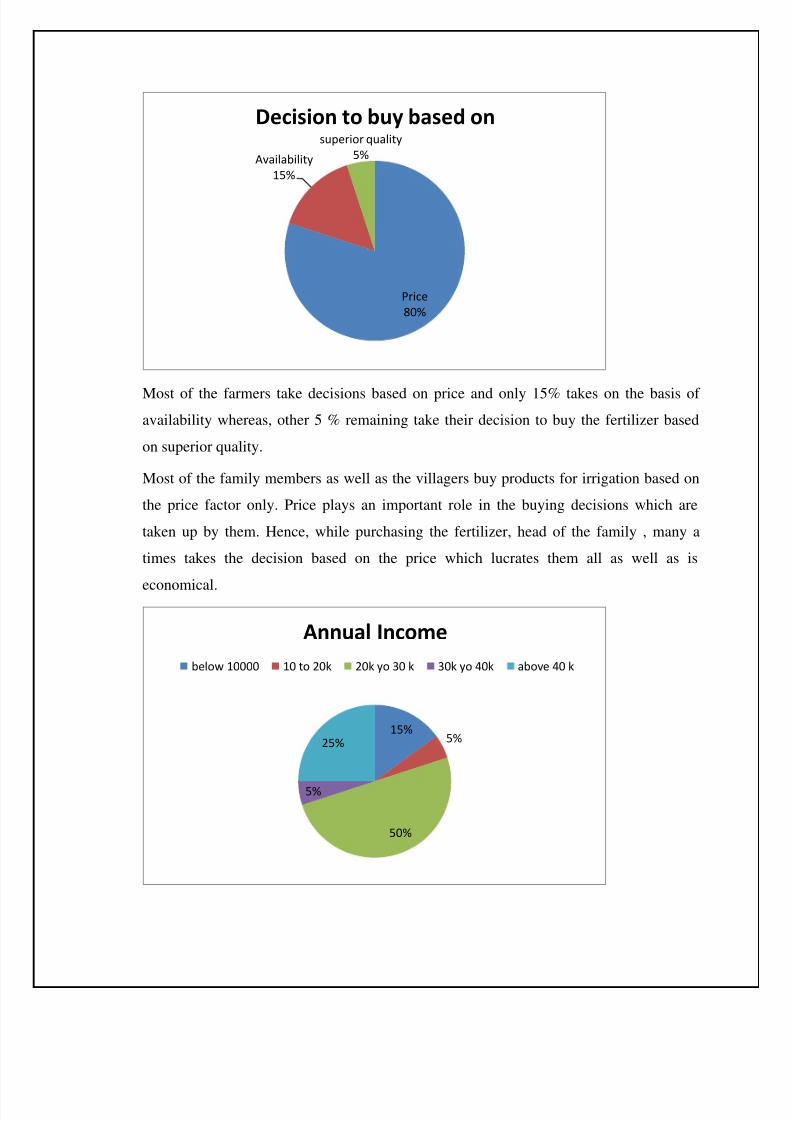
Those whose annual package is above 40000 is only 25% of the total population and they
do have income from other sources like dairy products too. They also have tractor which
would help them for the irrigation purpose.
own
irrigate
lease
Usage of land

8/2/2019 Submission 1 101340
http://slidepdf.com/reader/full/submission-1-101340 18/21
Of the total sample chosen for almost 55 % owns radio and 20 % owns tractor whereas
20 % have two wheeler with them and only 5% owns TV.
Those who has less income are nuclear family and they do not maintain the bank
accounts in the banks. They are being helped by government by providing education to
their children by government. Most of the farmers try to buy fertilizers at less cost.
Around 69% of the sample buys fertilizer for less than Rs. 5000 and only 5 % of the
farmers spend exceeding Rs. 12000.
Radio
55%tractor
20%
two wheeler
20%
TV
5%
Assets owned
<5000
69%
5k to 8k
21%
8k to 12k
5%
above 12k
5%
Expenditure annuly for fertilizer
8/2/2019 Submission 1 101340
http://slidepdf.com/reader/full/submission-1-101340 19/21
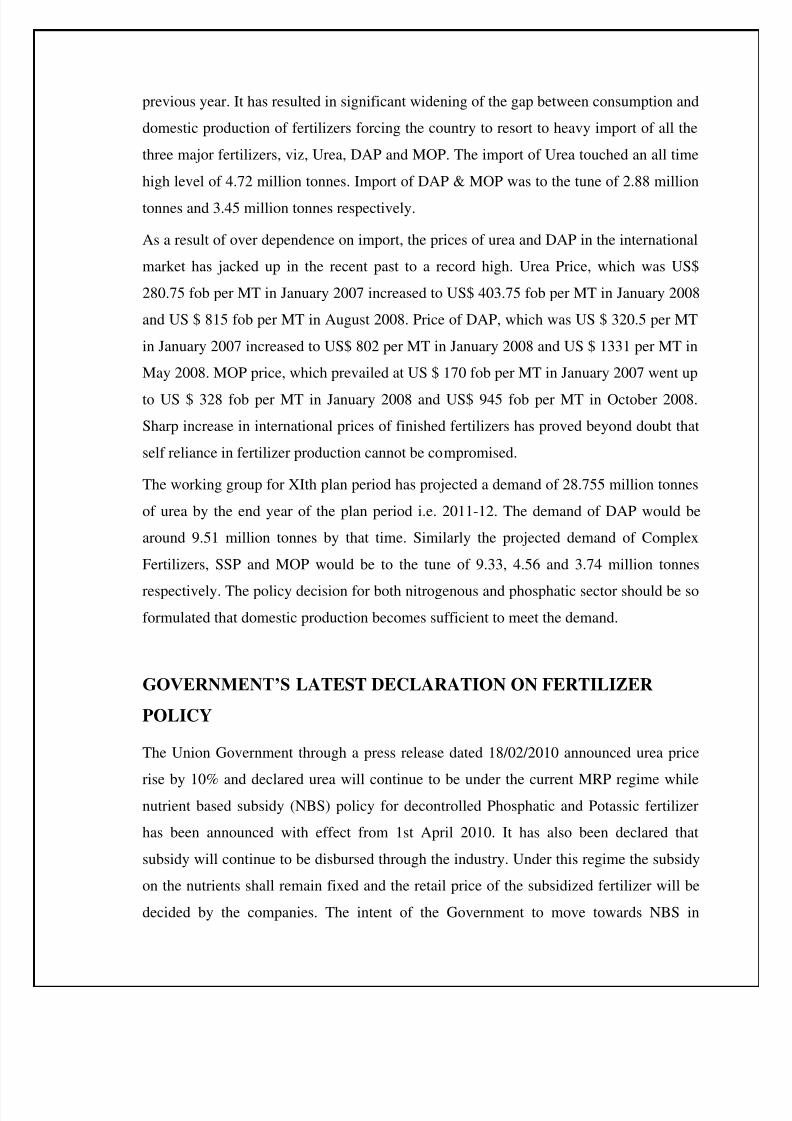
Most of the farmers take decisions based on price and only 15% takes on the basis of
availability whereas, other 5 % remaining take their decision to buy the fertilizer based
on superior quality.
Most of the family members as well as the villagers buy products for irrigation based on
the price factor only. Price plays an important role in the buying decisions which are
taken up by them. Hence, while purchasing the fertilizer, head of the family , many a
times takes the decision based on the price which lucrates them all as well as is
economical.
Price
80%
Availability
15%
superior quality
5%
Decision to buy based on
15%5%
50%
5%
25%
Annual Income
below 10000 10 to 20k 20k yo 30 k 30k yo 40k above 40 k

8/2/2019 Submission 1 101340
http://slidepdf.com/reader/full/submission-1-101340 20/21
The farmers use the fertilizers every six months or yearly depending on the type of crops
which they grow in the farm.
55%
45%
Usage of fertilizers
six months
yearly

8/2/2019 Submission 1 101340
http://slidepdf.com/reader/full/submission-1-101340 21/21
Conclusion: