Embed Size (px)
Citation preview

TO: HousingAlerts.com Active Members FROM: Ken Wade
SUBJECT: New Tools & New Markets
Hang on! We’re adding 20,000 new FREE TO YOU ‘micro markets’ to your member’s area, including zip code level data! We’ve also created a new generation of advanced, highly accurate market analysis algorithms making it even easier to nail hot, emerging markets and avoid weak or declining markets. This is game-changing for anyone associated with U.S. real estate. Check out some of these additions:
1) See what’s hot and what’s not nationwide in a single glance! Precise color-coded map reveals annual zip code level trends!
2) D.R.E.A.M. now includes full color map visualizations of our state-of-the-art market scoring algorithms. Scrutinize markets on the move all across the country with our color-coded Momentum, Technical and “Master” scoring/ranking results.
3) Turn hunches into hard evidence with our Custom Analysis & Charts! Now includes
micro-level zip code data!
4) Separate rumors from reality with the Advanced Market Scoring, Ranking and Search Filters in the S.T.A.R. tool.
National-level Members have access to all these new tools and markets right now. Over the coming weeks we’ll be adding them into Regional, State and Local (City) level member areas.
Here’s a quick overview how to access these new tools and micro-markets:
1) D.R.E.A.M. - Zip Code Maps
Step #1: Check “Show Zip Codes:” U.S. Map will reload to show zips nationwide.
Step #2: Select “2 yr. CAGR” U.S. Map will reload.
(CAGR = Compound Annual Growth Rate. This setting helps smooth-out ‘noise’ associated with small zip code level sample sizes.)
Step #3: Drag & Zoom U.S. map using “+” button, mouse wheel or by pinching screen.

2) D.R.E.A.M. – Color Coded Scoring Maps
Step #1: Uncheck Zip Code box to enable BETA Heat Map options
Step #2: Select desired Heat Map U.S. Map will reload.
-TAPS LOCAL map assigns city-level TA scores ignoring State, Regional and Nat’l market conditions. -TAPS OVERALL map reflects the influence of State, Regional and Nat’l conditions on each local market. -Momentum Score map reflects only the STAR (Red-Yellow-Green) 6-trigger momentum indicators. -MASTER Score map is generated from combining TAPS, STAR and other a proprietary in-house algorithms.

Step #3: Drag & Zoom U.S. map using “+” button, mouse wheel or pinching screen to see
actual scores and local details.
.
3) Custom Analysis & Charts – Zip Code Levels
Step #1: Add zip code markets to Custom Analysis using either Direct Selection or MAP.
Step #2: Analyze & compare any combination of markets (zip, city, state, etc.)
simultaneously.

…or… select zip codes using use MAP
4) STAR - Next Generation Market Scoring, Ranking and Search Filters
We’ve rolled these new hot/cold market finder tools into a simple one-click dashboard inside the S.T.A.R. tool. You can now search and rank all markets using our advanced custom scoring algorithms:
Master Score | Technical (TAPS) Score | Momentum (STAR) Score | Alphabetically
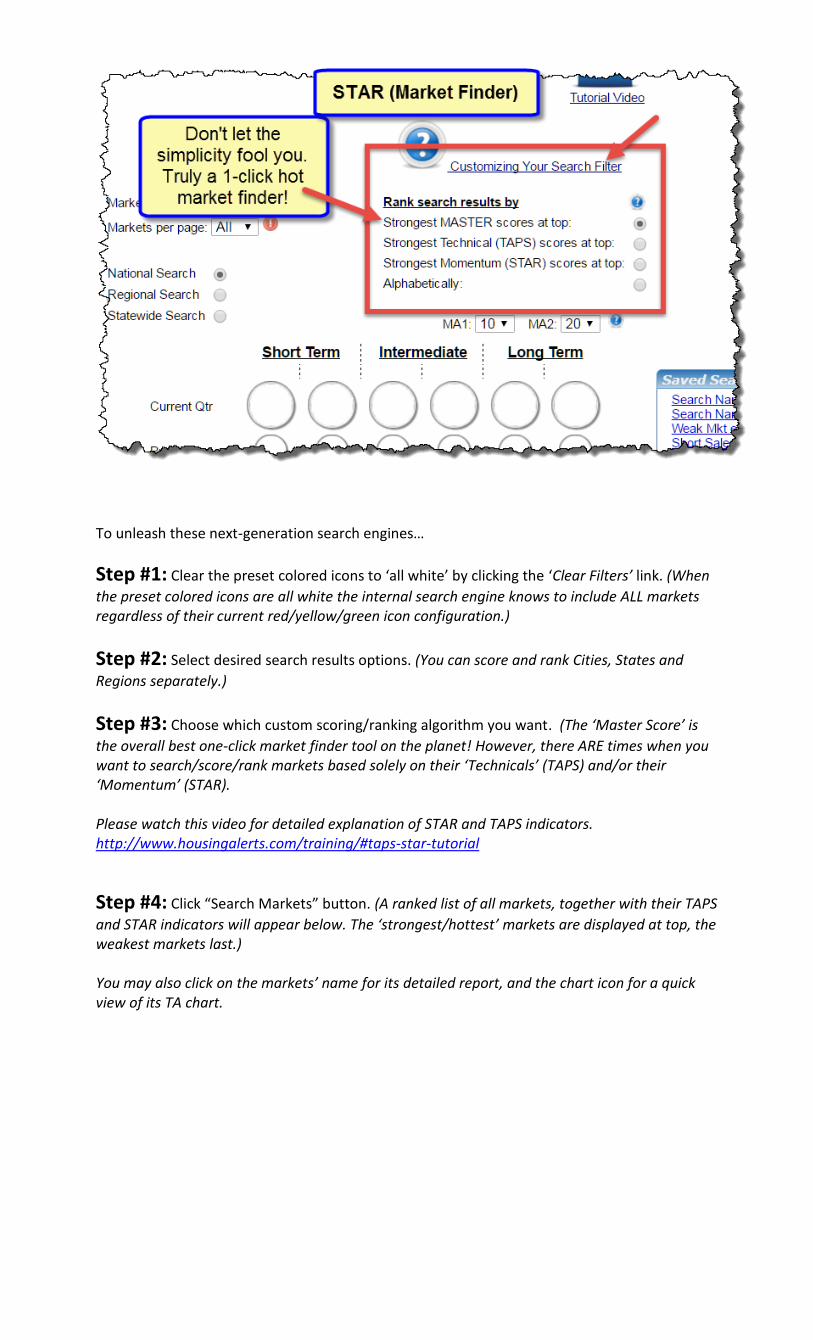
To unleash these next-generation search engines…
Step #1: Clear the preset colored icons to ‘all white’ by clicking the ‘Clear Filters’ link. (When
the preset colored icons are all white the internal search engine knows to include ALL markets regardless of their current red/yellow/green icon configuration.)
Step #2: Select desired search results options. (You can score and rank Cities, States and
Regions separately.)
Step #3: Choose which custom scoring/ranking algorithm you want. (The ‘Master Score’ is
the overall best one-click market finder tool on the planet! However, there ARE times when you want to search/score/rank markets based solely on their ‘Technicals’ (TAPS) and/or their ‘Momentum’ (STAR). Please watch this video for detailed explanation of STAR and TAPS indicators. http://www.housingalerts.com/training/#taps-star-tutorial
Step #4: Click “Search Markets” button. (A ranked list of all markets, together with their TAPS
and STAR indicators will appear below. The ‘strongest/hottest’ markets are displayed at top, the weakest markets last.) You may also click on the markets’ name for its detailed report, and the chart icon for a quick view of its TA chart.

View of a completed ‘Master Score’ search…
To seize the hidden advantage you’ve always dreamed of, watch this video for detailed explanation of STAR and TAPS indicators.
http://www.housingalerts.com/training/#taps-star-tutorial